Article

Formation of Carbon Quantum Dots via Hydrothermal Carbonization: Investigate the Effect of Precursors

1
Department of Chemical and Biomolecular Engineering, Ohio University, Athens, OH 45701, USA
2
Department of Biomedical and Chemical Engineering and Sciences, Florida Institute of Technology, Melbourne, FL 32901, USA
*
Author to whom correspondence should be addressed.
Energies 2021, 14(4), 986; https://doi.org/10.3390/en14040986
Submission received: 17 January 2021 / Revised: 8 February 2021 / Accepted: 11 February 2021 / Published: 13 February 2021
(This article belongs to the Special Issue Hydrothermal Carbonization)

Abstract

:
Carbon quantum dots (CQDs) are nanomaterials with a particle size range of 2 to 10 nm. CQDs have a wide range of applications such as medical diagnostics, bio-imaging, biosensors, coatings, solar cells, and photocatalysis. Although the effect of various experimental parameters, such as the synthesis method, reaction time, etc., have been investigated, the effect of different feedstocks on CQDs has not been studied yet. In this study, CQDs were synthesized from hydroxymethylfurfural, furfural, and microcrystalline cellulose via hydrothermal carbonization at 220 °C for 30 min of residence time. The produced CQDs showed green luminescence behavior under the short-wavelength UV light. Furthermore, the optical properties of CQDs were investigated using ultraviolet-visible spectroscopy and emission spectrophotometer, while the morphology and chemical bonds of CQDs were investigated using transmission electron microscopy and Fourier-transform infrared spectroscopy, respectively. Results showed that all CQDs produced from various precursors have absorption and emission properties but these optical properties are highly dependent on the type of precursor. For instance, the mean particle sizes were 6.36 ± 0.54, 5.35 ± 0.56, and 3.94 ± 0.60 nm for the synthesized CQDs from microcrystalline cellulose, hydroxymethylfurfural, and furfural, respectively, which appeared to have similar trends in emission intensities. In addition, the synthesized CQDs experienced different functionality (e.g., C=O, O-H, C-O) resulting in different absorption behavior.

1. Introduction

Carbon quantum dots (CQDs) are a new class of carbon nanomaterials sized below 10 nm [1,2]. CQDs have attracted tremendous attention in the research community due to their unique photoluminescence (PL) properties, biocompatibility, electrochemical luminescence properties, and low toxicity [3,4,5]. These properties enable them to be used in bio-imaging, biosensor, drug delivery, and photo-catalysis applications [6,7,8,9,10,11,12,13]. CQDs are mainly synthesized via two approaches: top-down and bottom-up. The top-down approach refers to the breakdown of larger carbon particles by laser ablation, electrochemical oxidation, chemical oxidation, and ultrasonic synthesis [14,15,16,17], while the bottom-up approach synthesizes the CQDs from molecular precursors through microwave synthesis, thermal decomposition, and hydrothermal treatment [4,18,19,20]. Among all synthesis methods, hydrothermal carbonization (HTC) has been considered as the most promising method due to high quantum efficiency, lower cost, environmentally friendly nature, and non-toxicity [4,5,20,21,22].
HTC is an emerging technology that converts carbohydrates into high-value materials, fuels, and chemicals [23,24,25,26]. HTC is typically performed at 180 to 260 °C for 5 min to 12 h under water saturation pressure, depending on the application [27]. In this conditions, water is more reactive and behaves as a non-polar solvent because of high ionic product and low dielectric constant [28]. Therefore, carbohydrates undergo for hydrolysis and the hydrolyzed products then undergo for simultaneous dehydration, decarboxylation, condensation, and polymerization to make cross-linked polymeric materials [29]. The particle sizes of the solid product, often referred as hydrohcar, are generally between 10 nm to 100 µm [30]. As HTC is a bottom-up approach, the particles smaller than 10 nm remain in the liquid phase (known as process liquid). HTC process liquid is referred to as the waste product from a HTC process; thus far, it is considered as a liability for the HTC development, as it requires expensive treatment. Various treatment technologies including anaerobic digestion (AD), wet air oxidation (WAO), and membrane distillation (MD) have been proposed to treat HTC process liquid [31,32,33]. However, the lack of value-added product separation along with the additional cost of treatment often prohibits the adoption of these aforementioned technologies for HTC process liquid.
In the recent past, various researchers have tried to separate the CQDs from the liquid phase of the HTC process [3,4,34,35,36]. For instance, Mehta et al. produced highly fluorescent CQDs from sugarcane via hydrothermal treatment at 120 °C for 3 h [4]. The obtained the CQDs were about 3.0 nm in size with highly blue fluorescence. On the other hand, Sahu et al. reported highly photoluminescent CQDs with sizes 1.5 to 4.5 nm from orange juice via HTC at 120 °C for 2.5 h [34]. Papaioannou et al. studied the effect of HTC residence time from 2 to 12 h at 200 °C on the properties of CQDs produced from D-(+)-glucose [35]. They reported that the sizes of CQDs decreased and their level of crystallinity increased with an increase in reaction time.
From the above discussed literature, it is clear that various parameters such as reaction time, residence time, etc. have been examined to understand their effect on the properties of CQDs. Although researchers studied different feedstocks at various conditions, to the best of the authors’ knowledge, no study has been reported about how the properties of CQDs change with the variation of feedstock at the same experimental conditions (temperature and residence time). The hypothesis was that simultaneous evolutions of amorphous hydrochar and semi-crystalline CQDs occur during HTC reactions. The amorphous hydrochar agglomerates into micro-meter-sized supramolecules, whereas, nano-sized CQDs remain in the liquid phase due to their high aqueous solubility. As various biopolymers react differently under HTC conditions, the authors’ expectation was that the presence and properties of CQDs will be different as well. Therefore, the objectives of the project were to investigate the effect of feedstock on the properties of CQDs. To achieve this goal, HTC of three organic precursors (i.e., furfural, 5-hydroxymethyl furfural (HMF), and microcrystalline cellulose) have been performed at 220 °C for 30 min of residence time. In this study, the HTC experiments were conducted at a relatively low temperature and residence time as they are reported to be favorable for CQD production. HMF and furfural might react at temperatures lower than 220 °C under an HTC environment, but the literature indicates that microcrystalline cellulose starts to react at around 220 °C [29,37]. As the purpose of this study was to investigate the effect of precursor, the authors wanted to choose the lowest temperature where all the precursors could react under the HTC environment. Multi-staged filtration was performed on the process liquids to remove supramolecules. The presence of CQDs was confirmed by investigating the optical (luminescence, ultraviolet-visible absorption, and emission), morphology (transmission electron microscopy), and chemical (Fourier Transform Infrared Spectroscopy) properties.

2. Materials and Methods

2.1. Materials

In this study, CQDs were produced from three different biomass precursors. Of them, 5-hydroxymethylfurfural (HMF) was purchased from Carbosynth LLC. (San Diego, CA, USA). Meanwhile, furfural was purchased from Sigma-Aldrich (St. Louis, MO, USA). On the other hand, microcrystalline cellulose (extra pure, avg. particle size 90 μm) was purchased from Acros Organics (Fair Lawn, NJ, USA). Analytical-grade ethanol was purchased from Fisher Scientific (Waltham, MA, USA).

2.2. Methods

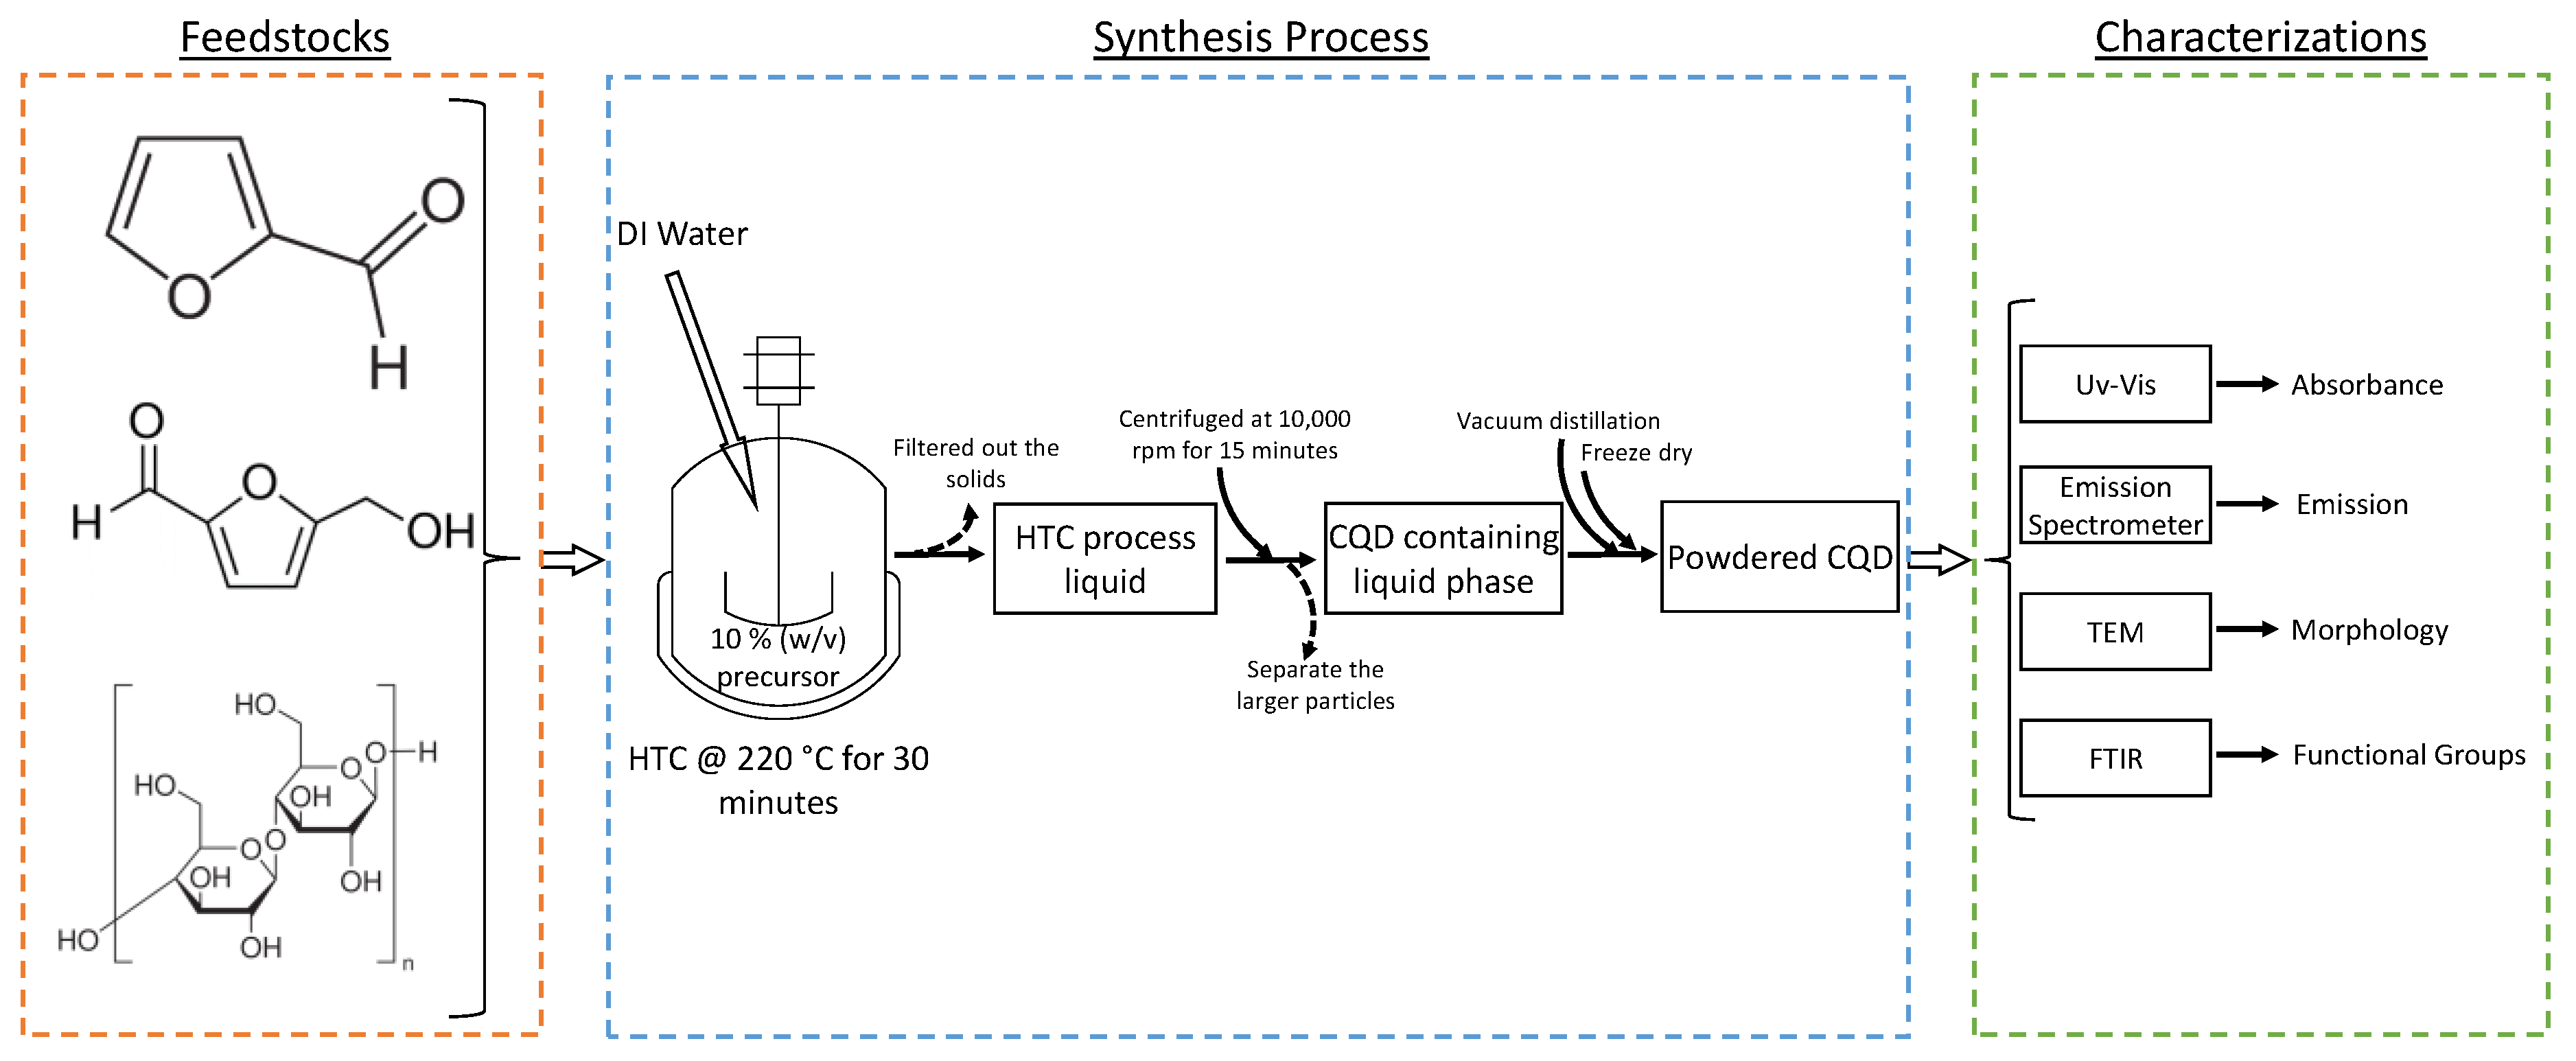
2.2.1. Hydrothermal Carbonization and Separation of CQDs from HTC Process Liquid

HTC experiments of different precursors were performed in a glass-lined 100 mL Parr batch reactor (reactor series 4590, Moline, IL, USA). A Parr proportional-integral-derivative (PID) controller (model 4590) with an accuracy of ±2 °C was used to control the reaction temperature. The pressure was not controlled but was monitored during the experiment with a pressure transducer and a gauge. HTC experiments were conducted at 220 °C for a residence time of 30 min. The reactor was loaded with 45 mL solution contained 10% (w/v) of precursor and the rest was deionized (DI) water. The reactor was closed and heated at a constant rate of 10 °C/min until it reached the set temperature and then it was maintained at isothermal conditions for 30 min. At the end of the residence time, the heater was turned off, heating elements were removed from the reactor, and the reactor was rapidly cooled to room temperature (~30 °C) by placing it in an ice-water bath. Once the reactor reached room temperature, the gaseous products produced during the reaction were vented in a fume hood by opening the vent valve. Finally, the lid of the reactor was opened and HTC process liquid was filtered by Whatman 41 filter paper. Dark brown HTC process liquid samples were collected in centrifuge tubes and stored in the refrigerator for further synthesis. As the major goal of this study was to evaluate the variation of optical, morphological, and chemical properties of CQDs with precursors, the hydrochar and gaseous products were not further characterized. However, the mass balance and physico-chemical characterization of hydrochars can be found elsewhere [23]. All the experiments were completed in duplicate to check reproducibility.
The dark brown HTC process liquid was centrifuged at 10,000 rpm for 15 min by a Sorvall BIOS 16-series centrifuge from Thermo Fisher Scientific (Waltham, MA, USA) to separate the larger particles from the liquid phase. The fluorescent CQD containing liquid phase was then filtered with a standard syringe filter (0.22 µm). The filtered CQD containing solution was then evaporated under reduced pressure by vacuum distillation. The concentrated product from vacuum distillation was kept in the high vacuum freeze dryer for 24 h to obtain powdered CQDs. The powdered CQDs were collected and refrigerated in glass vials for further investigations. A schematic of the CQD synthesis and characterization strategy is shown in Figure 1.

2.2.2. Optical, Morphological, and Chemical Characterizations of CQDs

To investigate the fluorescent properties of the synthesized CQDs, short-wavelength (254 nm) UV light was used. Although the produced CQDs appeared as light brown in color under the day light, it showed a green luminescence under UV light (see graphical abstract). The green luminescence under the UV light provided hints about the presence of quantum particles in the produced solution. This finding encouraged the authors to further investigate the optical properties of CQDs.
A Perkin Elmer Lambda LS 35 UV-visible spectrometer (Waltham, MA, USA) was used to observe the absorption behavior of the CQDs. The syringe-filtered CQD containing liquid phase was used in this analysis. The absorption capacity of those CQDs containing liquid phase were beyond the maximum limit (2.5) of the UV-vis spectrometer. As a result, all the original samples were diluted 5000 times with DI water. For each run, 10 mL of diluted sample was taken in a quartz cuvette and absorption was monitored for a wavelength range of 200 to 700 nm. The absorption capability of the CQDs was observed relative to the DI water blank run.
A Horiba FluoroMax-4 emission spectrometer (Irvine, CA, USA) was used to investigate the fluorescence emission capability of the synthesized CQDs at a certain excitation wavelength. For a clear comparison of the emission capacity of different CQDs, all the CQD samples were diluted to an absorbance value of 0.2 at 350 nm wavelength. A quartz cuvette (considered for better light transmission) was used for obtaining the fluorescence emission spectra. A slit width of 3 mm was used for the excitation and fluorescence emission spectra of aqueous CQD solution. For 360 nm of excitation wavelength, emission spectra were recorded for a wavelength range of 375 to 700 nm. Emission spectra were compared to DI water blank run at the same condition.
To observe the morphologies and obtain size images of CQDs, transmission electron microscopy (TEM) was performed on a Tecnai F20 system (Hillsboro, OR, USA). The powdered CQDs were dispersed into ethanol and sonicated for 6 h. One drop of the ethanol dispersed CQDs was placed on a copper grid coated with amorphous carbon, dried at room temperature, and analyzed in TEM. The instrument was operated at 200 kV with an X-TWIN lens and high-brightness field emission electron gun (FEG). The TEM images were then processed with Image J software to determine the particle size distribution of the CQDs.
To observe the changes in functional groups, Fourier-transform infrared spectroscopy (FTIR) analysis was performed in Bruker Optics Vertex 80 FTIR (Billerica, MA, USA). For the analysis, CQDs particles were dispersed in DI water. FTIR transmittance spectra were obtained for the wavenumber range of 4000 to 500 cm−1 with respect to the reference of DI water run.
All the above-mentioned characterizations were completed in duplicate to check reproducibility.

3. Results and Discussions

3.1. Absorption Properties

The optical characteristics of CQDs were investigated in terms of their absorption and emission properties. From the UV-vis spectra (absorption properties) shown in Figure 2, it was observed that all CQDs exhibit a broad range of absorption in the UV region, with the tails of the spectra in the near-visible region. Although all of the CQD samples started to show absorption behavior at the same wavelength (240 nm), their peak intensities were different. For instance, the cellulose peak showed the highest intensity of 2.35 while HMF and furfural showed peaks of 1.45 and 0.7, respectively. Additionally, the cellulose derived CQDs showed normal distribution while the furfural showed average distribution. This phenomenon indicates that the CQDs produced from furfural can absorb wide wavelengths while cellulose CQDs can adsorb more specific wavelengths among the three studied precursors. This variation of the absorption properties could be further supported by the FTIR spectra (see Figure 3). In the cellulose spectrum, only a carbonyl (C=O) peak was observed at 1670 cm−1. On the other hand, both HMF and furfural showed various other peaks, such as medium alcohol (O-H) peaks between 1330 and 1420 cm−1, aromatic ester (C-O) peaks between 1200 and 1300 cm−1, and a sharp alkyl ether (C-O) peak at 1027 cm−1. Due to the presence of additional functionality, HMF and furfural could exhibit broader absorbance compared to cellulose. In addition to the broad peaks, CQDs showed tails in the visible region. These tails are typically related to nanoparticle functionalization and are reported as lower energy surface centers [38]. These tails are also attributed the presence of various π→π* (C=C) and n→π* (C=O and/or others) transitions [2]. As the aromatic rings increase with the hydrothermal treatment, the energy gaps between π states gradually decreased [15]. On the other hand, functional groups (i.e., carbonyl) with electron lone pairs could be bonded with aromatic carbon that allows electron transition from n states [39].

3.2. Emission Properties

In addition to the adsorption properties, fluorescence emission properties of the CQDs were investigated. The emission spectra of the CQDs are shown in Figure 4, where it can be seen that the emission wavelength (360 nm) is longer than the excitation wavelength (240 nm) shown in the absorbance spectra (Figure 2). This observation is in line with previous literature, where the researchers reported the reason behind this is mainly due to bandgap of the conjugated π domains and/or the presence of defects in the structures [39,40,41]. The spectra also show that the emission capacity of cellulose-based CQDs is the highest among the studied feedstocks, where furfural-derived CQDs show the least emission capacities. As the absorbance intensity of the furfural-derived CQDs was the least, it was expected to have the highest emission properties. However, the emission properties showed the similar trend as absorption capacity. This could be due to the combined effect of functional groups, ligand chain length, surface defects, and morphology of the CQDs [42].

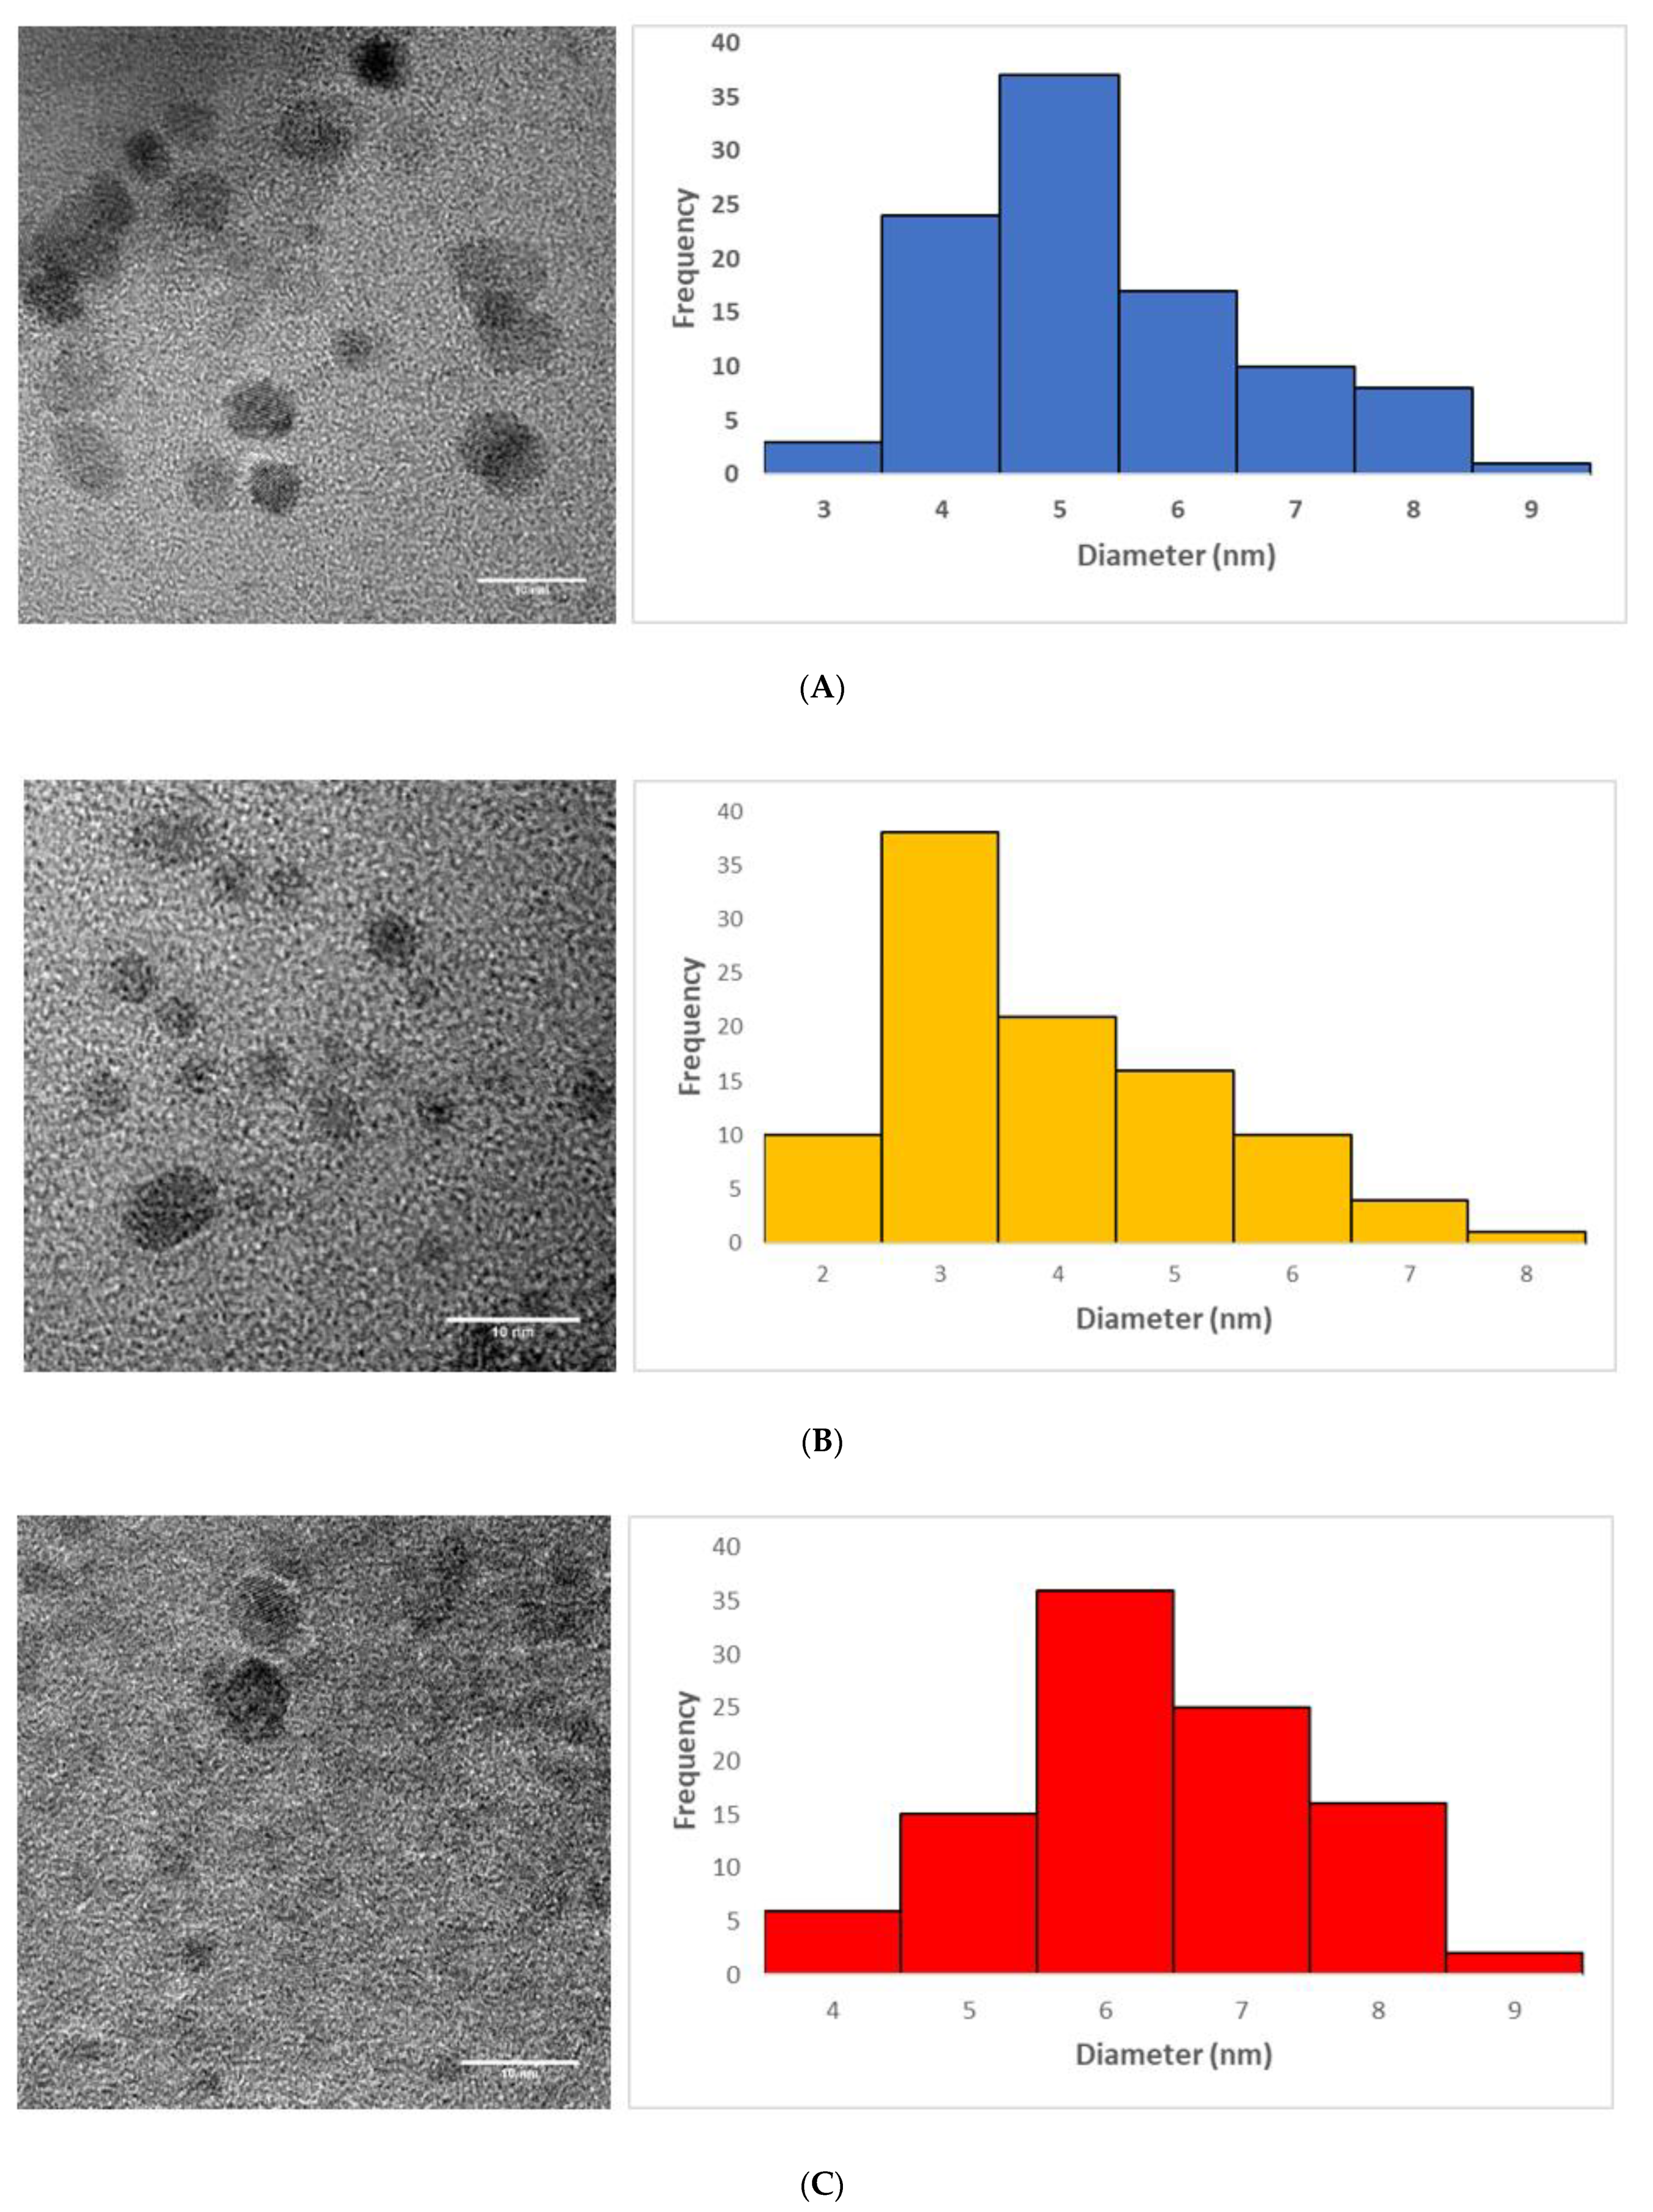
3.3. Morphology of the CQDs

The morphology and particle size of the produced CQDs were obtained from TEM analysis which are shown in Figure 5. It is observed that these CQD particles are spherical in shape and most of the particles are separated from each other. Size distribution results revealed that the spherical nanoparticles diameter ranged from 2 to 9 nm. Although the CQDs were synthesized under the same hydrothermal conditions, the sizes of the CQDs were different. This could be due to the various degradation temperatures of the precursors allowing them to nucleate at different conditions, thus forming different-sized CQDs [43,44]. In addition, the agglomeration of the particles could be the reason for getting various mean sizes [43]. A general trend between CQD emission capacity and mean size was observed. For instance, the highest emission capacity was attributed to the mean particle diameter of 6.36 ± 0.54 nm for the cellulose-derived CQDs, while the lowest emission intensity occurred with the mean particle diameter of 3.94 ± 0.60 nm from the furfural-derived CQDs. This could be attributed to the increased surface area of the particles, allowing more light-emitting functional groups to be present and active.
The CQDs produced in this study contain remarkably similar characteristics, as found by the Zhao et al. and Gao at al., where they produced CQDs from pine wood and alkali lignin, respectively, via HTC treatment [45,46]. The similarities include but are not limited to the absorption range of 225 to 300 nm, the emission range of 435 to 450 nm, and the size 2 to 5 nm. With these characteristics, the CQDs were successfully used as a nanosensor to detect the iron (Fe3+) and ascorbic acid. It has been determined that the functionalization of the CQDs with groups containing oxygen are crucial to the success of the detection of the ions as they are chelated by these groups to induce a fluorescent quenching [45,46]. The CQDs produced in this study all share this vital characteristic as well. Although the dots in this study fall within those ranges in every respect except for the size of the cellulose dots, these CQDs could be used for similar purposes as well.

4. Conclusions

In this study, CQDs were produced from HMF, furfural, and microcrystalline cellulose via HTC at 220 °C for 30 min. The optical and morphological properties of the produced CQDs were investigated. It was observed that CQDs showed green luminescence under short-wavelength UV light (254 nm). Additionally, they can absorb light in a broad range. The variation of the absorption range was justified from the FTIR spectra where CQDs from different precursors showed different chemical bonds (e.g., alcohol, ketone, etc.). Although all the studied CQDs were within two to nine nm in diameter, the mean diameter varied with the precursor. Depending on the particle size, the CQDs showed different emission capacities. Finally, this study provides an insight into the effect of precursor on the CQD properties. So, the precursors for the CQDs should be selected based on the targeted applications.

Author Contributions

Conceptualization, M.R.H., N.S., M.T.R.; methodology, M.R.H., N.S.; formal analysis, M.R.H., N.S., T.Q.; investigation, M.R.H., N.S., M.T.R.; writing—original draft preparation, M.R.H., N.S., T.Q.; writing—review and editing, M.R.H., N.S., T.Q., M.T.R. All authors have read and agreed to the published version of the manuscript.

Funding

The research is partially funded by the United States Department of Agriculture (USDA) grant (2019-67019-2928) through M.T.R.

Institutional Review Board Statement

Not applicable.

Informed Consent Statement

Not applicable.

Data Availability Statement

Not applicable.

Acknowledgments

The authors acknowledge Travis A. White from the Department of Chemistry and Biochemistry at Ohio University for allowing to use emission spectrofluorometer. The authors are also thankful to Kyle McGaughy from the biofuels lab at the Florida Institute of Technology for his laboratory efforts in this project.

Conflicts of Interest

The authors declare no conflict of interest.

References

  1. Liu, W.; Li, C.; Ren, Y.; Sun, X.; Pan, W.; Li, Y.; Wang, J.; Wang, W. Carbon dots: Surface engineering and applications. J. Mater. Chem. B 2016, 4, 5772–5788. [Google Scholar] [CrossRef]
  2. Wang, Y.; Hu, A. Carbon quantum dots: Synthesis, properties and applications. J. Mater. Chem. C 2014, 2, 6921–6939. [Google Scholar] [CrossRef] [Green Version]
  3. Zhu, S.; Meng, Q.; Wang, L.; Zhang, J.; Song, Y.; Jin, H.; Zhang, K.; Sun, H.; Wang, H.; Yang, B. Highly photoluminescent carbon dots for multicolor patterning, sensors, and bioimaging. Angew. Chem. 2013, 125, 4045–4049. [Google Scholar] [CrossRef]
  4. Mehta, V.N.; Jha, S.; Kailasa, S.K. One-pot green synthesis of carbon dots by using Saccharum officinarum juice for fluorescent imaging of bacteria (Escherichia coli) and yeast (Saccharomyces cerevisiae) cells. Mater. Sci. Eng. C 2014, 38, 20–27. [Google Scholar] [CrossRef] [PubMed]
  5. Qu, D.; Zheng, M.; Du, P.; Zhou, Y.; Zhang, L.; Li, D.; Tan, H.; Zhao, Z.; Xie, Z.; Sun, Z. Highly luminescent S, N co-doped graphene quantum dots with broad visible absorption bands for visible light photocatalysts. Nanoscale 2013, 5, 12272–12277. [Google Scholar] [CrossRef] [PubMed]
  6. Choudhary, R.; Patra, S.; Madhuri, R.; Sharma, P.K. Equipment-free, single-step, rapid, “on-site” kit for visual detection of lead ions in soil, water, bacteria, live cells, and solid fruits using fluorescent cube-shaped nitrogen-doped carbon dots. ACS Sustain. Chem. Eng. 2016, 4, 5606–5617. [Google Scholar] [CrossRef]
  7. Gao, X.; Lu, Y.; Zhang, R.; He, S.; Ju, J.; Liu, M.; Li, L.; Chen, W. One-pot synthesis of carbon nanodots for fluorescence turn-on detection of Ag+ based on the Ag+-induced enhancement of fluorescence. J. Mater. Chem. C 2015, 3, 2302–2309. [Google Scholar] [CrossRef]
  8. Kim, S.; Choi, Y.; Park, G.; Won, C.; Park, Y.-J.; Lee, Y.; Kim, B.-S.; Min, D.-H. Highly efficient gene silencing and bioimaging based on fluorescent carbon dots in vitro and in vivo. Nano Res. 2017, 10, 503–519. [Google Scholar] [CrossRef]
  9. Li, H.; Kang, Z.; Liu, Y.; Lee, S.-T. Carbon nanodots: Synthesis, properties and applications. J. Mater. Chem. 2012, 22, 24230–24253. [Google Scholar] [CrossRef]
  10. Liu, J.; Liu, Y.; Liu, N.; Han, Y.; Zhang, X.; Huang, H.; Lifshitz, Y.; Lee, S.-T.; Zhong, J.; Kang, Z. Metal-free efficient photocatalyst for stable visible water splitting via a two-electron pathway. Science 2015, 347, 970–974. [Google Scholar] [CrossRef] [PubMed]
  11. Loukanov, A.; Sekiya, R.; Yoshikawa, M.; Kobayashi, N.; Moriyasu, Y.; Nakabayashi, S. Photosensitizer-conjugated ultrasmall carbon nanodots as multifunctional fluorescent probes for bioimaging. J. Phys. Chem. C 2016, 120, 15867–15874. [Google Scholar] [CrossRef]
  12. Wang, Z.; Fu, B.; Zou, S.; Duan, B.; Chang, C.; Yang, B.; Zhou, X.; Zhang, L. Facile construction of carbon dots via acid catalytic hydrothermal method and their application for target imaging of cancer cells. Nano Res. 2016, 9, 214–223. [Google Scholar] [CrossRef]
  13. Wu, Y.-F.; Wu, H.-C.; Kuan, C.-H.; Lin, C.-J.; Wang, L.-W.; Chang, C.-W.; Wang, T.-W. Multi-functionalized carbon dots as theranostic nanoagent for gene delivery in lung cancer therapy. Sci. Rep. 2016, 6, 21170. [Google Scholar] [CrossRef] [PubMed]
  14. Zhou, J.; Booker, C.; Li, R.; Zhou, X.; Sham, T.-K.; Sun, X.; Ding, Z. An electrochemical avenue to blue luminescent nanocrystals from multiwalled carbon nanotubes (MWCNTs). J. Am. Chem. Soc. 2007, 129, 744–745. [Google Scholar] [CrossRef] [PubMed]
  15. Li, H.; He, X.; Kang, Z.; Huang, H.; Liu, Y.; Liu, J.; Lian, S.; Tsang, C.H.A.; Yang, X.; Lee, S.T. Water-soluble fluorescent carbon quantum dots and photocatalyst design. Angew. Chem. 2010, 122, 4532–4536. [Google Scholar] [CrossRef]
  16. Qiao, Z.-A.; Wang, Y.; Gao, Y.; Li, H.; Dai, T.; Liu, Y.; Huo, Q. Commercially activated carbon as the source for producing multicolor photoluminescent carbon dots by chemical oxidation. Chem. Commun. 2010, 46, 8812–8814. [Google Scholar] [CrossRef]
  17. Park, S.Y.; Lee, H.U.; Park, E.S.; Lee, S.C.; Lee, J.-W.; Jeong, S.W.; Kim, C.H.; Lee, Y.-C.; Huh, Y.S.; Lee, J. Photoluminescent green carbon nanodots from food-waste-derived sources: Large-scale synthesis, properties, and biomedical applications. ACS Appl. Mater. Interfaces 2014, 6, 3365–3370. [Google Scholar] [CrossRef]
  18. Tang, L.; Ji, R.; Cao, X.; Lin, J.; Jiang, H.; Li, X.; Teng, K.S.; Luk, C.M.; Zeng, S.; Hao, J. Deep ultraviolet photoluminescence of water-soluble self-passivated graphene quantum dots. ACS Nano 2012, 6, 5102–5110. [Google Scholar] [CrossRef] [PubMed]
  19. Chen, B.; Li, F.; Li, S.; Weng, W.; Guo, H.; Guo, T.; Zhang, X.; Chen, Y.; Huang, T.; Hong, X. Large scale synthesis of photoluminescent carbon nanodots and their application for bioimaging. Nanoscale 2013, 5, 1967–1971. [Google Scholar] [CrossRef] [PubMed]
  20. Wang, W.; Ni, Y.; Xu, Z. One-step uniformly hybrid carbon quantum dots with high-reactive TiO2 for photocatalytic application. J. Alloy. Compd. 2015, 622, 303–308. [Google Scholar] [CrossRef]
  21. Bian, J.; Huang, C.; Wang, L.; Hung, T.; Daoud, W.A.; Zhang, R. Carbon dot loading and TiO2 nanorod length dependence of photoelectrochemical properties in carbon dot/TiO2 nanorod array nanocomposites. ACS Appl. Mater. Interfaces 2014, 6, 4883–4890. [Google Scholar] [CrossRef]
  22. Wang, J.; Gao, M.; Ho, G.W. Bidentate-complex-derived TiO2/carbon dot photocatalysts: In situ synthesis, versatile heterostructures, and enhanced H 2 evolution. J. Mater. Chem. A 2014, 2, 5703–5709. [Google Scholar] [CrossRef]
  23. Saha, N.; Saba, A.; Reza, M.T. Effect of hydrothermal carbonization temperature on pH, dissociation constants, and acidic functional groups on hydrochar from cellulose and wood. J. Anal. Appl. Pyrolysis 2019, 137, 138–145. [Google Scholar] [CrossRef]
  24. Saha, N.; Volpe, M.; Fiori, L.; Volpe, R.; Messineo, A.; Reza, M.T. Cationic Dye Adsorption on Hydrochars of Winery and Citrus Juice Industries Residues: Performance, Mechanism, and Thermodynamics. Energies 2020, 13, 4686. [Google Scholar] [CrossRef]
  25. Saha, N.; Saba, A.; Saha, P.; McGaughy, K.; Franqui-Villanueva, D.; Orts, W.J.; Hart-Cooper, W.M.; Reza, M.T. Hydrothermal carbonization of various paper mill sludges: An observation of solid fuel properties. Energies 2019, 12, 858. [Google Scholar] [CrossRef] [Green Version]
  26. Reza, M.T. Upgrading biomass by hydrothermal and chemical conditioning. Ph.D. Dissertation, University of Nevada, Reno, NV, USA, 2013. [Google Scholar]
  27. Berge, N.D.; Ro, K.S.; Mao, J.; Flora, J.R.V.; Chappell, M.A.; Bae, S. Hydrothermal Carbonization of Municipal Waste Streams. Environ. Sci. Technol. 2011, 45, 5696–5703. [Google Scholar] [CrossRef] [PubMed]
  28. Bandura, A.V.; Lvov, S.N. The ionization constant of water over wide ranges of temperature and density. J. Phys. Chem. Ref. Data 2006, 35, 15–30. [Google Scholar] [CrossRef] [Green Version]
  29. Sevilla, M.; Fuertes, A.B. The production of carbon materials by hydrothermal carbonization of cellulose. Carbon 2009, 47, 2281–2289. [Google Scholar] [CrossRef] [Green Version]
  30. Sevilla, M.; Fuertes, A.B. Chemical and structural properties of carbonaceous products obtained by hydrothermal carbonization of saccharides. Chem.–A Eur. J. 2009, 15, 4195–4203. [Google Scholar] [CrossRef] [PubMed]
  31. Reza, M.T.; Freitas, A.; Yang, X.; Coronella, C.J. Wet air oxidation of hydrothermal carbonization (HTC) process liquid. ACS Sustain. Chem. Eng. 2016, 4, 3250–3254. [Google Scholar] [CrossRef]
  32. Silva, N.A. Evaluation of Membrane Distillation for Treating Hydrothermal Carbonization Aqueous Product (HAP) from Dairy Manure. Master’s Thesis, University of Nevada, Reno, NV, USA, 2020. [Google Scholar]
  33. Wirth, B.; Reza, T.; Mumme, J. Influence of digestion temperature and organic loading rate on the continuous anaerobic treatment of process liquor from hydrothermal carbonization of sewage sludge. Bioresour. Technol. 2015, 198, 215–222. [Google Scholar] [CrossRef]
  34. Sahu, S.; Behera, B.; Maiti, T.K.; Mohapatra, S. Simple one-step synthesis of highly luminescent carbon dots from orange juice: Application as excellent bio-imaging agents. Chem. Commun. 2012, 48, 8835–8837. [Google Scholar] [CrossRef]
  35. Papaioannou, N.; Titirici, M.-M.; Sapelkin, A. Investigating the Effect of Reaction Time on Carbon Dot Formation, Structure, and Optical Properties. ACS Omega 2019, 4, 21658–21665. [Google Scholar] [CrossRef] [Green Version]
  36. Yang, Z.-C.; Wang, M.; Yong, A.M.; Wong, S.Y.; Zhang, X.-H.; Tan, H.; Chang, A.Y.; Li, X.; Wang, J. Intrinsically fluorescent carbon dots with tunable emission derived from hydrothermal treatment of glucose in the presence of monopotassium phosphate. Chem. Commun. 2011, 47, 11615–11617. [Google Scholar] [CrossRef]
  37. Saha, N.; McGaughy, K.; Reza, M.T. Elucidating hydrochar morphology and oxygen functionality change with hydrothermal treatment temperature ranging from subcritical to supercritical conditions. J. Anal. Appl. Pyrolysis 2020, 152, 104965. [Google Scholar] [CrossRef]
  38. Carbonaro, C.M.; Corpino, R.; Salis, M.; Mocci, F.; Thakkar, S.V.; Olla, C.; Ricci, P.C. On the emission properties of carbon dots: Reviewing data and discussing models. C—J. Carbon Res. 2019, 5, 60. [Google Scholar] [CrossRef] [Green Version]
  39. Wang, R.; Lu, K.-Q.; Tang, Z.-R.; Xu, Y.-J. Recent progress in carbon quantum dots: Synthesis, properties and applications in photocatalysis. J. Mater. Chem. A 2017, 5, 3717–3734. [Google Scholar] [CrossRef]
  40. Baker, S.N.; Baker, G.A. Luminescent carbon nanodots: Emergent nanolights. Angew. Chem. Int. Ed. 2010, 49, 6726–6744. [Google Scholar] [CrossRef] [PubMed]
  41. Gokus, T.; Nair, R.; Bonetti, A.; Bohmler, M.; Lombardo, A.; Novoselov, K.; Geim, A.; Ferrari, A.; Hartschuh, A. Making graphene luminescent by oxygen plasma treatment. Acs Nano 2009, 3, 3963–3968. [Google Scholar] [CrossRef] [PubMed] [Green Version]
  42. Spirin, M.G.; Brichkin, S.B.; Gak, V.Y.; Razumov, V.F. Influence of photoactivation on luminescent properties of colloidal InP@ZnS quantum dots. J. Lumin. 2020, 226, 117297. [Google Scholar] [CrossRef]
  43. Zhang, Y.; Wang, Y.; Feng, X.; Zhang, F.; Yang, Y.; Liu, X. Effect of reaction temperature on structure and fluorescence properties of nitrogen-doped carbon dots. Appl. Surf. Sci. 2016, 387, 1236–1246. [Google Scholar] [CrossRef]
  44. Wongso, V.; Sambudi, N.S.; Sufian, S. The effect of hydrothermal conditions on photoluminescence properties of rice husk-derived silica-carbon quantum dots for methylene blue degradation. Biomass Convers. Biorefin. 2020, 179. [Google Scholar] [CrossRef]
  45. Zhao, S.; Song, X.; Chai, X.; Zhao, P.; He, H.; Liu, Z. Green production of fluorescent carbon quantum dots based on pine wood and its application in the detection of Fe3+. J. Clean. Prod. 2020, 263, 121561. [Google Scholar] [CrossRef]
  46. Gao, X.; Zhou, X.; Ma, Y.; Qian, T.; Wang, C.; Chu, F. Facile and cost-effective preparation of carbon quantum dots for Fe3+ ion and ascorbic acid detection in living cells based on the “on-off-on” fluorescence principle. Appl. Surf. Sci. 2019, 469, 911–916. [Google Scholar] [CrossRef]
Figure 1. A schematic of the CQD synthesis and characterization strategy.
Energies 14 00986 g001
Figure 2. UV-Vis spectra for carbon quantum dots derived from various precursors.
Energies 14 00986 g002
Figure 3. FTIR spectra of the CQDs synthesized from various precursors.
Energies 14 00986 g003
Figure 4. Emission spectra of carbon quantum dots derived from various precursors.
Energies 14 00986 g004
Figure 5. TEM size images along with the particle size distribution of the different types of CQDs synthesized from: (A) HMF; (B) Furfural; (C) Cellulose.
Energies 14 00986 g005
Publisher’s Note: MDPI stays neutral with regard to jurisdictional claims in published maps and institutional affiliations.

