Article

Estimation of the Performance Aging of the Vestas V52 Wind Turbine through Comparative Test Case Analysis

1
Department of Engineering, University of Perugia, Via G. Duranti 93, 06125 Perugia, Italy
2
Centre for Renewables and Energy-Dundalk Institute of Technology, Dublin Road, A91 V5XR Louth, Ireland
*
Author to whom correspondence should be addressed.
Energies 2021, 14(4), 915; https://doi.org/10.3390/en14040915
Submission received: 28 January 2021 / Revised: 5 February 2021 / Accepted: 7 February 2021 / Published: 9 February 2021
(This article belongs to the Special Issue Power System Dynamics and Renewable Energy Integration)

Abstract

:
It is a common sense expectation that the efficiency of wind turbines should decline with age, similarly to what happens with most technical systems. Due to the complexity of this kind of machine and the environmental conditions to which it is subjected, it is far from obvious how to reliably estimate the impact of aging. In this work, the aging of five Vestas V52 wind turbines is analyzed. The test cases belong to two different sites: one is at the Dundalk Institute of Technology in Ireland, and four are sited in an industrial wind farm in a mountainous area in Italy. Innovative data analysis techniques are employed: the general idea consists of considering appropriate operation curves depending on the working control region of the wind turbines. When the wind turbine operates at fixed pitch and variable rotational speed, the generator speed-power curve is studied; for higher wind speed, when the rotational speed has saturated and the blade pitch is variable, the blade pitch-power curve is considered. The operation curves of interest are studied through the binning method and through a support vector regression with a Gaussian kernel. The wind turbine test cases are analyzed vertically (each in its own history) and horizontally, by comparing the behavior at the two sites for the given wind turbine age. The main result of this study is that an evident effect of aging is the worsening of generator efficiency: progressively, less power is extracted for the given generator rotational speed. Nevertheless, this effect is observed to be lower for the wind turbines in Italy (order of −1.5% at 12 years of age with respect to seven years of age) with respect to the Dundalk wind turbine, which shows a sharp decline at 12 years of age (−8.8%). One wind turbine sited in Italy underwent a generator replacement in 2018: through the use of the same kind of data analysis methods, it was possible to observe that an average performance recovery of the order of 2% occurs after the component replacement. It also arises that for all the test cases, a slight aging effect is visible for higher wind speed, which can likely be interpreted as due to declining gearbox efficiency. In general, it is confirmed that the aging of wind turbines is strongly dependent on the history of each machine, and it is likely confirmed that the technology development mitigates the effect of aging.

1. Introduction

It is a well-known fact that machines and technical systems are affected by aging [1,2,3,4,5,6], but it is difficult to theoretically estimate this kind of effect.
In particular, the power production of a wind turbine has a very complex dependence on ambient conditions [7,8,9,10], on the stochastic nature of the source [11,12], on the working parameters [13,14], on the wake interactions [15,16], and on the health status and on the efficiency [17,18] of the sub-components. On these grounds, it is a common sense expectation that the efficiency of wind turbines declines with age, but there are no standards about how much and in how much time the performance should decline.
Therefore, a uniquely conceivable approach to the analysis of wind turbine aging consists of learning from experience, which is feasible because a vast number of industrial wind turbines of different sizes and technologies are reaching the end-of-life expectancy. For example, in [19], it was reported that in 2020, 28% of wind turbines installed in Europe were older than 15 years of age, with peaks in the order of 50% in Spain, Germany, and Denmark.
The analysis of wind turbine aging results in being a very complex problem because a vast number of wind turbines should be considered, in order to obtain statistically robust results: from this point of view, the only possibility is considering cumulative data, as for example average yearly capacity, yearly production, and so on. Unfortunately, due to the fact that wind turbines operate under non-stationary conditions and that failure rates are not irrelevant [20], the use of cumulative data is equivalent to losing the control details of the behavior of the wind turbines under consideration. It should also be noticed that in wind energy practice, it has become common to refurbish wind turbines by adopting aerodynamic and/or control technology innovations [21]; therefore, in general, it should be concluded that without knowing in detail the history of the analyzed wind farms, it is likely that the effects of aging are incorrectly estimated.
Despite the above summarized critical points, some remarkable analyses have been conducted. In [22], two-hundred-eighty-two wind farms in the U.K. were considered, and the mismatch between the theoretical and measured load factor was analyzed by attempting a linear regression between the age and the measured load. In [22], it was estimated that the output of the considered test cases diminished by 1.6 ± 0.2 % per year: this implies a 9% increase of the levelized cost of electricity over twenty years. An important point of [22] was that the hypothesis was formulated that wind turbine performance decline with age should be mitigated by innovation in wind turbine technology. In [23], a similar methodology was proposed based on the analysis of wind farms in Sweden: a linear regression between the capacity factor of wind turbines and their age. The methods in [22,23] contain some hints about the fact that a linear trend might be too simple for taking into account the complexity given by the fact that the source (the wind) is stochastic and the response of the machine (i.e., the measured load) depends on several factors; for this reason, some corrections in the linear regression were included, which were an adjustment for the on-site conditions in [22] and sine-cosine fluctuations of the dependency on the age in [23].
The critical points of the approaches based on cumulative data can be overcome through an in-depth analysis of wind turbines’ operation data and operation curves [24,25], which allows disentangling the aging effects from reliability degradation or ambient effects. In a nutshell, aging can be distinguished with respect to reliability by considering the behavior of operation curves when the wind turbines are running. Aging can be distinguished with respect to ambient effects by analyzing operation curves such as the generator speed-power, rotor speed-power, and blade pitch-power curves [25]. The drawback of this approach is that it is costly from the point of view of data analysis: for example, the studies in [24,25,26], which constitute the premise of this work, dealt with a unique wind turbine.
In particular, the results in [24,25] constitute the motivation of the present work: in those studies, a Vestas V52 wind turbine was studied, which is sited at the Dundalk Institute of Technology in Ireland. The wind turbine has been operating since 2005, and operation data from 2008 to 2019 were analyzed. The generator speed-power curve was analyzed when the wind intensity was between 5 and 9 m/s (indicated as Region 2), because in that regime, the wind turbine control is based on variable rotor and generator speed and fixed pitch. When the wind speed was between 9 and 13 m/s (indicated as Region 2 1 2 ), the blade pitch-power curve was studied, because the wind turbine operates at rated rotational speed and the blade pitch varies with the wind intensity. The earliest data set available was employed for training a support vector regression for the curves of interest, and the aging was quantified through the analysis of how the residuals between measurements and model estimates evolve as years pass by. The main result of [25] was that the performance decline with the age of the test case wind turbine can be ascribed mainly to the decline of generator performance: in Region 2, it is observed that progressively, the wind turbine extracts less power for a given generator rotational speed. Comparing the average performance after ten years of operation (2008 vs. 2018), a worsening in the order of 8% is observed. It is further observed that in Region 2 1 2 in general, the gearbox efficiency decline contributes almost negligibly to the aging, but in the proximity of the gearbox end of life, it is possible to detect an average performance decline of the order of 1.3%.
The aging estimate obtained in [24,25] was lower with respect to the results in [22], but is in general a non-negligible amount. On these grounds and given the ubiquitous deployment of the Vestas V52 wind turbine model, in [24,25], the importance of analyzing how general the obtained results were was noticed. This involves analyzing further test cases of the same wind turbine model, and the present work deals with this objective: four Vestas V52 wind turbines are studied, which are sited in southern Italy in a complex terrain. Data from 2013 to 2020 are analyzed, courtesy of the Lucky Wind company. The objective of this study is twofold:
  • Analyzing the rate of performance decline with age for the wind turbines sited in Italy and comparing against the results in [24];
  • Inquiring if the operation curves, and therefore the aging, of the four Italian wind turbines are comparable to those of the test case in [24] when the wind turbines have the same age.
The points of strength of the present work are therefore several:
  • Four test case wind turbines of the same model as [24] (Vestas V52) are added to the literature;
  • The four wind turbines sited in Italy can be compared among themselves and against the reference of [24]: the analysis is therefore vertical (each turbine against itself) and horizontal (each wind turbine against the others in the farm and against the reference in [24]). This investigation provides additional information, with respect to the existing literature, about the extent to which it is possible to individuate recurring patterns in the aging of wind turbines of a certain model.
  • The generator of one wind turbine sited in Italy reached its end of life in 2018. Therefore, a devoted analysis is performed in this study in order to understand how the performance of the wind turbine changes after the replacement of the generator with respect to the yearly data set immediately before. This analysis, on the one hand, represents a crosscheck of the proposed methodologies and, on the other hand, provides an estimate of the amount of performance recovery that can be expected by replacing an aged main component, as the generator of a wind turbine.
  • It is possible to inquire at least qualitatively if there is a connection between the wind turbine site and aging: the wind turbine in [24] is placed in a peri-urban site (in proximity to the Dundalk Institute of Technology in Ireland), while the other four wind turbines considered in this study are placed in an industrial wind farm in a mountainous area.
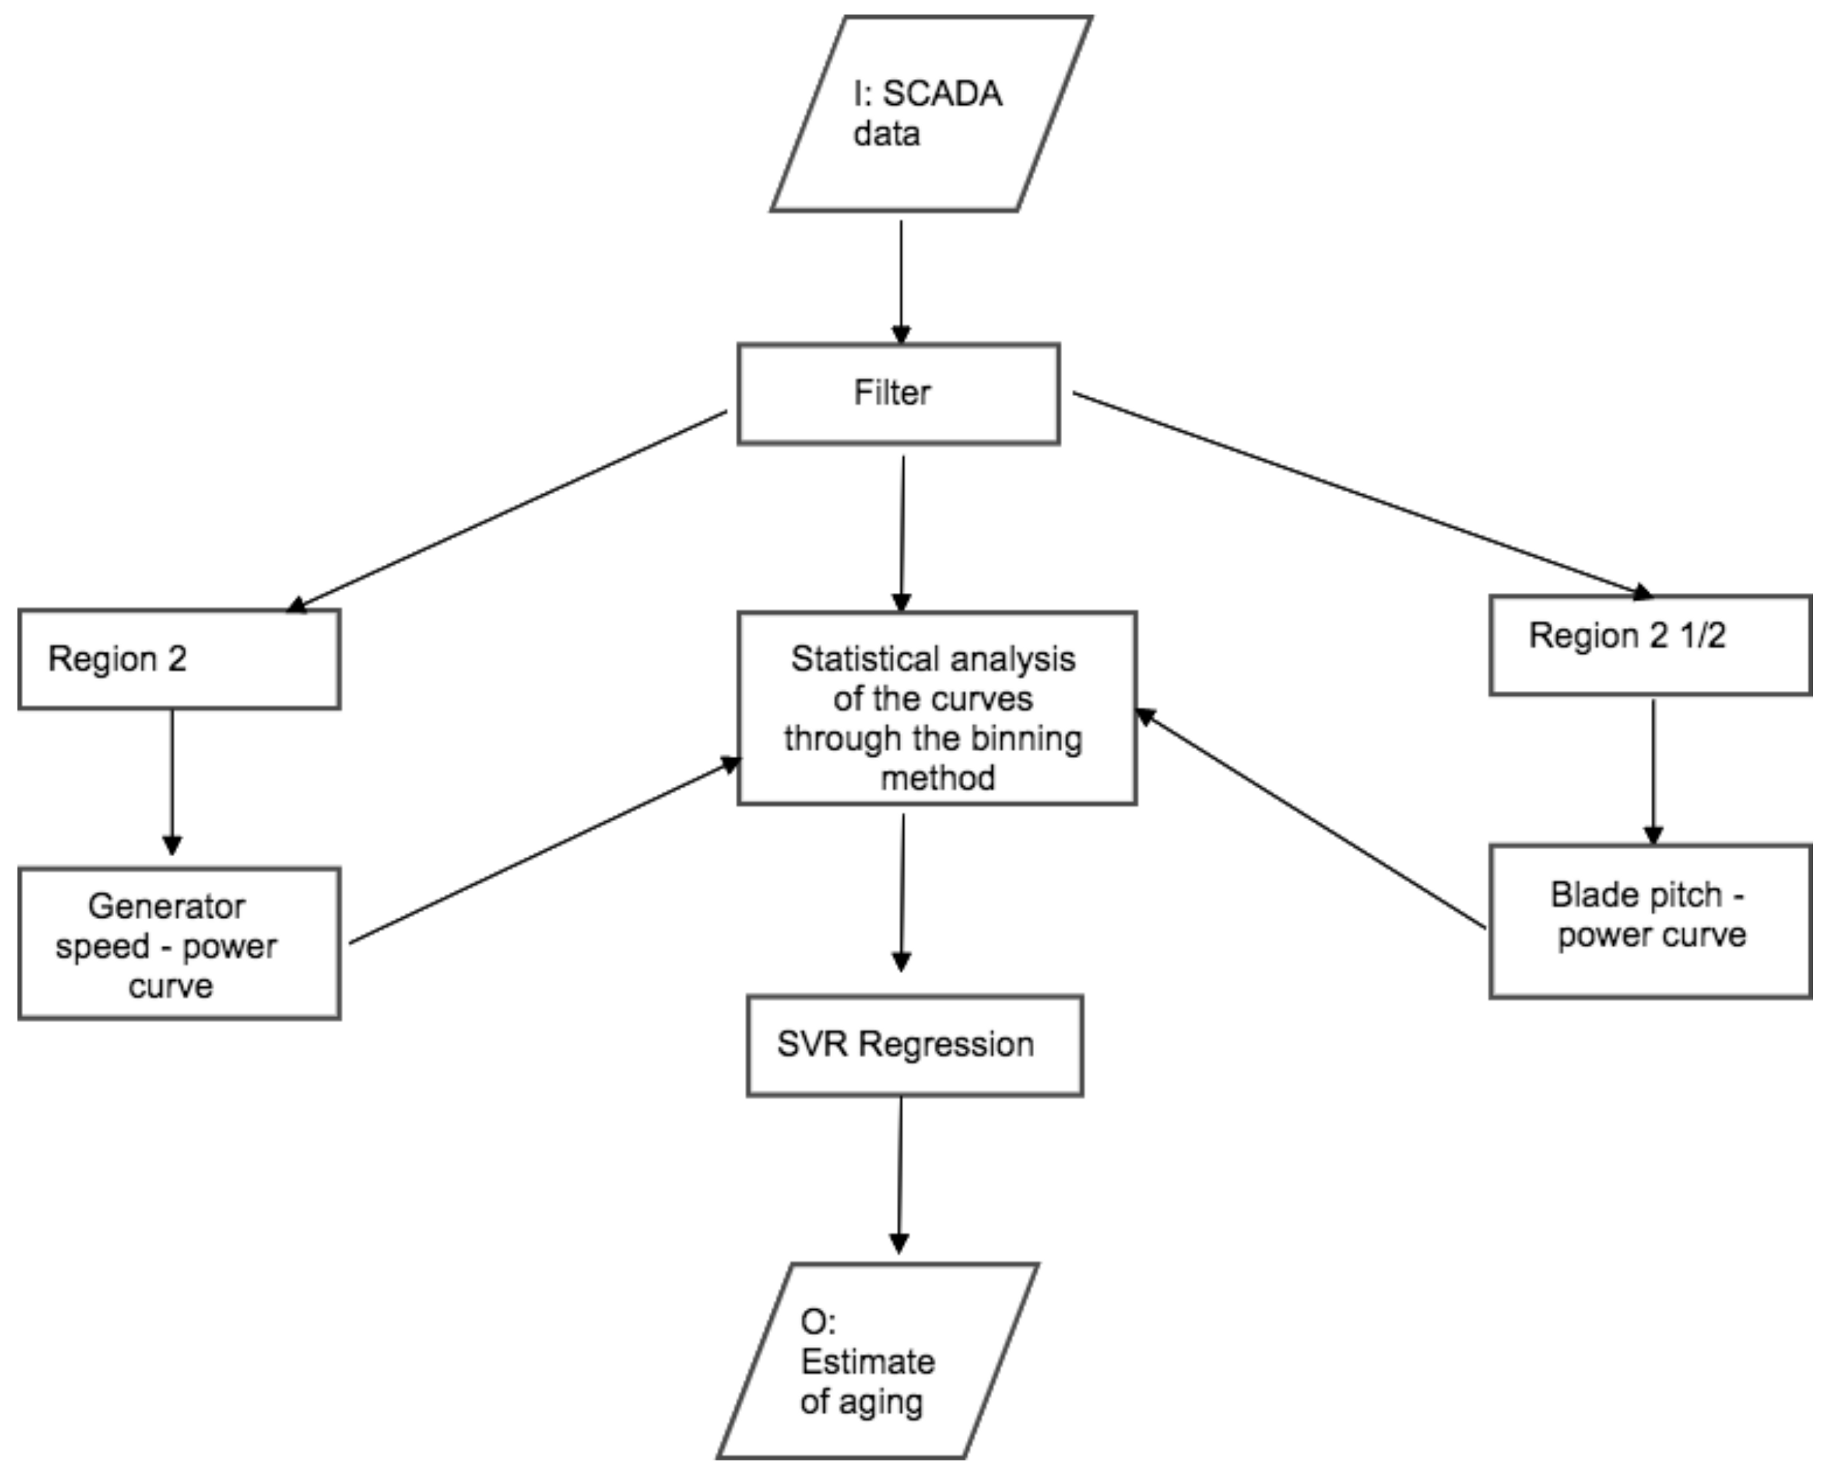
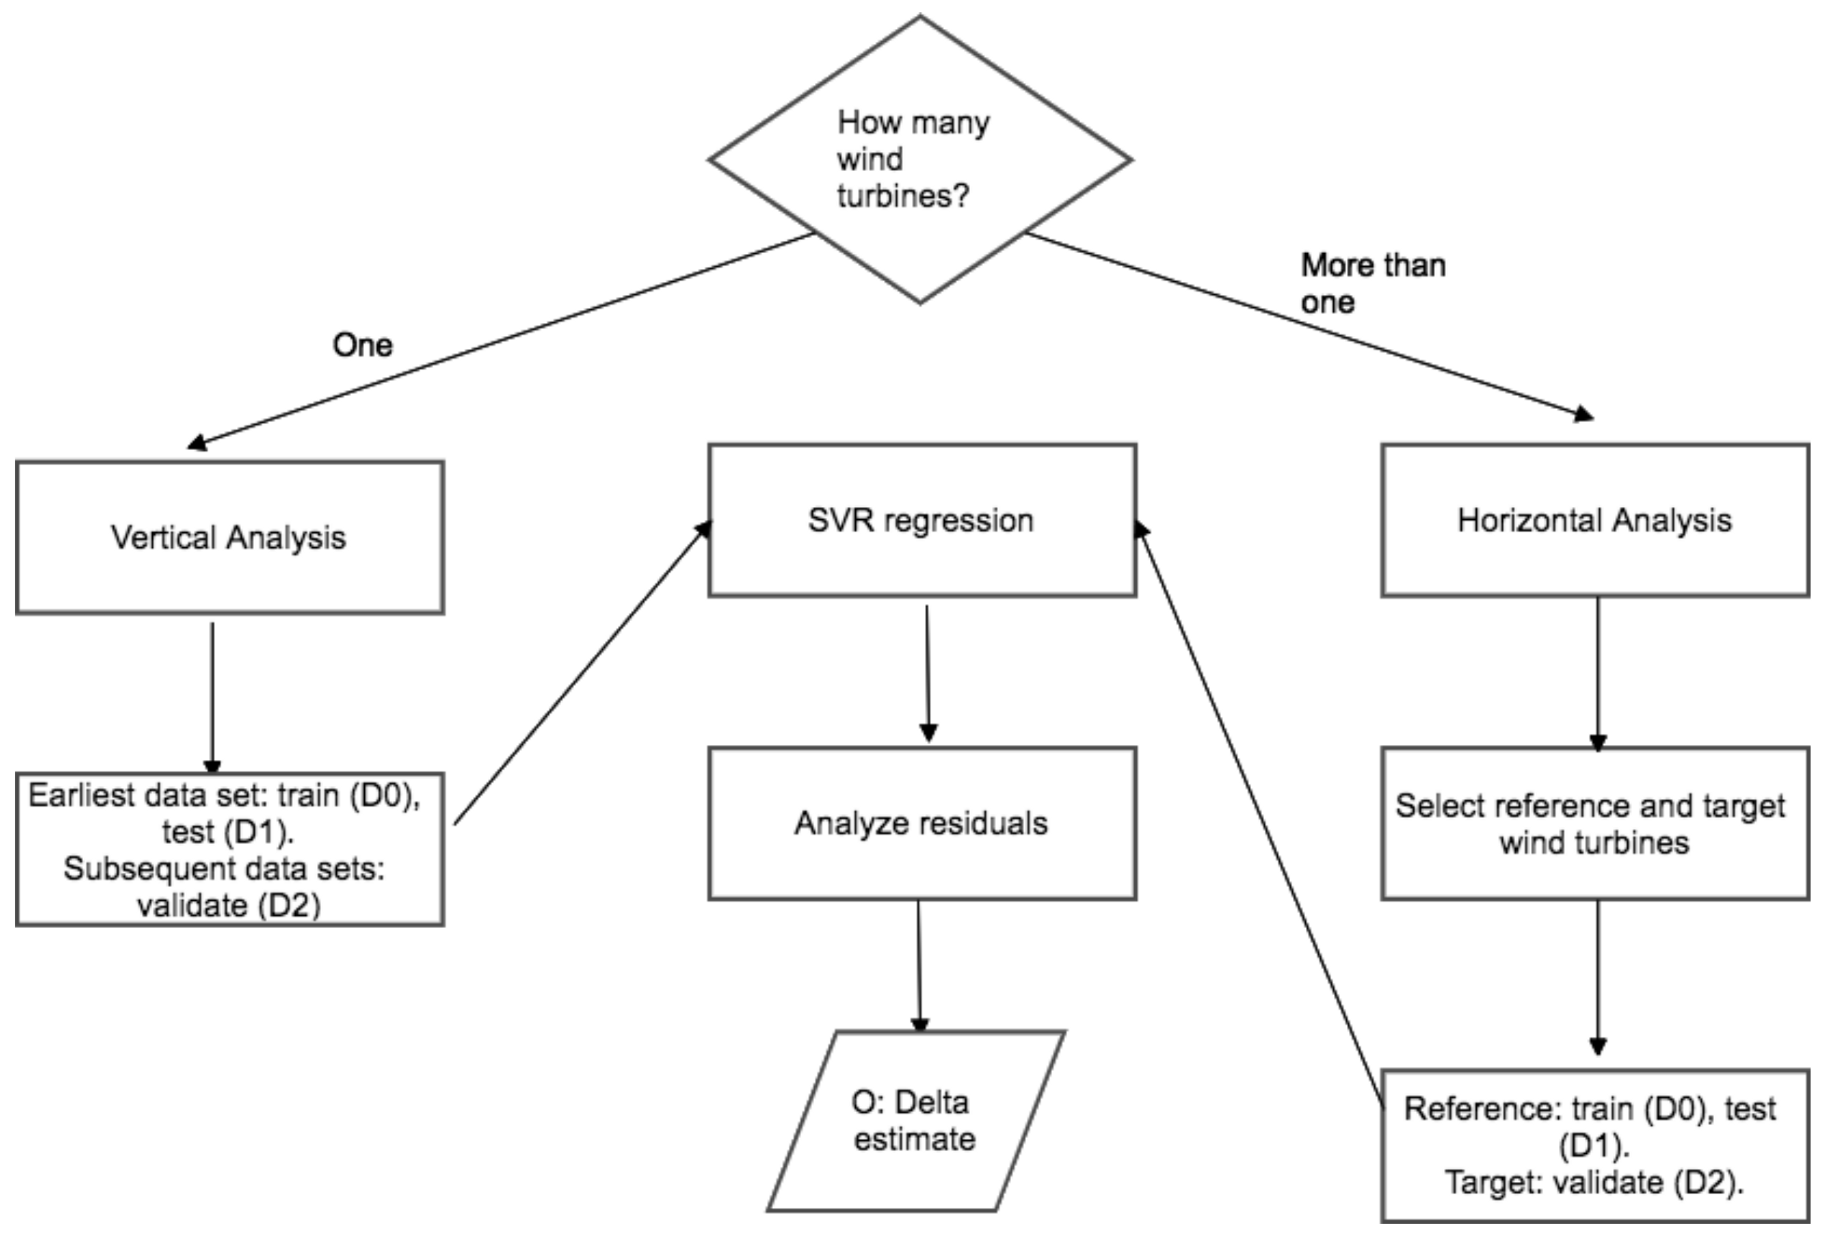
The methodologies employed in this study are similar to those in [24,25], but were adapted to the case of multiple wind turbines from two different sites. In particular, the operation curves are analyzed qualitatively, through the generalization of the binning method, which is recommended for power curve analysis [27], and quantitatively, through support vector regression with a Gaussian kernel. The analysis is conducted in parallel for the two sites, by considering the age of the wind turbines.
It should be noticed that the above summarized methodologies, and in particular the horizontal analysis of the operation curves of the two test cases, represent also a contribution to the more general problem of wind turbine performance analysis and to the problem of comparing the performance of wind turbines of the same model that are sited in different environments: it is known from the literature, and widely discussed in Section 3, that environmental factors (shear, turbulence, atmospheric stability) have an impact on the wind turbine nacelle transfer function and on the measured power curve [28,29]. Therefore, it is more reliable to compare operation curves that do not depend on nacelle wind speed measurements, as is done in the present work and in [14], where several operation curves were analyzed in detail through a data-driven regression.
The manuscript is organized as follows: Section 2 is devoted to the description of the test case wind farms and the materials at our disposal for the study; in Section 3, the methods are described; the results are reported in Section 4; and finally, in Section 5, the conclusions are summarized.

2. The Test Cases and the Data Sets

The former test case is the same as in the previous studies [24,25]: it is a Vestas V52 installed in 2005 at the Dundalk Institute of Technology, indicated as Test Case 1 (or IREwind turbine) and shown in Figure 1.
The latter test case is constituted by four Vestas V52 wind turbines, from a wind farm sited in southern Italy in a mountainous area, which were installed in 2007: these are indicated as Test Case 2 (or ITA1, ITA2, ITA3, ITA4 wind turbines).
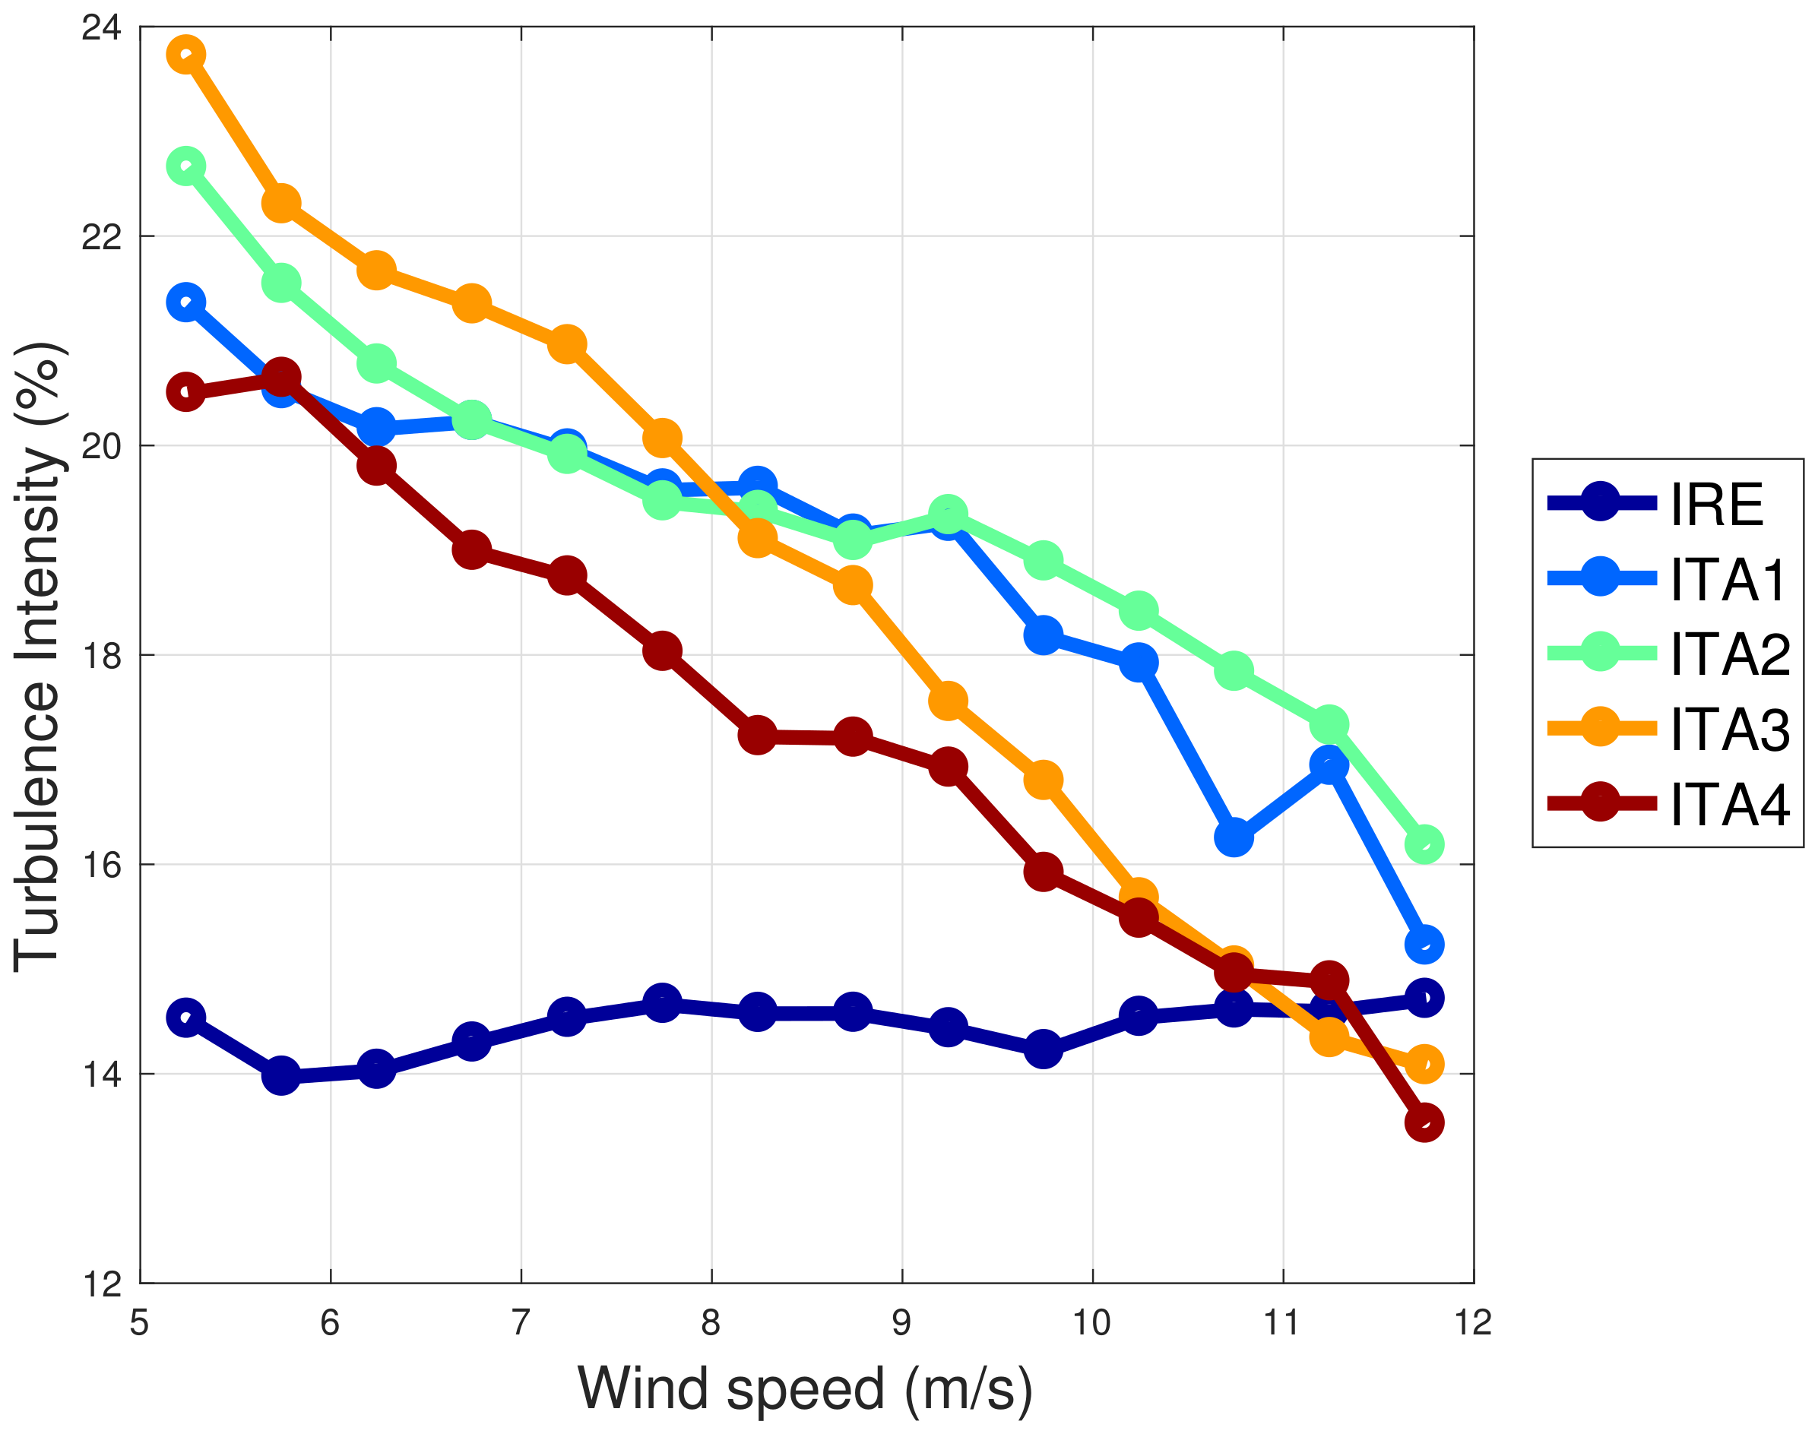
The different climatologies at the two sites are summarized by Figure 2, where the average yearly turbulence intensity (per wind speed interval of 0.5 m/s) is reported. There were no meteorological mast data at our disposal for the present study, and therefore, Figure 2 was constructed using the nacelle anemometer data of each wind turbine. The critical points as regards the use of nacelle anemometers for estimating turbulence intensity are well known, but the intention of Figure 2 is mainly qualitative and aimed at indicating that both environments can be considered complex; the mountainous area of the ITA wind turbines is very complex, with an impressively high level of turbulence. As regards the wind intensity distributions, the same sample year as in Figure 2 was considered, and the average wind intensities are respectively 6.2 m/s (IRE), 6.4 m/s (ITA1), 6.7 m/s (ITA2), 6.3 m/s (ITA3), and 6.3 m/s (ITA4).
For the purposes of this study, it is sufficient to indicate that the average yearly intensities are similar (order of 6 m/s), with a slightly higher average for the ITA site.
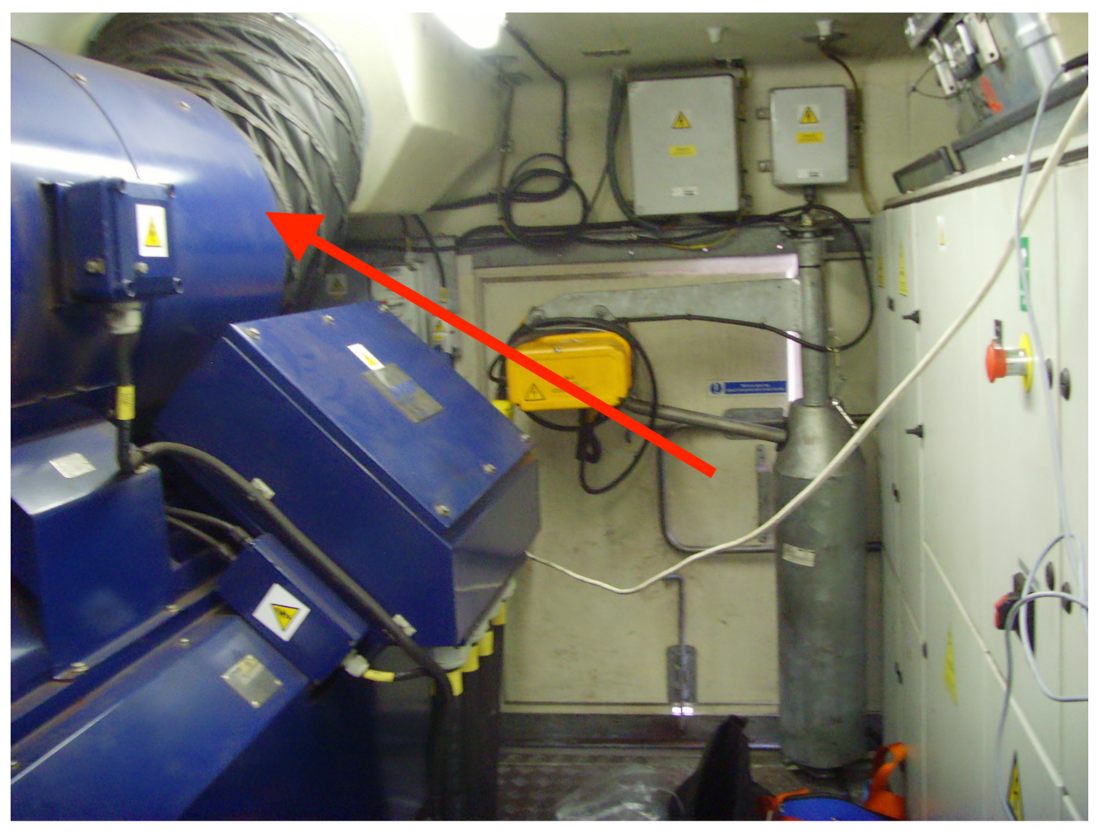
The gearbox and the generator models are the same for all the test case wind turbines. The model of the generator in this case is a Weier 850 kW, shown in Figure 3, and the main features are reported in Table 1. It should be noted that the generator of wind turbine ITA4 reached its end of life in February 2018; this represents an interesting test case, because the performance before and after the generator replacement can be analyzed. For this reason, a devoted analysis is performed for ITA4.
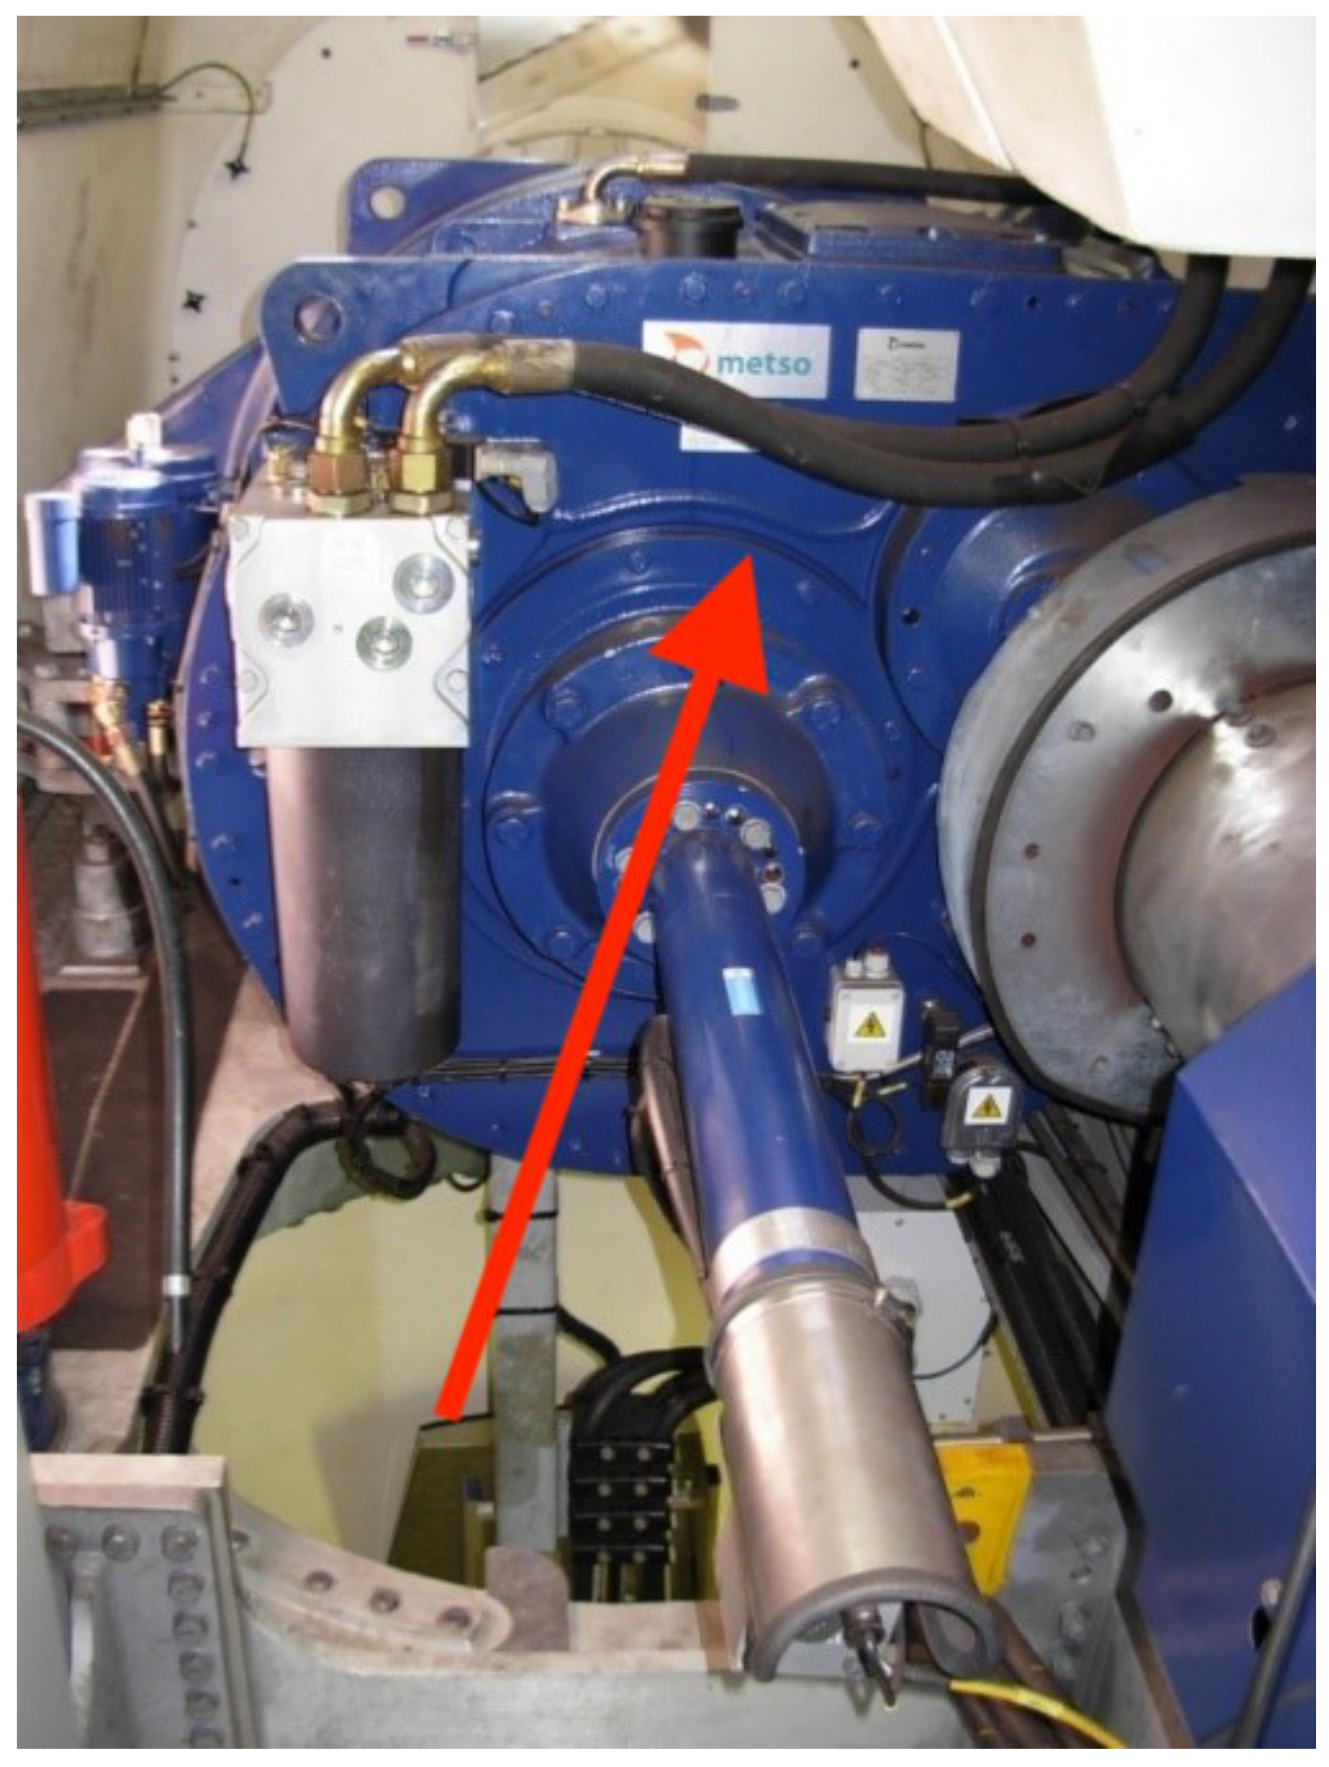
The gearbox of the wind turbines is Metso PLH-400V52; it is shown in Figure 4, and the principal specifications are reported in Table 2. This information was reported in [24].
The data sets at our disposal are from 2008 to 2019 for Test Case 1 (except 2016) and from 2013 to 2020 for Test Case 2; these were organized in yearly packets to be analyzed in parallel, which are characterized by the wind turbines having the same age. This is represented in Table 3.
On the grounds of the above considerations about the ITA4 wind turbine and the generator replacement, a separate analysis was conducted using the data sets D 2017 2 , D 2018 2 , and D 2019 2 . The data set D 2018 2 started since the replacement date of the generator at ITA4 (in March).
The measurements at our disposal are reported in Table 4.
In order to correctly interpret the performance of the wind turbines, it is fundamental to filter the operation data appropriately. The first filter that was applied to the data of both test cases was based on the run time counter. For Test Case 2, where the wind turbines operate under possible limitations dictated by the grid, the measurements corresponding to curtailment were filtered out through the analysis of the outliers with respect to the average wind speed-blade pitch curve.
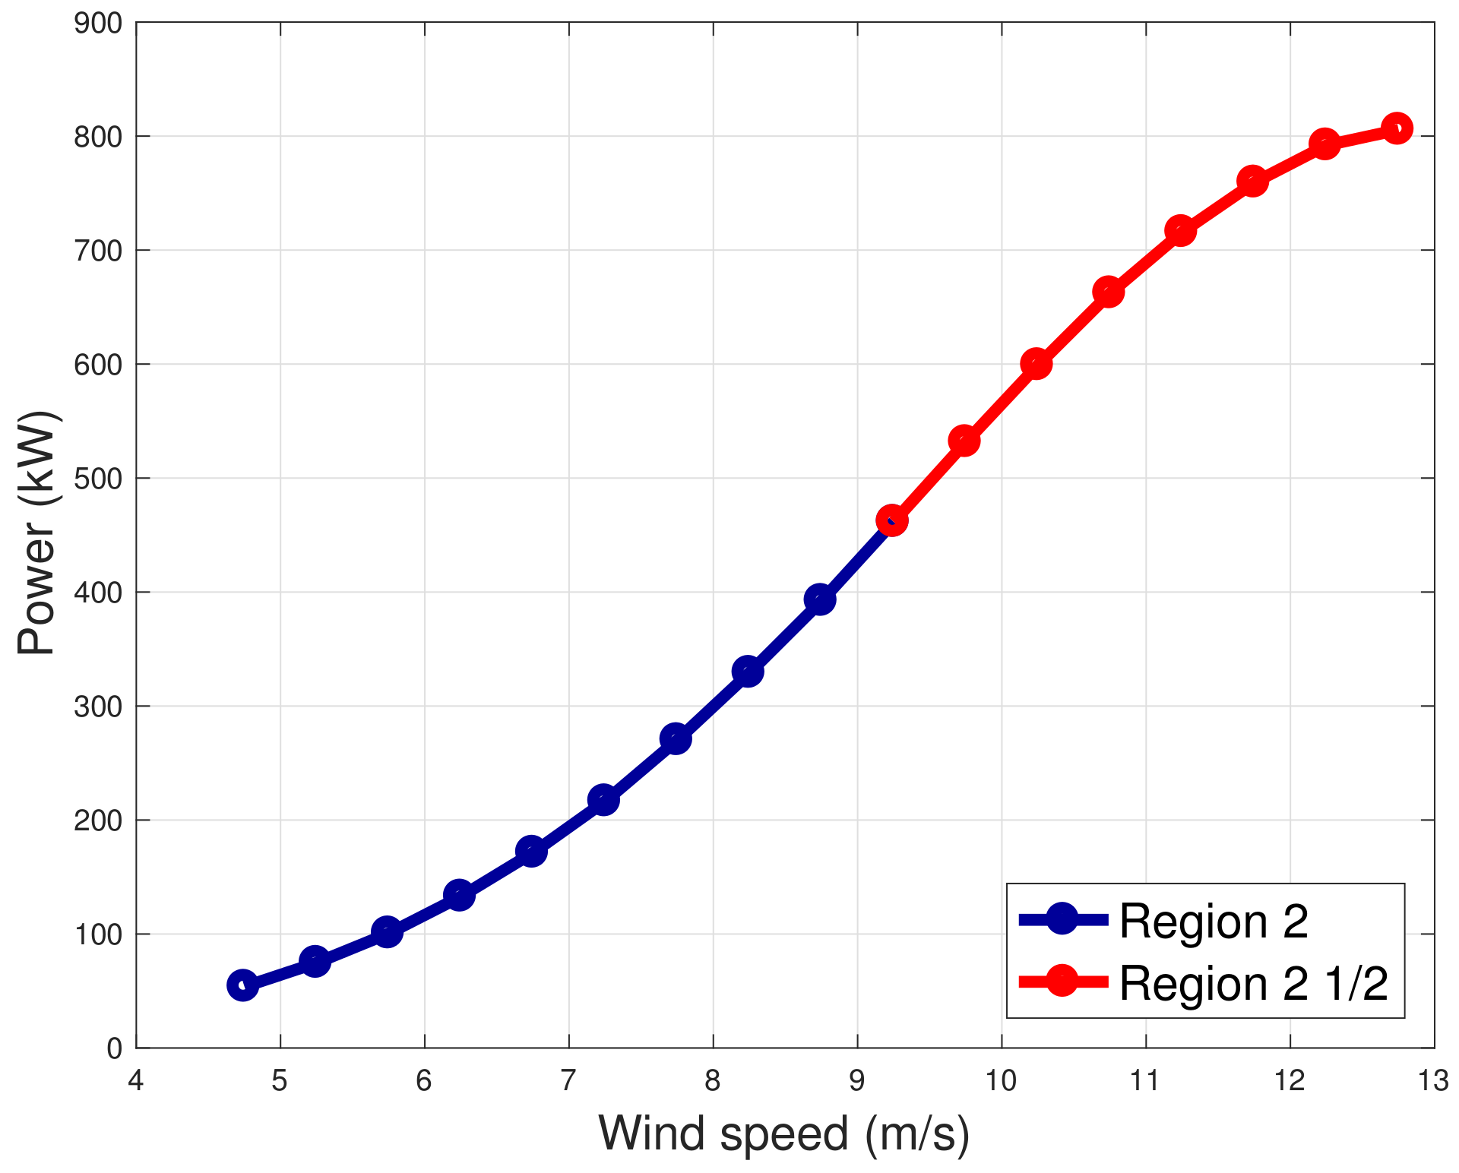
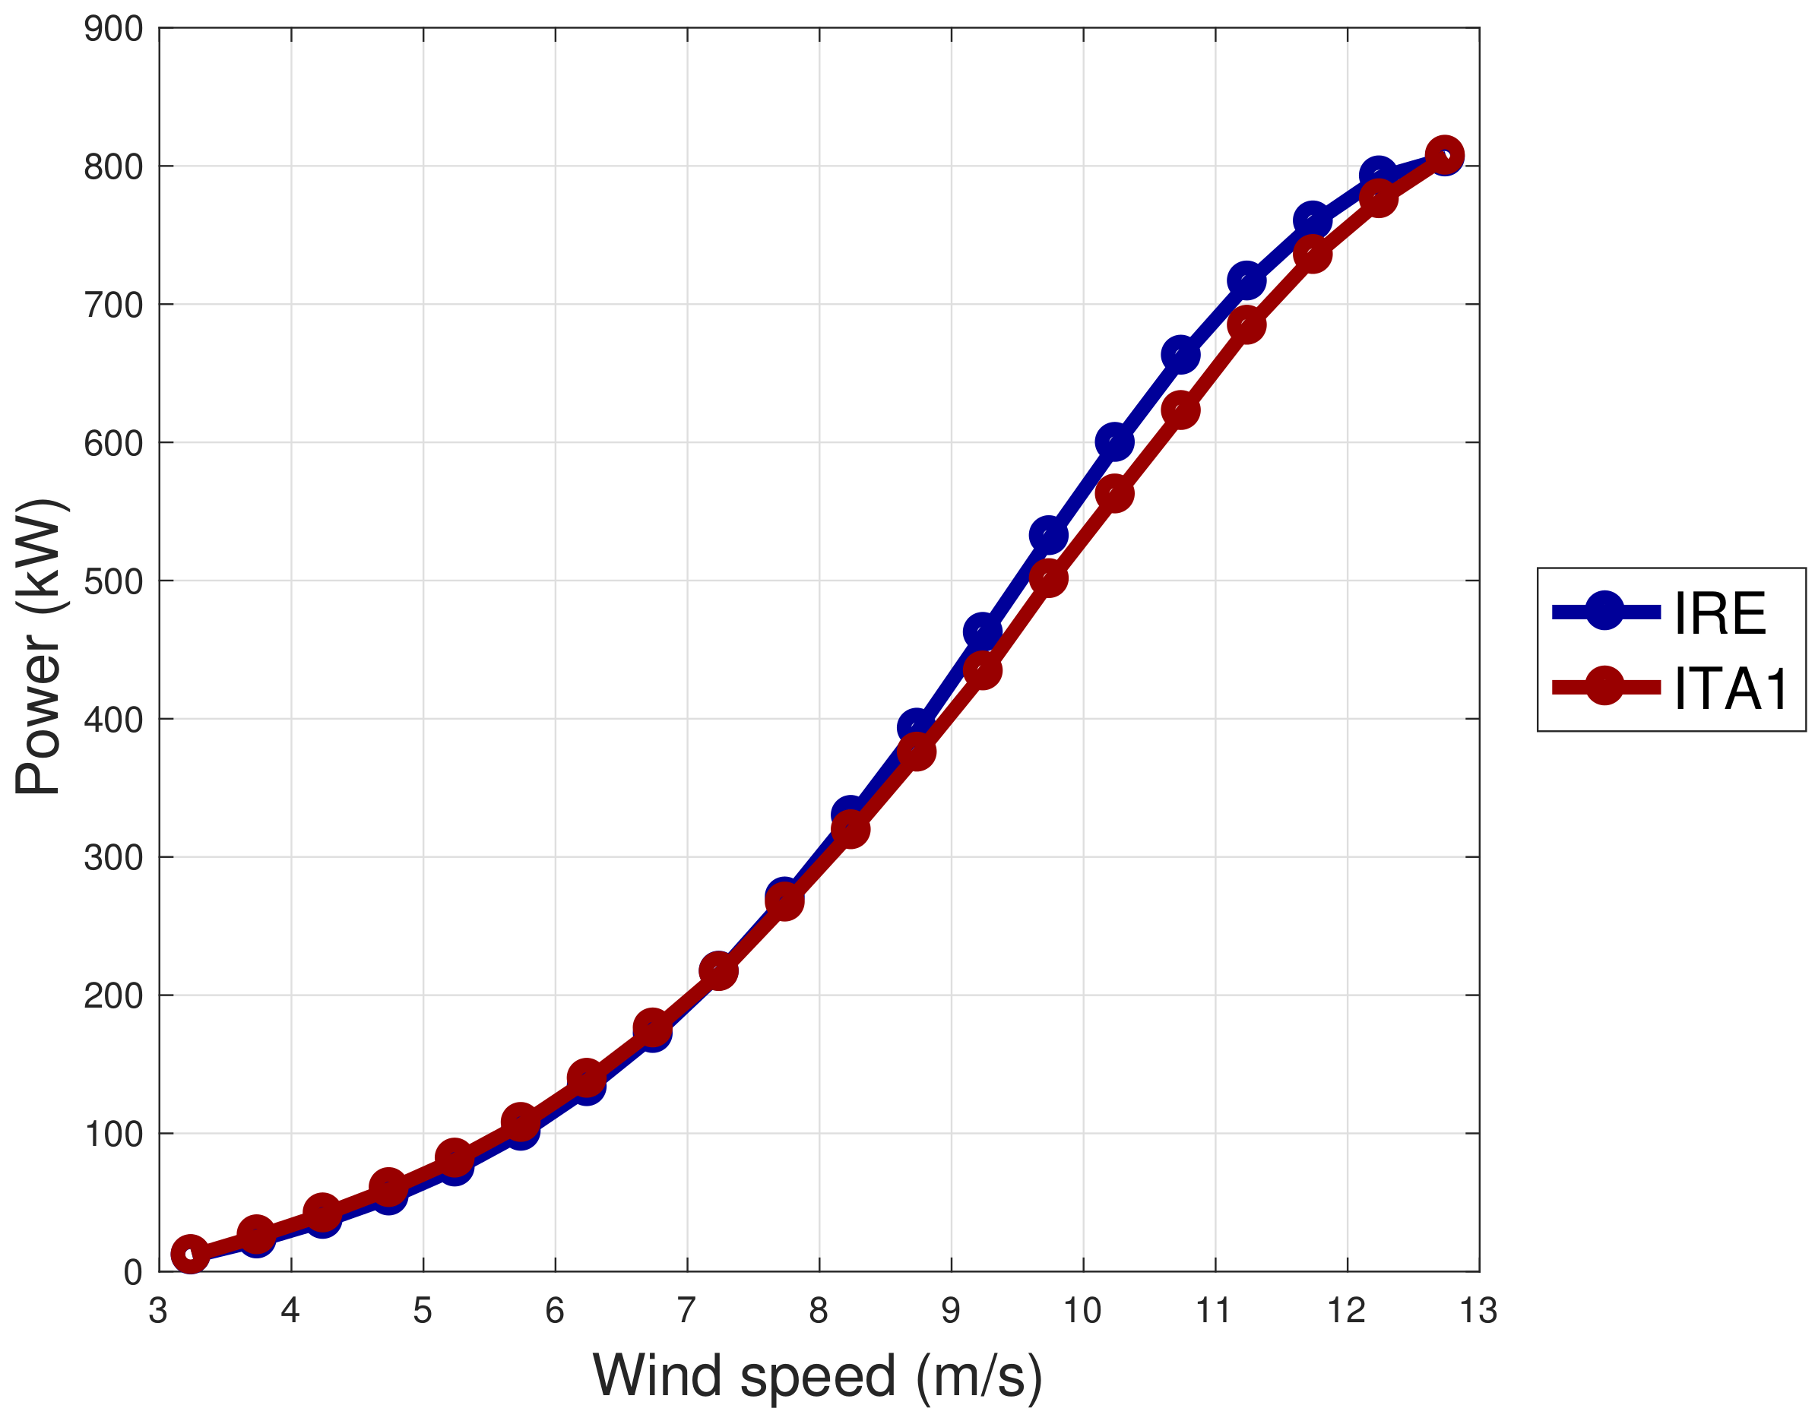
For the objectives of the present study, it is important to distinguish the data sets on the basis of the operation regions, which respectively are fixed pitch-variable rotational speed and vice versa. In order to do this, on the grounds of the qualitative analysis of the wind speed-generator speed and wind speed-blade pitch curves, it was decided to employ the nacelle wind intensity v to discriminate the two working regions, as indicated in Table 5 and shown in Figure 5 on a sample power curve (IRE wind turbine). The same notation as in [25] was adopted: the regime when the wind turbine operates at full aerodynamic load, with variable rotational speed and fixed pitch, is indicated as Region 2; instead, the regime characterized by rated rotational speed and variable pitch is indicated as Region 2 1 2 .

3. The Method

In this section, the adopted methodologies are explained: the underlying idea is similar to [25], but the analysis was adapted and generalized in order to consider also the comparisons between wind turbines placed in different sites. On these grounds, there are overlaps between the following section and [25].

3.1. Operation Curve Analysis

The methodology for the analysis of the operation curves is inspired by the recommendations of the International Electrotechnical Commission (IEC) [27] as regards the power curve, which is the observed relation between the wind intensity v and the power output P. The binning method proposed by the IEC is particularly intuitive and consists of dividing the data into wind speed intervals of of 0.5 or 1 m/s in amplitude and computing the average power for each interval, thus obtaining an average power curve.
The average wind speed for the i-th interval is defined in Equation (1):
v ¯ i = 1 N i j = 1 N i v i , j
and the average power for the bin is computed as in Equation (2):
P ¯ i = 1 N i j = 1 N i P i , j .
With this notation, it is intended that there are N i wind speed measurements for each i-th bin, that v i , j is the j-th wind speed measurement in the i-th bin, and that P i , j is the corresponding power output.
There are some critical points in the analysis of the power curve through the binning method, which are particularly relevant if the objective is comparing wind turbines sited in different environments. The main issue is that the power has a multivariate dependence on ambient conditions, which include atmospheric stability, wind shear, turbulence intensity, and so on; these effects can be particularly relevant in complex terrain [30,31,32,33] and affect the nacelle transfer function [28,29]. Therefore, one should not expect that the measured relation between nacelle wind speed and power output is the same in different environments: this expectation would lead to the wrong conclusions, as the comparison between the two test cases in this work indicates. An illustrative example is the power curve reported in Figure 6 for the IRE and ITA1 wind turbines having the same age (seven years): data are averaged per wind speed intervals of 0.5 m/s. From Figure 6, one would conclude that the ITA wind turbine is remarkably under-performing with respect to the IRE one. This conclusion is incorrect, because the wind turbines are placed in different sites and the ambient conditions affect the nacelle wind speed measurements. In particular, Figure 6 is consistent with Figure 2 because higher turbulence means a higher apparent curve in Region 2 and a sensibly lower apparent curve in Region 2 1 2 . This interpretation is consistent also with Figure 7, where the standard deviation of the IEC-based power curve of Figure 6 is reported: it arises that for the ITA1 wind turbine, the extracted power for given average wind speed varies more than for the IRE wind turbine.
For these reasons, in order to compare reliably the performance of the same model of wind turbine placed in different sites, it is more appropriate to compare operation curves that are not based on the nacelle wind speed measurements: in this study, the same curves as in [25] are selected, which are the generator speed-power curve and the blade pitch-power curve. In studies like [34,35,36], it was observed that operation variables as the rotor speed, generator speed, and blade pitch are important for a reliable multivariate analysis of the power of a wind turbine [37,38]. In this study, following [38], a step forward with respect to the literature is made because the selected curves involve couples of operation variables and do not involve the nacelle wind speed.
In [25], it has been observed that the above curves should be interpreted in light of the control of the wind turbines: for moderate wind speed (approximately 5 v 9 m/s), wind turbines operate with a variable rotational speed and fixed pitch; for higher wind speeds (approximately 9 v 13 m/s), the rotational speed is rated and the blade pitch varies. These two control regions were indicated as Region 2 and Region 2 1 2 in [25] (Table 5), and this notation was also adopted in this study. This means that in the present study, as well as in [25], the rotor equivalent wind speed was used in what here is called Region 2, because rotor speed and generator speed are proportional. It can be said that instead in Region 2 1 2 , a sort of pitch equivalent wind speed has been introduced, because in that operation region, the rotational speed has saturated and does not provide information about the wind intensity and therefore the amount of power that should be extracted.
In Figure 8 and Figure 9, examples of binned generator speed-power and blade pitch-power curves are respectively reported for Region 2 and Region 2 1 2 . For the readability of the Figures, the curves are plotted for two sample wind turbines (IRE and ITA1) when they had the same age (7 years). From Figure 8 and Figure 9, it arises that the wind turbines placed in the two different sites respond to the same control logic because the curves are substantially the same: it should be noted that this is not obvious because innovations in the control logic and in the rotational speed management can occur during the lifetime of wind turbines (as analyzed for example in [39]). From Figure 9, in particular, it arises that for the given blade pitch angle, the amount of power extracted by the ITA1 wind turbine is on average a little higher than for the IRE wind turbine: from this curve, one would conclude that the performance of ITA1 is a little better than IRE, while the opposite conclusion would be drawn from the power curve in Figure 6. This observation further supports that power curves of wind turbines sited in different environments should not be compared.
On the grounds of these observations, it is important for this study to generalize the IEC binning method for the analysis of the operation curves of interest. For a generic selection ( G 1 , G 2 ) of the quantities to be put in the abscissa and ordinate of the operation curve, Equations (1) and (2) remain, with v substituted by G 1 and P substituted by G 2 . There are no established recommendations about how to select the averaging intervals for G 1 : a meaningful rule of thumb might be considering intervals of the order of 10% of the range that G 1 can assume. The summary of the curves of interest for each working region is reported in Table 6 and is based on the selections employed in [25].

3.2. Support Vector Regression

The IEC-like analysis of the operation curves indicated in Table 6 provides a qualitative indication of the performance of the wind turbines of interest. In order to achieve a quantitative estimation, a data-driven regression is helpful. The objective is therefore an estimation of the performance worsening with age for each wind turbine (vertical) and the horizontal comparison between the curves of the two test cases at the same age of the wind turbines. In practice, a reference data set is employed for training the regression, which means constructing a digital twin of the curves of interest. The digital twin is subsequently employed for simulating the output, i.e., the power P, given the input variables’ measurements in the target data set: the difference between the model estimates and the measurements of the power encode how much the target data set differs from the reference one. Depending on the reference and target data set selection, this same kind of procedure allows performing the vertical and the horizontal analysis, which means analyzing the aging history of each wind turbine and comparing the behavior of the ITA wind turbines with respect to the IRE one for a given age of the wind turbines. The structure of the employed methods can be visualized in Figure 10.
The selected regression is a support vector regression with a Gaussian kernel [40]. The following explanation of the general methodology for the regression has overlaps with the manuscripts [24,25].
Consider at first a linear model (Equation (3)):
f ( X ) = X β + b .
X is the matrix of the covariates. β are the coefficients of the multivariate regression. b are the intercept coefficients. The objective of the regression is using the training data set for estimating f ( X ) with the minimum norm value β β , given the constraint that the residuals between the measurement Y and the model estimate f ( X ) should be lower than a threshold ϵ for each n-th observation (Equation (4)):
Y n X n β + b n ϵ
The request that the norm of the regression coefficient vector ( β β ) should be minimum consists of searching for models that are as flat as possible, but this request must be compromised with the necessity that the model is as precise as possible (Equation (4)) for each observation. This kind of optimization problem, where the targets are possibly conflicting, is typically rephrased in the Lagrange dual formulation. The function to minimize is L α (Equation (5)):
L α = 1 2 i = 1 N j = 1 N α i α i * α j α j * X i X j + ϵ i = 1 N α i + α i * + i = 1 N Y i α i * α i ,
with the constraints (Equation (6)):
n = 1 N α n α n * = 0 0 α n C 0 α n * C ,
where C is the box constraint.
The β parameters are given in Equation (7):
β = n = 1 N α n α n * X n .
If α n or α n * is non-vanishing, the corresponding observation is called a support vector (hence the name of the regression).
Given the input variables matrix and the β coefficients computed on a training data set, the model can be used to predict through the function (Equation (8)):
f ( X ) = n = 1 N α n α n * X n X + b .
The non-linear support vector regression is obtained by replacing the products between the observations matrix with a non-linear kernel function (Equation (9)):
G X 1 , X 2 = φ X 1 φ X 2 ,
where φ is a transformation mapping the X observations into the feature space.
A Gaussian kernel selection is given in Equation (10) and is widely employed for non-linear problems:
G X i , X j = e X i X j 2 .
Then, Equation (5) is rewritten as in Equation (11):
L α = 1 2 i = 1 N j = 1 N α i α i * α j α j * G X i , X j + ϵ i = 1 N α i + α i * + i = 1 N Y i α i * α i ,
and Equation (8) for predicting is rewritten as in Equation (12):
f ( X ) = n = 1 N α n α n * G X n , X + b .
The data sets must be organized appropriately in order to distinguish performance differences. In order to do this, therefore:
  • We divide the training data set into two parts: 2 3 of the data (named D0) are used for training the model; 1 3 (D1) is used for validating and establishing a reference for the behavior of the residuals between model estimates and measurements.
  • The model is subsequently validated on the target data set D2, with the objective of comparing the residuals against the reference for the data set D1.
The general methodology moves from Equation (13) with i = 1 , 2 , which defines the sets of residuals for data sets D1 and D2:
R ( X i ) = Y ( X i ) f ( X i ) .
For i = 1 , 2 , one computes (Equation (14)):
Δ i = 100 X D a t a i Y ( X ) f ( X ) X D a t a i Y ( X )
and the quantity in Equation (15):
Δ = Δ 2 Δ 1
provides an estimate of the performance deviation from data sets D1 to D2 [39,41].
As discussed above, vertical and horizontal analysis are performed in this work. This translates into the use of the data sets that are summarized in Table 7. As can be argued from Table 7 and from the block diagram in Figure 11, the vertical analysis spans the ages for each wind turbine, while the horizontal analysis constructs the reference at a certain age with IRE data and spans the ITA wind turbines at the same age.
If, for example, the performance of the wind turbine in the data set D2 is worse than in D1 (as is expected for an aging assessment), the residuals of the D2 data set should be lower with respect to those of D1 because the simulated data are obtained with a model that is trained when the wind turbine had better performance with respect to D2.
In Table 8, the setup of the models for each operation region is indicated.
Furthermore, the case of ITA4 and generator replacement was treated by performing a vertical analysis in Region 2, where D0 and D1 were extracted from D 2017 2 , and the model as validated against D 2018 2 (since March) and D 2019 2 . The rationale for this selection was taking as the reference the data set immediately before the generator replacement at ITA4 and as the validation the data sets immediately after generator replacement: a model for each wind turbine was set up, in order to highlight the difference between ITA4 and the other wind turbines in the farm (which have not replaced the generator).

4. Results

4.1. Operation Curve Analysis

4.1.1. Region 2: Curve Analysis

Figure 12 contains a comparison between the two test cases. The generator speed-power curve is reported, in the form of the difference between the Italian wind turbines and the Irish benchmark at the same wind turbines age. It arises that for seven years of wind turbine age, the difference is negative for all the ITA wind turbines, especially approaching the rated speed. Subsequently, the difference stabilizes around zero and becomes positive when the wind turbines are aged 12 years. These results can be better interpreted in light of Figure 13, which groups for each wind turbine the comparison between the curve at seven years of age and for subsequent years: it arises that for the IRE wind turbine, there is a sharp decline at 12 years of wind turbine age, which does not occur at the ITA wind turbines. This results in the fact that the IRE and ITA wind turbines have comparable performance up to when the wind turbines are aged 12 years, and at 12 years, the performance of the ITA wind turbines is clearly better than the IRE one. The analysis of Figure 13 indicates a trend of aging for wind turbines ITA2 and ITA3 because the amount of extracted power for the given rotational speed slightly decreases in time: it should be noted that this phenomenon is of the order of a few kW, and it would be interesting to analyze its further evolution and inquire if and possibly when a sharp decline as for the IRE wind turbine occurs. Furthermore, it is not surprising to notice that ITA4 is the only wind turbine for which the curve at 12 years of age is better than the one at 10 years of age: the data set at 10 years of age describes the generator at its end of life, while the data set at 12 years describes ITA4 operating with a new generator.
Figure 14 contains an analysis devoted to the case of ITA4: the curves of ITA4 after the generator replacement are considered (data sets D 2018 2 and D 2019 2 , corresponding to 11 and 12 years of age) and are compared against the data set immediately before the generator replacement ( D 2017 2 , corresponding to 10 years of age). This kind of plot is reported for ITA4 and for ITA2, which is individuated as being affected by declining performance (Figure 13). From Figure 13e, it arises that for ITA4, after the generator replacement, there is a clear improvement in the amount of power extracted for the given generator speed, which is more visible as the rotational speed increases. The other way round, for ITA2, there is a clear worsening, especially for moderate and high generator speed. In Section 4.2, using support vector regression, it will be possible to estimate quantitatively the average production improvement after the generator replacement at ITA4.

4.1.2. Region 2 1 2 : Curve Analysis

In Figure 15, the same kind of plot as in Figure 12 is provided for the blade pitch-power curve. The curve is reported in the form of the difference between the IRE benchmark curve and the target ITA wind turbines’ curve (each taken at the same wind turbine age). In general, it arises that the behavior is less regular with respect to the generator-power curve: a common feature of the ITA curves is that they are lower than the IRE one near the lower and upper bounds of the pitch angle, while the curves are comparable elsewhere. The evolution in time of the curve of each wind turbine is shown in Figure 16: a declining trend is visible for the IRE wind turbine, and this phenomenon was interpreted in [25] as due to the gearbox approaching its end of life; the behavior is less regular for the ITA wind turbines, despite a decreasing trend being visible in the latest three data sets for ITA1, ITA2, and ITA3 (similarly to what happens for the generator speed-power curve). Furthermore, it can be noticed that the replacement of the generator at ITA4 seems not to influence noticeably the behavior in Region 2 1 2 . This confirms the observations in [24,25] about the fact that the aging of different components of the wind turbines impacts differently depending on the working region. Finally, it can be observed that, in general, the more complicated behavior of the pitch curves for the ITA wind turbines can likely be interpreted as due to the fact that they are sited in a very complex terrain in a mountainous area.

4.2. Support Vector Regression

In this section, the qualitative results of Section 4.1 are re-interpreted quantitatively by adopting a support vector regression with a Gaussian kernel for constructing a digital twin of the operation curves of interest. The importance of this part of the study is also the fact that the analysis, similarly to Section 4.1, was conducted vertically and horizontally. In other words, the reference digital twin of the curves was constructed as follows:
  • For the vertical analysis, the reference was set by training the regression with the data describing each wind turbine aged seven years. The evolution of the curves was quantified by analyzing how the residuals between model estimates and measurements change in all the posterior data sets for each wind turbine. In practice, this analysis follows the history of each wind turbine and compares each wind turbine against itself. This is equivalent to selecting the D0 and D1 data sets from the seven years age data set for each wind turbine and the D2 data set as each posterior one.
  • The objective of the horizontal analysis was inquiring how similar the behaviors of wind turbines of the same model are, which are sited in different environments, when they have the same age. The benchmark was selected as the IRE wind turbine this means that D0 and D1 were selected from the data sets of the IRE wind turbine. A separate model was trained per each age and was validated against the ITA data sets of the same age (which therefore constitute the D2 data set). For example, if one considers the generator speed-power curve, the behavior of the IRE wind turbine is learned through the regression and is replicated by predicting how much power the IRE wind turbine would extract when the generator speeds are those measured at the ITA wind turbines; the comparison between measurement and model estimates allows quantifying the average performance difference between the IRE and ITA wind turbines at a given age.
A separate vertical analysis was performed for analyzing the effect of generator replacement at ITA4; the details are reported in Section 4.2.1.

4.2.1. Region 2: Regression Analysis

The results of the vertical analysis for the generator speed-power curve are reported in Table 9: the IRE wind turbine underwent an evident decline, which in five years time (7 to 12 years of age) reached 8.8% on average. As shown also in Section 4.1, the ITA2 and ITA3 wind turbines had a slight trend of performance worsening, which is definitely non-comparable with those of the IRA wind turbine because it reached the order of 1% at 12 years age. ITA1 seemed not to be affected by a remarkable aging trend. The case of ITA4 stood apart, because of the generator replacement: at 12 years of age, the performance was visibly better with respect to 10 years of age (when the generator was approaching its end of life) and with respect to the earliest data set at our disposal in this study (the Δ at 12 years with respect to seven years was positive).
Given the different behavior in time of the IRE and ITA wind turbines, the horizontal analysis of Table 10 is particularly interesting: it arises that for seven years of wind turbine age, the performance of the IRE wind turbine is superior to the ITA ones, and this is mainly due to the behavior near rated rotational speed (Figure 12). From eight years of wind turbine age, the difference between the ITA and the IRE wind turbine erodes, and the trend inverts: the ITA wind turbines extract on average a little more power for a given generator speed, except for ITA2 and ITA4, which at 10 years of age, have slightly worse behavior with respect to the IRE wind turbine. At 12 years of wind turbine age, the difference between the IRE and ITA wind turbines is dictated by the sharp decline of the IRE wind turbine’s performance: the ITA wind turbines result in having considerably better behavior, despite some differences (the Δ varies from 7.8% to 3.8%).
In general, the analysis of Table 10 and Figure 12 indicates that the behavior of the operation curves of the wind turbines of the same model at the same age is qualitatively similar, but there are some quantitative differences that depend on the history of each wind turbine. For example, the ITA wind turbines have likely less suffered from aging from seven to 12 years of age, but started from an inferior performance at seven years of age. It is likely that the energy balance between the two test cases is tricky to understand up to 10 years of age, while the situation becomes clearer at 12 years of age because of the evident decline of the IRE wind turbine: this indicates that the decline of the generator efficiency can deteriorate considerably the performance of a wind turbine (as in the IRE case), but the other four wind turbines considered in this study do not show evidence of a similar remarkable behavior.
Table 11 reports the result of a vertical analysis that has been conducted in order to understand how the performance of ITA4 changed after the generator replacement, with respect to immediately before. Similarly to Figure 14, ITA2 and ITA4 are compared. The baseline data set was selected to be D 2017 2 , and the target data sets are respectively D 2018 2 (after the generator replacement at ITA4) and D 2019 2 . It arises that ITA4 improved of the order of 2% with respect to the data set immediately before the generator replacement, while ITA2 instead shows a progressive performance decline. This result not only provides a consistency check of the method, similar to the one obtained in [24,25] as regards the substitution of a gearbox, but also indicates an estimate of the possible profitability of the replacement of aged components, whose performance has declined with the years. A further interesting consideration regards the comparison between ITA4 and IRE and the relation between performance and end of life: the performance of the IRE generator at 12 years of life is worse with respect to that of ITA4 when the generator reaches its end of life. This in general indicates that economic considerations regarding the profitability of components substitution should be read also in light of the expected lifetime, which is a complex topic, beyond the scope of the present study.

4.2.2. Region 2 1 2 : Regression Analysis

In Table 12, the results of the vertical analysis are reported: it arises that each wind turbine undergoes a performance worsening, which, from seven years to 12 years of age, is of the order of 1–2%. The addition of further test cases to the study substantially confirms the results in [24,25]: a decreasing trend is visible, but it is not as impactful as the generator efficiency decline observed for the IRE wind turbine. The horizontal analysis in Table 13 indicates that the performance of the IRE and ITA wind turbines is comparable in Region 2 1 2 from nine years of wind turbine age, while at seven years of age, three ITA wind turbines had superior performance with respect to the IRE one; it can be likely concluded that the aging in Region 2 1 2 impacted more the ITA wind turbines, but it should be noticed that the curves for the ITA wind turbines (as shown in Figure 15 and Figure 16) have a less regular behavior, which can be dictated by the complexity of the external environment.

4.2.3. Summary of the Results: Aging Estimate

The results from Section 4.2.1 and Section 4.2.2 are combined here (Table 14) to give a unique estimate of aging performance, which is obtained through a weighted average of the results from Table 9 and Table 12: the weights are selected to be the sizes of the data sets for respectively Region 2 and Region 2 1 2 for each turbine. By doing this, the estimates of Table 14 are obtained by taking into account how much time each wind turbine operates in each working region. It should be mentioned that this estimate corresponds to the sub-rated regime, and to obtain an estimate of annual energy production, the time of operation in the so-called Region 3 (at rated power) should be considered.
From Table 14, the results of [24,25] are substantially confirmed as regards the IRE wind turbine. As regards the ITA wind turbines, it arises that in five years time, ITA1-ITA2-ITA3 underwent a slight worsening (up to the order of 1.5%), while ITA4 even improved its performance thanks to the generator replacement.

5. Conclusions

The present work deals with the analysis of wind turbine performance decline with age. Motivated by previous findings in [24,25] about a Vestas V52 wind turbine sited at the Dundalk Institute of Technology in Ireland, in this study, four Vestas V52 sited in a mountainous area in southern Italy are selected as further test cases. The objective of the study was addressing if wind turbines of the same model present similar aging trends.
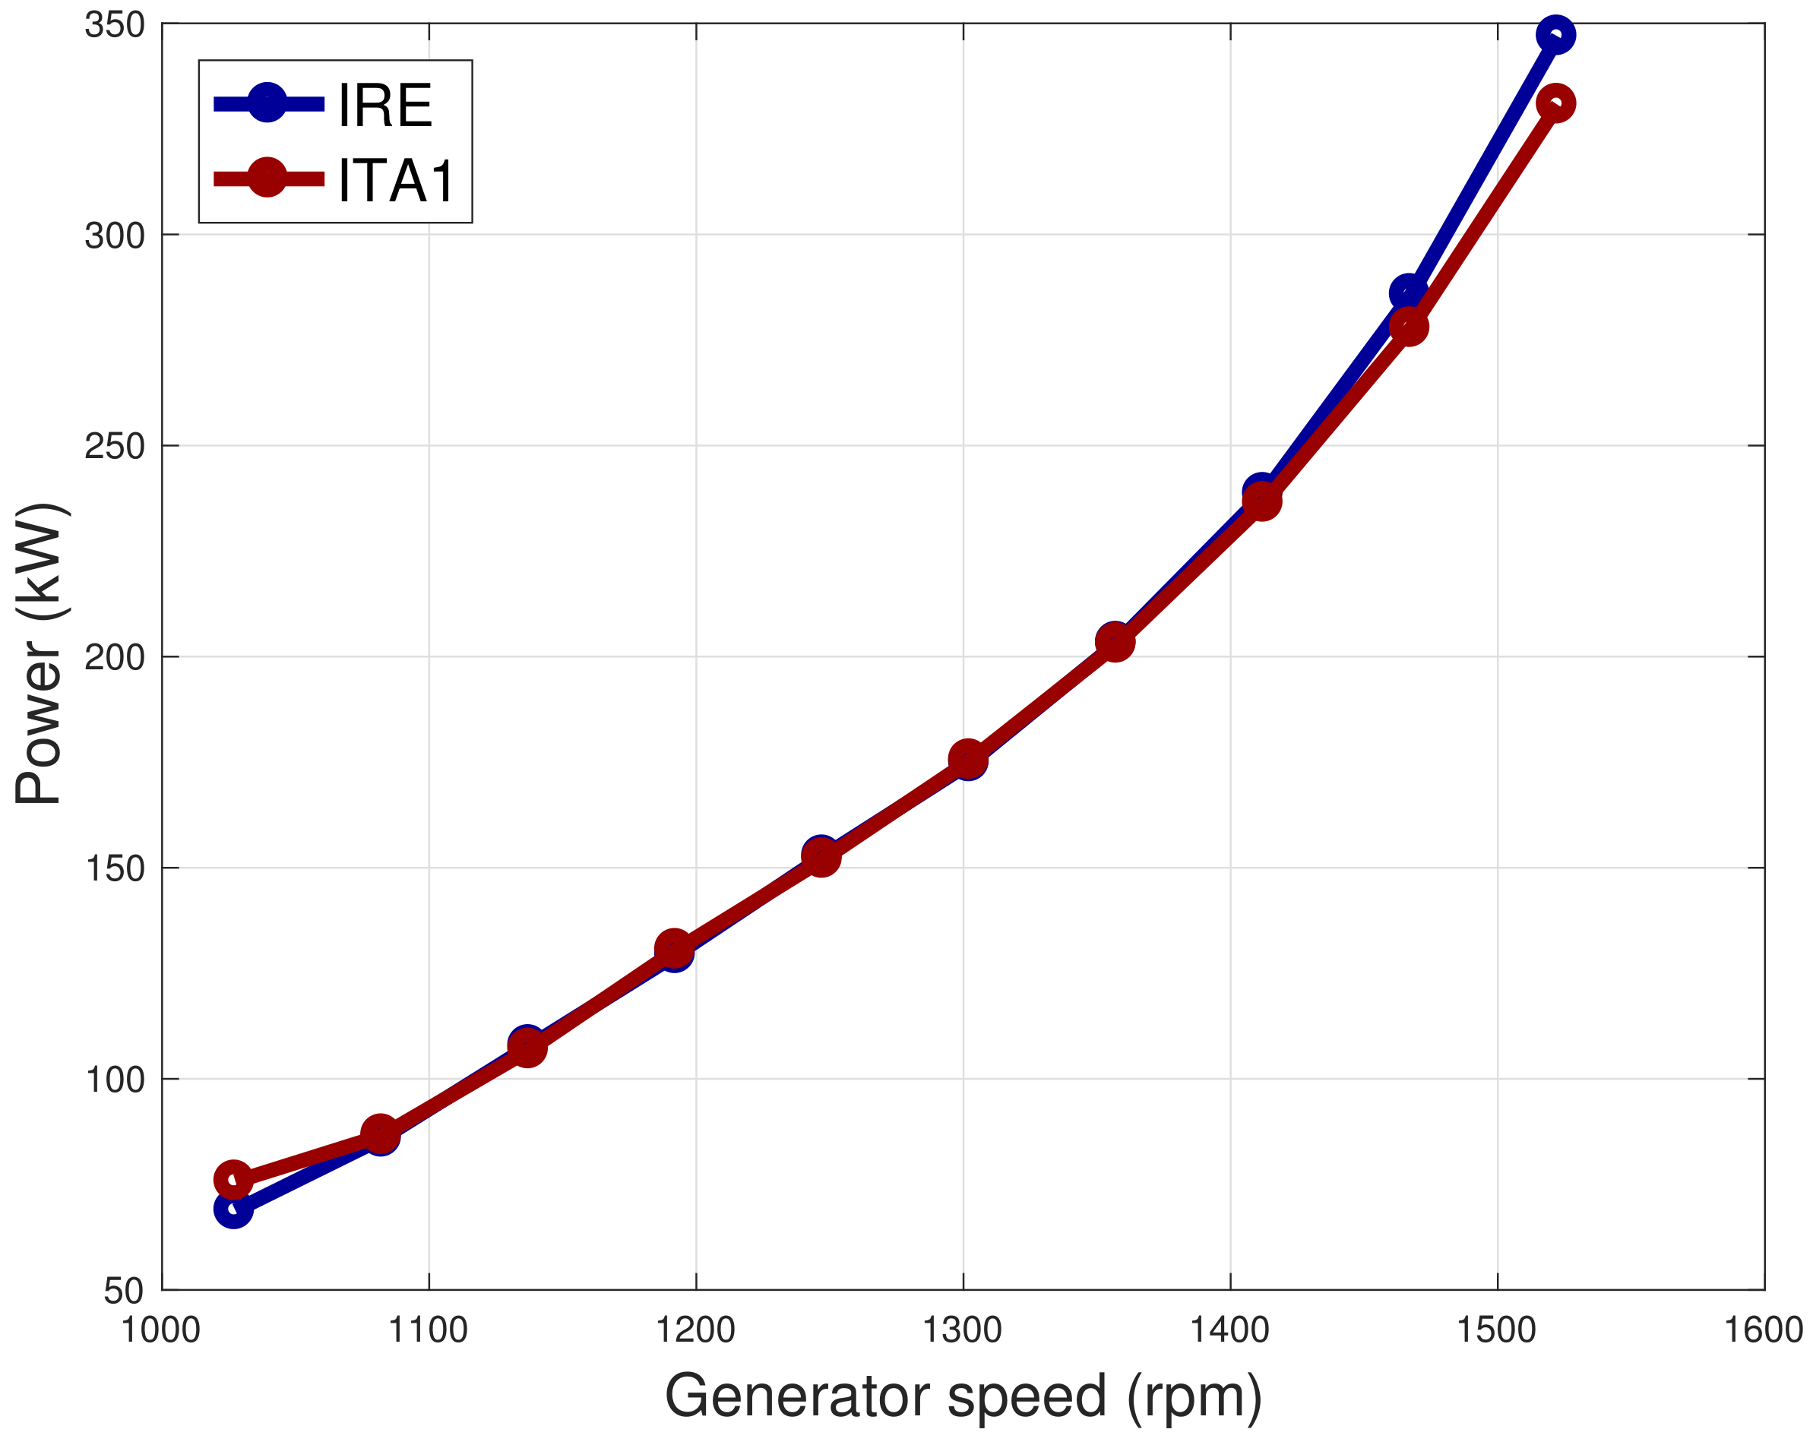
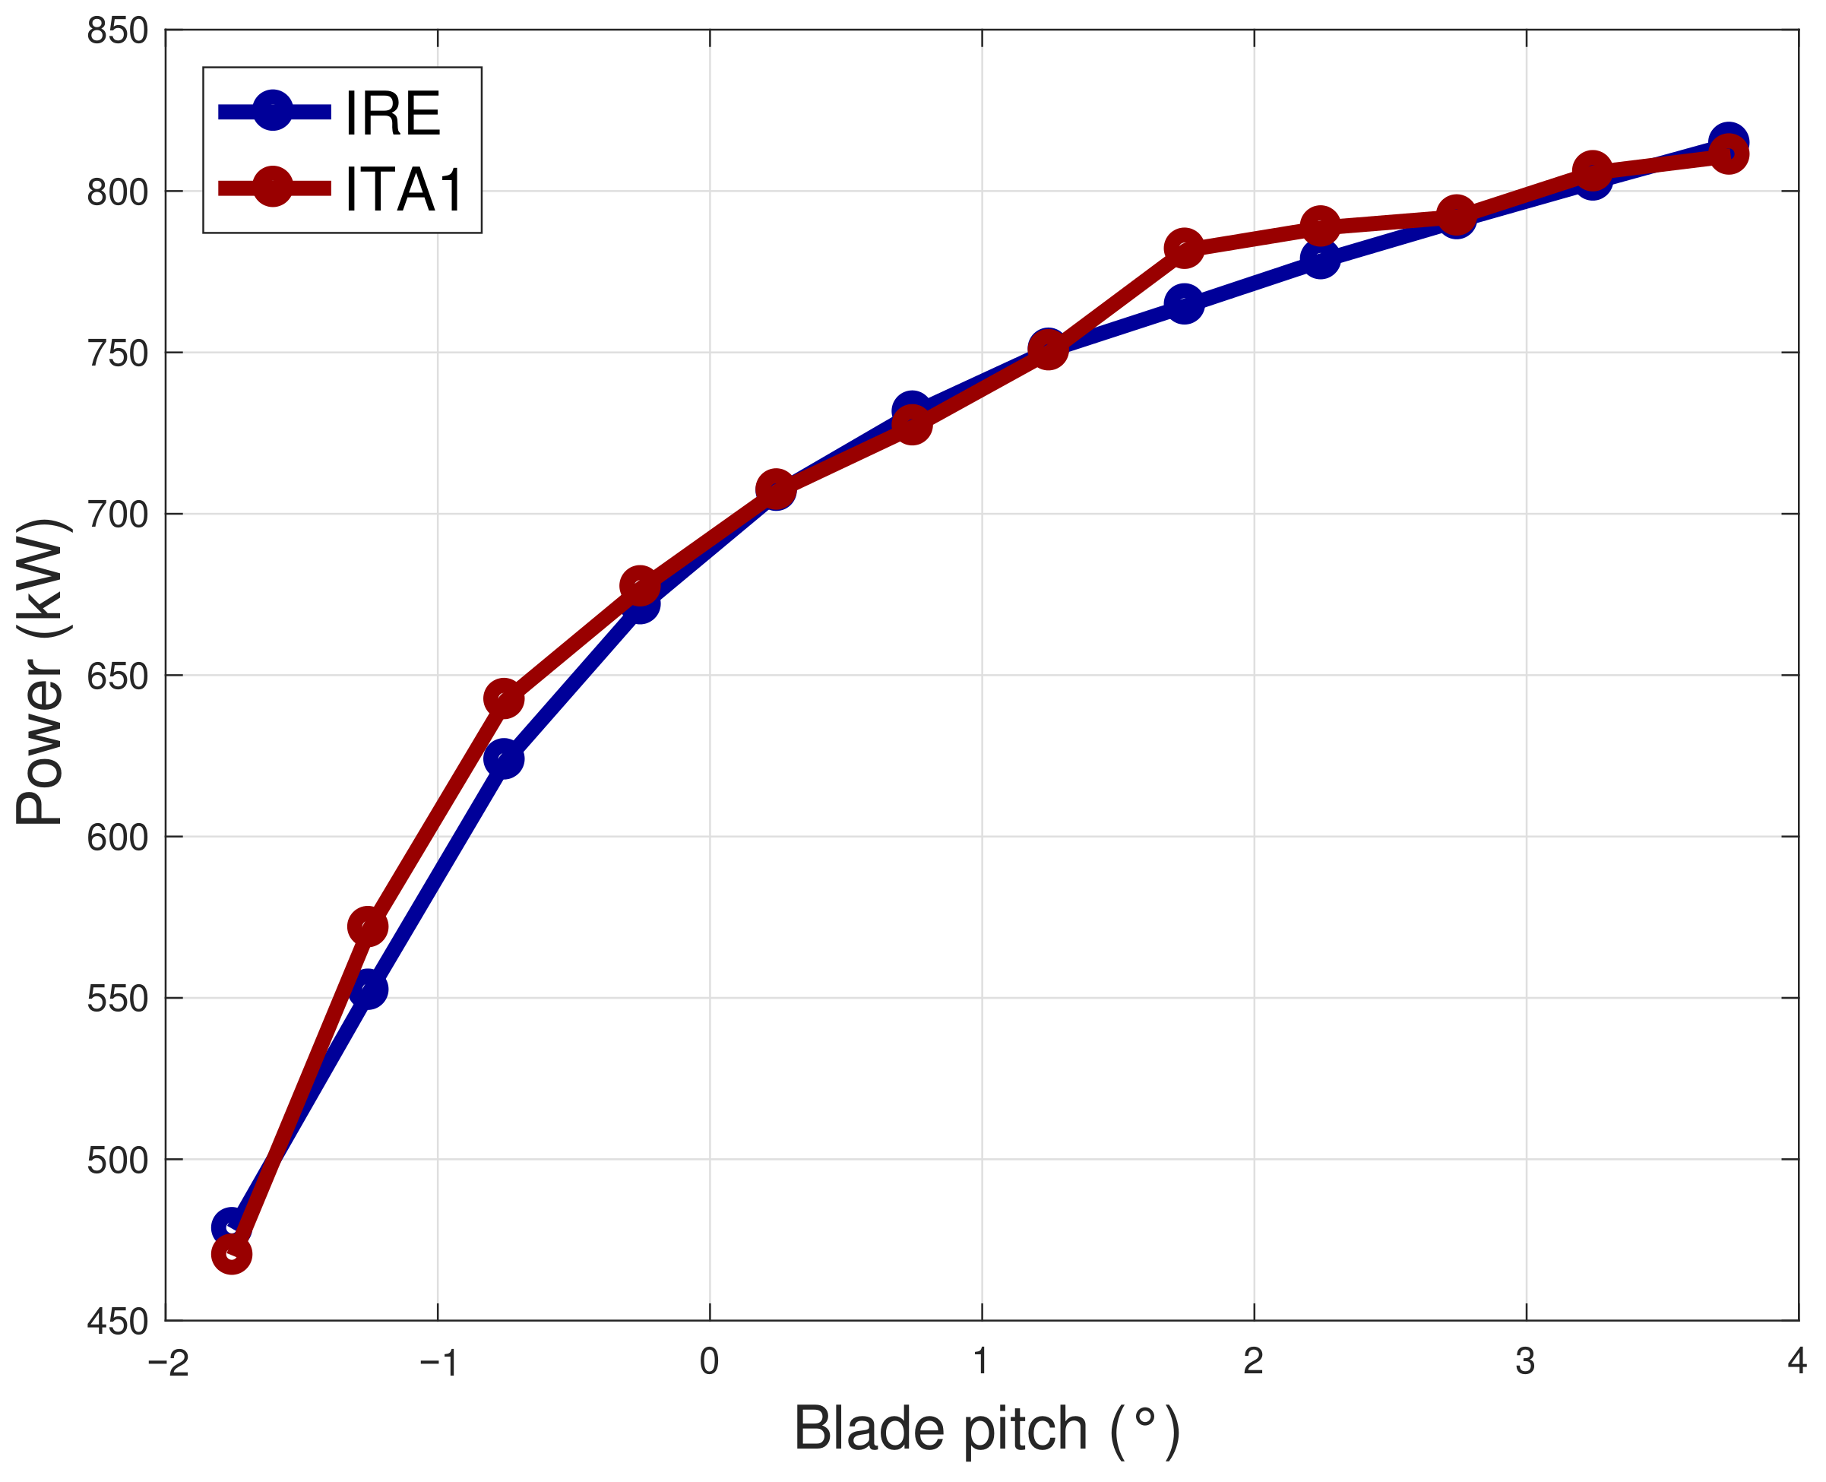
The employed methodologies consisted of the analysis of appropriate operation curves depending on the working region of the wind turbines and in a support vector regression for constructing digital twins of the curves of interest and for validating them against target data sets. The selected curves are the generator speed-power curve and blade pitch-power curve, and each is analyzed in the working region where it is of most interest: the former curve is analyzed for moderate wind speed, when the wind turbines operate at fixed pitch and variable rotational speed; the latter curve is analyzed for higher wind speed, when the wind turbines operate at rated rotational speed and variable pitch.
The methodologies were employed vertically and horizontally: in other words, for each wind turbine, its history was studied (vertical analysis), and the horizontal analysis consisted of the comparison between the IRE and ITA wind turbines when they had the same age. This approach goes beyond the scope of the present work because it contributes to the general problem of comparing the performance of the same model of wind turbine, installed in different environments: the power curve analysis is not reliable, because the environmental conditions affect the nacelle transfer function differently at each site. Therefore, it is more appropriate to analyze the operation curves, which do not depend on the nacelle wind speed measurements, as the ones selected in this study.
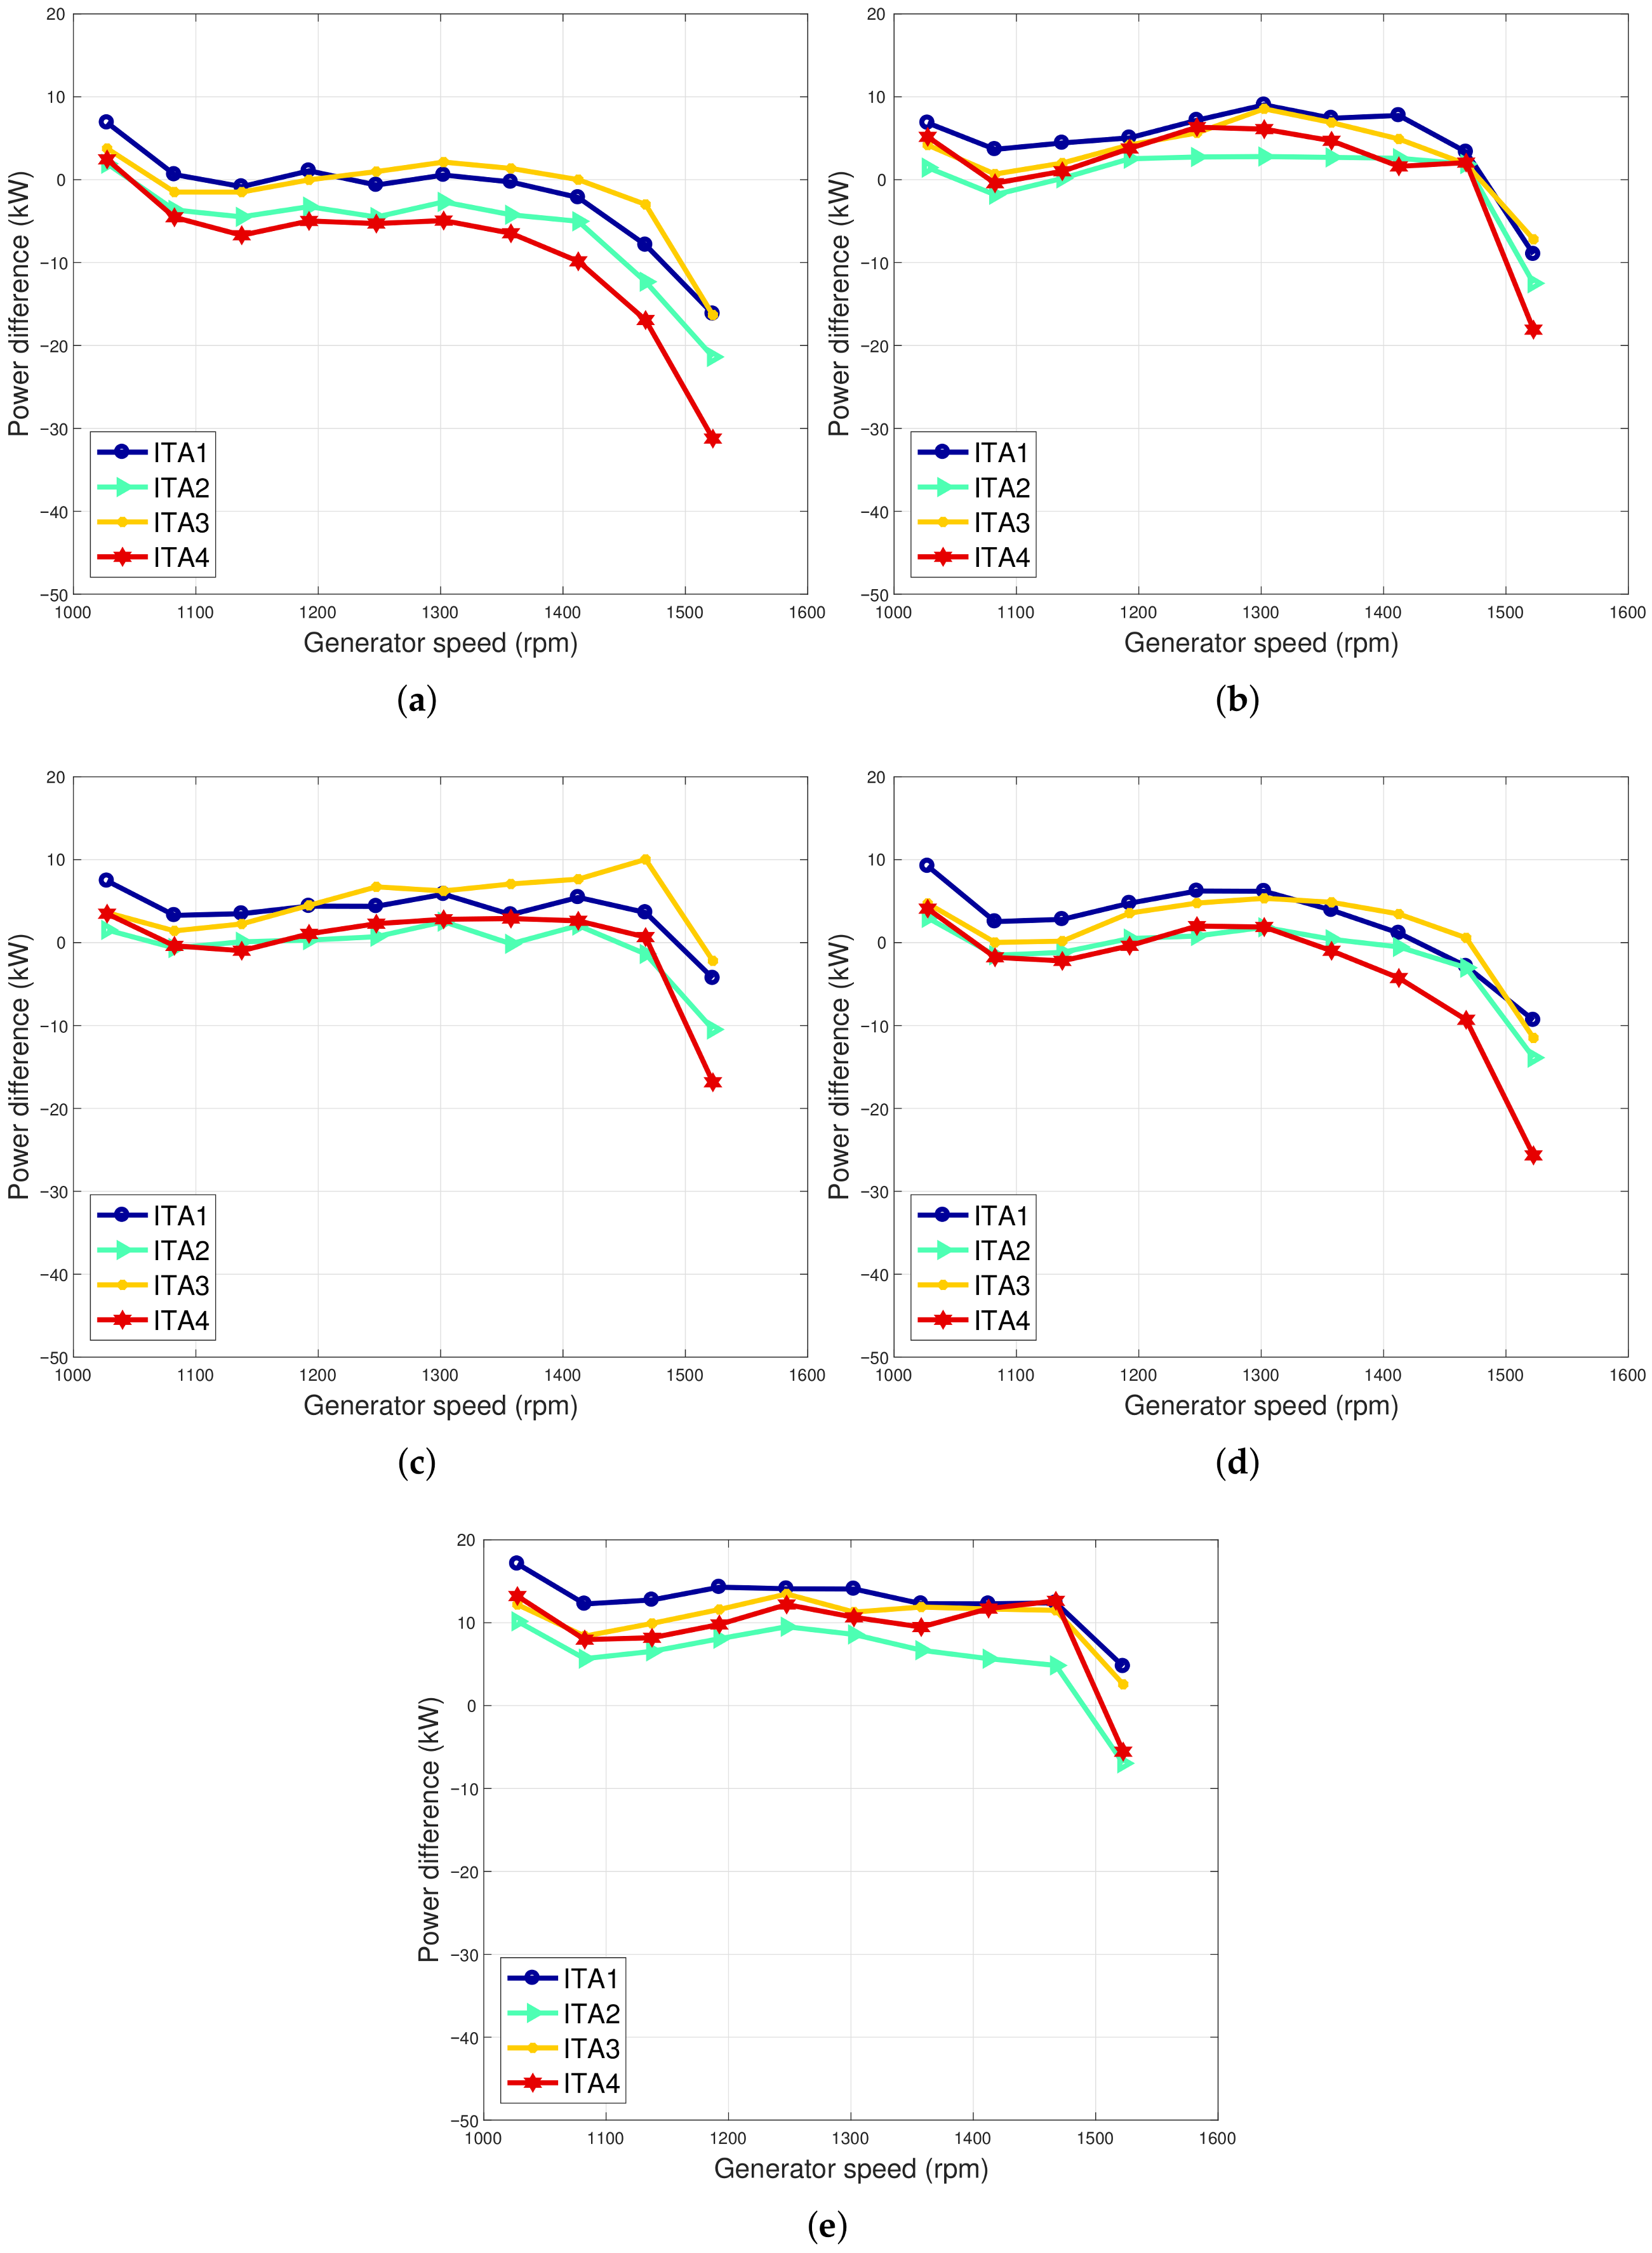
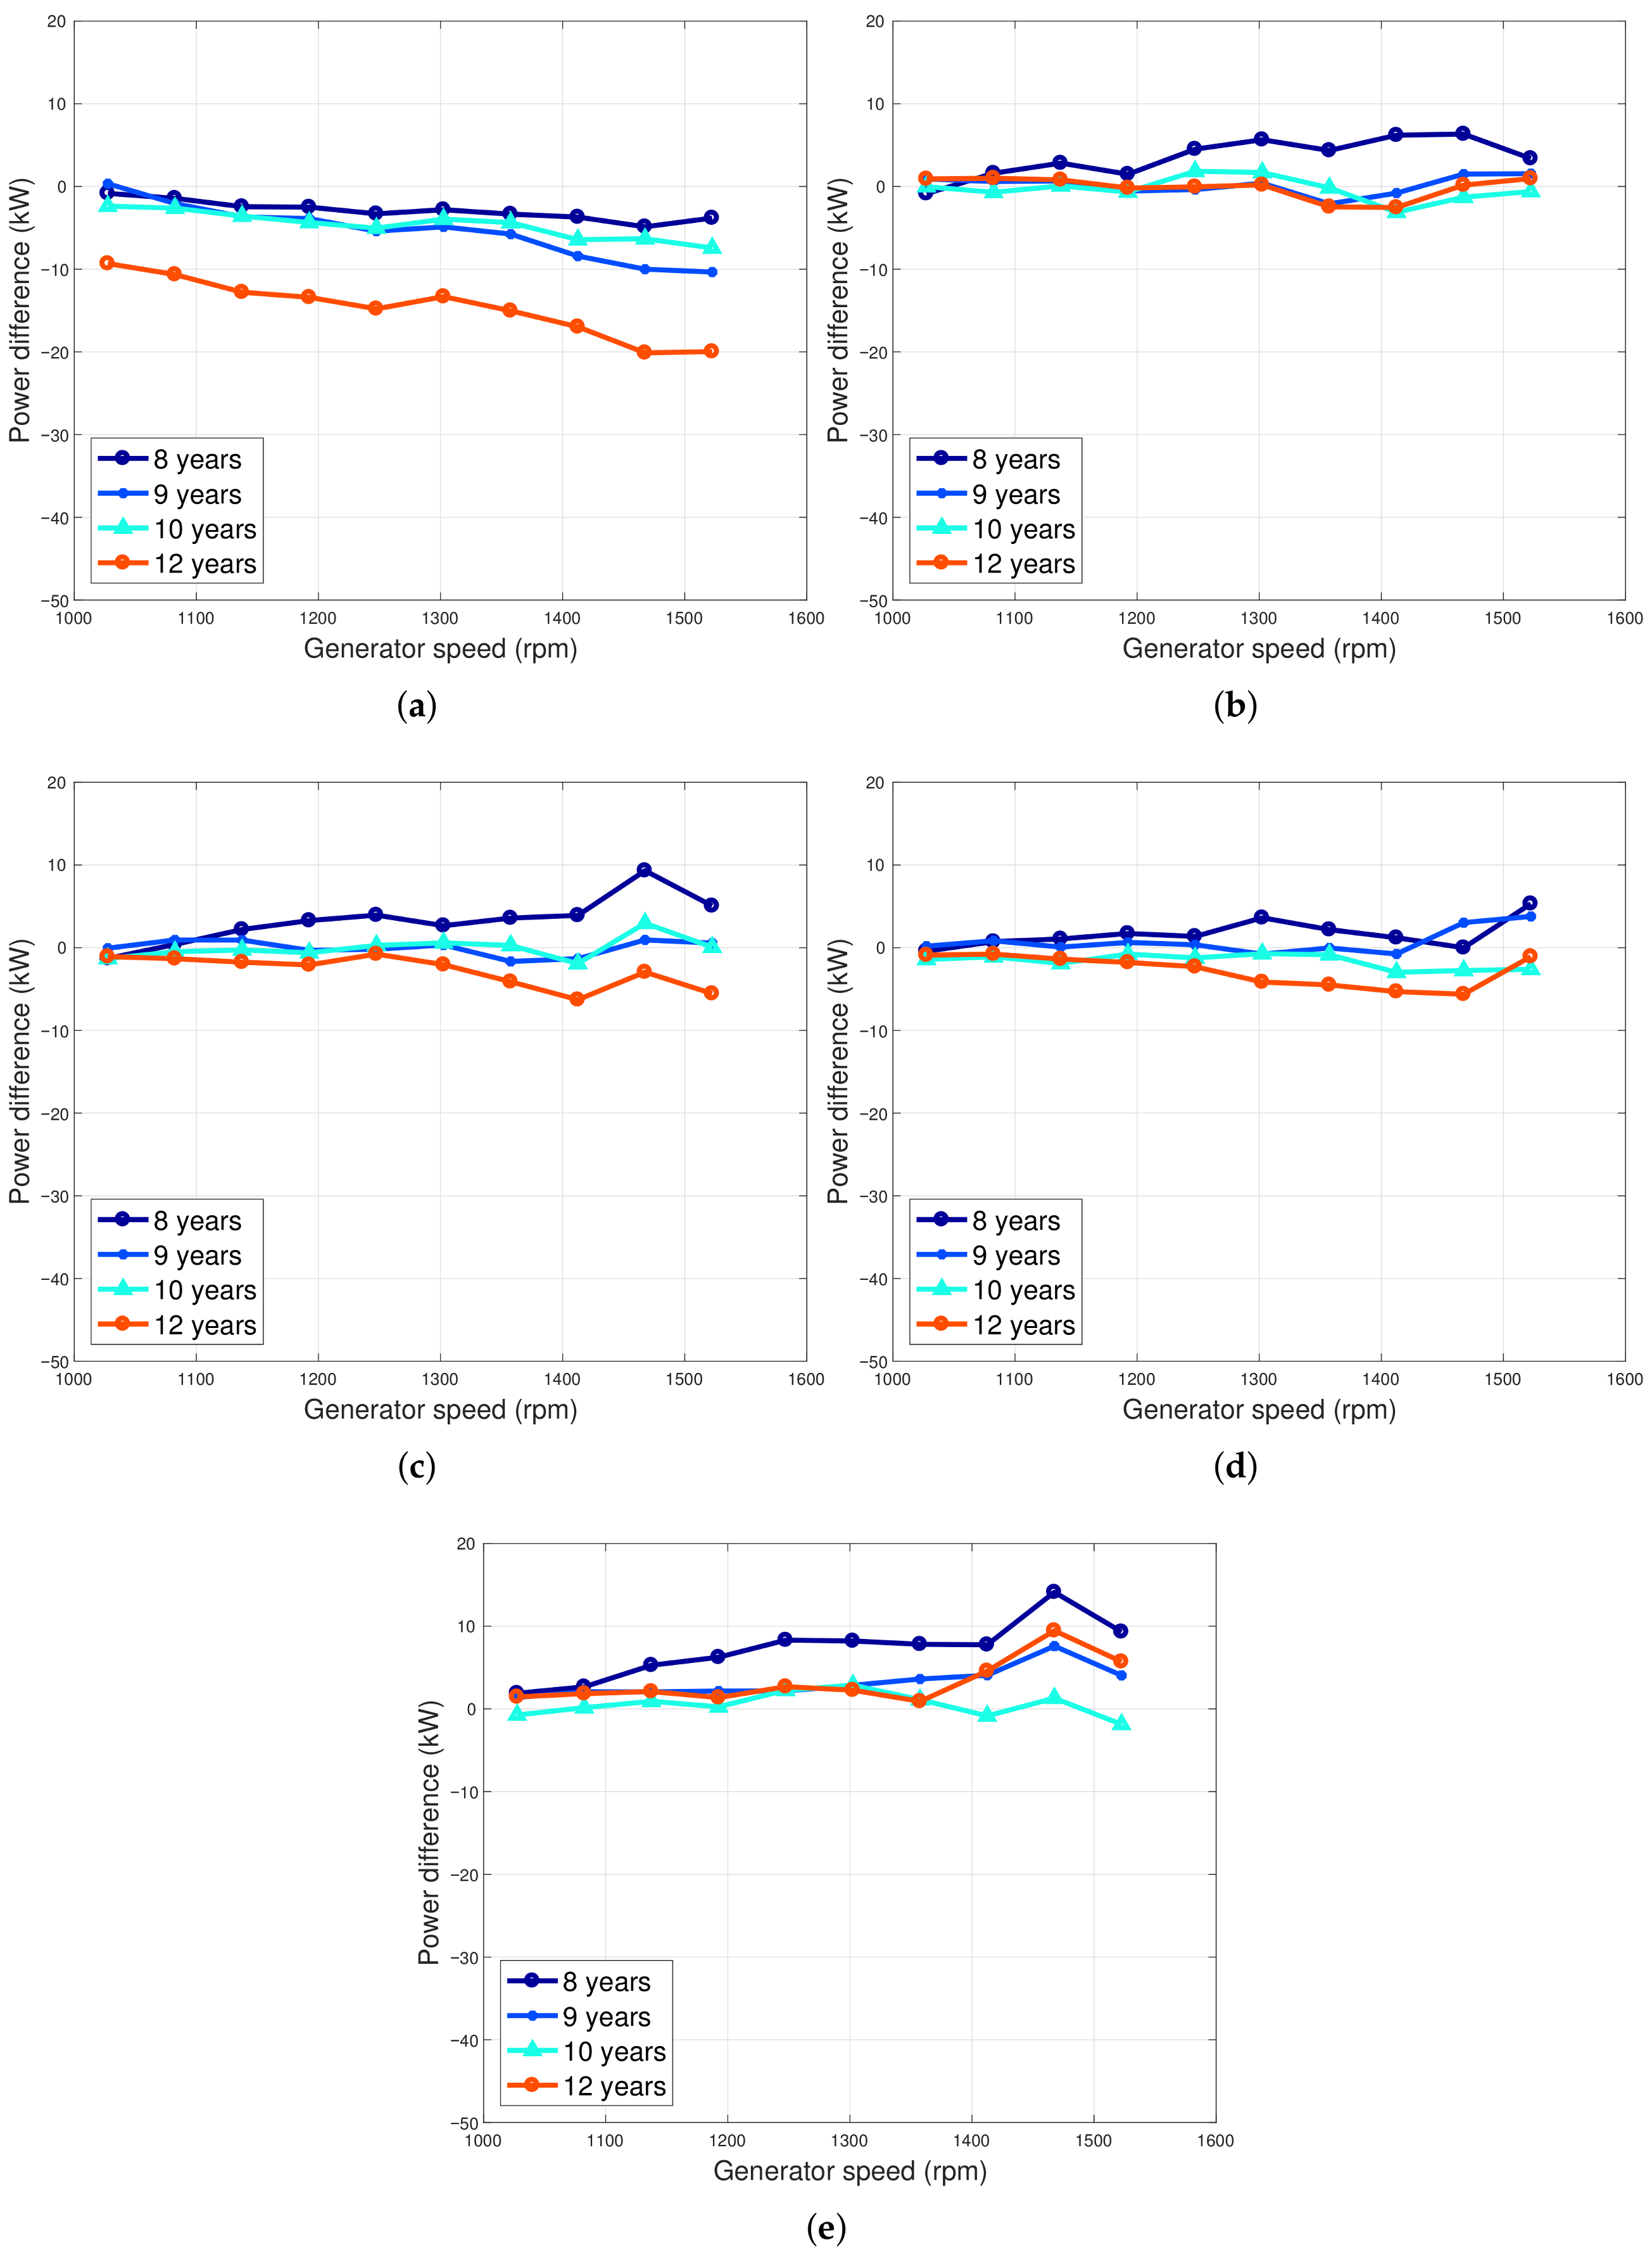
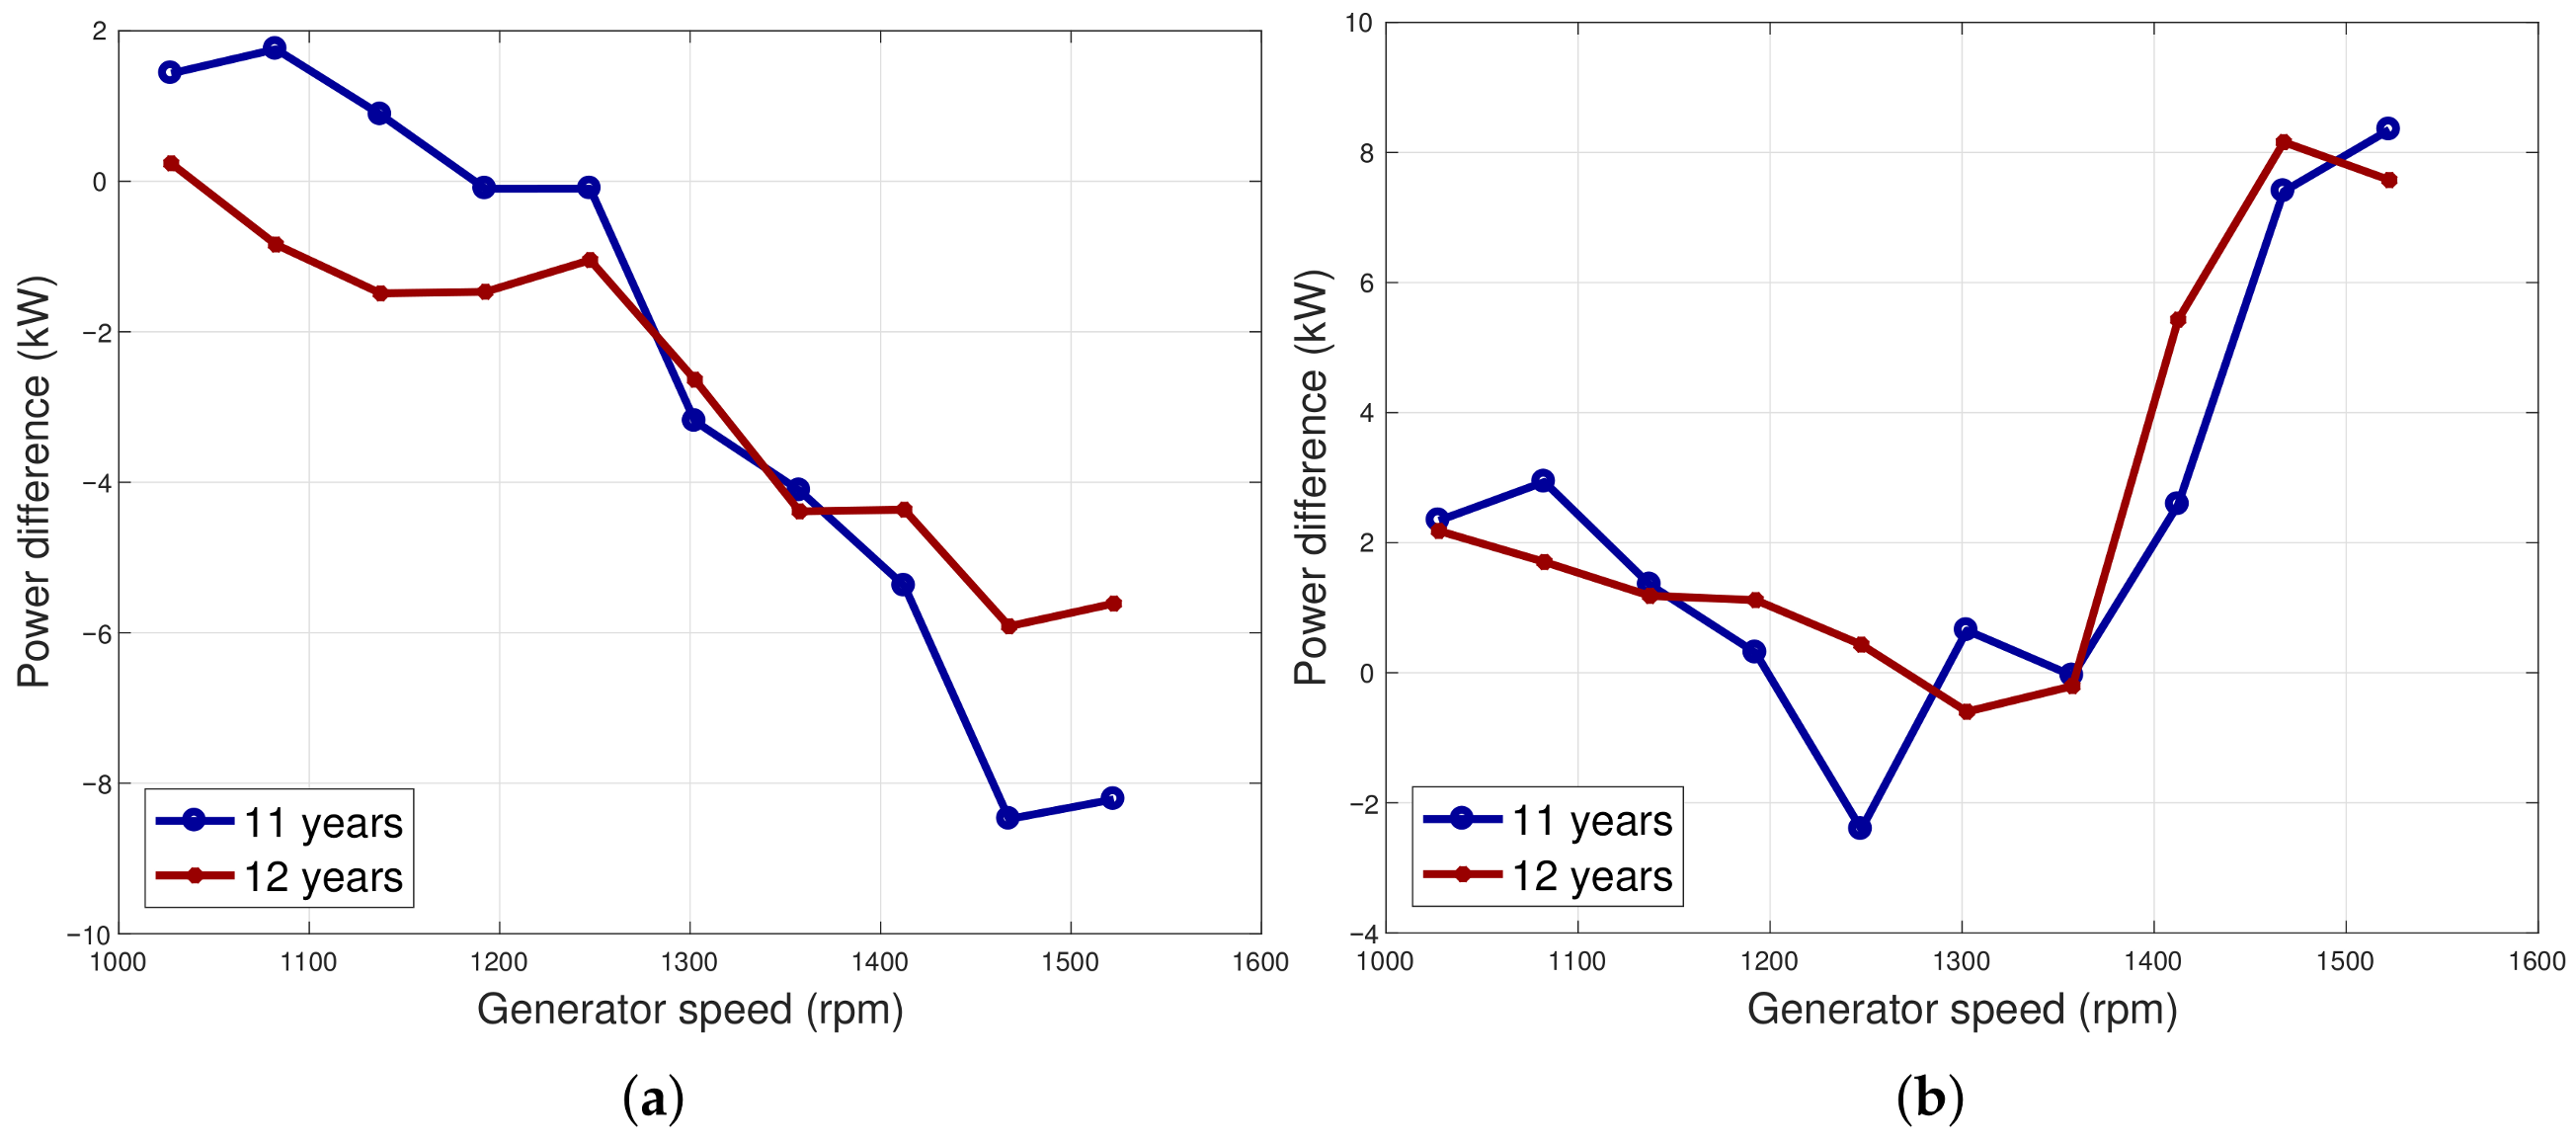
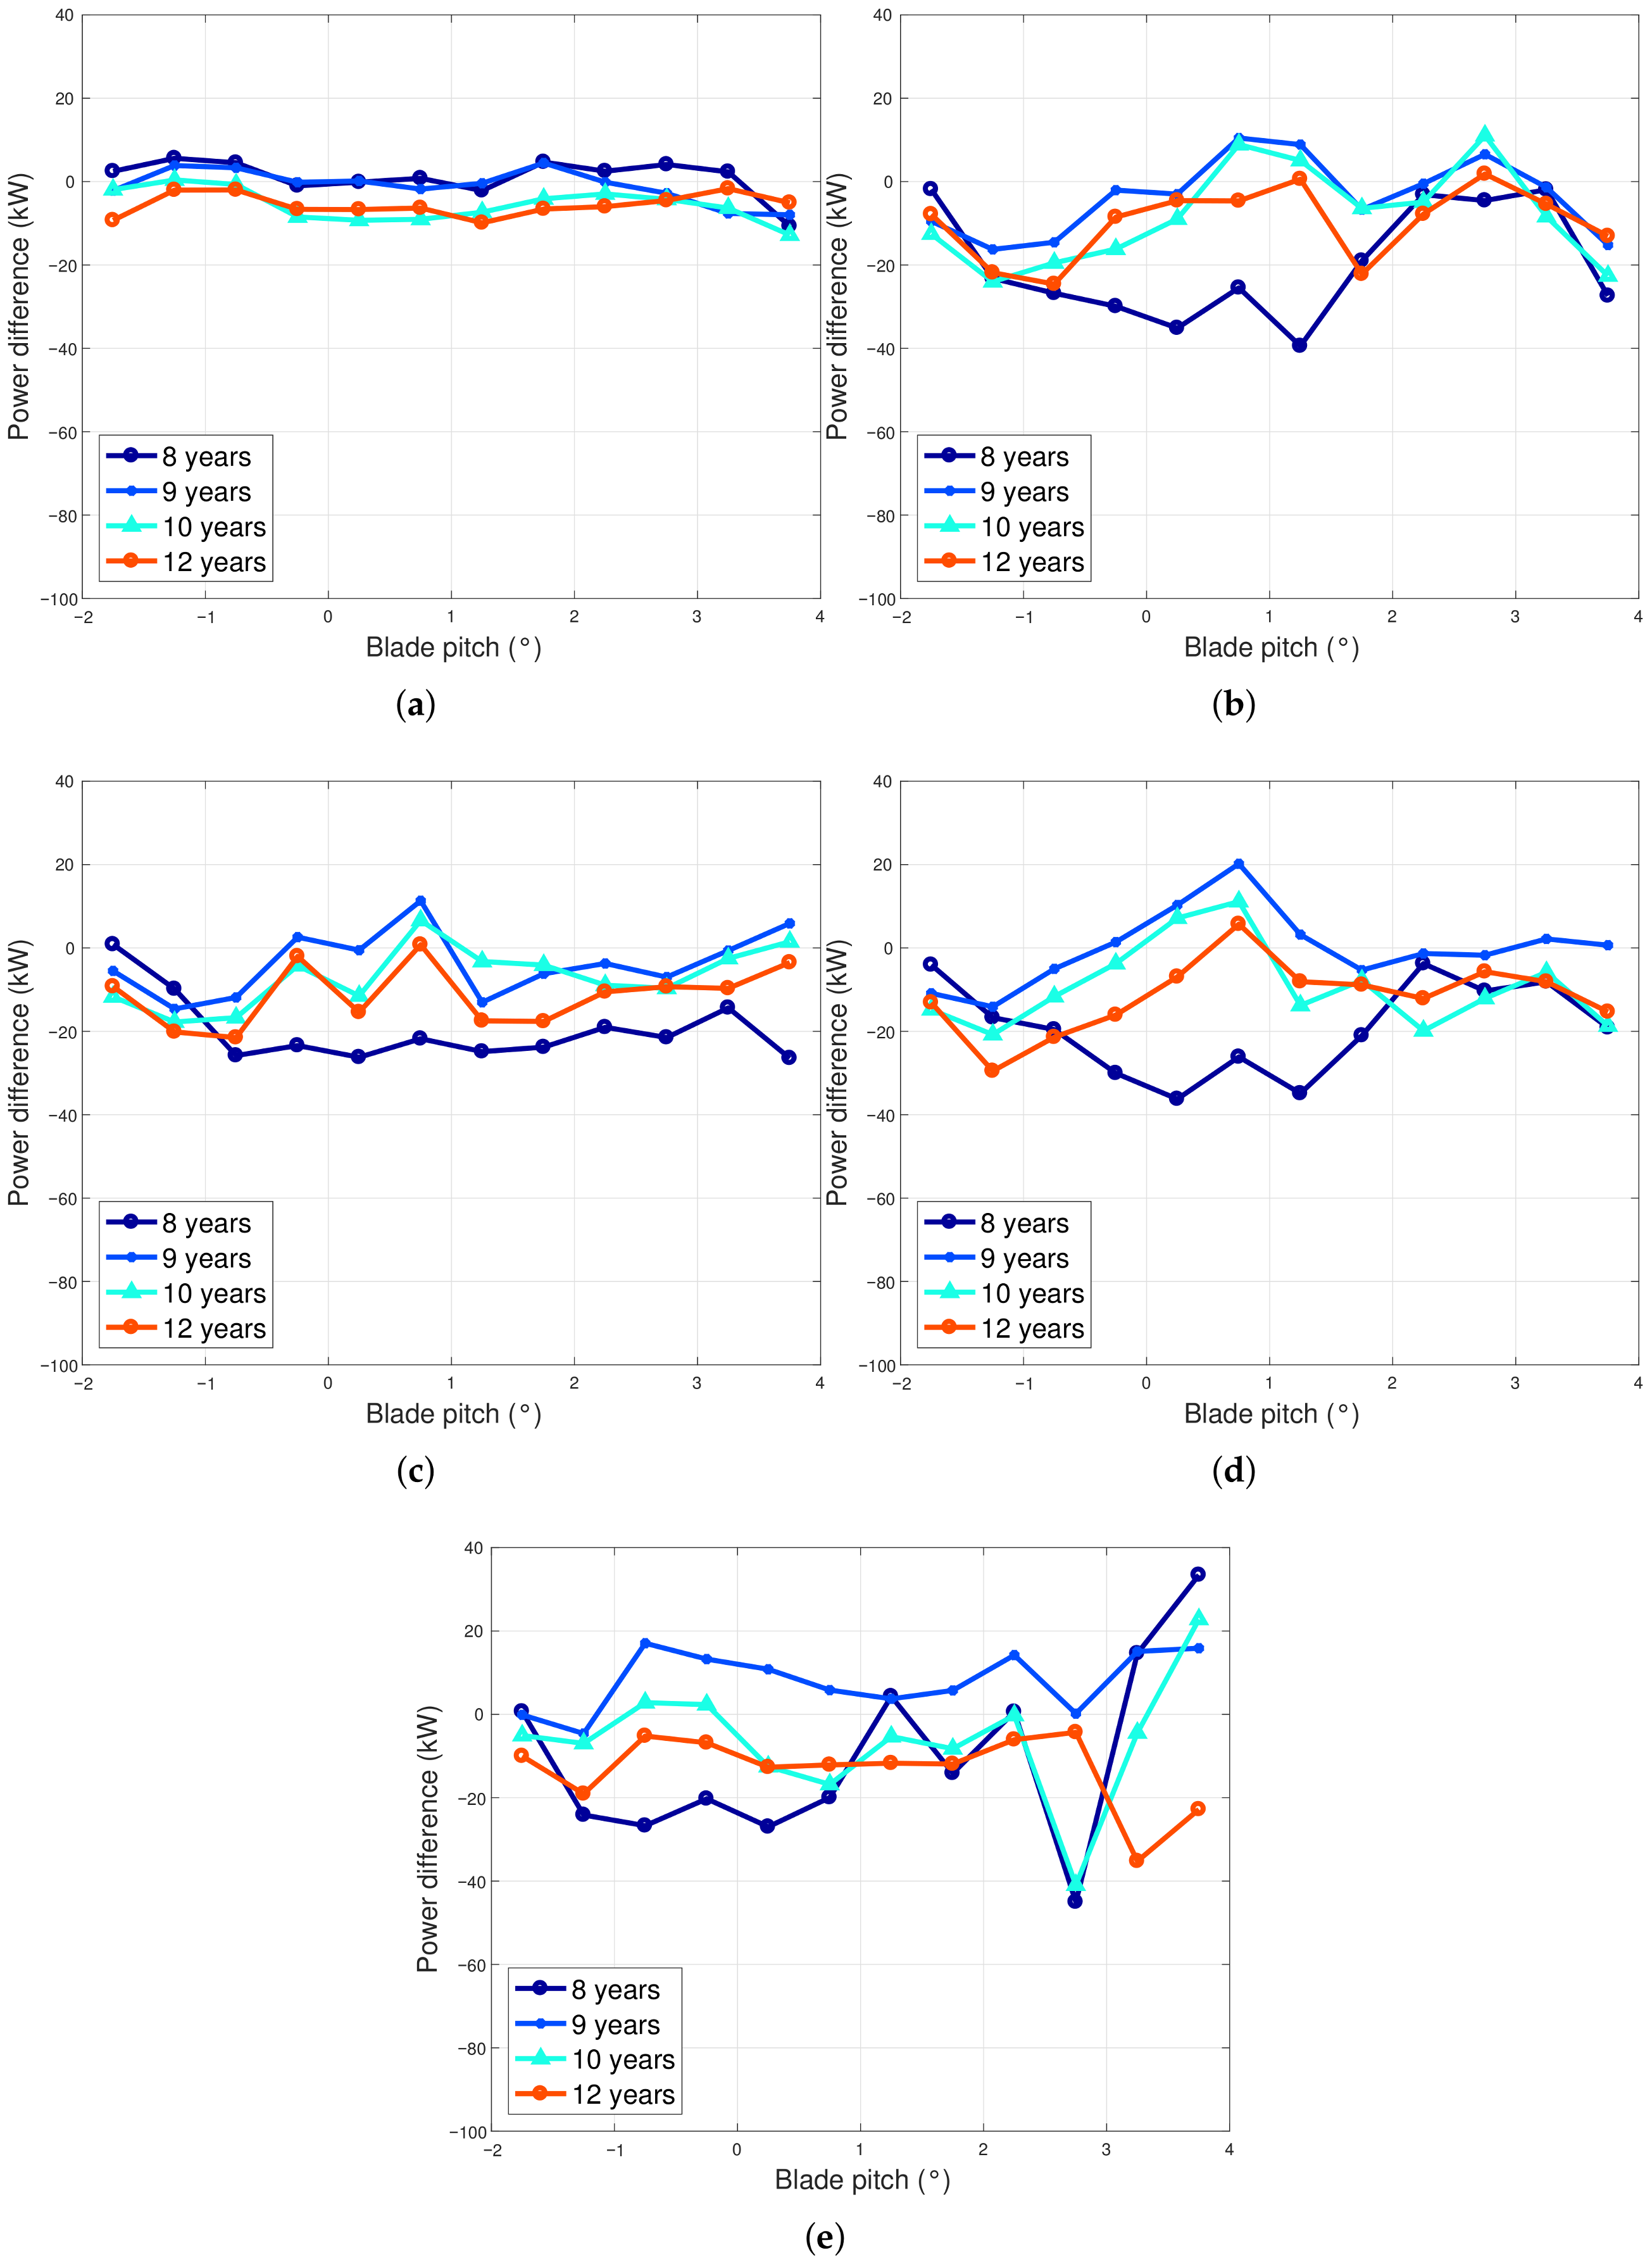
It results that the aging of the generator affects non-negligibly the performance of the wind turbines, and this is highlighted as diminished power extraction for a given generator speed; however, this happens to different extents in the test case wind turbines: from seven to 12 years of age, in Region 2, two wind turbines sited in Italy underwent a performance worsening of the order of 1–2%, while the average performance decrease was −8.8% in the same period for the wind turbine in Ireland. An interesting test case is given by the fact that the generator of one wind turbine sited in Italy reached its end of life in 2018 and was substituted: by comparing the data sets immediately before the ones immediately after the replacement, it can be estimated that the replacement provided a performance improvement of the order of 2%. This provides a consistency check of the proposed methodologies and indicates an estimate of the profitability of substituting aged wind turbine components. In Region 2 1 2 , the behavior of all the test case wind turbines was similar, and a performance decline of the order of 2% was observed. Overall, it can be summarized that after five years of operation (which is the span of the data sets at out disposal for this study), the performance of the IRE wind turbine declined below the rated power of the order of 7.7%, while three ITA wind turbines had slightly worsened performance (from 0.2% to 1.4%) and one (ITA4) improved. Another important aspect is given by the fact that the performance worsening with age seems not to be linear in time: the selected data sets go from seven to twelve years of age of the wind turbines, and in particular for the IRE test case, an evident decline occurs at twelve years of age. Referring to the results in [25] for the IRE wind turbine, if one considers a span of ten years (two years of age against twelve), the estimated worsening is in the order of 8.8%: by comparison, it can be argued that the aging from two to seven years of age is quite low. This ex post supports the rationale of the horizontal and vertical analysis, which were combined in this work: by comparing several test cases, it is possible to analyze the level of performance at a certain age of the wind turbines.
Therefore, on the grounds of what is observed for the four wind turbines in Italy in comparison with the test case in Ireland, it is concluded that it is likely that the effect of aging for the Vestas V52 wind turbines can be in general lower with respect to the estimates provided in [24,25], but it cannot be excluded that a similar decline in the generator efficiency would occur as well for the other test case wind turbines in the future. This motivates that an interesting further direction of this work is the analysis of the electrical parameters of wind turbine generators in order to formulate prognostic models. In addition, the operating condition and response of the hydraulic station that controls the blade pitching system deserves further examination, e.g., if oil pressures in the hydraulic station are not well maintained, the blade pitch response may deviate from the optimum and affect the power performance.
Furthermore, the case of the ITA4 wind turbine, which has undergone a replacement of the generator, inspires further developments as regards a detailed analysis of the economic balance: this could give meaningful indications in general as regards the management of wind turbines.
Another interesting further line of research regards the interpretation of the aging performance in terms of the overall maintenance level of the wind turbines: from this point of view, we expect that a large number of test cases should be analyzed, in order to possibly highlight the dependence on this factor, which can be expected to be relevant, but can not be expected to be the only or the main determinant.
A valuable further development of the present work is investigating in more detail the hypothesis formulated in [22] about the fact that the evolution of wind turbine technology should mitigate the impact of aging: the results reported in [24,25] and in the present work indicate that the hypothesis should be confirmed because the observed decline rate is lower with respect to the estimates reported in [22] for wind turbines installed in the 1990s. At present, further studies are being conducted by the authors on wind turbines of higher size (the order of a 100 m rotor diameter), which were installed in the late 2000s, and the preliminary results indicate that the aging decline is lower with respect to the results of this study.

Author Contributions

Conceptualization, D.A., R.B., and F.C.; data curation, D.A., R.B., and F.C.; formal analysis, D.A., R.B., and F.C.; investigation, D.A.; methodology, D.A.; project administration, R.B. and F.C.; software, D.A.; supervision, R.B. and F.C., validation, D.A., R.B., and F.C.; writing—original draft, D.A.; writing—review and editing, D.A., R.B., and F.C. All authors read and agreed to the published version of the manuscript.

Funding

This research received no external funding.

Acknowledgments

The authors acknowledge Fondazione “Cassa di Risparmio di Perugia” for the funded research project WIND4EV (WIND turbine technology EVolution FOR lifecycle optimization). The authors also wish to acknowledge the support of the INTERREG VA SPIRE2 project. This research was supported by the European Union’s INTERREG VA Programme (Grant No. INT-VA/049), managed by the Special EU Programmes Body (SEUPB). The views and opinions expressed in this document do not necessarily reflect those of the European Commission or the Special EU Programmes Body (SEUPB). The authors acknowledge the IEA-Wind-Task 41-“Enabling Wind to Contribute to a Distributed Energy Future”. The authors thank the company Lucky Wind for the technical support and for providing the data sets employed for the study.

Conflicts of Interest

The authors declare no conflict of interest.

References

  1. Kurz, R.; Brun, K. Degradation of gas turbine performance in natural gas service. J. Nat. Gas Sci. Eng. 2009, 1, 95–102. [Google Scholar] [CrossRef]
  2. Penrose, H.W.; Frost, N. Aging electric machines. In Proceedings of the 2015 IEEE Electrical Insulation Conference (EIC), Seattle, WA, USA, 7–10 June 2015; pp. 292–296. [Google Scholar]
  3. Giangrande, P.; Madonna, V.; Nuzzo, S.; Galea, M. Moving Toward a Reliability-Oriented Design Approach of Low-Voltage Electrical Machines by Including Insulation Thermal Aging Considerations. IEEE Trans. Transp. Electrif. 2020, 6, 16–27. [Google Scholar] [CrossRef]
  4. Blokus, A.; Kołowrocki, K. Reliability and maintenance strategy for systems with aging-dependent components. Qual. Reliab. Eng. Int. 2019, 35, 2709–2731. [Google Scholar] [CrossRef]
  5. Scharfenberg, G.; Elis, L.; Hofmann, G. New Design Methodology–Using VHDL-AMS Models to Consider Aging Effects in Automotive Mechatronic Circuits for Safety Relevant Functions. In Proceedings of the 2019 International Conference on Applied Electronics (AE), Pilsen, Czech Republic, 10–11 September 2019; pp. 1–5. [Google Scholar]
  6. Saltas, E.; Bouilly, J.; Geivanidis, S.; Samaras, Z.; Mohammadi, A.; Iida, Y. Investigation of the effects of biodiesel aging on the degradation of common rail fuel injection systems. Fuel 2017, 200, 357–370. [Google Scholar] [CrossRef]
  7. Kim, D.Y.; Kim, Y.H.; Kim, B.S. Changes in wind turbine power characteristics and annual energy production due to atmospheric stability, turbulence intensity, and wind shear. Energy 2021, 214, 119051. [Google Scholar] [CrossRef]
  8. Bahamonde, M.I.; Litrán, S.P. Study of the energy production of a wind turbine in the open sea considering the continuous variations of the atmospheric stability and the sea surface roughness. Renew. Energy 2019, 135, 163–175. [Google Scholar] [CrossRef]
  9. Wen, B.; Wei, S.; Wei, K.; Yang, W.; Peng, Z.; Chu, F. Power fluctuation and power loss of wind turbines due to wind shear and tower shadow. Front. Mech. Eng. 2017, 12, 321–332. [Google Scholar] [CrossRef] [Green Version]
  10. Barthelmie, R.J.; Shepherd, T.J.; Aird, J.A.; Pryor, S.C. Power and wind shear implications of large wind turbine scenarios in the US Central Plains. Energies 2020, 13, 4269. [Google Scholar] [CrossRef]
  11. Zhang, Y.; Chen, B.; Pan, G.; Zhao, Y. A novel hybrid model based on VMD-WT and PCA-BP-RBF neural network for short-term wind speed forecasting. Energy Convers. Manag. 2019, 195, 180–197. [Google Scholar] [CrossRef]
  12. Zhang, Y.; Wang, P.; Ni, T.; Cheng, P.; Lei, S. Wind power prediction based on LS-SVM model with error correction. Adv. Electr. Comput. Eng. 2017, 17, 3–8. [Google Scholar] [CrossRef]
  13. Castellani, F.; Garinei, A.; Terzi, L.; Astolfi, D.; Gaudiosi, M. Improving windfarm operation practice through numerical modelling and supervisory control and data acquisition data analysis. IET Renew. Power Gener. 2014, 8, 367–379. [Google Scholar] [CrossRef]
  14. Astolfi, D. Wind Turbine Operation Curves Modelling Techniques. Electronics 2021, 10, 269. [Google Scholar] [CrossRef]
  15. Barthelmie, R.J.; Jensen, L. Evaluation of wind farm efficiency and wind turbine wakes at the Nysted offshore wind farm. Wind Energy 2010, 13, 573–586. [Google Scholar] [CrossRef]
  16. Astolfi, D.; Castellani, F.; Terzi, L. Mathematical methods for SCADA data mining of onshore wind farms: Performance evaluation and wake analysis. Wind Eng. 2016, 40, 69–85. [Google Scholar] [CrossRef] [Green Version]
  17. Fernandes, C.M.; Blazquez, L.; Sanesteban, J.; Martins, R.C.; Seabra, J.H. Energy efficiency tests in a full scale wind turbine gearbox. Tribol. Int. 2016, 101, 375–382. [Google Scholar] [CrossRef]
  18. Sequeira, C.; Pacheco, A.; Galego, P.; Gorbeña, E. Analysis of the efficiency of wind turbine gearboxes using the temperature variable. Renew. Energy 2019, 135, 465–472. [Google Scholar] [CrossRef]
  19. Mishnaevsky, L., Jr.; Thomsen, K. Costs of repair of wind turbine blades: Influence of technology aspects. Wind Energy 2020, 23, 2247–2255. [Google Scholar] [CrossRef]
  20. Carroll, J.; McDonald, A.; McMillan, D. Failure rate, repair time and unscheduled O&M cost analysis of offshore wind turbines. Wind Energy 2016, 19, 1107–1119. [Google Scholar]
  21. Astolfi, D.; Castellani, F.; Terzi, L. Wind Turbine Power Curve Upgrades. Energies 2018, 11, 1300. [Google Scholar] [CrossRef] [Green Version]
  22. Staffell, I.; Green, R. How does wind farm performance decline with age? Renew. Energy 2014, 66, 775–786. [Google Scholar] [CrossRef] [Green Version]
  23. Olauson, J.; Edström, P.; Rydén, J. Wind turbine performance decline in Sweden. Wind Energy 2017, 20, 2049–2053. [Google Scholar] [CrossRef]
  24. Byrne, R.; Astolfi, D.; Castellani, F.; Hewitt, N.J. A Study of Wind Turbine Performance Decline with Age through Operation Data Analysis. Energies 2020, 13, 2086. [Google Scholar] [CrossRef] [Green Version]
  25. Astolfi, D.; Byrne, R.; Castellani, F. Analysis of Wind Turbine Aging through Operation Curves. Energies 2020, 13, 5623. [Google Scholar] [CrossRef]
  26. Dai, J.; Yang, W.; Cao, J.; Liu, D.; Long, X. Ageing assessment of a wind turbine over time by interpreting wind farm SCADA data. Renew. Energy 2018, 116, 199–208. [Google Scholar] [CrossRef] [Green Version]
  27. International Electrotechnical Commission. Wind Energy Generation Systems—Part 12-1: Power Performance Measurements of Electricity Producing Wind Turbines; Technical Report, IEC 61400-12-1: 2017; IEC: Geneva, Switzerland, 2007. [Google Scholar]
  28. St Martin, C.M.; Lundquist, J.K.; Clifton, A.; Poulos, G.S.; Schreck, S.J. Atmospheric turbulence affects wind turbine nacelle transfer functions. Wind Energy Sci. 2017, 2, 295. [Google Scholar] [CrossRef] [Green Version]
  29. Wagner, R.; Antoniou, I.; Pedersen, S.M.; Courtney, M.S.; Jørgensen, H.E. The influence of the wind speed profile on wind turbine performance measurements. Wind Energy Int. J. Prog. Appl. Wind. Power Convers. Technol. 2009, 12, 348–362. [Google Scholar] [CrossRef]
  30. Bulaevskaya, V.; Wharton, S.; Clifton, A.; Qualley, G.; Miller, W. Wind power curve modeling in complex terrain using statistical models. J. Renew. Sustain. Energy 2015, 7, 013103. [Google Scholar] [CrossRef]
  31. St Martin, C.M.; Lundquist, J.K.; Clifton, A.; Poulos, G.S.; Schreck, S.J. Wind turbine power production and annual energy production depend on atmospheric stability and turbulence. Wind Energy Sci. (Online) 2016, 1, 221–236. [Google Scholar] [CrossRef] [Green Version]
  32. Antoniou, I.; Pedersen, S.M.; Enevoldsen, P.B. Wind shear and uncertainties in power curve measurement and wind resources. Wind Eng. 2009, 33, 449–468. [Google Scholar] [CrossRef]
  33. Lange, J.; Mann, J.; Berg, J.; Parvu, D.; Kilpatrick, R.; Costache, A.; Chowdhury, J.; Siddiqui, K.; Hangan, H. For wind turbines in complex terrain, the devil is in the detail. Environ. Res. Lett. 2017, 12, 094020. [Google Scholar] [CrossRef]
  34. Pandit, R.K.; Infield, D. Comparative analysis of binning and Gaussian Process based blade pitch angle curve of a wind turbine for the purpose of condition monitoring. J. Phys. Conf. Ser. 2018, 1102, 012037. [Google Scholar] [CrossRef]
  35. Pandit, R.; Infield, D. Gaussian process operational curves for wind turbine condition monitoring. Energies 2018, 11, 1631. [Google Scholar] [CrossRef] [Green Version]
  36. Pandit, R.K.; Infield, D. Comparative assessments of binned and support vector regression-based blade pitch curve of a wind turbine for the purpose of condition monitoring. Int. J. Energy Environ. Eng. 2019, 10, 181–188. [Google Scholar] [CrossRef] [Green Version]
  37. Pandit, R.K.; Infield, D.; Kolios, A. Gaussian process power curve models incorporating wind turbine operational variables. Energy Rep. 2020, 6, 1658–1669. [Google Scholar] [CrossRef]
  38. Astolfi, D.; Castellani, F.; Natili, F. Wind Turbine Multivariate Power Modeling Techniques for Control and Monitoring Purposes. J. Dyn. Syst. Meas. Control 2021, 143, 034501. [Google Scholar] [CrossRef]
  39. Astolfi, D.; Castellani, F.; Fravolini, M.L.; Cascianelli, S.; Terzi, L. Precision computation of wind turbine power upgrades: An aerodynamic and control optimization test case. J. Energy Resour. Technol. 2019, 141, 051205. [Google Scholar] [CrossRef]
  40. Vapnik, V. The Nature of Statistical Learning Theory; Springer Science & Business Media: Berlin/Heidelberg, Germany, 2013. [Google Scholar]
  41. Lee, G.; Ding, Y.; Xie, L.; Genton, M.G. A kernel plus method for quantifying wind turbine performance upgrades. Wind Energy 2015, 18, 1207–1219. [Google Scholar] [CrossRef]
Figure 1. Vestas V52 wind turbine at Dundalk Institute of Technology [24].
Energies 14 00915 g001
Figure 2. Average yearly turbulence intensity per wind intensity interval at the IREand ITAsites.
Energies 14 00915 g002
Figure 3. Weier DVSGF 400/4L SP 850 kW generator.
Energies 14 00915 g003
Figure 4. Metso PLH-400V52 gearbox [24].
Energies 14 00915 g004
Figure 5. A sample power curve (IRE wind turbine) with the operation regions (2 and 1 2 ) indicated.
Energies 14 00915 g005
Figure 6. An example of the binned power curve for the IRE and ITA1 wind turbines having the same age (7 years).
Energies 14 00915 g006
Figure 7. The standard deviation of the IEC-based power curve of Figure 6, for the IRE and ITA1 wind turbines having the same age (7 years).
Energies 14 00915 g007
Figure 8. An example of the binned generator speed-power curve for the IRE and ITA1 wind turbines having the same age (7 years): Region 2.
Energies 14 00915 g008
Figure 9. An example of binned blade pitch-power curve for the IRE and ITA1 wind turbines having the same age (7 years): Region 2 1 2 .
Energies 14 00915 g009
Figure 10. Block diagram for the structure of the methods.
Energies 14 00915 g010
Figure 11. Block diagram of the horizontal and vertical analysis based on the support vector regression.
Energies 14 00915 g011
Figure 12. Generator speed–power curve: horizontal analysis, consisting of the comparison between the two test cases. For each data set, the difference between the IRE curve and the ITA wind turbines’ curve is represented. (a) Seven years, (b) 8 years, (c) 9 years, (d) 10 years, and (e) 12 years.
Energies 14 00915 g012
Figure 13. Generator speed–power curve: vertical analysis, consisting of the comparison of each wind turbine against itself in the earliest data set at our disposal (seven years). The difference with respect to the reference curve for each wind turbine is reported. (a) IRE, (b) ITA1, (c) ITA2, (d) ITA3, and (e) ITA4.
Energies 14 00915 g013
Figure 14. Analysis of generator substitution at the ITA4 wind turbine: the generator speed–power curve is reported, in the form of the difference between the data sets D 2018 2 and D 2019 2 (after the generator replacement at ITA4) and the reference D 2017 2 data set (before generator replacement at ITA4). Results are reported for ITA4 and for a sample wind turbine ITA2. (a) ITA2 and (b) ITA4.
Energies 14 00915 g014
Figure 15. Blade pitch–power curve: horizontal analysis, consisting of the comparison between the two test cases. For each data set, the difference between the IRE curve and the ITA wind turbines curve is represented. (a) Seven years, (b) 8 years, (c) 9 years, (d) 10 years, and (e) 12 years.
Energies 14 00915 g015
Figure 16. Blade pitch–power curve: vertical analysis, consisting of the comparison of each wind turbine against itself in the earliest data set at our disposal (seven years age). The difference with respect to the reference curve for each wind turbine is reported. (a) IRE, (b) ITA1, (c) ITA2, (d) ITA3, and (e) ITA4.
Energies 14 00915 g016
Table 1. Generator principal specifications.
SpecificationData
ModelDVSGF 400/4L SP
Rated power850 kW
Rated stator voltage690 V
Rated stator frequency50 Hz
No. of poles4
Weight3755 kg
Moment of inertia35.7 kg m 2
Table 2. Gearbox principal specifications [24].
SpecificationData
ModelPLH-400V52
Rated lower935 kW
Rated RPM (low speed shaft)26 min 1
Gearing ratio61.799
Weight5400 kg
Table 3. Organization of the data sets.
Test Case 1Test Case 2Age (Years)
D 2012 1 D 2014 2 7
D 2013 1 D 2015 2 8
D 2014 1 D 2016 2 9
D 2015 1 D 2017 2 10
D 2017 1 D 2019 2 12
Table 4. SCADA parameters analyzed.
ParameterUnitsSymbol
Wind speed(m/s)v
Wind speed standard deviation(m/s) σ v
Wind direction(deg) θ
Ambient temperature( C) T e x t
Rotor speed(rpm) ω
Blade pitch angle(deg) β
Generator speed(rpm) Ω
Power(kW)P
Gear oil temperature( C) T o i l
Table 5. Operation regions for the test case wind turbine.
RegionCondition
2 5 v 9
2 1 2 9 < v 13
Table 6. Analyzed operation curves and working range of the variables.
RegionCurve ( G 1 , G 2 ) G 1 Range G 1 Bin
2Generator speed-power curve ( Ω , P ) [1050, 1550] rpm50 rpm
2 1 2 Blade pitch angle-power curve ( β , P ) [ 2 , 4 ] 0 . 5
Table 7. Use of the data sets for vertical and horizontal analysis.
AnalysisD0–D1D2
VerticalAge 7 years ( D 2012 1 IRE– D 2014 2 ITA)Subsequent ages for each WT
HorizontalIRE data set (from D 2012 1 , age 7 years)ITA at same age (from D 2014 2 , age 7 years)
Table 8. Structure of the SVR regressions for each operation region.
RegionInputOutput
2Generator speed Ω Power P
2 1 2 Blade pitch angle β Power P
Table 9. Vertical analysis: estimates of Δ (%) with respect to the baseline data set (7 years age for each wind turbine).
AgeIREITA1ITA2ITA3ITA4
8 years−1.6+2.0+2.11.33.9
9 years−3.00.00.40.61.6
10 years−2.5−0.30.3−0.70.1
12 years−8.80.0−1.3−1.21.6
Table 10. Horizontal analysis: estimates of Δ (%) with respect to the corresponding IRE baseline data set for each wind turbine age.
AgeITA1ITA2ITA3ITA4
7 years−1.5−2.8−1.2−3.0
8 years2.90.22.11.2
9 years2.40.02.80.2
10 years1.6−0.61.2−1.7
12 years7.83.86.55.6
Table 11. Vertical analysis for the generator replacement case study: estimates of Δ (%) with respect to the baseline data set (10 years age for each wind turbine).
AgeITA2ITA4
11 years−0.42.2
12 years−0.82.4
Table 12. Vertical analysis: estimates of Δ (%) with respect to the baseline data set (7 years age for each wind turbine).
AgeIREITA1ITA2ITA3ITA4
8 years−0.3−1.1−0.8−0.9+0.2
9 years0.0−1.4−1.0−0.9+0.2
10 years−0.9−1.4−1.0−0.9+0.2
12 years−2.0−1.2−1.6−2.1−0.4
Table 13. Horizontal analysis: estimates of Δ (%) with respect to the corresponding IRE baseline data set for each wind turbine age.
AgeITA1ITA2ITA3ITA4
7 years1.21.10.8−0.8
8 years−2.3−1.0−1.6−3.4
9 years0.00.30.80.2
10 years0.00.50.6−0.4
12 years0.00.2−0.2−1.4
Table 14. Vertical analysis: estimates of Δ (%) with respect to the baseline data set (7 years age for each wind turbine): Region 2 and Region 2 1 2 are considered together.
AgeIREITA1ITA2ITA3ITA4
8 years−1.31.21.30.73.1
9 years−2.3−0.30.00.21.2
10 years−2.2−0.50.0−0.80.1
12 years−7.4−0.2−1.4−1.41.2
Publisher’s Note: MDPI stays neutral with regard to jurisdictional claims in published maps and institutional affiliations.

