1. Introduction
In recent years, the fossil energy crisis has gradually attracted the attention of various countries, and the development momentum of new energy has been risen rapidly [
1,
2]. As an important part of the new energy industry, photovoltaic power generation has greatly increased its installed capacity in recent years, occupying a large share of the power system [
3,
4]. At the same time, photovoltaic power generation has the characteristics of randomness, volatility and intermittent. For power systems, when large-scale photovoltaic power generation systems are integrated into the main grid, they will have a great impact on the economic operation and stability of the grid, thus increasing the difficulty of power system dispatch [
5,
6]. On the other hand, as a solution to maximize the profit of all participants [
7], virtual power plant (VPP) is the use of advanced communications and computing technology of whole organic regulation multi-type controlled source unit loads and stores, such as to reduce the effect of the randomness and volatility in the distributed generation operation of the main network, make it an active part in power demand side management [
8]. It excavates and utilizes the flexible adjustment ability of all kinds of distributed resources, which can reduce the energy cost of users and greatly promote the consumption of new energy. At present, the virtual power plant technology at home and abroad is mainly applied to the control and scheduling problem of multiple energy complementary systems [
9]. In terms of traditional energy output, it can change the system output in time with the change of scheduling strategy [
10]. In terms of new energy, due to the intermittent and random nature of wind and light energy, the output of the system cannot timely and effectively follow the change of scheduling strategy [
11], which lays hidden risks for large-scale system scheduling. In order to solve this problem, photovoltaic power prediction arises at the historic moment. Combined with the above, it can be seen that accurate photovoltaic power prediction plays an important role in the overall regulation of virtual power plant [
12]. Therefore, the prediction of photovoltaic power is of great significance for large-scale photovoltaic grid-connected power generation, improving the safety and stability of power system operation, and ensuring the safe dispatch of power grids.
The forecasting of photovoltaic power is not an easy task because PV power is affected by many factors, including irradiance, temperature, etc [
13]. Under such circumstances, at present, the PV power forecasting is mainly divided into two categories according to the different prediction results: certain point/ deterministic prediction [
14] and uncertainty interval prediction [
15]. In recent years, many authors have focused on the research of deterministic prediction, and the method of artificial intelligence is used widely. The method digs out the relationship between the input variables implicit in the historical output data of photovoltaic power plants and the predicted results by machine learning, to realize the prediction of photovoltaic power. Common artificial intelligence algorithms mainly include BP neural network, support vector machine, regression tree algorithm, and so on [
16]. Compared with the deterministic point prediction, there are fewer scholars studying the uncertainty interval prediction. Considering that photovoltaic power generation is greatly affected by meteorological factors when the meteorological conditions within the forecast period fluctuate greatly, the photovoltaic output curve will no longer be smooth, and there will be a large peak-valley difference, with the accuracy of the deterministic prediction results greatly reduced [
5]. For this reason, interval forecasts can make up for the lack of deterministic forecasts and have more comprehensive information. This not only allows decision-makers to understand the possible output of the prediction point, but also helps decision-makers understand the future change trend of the output of the prediction point, thereby greatly improving the prediction accuracy, and promoting grid planning, risk analysis, and reliability evaluation [
6]. Therefore, interval prediction is an advantageous tool with which to improve the accuracy of photovoltaic power prediction.
In the field of deterministic prediction, Reference [
17] divides weather conditions into ideal weather and non-ideal weather types. For ideal weather, a long-short-term memory neural network (LSTM) prediction method is used; for non-ideal weather, time-series correlation and characteristics of non-ideal weather types are considered in LSTM to generate the final point prediction value. In reference to the limitations and incompleteness of photovoltaic historical output data and meteorological data, Reference [
18] proposed a day-ahead prediction method similar to cloud space fusion based on this, so as to complete point prediction. Additionally, Reference [
19] established an independent day-ahead PV power prediction model based on a long-short-term recurrent neural network (LSTM-RNN), and proposed a method to modify the prediction results of LSTM-RNN model based on the principle of time correlation, which improves the prediction accuracy of the model.
In the field of uncertainty prediction, Reference [
4] proposed an integrated method of short-term PV power prediction based on extreme learning machine (ELM) and lower and upper bound estimation (LUBE), and used an improved differential evolution algorithm to find the best generating prediction intervals. Reference [
20] proposed a new two-stage model to quantify the prediction interval value of photovoltaic power output, integrated a variety of neural network models to generate point prediction values, and generated the prediction interval through the kernel density estimation method. Reference [
21] proposed an improved Bootstrap method to improve the traditional theoretical method, solve the problem of invalid prediction error hypothesis, and reduce the interval width under the premise of ensuring interval coverage. Reference Additionally, [
22] proposed a prediction model based on particle swarm optimization and boundary theory; by using particle swarm algorithm to optimize the output weight of boundary estimation theory, the interval prediction of photovoltaic output was realized.
To the best of our knowledge, each model has disadvantages and advantages. Therefore, none of these models can always achieve the desirable prediction results [
23,
24]. To further improve forecasting performance, this paper proposes a multi-objective optimization-based ensemble probability forecasting (MLBN) model for the non-stationary period of photovoltaic output based on the research of previous authors [
25,
26]. Modeling is divided into three stages: in the first stage, the historical output data of photovoltaic power plants are preprocessed, feature selection is performed based on the MIC theory, and the most suitable input features are selected; in the second stage, according to the feature selection results of the first stage, the features are respectively input to the improved LSTM algorithm and the BAYES neural network to obtain the initial deterministic point prediction results and the uncertainty interval prediction results; in the third stage, the initial interval prediction value is optimized to meet the narrowest interval width and the highest interval coverage, and then the initial point prediction result is optimized and estimated, and it is expanded to a new interval prediction value. Finally, the NSGA-II optimization algorithm is used to perform multi-objective optimization of the two new interval prediction values to obtain the final prediction interval.
The main contributions of this paper are demonstrated as the follows:
- (1)
Considering the non-stationary nature of PV power output, the differential theory based on irradiance and power’s ratio is proposed to preprocess the PV historical data.
- (2)
The Stack-LSTM model, which based on LSTM and Stacking learning, is put forward as a new point prediction model to improve the modeling accuracy.
- (3)
The multi-objective calibration of ensemble probabilistic photovoltaic power forecasting model (MLBN) is proposed, which can improve prediction accuracy by a large number and help decision-makers control the changes in the power grid planning and scheduling.
The remainder of this paper is organized as the follows.
Section 2 briefly describes the basic methods about DM, Stack-LSTM, BAYES and NSGA-II.
Section 3 presents the framework of the proposed MLBN model and the error indicators.
Section 4 is designed for data set preprocessing and forecasting results of different models. Conclusions are given in
Section 5.
2. Method Introduction
In this section, we mainly introduce the ensemble probability forecasting (MLBN) model method based on multi-objective optimization, including the power ratio difference discriminant method, point prediction model, interval prediction model, NSGA-II (Non-dominated Sorting Genetic Algorithm-II) multi-objective optimization algorithm, MIC (Maximal Information Coefficient) theory, etc.
2.1. Discrimination Method for Radiation Power Ratio Difference (DM)
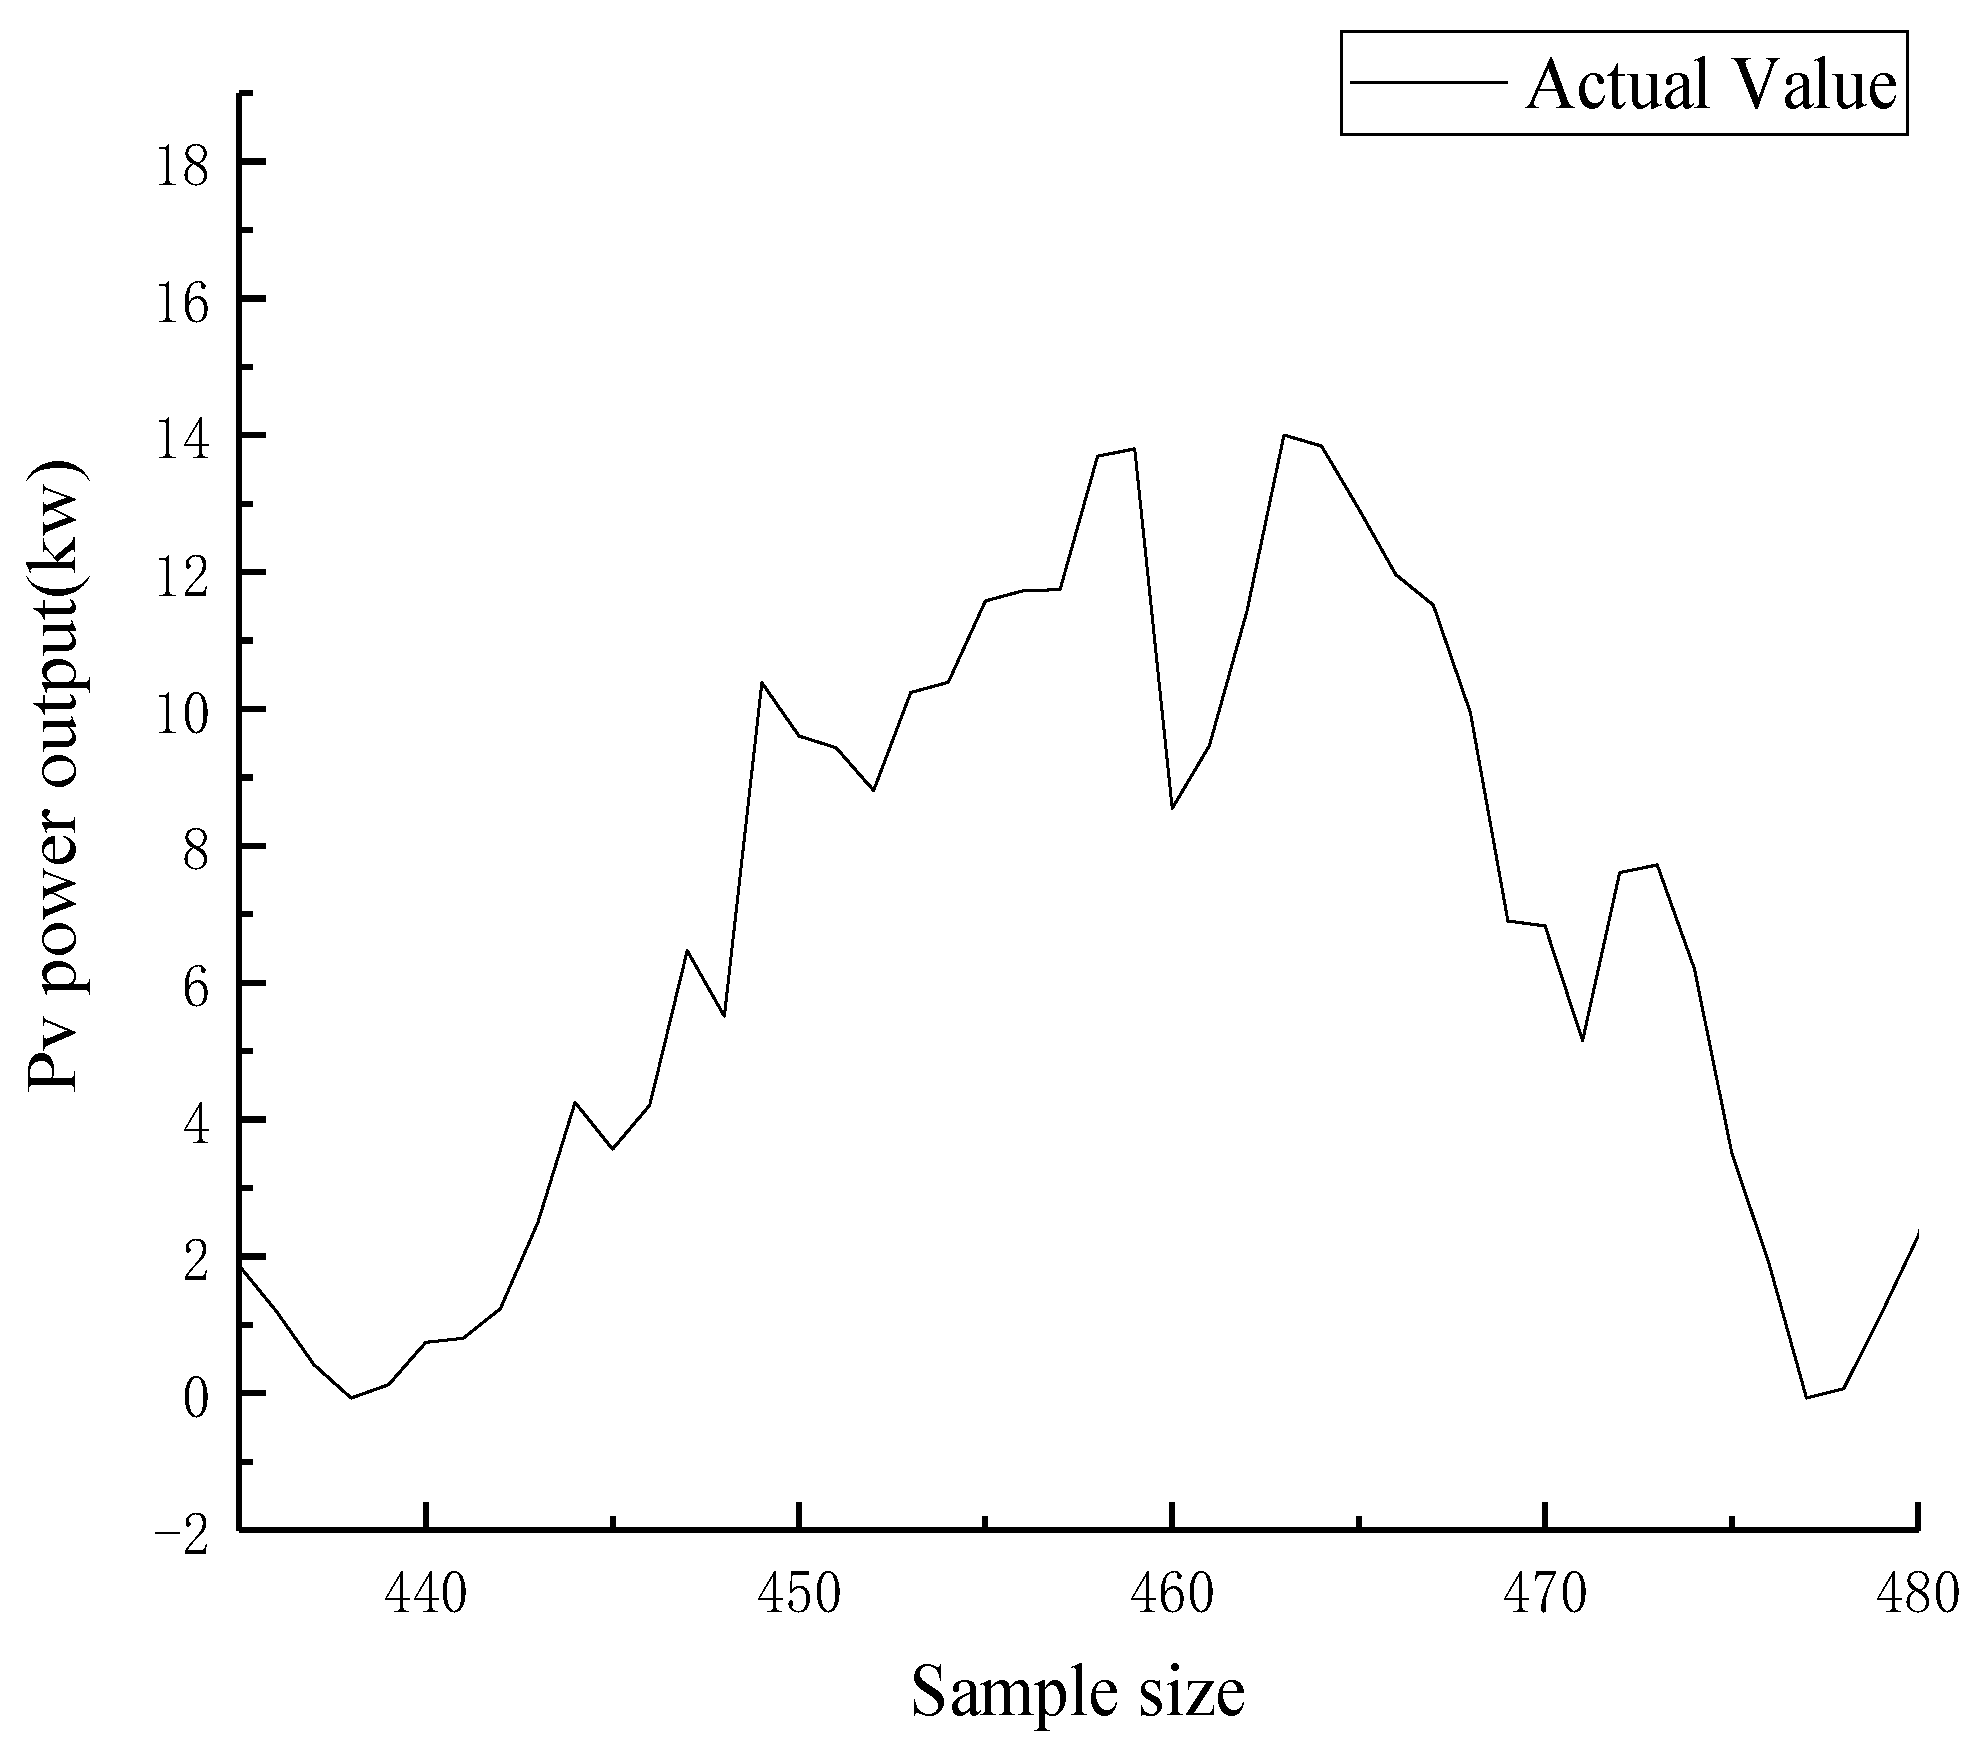
The output of photovoltaic power plants has the characteristics of randomness and intermittent. In ideal weather conditions such as sunny days, the output of photovoltaic power is in a stable period; The output curve shows obvious periodic changes, and is close to the normal distribution, and the fluctuation is small [
27]. In other cases, the photovoltaic output is in a non-stationary period, and the output curve fluctuates randomly with the change of the weather, with greater fluctuations than in a stable period. Therefore, this paper proposes for the first time the method of discriminating the difference in the radiation power ratio [
16]. According to the fluctuation range of the photovoltaic output curve, the historical data is divided into a stable output period and a non-steady output period. The specific discrimination process is as follows [
19].
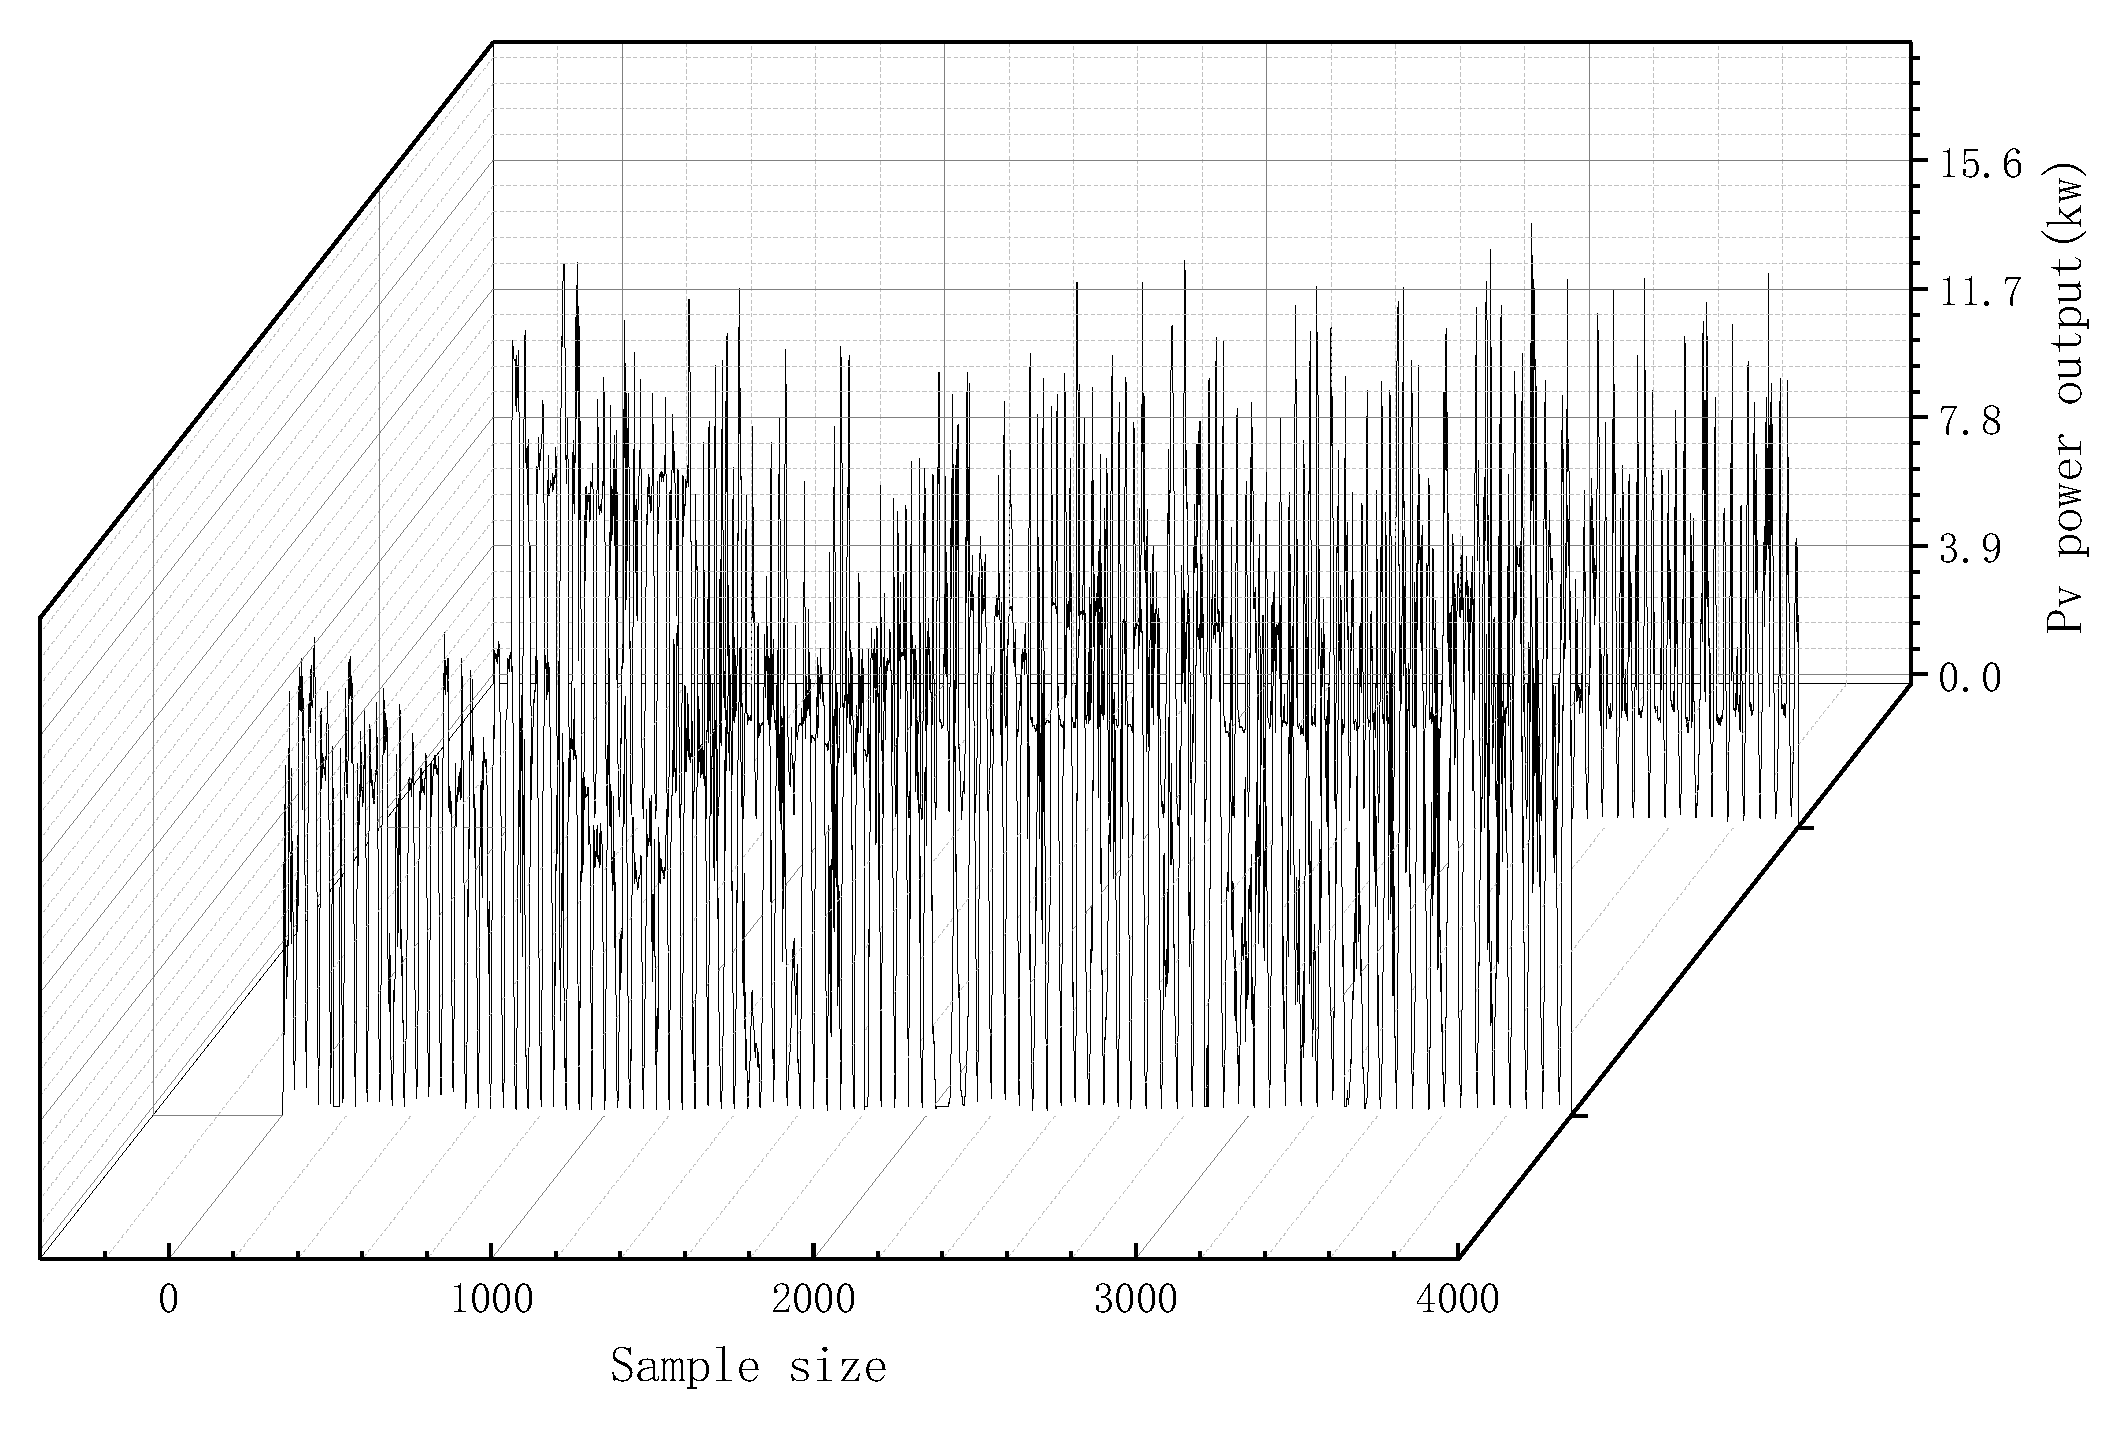
(1) Photovoltaic output is greatly affected by factors such as weather and irradiance, and it has a strong periodicity. The common output curve types are stable output type and non-stable output type.
Figure 1 and
Figure 2 show representative two Group data, respectively, as the specific description of these two types.
(2) In order to accurately distinguish the difference between the period of steady output and the period of non-stationary output, the steps in this paper are as follows.
(a) the parameter radiant power ratio difference can be defined as
where,
is the irradiance of the
-th sample in the data sample;
is the irradiance of the
-th sample in the data sample.
(b) Dividing the value range of
, can be expressed as
(c) The value of
is judged on the basis that when the value is on
, which is regarded as a period of steady output, and all other cases are periods of non-steady output. Due to the large changes in power during the two periods of time when the sun rises and the sun sets for photovoltaic power generation, it is a normal phenomenon. To avoid dividing the two periods of time into non-stationary output periods in the division process, a new criterion (3) is used to prevent misjudgments.
where,
is the actual output power of the
-th sample in the data sample, and
is the actual output power of the
-th sample in the data sample.
After the test of this method in this paper, the radiant power ratio difference criterion method can distinguish the stable period and the non-stationary period of photovoltaic output with high quality, which has strong feasibility.
2.2. Point Prediction Model
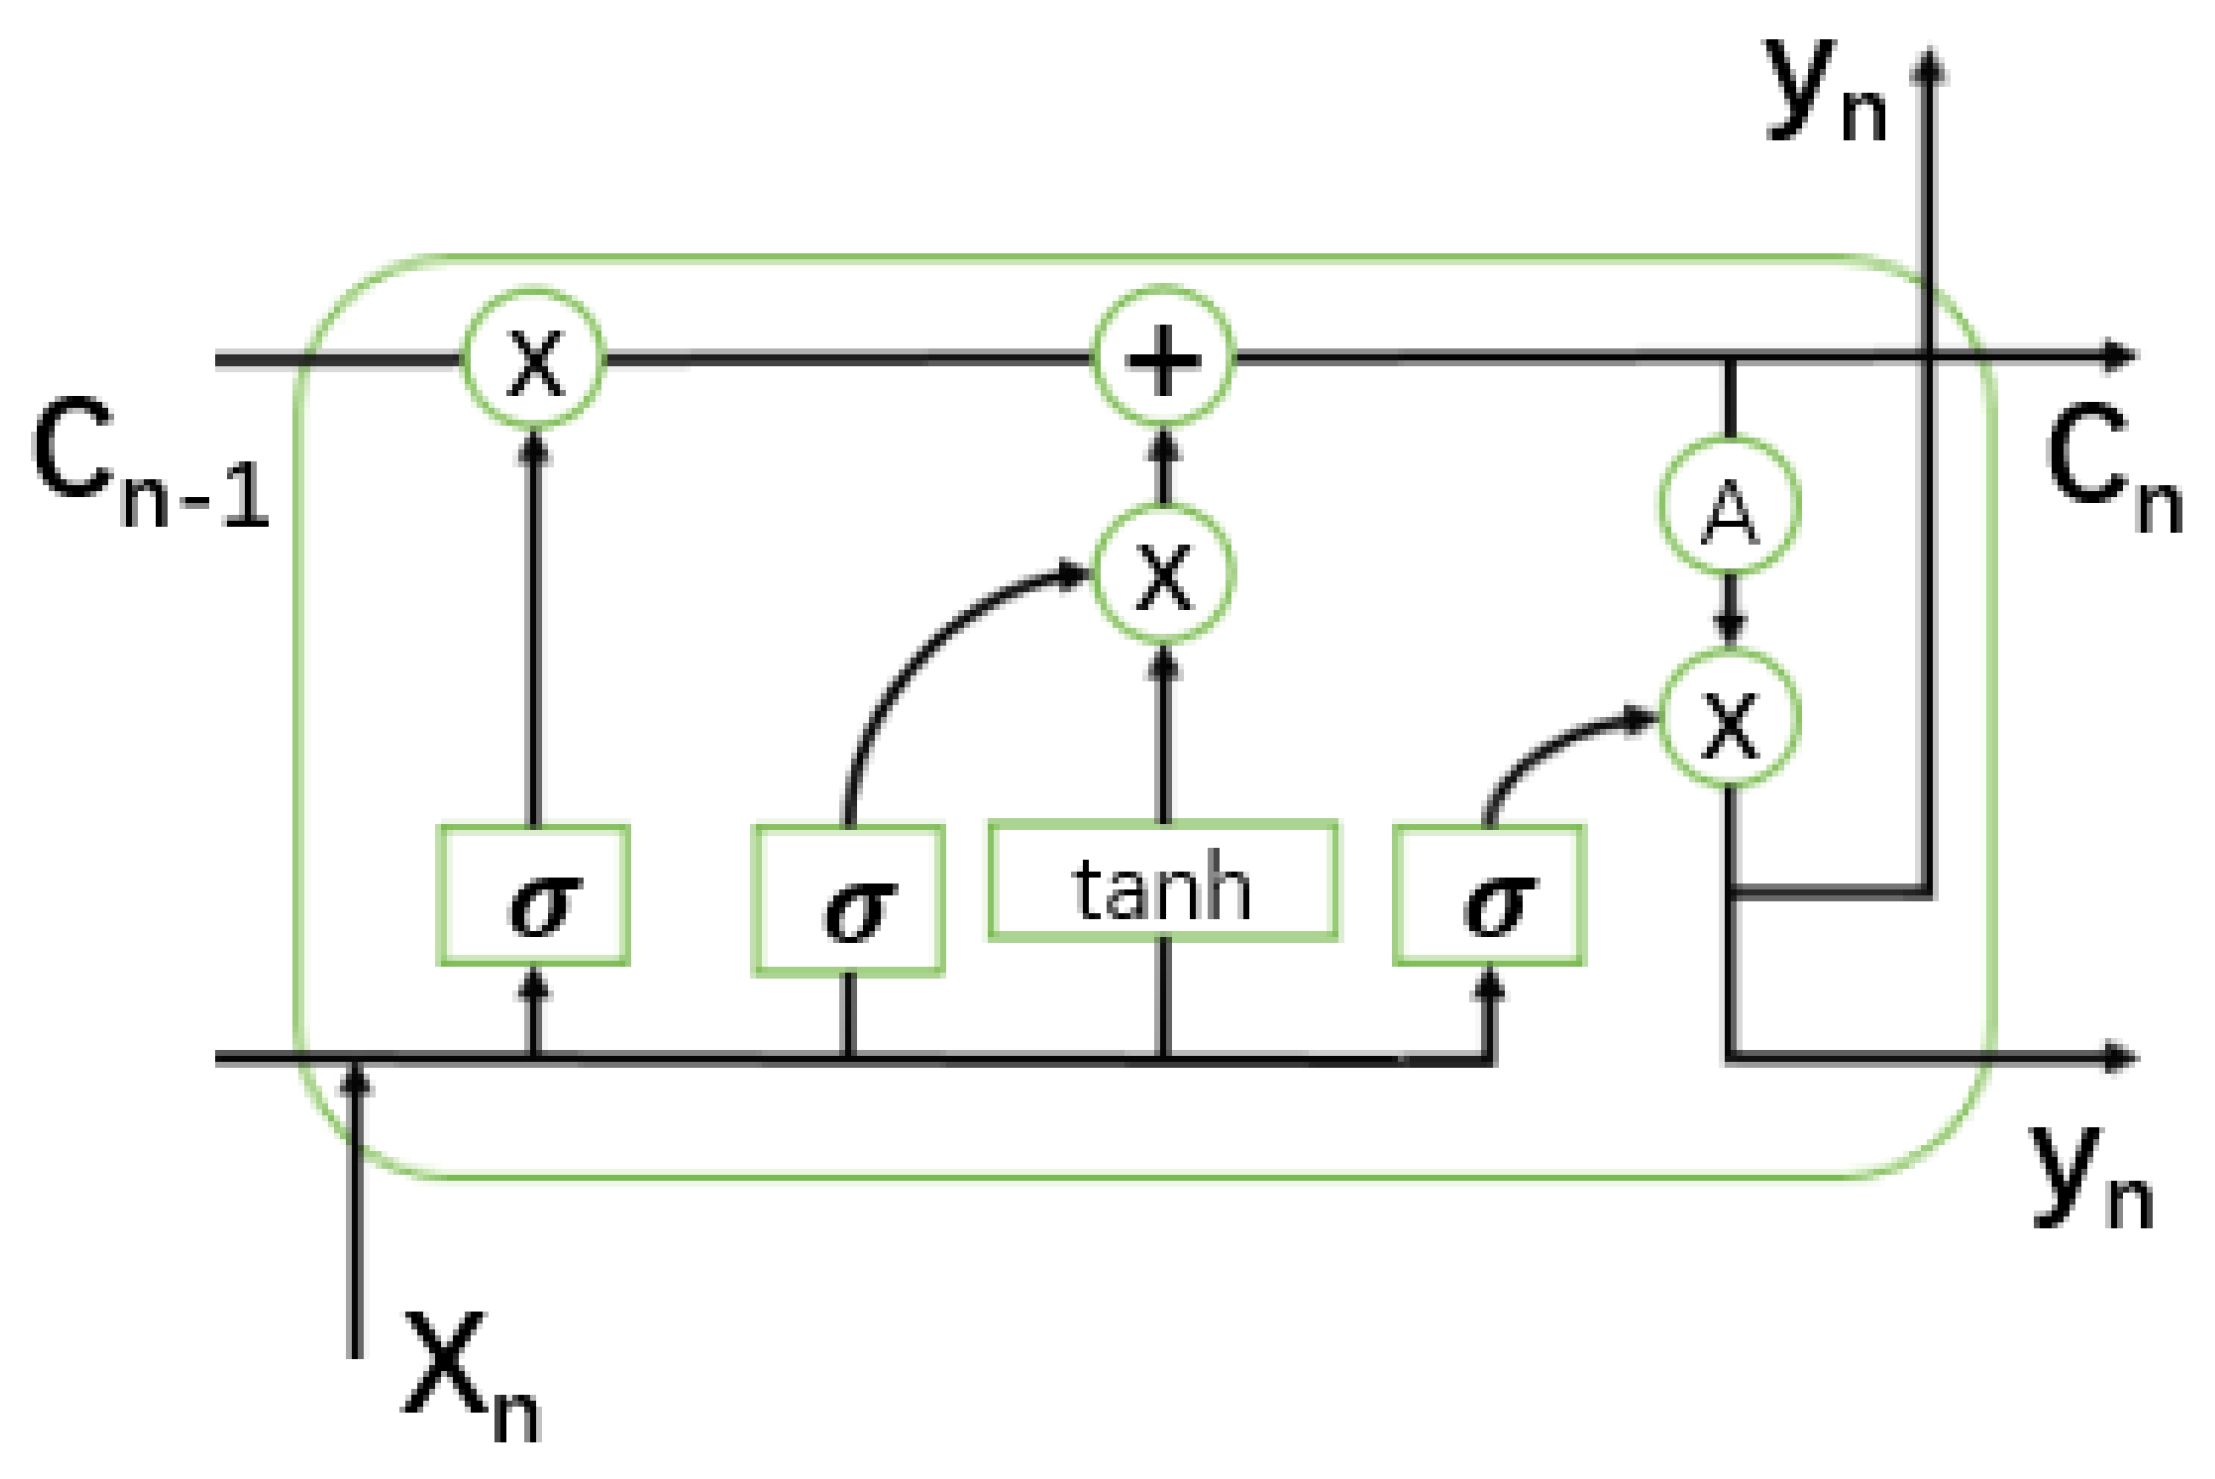
Aiming at the characteristics of photovoltaic output during non-stationary periods, this paper adopts an improved Stack-LSTM model to predict photovoltaic power with certainty points [
2,
28]. The standard LSTM neural network is improved from the general recurrent neural network (RNN) recurrent neural network model, which solves the problems of long-term dependence and gradient disappearance in the RNN network; compared with other networks, the processing of nonlinear problems has greater advantages. The standard structure is shown in
Figure 3.
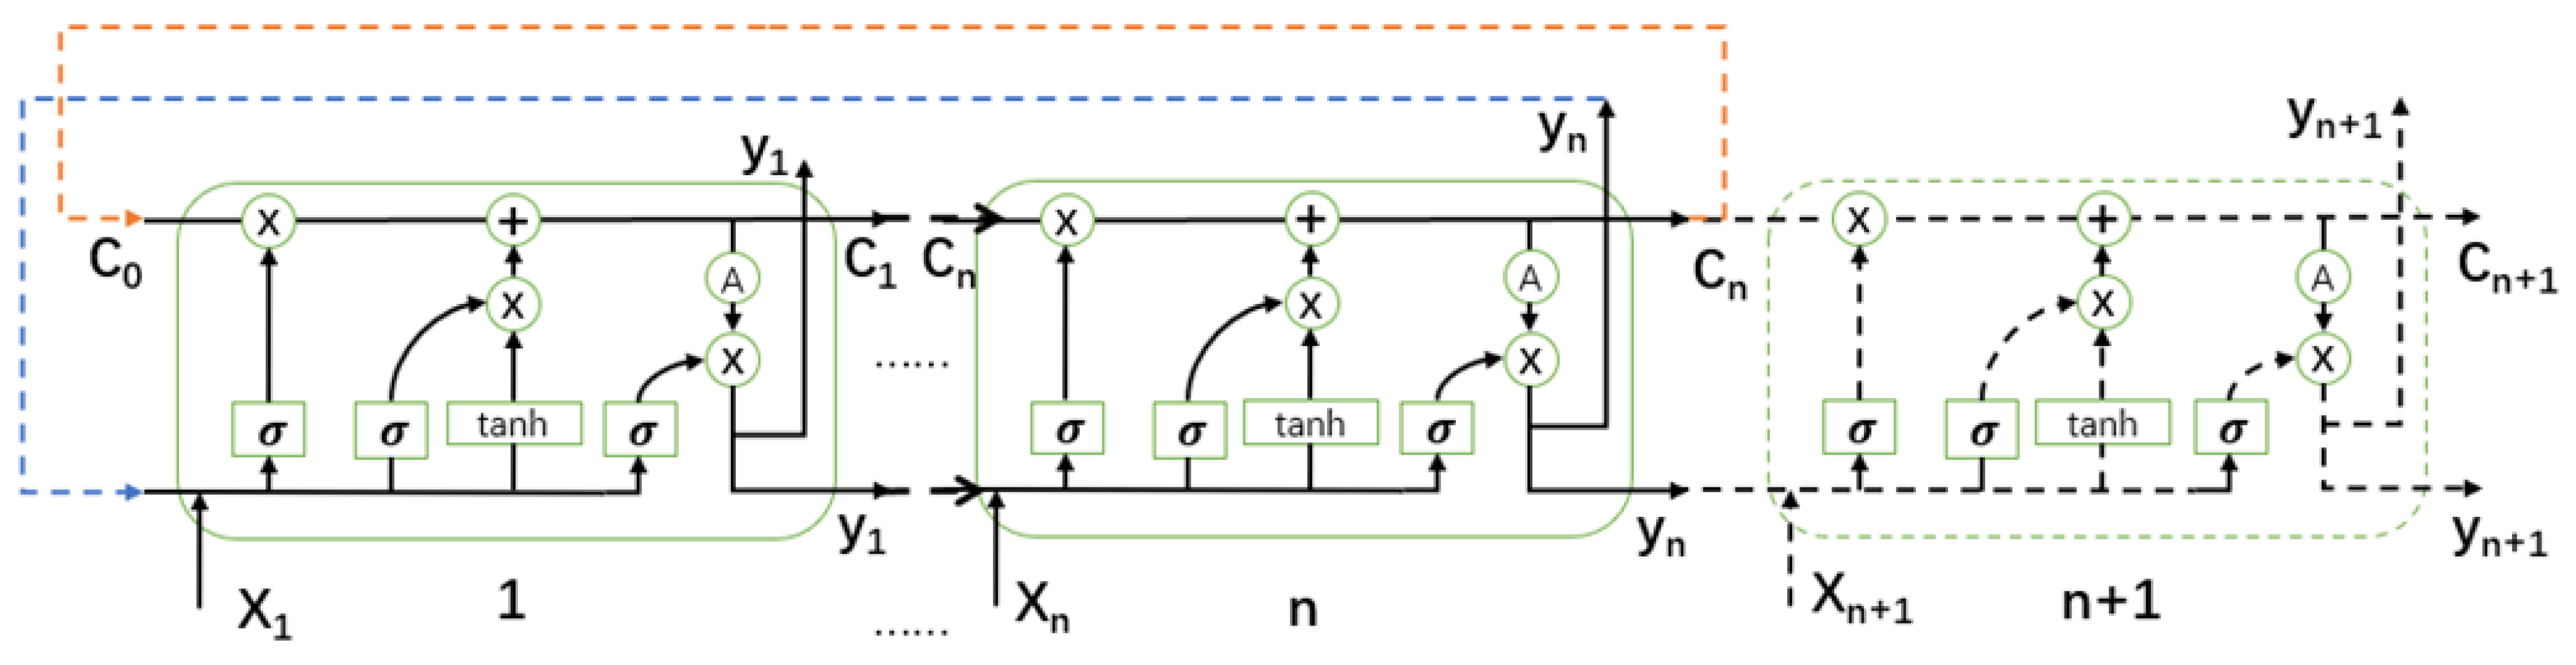
However, in actual operation, it is found that the prediction accuracy of the standard LSTM model is not high enough for the power prediction during the non-stationary output period extracted in this paper. To further improve the prediction model and improve the prediction accuracy of non-stationary output periods, this paper introduces the integration theory based on the original LSTM model, and builds the Stack-LSTM model. The model structure diagram is shown in
Figure 4, and the specific process is in the following.
- (1)
Dividing the data set into n subsets ;
- (2)
Based on these n subsets, they are input into the LSTM algorithm to obtain the first prediction result ;
- (3)
The first prediction result is added as an additional feature to the original feature to form a new input feature
, which is then input into the LSTM algorithm again to perform the second prediction and obtain a higher precision result [
19].
2.3. Interval Prediction Model
Under complex weather conditions, the short-term output of photovoltaic power plants is not stable. Aiming at the problem that the prediction accuracy of the deterministic prediction method is significantly reduced, this paper uses Bayesian neural network for interval prediction [
20]. Compared with deterministic forecasting, interval forecasting can give the interval distribution of all possible output values of photovoltaic equipment at the forecast time, thereby describing the uncertainty of the forecast point [
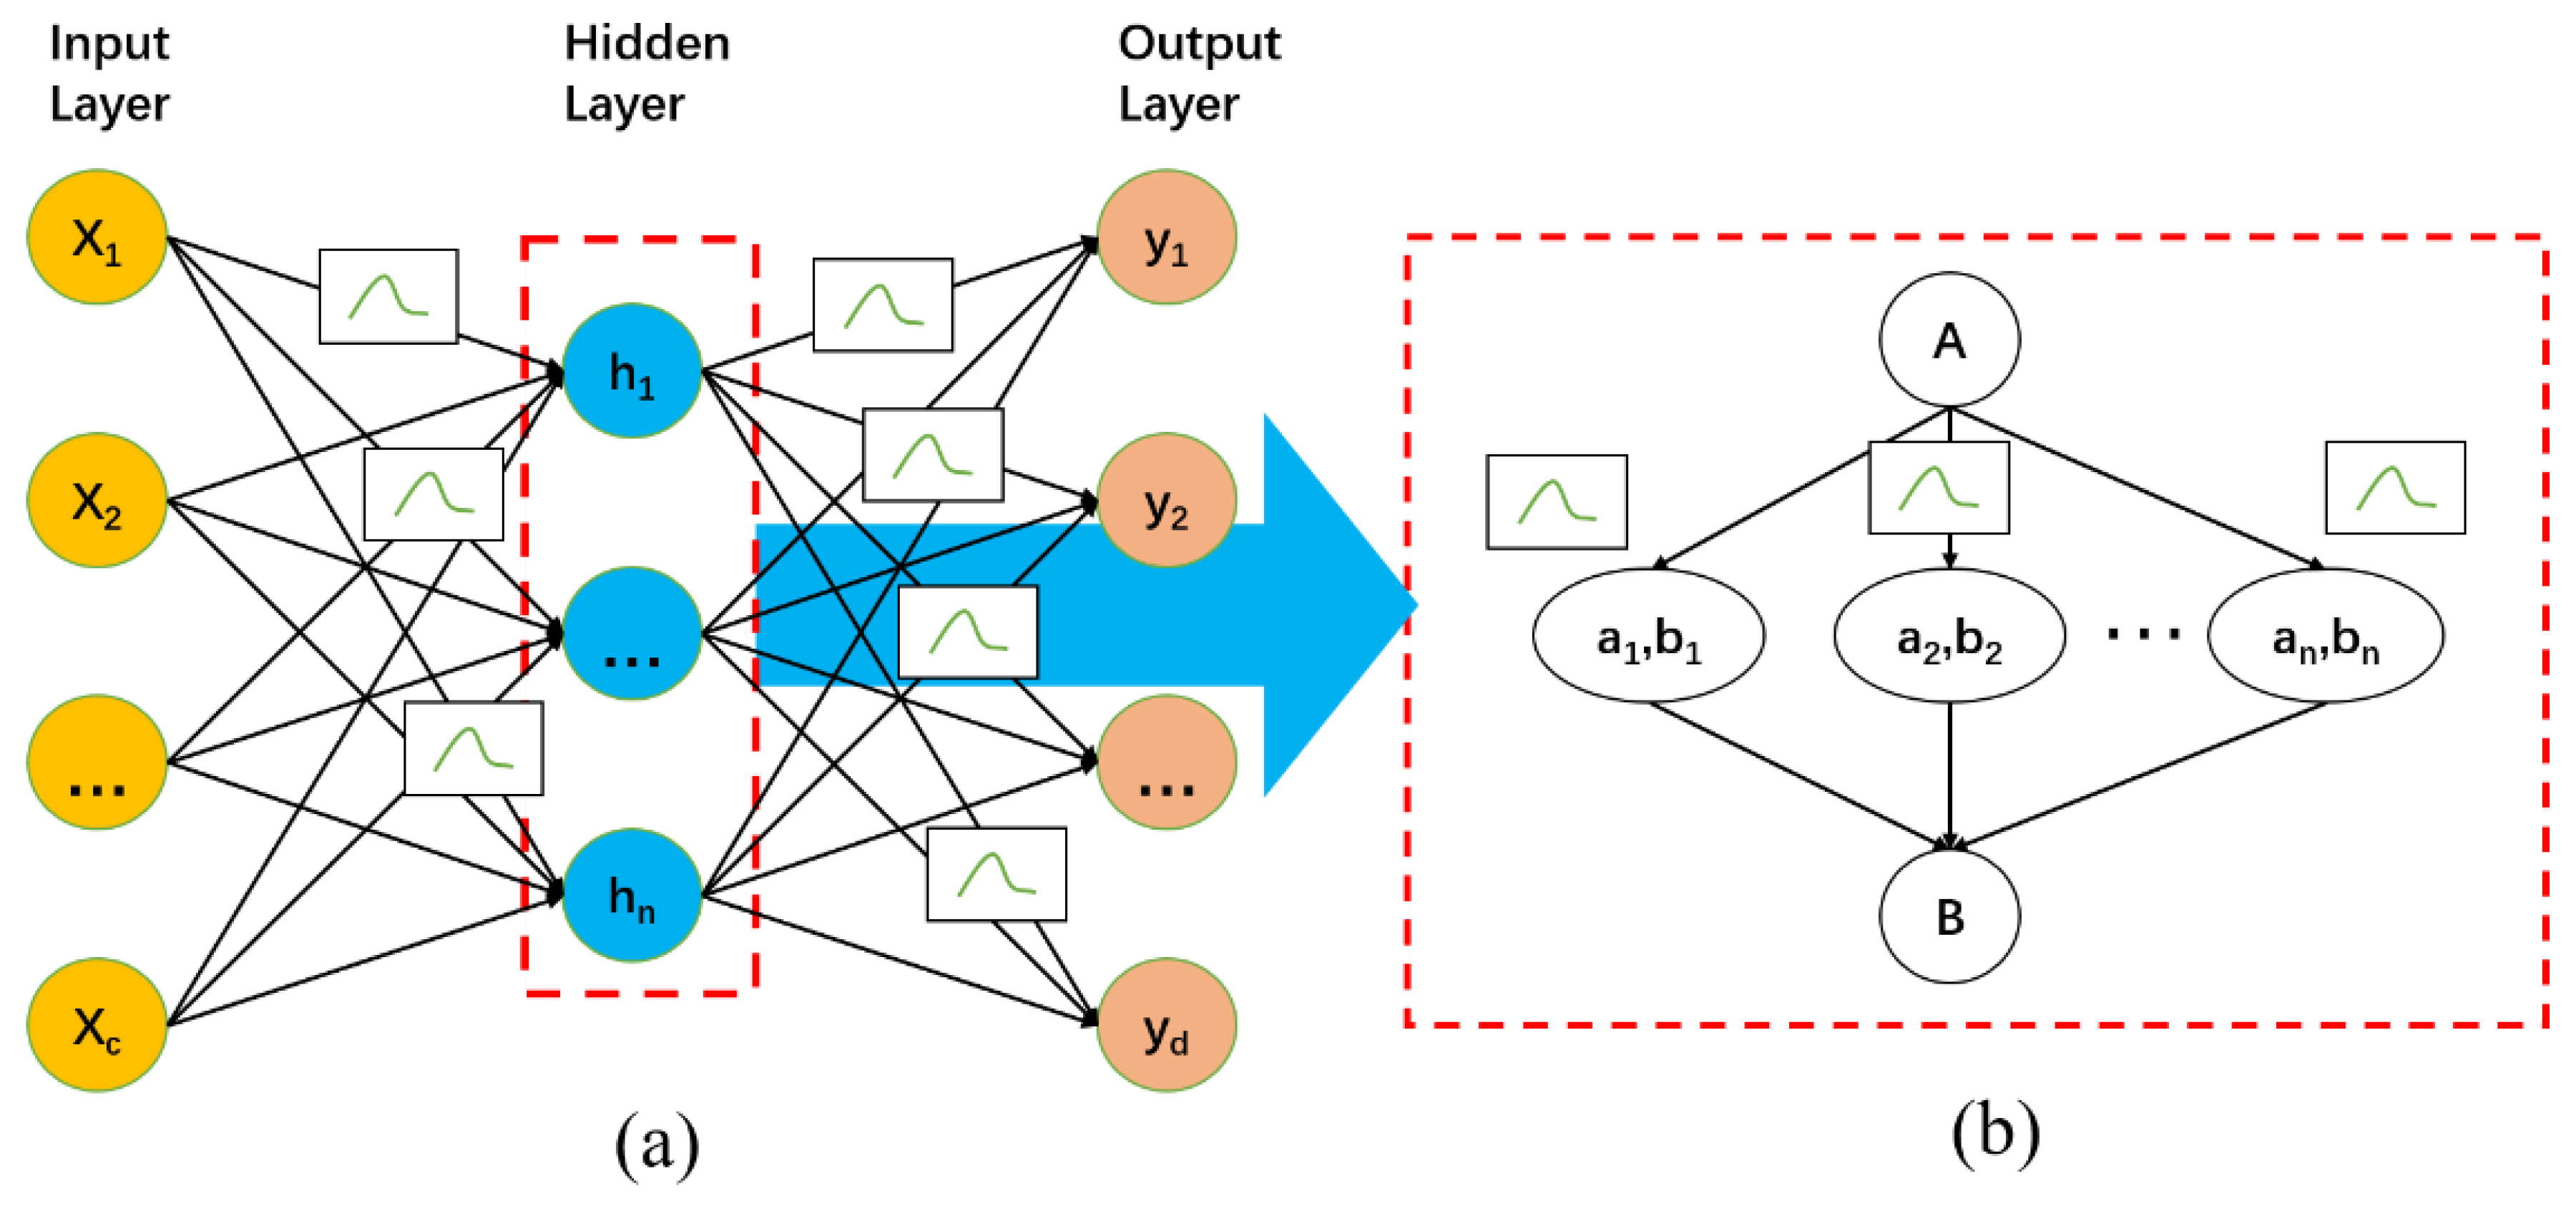
1]. The Bayesian neural network is essentially a probability-based uncertainty inference network. Its structure is similar to that of a deep neural network. It is composed of an input layer, a hidden layer, and an output layer, as shown in
Figure 5a. The difference is that the Bayesian neural network has a probability layer in the hidden layer of its network; the weight obeys the probability distribution and is a random variable, not a definite value [
21]. The structure of the hidden layer is shown in
Figure 5a,b.
In
Figure 5, A and B are the input and output vectors of the hidden layer, respectively;
is the weight of the n-th unit, which obeys the distribution of the form
, and
is the bias of the n-th unit [
22].
The existence of the probability layer gives the Bayesian neural network the ability to describe uncertain events. Its essence is like the integrated neural network. Besides, the difference is that each sub-network of the probability layer of Bayesian neural network is not independent of each other; rather, after each training, all sub-networks can be synchronized and optimized, which makes Bayesian neural networks have a better ability to suppress the risk of overfitting than ordinary neural networks [
23].
2.4. Optimization of the Ensemble Prediction Model
The deterministic prediction method chooses the power value as the prediction result, which can also support the long-term optimization of the scheduling system. However, in complex weather conditions, the prediction accuracy of the deterministic point prediction is poor that would affect the safe operation of the power grid. Consequently, the probability and interval of the prediction result are unavailable. And the interval prediction method depends on the interval distribution of the photovoltaic equipment as the output to describe the uncertainty of the forecast point at the forecast point, which promotes the scheduling system to evaluate the fluctuation of output according to the predicted interval size, thereby adjusting the scheduling strategy. In addition, the interval prediction results are affected by the interval width which is restricted by the learning ability of the network. Thus, the whole prediction accuracy would be influenced by interval prediction results. Considering existed problems above, the Non-dominated Sorting Genetic Algorithm-II (NSGA-II) is introduced to conduct Multi-objective optimization about its results and improve the overall prediction accuracy [
24].
The basic idea of the NSGA-II described as follows: an initial population of size N is generated randomly [
25]. Then, after non-dominated sorting, the first-generation progeny population is obtained through three basic operations of the genetic algorithm including selection, crossover, and mutation; subsequently, starting from the second generation, the parent population and the offspring population are merged to perform fast non-dominated sorting [
29]. Meanwhile, for forming a new parent population, the crowding degree calculation of the individuals in each non-dominated layer must be implemented according to the non-dominated relationship and the crowding degree of the individuals. Finally, a new progeny population is generated through the basic operation of the genetic algorithm; Follow above reasoning, until the conditions for the end of the program are met, the specific flowchart is shown in
Figure 6.
Applying NSGA-II to the conditions described in this article, the specific process is as follows [
19].
- (1)
Input selection. Select three points: the deterministic point prediction result, the upper and lower bounds of the interval distribution from the interval prediction, and the actual output value about this point as the input variables of the network.
- (2)
Model construction. By inputting the relevant variables selected above, a basic NSGA-II network model is constructed to perform multi-objective optimization. The optimization objectives are (PINAW) the smallest interval width and (PICP) the largest interval coverage. Owing to these two indicators are contradictory in the same network, the optimization constraint must weigh them, and choose the smallest interval width under the maximum interval coverage as the restrictions.
- (2)
Model validation. After experiments in the subsequent part of this article, the feasibility of the model would be verified.
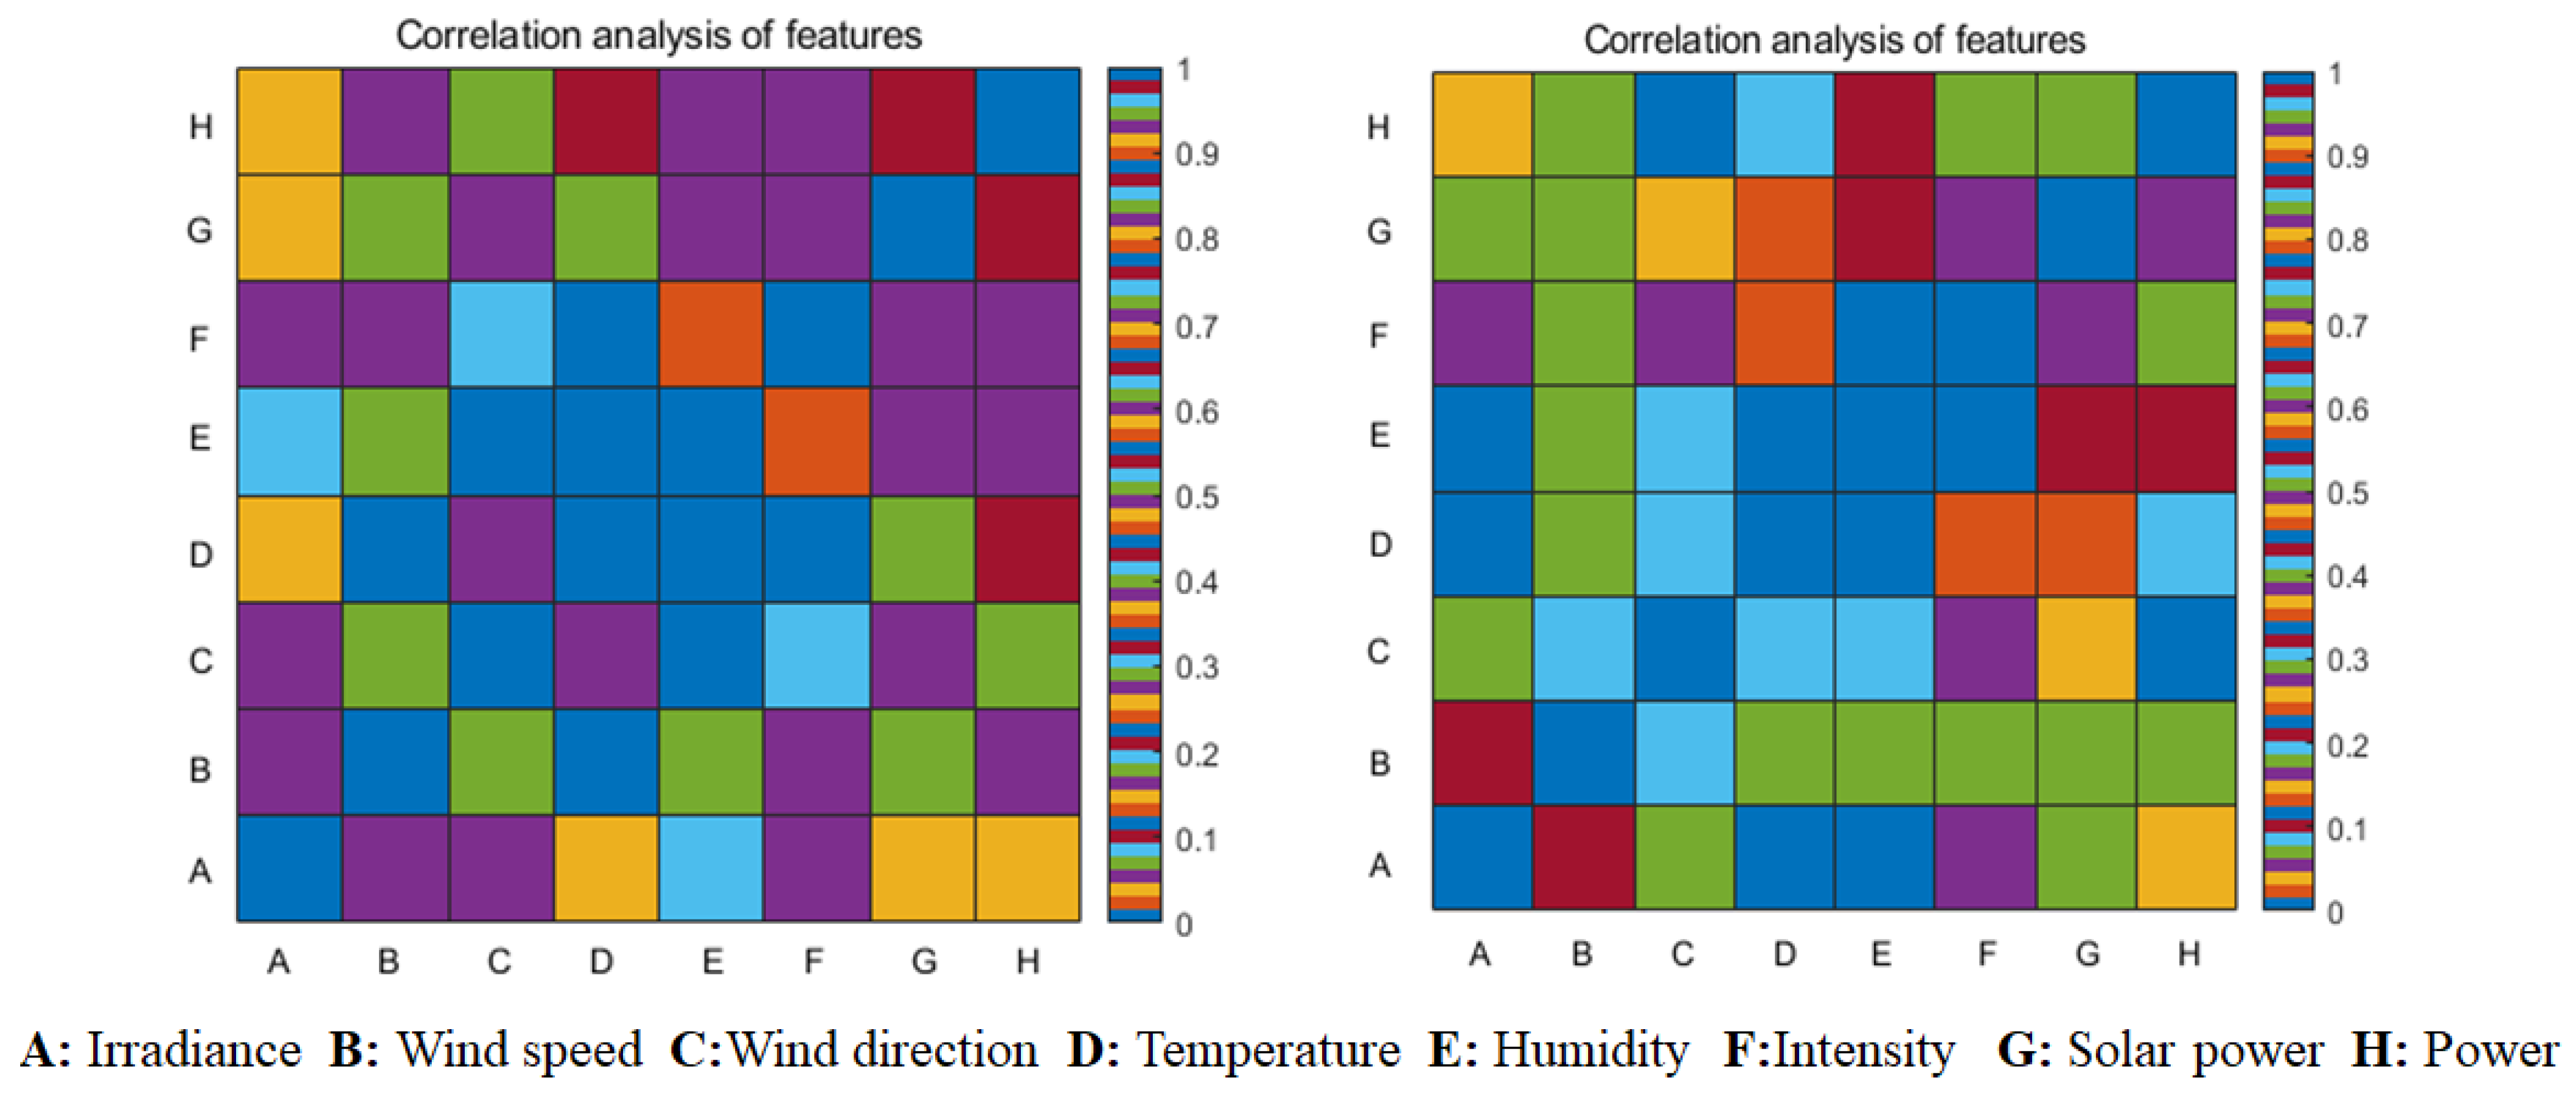
2.5. MIC Theory
MIC (Maximal Information Coefficient) is the maximum information coefficient. This theory was proposed by Reshef and other scholars in 2011 to measure the degree of correlation between two variables x and y, that is, the strength of linearity or nonlinearity [
25]. Compared with Mutual Information (MI, Mutual Information), MIC has higher accuracy and is an excellent data correlation calculation formula. The calculation formula of MI is shown as:
In the formula, is the joint probability between variables x and y; generally, it is difficult to find this value.
The basic principle of MIC is to discretize the relationship between two variables in a two-dimensional space and apply a scatter diagram to represent it [
26]. After the current two-dimensional space is divided into a certain number of intervals in the x and y directions, and then check how the current scatter points fall into each grid. This is the calculation of joint probability. This solves the difficult problem of joint probability in mutual information, with the calculation formula below.
In the formula, a and b are the number of grids divided in the x and y directions, which is essentially the network distribution, and B is a variable, generally taken as the 0.6th power of the amount of data.
3. MLBN Model Development
3.1. Model Construction
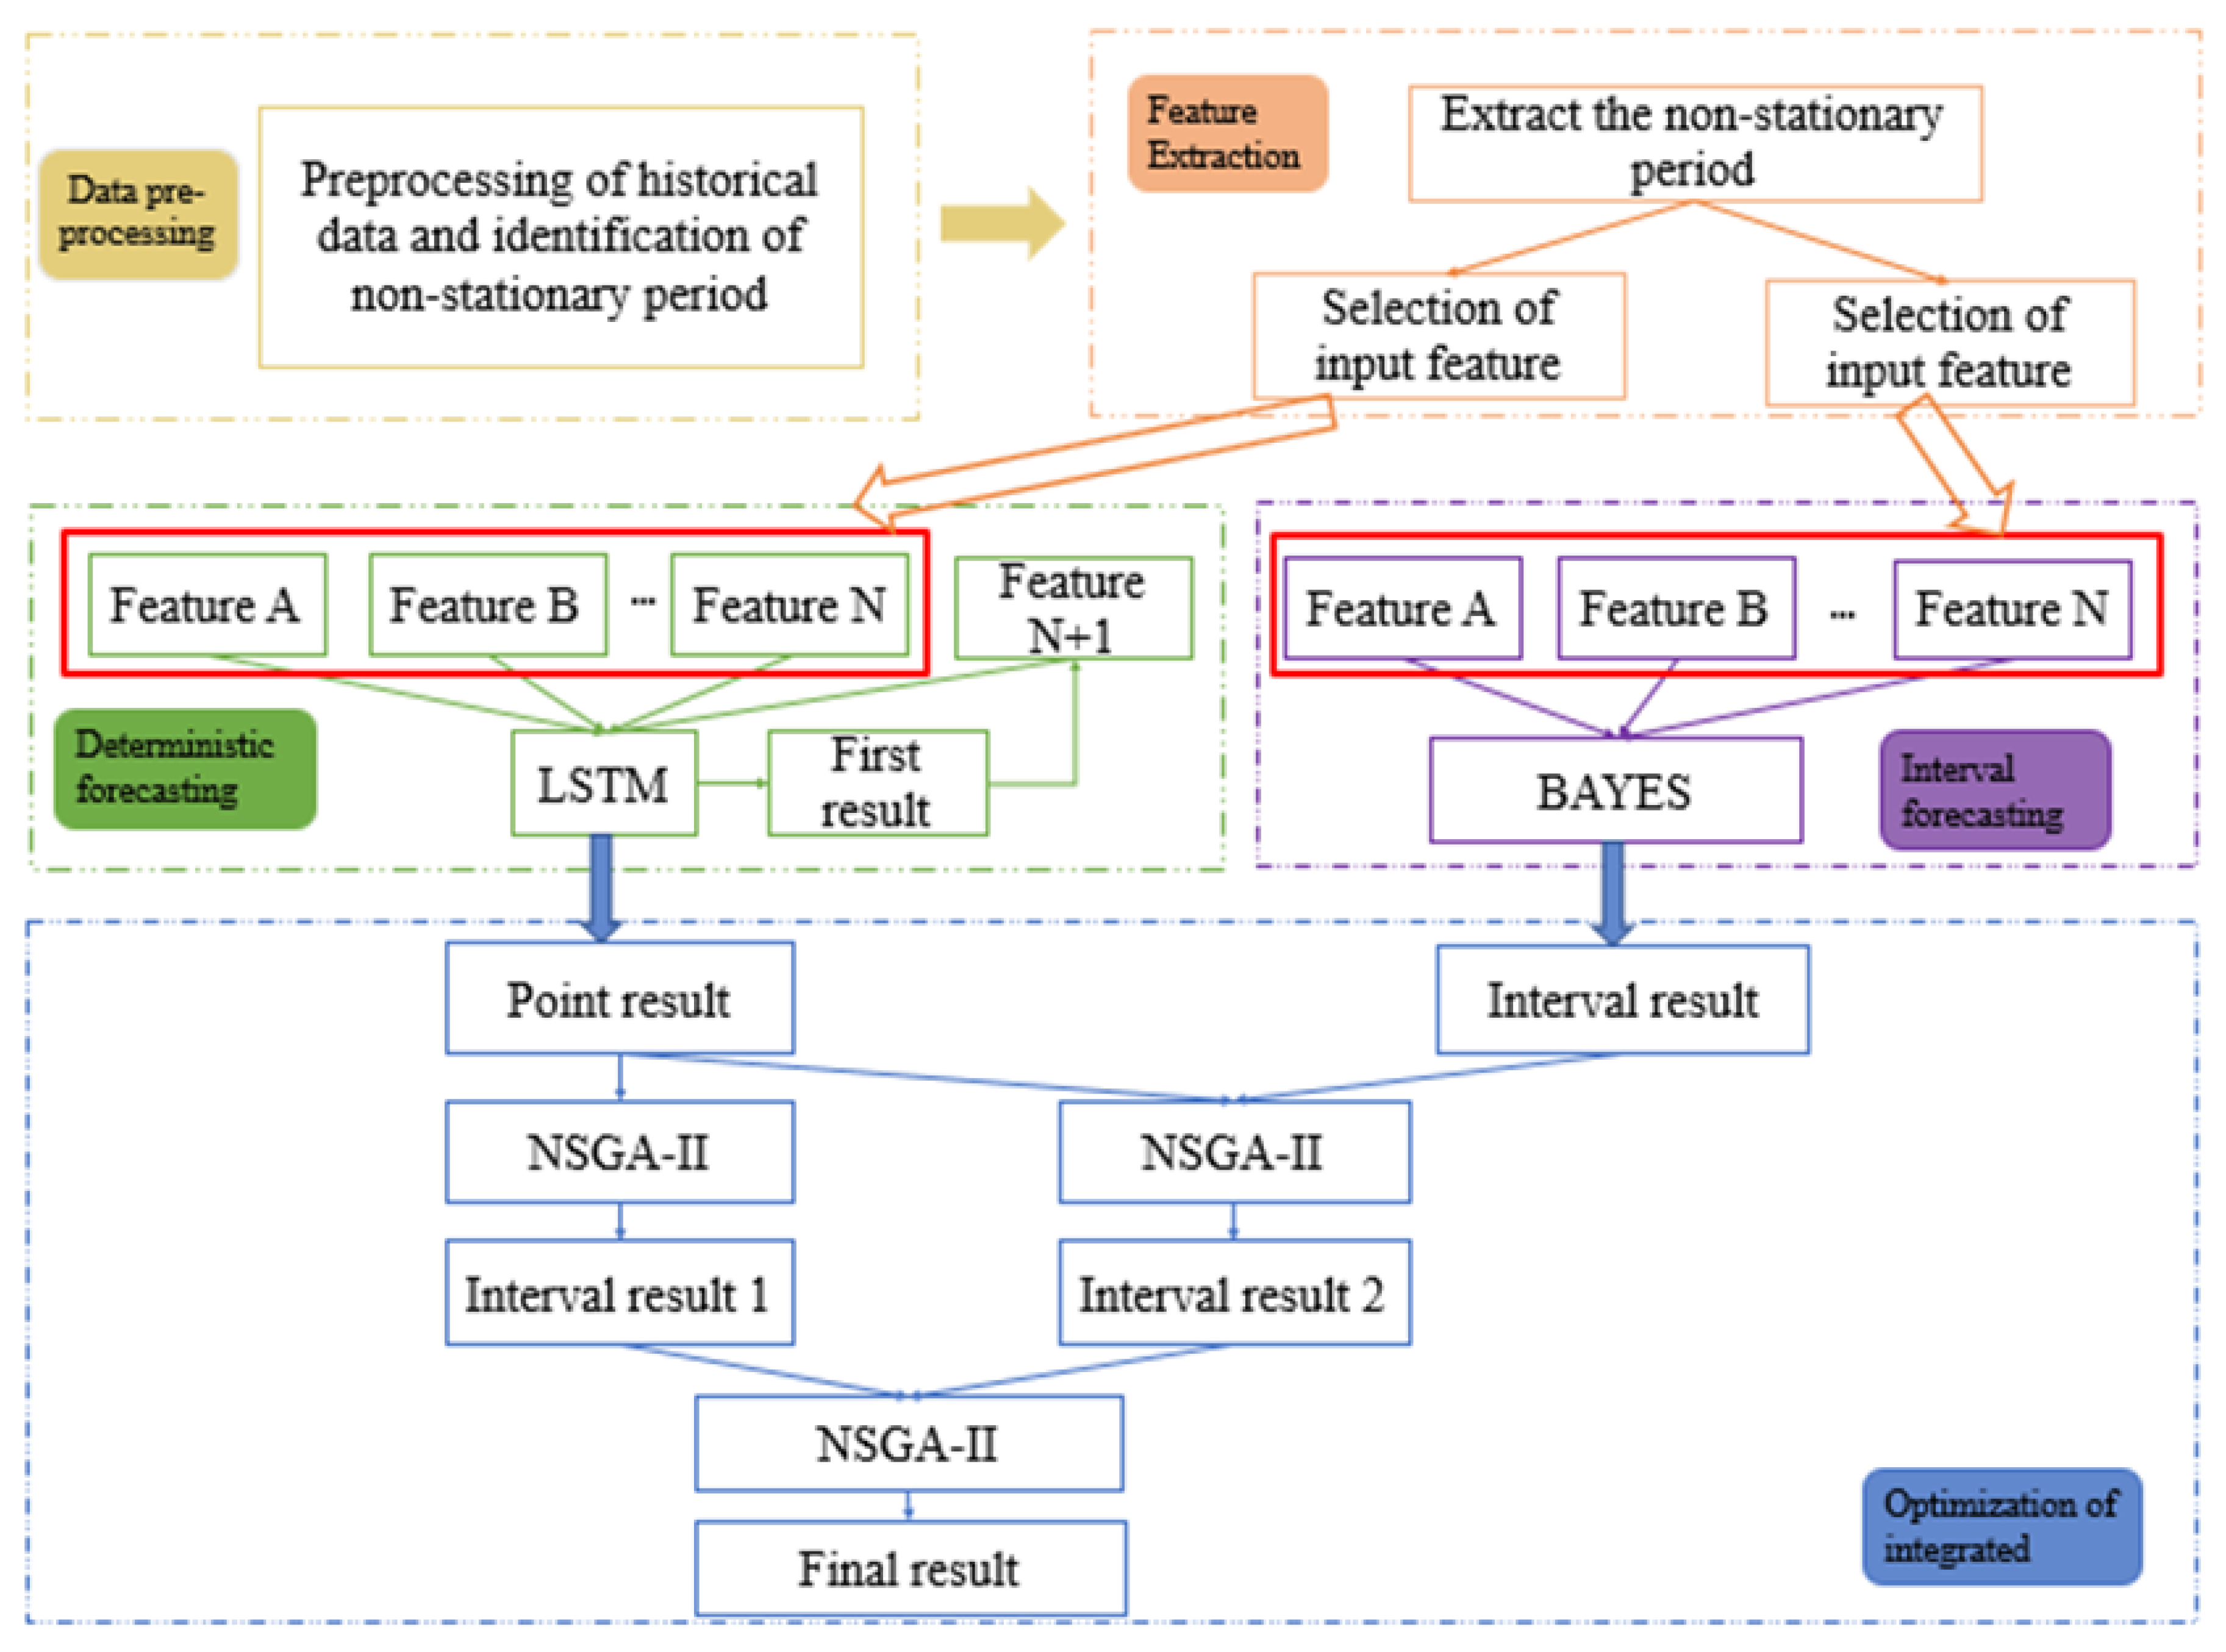
Based on the above methods (radio power ratio difference discriminant method, MIC, Stack-LSTM, BAYES, and NSGA-II), this paper proposes a multi-objective optimization-based ensemble probability forecast (MLBN) model. The model couples the integrated modules of data preprocessing, non-stationary period discrimination, feature extraction, deterministic prediction, uncertainty prediction, and optimization, as shown in
Figure 7.
The MLBN proposed in this article is mainly composed of five modules.
Module 1: Data preprocessing and identification of non-stationary periods
(1) Data preprocessing
The central limit theorem (3-Sigma principle) is applied to detect and eliminate abnormal data from the historical output data of photovoltaic power plants, and then adopt the K nearest neighbor algorithm, and the Euclidean distance method to fill in the abnormal data.
(2) Discrimination of non-stationary periods
The pre-processed historical data is discriminated by the method of discriminating the difference in power ratio described above, and two types of periods of steady output and non-stable output are obtained.
Module 2: Feature extraction
Based on the theory of mutual information, this paper chooses the MIC method to extract the input vector features of photovoltaic output data during non-stationary periods, which mainly include the following factors: wind speed, wind direction, temperature, humidity, pressure, and irradiance.
Module 3: Point forecast
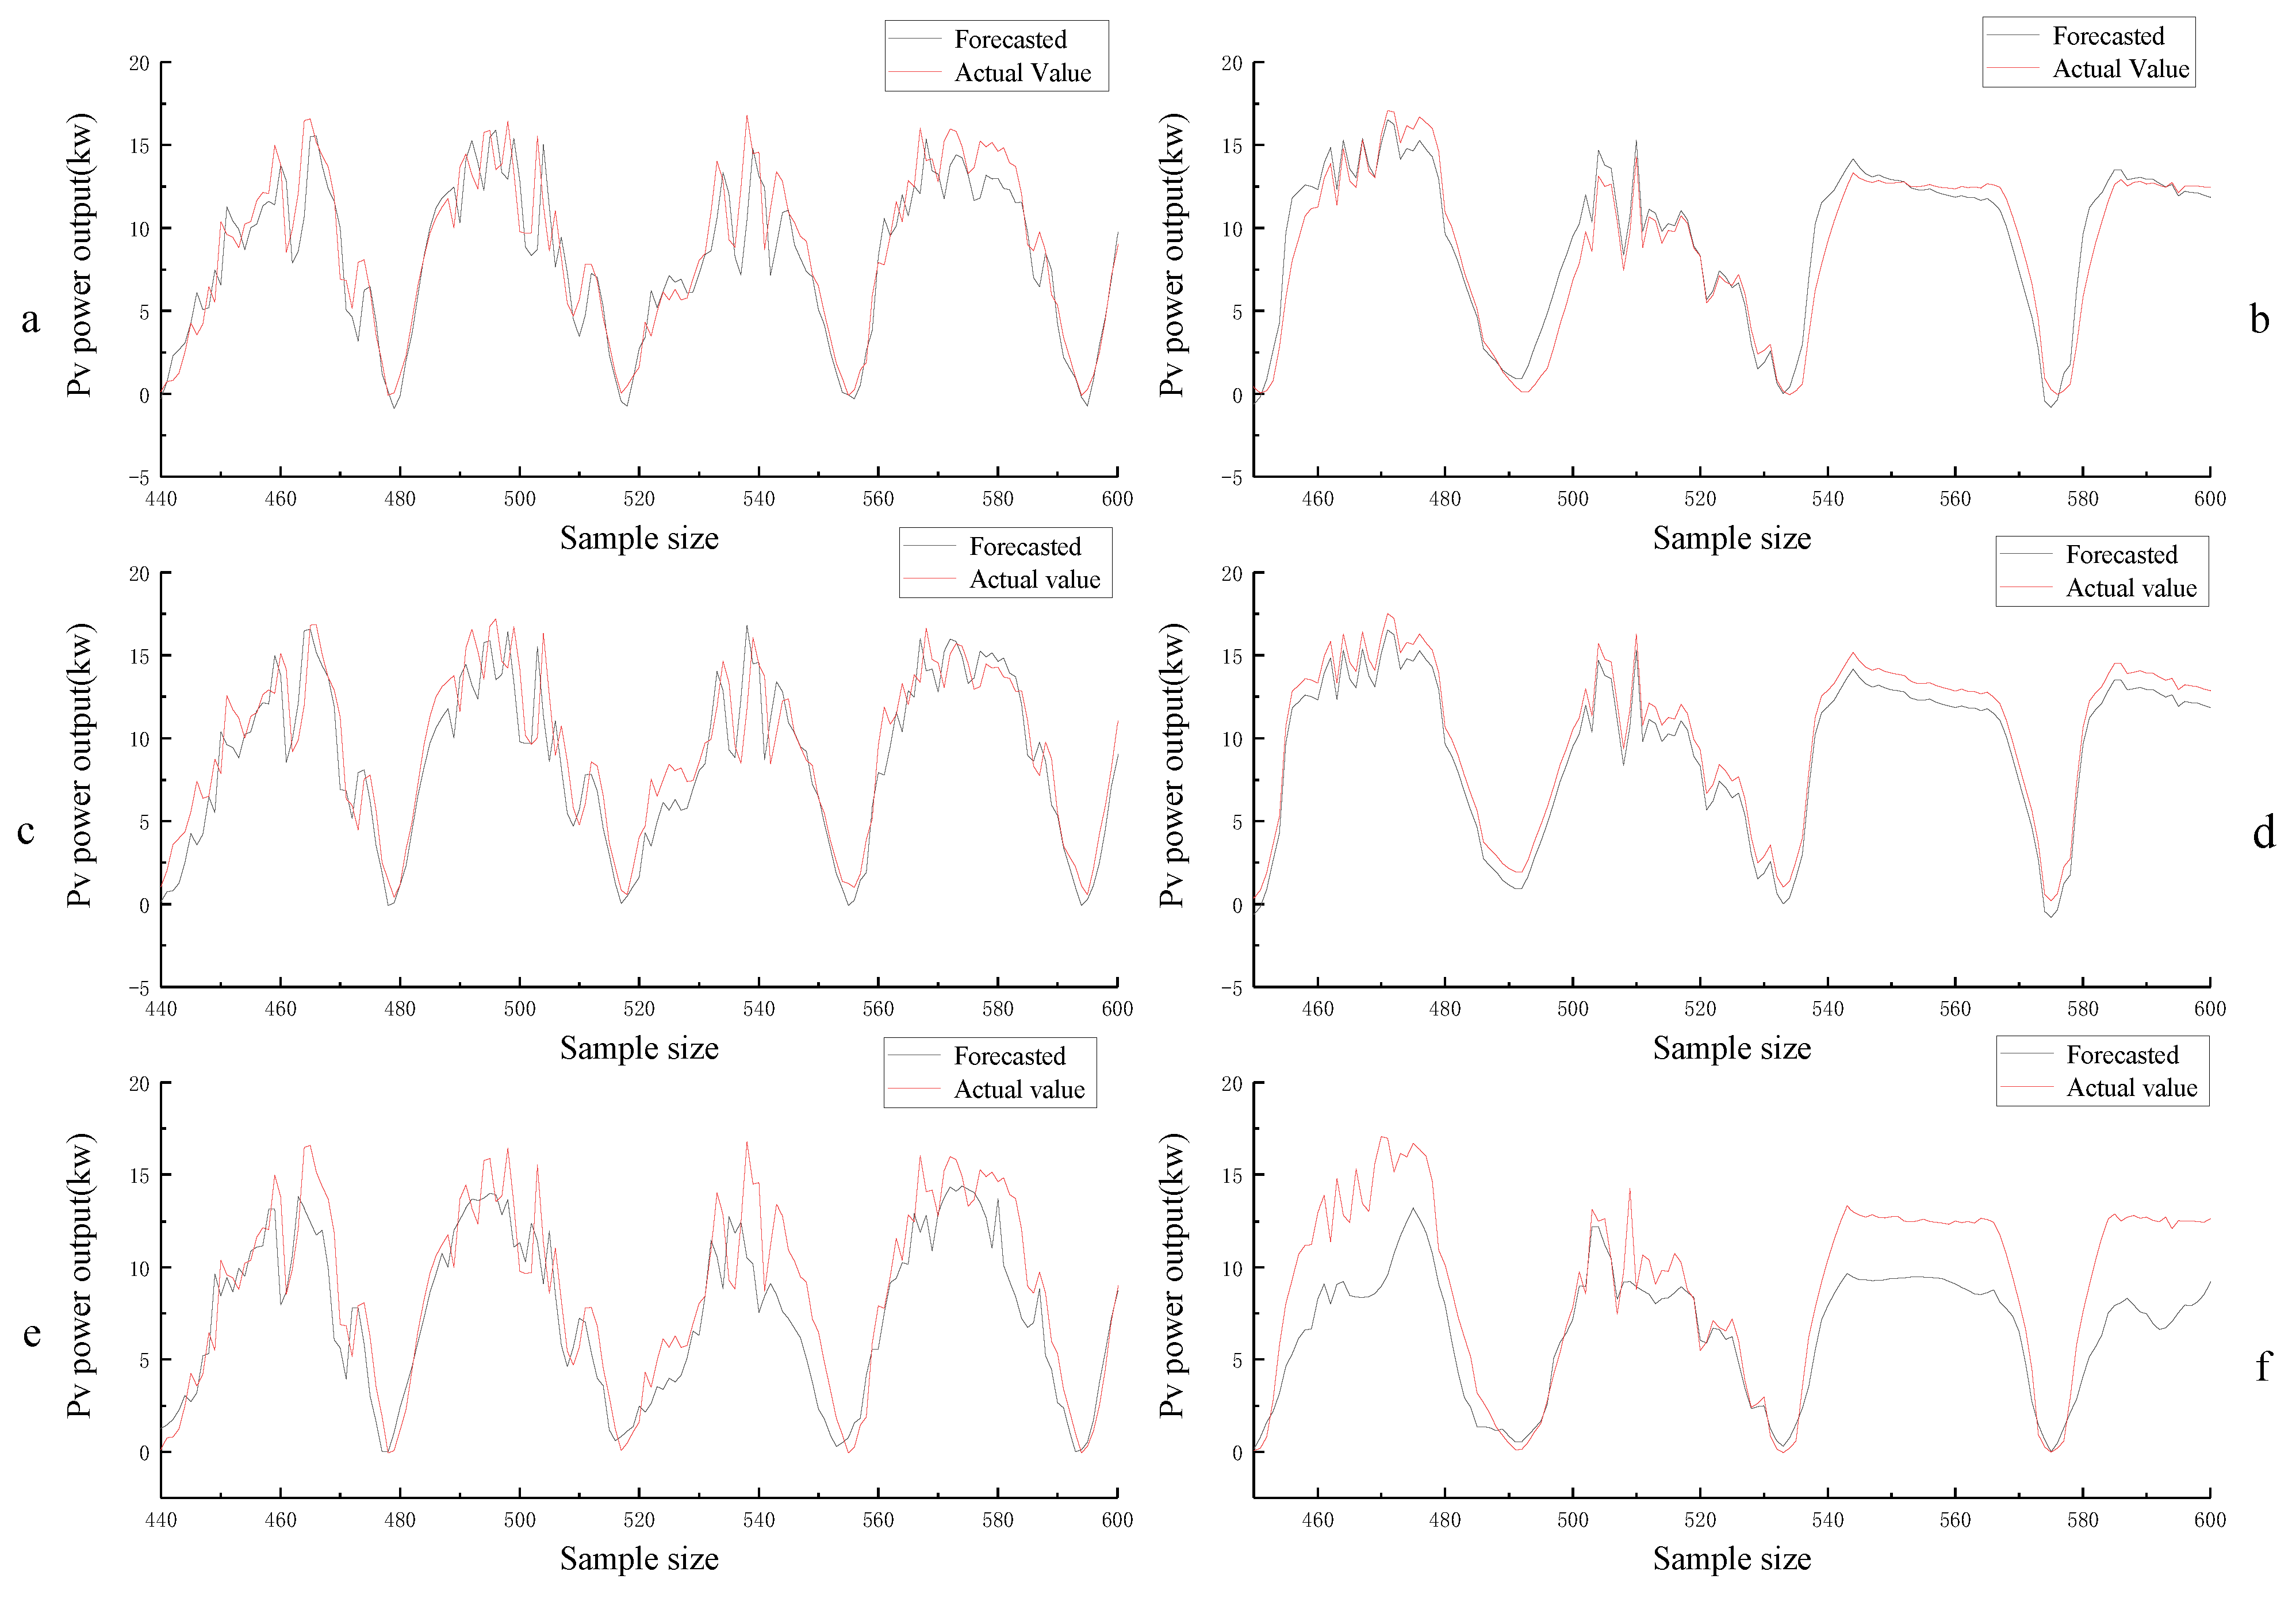
The improved Stack-LSTM model algorithm is used to predict the period of photovoltaic non-stationary output with certainty points, and two sets of data from different sources are selected for verification.
Module 4: Interval prediction
The Bayes neural network model is used to predict and verify the interval of uncertainty in the period of photovoltaic non-stationary output.
Module 5: optimize integration forecast
The NSGA-II optimization algorithm is utilized for multi-objective optimization. The prediction results of certainty points and the upper and lower bounds of uncertainty interval prediction are selected as input, and the optimization targets are the largest PICP and the smallest PINAW.
3.2. Model Prediction Evaluation Index
To evaluate the prediction results of the model more objectively and comprehensively, this paper evaluates the deterministic prediction results from the perspective of certainty, and evaluates the results of interval prediction from the perspective of uncertainty [
20].
The deterministic forecast evaluation indicators selected in this paper are the average absolute percentage error (
MAPE) and root mean square error (
RMSE). The calculation formula is as follows:
In the above formula, is the number of samples, and are the predicted value and actual value at time , respectively.
Meanwhile, to construct high-quality interval predictions, the indicators used in this paper to evaluate the uncertainty prediction results are the prediction interval coverage probability (PICP) and the prediction interval normalized average width (PINAW). Interval coverage is the most key indicators to measure wind power prediction effect, reflect the accuracy of forecasting model, the definition refers to the actual wind power value falls within the upper bound and lower bound envelope by the prediction interval of probability, the greater the PICP, represent the actual wind power value of the fall in the corresponding prediction interval, interval prediction effect is better, the smaller PICP value is, the more actual wind power value is not within the prediction range, and the worse the prediction effect is. The width of the forecast interval can be used to evaluate the quality of the forecast interval from another perspective. In other words, the mean width of the interval (PINAW) is to measure the interval width obtained by the forecast interval. Its mathematical to calculate the mean of all the interval widths over the forecast period.
With the calculation formulas in the following:
where,
is the total number of samples,
is the actual photovoltaic power,
is the lower bound of prediction, and
is the upper bound of prediction.
Usually, the performance evaluation index of interval prediction is PICP. If the limit value of the target value is used as the upper and lower boundaries of the prediction interval, 100% PICP can be easily achieved. Too wide the interval leads to an increase in the uncertainty of the forecast results, reduces the instruction of the forecast results for system scheduling, and loses decision-making value. Therefore, it is necessary to quantitatively evaluate the width of the forecast interval [
24].
where,
is the variation range of the target value, and using of
can ensure that
is normalized in
.
5. Conclusions
Aiming at the problem of poor prediction accuracy of traditional photovoltaic power prediction models during non-stationary periods of photovoltaic output, this paper proposes an ensemble probability prediction (MLBN) model based on multi-objective optimization, the conclusions are as the follows:
- (1)
The model combines with data preprocessing, non-stationary period discrimination, feature extraction, deterministic prediction, uncertainty prediction, and optimization integration modules to construct a difference in power ratio discrimination method and a Stack-LSTM point prediction model. The proposed MLBN model combines mainstream deterministic forecasting models and interval forecasting models, fusing point forecasting and interval forecasting, and performing multi-objective optimization on two different forms of forecasting results.
- (2)
After improving the prediction in this article, the prediction accuracy of the Stack-LSTM model is 20% higher than that of the original LSTM model, and compared with the traditional ANN network, the accuracy is improved by nearly 30%, verifying the feasibility and practicality of the model constructed in this article.
- (3)
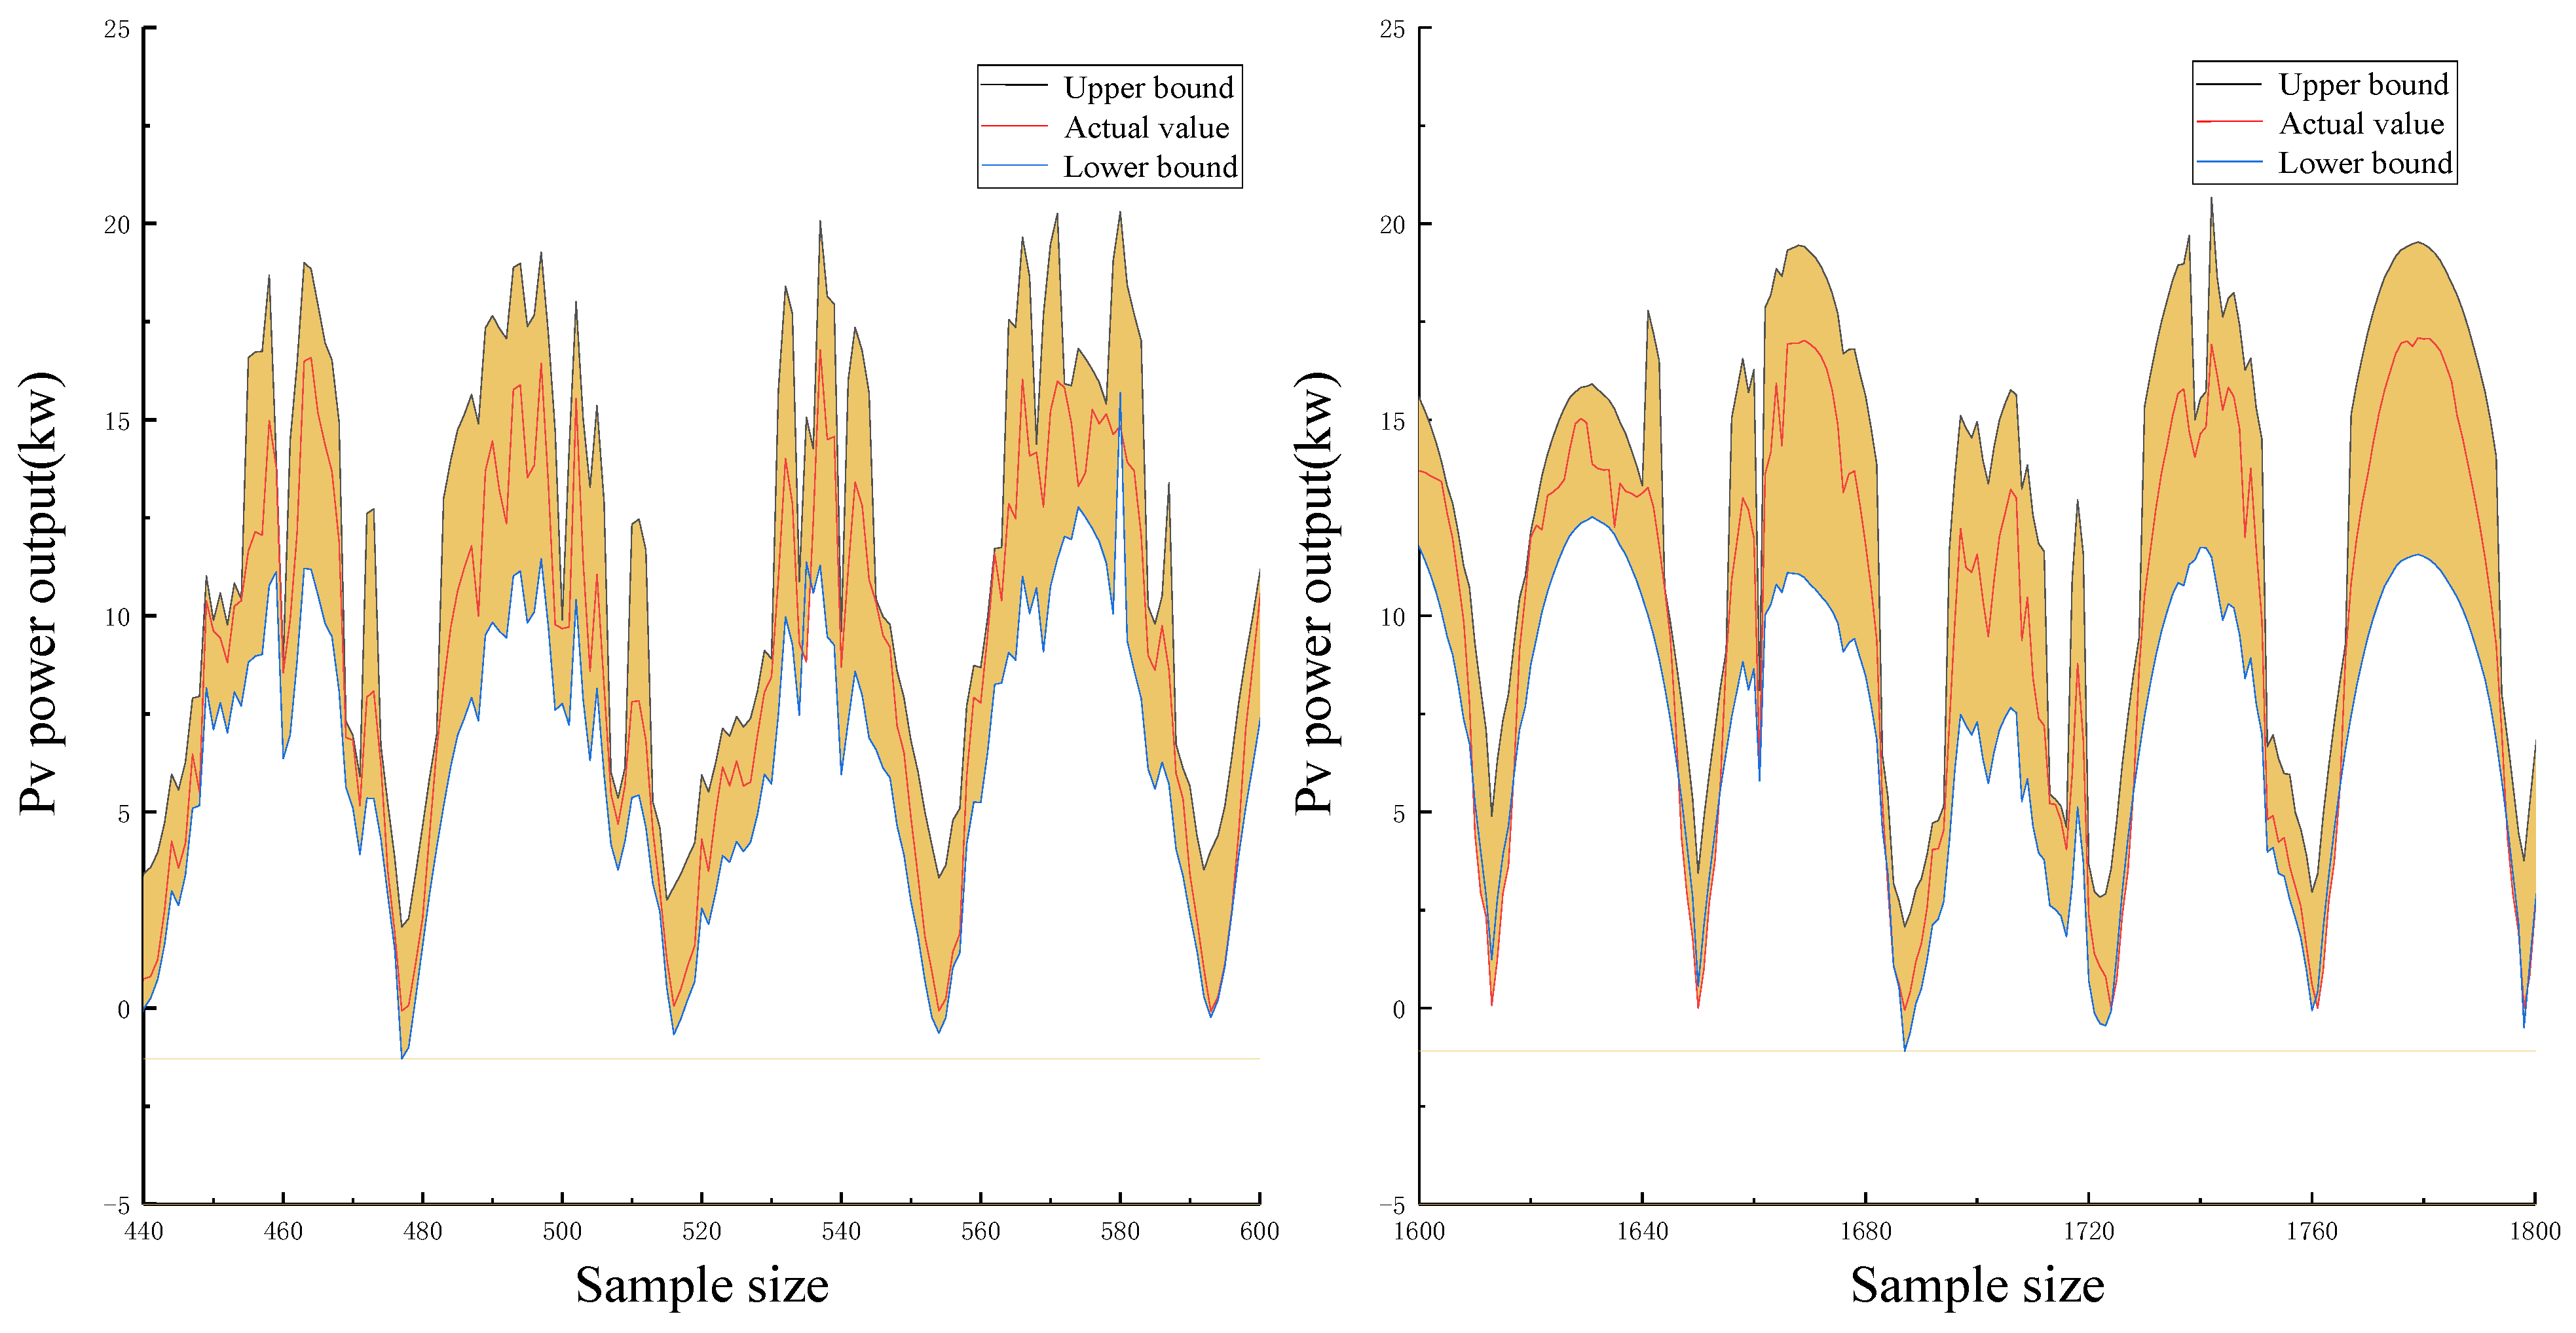
Under the PICP of 85%, 90% and 95%, the interval forecast can predict the possible output of this point as far as possible in the non-stationary output period, which enables the dispatching system to timely adjust the dispatching strategy and ensure the safe and stable operation of the power grid to the greatest extent.
- (4)
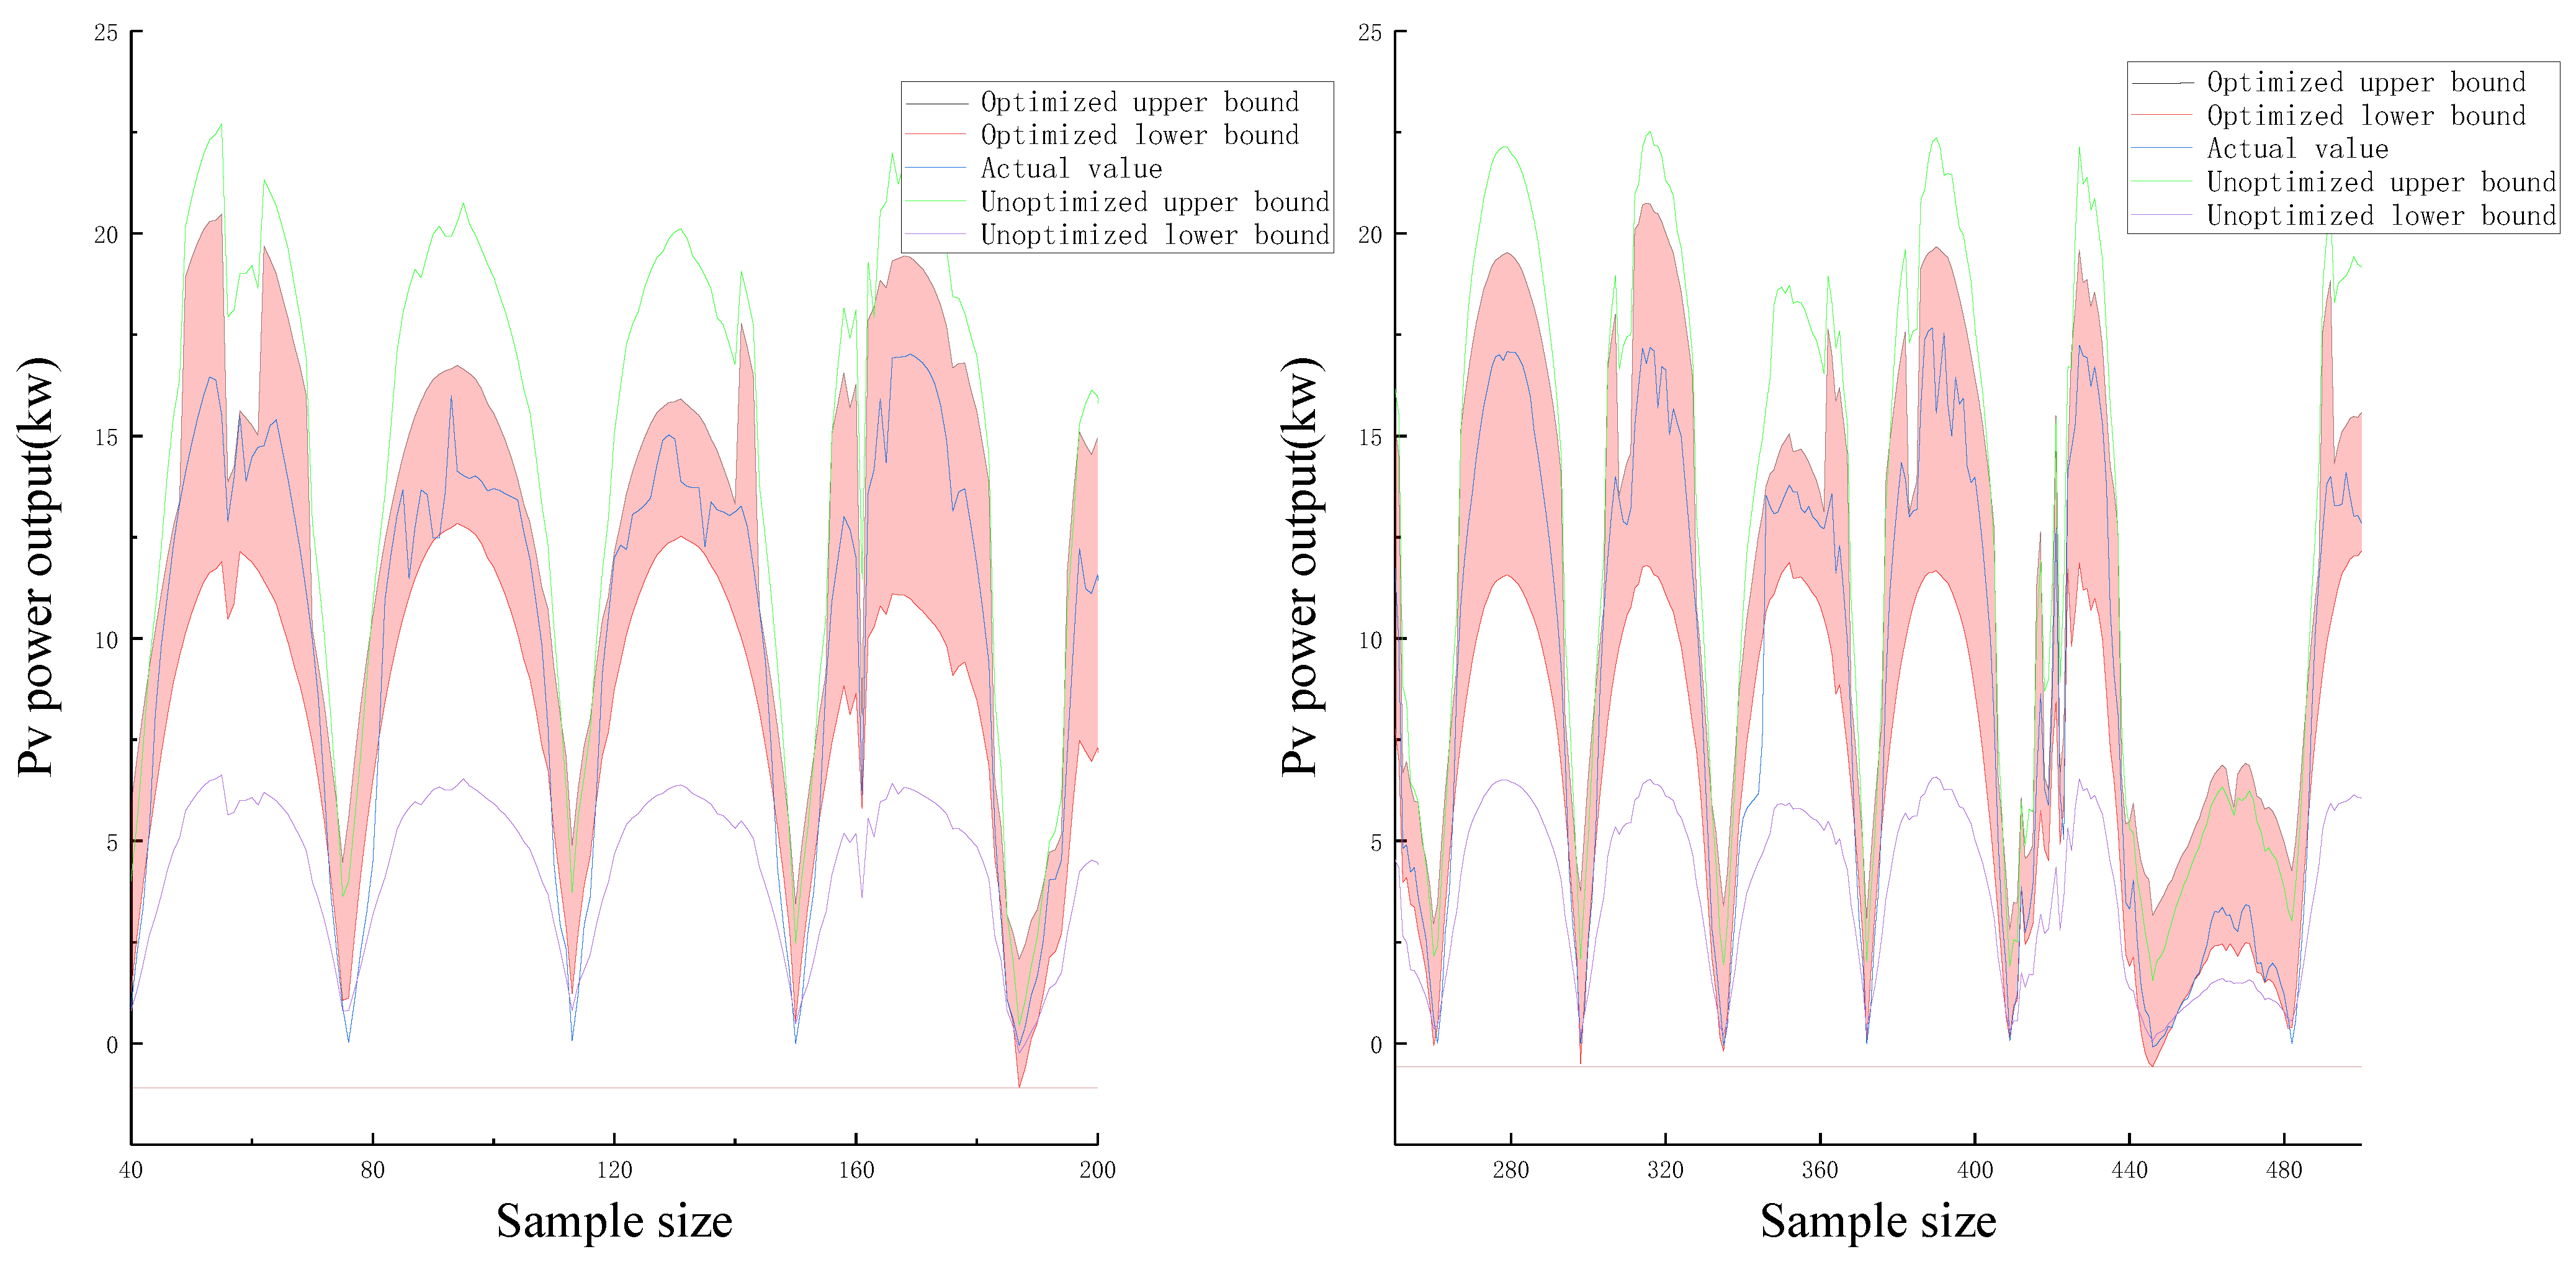
Compared with the unoptimized prediction model, the interval width is reduced by 10–20% and the prediction accuracy is improved by at least 10% under the uniform interval coverage, which significantly improves the prediction accuracy of photovoltaic power prediction and verifies the feasibility of the proposed method.
The novelty of the work relies on combining point prediction and interval prediction, focusing on interval prediction. The results show that the MLBN model can significantly improve the prediction accuracy of photovoltaic power prediction, which can greatly facilitate grid planning, risk analysis and reliability evaluation. At the same time, accurate photovoltaic power forecast can carry out effective scheduling and scientific management of photovoltaic power stations, improve the ability of power grid to accept photoelectricity, guide the deficiency elimination and planned maintenance of photovoltaic power stations, and improve the operation economy of photovoltaic power stations. And this model has great benefits to promote the efficient planning of renewable energy system operations and smart grid systems in obtaining multiple energy sources.
In the further research, this article will try as follows. One is to well combine the deterministic prediction and uncertainty prediction models since this article to further increase the prediction accuracy; the second is to try to higher-level machine learning methods to study the prediction of photovoltaic power interval in the whole climate field, increase the prediction duration, and improve the prediction accuracy.


