Long-Term Assessment of Onshore and Offshore Wind Energy Potentials of Qatar

 , , and
Abstract
1. Introduction
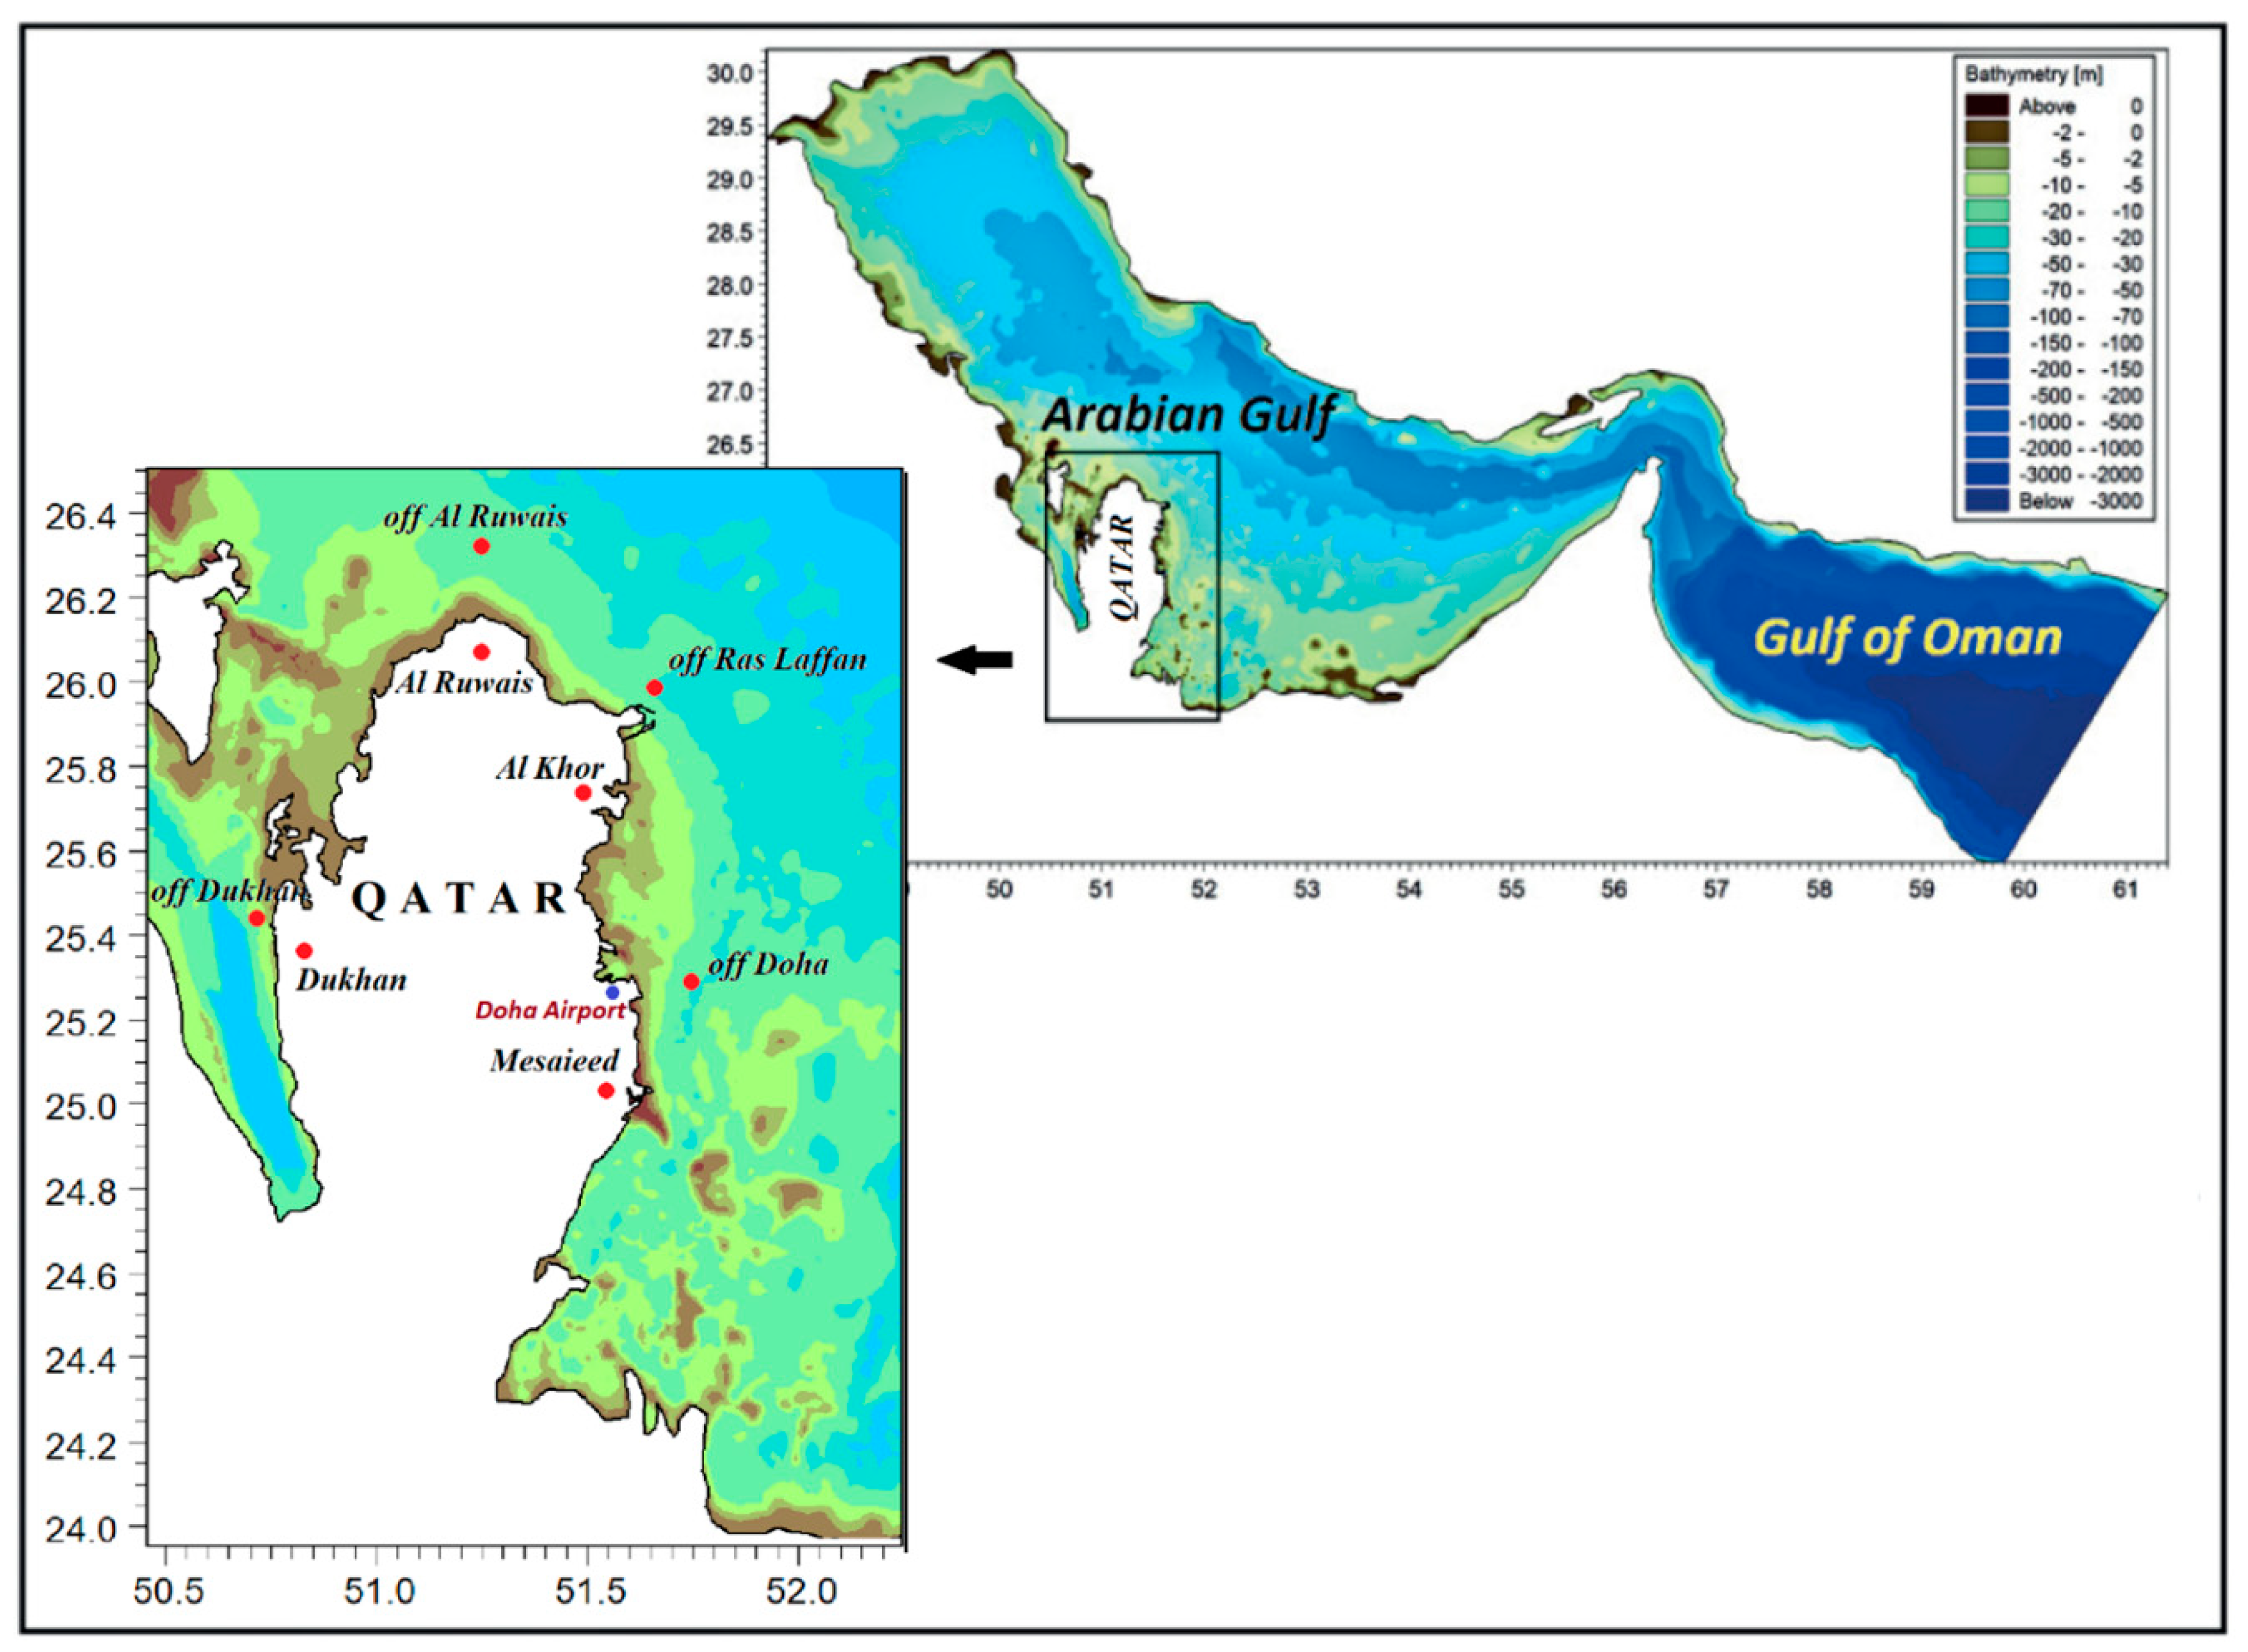
2. Area of Study
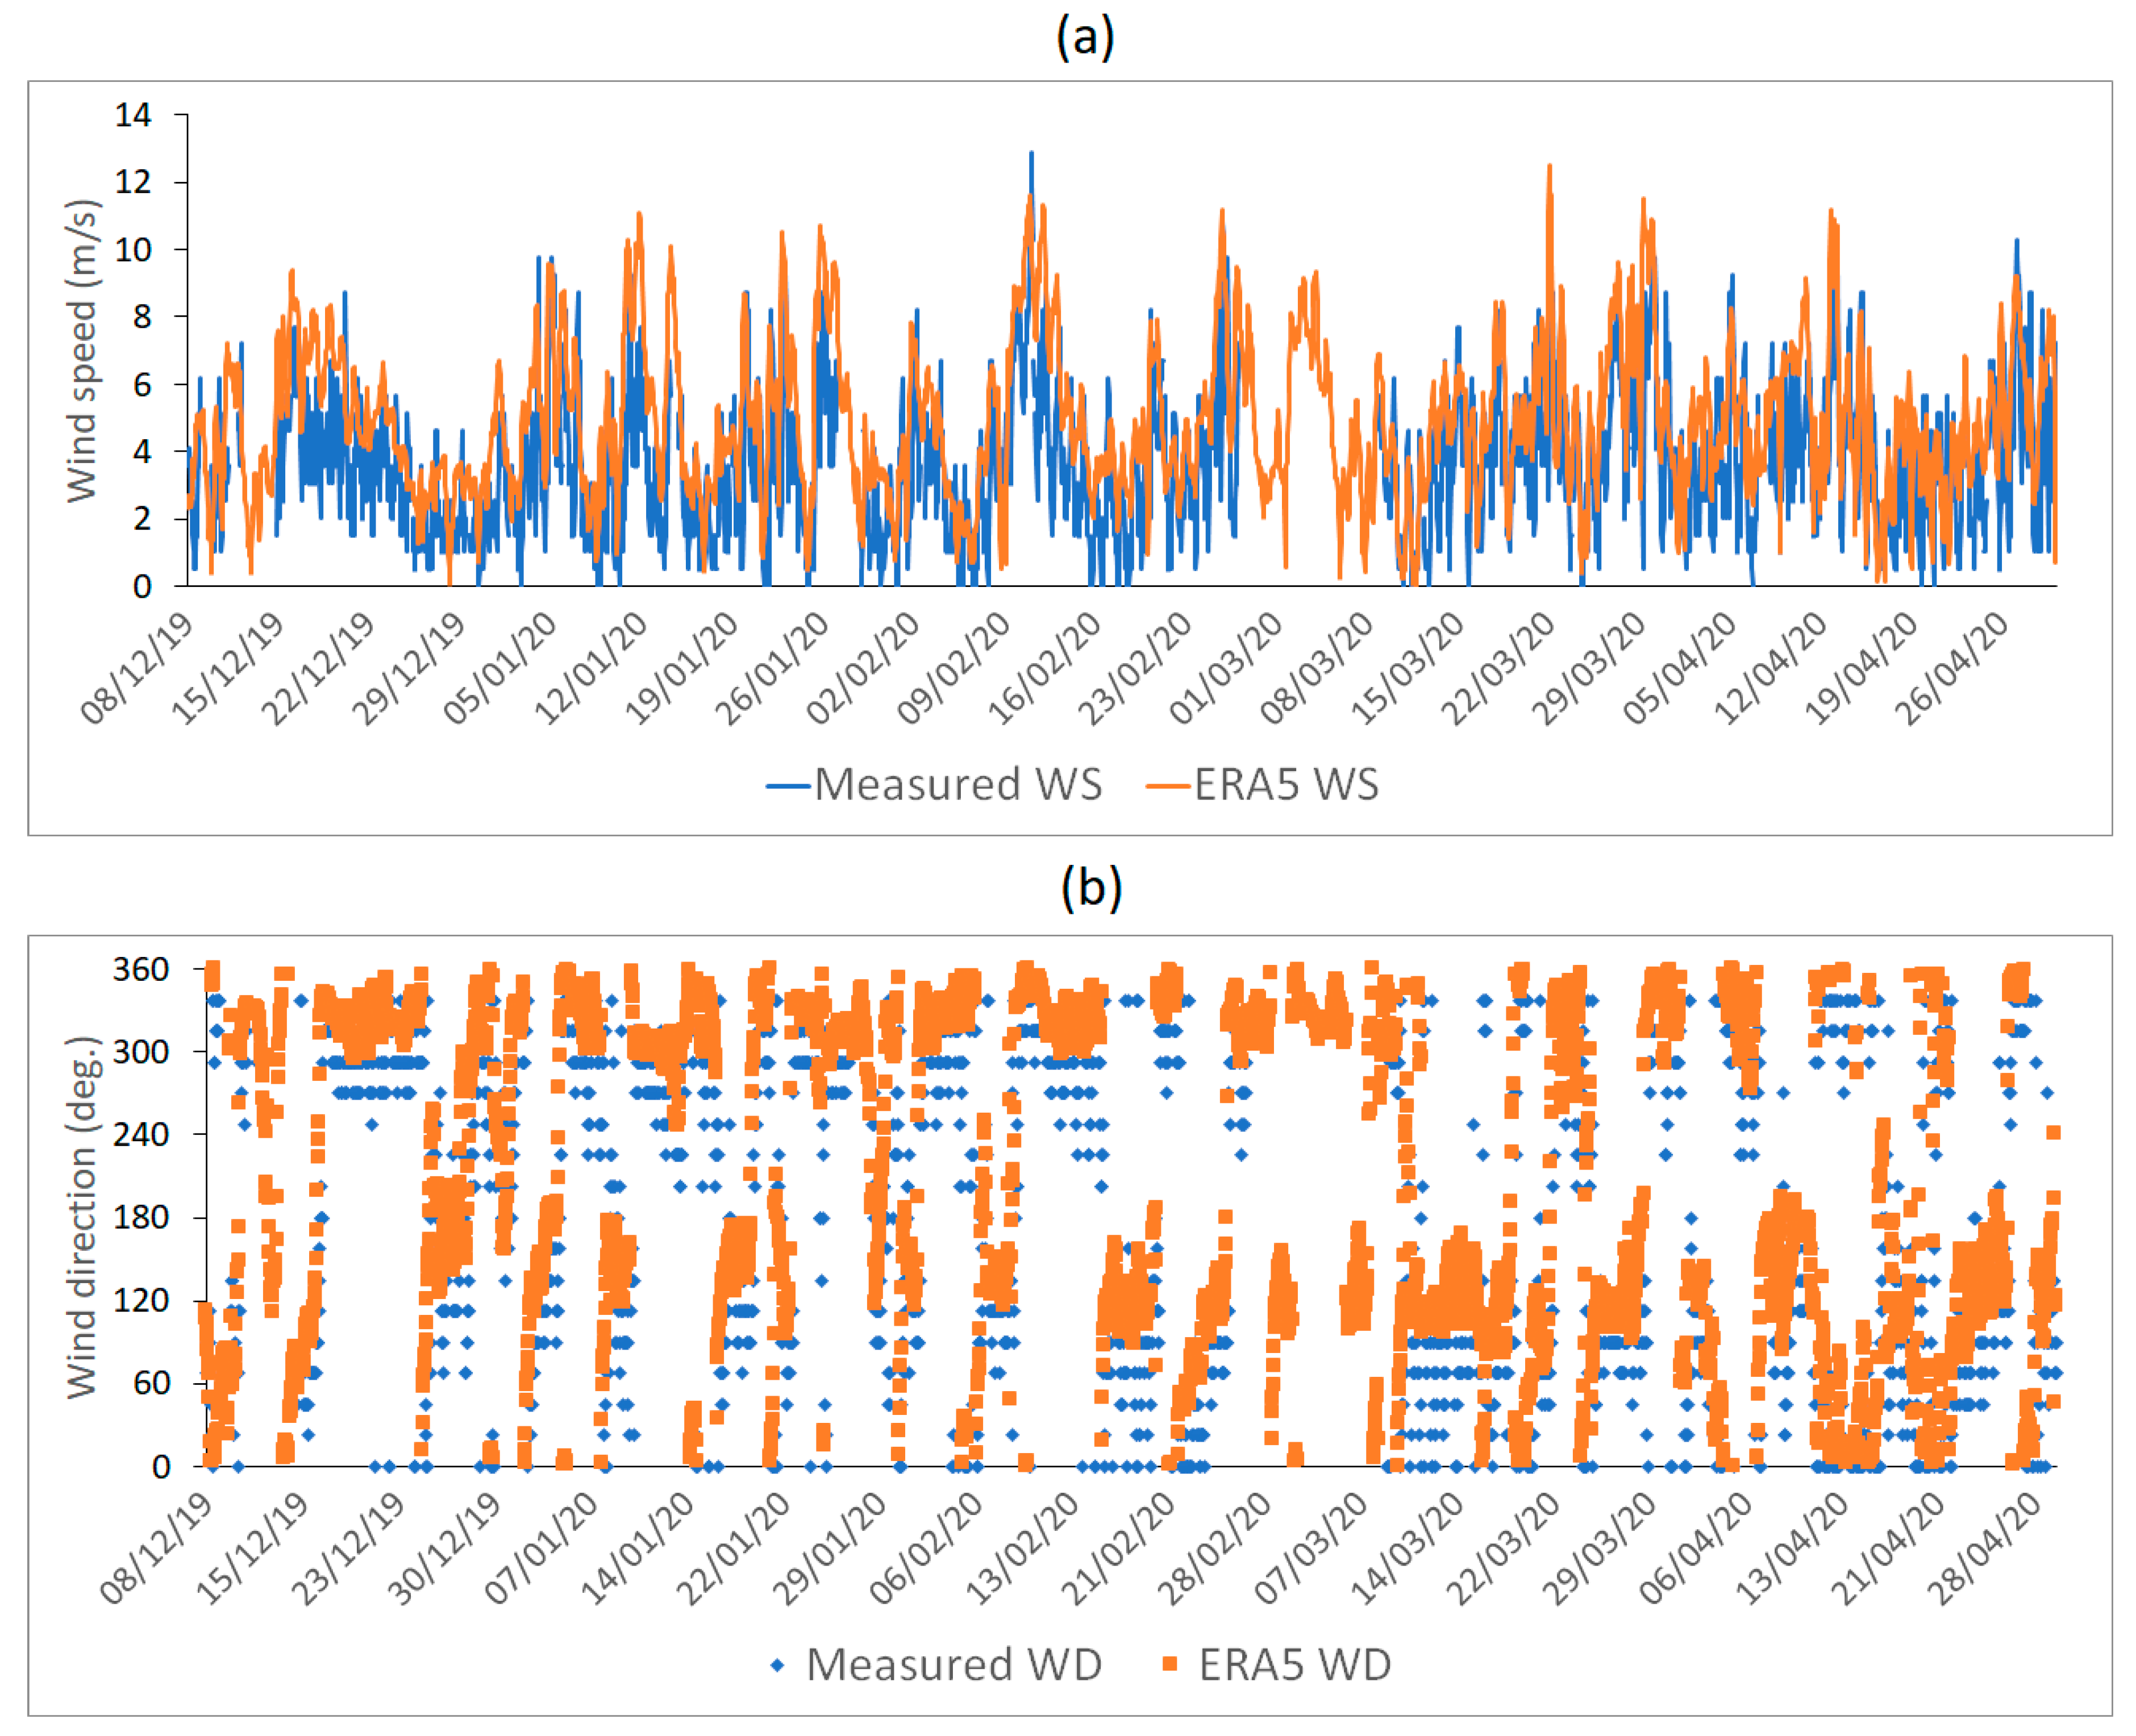
3. Data and Methods
4. Results and Discussion
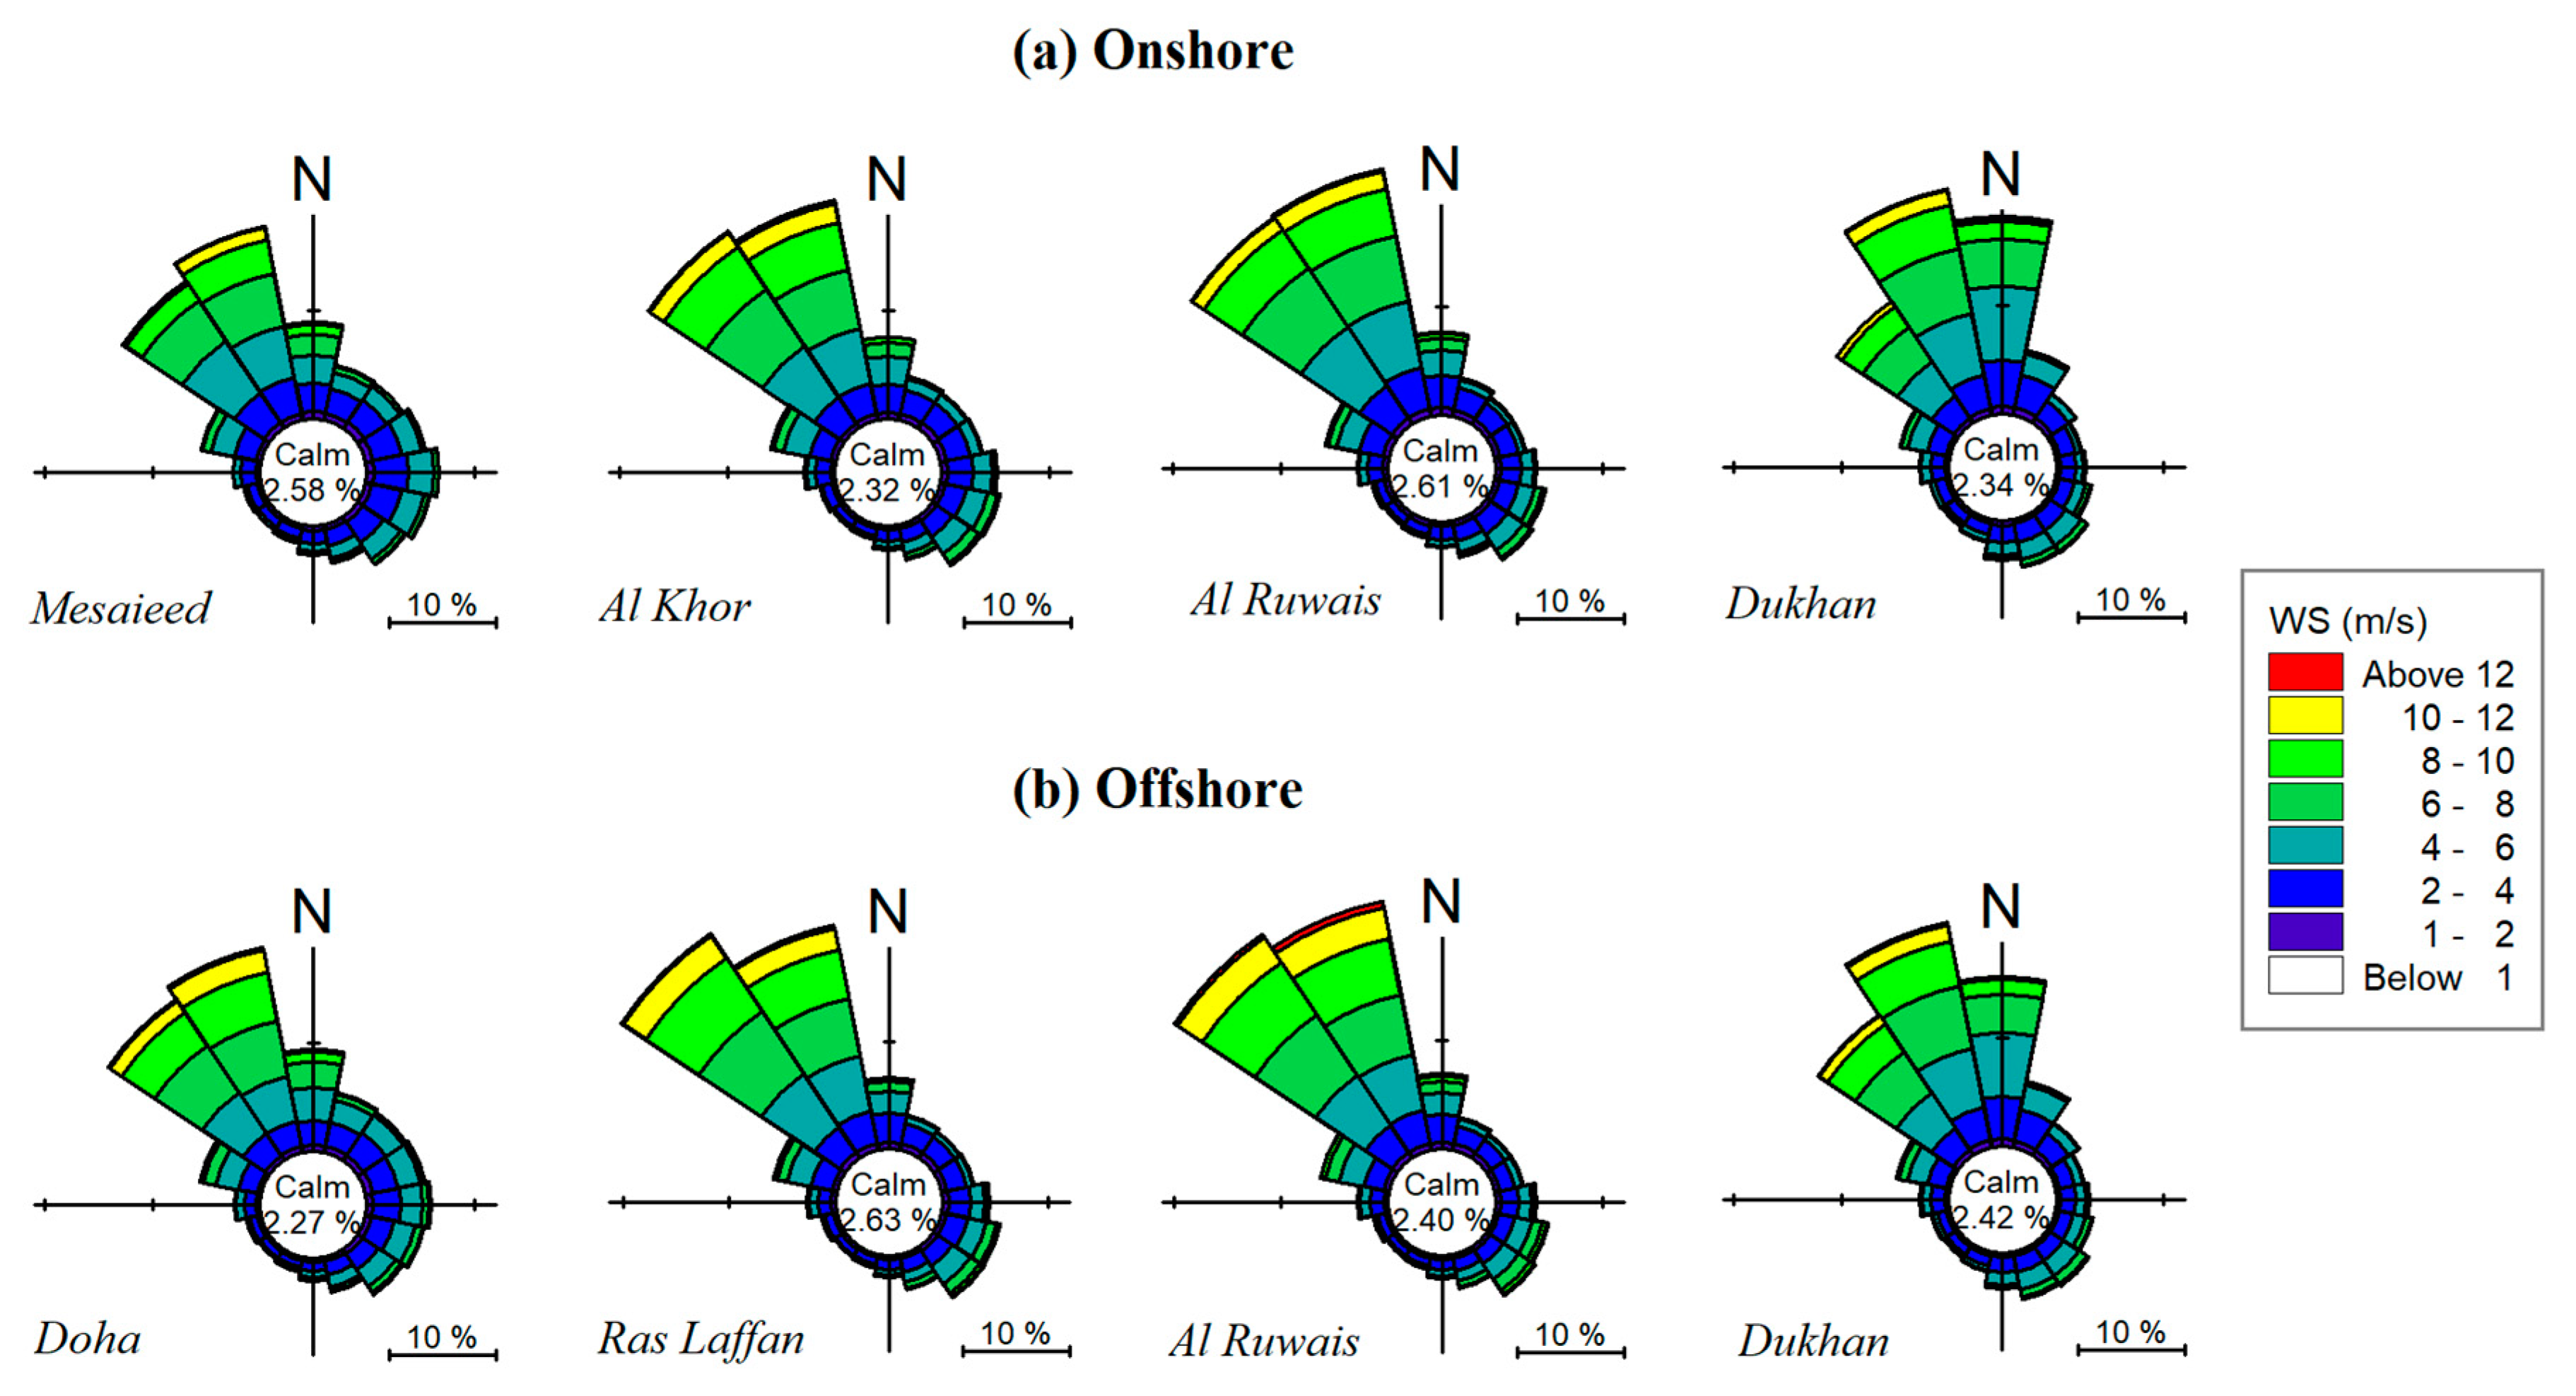
4.1. Wind Climate
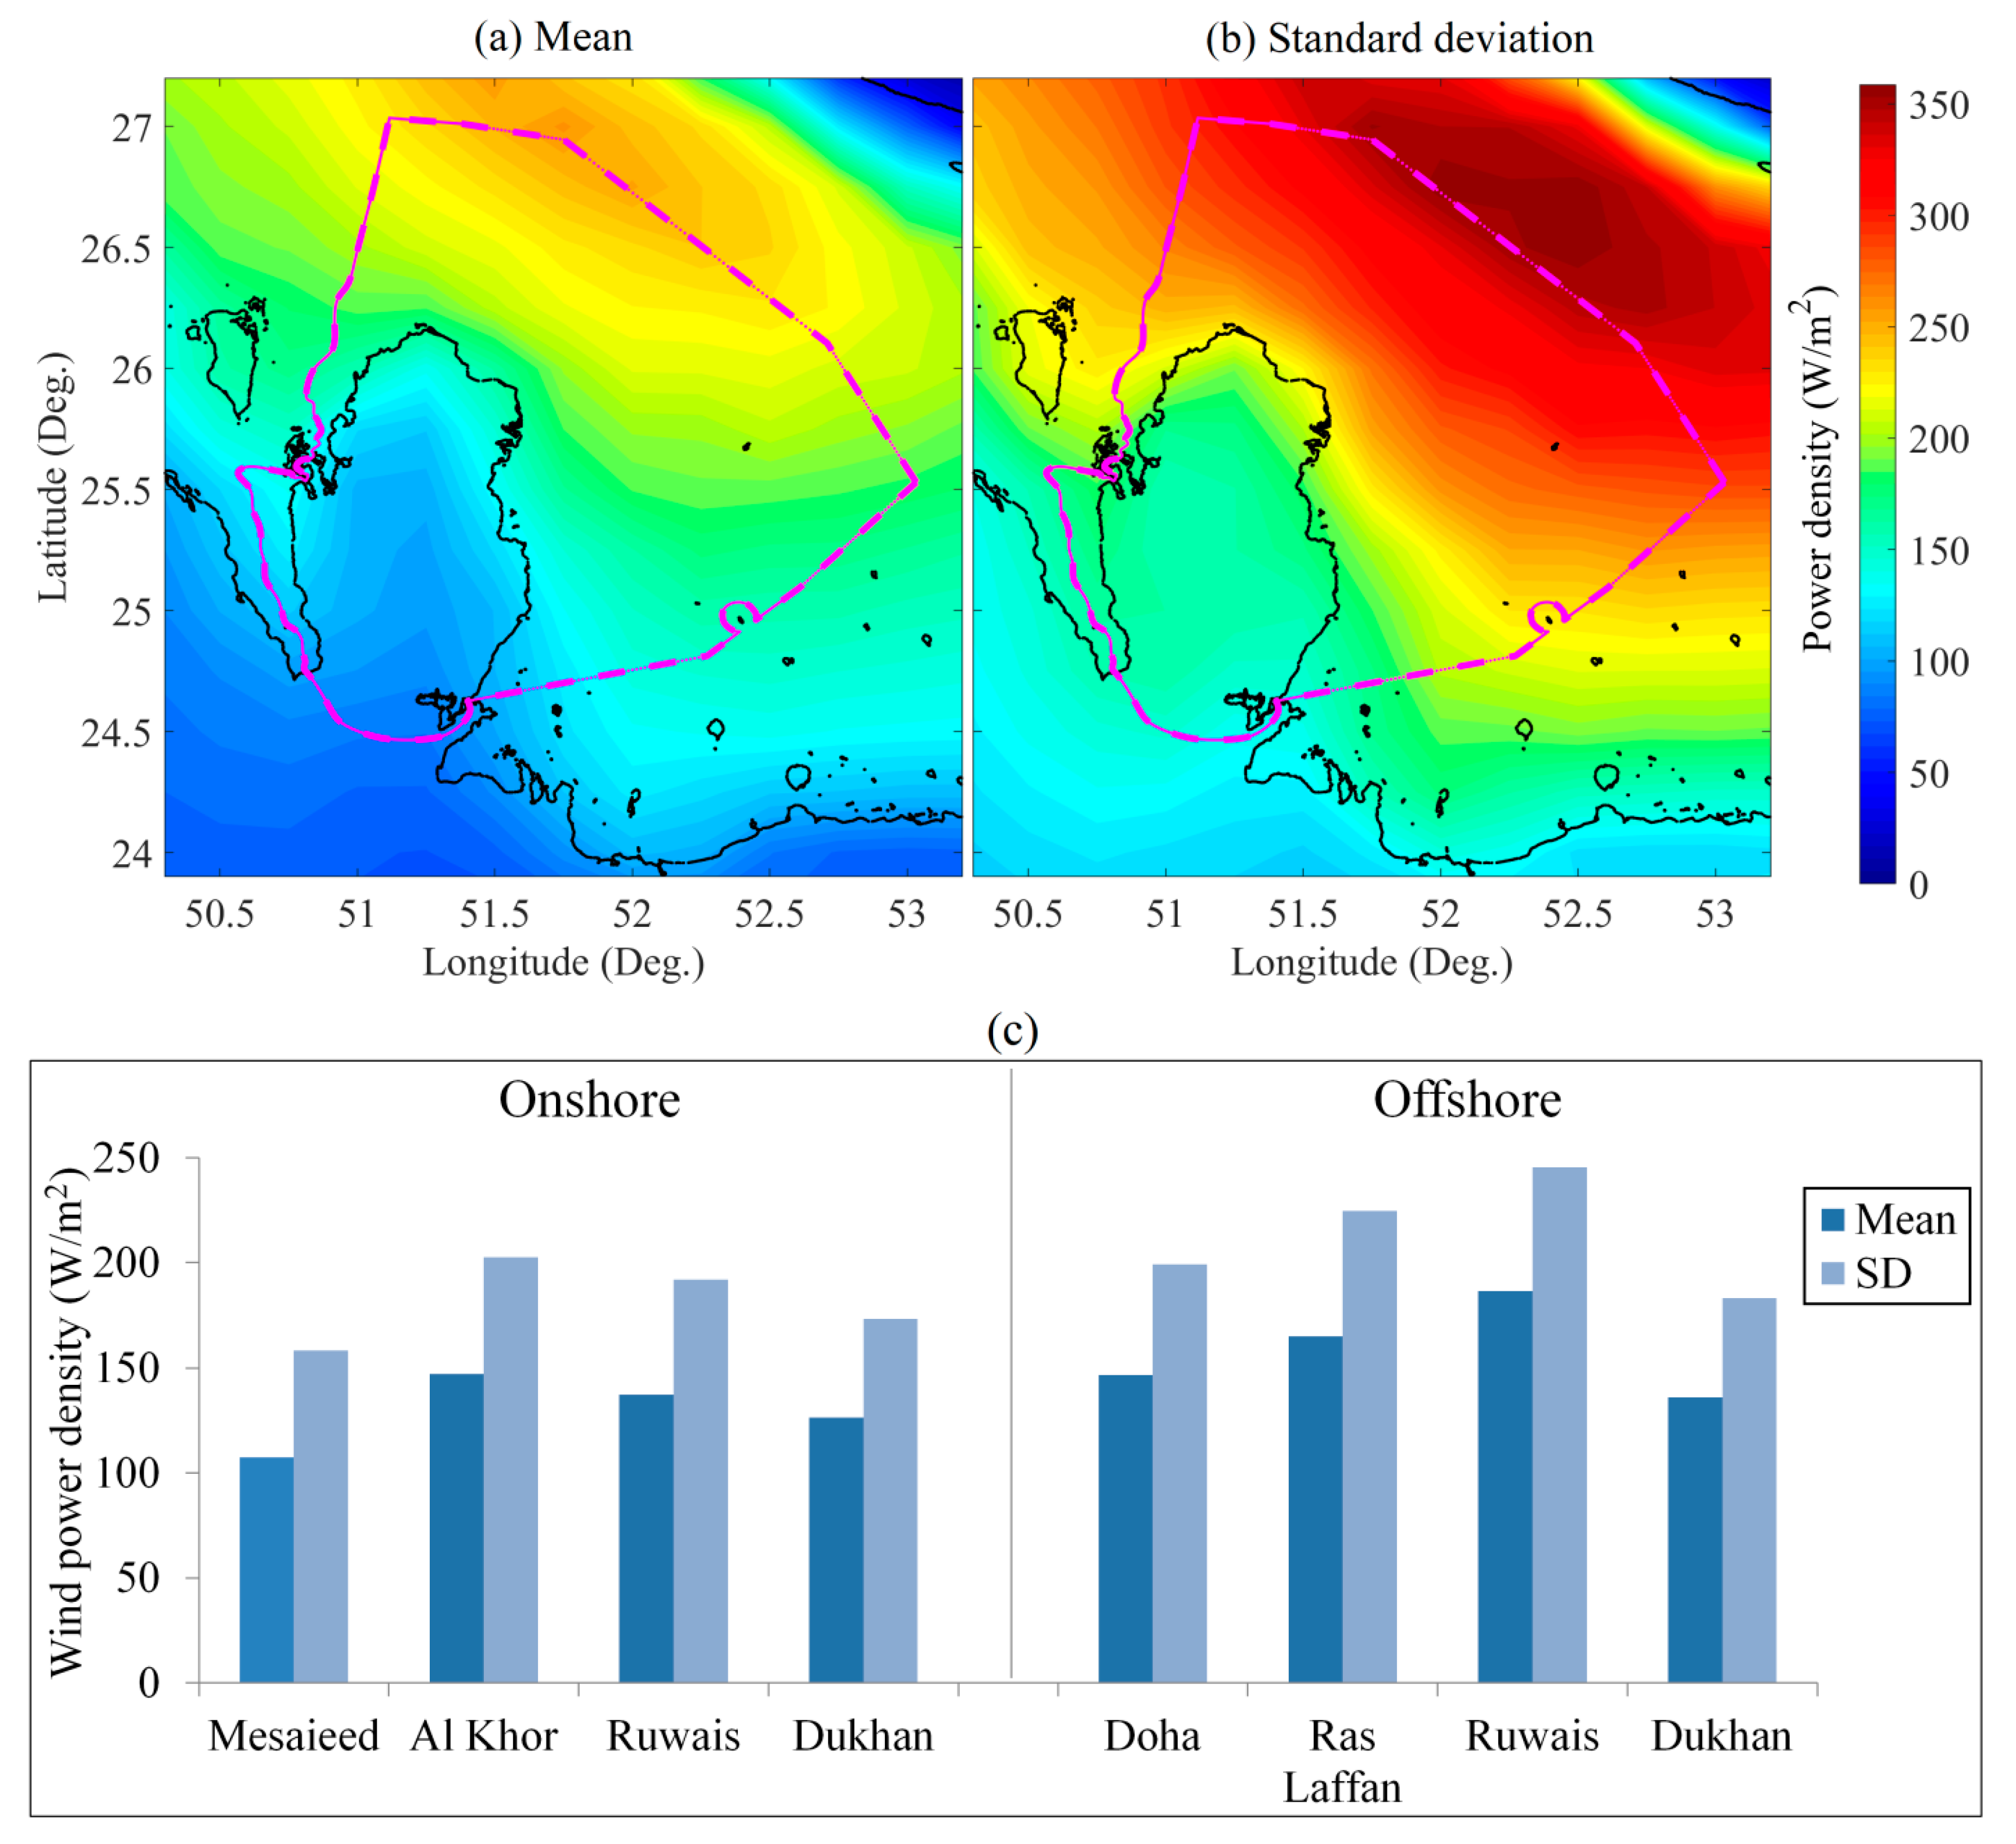
4.2. The Annual and Decadal Wind Power
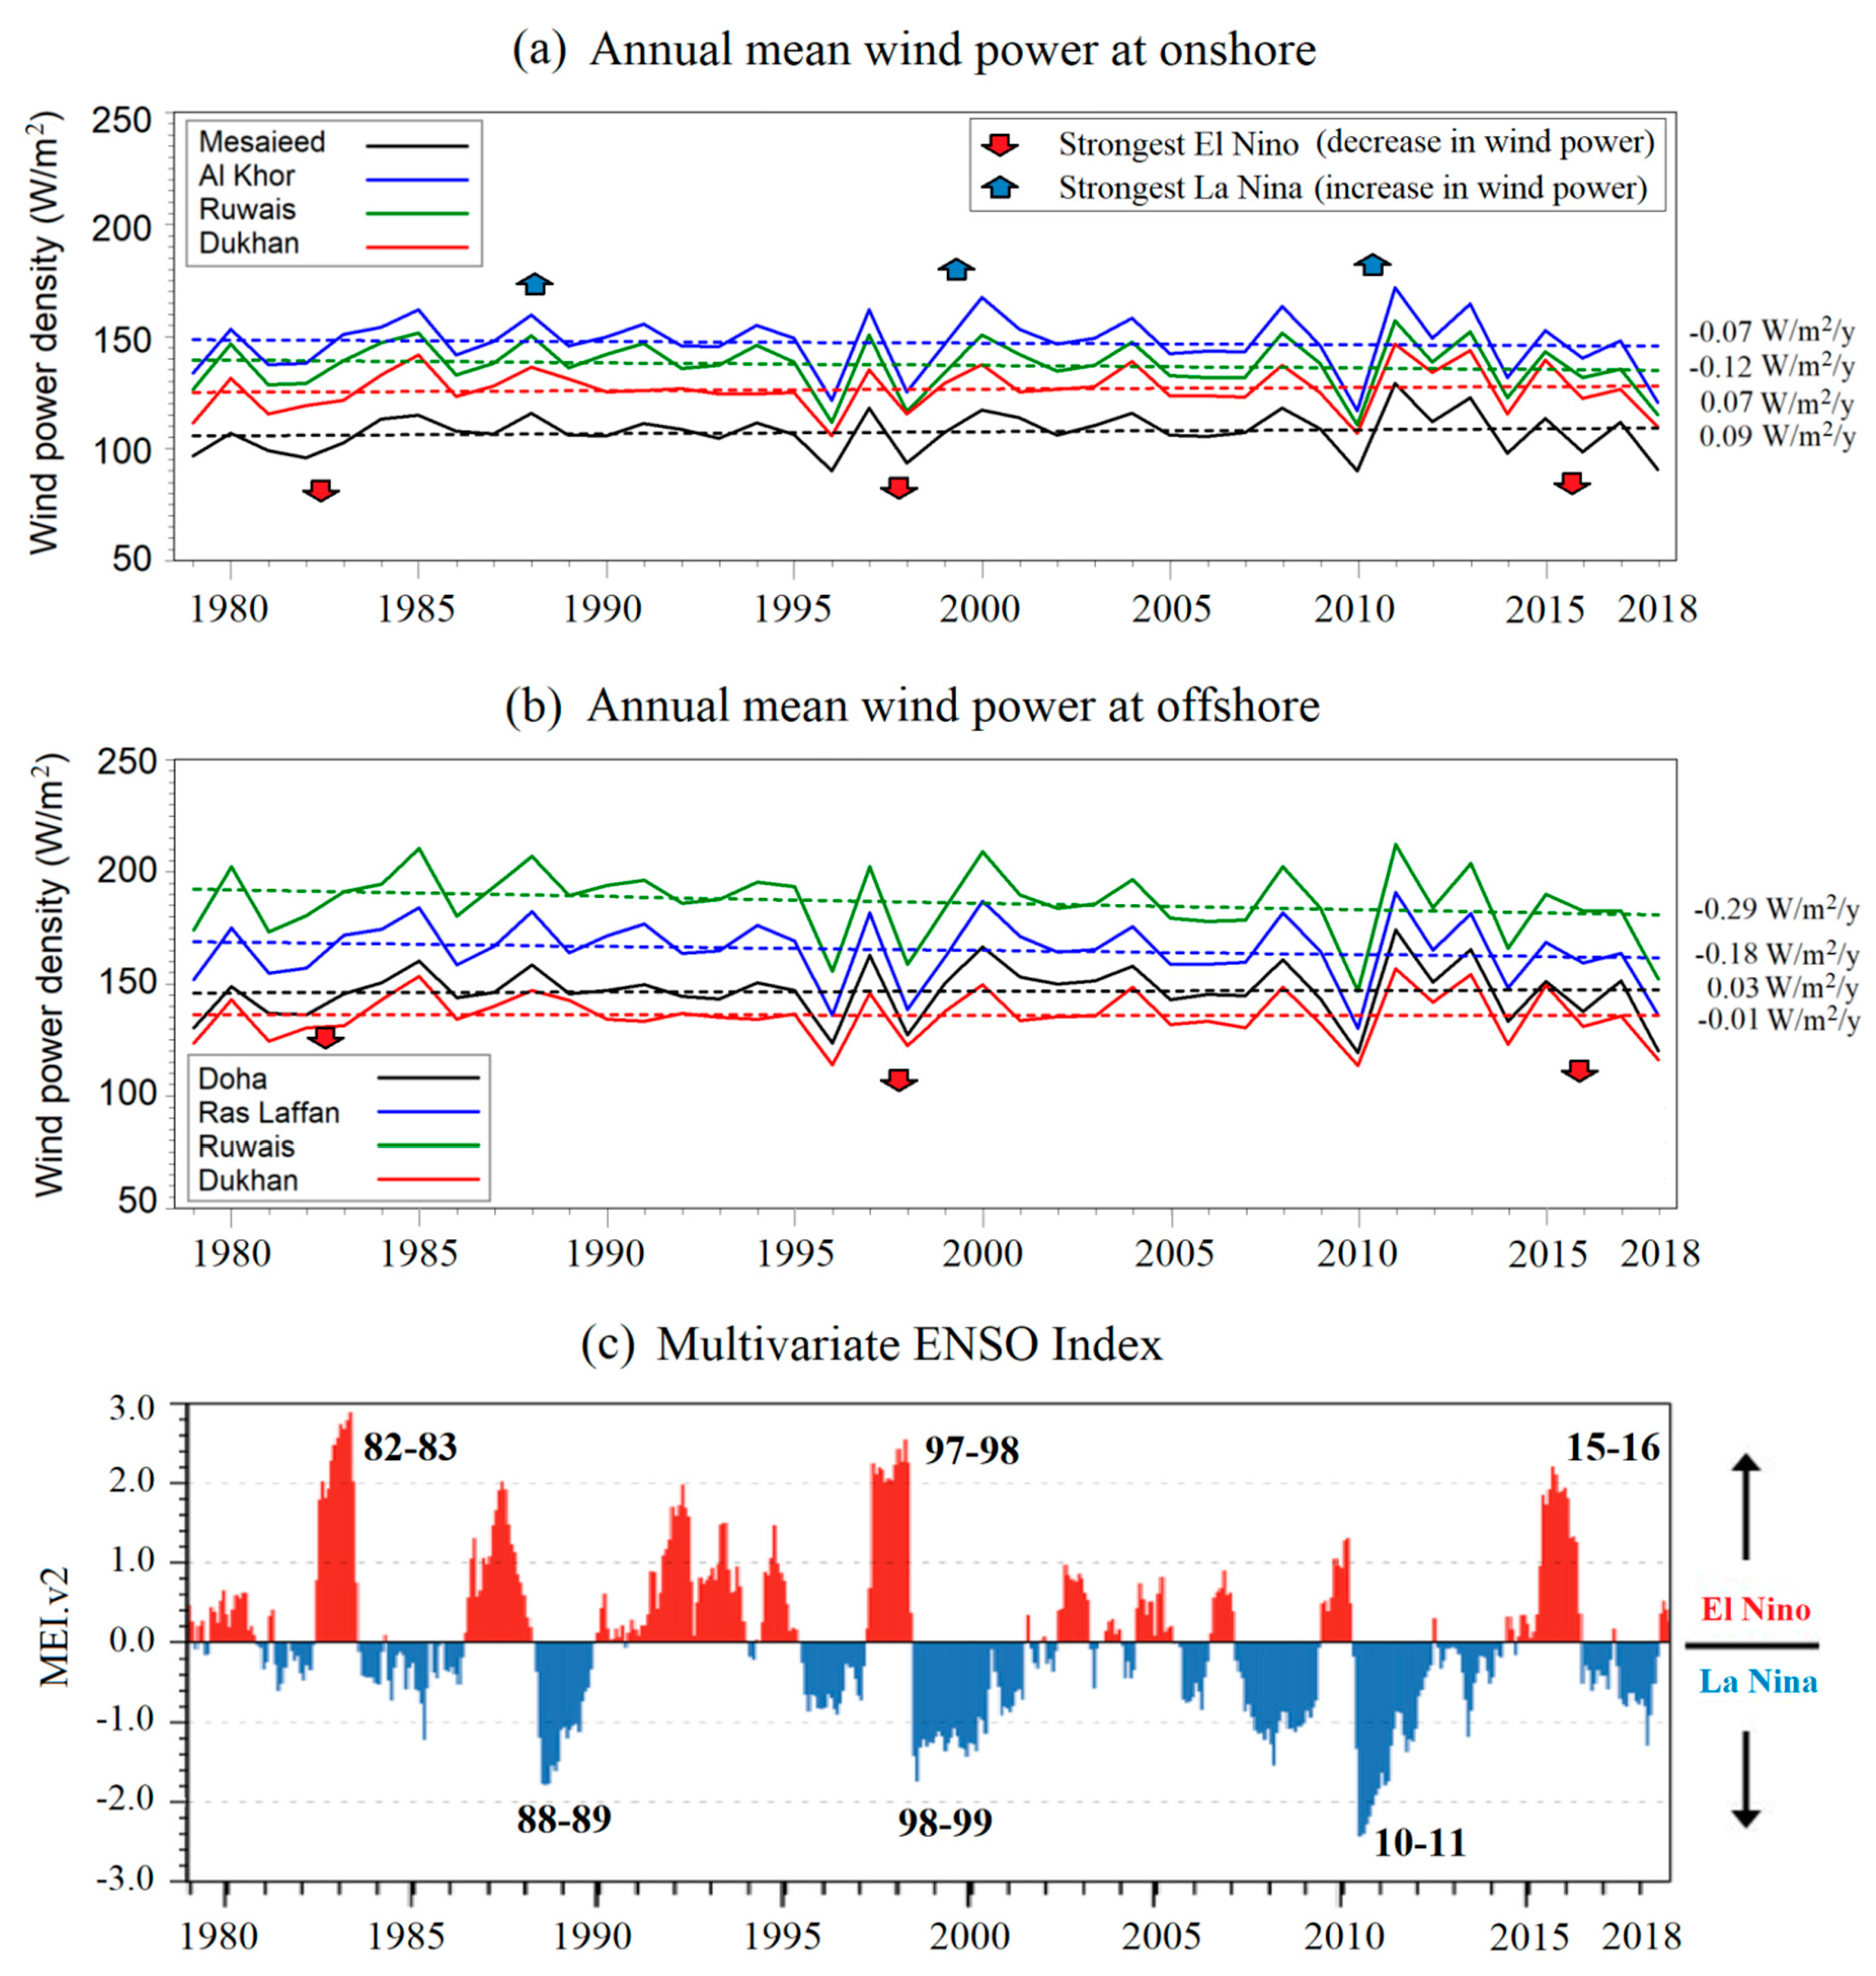
4.3. Inter-Annual Variability and Trends
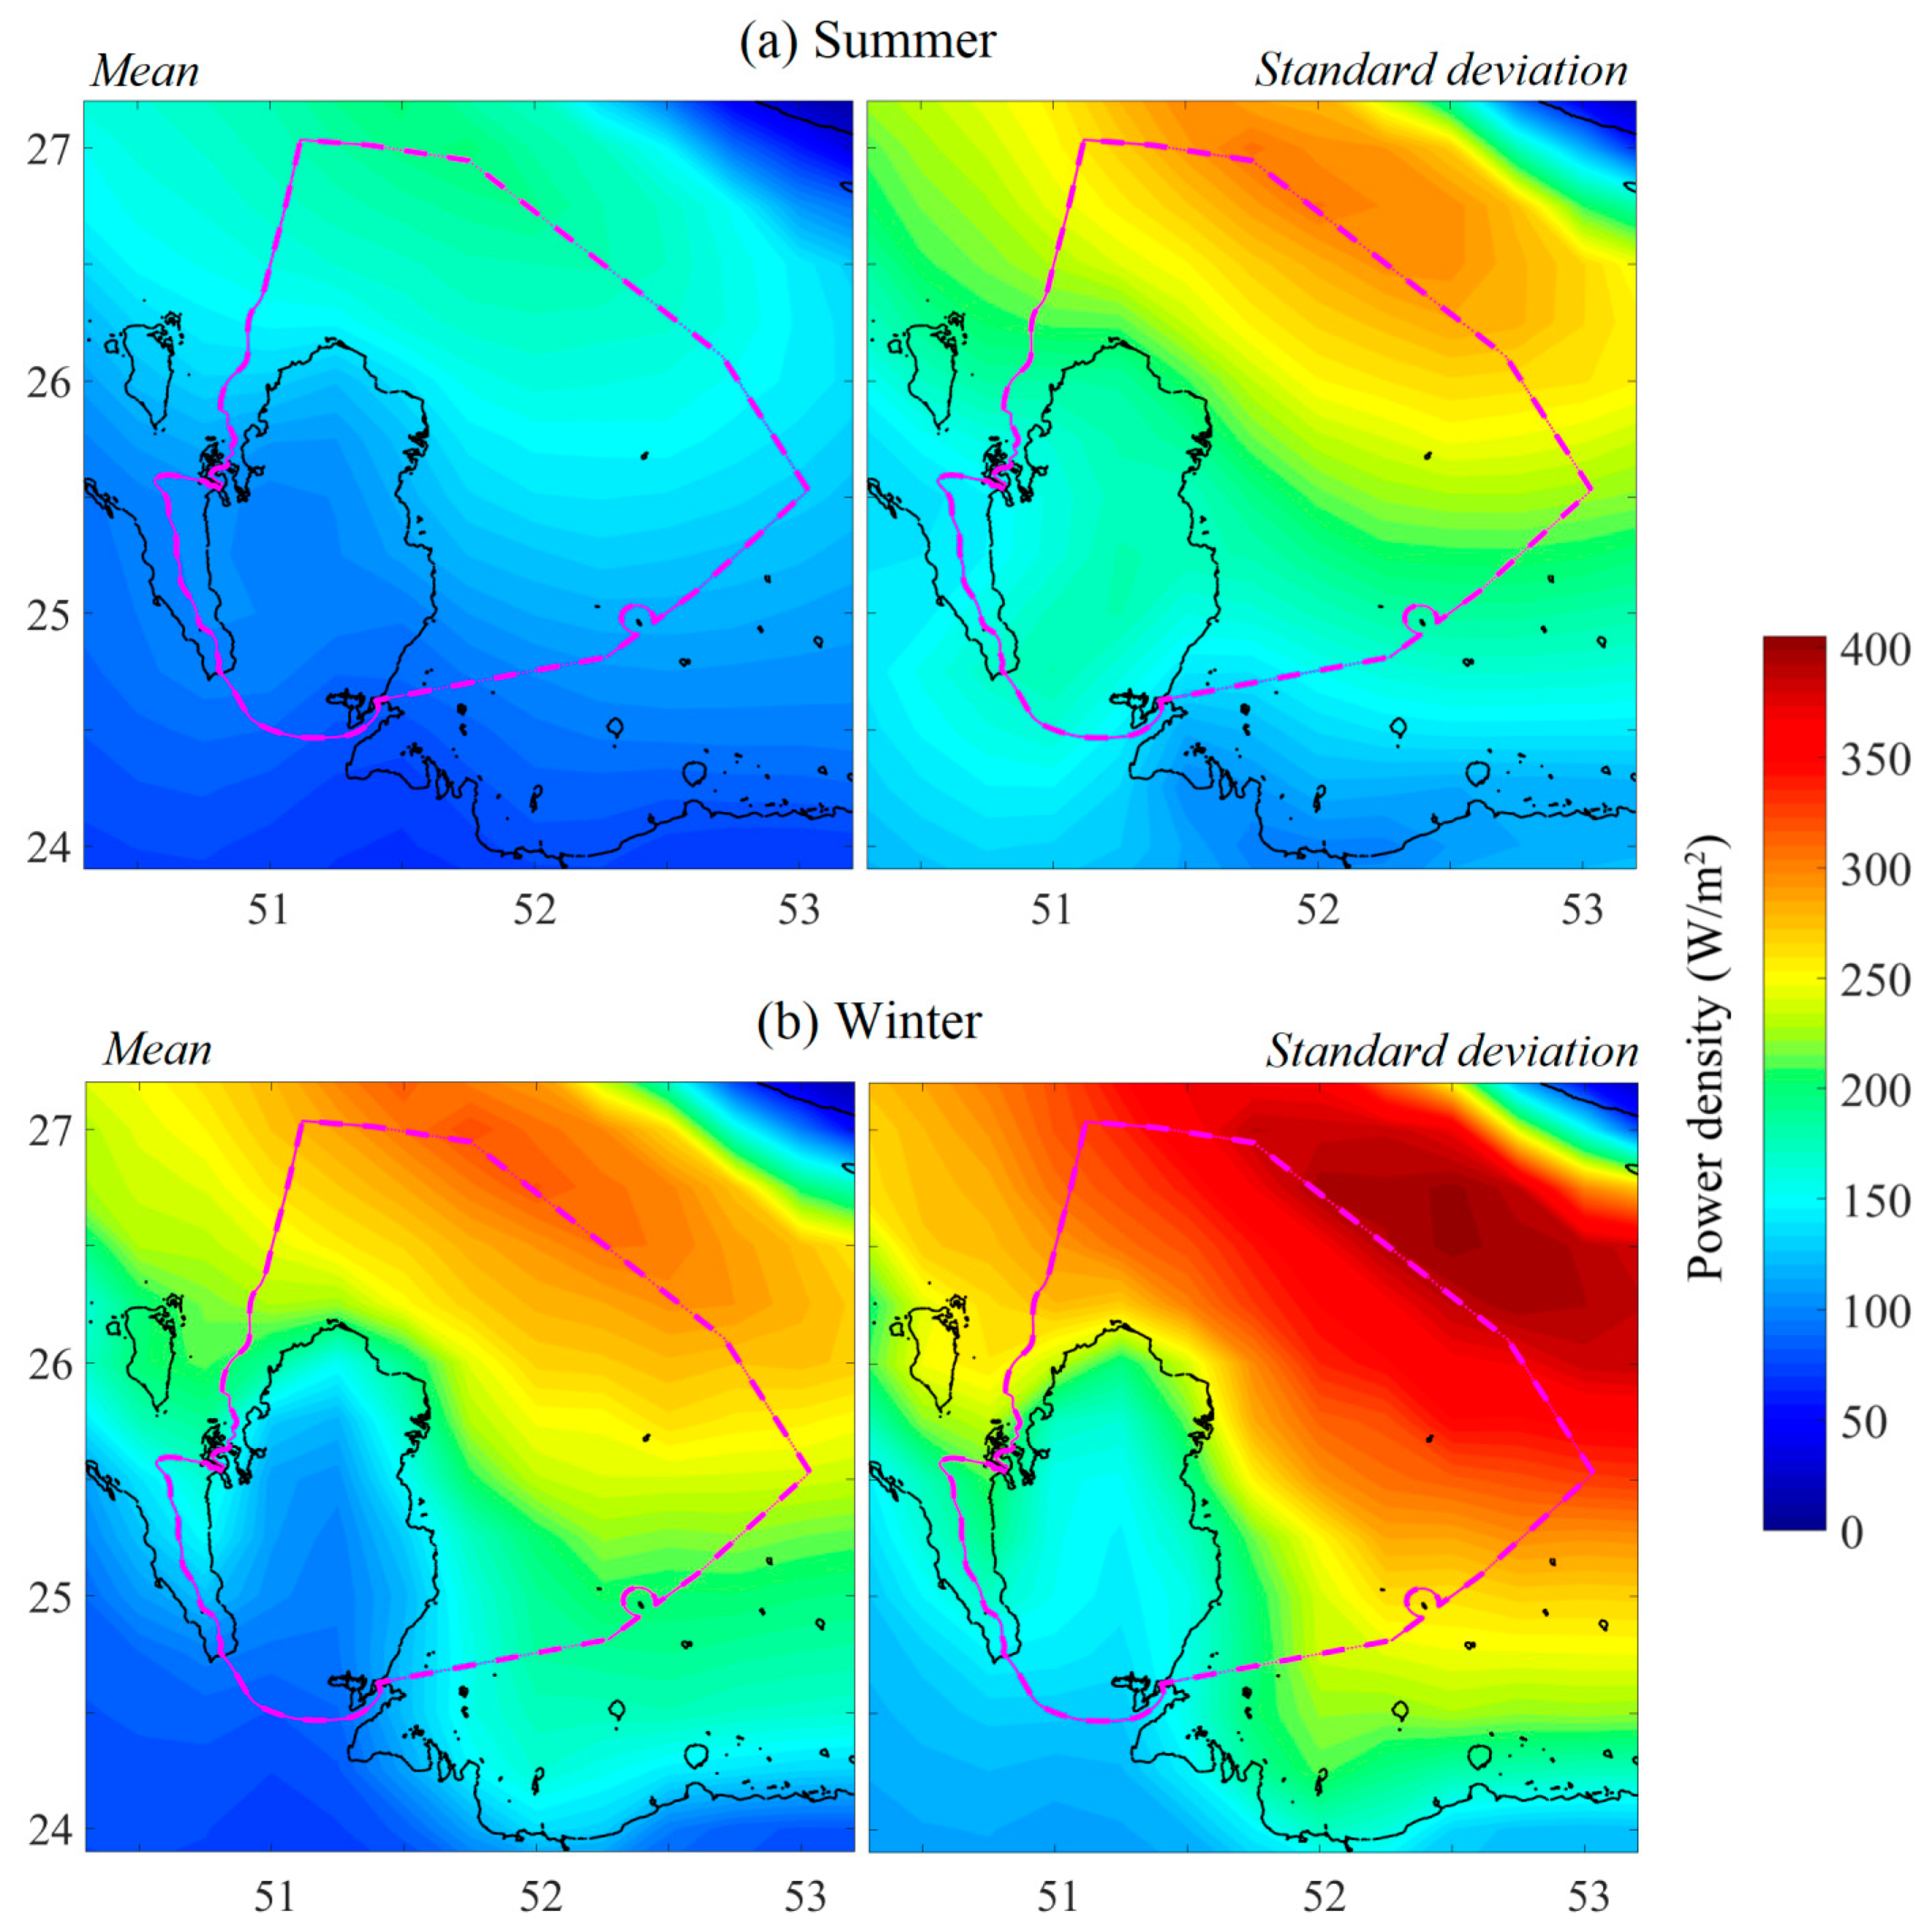
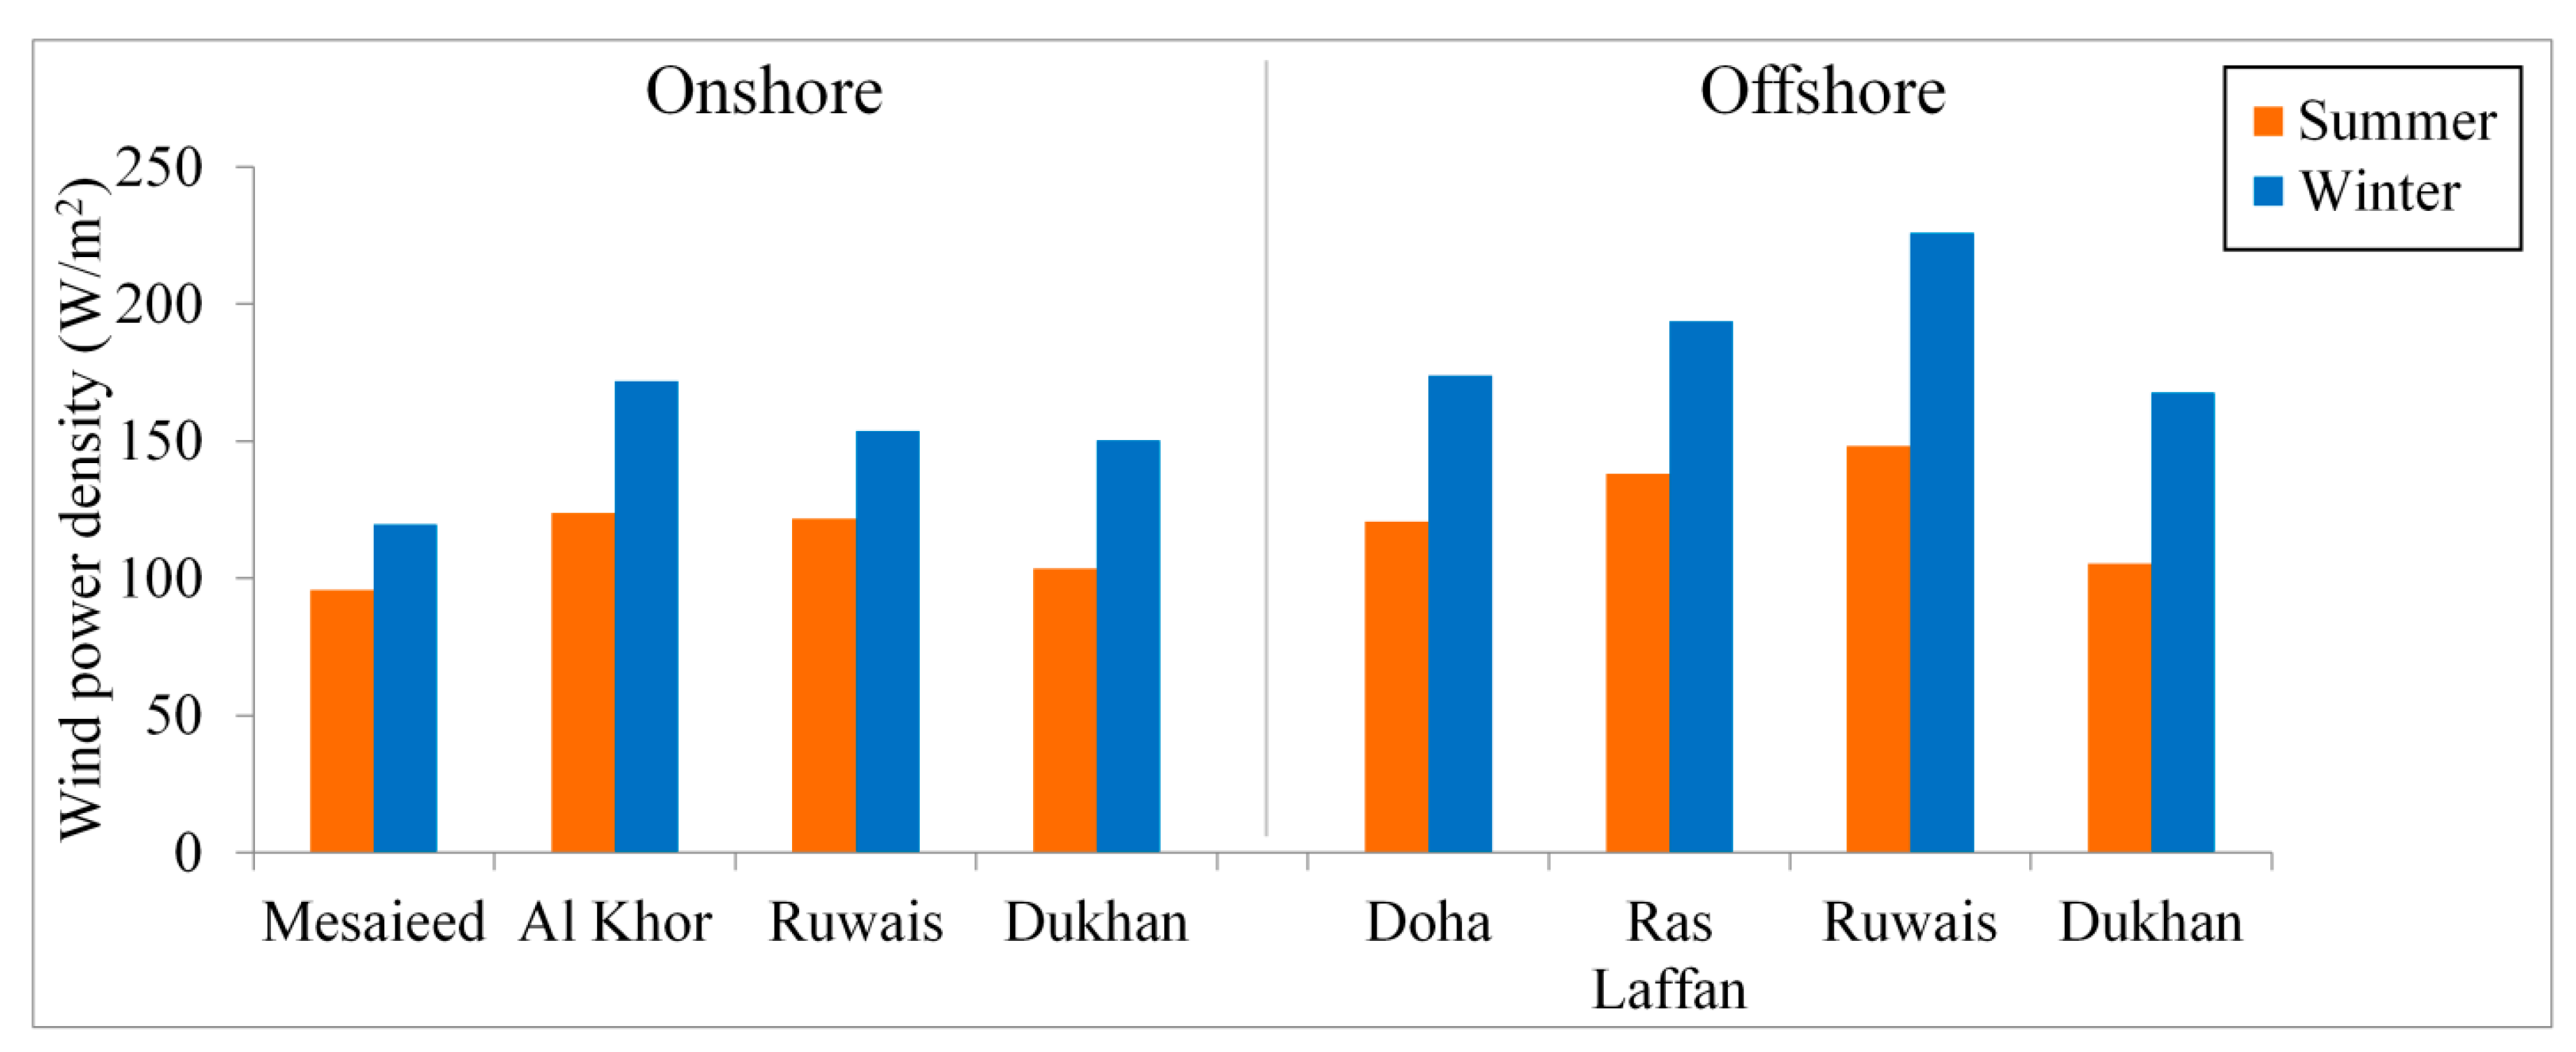
4.4. Seasonal Mean Wind Power
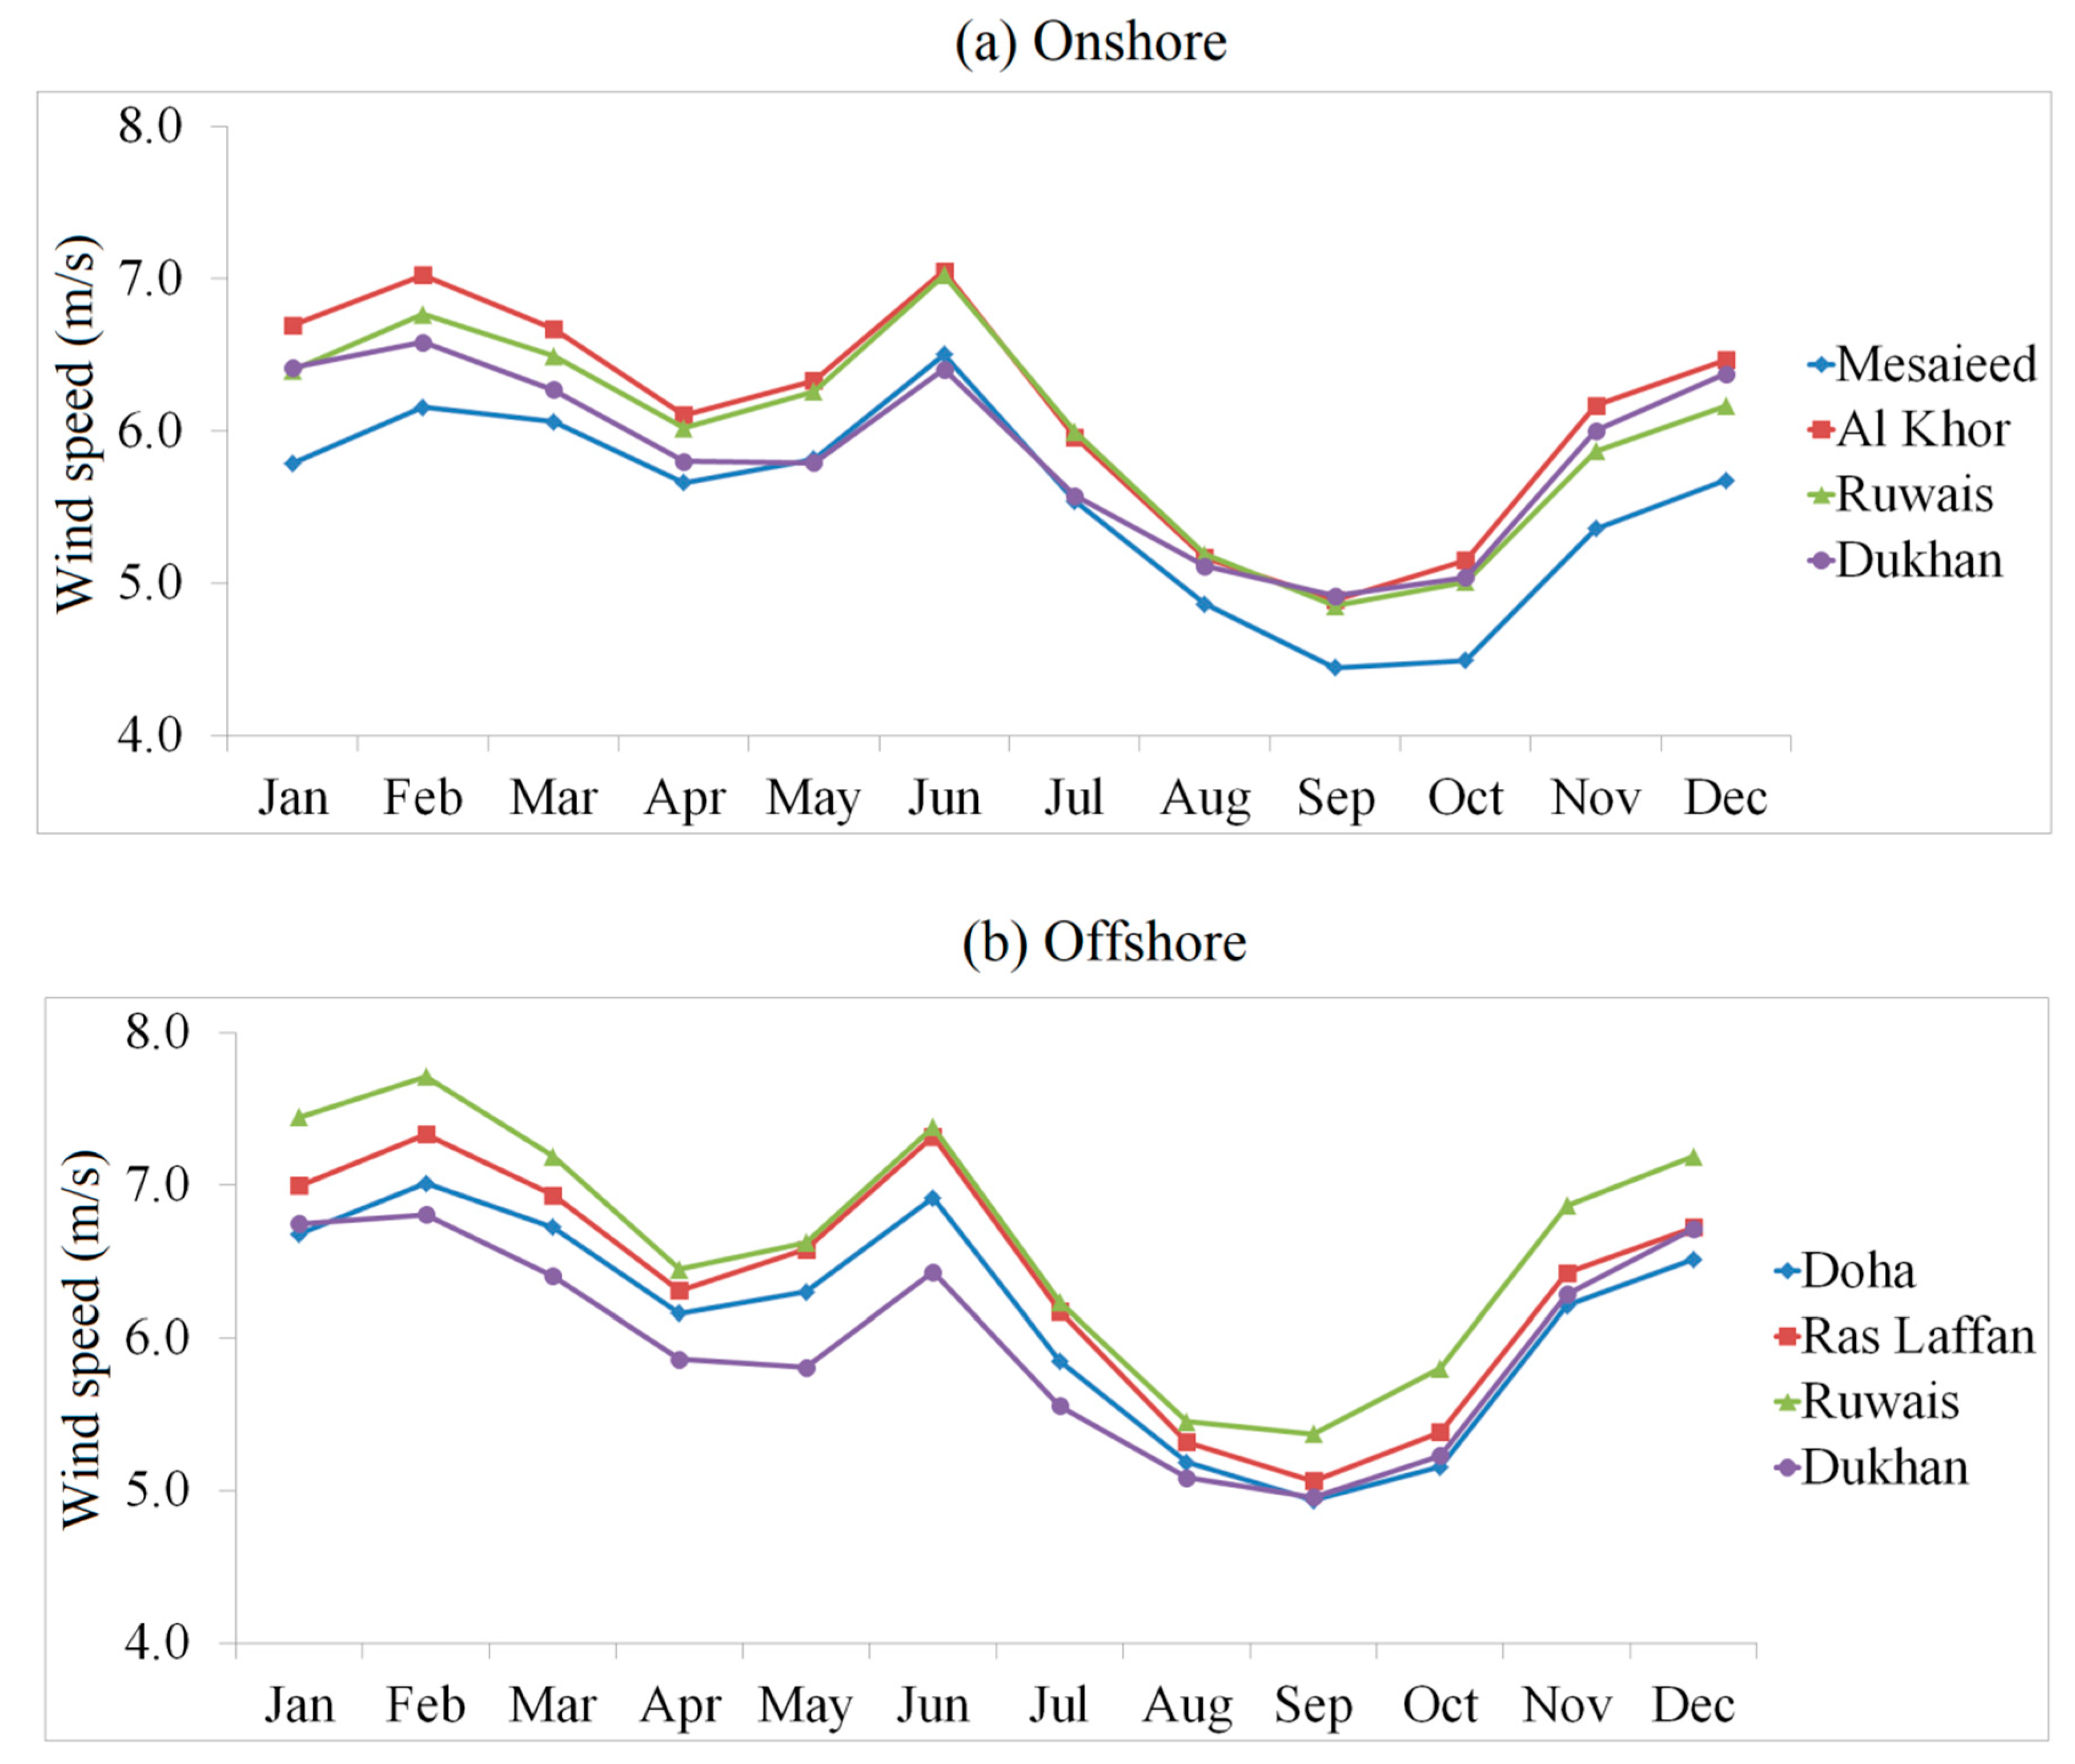
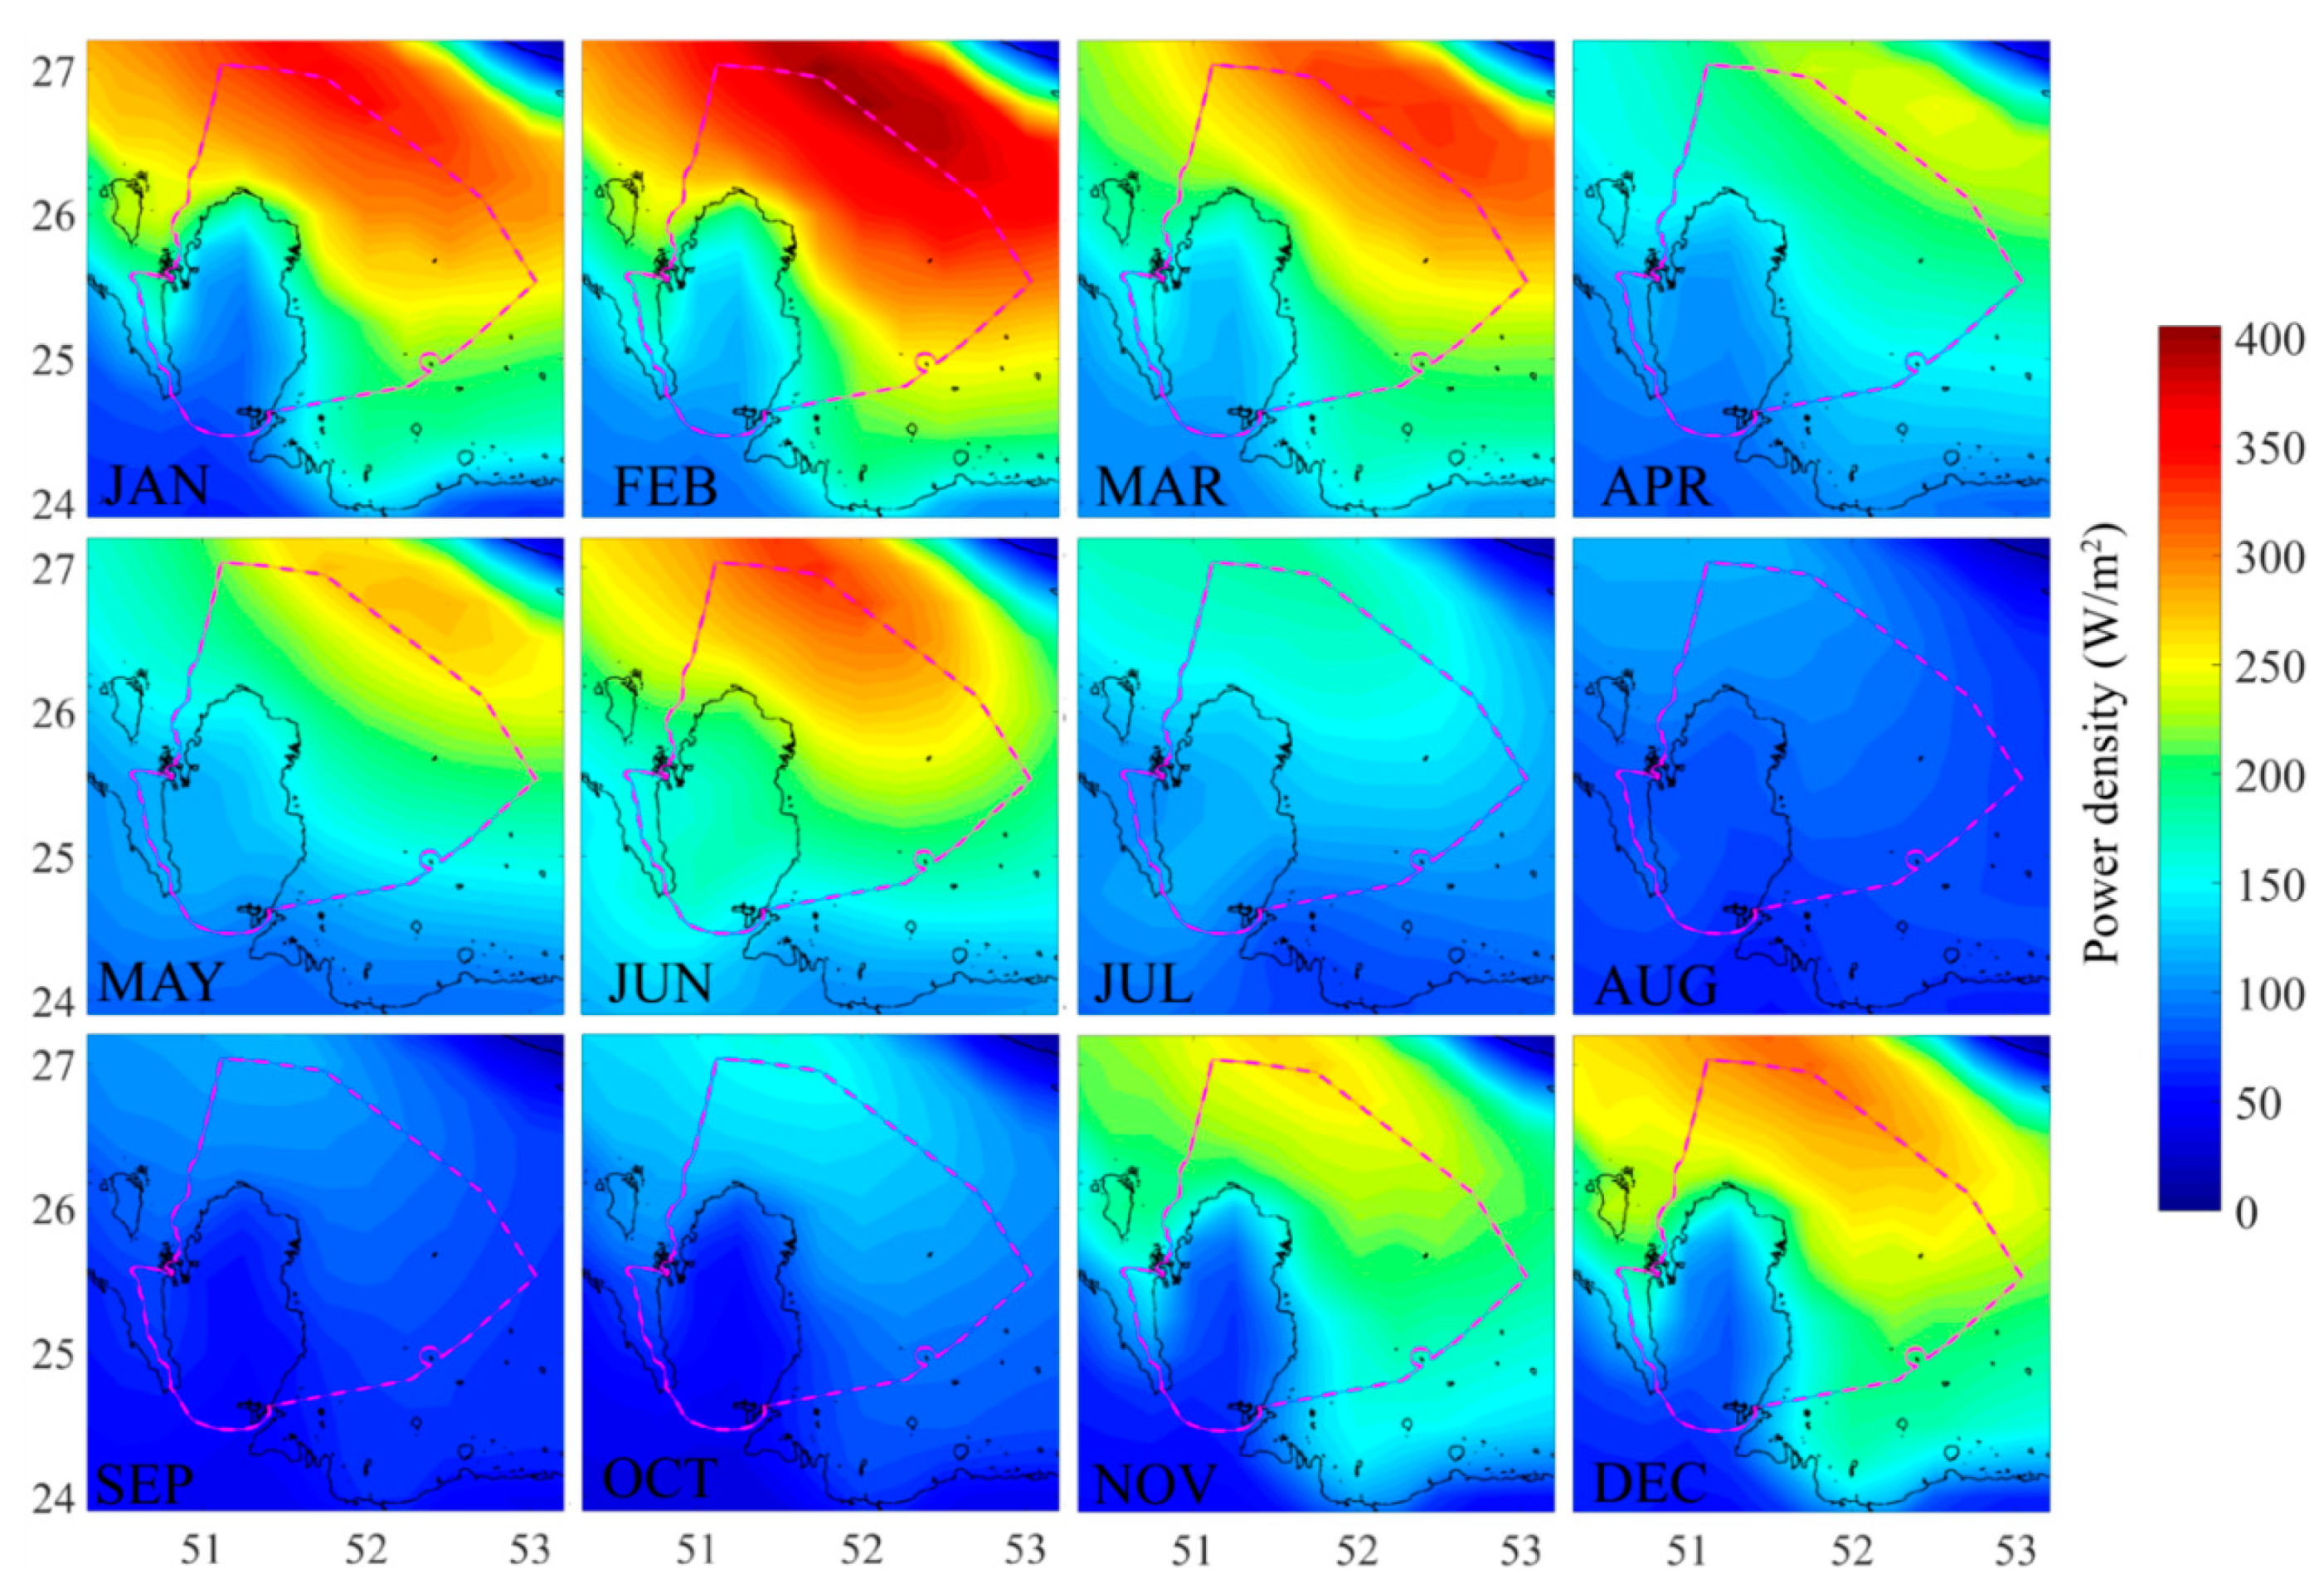
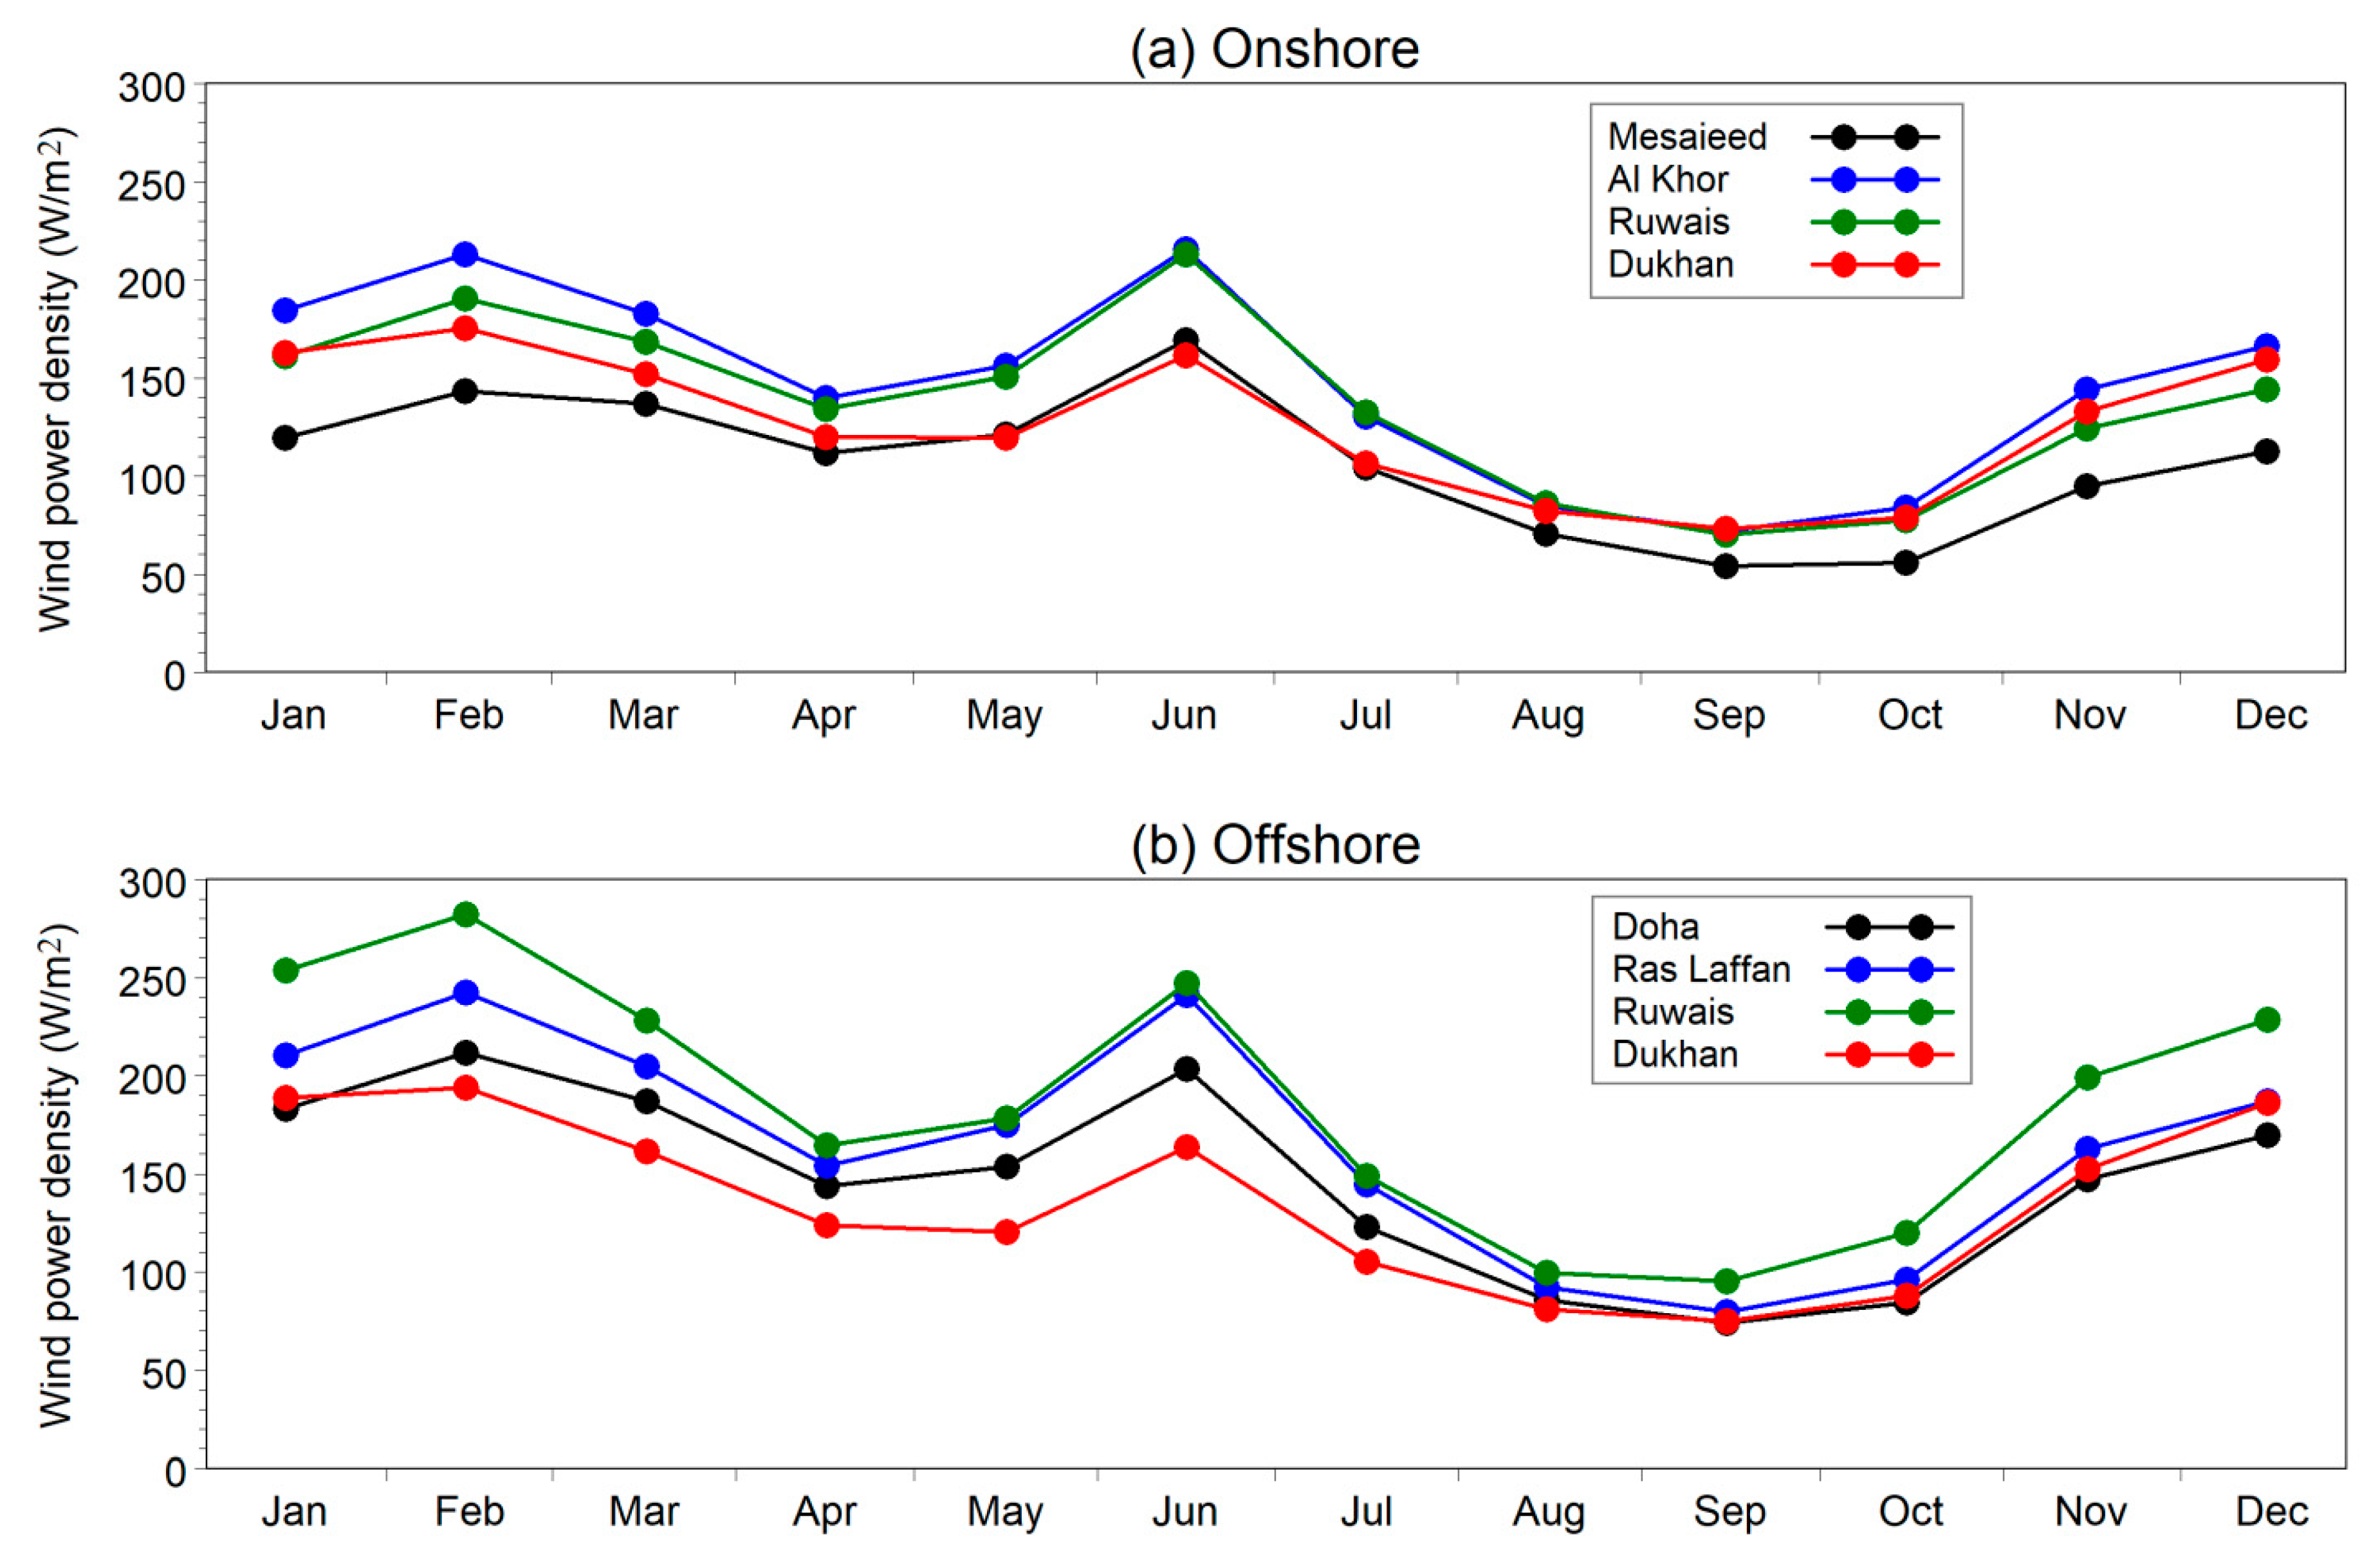
4.5. Monthly Mean Wind Power
5. Conclusions
Author Contributions
Funding
Acknowledgments
Conflicts of Interest
References
- Zou, C.; Zhao, Q.; Zhang, G.; Xiong, B. Energy revolution: From a fossil energy era to a new energy era. Nat. Gas Ind. B 2016, 3, 1–11. [Google Scholar] [CrossRef]
- Abdallah, L.; El-Shennawy, T. Reducing Carbon Dioxide Emissions from Electricity Sector Using Smart Electric Grid Applications. J. Eng. 2013, 2013, 1–8. [Google Scholar] [CrossRef]
- Bentley, R. Global oil & gas depletion: An overview. Energy Policy 2002, 30, 189–205. [Google Scholar] [CrossRef]
- Owusu, P.A.; Asumadu-Sarkodie, S. A review of renewable energy sources, sustainability issues and climate change mitigation. Cogent Eng. 2016, 3, 1167990. [Google Scholar] [CrossRef]
- Chaurasiya, P.K.; Warudkar, V.; Ahmed, S. Wind energy development and policy in India: A review. Energy Strat. Rev. 2019, 24, 342–357. [Google Scholar] [CrossRef]
- Kucukali, S.; Dinçkal, Ç. Wind energy resource assessment of Izmit in the West Black Sea Coastal Region of Turkey. Renew. Sustain. Energy Rev. 2014, 30, 790–795. [Google Scholar] [CrossRef]
- Guo, Q.; Xu, X.; Zhang, K.; Li, Z.; Huang, W.; Mansaray, L.R.; Liu, W.; Wang, X.; Gao, J.; Huang, J. Assessing Global Ocean Wind Energy Resources Using Multiple Satellite Data. Remote Sens. 2018, 10, 100. [Google Scholar] [CrossRef]
- Ren, G.; Wan, J.; Liu, J.; Yu, D. Assessing temporal variability of wind resources in China and the spatial correlation of wind power in the selected regions. J. Renew. Sustain. Energy 2020, 12, 13302. [Google Scholar] [CrossRef]
- Saha, S.; Moorthi, S.; Pan, H.-L.; Wu, X.; Wang, J.; Nadiga, S.; Tripp, P.; Kistler, R.; Woollen, J.; Behringer, D.; et al. The NCEP Climate Forecast System Reanalysis. Bull. Am. Meteorol. Soc. 2010, 91, 1015–1058. [Google Scholar] [CrossRef]
- Saha, S.; Moorthi, S.; Wu, X.; Wang, J.; Nadiga, S.; Tripp, P.; Behringer, D.; Hou, Y.-T.; Chuang, H.-Y.; Iredell, M.; et al. The NCEP Climate Forecast System Version 2. J. Clim. 2014, 27, 2185–2208. [Google Scholar] [CrossRef]
- Gelaro, R.; Mccarty, W.; Suárez, M.J.; Todling, R.; Molod, A.; Takacs, L.; Randles, C.A.; Darmenov, A.; Bosilovich, M.G.; Reichle, R.H.; et al. The Modern-Era Retrospective Analysis for Research and Applications, Version 2 (MERRA-2). J. Clim. 2017, 30, 5419–5454. [Google Scholar] [CrossRef]
- Uppala, S.M.; Kållberg, P.W.; Simmons, A.J.; Andrae, U.; Bechtold, V.D.C.; Fiorino, M.; Gibson, J.K.; Haseler, J.; Hernandez, A.; Kelly, G.A.; et al. The ERA-40 re-analysis. Q. J. R. Meteorol. Soc. 2005, 131, 2961–3012. [Google Scholar] [CrossRef]
- Berrisford, P.; Dee, D.P.; Fielding, M.; Fuentes, M.; Kållberg, P.W.; Kobayashi, S.; Uppala, S. The ERA-Interim Archive. Available online: https://www.ecmwf.int/node/8173 (accessed on 12 October 2020).
- Hersbach, H.; Bell, B.; Berrisford, P.; Hirahara, S.; Horányi, A.; Muñoz-Sabater, J.; Nicolas, J.; Peubey, C.; Radu, R.; Schepers, D.; et al. The ERA5 global reanalysis. Q. J. R. Meteorol. Soc. 2020, 146, 1999–2049. [Google Scholar] [CrossRef]
- Dee, D.P.; Uppala, S.M.; Simmons, A.J.; Berrisford, P.; Poli, P.; Kobayashi, S.; Andrae, U.; Balmaseda, M.A.; Balsamo, G.; Bauer, P.; et al. The ERA-Interim reanalysis: Configuration and performance of the data assimilation system. Q. J. R. Meteorol. Soc. 2011, 137, 553–597. [Google Scholar] [CrossRef]
- Kumar, V.S.; Asok, A.B.; George, J.; Amrutha, M.M. Regional Study of Changes in Wind Power in the Indian Shelf Seas over the Last 40 Years. Energies 2020, 13, 2295. [Google Scholar] [CrossRef]
- Hoffmann, L.; Günther, G.; Li, D.; Stein, O.; Wu, X.; Griessbach, S.; Heng, Y.; Konopka, P.; Müller, R.; Vogel, B.; et al. From ERA-Interim to ERA5: The considerable impact of ECMWF’s next-generation reanalysis on Lagrangian transport simulations. Atmos. Chem. Phys. Discuss. 2019, 19, 3097–3124. [Google Scholar] [CrossRef]
- Rivas, M.B.; Stoffelen, A. Characterizing ERA-Interim and ERA5 surface wind biases using ASCAT. Ocean Sci. 2019, 15, 831–852. [Google Scholar] [CrossRef]
- Ulazia, A.; Sáenz, J.; Ibarra-Berastegi, G.; González-Rojí, S.J.; Carreno-Madinabeitia, S. Global estimations of wind energy potential considering seasonal air density changes. Energy 2019, 187, 115938. [Google Scholar] [CrossRef]
- Ramon, J.; Lledó, L.; Torralba, V.; Soret, A.; Doblas-Reyes, F.J. What global reanalysis best represents near-surface winds? Q. J. R. Meteorol. Soc. 2019, 145, 3236–3251. [Google Scholar] [CrossRef]
- Olauson, J. ERA5: The new champion of wind power modelling? Renew. Energy 2018, 126, 322–331. [Google Scholar] [CrossRef]
- Thoppil, P.G.; Hogan, P.J. Persian Gulf response to a wintertime shamal wind event. Deep. Sea Res. Part I: Oceanogr. Res. Pap. 2010, 57, 946–955. [Google Scholar] [CrossRef]
- Yu, Y.; Notaro, M.; Kalashnikova, O.V.; Garay, M.J. Climatology of summer Shamal wind in the Middle East. J. Geophys. Res. Atmos. 2016, 121, 289–305. [Google Scholar] [CrossRef]
- Al Senafi, F.; Anis, A. Shamals and climate variability in the Northern Arabian/Persian Gulf from 1973 to 2012. Int. J. Clim. 2015, 35, 4509–4528. [Google Scholar] [CrossRef]
- Perrone, T.J. Winter Shamal in the Persian Gulf; Naval Environmental Prediction Research Facility: Monterey, CA, USA, 1979; p. 180. [Google Scholar]
- Kamranzad, B. Persian Gulf zone classification based on the wind and wave climate variability. Ocean Eng. 2018, 169, 604–635. [Google Scholar] [CrossRef]
- Eager, R.E.; Raman, S.; Wootten, A.; Westphal, D.L.; Reid, J.S.; Al Mandoos, A. A climatological study of the sea and land breezes in the Arabian Gulf region. J. Geophys. Res. Space Phys. 2008, 113, 113. [Google Scholar] [CrossRef]
- Sandeepan, B.; Panchang, V.G.; Nayak, S.; Kumar, K.K.; Kaihatu, J.M. Performance of the WRF Model for Surface Wind Prediction around Qatar. J. Atmospheric Ocean. Technol. 2018, 35, 575–592. [Google Scholar] [CrossRef]
- Patlakas, P.; Stathopoulos, C.; Flocas, H.A.; Kalogeri, C.; Kallos, G. Regional Climatic Features of the Arabian Peninsula. Atmosphere 2019, 10, 220. [Google Scholar] [CrossRef]
- Balog, I.; Ruti, P.M.; Tobin, I.; Armenio, V.; Vautard, R. A numerical approach for planning offshore wind farms from regional to local scales over the Mediterranean. Renew. Energy 2016, 85, 395–405. [Google Scholar] [CrossRef]
- Menendez, M.D.C.R.; García-Díez, M.; Fita, L.; Fernández, J.; Mendez, F.J.; Gutiérrez, J.M. High-resolution sea wind hindcasts over the Mediterranean area. Clim. Dyn. 2013, 42, 1857–1872. [Google Scholar] [CrossRef]
- Calaudi, R.; Arena, F.; Badger, M.; Sempreviva, A.M. Offshore Wind Mapping Mediterranean Area Using SAR. Energy Procedia 2013, 40, 38–47. [Google Scholar] [CrossRef][Green Version]
- Ucar, A.; Balo, F. Evaluation of wind energy potential and electricity generation at six locations in Turkey. Appl. Energy 2009, 86, 1864–1872. [Google Scholar] [CrossRef]
- Yip, C.M.A.; Gunturu, U.B.; Stenchikov, G.L. Wind resource characterization in the Arabian Peninsula. Appl. Energy 2016, 164, 826–836. [Google Scholar] [CrossRef]
- Al-Nassar, W.; Neelamani, S.; Al-Salem, K.; Al-Dashti, H. Feasibility of offshore wind energy as an alternative source for the state of Kuwait. Energy 2019, 169, 783–796. [Google Scholar] [CrossRef]
- Shata, A.A.; Hanitsch, R. The potential of electricity generation on the east coast of Red Sea in Egypt. Renew. Energy 2006, 31, 1597–1615. [Google Scholar] [CrossRef]
- Langodan, S.; Viswanadhapalli, Y.; Dasari, H.P.; Knio, O.; Hoteit, I. A high-resolution assessment of wind and wave energy potentials in the Red Sea. Appl. Energy 2016, 181, 244–255. [Google Scholar] [CrossRef]
- Al-Salem, K.; Neelamani, S.; Al-Nassar, W. Wind Energy Map of Arabian Gulf. Nat. Resour. 2018, 9, 212–228. [Google Scholar] [CrossRef]
- Khonkar, H. Complete Survey of Wind Behavior over the Arabian Gulf. J. King Abdulaziz Univ. Sci. 2009, 20, 31–47. [Google Scholar] [CrossRef]
- Ali, A. Wind Meteorology of the Summer Shamal in the Arabian Gulf Region. Master’s Thesis, Boston University, Boston, NE, USA, 1994. [Google Scholar]
- Rao, P.G.; Hatwar, H.R.; Al-Sulaiti, M.H.; Al-Mulla, A.H. Summer shamals over the Arabian Gulf. Weather 2003, 58, 471–478. [Google Scholar] [CrossRef]
- Amirinia, G.; Mafi, S.; Mazaheri, S. Offshore wind resource assessment of Persian Gulf using uncertainty analysis and GIS. Renew. Energy 2017, 113, 915–929. [Google Scholar] [CrossRef]
- Alnaser, W.; Almohanadi, A. Wind and solar energy in Qatar. Energy 1990, 15, 931–934. [Google Scholar] [CrossRef]
- Marafia, A.-H.; Ashour, H.A. Economics of off-shore/on-shore wind energy systems in Qatar. Renew. Energy 2003, 28, 1953–1963. [Google Scholar] [CrossRef]
- Méndez, C.; Bicer, Y. Qatar’s Wind Energy Potential with Associated Financial and Environmental Benefits for the Natural Gas Industry. Energies 2019, 12, 3329. [Google Scholar] [CrossRef]
- Al-Qaradawi, I.; Abdel-Moati, M.; Al-Yafei, M.A.-A.; Al-Ansari, E.; Al-Maslamani, I.A.; Holm, E.; Al-Shaikh, I.; Mauring, A.; Pinto, P.V.; Abdulmalik, D.; et al. Radioactivity levels in the marine environment along the Exclusive Economic Zone (EEZ) of Qatar. Mar. Pollut. Bull. 2015, 90, 323–329. [Google Scholar] [CrossRef]
- Cheng, W.L.; Saleem, A.; Sadr, R. Recent warming trend in the coastal region of Qatar. Theor. Appl. Clim. 2015, 128, 193–205. [Google Scholar] [CrossRef]
- Aboobacker, V.M.; Shanas, P.R.; Al-Ansari, E.M.A.S.; Sanil Kumar, V.; Vethamony, P. The maxima in northerly wind speeds and wave heights over the Arabian Sea, the Arabian/Persian Gulf and the Red Sea derived from 40 years of ERA5 data. Clim. Dyn. 2020. (In Press) [CrossRef]
- Yu, J.; Zhou, T.; Jiang, Z.; Zou, L. Evaluation of Near-Surface Wind Speed Changes during 1979 to 2011 over China Based on Five Reanalysis Datasets. Atmosphere 2019, 10, 804. [Google Scholar] [CrossRef]
- Dullaart, J.C.M.; Muis, S.; Bloemendaal, N.; Aerts, J.C.J.H. Advancing global storm surge modelling using the new ERA5 climate reanalysis. Clim. Dyn. 2019, 54, 1007–1021. [Google Scholar] [CrossRef]
- Mahmoodi, K.; Ghassemi, H.; Razminia, A. Temporal and spatial characteristics of wave energy in the Persian Gulf based on the ERA5 reanalysis dataset. Energy 2019, 187, 115991. [Google Scholar] [CrossRef]
- Tennekes, H. The Logarithmic Wind Profile. J. Atmos. Sci. 1973, 30, 234–238. [Google Scholar] [CrossRef]
- Zhou, J.; Erdem, E.; Li, G.; Shi, J. Comprehensive evaluation of wind speed distribution models: A case study for North Dakota sites. Energy Convers. Manag. 2010, 51, 1449–1458. [Google Scholar] [CrossRef]
- Genc, A.; Erisoglu, M.; Pekgor, A.; Oturanc, G.; Hepbasli, A.; Ulgen, K. Estimation of Wind Power Potential Using Weibull Distribution. Energy Sources 2005, 27, 809–822. [Google Scholar] [CrossRef]
- Chang, T.P. Estimation of wind energy potential using different probability density functions. Appl. Energy 2011, 88, 1848–1856. [Google Scholar] [CrossRef]
- Shi, J.; Erdem, E. Estimation of Wind Energy Potential and Prediction of Wind Power; Elsevier BV: Amsterdam, The Netherlands, 2017; pp. 25–49. [Google Scholar]
- Chen, Y.; Pillay, P.; Khan, A. PM Wind Generator Topologies. IEEE Trans. Ind. Appl. 2005, 41, 1619–1626. [Google Scholar] [CrossRef]
- Li, H.; Chen, Z. Design optimization and site matching of direct-drive permanent magnet wind power generator systems. Renew. Energy 2009, 34, 1175–1184. [Google Scholar] [CrossRef]
- Gitano-Briggs, H. Low Speed Wind Turbine Design; IntechOpen: London, UK, 2012. [Google Scholar]
- Verde, A.; Lastres, O.; Hernández, G.; Ibáñez, G.; Verea, L.; Sebastian, P. A new method for characterization of small capacity wind turbines with permanent magnet synchronous generator: An experimental study. Heliyon 2018, 4, e00732. [Google Scholar] [CrossRef]
- Darwish, A.S.; Shaaban, S.; Marsillac, E.; Mahmood, N.M. A methodology for improving wind energy production in low wind speed regions, with a case study application in Iraq. Comput. Ind. Eng. 2019, 127, 89–102. [Google Scholar] [CrossRef]
- Liu, H.; Shi, J.; Qu, X. Empirical investigation on using wind speed volatility to estimate the operation probability and power output of wind turbines. Energy Convers. Manag. 2013, 67, 8–17. [Google Scholar] [CrossRef]
- Qu, X.; Shi, J. Bivariate Modeling of Wind Speed and Air Density Distribution for Long-Term Wind Energy Estimation. Int. J. Green Energy 2010, 7, 21–37. [Google Scholar] [CrossRef]
- Sen, P.K. Estimates of the Regression Coefficient Based on Kendall’s Tau. J. Am. Stat. Assoc. 1968, 63, 1379–1389. [Google Scholar] [CrossRef]
- Hess, A.; Iyer, H.; Malm, W. Linear trend analysis: A comparison of methods. Atmos. Environ. 2001, 35, 5211–5222. [Google Scholar] [CrossRef]
- Cosseron, A.; Gunturu, U.B.; Schlosser, C.A. Characterization of the Wind Power Resource in Europe and its Intermittency. Energy Procedia 2013, 40, 58–66. [Google Scholar] [CrossRef]
- Cornett, A.M. A global wave energy resource assessment. In Proceedings of the 18th International Offshore and Polar Engineering Conference (ISOPE), International Society of Offshore and Polar Engineers, Vancouver, BC, Canada, 6–11 July 2008. [Google Scholar]
- Harrison, R.; Hau, E.; Snel, H. Large Wind Turbines: Design and Economics; Wiley: Chichester, UK, 2000. [Google Scholar]
- Zheng, C.; Pan, J.; Li, J.-X. Assessing the China Sea wind energy and wave energy resources from 1988 to 2009. Ocean Eng. 2013, 65, 39–48. [Google Scholar] [CrossRef]
- Pantusa, D.; Tomasicchio, G. Large-scale offshore wind production in the Mediterranean Sea. Cogent Eng. 2019, 6, 6. [Google Scholar] [CrossRef]
- Rusu, L.; Ganea, D.; Mereuta, E. A joint evaluation of wave and wind energy resources in the Black Sea based on 20-year hindcast information. Energy Explor. Exploit. 2017, 36, 335–351. [Google Scholar] [CrossRef]
- Cox, J. Impact of Intermittency: How Wind Variability Could Change the Shape of the British and Irish Electricity Markets; Summary Report; Poyry Energy Ltd.: Oxford, UK, 2009. [Google Scholar]
- Knapp, K.R.; Kruk, M.C.; Levinson, D.H.; Diamond, H.J.; Neumann, C.J. The International Best Track Archive for Climate Stewardship (IBTrACS). Bull. Am. Meteorol. Soc. 2010, 91, 363–376. [Google Scholar] [CrossRef]
- Naizghi, M.S.; Ouarda, T.B.M.J. Teleconnections and analysis of long-term wind speed variability in the UAE. Int. J. Clim. 2016, 37, 230–248. [Google Scholar] [CrossRef]
- Shanas, P.; Aboobacker, V.; AlBarakati, A.M.; Zubier, K.M. Climate driven variability of wind-waves in the Red Sea. Ocean Model. 2017, 119, 105–117. [Google Scholar] [CrossRef]
- Aboobacker, V.M.; Shanas, P.R. The climatology of shamals in the Arabian Sea-Part 1: Surface winds. Int. J. Clim. 2018, 38, 4405–4416. [Google Scholar] [CrossRef]
- Brano, V.L.; Galanis, G.; Spyrou, C.; Diamantis, D.; Baladima, F.; Koukoula, M.; Kallos, G.B. Assessing the European offshore wind and wave energy resource for combined exploitation. Renew. Energy 2017, 101, 244–264. [Google Scholar] [CrossRef]


| Region | Locations | Geographical Co-Ordinates | Wind Speed (m/s) | % of Exploitable Wind Speed | |||
|---|---|---|---|---|---|---|---|
| Longitude (° E) | Latitude (° N) | Maximum | Mean | Standard Deviation | |||
| Onshore | Mesaieed | 51.5828 | 25.0444 | 15.4 | 4.6 | 2.3 | 73.9 |
| Al Khor | 51.4394 | 25.7534 | 16.2 | 5.1 | 2.6 | 77.1 | |
| Al Ruwais | 51.2202 | 26.0690 | 15.9 | 4.9 | 2.5 | 74.7 | |
| Dukhan | 50.8398 | 25.3355 | 15.7 | 4.9 | 2.4 | 77.5 | |
| Offshore | Doha | 51.7970 | 25.2755 | 15.5 | 5.1 | 2.5 | 78.5 |
| Ras Laffan | 51.6146 | 26.0131 | 16.5 | 5.2 | 2.7 | 76.5 | |
| Al Ruwais | 51.2992 | 26.2822 | 16.9 | 5.5 | 2.8 | 78.4 | |
| Dukhan | 50.7251 | 25.4767 | 16.1 | 5.0 | 2.4 | 78.2 | |
| Region | Statistics of Wind Power Density | ||||||
|---|---|---|---|---|---|---|---|
| Locations | Mean (W/m2) | Max (W/m2) | SD (W/m2) | CoV | Sk | K | |
| Onshore | Mesaieed | 107.4 | 2249.6 | 158.5 | 1.48 | 3.18 | 17.30 |
| Al Khor | 147.3 | 2604.2 | 202.6 | 1.38 | 2.52 | 11.43 | |
| Al Ruwais | 137.3 | 2467.1 | 192.0 | 1.40 | 2.57 | 11.93 | |
| Dukhan | 126.5 | 2378.5 | 173.3 | 1.37 | 2.75 | 13.48 | |
| Offshore | Doha | 146.7 | 2273.1 | 199.2 | 1.36 | 2.55 | 11.62 |
| Ras Laffan | 165.3 | 2783.8 | 224.7 | 1.36 | 2.32 | 9.84 | |
| Al Ruwais | 186.4 | 2960.3 | 245.4 | 1.32 | 2.22 | 9.42 | |
| Dukhan | 136.1 | 2547.7 | 183.1 | 1.35 | 2.61 | 12.31 | |
| Region | Locations | Annual Mean Wind Power (W/m2) during 1979–2018 | % of Variation | ||
|---|---|---|---|---|---|
| Highest | Lowest | Highest-Lowest | |||
| Onshore | Mesaieed | 129.1 | 90.0 | 39.1 | 43.4 |
| Al Khor | 171.8 | 117.0 | 54.8 | 46.8 | |
| Al Ruwais | 157.0 | 110.7 | 46.3 | 41.8 | |
| Dukhan | 146.6 | 105.6 | 41.0 | 38.8 | |
| Offshore | Doha | 174.0 | 119.2 | 54.8 | 46.0 |
| Ras Laffan | 190.7 | 130.1 | 60.6 | 46.6 | |
| Al Ruwais | 212.2 | 146.8 | 65.4 | 44.6 | |
| Dukhan | 156.9 | 113.4 | 43.5 | 38.4 | |
| Region | Locations | Mean Wind Power during 1979 | Increment in Mean Wind Power (W/m2) | Annual% of Increment | |
|---|---|---|---|---|---|
| 1979–2018 (40 Years) | Annual Rate of Increment | ||||
| Onshore | Mesaieed | 105.65 | +3.46 | +0.086 | +0.08 |
| Al Khor | 148.58 | −2.76 | −0.069 | −0.05 | |
| Al Ruwais | 139.58 | −4.61 | −0.115 | −0.08 | |
| Dukhan | 125.11 | +2.77 | +0.069 | +0.06 | |
| Offshore | Doha | 145.92 | +1.35 | +0.034 | +0.02 |
| Ras Laffan | 168.84 | −7.10 | −0.177 | −0.11 | |
| Al Ruwais | 192.23 | −11.57 | −0.289 | −0.15 | |
| Dukhan | 136.24 | −0.23 | −0.006 | 0.00 | |
| Region | Locations | Annual Variability Index | Seasonal Variability Index | Monthly Variability Index |
|---|---|---|---|---|
| Onshore | Mesaieed | 0.36 | 0.22 | 1.07 |
| Al Khor | 0.37 | 0.33 | 0.98 | |
| Al Ruwais | 0.34 | 0.23 | 1.04 | |
| Dukhan | 0.32 | 0.37 | 0.81 | |
| Offshore | Doha | 0.37 | 0.36 | 0.94 |
| Ras Laffan | 0.37 | 0.34 | 0.99 | |
| Al Ruwais | 0.35 | 0.42 | 1.00 | |
| Dukhan | 0.32 | 0.46 | 0.87 |
Publisher’s Note: MDPI stays neutral with regard to jurisdictional claims in published maps and institutional affiliations. |
© 2021 by the authors. Licensee MDPI, Basel, Switzerland. This article is an open access article distributed under the terms and conditions of the Creative Commons Attribution (CC BY) license (http://creativecommons.org/licenses/by/4.0/).
Share and Cite
Aboobacker, V.M.; Shanas, P.R.; Veerasingam, S.; Al-Ansari, E.M.A.S.; Sadooni, F.N.; Vethamony, P. Long-Term Assessment of Onshore and Offshore Wind Energy Potentials of Qatar. Energies 2021, 14, 1178. https://doi.org/10.3390/en14041178
Aboobacker VM, Shanas PR, Veerasingam S, Al-Ansari EMAS, Sadooni FN, Vethamony P. Long-Term Assessment of Onshore and Offshore Wind Energy Potentials of Qatar. Energies. 2021; 14(4):1178. https://doi.org/10.3390/en14041178
Chicago/Turabian StyleAboobacker, Valliyil Mohammed, Puthuveetil Razak Shanas, Subramanian Veerasingam, Ebrahim M. A. S. Al-Ansari, Fadhil N. Sadooni, and Ponnumony Vethamony. 2021. "Long-Term Assessment of Onshore and Offshore Wind Energy Potentials of Qatar" Energies 14, no. 4: 1178. https://doi.org/10.3390/en14041178
APA StyleAboobacker, V. M., Shanas, P. R., Veerasingam, S., Al-Ansari, E. M. A. S., Sadooni, F. N., & Vethamony, P. (2021). Long-Term Assessment of Onshore and Offshore Wind Energy Potentials of Qatar. Energies, 14(4), 1178. https://doi.org/10.3390/en14041178