Article

Electric Vehicles Ready for Breakthrough in MaaS? Consumer Adoption of E-Car Sharing and E-Scooter Sharing as a Part of Mobility-as-a-Service (MaaS)

Sustainable Energy Management Unit, Department of Operations, Energy and Environmental Management, Alpen-Adria-Universität Klagenfurt, Universitätsstraße 65-67, 9020 Klagenfurt am Wörthersee, Austria
*
Author to whom correspondence should be addressed.
Energies 2021, 14(4), 1088; https://doi.org/10.3390/en14041088
Submission received: 2 December 2020 / Revised: 31 January 2021 / Accepted: 4 February 2021 / Published: 19 February 2021

Abstract

:
Current mobility trends indicate that the popularity of privately-owned cars will decrease in the near future. One reason for this development is the diffusion of mobility services such as car or bike sharing, or Mobility-as-a-Service (MaaS) bundles. Especially, MaaS bundles have the potential to respond to environmental issues and provide reliable mobility to users, thus illustrating the possibilities of being mobile without owning a car. Most of the past research on MaaS bundles, however, has focused on bigger cities that already have good infrastructural bases. Building on previous work in the MaaS field, we conducted a choice-based conjoint survey (n = 247) in Austria to investigate consumer preferences for MaaS packages in a suburban area. Further, we gathered data on the consumers’ willingness to pay, especially for including electric vehicles in the form of e-car sharing and e-scooter sharing in MaaS packages. The results highlight the importance of package price as the attribute with the highest impact on purchase intention. Further, participants in our study most preferred MaaS packages that included e-car sharing to ones with e-scooter sharing. Using latent class analysis, we classified the respondents into three different segments with varying preferences for MaaS bundle features, and conducted market simulations.

1. Introduction

Currently, the majority of cars in use are household owned. However, on average, these cars are parked 92% of the time, therefore their capacity is not nearly optimally used [1]. Although the mobility sector is rapidly changing and the trend is to move away from car ownership, it is still unclear how this market will develop [2]. Car sharing, as an alternative to car ownership, is gaining momentum [3,4]. Generally, according to a recent market forecast, the car sharing business will grow at an annual rate of more than 24% between 2020 and 2026 to more than USD 9 billion [5]. Besides the urban context, more marginal suburban locations are showing the same trend [6]. Another trend likely to have a high impact on future transport systems, is electrification [7]. Largely, electric cars appear to be taking the lead as a green alternative to private cars [8,9]. Overall, several studies indicate that electric vehicles (EVs) can positively address environmental concerns e.g., [10,11,12]. Thus, new mobility services that build on sharing and electric mobility such as Mobility-as-a-Service (MaaS) offerings could potentially provide green and non-ownership alternatives to meet future customers’ estimated mobility needs [13]. One way of fostering MaaS adoption is to combine different mobility services (e.g., PT, car sharing, bike sharing) in so-called “multimodal mobility or MaaS packages” to increase, e.g., convenience, flexibility and cost reduction for customers e.g., [13,14,15]. Combining such sustainable mobility solutions, Gould et al. [16] see MaaS as an opportunity not only to decarbonize the transport sector, but also to foster the diffusion of EVs by including such alternative means of transport in multimodal mobility bundles/MaaS packages [17]. In the context of MaaS, Karlsson et al. [18], and other researchers [2,19] pointed out that to meet users’ needs, more studies on large-scale implementation and detailed analysis of potential users’ preferences regarding MaaS are essential. All pilot projects and studies regarding MaaS packages to date have been conducted in big cities like Amsterdam, Helsinki, London and Sydney [14,20,21,22,23,24,25]. Additionally, extant research has dedicated more attention to studying best practices than to following a “bottom-up approach” that could identify potential users’ preferences e.g., [26,27,28]. Our research aims to contribute to the discourse on MaaS and attempts to close the research gap by identifying preferences related to multimodal mobility packages’ features and respondents’ willingness to pay (WTP) in less densely populated suburban districts. To reach this goal, we conducted a choice-based conjoint (CBC) study (n = 247) including latent class analysis (LCA) and market simulations (sensitivity analysis) to investigate potential consumers’ preferences for MaaS packages in a suburban district of Klagenfurt, the capital of the Austrian federal state Carinthia. In Klagenfurt’s Harbach district a real estate project for residential living, “hi Harbach”, is currently being developed with a new multimodal mobility point (“hi MOBIL”; the project “hi MOBIL—Multi-modal mobility node Klagenfurt-Harbach” is funded by the Austrian Ministry for Transport, Innovation and Technology. Project leader: City of Klagenfurt; other project partners: Diakonie de la Tour, Family of Power, Klagenfurt Mobil GmbH, Landeswohnbau Kärnten, Vorstädtische Kleinsiedlung; Duration: 10/2018–09/2021.), the first of its kind in Klagenfurt and in Carinthia. Once implemented, it will provide residents with MaaS offerings. To our knowledge, only a few studies so far have analyzed consumer preferences regarding multimodal mobility packages in similar contexts, i.e., in a suburban area and/or residential settlement [29,30,31]. Besides this general aspect, our study is the first to analyze EV inclusion, i.e., e-car sharing and e-scooter sharing, in MaaS packages.
The remainder of this paper is organized as follows: after briefly introducing the topic in Section 1, Section 2 gives an overview of the scientific literature focusing on service bundling in the mobility sector and related to MaaS. Section 3 introduces the sample and the research method, and Section 4 provides the results. Finally, Section 5 discusses the results, draws conclusions and suggests potential future research topics.

2. Literature Review

2.1. Service Bundling in the Mobility Sector

As new transportation modes (e.g., electric cars, e-scooters) and concepts (shared mobility, MaaS) enter the market, their diffusion can be stimulated by bundling. Originally developed in Helsinki [32], such MaaS packages or bundles are seen as a promising new mobility concept that, in recent years, especially practitioners have given much attention. The main idea of MaaS is to fulfil public mobility needs without people needing to own a private car. An associated key issue to be addressed in MaaS relates to various kinds of travel cards issued by different public transport (PT) companies or mobility service providers [13,33]. Combining different transport modes and services within one journey, i.e., using more than one of the PT, car sharing, ride sharing, taxi and bicycle options, is not a new idea. However, with the most advanced and integrated form of MaaS the whole package can be booked and (pre-)paid with, e.g., only one mobile application or one card [2]. In the context of the above-mentioned trends, digitalization plays a central role as it provides enhanced interconnectivity and gives users additional benefits, such as saving time by giving alternative transport possibilities in organizing a trip. Further, the new concept should not only facilitate the use of existing transport modes; it should offer additional value, e.g., by simultaneously providing a higher service level or a lower price [33].

2.2. Overview of MaaS Initiatives, Concepts and Projects

Sweden and Finland with UbiGo and Whim, have acted as pioneers in introducing and developing MaaS. UbiGo, a project piloted in Gothenburg, Sweden, in 2013 is often referred to as the first real-life MaaS demonstration [34]. At the time, they offered 151 pilot users a mobility package with several transport modes integrated in a single subscription [34,35,36]. By the end of the pilot project almost all participants expressed an interest in using UbiGo. Reportedly, the trial users also developed more negative attitudes towards private car use, and became more positive towards alternative modes of transport [37]. Further, Whim, developed and launched in Finland in 2016, is operated as a MaaS initiative [38]. At Whim, customers can choose between three types of bundles: the classic “pay-as-you-go” option, the “Whim Urban” (€49 per month) that includes unlimited urban PT and discounted taxi prices, and the “Whim Unlimited” (€499 per month) that offers unlimited access to PT, taxis or a (shared) car. Besides these two promising MaaS concept implementations (UbiGo and Whim), there are multiple other (pilot) MaaS projects that have been launched, especially in Europe, but also further afield. [23] provide a good overview of different studies summarizing the features of and lessons learnt from integrated mobility solutions focusing particularly on practice examples [39,40,41,42]. For instance, they mention Schad et al. [41] whose work shows that multimodal mobility packages help people to change their habits and rethink their mobility behavior. Nearly 90% of all users in their study’s sample started using their own car less.
We took Kamargianni et al. [23] as a basis for this study, specifically the index (the MaaS integration index) they developed, which enables a comparison between different MaaS initiatives, concepts and projects. The index has three levels of integration related to the different transport modes that are part of a MaaS package. The first level is ticket integration which refers to the number of modes that can be accessed via a single ticket or smart card. The second level is the integration of information and communication technologies (ICT) via an application or online interface that can relate to two different functions: journey planning and booking. The third level includes full integration of the mobility modes in one single package where customers do pre-payment, thereby purchasing a combination of mobility services for a specific amount (time or distance). According to this MaaS integration index the two above-mentioned initiatives, UbiGo and Whim, achieved the highest scores. Another initiative that scored highly on this index is SHIFT. Initiated in 2013 in Las Vegas, SHIFT includes shuttle buses, bike sharing, car rental, car sharing, and a valet service. In contrast to UbiGo and Whim, SHIFT is completely institutionally integrated, offering unique mobility packages to customers. Further, SHIFT owns all its vehicles, many of which are EVs, thereby following not only the sharing concept, but also the electrification trend, on which our study also focusses.
Further, Kamargianni et al. [23] provide a good overview of different integration forms in the personal mobility sector. They distinguish two levels of integration in their review, namely partial integration and advanced integration (with or without mobility packages). The partial integration category is illustrated by a system introduced in Belgium, built on a concept developed in Brussels. The car-sharing company, Cambio, cooperates with STIB (Société des Transports Intercommunaux de Bruxelles), a multimodal mobility operator for PT, bike sharing and taxi services. The two service providers (Cambio and STIB) designed a common smart card for users of both systems. Additionally, Cambio members enjoy discounts if they subscribe to the STIB service. However, payments are not integrated, nor is the ICT. To illustrate advanced integration, in Germany a few different concepts were similarly brought together as mobility services: Qixxit, Moovel and Switchh. Qixxit has included rail, urban PT, car sharing, car rental, bike sharing and taxi services, as well as flights and coach trips on a national level. Through a smart app the user has access to different services such as planning, booking, real-time information, and personalized trip advice. Moovel, another national mobility integration service, in contrast to Qixxit, gives ICT integration. Moovel’s single smartphone platform provides booking and payment for nearly all services, which include PT, car sharing, bike sharing, national rail, taxi services, etc. [23]. Although, Switchh, developed for Hamburg (Germany), also represents advanced integration in relation to the other two concepts, it still has potential for further integration because currently it has no single invoice for payment of the services.
The advanced integration level includes the same basic components as those in the mobility solutions identified as having partial integration; additionally, it has three particular identifying elements: ticket sales, payment options, and ICT integration. To illustrate, Hannovermobil (2.0) provides a service in which users receive one bill that integrates all the mobility services they used at the end of each month. A similar solution introduced in Montpellier (France), is known as EMMA (EMMA is an integrated mobility platform in the city of Montpellier, France. Transports de l’Agglomération de Montpellier (TAM) is the key operator of EMMA services.). However, in contrast to Hannovermobil (2.0), EMMA users can also purchase monthly or annual mobility contracts (including all the TAM services). Depending on their needs, or their affiliation to different user groups, contracts have different designs and payment structures (e.g., EMMA Young, EMMA Senior) incorporating all three above-mentioned elements of advanced integration [23]. In addition to these examples, the Netherlands has developed different concepts (e.g., Mobility Mixx, NS-Business Card), as have different German speaking countries; however, they are still in a research phase (Austria/Vienna: Smile; Germany/Berlin: BeMobility). The MaaS concepts Kamargianni et al. (2016) have classified as offerings with the highest level of integration are the ones already mentioned: UbiGo (Gothenburg), Whim (Helsinki) and SHIFT (Las Vegas).

2.3. Consumer Preferences toward MaaS Packages

Huwer’s study [43] represents one of the first studies related to the subject of MaaS. Very recently, scholars e.g., [2,19,21,44,45] advanced this field in studies on potential consumers’ preferences towards services included in MaaS packages and their characteristics. Methodologically, most of these studies used stated preference experiments, as does this study [21,22,25,45,46,47].
Matyas and Kamargianni [24,47] conducted the first study in this field that used a stated preference experiment to investigate consumer preferences for features of MaaS bundles. They collected preference data in the Greater London area for different types of MaaS subscription plans; fixed and flexible ones, the latter with a menu option to configure mixed bundles. The bundles included PT, bike sharing, car sharing and taxi services, as well as additional features such as bike sharing rental time of up to 60 min at a time or a pooled taxi as an option. Their findings reveal that the type and number of transport modes in the plans are important determinants of users’ willingness to subscribe to such plans. Specifically, the respondents preferred PT to the other transport modes (e.g., bike sharing or car sharing) in their plans. However, their preferences for sharing options were moderated by their previous use of such services. Kamargianni et al. [23] and Guidon et al. [45] also showed a high preference for PT in MaaS packages. To elaborate, [23] revealed the highest preference for PT in combination with e-car sharing, on demand busses, and e-bike sharing, in that order. In contrast, they found that potential customers showed less preference for PT bundled with taxi services, ride sharing, and car rental services. Guidon et al. [45] found the highest WTP for bundles that include complementary mobility services related to PT such as car sharing and park-and-ride services. Ho et al. [22,46] report on two stated preference studies relating to MaaS subscription plans conducted in Sydney, Australia, and Tyneside, UK. These studies’ key findings include that individuals are not willing to pay for bike sharing as part of MaaS packages, and that overall, discounts should be offered on the bundled mobility services to increase MaaS package adoption. Further, the high impact of subscription price on users’ purchase intention has also been shown by [21,25]. Mulley et al. [25] reveal that what users are willing to pay for MaaS bundles is even lower than the providers’ unit costs of providing the service included in the bundle. More generally, [21,22] report a rather low overall intention of their respondents to subscribe to MaaS offerings. In this regard, scholars show that habit (e.g., daily car or public transport usage) has a strong impact on users’ willingness to subscribe to MaaS offerings e.g., [21,22,48], which is also reflected in general literature on transport mode choice and modal diversion e.g., [49,50].
Our literature review on consumer preferences and WTP for MaaS bundles using stated preference experiments highlights that nearly all earlier studies are focused on urban areas. To the best of our knowledge only a few studies so far have analyzed consumer preferences regarding MaaS packages in suburban areas and/or residential settlements [29,30,31]. Wright et al. [31], for instance, investigated MaaS bundles including PT and carpooling services in four European suburban regions or areas (Canton Ticino, Brussels, Zagreb and Ljubljana). The study was based on a pilot project called ‘RideMyRoute’, which included an application to help users better plan their journey involving PT as well as carpooling. In this study with relatively limited focus, surveys were administered before and after the pilot project. Further, none of the studies we found in the literature investigated the inclusion of EVs as part of MaaS bundles, such as e-car sharing or e-scooter sharing. Thus, considering these research gaps, we seek to answer the following research questions:
  • Research Question 1: What are the most attractive attributes of MaaS bundles in suburban areas/residential settlements?
  • Research Question 2: How high is the potential users’ purchase intention of MaaS bundles that include EVs (i.e., e-car sharing and/or e-scooter sharing)?
  • Research Question 3: What differences regarding respondents’ socio-demographic (e.g., gender, age, income), psychological (e.g., climate change concerns) and behavioral (e.g., car usage) characteristics can be identified between (non-)adopter groups in suburban areas/residential settlements?

3. Methodology and Data

3.1. Data Collection and Sample

This paper builds on a web-based survey (n = 247) conducted in Austria in 2019 in course of the research project “hi MOBIL—Multi-modal mobility node Klagenfurt-Harbach”. The hi MOBIL project’s goal is to install a multimodal mobility point as part of the real estate project “hi Harbach” in Klagenfurt, Carinthia, that will provide residents with MaaS offerings. Our sample consists of individuals who, at the point of testing, were registered at the two involved real estate companies as prospective hi Harbach residents and current residents in the Harbach district, which would also have the possibility of using the multimodal mobility point (At the point of testing, 600 prospective residents of hi Harbach were registered with the real estate companies. Due to data privacy issues the real estate companies sent out the survey invitation (as well as two reminders) per email. Of the prospective residents, 149 participated in our survey, which was a response rate of 24.8% for this subgroup of the sample. The residents in the Harbach district within a radius of 1 km of the hi Harbach project (approx. 5943 individuals) were invited to participate in the survey via mass mailing (including the survey link, which was directly indicated in the text and alternatively accessible via QR code). Of these residents. 98 participated in the survey, which was a response rate of 1.6% for this subgroup of our sample. We checked for statistically significant differences in preferences between these two subgroups but did not find any.). The questionnaire included a section on travel behavior and a conjoint experiment to investigate preferences and WTP for different features of the multimodal mobility offering, which included transport modes (e.g., PT, e-car sharing), contract termination modes, modes of access to the MaaS offering, and price per month. To incentivize survey participation, the respondents could be included in a raffle offering prizes such as a hotel voucher.

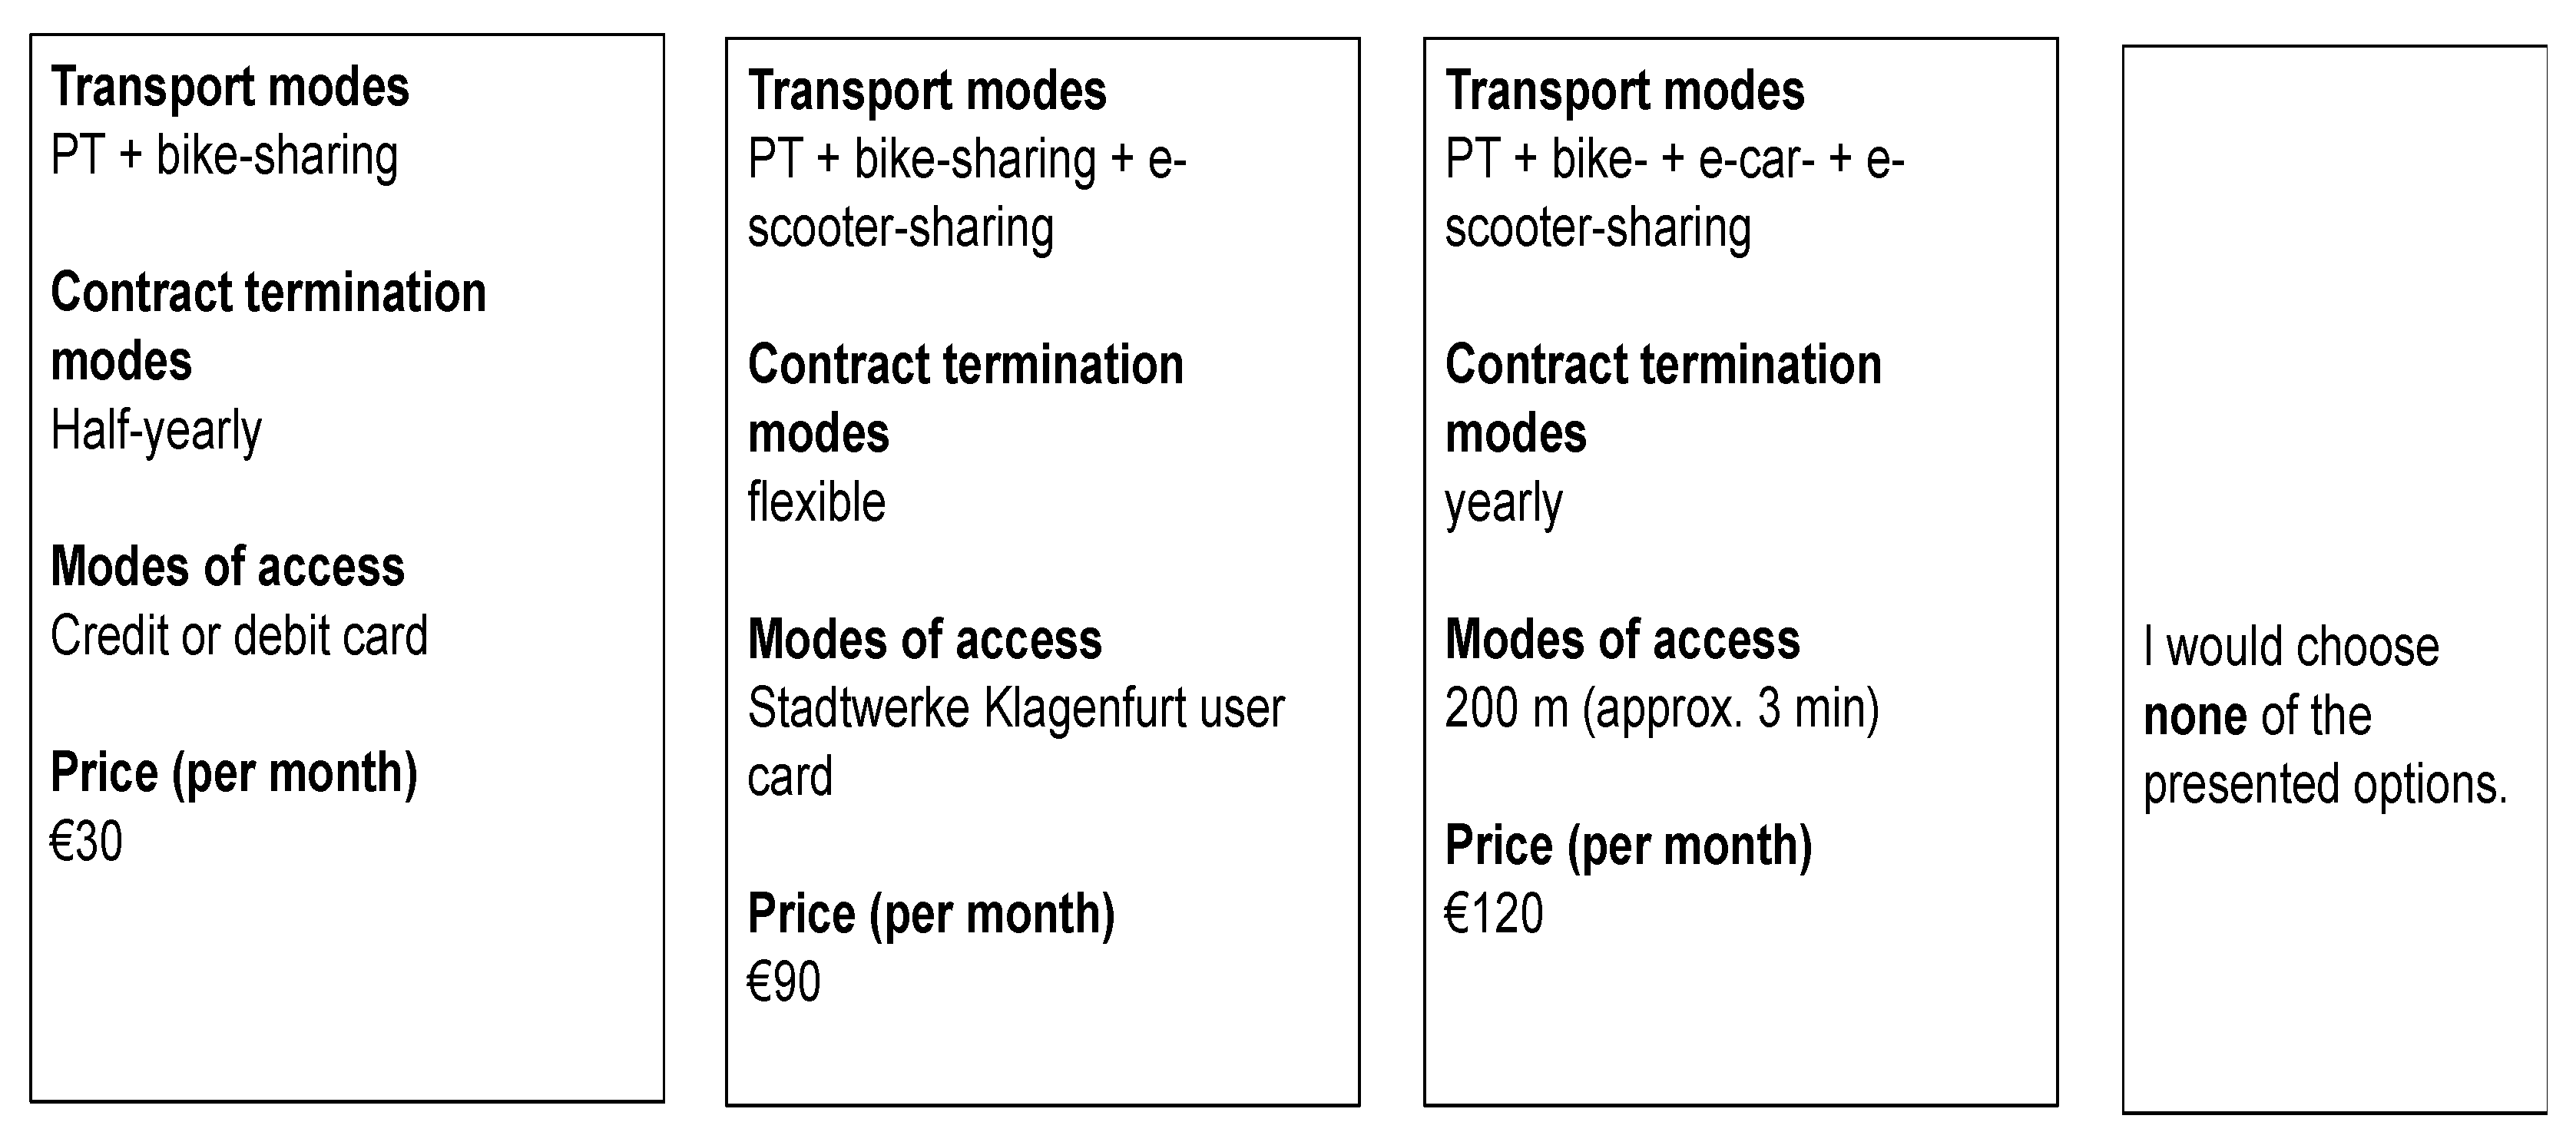
3.2. Choice-Based Conjoint

To identify the relative importance of the factors included in the study testing the willingness to purchase MaaS bundles, we used conjoint analysis, or specifically, a CBC experiment. This method is widely used in marketing research and practice (e.g., studying product design or pricing; conducting market segmentation based on stated preference data, etc.) [51]. It counts as mainstream in research on decision-making [52,53] especially due to its indirect approach to determining preferences for specific decision attributes and attribute levels. The indirect questioning approach consists of several choice tasks where respondents have to choose one of a number (typically 3 to 4) of alternative options (e.g., existing or hypothetical products or services). The respondents’ choices are taken as the dependent variable in the estimation model. The options in the choice tasks are described along a set of pre-defined attributes with levels varying on a random basis between the options within and between the choice tasks. These attributes and attribute levels are treated as independent variables for which part-worth utilities are estimated based on the assumption that these part-worth utilities add up to the overall utility of the product or service [52,53,54]. This indirect, decompositional approach to measuring preferences has several advantages over other methods (e.g., interview, survey). For instance, CBC allows for a real-time collection of data and, thus, for a more direct and accurate investigation of consumer decision models, which deals with issues typically associated with methods based on self-reports such as social desirability and hindsight biases e.g., [55]. Further, this research method is highly suitable for products or services that are not in the market yet or of which the market diffusion is still limited [56,57]. This is the case in our research context where we study preferences for MaaS bundle features in Austria.

3.3. Survey Design

The survey consisted of two parts. First, we administered a questionnaire assessing the mobility behavior of respondents (asking, e.g., “How often do you use the following transport modes?”) and collecting data on their socio-demographic (e.g., gender, age, income) and psychological (e.g., climate change concerns) characteristics (see Table A1 and Table A2). Second, we included the CBC experiment in the survey. Before the CBC experiment started, the respondents received an introduction which gave them details on the attributes and attribute levels that described the MaaS bundle options in the choice tasks (e.g., different transport modes, modes of access) and provided an illustrative example (see Figure 1). The study was pre-tested with the hi MOBIL project partners, experts from the mobility sector, and potential users. Table 1 below summarizes the selected attributes and attribute levels we used in this study.
To investigate the impact of including EV sharing modes (i.e., e-car sharing and/or e-scooter sharing) in MaaS bundles on the potential users’ purchase intention we used the following four levels for the attribute transport modes: (1) PT + bike sharing (baseline offering), (2) PT + bike sharing + e-scooter sharing (package that includes e-scooter sharing only to determine part-worth utility for this specific EV sharing mode), (3) PT + bike sharing + e-car sharing (package that includes e-car sharing only to determine part-worth utility for this specific EV sharing mode), and (4) PT + bike sharing + e-car sharing + e-scooter sharing (package that includes both e-scooter sharing and e-car sharing, to determine part-worth utility for combining these two EV sharing modes).
The conjoint experiment comprised 12 choice tasks, which is in line with other studies in this field e.g., [58,59,60]. In general, the recommended number of choice tasks depends on different parameters such as the number of attributes and attribute levels or the targeted sample size [61]. Each of the choice tasks in this study comprised three options of hypothetical MaaS bundles described by our four pre-defined attributes. In order to mirror real purchase situations, we added a fourth alternative to each choice task, i.e., a so-called “none option”, that respondents could choose if they did not prefer any of the other three presented options (see Figure 1). In each choice task, the respondents had to select which option of the four they preferred most. We designed our CBC experiment by following a full-profile approach (all attributes were shown in each of the choice tasks) and a balanced-overlap design strategy (balanced level of overlap of attribute levels between alternatives within choice tasks) [61,62].

3.4. Data Analysis

We used Sawtooth Software’s Lighthouse Studio to design the CBC experiment and to analyze the stated preference data. We applied a hierarchical Bayes (HB) model implemented in Lighthouse Studio to estimate the part-worth utilities for the overall sample. The HB procedure estimates robust part-worth utilities on an individual level, which makes it superior to alternatives such as multinomial logit models that only estimate utilities on an aggregated level [63,64]. For more details on the HB estimation procedure see [61]. We used the average root likelihood (RLH) value (geometric mean of all predicted probabilities) as a measure of the goodness of fit of our model [61]. The average RLH value for our model was 0.67, which means that our model was 2.7 times better than the chance model (0.25, i.e., the predicted probability of randomly choosing one of the four options (1/4) within each choice task).
Further investigating the results from the HB estimation, we used another well-established method, LCA, that clusters the overall sample (n = 247) into largely homogeneous groups to gain more insight on the preference heterogeneity among respondents and to identify different customer segments [65,66]. As LCA uses different starting points at each computation, [66] recommends re-running the model several times and estimating a number of different group solutions. Following this advice, we estimated two-group to five-group-solutions and retained for each group solution the estimate with the highest chi-square score. Besides the chi-square score, we also used other quality criteria—percent certainty and the Consistent Akaike Information Criterion (CAIC)—to identify the best segmentation result (see Table 2).
The scores for percent certainty and chi-square can be interpreted as “the higher, the better” as they indicate how much better a solution is in comparison to a “no segments” solution. CAIC, on the contrary, needs to be minimized [67,68]. Table 2 shows that percent certainty and chi-square advocated for a five-group-solution, but CAIC was at its minimum with a four-group-solution. However, in order to define the optimal number of segments, we additionally checked the group sizes (very large and very small groups should be avoided), as well as the interpretability of the part-worth utilities and relative importance scores of the groups, checking whether the groups and differences between them can be described meaningfully, as the literature recommends [66]. Thus, the model we finally chose was the three-group-solution (for further details on the customer segments, see Section 4.3).
Further, we conducted a sensitivity analysis based on market simulations using part-worth data by assessing different variations of MaaS bundles. We applied a randomized first choice model to estimate the share of preference per customer segment for each of the MaaS bundle scenarios [69].

4. Results

4.1. Part-Worth Utilities and Relative Importance Scores

In this section, we present the results regarding the relative importance of attributes included in the CBC experiment (e.g., transport modes, price (per month)) and the part-worth utilities per attribute level. The relative importance scores were determined by the difference between the highest and lowest part-worth utility per level for each attribute and represent the attribute’s impact on the dependent variable, i.e., purchase intention. Due to standardization over all attributes the scores sum up to 100% making it possible to compare the scores between attributes. Our results showed that the attribute price (per month) was the most important consideration for the respondents in our sample (49.10%). After price of the package, in terms of importance ranking, respondents rated transport mode (27.28%), contract termination mode (13.19%), and modes of access (10.42%). These findings indicated that monthly price had the largest effect on the overall utility of the MaaS bundles and, thus, on respondents’ purchase intention. The attributes termination mode and modes of access each had a relatively marginal effect on purchase intention.
Further, Table 3 gives an overview of the part-worth estimation results per attribute level with corresponding standard deviations and 95% confidence intervals. The part-worth utility of an attribute level can only be compared to those of other levels of the same attribute. It represents the desirability of a specific attribute level for the respondents (e.g., the higher the utility score, the more positive its effect on the intention to purchase the MaaS bundle). The attribute levels with the highest utility scores per attribute were as follows: €30/month (lowest bundle price), bundles including all offered transport modes (PT + bike sharing + e-car sharing + e-scooter sharing), flexible cancellation options, and the Stadtwerke Klagenfurt user card as mode of access to the MaaS services. That the respondents in our sample preferred the highest service for the lowest bundle price with flexible cancellation options seems obvious. However, that the respondents preferred the PT user card instead of an app was an interesting finding. In the questionnaire used in the survey, we also directly asked the respondents to indicate their most preferred level for each of the attributes (except for monthly price, of which the direct WTP was assessed in a separate question) included in our conjoint design (build-your-own (BYO) exercise). The results of the BYO exercise (see Table A7) show that direct preference for an app is twice as high as for the Stadtwerke Klagenfurt user card (These different results of the direct and indirect questioning approaches might be explained by this attribute, modes of access, having the lowest relative importance (10.42%). This typically happens when respondents do not pay close attention to variations related to an attribute in the choice tasks.). For the other attributes, the BYO showed results similar to the CBC analysis.

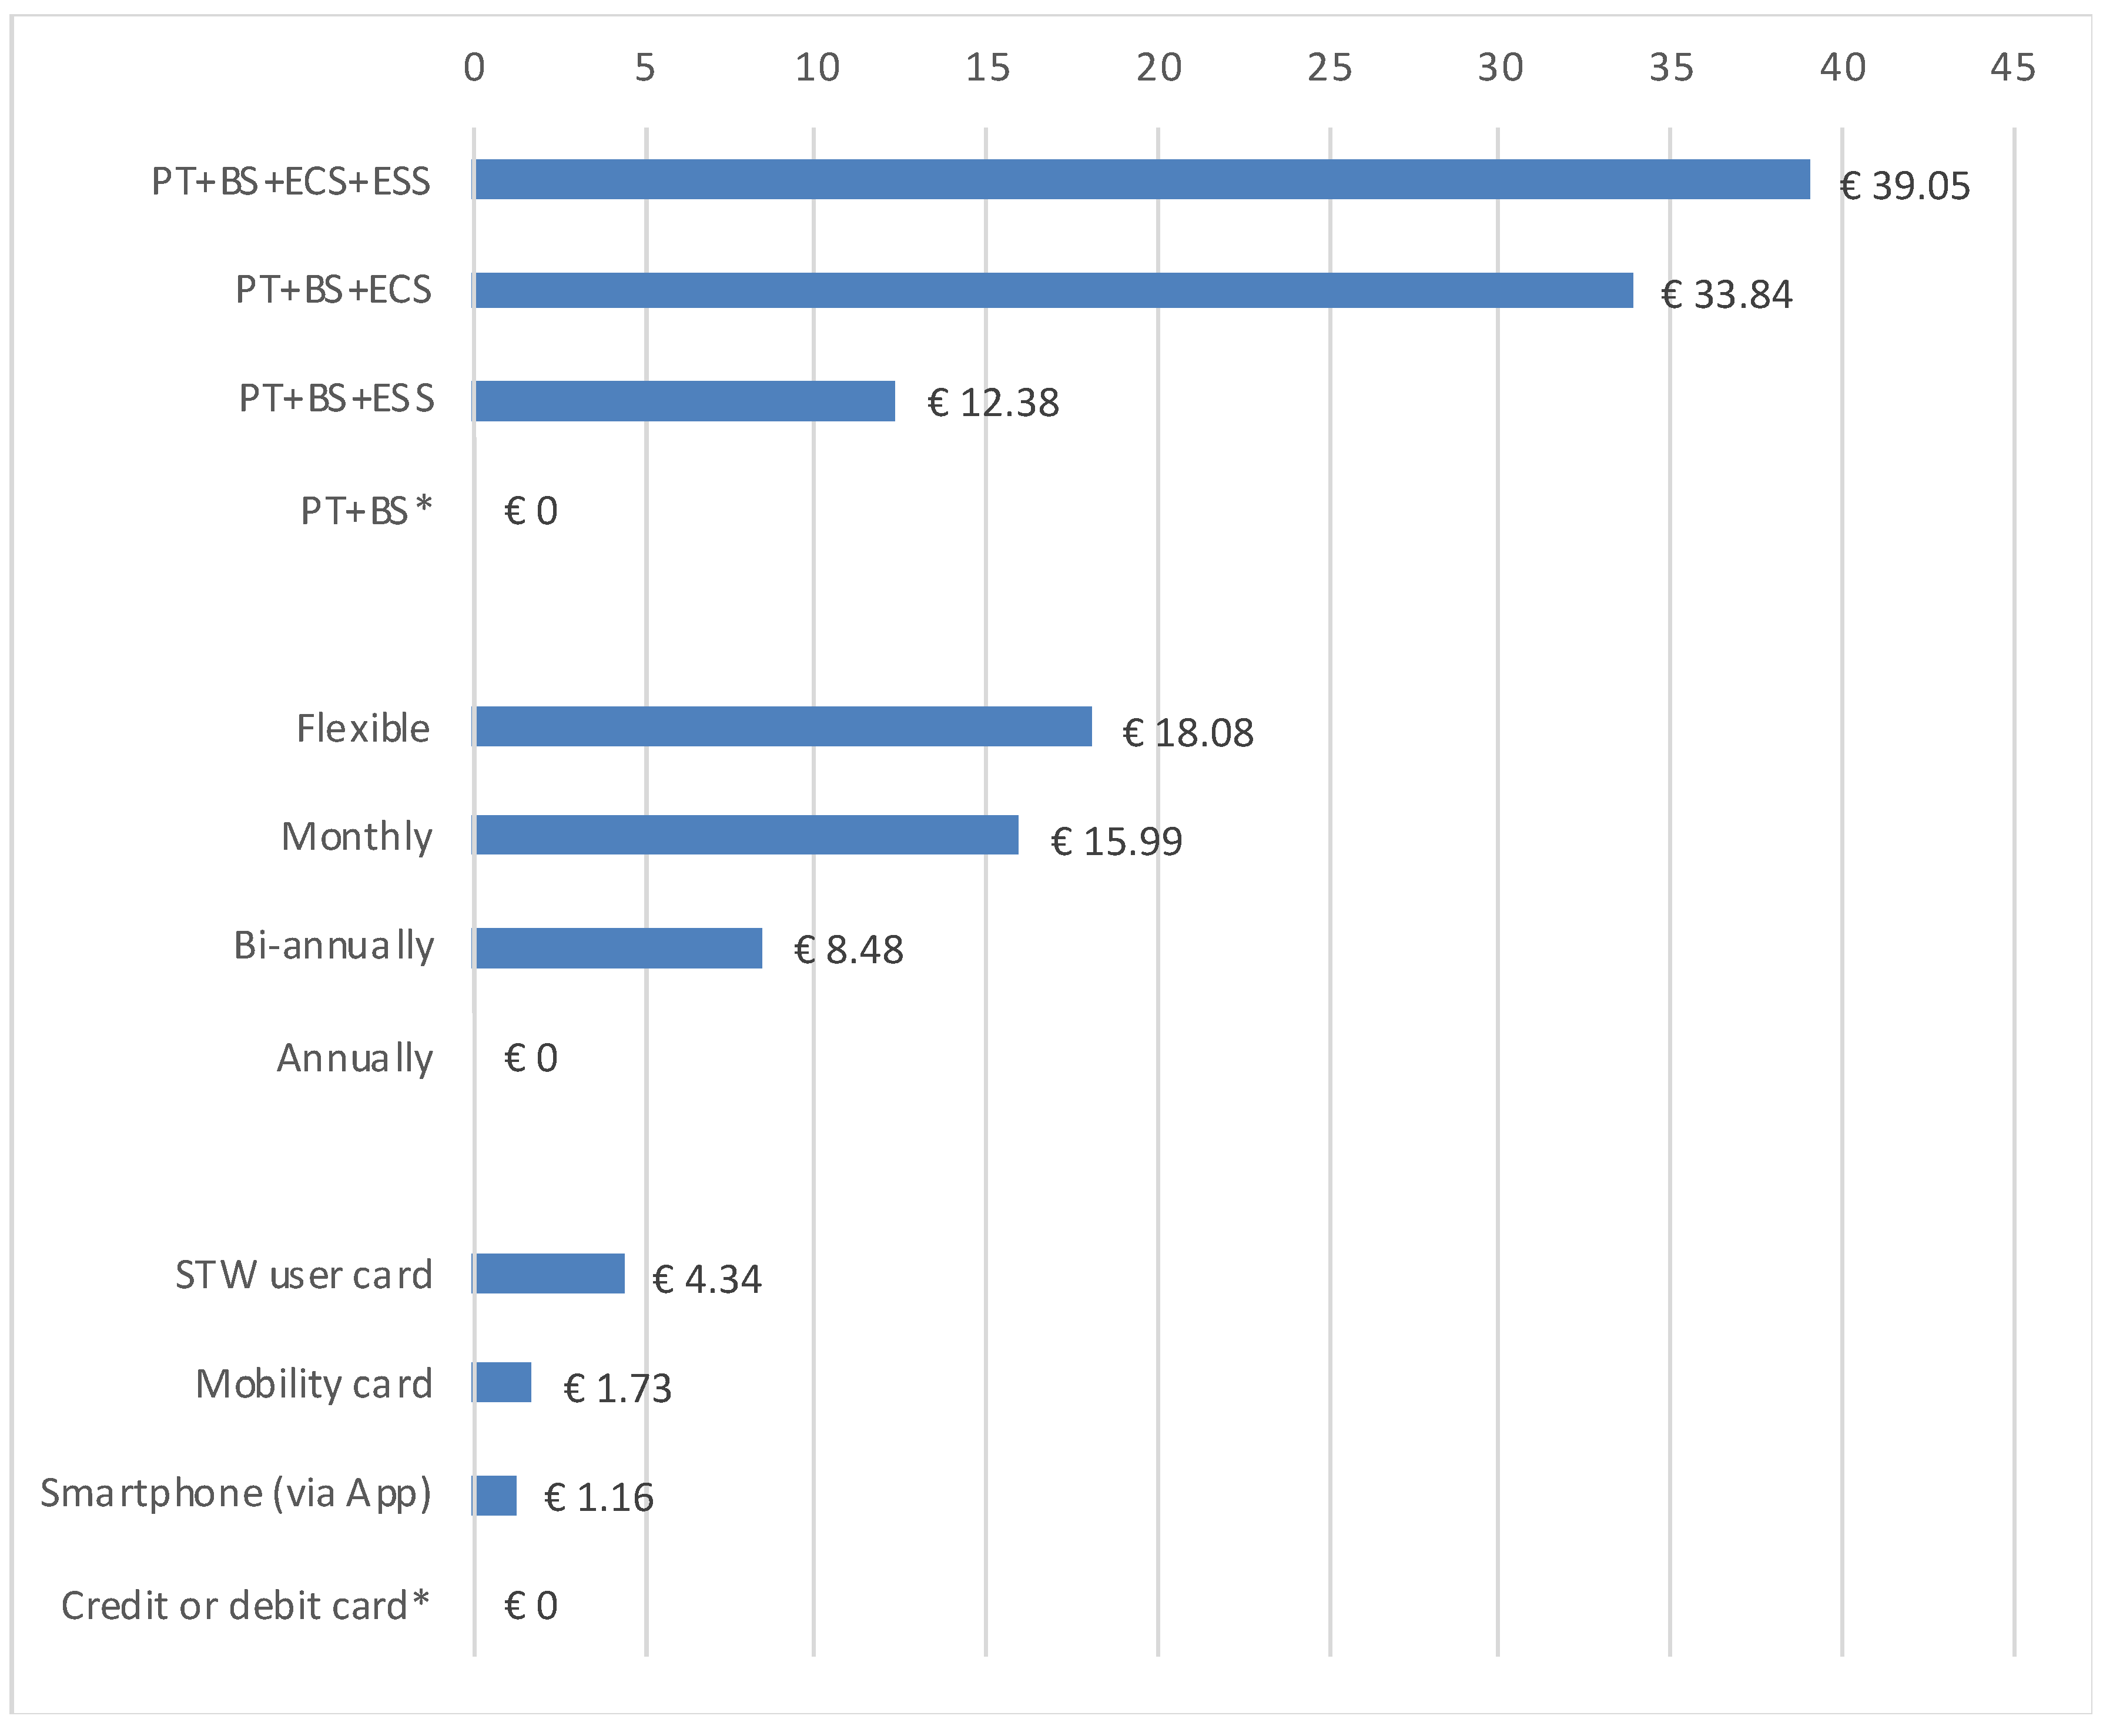
4.2. Willingness-to-Pay

To define the respondents’ WTP for the different attributes of MaaS packages included in our CBC experiment, we transformed the part-worth utilities per attribute level into monetary values. As we treated all independent variables (attribute levels, including the levels of the price attribute) as categorial variables in our estimation [70], we determined the WTP for this part-worth model using the following formula [71,72]:
WTP   ( u ij ) =   ( u ij   u ij   Default ) p max p min u pj   max u pj   min
This formula defines WTP as the difference between the part-worth utility (uij) of an attribute’s (i) level (j) and a default part-worth utility (uij Default) (i.e., the least preferred attribute level in the same attribute) multiplied by the price of one utility unit (i.e., difference between the highest (pmax) and lowest (pmin) level of the price attribute divided by the utility difference between the highest and lowest price level (upj max–upj min)). Figure 2 shows the WTP values indirectly calculated based on the results of the CBC experiment.
In order to provide additional insight on the respondents’ WTP, we also included a question in the questionnaire part of the survey asking directly how much the respondents would be willing to pay for a MaaS package that meets their preferences. Overall, the results indicated that study participants, if directly asked, were willing to pay approx. €52 for such a MaaS package. Figure 3 shows, based on the answers to this open question, how many respondents in our sample (in percentage) were willing to buy a MaaS package at a given price level. For instance, the market potential of a product with a price of €25 would be 79%.

4.3. Customer Segments

In a further step, we applied LCA to further explore the heterogeneity of preferences in the study sample. As described in Section 3.4, we chose a three-group-solution as our final segmentation result applying multiple criteria. Table 4 and Table 5 give detailed overviews of the differences in the part-worth utilities as well as relative importance scores of the attributes and attribute levels between the three customer segments. Building on insights presented in the tables, we labelled these segments as convenience seekers, price-sensitive worriers, and non-adopters.
Considering the respondents’ stated preferences on segment level, we labeled the first potential adopter group convenience seekers (n = 77, 31.2% of the respondents). In general, they rated price as the most important attribute (57.1%), as did respondents in the other two segments. The attribute they rated as second most important, is transport modes (31.0%). Considering the part-worth utilities for that attribute we found that the respondents in this segment most preferred offerings including PT + bike sharing + e-car sharing + e-scooter sharing. Contrary to the other two segments, this group preferred an own mobility card to other modes of accessing the mobility services included in the bundle. Investigating socio-demographic differences between the segments showed that convenience seekers were significantly younger than non-adopters (p = 0.004) (see Table A1 and Table A3). Regarding household income (net/month) this group indicated the highest value on average (€2664.8); however, their differences to the other two groups were statistically not significant. Further, almost all respondents in this group (93.5%) owned at least one car which, compared to the other segments, costed the most per month (approx. €260 for fuel, insurance, etc.). In comparison to the other groups, a higher share of respondents in this segment used their car on a daily basis (13% versus 9.7% of the price-sensitive worriers and 2.6% of the non-adopters; see Table A1 and Table A4). This group generally was the most interested in and willing to adopt multimodal services, i.e., more than 71.4% of the respondents in this segment indicated that they (most) likely would purchase a MaaS bundle that meets their preferences. This was also reflected in the negative value of the none option in our part-worth model (−150.90). Their directly indicated WTP for a MaaS package that met their preferences was the highest among the three groups, i.e., €62.3, on average. In this regard, the convenience seekers significantly differed from the price-sensitive worriers (€54.8, p < 0.001) and the non-adopters (€38.0, p < 0.001). Finally, the results showed a significant difference regarding the subjective norm (peer group effect) between the segments (p < 0.001). Regarding this variable, the convenience seekers (3.13) significantly differed in relation to the other two segments, i.e., the non-adopters (2.61, p < 0.001) and price-sensitive worriers (2.73, p = 0.004).
The second potential adopter segment was labeled price-sensitive worriers (n = 93, 37.6%). The respondents in this group paid the most attention of all groups to the monthly price of the bundles in the choice tasks (63.4%). Further, they most preferred a monthly contract termination mode in comparison to the other two groups that preferred a flexible one. Regarding the mobility services included in the bundle, they most preferred a combination of PT + bike sharing + e-car sharing; rather than a package with the largest range of services, i.e., one also including e-scooter sharing, they preferred the slightly reduced choice, although the difference between these two part-worth values was small (40.29 and 37.65, respectively). These findings are in line with the results of our BYO exercise, which shows that this group found no added value if e-scooter sharing was included in the package. Regarding age, the price-sensitive worriers were significantly younger than the non-adopters (p = 0.001). Further, they expressed a significantly higher willingness to adopt MaaS packages (61.3%) than the non-adopters group (36.4%, p < 0.001).
We labeled the third adopter segment non-adopters (n = 77, 31.2%). Our part-worth estimates revealed the highest value of the none option in this group (353.73), indicating that these respondents most often chose the none option in the choice tasks, i.e., they did not prefer any of the three presented MaaS bundle variations. Further, in our direct question on the general willingness to adopt MaaS bundles, this group was the least likely of all three segments (approx. 36%) to adopt a MaaS package. They also showed a significantly lower directly indicated WTP in relation to the other two segments (convenience seekers p = 0.001; price-sensitive worriers p = 0.023). Although, this segment scored the lowest on the willingness to adopt MaaS bundles, some other relevant criteria were insightful and distinctive. This group stood out regarding the relatively high importance it assigned to the attribute contract termination modes (33.1%) and its desire for flexibility in contract termination. In contrast to the other segments, this group’s respondents were significantly older (p < 0.001), with an average age of 52.2. Overall, compared to the other two segments this group had the lowest share of car owners (83.1%), those who did own cars use them the least often (only 2.6% indicated using their cars on a daily basis), and, apparently due to low mobility needs, had the lowest monthly costs for a car (approx. €226), which might partly explain their low interest in MaaS bundles.

4.4. Sensitivity Analysis on Segment Level

Building on the LCA results, we conducted a sensitivity analysis to test for differences in the segments’ preferences (randomized first choice) regarding variations in the MaaS bundle features. Following here, we present the results of four market simulations and graphically summarize these results in Figure 4, below.

4.4.1. Simulation 1: Transport Modes

For the first simulation we designed MaaS packages to evaluate the effect of different transport mode combinations on the segments’ choice. All created packages differed only regarding the transport mode attribute: (1) PT + bike sharing, (2) PT+ bike sharing + e-scooter sharing, (3) PT+ bike sharing + e-car sharing, and (4) PT+ bike sharing + e-car sharing + e-scooter sharing. The other attributes were held constant at an annual subscription, an own mobility card as access mode, and a price of €30 per month (This price level seems to be realistic for a baseline offering of mobility services (i.e., PT + bike sharing) as a monthly ticket at the Stadtwerke Klagenfurt would cost a city of Klagenfurt resident €25 (see https://www.stw.at/privat/mobilitaet/tickets-tarife-und-abos/#30-tage-karte-umweltschutz), while they charge €4 per month for using nextbike’s bike sharing services. An annual subscription mode would allow for lower prices per month if more transport modes were added to the bundle, and an own mobility card for accessing the services would allow a higher level of independence from only one provider.). The results showed that the largest share of respondents in the convenience seekers’ segment (96%) would prefer a bundle that includes PT+ bike sharing + e-car sharing + e-scooter sharing, all else being equal. However, the difference between the most and second most preferred levels (PT+ bike sharing + e-car sharing) was quite small (1.1 percentage points), which suggested that e-scooter sharing provided these respondents only marginal value. Overall this segment showed a very high preference (> 85% of the respondents in this segment would choose this bundle in the market) for each of the bundle combinations, which underlined their high willingness to adopt MaaS offerings. The group of price-sensitive worriers most preferred a package including a combination of PT+ bike sharing + e-car sharing as mobility services (65.1%). In contrast, the non-adopters showed consistently low preference for all the package combinations in this first simulation (< = 3.9%).

4.4.2. Simulation 2: Contract Termination Modes

In the second simulation, we tested for preference share sensitivity regarding the contract termination mode. We varied the attribute according to its four levels (annually, bi-annually, monthly, flexible), while other dimensions were held stable as in the first simulation (the attribute transport modes remained constant at PT + bike sharing). The second simulation results revealed similar tendencies to those of the first simulation. The convenience seekers most preferred a package with a flexible contract termination mode and the price-sensitive worriers one with a monthly subscription. However, the difference between the most and the second most preferred levels of the convenience seekers (88.1% and 87.8% respectively) and the price-sensitive worriers (39.3% and 38.4%, respectively) groups was only marginal. Again, this second market simulation highlighted the significant willingness of respondents in the convenience seekers segment (>85%) to adopt a MaaS package.

4.4.3. Simulation 3: Modes of Access

For our third simulation we varied the modes of access (mobility card, app, credit or debit card, and Stadtwerke Klagenfurt user card) to our baseline MaaS offering, keeping all other attributes stable. The results indicated that the mobility card was the most preferred access mode among the respondents of the convenience seekers segment (85.8%), which was the access mode we chose for our baseline MaaS bundle. The price-sensitive worriers most preferred the Stadtwerke Klagenfurt user card, where 29.5% would be willing to buy a MaaS package with such an access mode. The BYO exercise disclosed that the most attractive access mode for all groups, would be the app. If the mode of access were switched to this level (app), then the two likely adopter groups’ share of preference would drop to 82.5% and 24.5%, respectively.

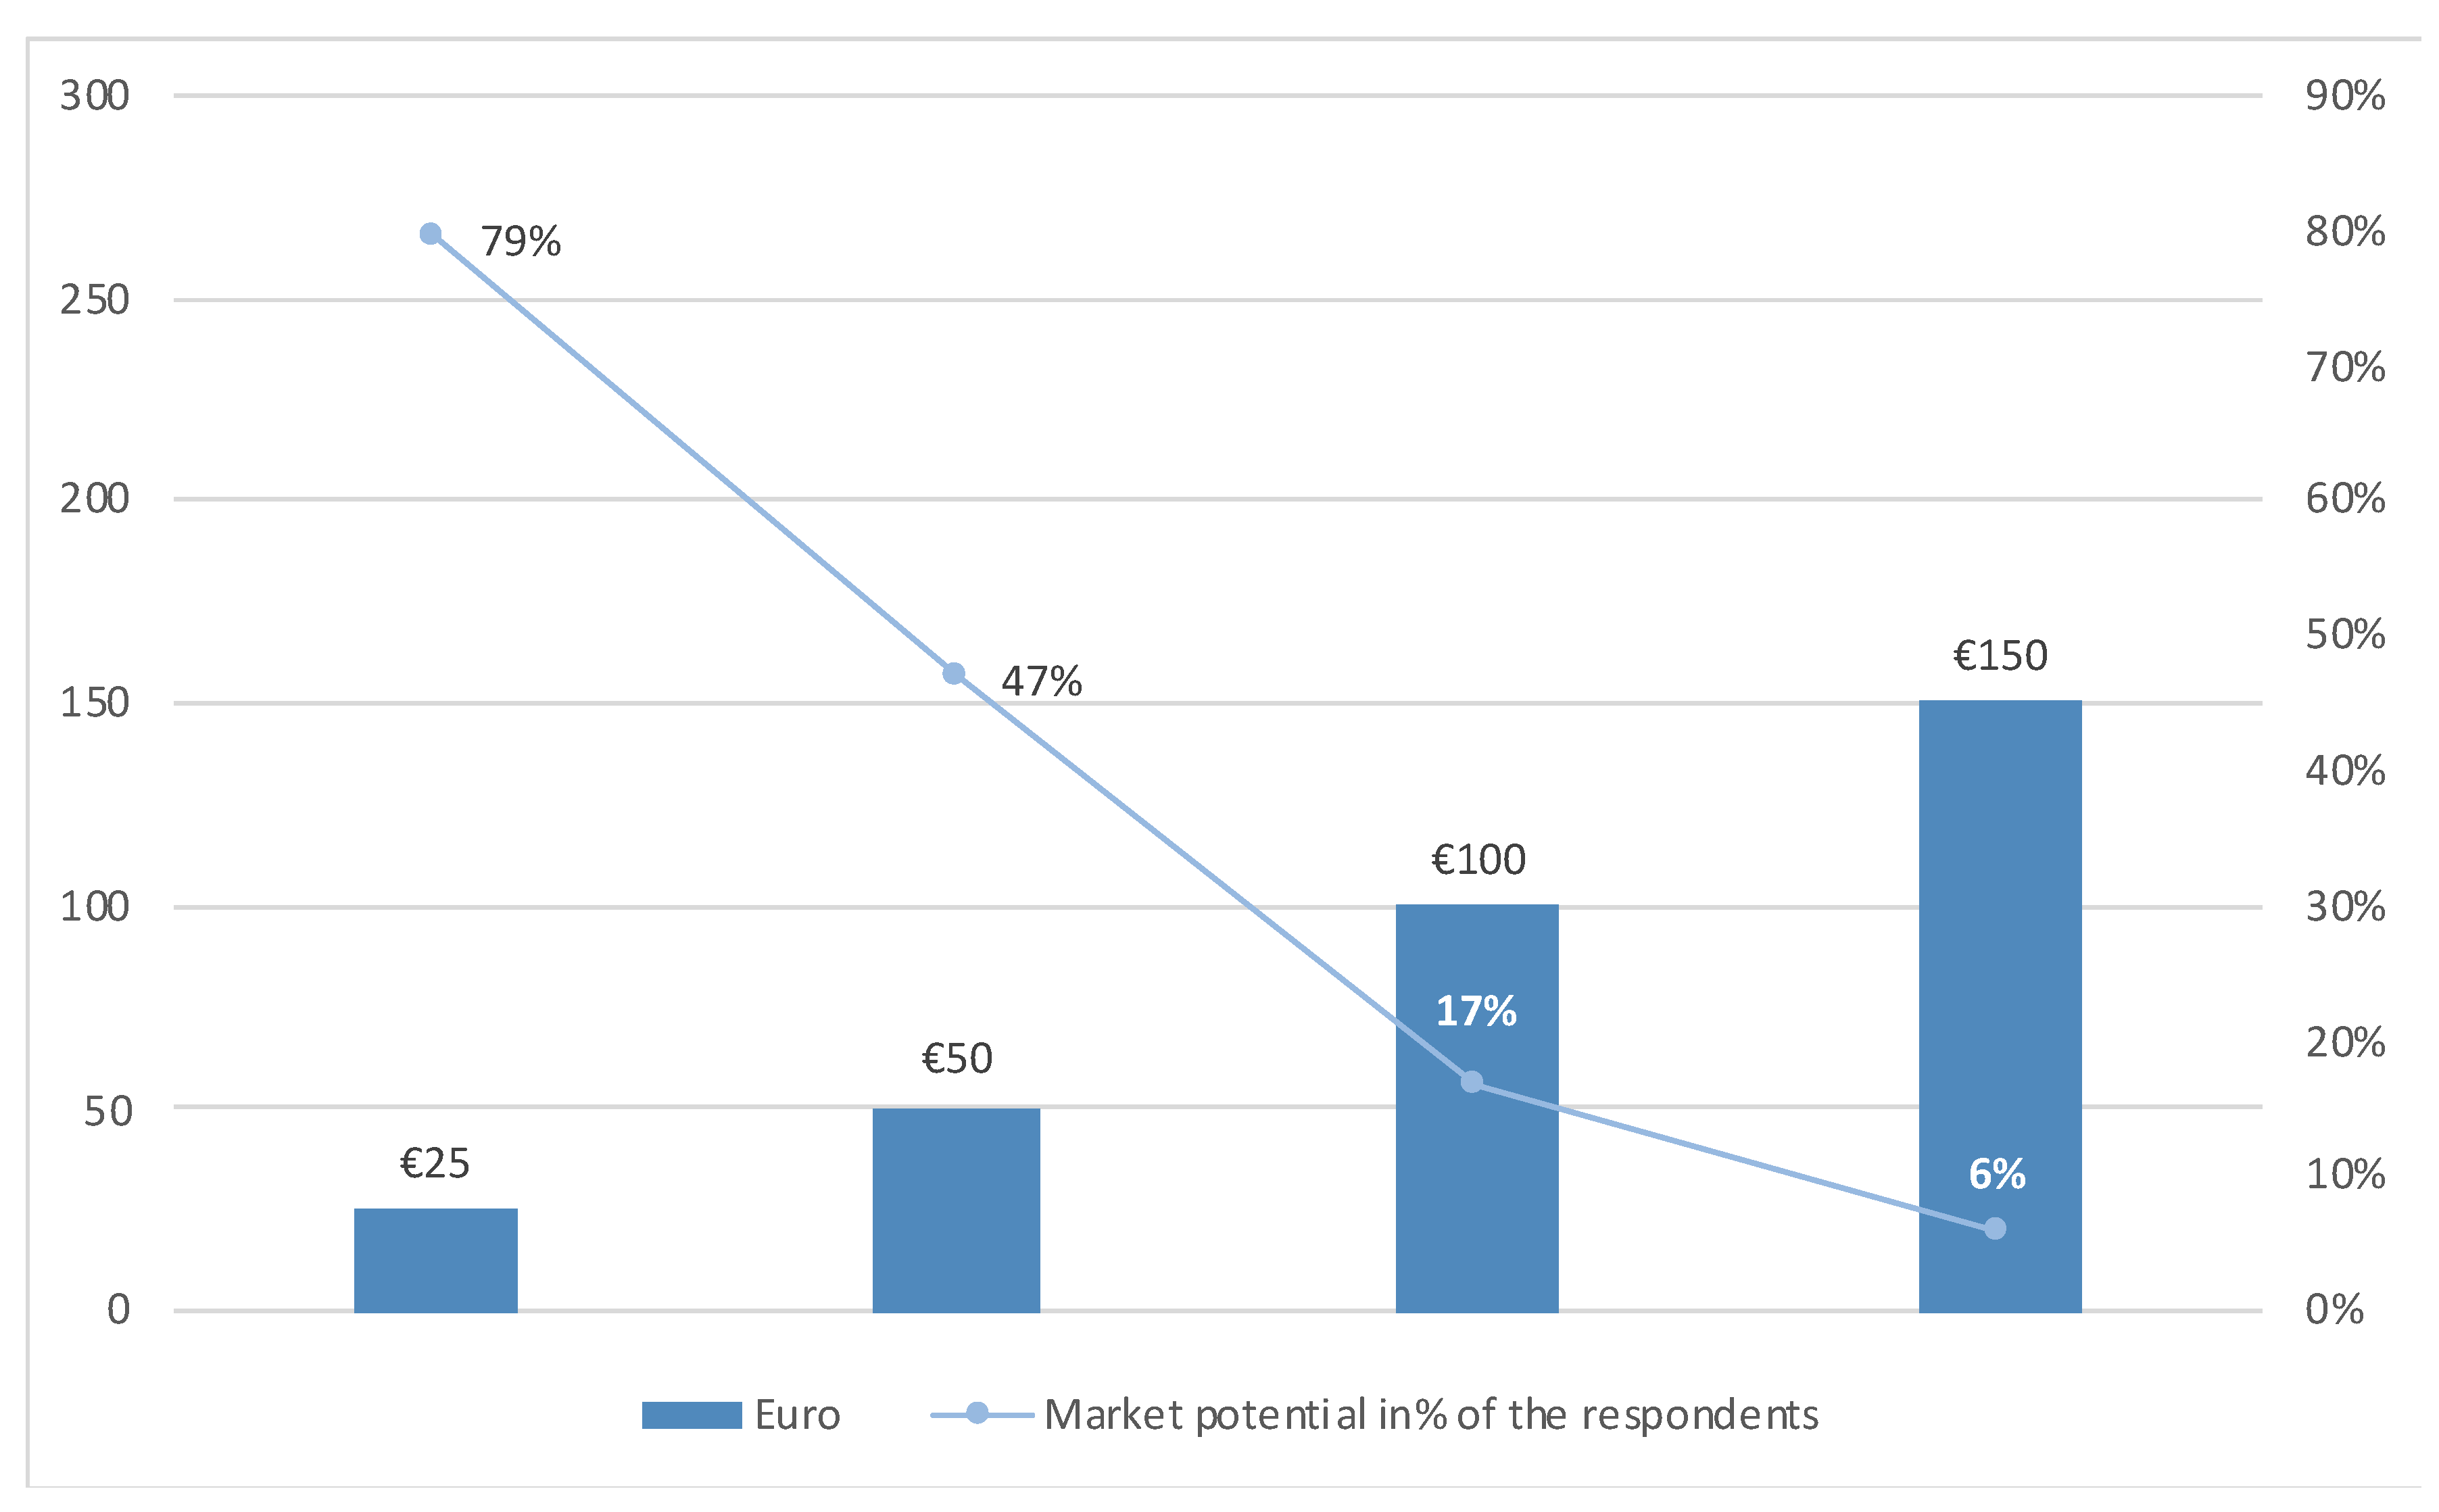
4.4.4. Simulation 4: Price (Per Month)

The last sensitivity analysis varies the price level (€30, €60, €90 and €120), keeping all other variables equal. This simulation reflected the tremendous importance of price for the respondents in our sample. Specifically, the convenience seekers’ share of preference for our baseline product (85.8%) would significantly drop to nearly half of its value, i.e., 41.8%, if the price were to increase from €30 to €120. However, compared to the other two groups, this segment remained the one with the highest willingness to pay in monetary terms, as even at a price level of €120, a share of more than 40% of the respondents in this sample would opt for such a MaaS bundle. The share of price-sensitive worriers would drop from 25.2% for the reference product to 4.0% if the price of the MaaS package were doubled to €60.

4.5. Insights on Electric Vehicles as a Part of the MaaS Packages

Besides considering the respondents’ preferences for various features of MaaS packages, this study took a closer look at the role of EVs, i.e., e-car sharing and e-scooter sharing, in MaaS bundle adoption. Our CBC experiment’s results suggest that the respondents in our sample strongly prefer a MaaS package including e-car sharing to one including e-scooter sharing. The differences between the part-worth utilities of the transport mode levels clearly suggested this in that, compared to PT + bike sharing (reference level) utility increased by 26.20 points if e-scooter sharing was added to the bundle (see Table 3), whereas it increased by 71.62 points if e-car sharing was added. Additionally, the difference between the level PT + bike sharing + e-car sharing and the level which included all transport modes, was only 11.03 utility points. This finding was also reflected in our CBC experiment’s segment level results for our two potential adopter groups. For the price-sensitive worriers, part-worth utility even decreased from 40.29 to 37.65 (see Table 4) if e-scooter sharing was added to a bundle that has PT + bike sharing + e-car sharing. The results of the BYO exercise provided an even clearer picture (Table A7): 14.6% of the respondents would opt for a bundle including PT + bike sharing + e-scooter sharing and about one third (34.8%) would opt for the same bundle that had e-car sharing, instead.
Further, we asked the respondents in the questionnaire part of our survey to indicate what transport modes they would include in a MaaS bundle. The survey participants rated several transport modes on a scale ranging from 1 = “should not be included at all” to 4 = “should definitely be included”. Table 6 below shows the share of respondents that selected each of these scale values, and Table A6 gives an overview of the rating means of the segments compared to the overall sample. In the last column of this table, we summed up the shares for the two highest preference levels (should definitely be included and should be included). The results show that e-car sharing was selected by 68.8% of the respondents to be (definitely) included in a MaaS bundle, and thus ranked third after two modes representing PT. Respondents preferred e-car sharing even more than conventional car sharing (63.2%). Interestingly, bike sharing and e-bike sharing were equally preferred (58.3%). Of the respondents, 43.3% selected e-scooter sharing to be included in a MaaS bundle, whereas only 27.5% of the respondents selected e-load-cycle sharing that we had also included in the list.

5. Discussion and Conclusions

Based on the fact that the transport sector is the highest contributor to greenhouse gas emissions [73], Collins et al. (p. 640, [74]) noted that selecting travel modes is “among the most environmentally-significant decisions faced by individuals”. Thus, in the context of the present study and following recent calls in the literature e.g., [21,45], we investigated individuals’ preferences for MaaS bundles that include more sustainable transport modes (i.e., PT, bike sharing, e-car sharing, e-scooter sharing) with the ultimate goal of decreasing individual car ownership and usage. In contrast to existing studies that have mainly focused on urban areas, we aimed to gain insight on potential adopters’ preferences for MaaS packages in sub-urban areas. Further, the study intended to shed light on the impact EVs, i.e., e-cars and e-scooters, included in MaaS bundles would have on the adoption of such multimodal mobility services.

5.1. Discussion of Results and Implications

The study’s findings highlight the importance of a MaaS bundle’s price regarding its acceptance, as other researchers have shown in the past, studying different geographical contexts e.g., [21,22,25,46]. The CBC results reveal that price contributes nearly 50% (49.10%) to the overall utility of the average respondent in our sample. Directly asked, the average study participant would be willing to pay approx. €52 for a MaaS package that meets their preferences. Although the LCA results show that there are differences between the segments in the relative importance values they assign to the price attribute, they are still at a high level (e.g., the lowest relative importance value is 43.7% for the non-adopters group). The convenience seekers segment shows the highest WTP in both the CBC analysis and the direct question implemented in the questionnaire part of the survey. The differences in the part-worth values for the levels €30 (106.25) and €60 (50.60) for the convenience seekers is much smaller (55.65 utility points) than for the other potential adopter group, i.e., the price-sensitive worriers, (95.67 utility points). The differences between the two groups are quite similar in the part-worth utilities for the higher price levels. This group difference in price sensitivity is also reflected in the simulation results. Moreover, average direct WTP indications significantly differ (p < 0.001) between the convenience seekers (€62.3) and the price-sensitive worriers (€54.8). The implications of these findings are that MaaS package providers need to consider varying WTP thresholds between different potential user segments, such as offering price-differentiated bundles (e.g., services or features that are included or excluded in the different bundles). Further, MaaS bundles’ price could be decreased by government subsidies (e.g., for using PT, as is already the case in Vienna where an annual PT pass at €365 costs comparatively much less than a 24 h-ticket at €8, and as is currently under discussion for roll-out in a similar way nationally, as the 1-2-3-ticket). However, recent scholarly work suggests that price sensitivity related to MaaS adoption is more pronounced in the early stages of market diffusion and might decrease with the maturity of the market and MaaS technology (e.g., an app) due to commuters’ increased experience with the new offerings [75].
The findings regarding the overall price the respondents in our study are willing to pay for MaaS services are related to the question of what the respondents are willing to pay for specific features of a MaaS offering. Our findings show that the second most important attribute in our stated preference analysis is transport mode (27.28%), i.e., what (type and quantity) of mobility services are included in the MaaS bundle. Overall, our analysis shows that the respondents prefer larger bundles (i.e., highest part-worth utility for PT + bike sharing + e-car sharing + e-scooter sharing; 37.54 part-worth utility) to smaller bundles (i.e., PT + bike sharing; −45.12 part-worth utility). On a more detailed level, our results suggest that the respondents do not perceive as much value in e-scooter sharing as in e-car sharing. If asked directly, almost 70% of the respondents in our sample would choose e-car sharing while only about 43% would choose e-scooter sharing as a basic component of MaaS packages they would purchase. Besides the fact that e-car sharing is a better substitute to private car ownership than e-scooter sharing, we found three reasons to be quite plausible explanations of these findings. First, e-scooter sharing is still quite novel in Austria, and more so in Klagenfurt. Although literature on product or service bundling suggests that product spill-over effects from more mature to less mature products or services increase the acceptance of the overall bundle [76,77,78], we cannot find such an effect in our survey results. Generally, the experience with sharing services is rather low in our sample, although the experience with (e-)scooter sharing is comparatively higher than for the other sharing modes (see Table A5). Second, an explanation for the lower preference for e-scooter sharing might be that e-scooters suffer from the same disadvantages as bikes such as in being dependent on weather conditions. Thus, as bike sharing, together with PT, was already included as baseline elements of the MaaS bundle, the respondents in our sample might not have perceived additional value in the mobility services provided by e-scooter sharing. Third, research on product/service bundling emphasizes the importance of value-adding complementarity of the products or services in the bundles, because otherwise consumers are more likely to purchase the products or services separately e.g., [77,79]. This agrees with Guidon et al.’s [45] findings, which showed that complementary mobility services such as PT and car sharing achieved the highest WTP among their respondents. The particular reasons at play regarding the lower preference for e-scooter sharing and similar transport modes (e.g., e-bike sharing) does, however, need further research. Nevertheless, these findings have important implications for the configuration of MaaS packages.
We found the other attributes we included in the CBC experiment (contract termination modes, modes of access) of marginal relative importance regarding respondents’ willingness to adopt MaaS bundles (13.19% and 10.42%, respectively); however, we noticed some interesting differences between the three segments. For instance, one third (33.1%) of the overall utility of the average respondent in the non-adopters group can be attributed to the contract termination mode. This segment specifically prefers flexible cancellation options, which could be a potential lever to convince current non-adopters to try out MaaS offerings, as they would be able to terminate the subscription easily and on short notice if they do not find it useful or practical. Further, the mode of access seems to be of marginally higher importance to the convenience seekers who would prefer an own mobility card rather than the Stadtwerke Klagenfurt user card, which was the most preferred level among the respondents of the other two groups. However, as we found contradictory results in our BYO exercise revealing the highest preference for accessing the services via a smartphone app (43.7% of the respondents), we encourage scholars to conduct further research in this field.
Overall our results show that the willingness to adopt MaaS bundles is rather high in our sample (56.7% indicate that they would (very) likely adopt a MaaS bundle that meets their preferences). However, whether the respondents in our sample would actually decrease individual car usage by adopting MaaS packages, remains an open question, which can only be answered in a real-life setting and by applying a longitudinal study design. Studies that investigated the success of MaaS pilot projects report that, at least, the immediate effects on the reduction of car usage are positive e.g., [41], but the sustainability of such behavioral changes is still unclear. Further, our study confirms the high preference for PT to be included in MaaS packages, as other scholars have also found in the past e.g., [21,24,45,47]. For instance, 92.7% of the respondents indicated that PT (e.g., bus, tram, metro) and 72.9% indicated that trains (e.g., regional trains) should (definitely) be included in a MaaS bundle.
Finally, we also tested for differences between the identified segments in socio-demographic, behavioral (mobility behavior), and psychological characteristics. Surprisingly, we did not find statistically significant differences between the two potential adopter groups and the non-adopters regarding sustainability-related psychological or behavioral variables investigated in our study, such as climate change concern, pro-environmental attitude or energy-saving behavior. This finding seems to refer to the often cited “attitude-behavior gap” or “attitude-intention-behavior gap” (for a recent literature review see e.g., [80]), explaining why pro-environmental attitudes often do not transform into pro-environmental behavior, or in our case, into purchase intention of environmentally friendly products. Further, in line with our results, Schikofsky et al.’s [81] qualitative study reports that pro-environmental attitudes are of “subordinated relevance” for the intention to adopt MaaS packages. However, they found that psychological needs such as autonomy, competence and relatedness to a social peer group are good predictors of the intention to use MaaS offerings. Thus, future research might further investigate the socio-psychological determinants of the intention to adopt MaaS offerings, as such insights could have important implications for how service providers should design offerings and marketing campaigns and what motives and attitudes of potential adopters they seek to address.

5.2. Limitations and Further Research

As with any research, the results of our study are subject to some limitations. First, it is important to mention that we drew the study sample from a sub-urban district in Klagenfurt, Carinthia. Thus, our analysis is limited to a specific regional section of the Austrian population. In future, research should test our findings in other (sub-urban) regions in Austria and in different demographic and cultural contexts. Second, looking more closely at methodological limitations, although the MaaS packages we tested were developed to be as realistic as possible, respondents’ decisions would still not be the same as real-life decisions in purchasing such packages and actually paying for these services. Future studies could compare stated preference data, like ours, with revealed preferences for MaaS offerings actually implemented in the market. Third, in the conjoint part of our study only a limited number of attributes and attribute levels were included. Building on a literature review, as well as on interviews with experts, stakeholders, potential adopters and the likes, there is a wide pallet of factors potentially influencing travel mode choice generally, and affecting purchase intention of MaaS packages, specifically (e.g., availability of transport modes within a certain distance to home/work, transfer time between modes, employers’ financial support of MaaS bundles, etc.). Further, we would encourage future research that combines preference data with data from secondary sources, such as transport sector-related characteristics of the cities or rural areas the respondents live in. For instance, [30] used local characteristics of 15 European cities, such as weather, PT satisfaction, density, city structure and the likes, to design multimodal mobility packages customized to the particularities of the cities. Additional analyses could further investigate potential supply-side effects of different local or regional MaaS offerings (e.g., implications for raw material and energy demand, settlement and housing patterns, etc.) [82]. Finally, although, we included a few psychological variables in our study, this still represents only a fraction of the individual characteristics that could be important for understanding potential MaaS package adopters’ preferences and for distinguishing between potential adopters and non-adopters. Future research should take this into account, and could use this study as a point of departure, considering a range of other factors not included here but found to be relevant in general literature on travel mode choice (e.g., affective factors such as comfort, symbolic factors such as status and prestige, etc.). For instance, we would anticipate that respondents who pay high attention to status symbols are less likely to adopt MaaS packages e.g., [83].

Author Contributions

Conceptualization, P.B. and N.H.; methodology, P.B. and N.H.; formal analysis, P.B.; investigation, N.H.; data curation, P.B.; writing—original draft preparation, P.B.; writing—review and editing, N.H.; supervision, N.H.; project administration, P.B.; funding acquisition, N.H. All authors have read and agreed to the published version of the manuscript.

Funding

This study was conducted in the course of the hi MOBIL project, which received funding from the Austrian Ministry for Climate Action, Environment, Energy, Mobility, Innovation and Technology.

Data Availability Statement

The data presented in this study are available on request from the corresponding author. The data are not publicly available due to privacy reasons.

Acknowledgments

We would like to thank Isabell Lehnertz for her valuable support in the course of this study and two anonymous reviewers for their detailed comments and suggestions.

Conflicts of Interest

The authors declare no conflict of interest. The funding agency had no role in the design of the study; in the collection, analyses, or interpretation of data; in the writing of the manuscript, or in the decision to publish the results.

Appendix A

Table A1. Description of the sample and the segments.
VariableSampleConvenience
Seekers
Price-Sensitive WorriersNon-Adopters
Demographic Variables
Age46.644.4743.6852.21
Gender (man)34.0%32.5%35.5%33.0%
Education
Compulsory school6.1%5.2%2.2%11.7%
Vocational training39.3%44.2%39.8%33.8%
High school25.5%24.7%26.9%24.7%
Collage/university29.1%26.0%31.2%29.9%
Income€2513.1€2664.75€2601.24€2255.12
Mobility Behavior Related Variables
WTP for MaaS€51.88€62.32€54.77€37.95
WTA 1 MaaS ((most) likely)56.7%71.4%61.3%36.4%
Car ownership (at least one car)89.5%93.5%91.4%83.1%
Daily car usage (as driver)8.5%13%9.7%2.6%
Cost for car (per month)€238.52€257.38€230.42€225.94
Socio-Psychological Variables
Climate change concerns 3.863.873.883.82
Pro-environmental attitude 3.363.403.303.41
Values (Schwartz’s value scale)3.803.953.723.74
Energy-saving behavior3.023.072.973.03
Subjective norm2.823.132.732.61
Intention towards using PT2.632.782.602.52
1 Willingness to adopt.
Table A2. Psychographic measurement scales and items with origin.
SchemePsychological Items Origin
Climate change concerns (1 = not worried at all; 5 = very worried)How worried are you, if at all, about climate change?Leiserowitz et al. (2019) (N/A)
Pro-environmental attitude (α = 0.89) (1 = not agree at all; 4 = fully agree)I would say of myself that I am environmentally conscious.
Being environmentally friendly is an important part of my personality.
I would describe myself as someone who cares about the environment.
Whitmarsh and O’Neill (2010) (α = 0.70)
Values ((short) Schwartz’s value scale) (α = 0.70) (1 = not important at all; 6 = very important)POWER (social power, authority, wealth)Schwartz (1992, 1996) (α = 0.89)
ACHIEVEMENT (success, capability, ambition, influence on people and events)
HEDONISM (gratification of desires, enjoyment in life, self-indulgence)
STIMULATION (daring, a varied and challenging life, an exciting life)
SELF-DIRECTION (creativity, freedom, curiosity, independence, choosing one’s own goals)
UNIVERSALISM (broad-mindedness, beauty of nature and arts, social justice, a world at peace, equality, wisdom, unity with nature, environmental protection)
BENEVOLENCE (helpfulness, honesty, forgiveness, loyalty, responsibility)
TRADITION (respect for tradition, humbleness, accepting one’s portion in life, devotion, modesty)
CONFORMITY (obedience, honoring parents and elders, self- discipline, politeness)
SECURITY (national security, family security, social order, cleanliness, reciprocation of favors)
Energy-saving behavior (α = 0.68) (1 = never; 4 = always)Turn off lights, the computer and other electronic devices when they are not needed.Spence, Leygue, Bedwell and O’Malley (2014) (α = 0.60)
Using warmer clothes at home instead of heating more.
Disconnect the phone and other devices to be charged as soon as they are fully charged.
Walk short distances or use the bike.
Choose holiday destinations that do not require a flight.
Consume seasonal, local and organic foods.
If possible, avoid the consumption of meat products.
Engage for energy saving measures writing letters politicians and/or the employer, as well as similar actions.
Subjective norm
(α = 0.87) (1 = not agree at all; 4 = fully agree)
Most people who are important to me would support me using public transport for daily travel.Bamberg, Rölle and Weber (2003) (N/A)
Most people who are important to me think that I should use public transport for daily travel.
Most people who are important to me think it is good if I would give up on car.
Intention towards using PT (1 = not agree at all; 4 = fully agree)My intention to use public transportation on my regular trips (shopping, leisure, university, work) is strong.Friedrichsmeier, Matthies and Klöckner (2013)
Table A3. ANOVA summary table of differences between segments 1,2.
SourceSum of SquaresdfMean SquareFp
Age a,b3565.8821782.948.120.000
WTA c,d32.86216.4312.040.000
WTP e,f24,124.66212,062.337.090.001
Values g,h2.7321.365.560.004
Subjective norm i,j11.2525.628.940.000
a Convenience seeker vs. non-adopters—p = 0.004, b Non-adopters vs. price-sensitive worriers—p = 0.001, c Convenience seeker vs. non-adopters—p = 0.000, d Non-adopters vs. price-sensitive worriers—p = 0.001, e Convenience seeker vs. non-adopters—p = 0.001, f Non-adopters vs. price-sensitive worriers—p = 0.023, g Convenience seeker vs. non-adopters—p = 0.023, h Convenience seekers vs. price-sensitive worriers—p = 0.006, i Convenience seeker vs. non-adopters—p = 0.000, j Convenience seekers vs. price-sensitive worriers—p = 0.004. 1 Post hoc test after Turkey HDS. 2 Variables not listed in this table did not reveal statistically significant differences between the segments.
Table A4. Summary table for usage frequency of different transport modes (% of the respondents).
Usage Frequency of Different Transport ModesDailyMin. Once a WeekMin. Once a MonthFew Times per YearRarely or Never
Car (as driver)8.520.66.512.651.8
Car (as co-driver)4.912.611.317.853.4
PT (e.g., bus, tram, metro)12.68.917.827.932.8
Train (e.g., regional train)1.22.012.133.651.0
Motorbike1.24.03.22.089.5
Bike25.921.912.116.223.9
E-bike2.02.81.22.891.1
Walking 59.523.510.12.04.9
Micro-PT5.392.7
Taxi0.86.138.554.7
(E-)load-cycle--1.298.8
(E-)scooter1.63.66.188.7
Table A5. Summary table for usage frequency of different sharing modes (% of the respondents).
Usage Frequency of Different Sharing Modes DailyMin. Once a WeekMin. Once a MonthFew Times per YearRarely or Never
Car sharing0.80.82.03.692.7
E-car sharing2.098.0
Bike sharing1.62.895.5
E-bike sharing1.698.4
(E-)load-cycle sharing0.499.6
(E-)scooter sharing0.83.24.591.5
Table A6. Results for direct question on preferred transport modes to be included in MaaS bundle (mean).
SampleConvenience SeekerPrice-Sensitive WorrierNon-Adopter
PT (e.g., bus, tram, metro)3.683.573.783.65
Train (e.g., regional train)3.032.882.913.42
E-car sharing2.882.902.832.94
Car sharing3.083.183.062.96
Bike sharing2.792.762.992.52
E-bike sharing2.812.832.872.69
Micro-PT2.372.322.272.60
E-scooter sharing2.071.882.092.31
Taxi1.991.961.922.15
E-load-cycle sharing2.392.492.532.02
Other1.301.411.291.20
Table A7. Results of BYO exercise (% of the respondents).
AttributesSampleConnivence SeekersNon-AdoptersPrice-Sensitive
Worriers
Transport Modes
PT + bike sharing23.923.437.712.9
PT + bike sharing + e-scooter sharing14.618.210.415.1
PT + bike sharing + e-car sharing34.828.628.645.2
PT + bike sharing + e-car sharing + e-scooter sharing26.729.923.426.9
Contract Termination Modes
Annually5.76.56.54.3
Bi-annually8.910.43.911.8
Monthly35.635.131.239.8
Flexible49.848.158.444.1
Modes of Access
Mobility card 20.622.122.118.3
Smartphone (via app)43.746.833.849.5
Credit or debit card13.814.313.014.0
Stadtwerke Klagenfurt user card21.916.931.218.3

References

  1. Ellen MacArthur Foundation. Towards a Circular Economy-Economic and Business Rationale for an Accelerated Transition. Greener Management International, 97. Available online: https://doi.org/2012-04-03 (accessed on 25 November 2019).
  2. Hensher, D.A. Future bus transport contracts under a mobility as a service (MaaS) regime in the digital age: Are they likely to change? Transp. Res. Part. A Policy Practice 2017, 98, 86–96. [Google Scholar] [CrossRef] [Green Version]
  3. Bert, J.; Collie, B.; Gerrits, M.; Xu, G. What’s Ahead for Car Sharing? The New Mobility and Its Impact on Vehicle Sales. Available online: https://trid.trb.org/view/1399142 (accessed on 29 November 2020).
  4. Grosse-Ophoff, A.; Hausler, S.; Heineke, K.; Möller, T. How Shared Mobility Will Change the Automotive Industry; McKinsey & Company: Washington DC, USA, 2017. [Google Scholar]
  5. Global Market Insights. Car Sharing Market. Statistics-Global Growth Trends 2026. Available online: https://www.gminsights.com/industry-analysis/carsharing-market (accessed on 29 November 2020).
  6. Shaheen, S.A.; Cohen, A.P. Carsharing and personal vehicle services: Worldwide market developments and emerging trends. Int. J. Sustain. Transp. 2013, 7, 5–34. [Google Scholar] [CrossRef]
  7. Cooper, P.; Tryfonas, T.; Crick, T.; Marsh, A. Electric vehicle mobility-as-a-service: Exploring the “Tri-Opt” of novel private transport business models. J. Urban. Technol. 2019, 26, 35–56. [Google Scholar] [CrossRef]
  8. Gnann, T.; Plötz, P.; Funke, S.; Wietschel, M. What is the market potential of plug-in electric vehicles as commercial passenger cars? A case study from Germany. Transp. Res. Part. D Transp. Environ. 2015, 37, 171–187. [Google Scholar] [CrossRef]
  9. Paffumi, E.; de Gennaro, M.; Martini, G.; Scholz, H. Assessment of the potential of electric vehicles and charging strategies to meet urban mobility requirements. Transportmetrica A Transport. Sci. 2015, 1, 22–60. [Google Scholar] [CrossRef]
  10. Creutzig, F.; Ravindranath, N.H.; Berndes, G.; Bolwig, S.; Bright, R.; Cherubini, F.; Fargione, J. Bioenergy and climate change mitigation: An assessment. Gcb Bioenerg. 2015, 7, 916–944. [Google Scholar] [CrossRef] [Green Version]
  11. Lutsey, N. Global climate change mitigation potential from a transition to electric vehicles. Int. Counc. Clean Transp. 2015, 2015, 5. [Google Scholar]
  12. Turcksin, L.; Mairesse, O.; Macharis, C. Private household demand for vehicles on alternative fuels and drive trains: A review. Eur. Transport. Res. Rev. 2013, 5, 149–164. [Google Scholar] [CrossRef] [Green Version]
  13. Ambrosino, G.; Nelson, J.D.; Boero, M.; Pettinelli, I. Enabling intermodal urban transport through complementary services: From flexible mobility services to the shared use mobility agency: Workshop 4. Developing inter-modal transport systems. Res. Transp. Econ. 2016, 59, 179–184. [Google Scholar] [CrossRef]
  14. Ho, C.; Hensher, D.A.; Mulley, C.; Wong, Y. Prospects for switching out of conventional transport services to mobility as a service subscription plans–A stated choice study. In Proceedings of the International Conference Series on Competition and Ownership in Land Passenger Transport, (Thredbo 15), Stockholm, Sweden, 13–17 August 2017. [Google Scholar]
  15. Li, Y.; Voege, T. Mobility as a service (MaaS): Challenges of implementation and policy required. J. Transp. Technol. 2017, 7, 95–106. [Google Scholar] [CrossRef] [Green Version]
  16. Gould, E.; Wehrmeyer, W.; Leach, M. Transition pathways of e-mobility services. WIT Trans. Ecol. Environ. 2015, 194, 349–359. [Google Scholar]
  17. Smith, G.; Sarasini, S.; Karlsson, I.M.; Mukhtar-Landgren, D.; Sochor, J. Governing Mobility-as-a-Service: Insights from Sweden and Finland. In The Governance of Smart Transportation Systems; Springer: Cham, Germany, 2019; pp. 169–188. [Google Scholar]
  18. Karlsson, I.C.M.; Mukhtar-Landgren, D.; Smith, G.; Koglin, T.; Kronsell, A.; Lund, E.; Sochor, J. Development and implementation of Mobility-as-a-Service–A qualitative study of barriers and enabling factors. Transp. Res. Part. A Policy Practice 2020, 131, 283–295. [Google Scholar] [CrossRef]
  19. Mulley, C.; Nelson, J.D.; Wright, S. Community transport meets mobility as a service: On the road to a new a flexible future. Res. Transp. Econ. 2018, 69, 583–591. [Google Scholar] [CrossRef] [Green Version]
  20. Audouin, M.; Finger, M. The development of mobility-as-a-service in the Helsinki metropolitan area: A multi-level governance analysis. Res. Transp. Bus. Manag. 2018, 27, 24–35. [Google Scholar] [CrossRef]
  21. Caiati, V.; Rasouli, S.; Timmermans, H. Bundling, pricing schemes and extra features preferences for mobility as a service: Sequential portfolio choice experiment. Transp. Res.Part. A Policy Practice 2020, 131, 123–148. [Google Scholar] [CrossRef]
  22. Ho, C.Q.; Hensher, D.A.; Mulley, C.; Wong, Y.Z. Potential uptake and willingness-to-pay for Mobility as a Service (MaaS): A stated choice study. Transp. Res. Part. A Policy Practice 2018, 117, 302–318. [Google Scholar] [CrossRef]
  23. Kamargianni, M.; Li, W.; Matyas, M.; Schäfer, A. A critical review of new mobility services for urban transport. Transp. Res. Proced. 2016, 14, 3294–3303. [Google Scholar] [CrossRef] [Green Version]
  24. Matyas, M.; Kamargianni, M. The potential of mobility as a service bundles as a mobility management tool. Transportation 2018, 46, 1–18. [Google Scholar] [CrossRef] [Green Version]
  25. Mulley, C.; Ho, C.; Balbontin, C.; Hensher, D.; Stevens, L.; Nelson, J.D.; Wright, S. Mobility as a service in community transport in Australia: Can it provide a sustainable future? Transp. Res. Part A Policy Practice 2020, 131, 107–122. [Google Scholar] [CrossRef]
  26. Goodall, W.; Dovey, T.; Bornstein, J.; Bonthron, B. The rise of mobility as a service. Deloitte Rev. 2017, 20, 112–129. [Google Scholar]
  27. Kostiainen, J.; Tuominen, A. Mobility as a service—Stakeholders’ challenges and potential implications. In Towards User-Centric Transport in Europe; Springer: Cham, Germany, 2019; pp. 239–254. [Google Scholar]
  28. Utriainen, R.; Pöllänen, M. Review on mobility as a service in scientific publications. Res. Transp. Bus. Manag. 2018, 27, 15–23. [Google Scholar] [CrossRef]
  29. Aapaoja, A.; Eckhardt, J.; Nykänen, L.; Sochor, J. MaaS service combinations for different geographical areas. In Proceedings of the 24th world congress on intelligent transportation systems, Montreal, QC, Canada, 29 October–2 November 2017. [Google Scholar]
  30. Esztergár-Kiss, D.; Kerényi, T. Creation of mobility packages based on the MaaS concept. Travel Behav. Soc. 2019, 21, 307–317. [Google Scholar] [CrossRef]
  31. Wright, S.; Nelson, J.D.; Cottrill, C.D. MaaS for the suburban market: Incorporating carpooling in the mix. Transp. Res. Part. A Policy Practice 2020, 131, 206–218. [Google Scholar] [CrossRef]
  32. Heikkilä, S. Mobility as a Service–A Proposal for Action for the Public Administration, Case Helsinki. Master’s Thesis, Aalto University, Espoo, Finland, 2014. [Google Scholar]
  33. Giesecke, R.; Surakka, T.; Hakonen, M. Conceptualising Mobility as a Service; IEEE: Piscataway, NJ, USA, 2016; pp. 1–11. [Google Scholar]
  34. Sochor, J.L.; Strömberg, H.; Karlsson, M. An innovative mobility service to facilitate changes in travel behavior and mode choice. In Proceedings of the 22nd World Congress on Intelligent Transportation Systems, Bordeaux, France, 5–9 October 2015. [Google Scholar]
  35. Sochor, J.; Strömberg, H.; Karlsson, I.C.M. Implementing Mobility as a Service challenges in integrating user, commercial, and societal perspectives. Transp. Res. Record 2015, 4, 1–9. [Google Scholar] [CrossRef]
  36. Sochor, J.; Strömberg, H.; Karlsson, I.C.M. Trying out mobility as a service experiences from a field trial and implications for understanding demand. In Proceedings of the 95th Transportation Research Board Annual Meeting, Washington, DC, USA, 1 January 2016. [Google Scholar]
  37. Karlsson, I.M.; Sochor, J.; Strömberg, H. Developing the ‘Service’in Mobility as a Service: Experiences from a field trial of an innovative travel brokerage. Transp. Res. Proced. 2016, 14, 3265–3273. [Google Scholar] [CrossRef] [Green Version]
  38. Whim. All Your Journeys. Available online: https://whimapp.com (accessed on 2 April 2019).
  39. Axhausen, K.W.; Simma, A.; Golob, T.F. Pre-commitment and usage: Season tickets, cars and travel. Arbeitsb. Verk. Raumplan. 2000, 495, 24. [Google Scholar]
  40. Lathia, N.; Capra, L. How Smart is your Smartcard? Measuring Travel Behaviours, Perceptions, and Incentives; ACM: Beijing, China, 2011; pp. 291–300. [Google Scholar]
  41. Schad, H.; Flamm, M.; Wagner, C.; Frey, T. New, Integrated Mobility Services, NIM; Project A3 of the National Research Programme (NRP): Bern, Switzerland, 2005. [Google Scholar]
  42. Thøgersen, J. Promoting public transport as a subscription service: Effects of a free month travel card. Trans. Policy 2009, 16, 335–343. [Google Scholar] [CrossRef]
  43. Huwer, U. Public transport and car-sharing—benefits and effects of combined services. Transport. Policy 2004, 11, 77–87. [Google Scholar] [CrossRef]
  44. Durand, A.; Harms, L.; Hoogendoorn-Lanser, S.; Zijlstra, T. Mobility-as-a-Service and Changes in Travel Preferences and Travel Behaviour: A Literature Review. KiM| Netherlands Institute for Transport Policy Analysis: Hague, The Netherlands, 2018. [Google Scholar]
  45. Guidon, S.; Wicki, M.; Bernauer, T.; Axhausen, K. Transportation service bundling–for whose benefit? Consumer valuation of pure bundling in the passenger transportation market. Transp. Res. Part. A Policy Pract. 2020, 131, 91–106. [Google Scholar] [CrossRef]
  46. Ho, C.Q.; Mulley, C.; Hensher, D.A. Public preferences for mobility as a service: Insights from stated preference surveys. Transp. Res. Part. A Policy Practice 2020, 131, 70–90. [Google Scholar] [CrossRef]
  47. Matyas, M.; Kamargianni, M. Survey design for exploring demand for Mobility as a Service plans. Transportation 2019, 46, 1525–1558. [Google Scholar] [CrossRef] [Green Version]
  48. Alonso-González, M.J.; Hoogendoorn-Lanser, S.; van Oort, N.; Cats, O.; Hoogendoorn, S. Drivers and barriers in adopting Mobility as a Service (MaaS)–A latent class cluster analysis of attitudes. Transp.Res. Part. A Policy Pract. 2020, 132, 378–401. [Google Scholar] [CrossRef]
  49. Diana, M. From mode choice to modal diversion: A new behavioural paradigm and an application to the study of the demand for innovative transport services. Technol. Forecast. Soc. Change 2010, 77, 429–441. [Google Scholar] [CrossRef] [Green Version]
  50. Gardner, B. Modelling motivation and habit in stable travel mode contexts. Transp. Res. Part. F Traffic Psychol. Behav. 2009, 12, 68–76. [Google Scholar] [CrossRef]
  51. Wittink, D.R.; Cattin, P. Commercial Use of Conjoint Analysis: An Update. J. Market. 1989, 53, 91–96. [Google Scholar] [CrossRef]
  52. Green, P.E.; Srinivasan, V. Conjoint analysis in consumer research: Issues and outlook. J. Consum. Res. 1978, 5, 103–123. [Google Scholar] [CrossRef]
  53. Green, P.E.; Srinivasan, V. Conjoint analysis in marketing: New developments with implications for research and practice. J. Market. 1990, 54, 3–19. [Google Scholar] [CrossRef]
  54. Louviere, J.J.; Street, D.; Burgess, L.; Wasi, N.; Islam, T.; Marley, A.A. Modeling the choices of individual decision-makers by combining efficient choice experiment designs with extra preference information. J. Choice Modell. 2008, 1, 128–164. [Google Scholar] [CrossRef] [Green Version]
  55. Golden, B.R. The past is the past—or is it? The use of retrospective accounts as indicators of past strategy. Acad. Manag. J. 1992, 35, 848–860. [Google Scholar]
  56. Adamowicz, W.; Louviere, J.; Williams, M. Combining revealed and stated preference methods for valuing environmental amenities. J. Environ. Econ. Manag. 1994, 26, 271–292. [Google Scholar] [CrossRef]
  57. Louviere, J.J.; Hensher, D.A.; Swait, J.D. Stated Choice Methods: Analysis and Applications; Cambridge University Press: Cambridge, UK, 2000. [Google Scholar]
  58. Hampl, N.; Loock, M. Sustainable development in retailing: What is the impact on store choice? Bus. Strategy Environ. 2013, 22, 202–216. [Google Scholar] [CrossRef]
  59. Kubli, M.; Loock, M.; Wüstenhagen, R. The flexible prosumer: Measuring the willingness to co-create distributed flexibility. Energy Policy 2018, 114, 540–548. [Google Scholar] [CrossRef]
  60. Priessner, A.; Hampl, N. Can product bundling increase the joint adoption of electric vehicles, solar panels and battery storage? Explorative evidence from a choice-based conjoint study in Austria. Ecol. Econ. 2020, 167, 106381. [Google Scholar] [CrossRef]
  61. Sawtooth Software. The CBC/HB System for Hierarchical Bayes Estimation Version 5.0 Technical Paper; Sawtooth Software: Sequim, WA, USA, 2009. [Google Scholar]
  62. Chrzan, K.; Orme, B. An overview and comparison of design strategies for choice-based conjoint analysis. Sawtooth Softw. res. Pap. Ser. 2000, 98382, 360. [Google Scholar]
  63. Rossi, P.E.; Allenby, G.M. Bayesian statistics and marketing. Market. Sci. 2003, 22, 304–328. [Google Scholar] [CrossRef]
  64. Huber, J.; Train, K. On the similarity of classical and Bayesian estimates of individual mean partworths. Market. Lett. 2001, 12, 259–269. [Google Scholar] [CrossRef]
  65. Magidson, J.; Vermunt, J.K. Latent class models. The Sage Handbook of Quantitative Methodology for the Social Sciences; SAGE Publications: Thousand Oaks, CA, USA, 2004; pp. 175–198. [Google Scholar]
  66. Sawtooth Software. The CBC Latent Class Technical Paper (Version 3); Sawtooth Software: Sequim, WA, USA, 2004. [Google Scholar]
  67. Bozdogan, H. Model selection and Akaike’s information criterion (AIC): The general theory and its analytical extensions. Psychometrika 1987, 52, 345–370. [Google Scholar] [CrossRef]
  68. Ramaswamy, V.; de Sarbo, W.S.; Reibstein, D.J.; Robinson, W.T. An empirical pooling approach for estimating marketing mix elasticities with PIMS data. Market. Sci. 1993, 12, 103–124. [Google Scholar] [CrossRef]
  69. Orme, B.K.; Chrzan, K. Becoming an Expert in Conjoint Analysis: Choice Modelling for Pros; Sawtooth Software: Sun Valley, ID, USA, 2017. [Google Scholar]
  70. Eggers, F.; Sattler, H.; Teichert, T.; Völckner, F. Choice-based conjoint analysis. Handbook of Market Research; Springer: Cham, Germany, 2018. [Google Scholar]
  71. Orme, B. Getting Started with Conjoint Analysis: Strategies for Product Design and Pricing Research, 2nd ed.; Research Publishers LLC: Madison, WI, USA, 2010. [Google Scholar]
  72. Salm, S.; Hille, S.L.; Wüstenhagen, R. What are retail investors’ risk-return preferences towards renewable energy projects? A choice experiment in Germany. Energy Policy 2016, 97, 310–320. [Google Scholar] [CrossRef]
  73. European Comission. Road Transport: Reducing CO2 Emissions from Vehicles. 2019. Available online: https://ec.europa.eu/clima/policies/transport/vehicles_en (accessed on 20 January 2019).
  74. Collins, C.M.; Chambers, S.M. Psychological and situational influences on commuter-transport-mode choice. Environ. Behave. 2005, 37, 640–661. [Google Scholar] [CrossRef]
  75. Mola, L.; Berger, Q.; Haavisto, K.; Soscia, I. Mobility as a service: An exploratory study of consumer mobility behaviour. Sustainability 2020, 12, 8210. [Google Scholar] [CrossRef]
  76. Choi, J.P. Bundling new products with old to signal quality, with application to the sequencing of new products. Int. J. Ind. Organ. 2003, 21, 1179–1200. [Google Scholar] [CrossRef]
  77. Reinders, M.J.; Frambach, R.T.; Schoormans, J.P. Using product bundling to facilitate the adoption process of radical innovations. J. Product Innov. Manag. 2010, 27, 1127–1140. [Google Scholar] [CrossRef]
  78. Simonin, B.L.; Ruth, J.A. Bundling as a strategy for new product introduction: Effects on consumers’ reservation prices for the bundle, the new product, and its tie-in. J. Bus. Res. 1995, 33, 219–230. [Google Scholar] [CrossRef]
  79. Harris, J.; Blair, E.A. Consumer preference for product bundles: The role of reduced search costs. J. Acad. Market. Sci. 2006, 34, 506–513. [Google Scholar] [CrossRef]
  80. ElHaffar, G.; Durif, F.; Dubé, L. Towards closing the attitude-intention-behavior gap in green consumption: A narrative review of the literature and an overview of future research directions. J. Clean. Prod. 2020, 275, 122556. [Google Scholar] [CrossRef]
  81. Schikofsky, J.; Dannewald, T.; Kowald, M. Exploring motivational mechanisms behind the intention to adopt mobility as a service (MaaS): Insights from Germany. Transp. Res. Part. A Policy Practice 2020, 131, 296–312. [Google Scholar] [CrossRef]
  82. Pinto, J.; Morales, M.E.; Fedoruk, M.; Kovaleva, M.; Diemer, A. Servitization in support of sustainable cities: What are steel’s contributions and challenges? Sustainability 2019, 11, 855. [Google Scholar] [CrossRef] [Green Version]
  83. Hiscock, R.; Macintyre, S.; Kearns, A.; Ellaway, A. Means of transport and ontological security: Do cars provide psycho-social benefits to their users? Transp. Res. Part. D Transp. Environ. 2002, 7, 119–135. [Google Scholar] [CrossRef]
Figure 1. Example of choice tasks.
Energies 14 01088 g001
Figure 2. Indirect willingness to pay (WTP) for attribute levels of Mobility-as-a-Service (MaaS) packages (relative to default). Note: Bike sharing (BS), e-car sharing (ECS), e-scooter sharing (ESS), Stadtwerke Klagenfurt (STW).
Energies 14 01088 g002
Figure 3. Direct WTP and market potential for MaaS packages.
Energies 14 01088 g003
Figure 4. Summary of market simulations on segment level (% of respondents).
Energies 14 01088 g004
Table 1. Attributes and attribute levels included in the choice-based conjoint (CBC) experiment.
AttributesDescriptionLevels
Transport modesTransport modes included in the package (incl. a specific number of free hours or mileage 1) PT + bike sharing
PT + bike sharing + e-scooter sharing
PT + bike sharing + e-car sharing PT + bike sharing + e-car sharing + e-scooter sharing
Contract termination modesPossibility of changing the package or cancel the contractAnnually
Bi-annually
Monthly
Flexible
Modes of accessPossibility of activating the individual mobility offers for useMobility card 2 Stadtwerke Klagenfurt user card
Credit or debit card
Smartphone (via app)
Price (per month)Total monthly cost for all transport modes included in the package€30
€60
€90
€120
1 PT: Includes all busses of the Klagenfurt Mobil GmbH within the Klagenfurt central traffic area. Bike sharing: Only valid for the services offered by nextbike within Klagenfurt. The bundle includes the basic tariff (€4/month). The first 30 min are free of charge for each rental; each additional 30 min are charged with a €1 tariff. The 24 h-tariff starts with the 5th rental hour and will be charged at €9. E-car sharing: Only valid for the services offered by FAMILY OF POWER. The bundle includes 10 h/month. Each additional hour will be charged at €4.80. E-scooter sharing: Valid for all services offered by a specific provider (not defined yet at the time of data collection). The bundle includes up to 10 rides (incl. unlocking) and max. 200 min/month. For additional services, unlocking will be charged at €1, and at €0.15 per additional minute. 2 An own mobility card for using the MaaS bundle services independent of any specific service provider.
Table 2. Summary from latent class analysis highlighting best replications.
GroupsPercent CertaintyCAICChi-Square
236.435467.102993.70
340.455262.613324.11
442.795196.313516.33
543.895232.103606.46
Table 3. The hierarchical Bayes (HB) model estimation of mean utility values and mean relative importance scores (n = 247).
Attributes and Attribute LevelsMeanStandard DeviationLower 95% CI 1Upper 95% CI 1
Transport Modes (m = 27.28; SD = 12.69)
PT + bike sharing−45.1239.10−49.99−40.24
PT + bike sharing + e-scooter sharing−18.9232.14−22.93−14.91
PT + bike sharing + e-car sharing26.5042.7021.1831.83
PT + bike sharing + e-car sharing + e-scooter sharing 37.5428.9233.9341.14
Contract Termination Modes (m = 13.19; SD = 5.69)
Annually−22.5120.62−25.08−19.94
Bi-annually−4.5716.40−6.62−2.52
Monthly11.3314.479.5213.13
Flexible15.7514.8613.9017.60
Modes of Access (m = 10.42; SD = 6.14)
Mobility card−0.1621.52−2.842.52
Smartphone (via app)−1.3719.65−3.821.09
Credit or debit card −3.8315.29−5.73−1.92
Stadtwerke Klagenfurt user card5.3516.183.337.37
Price (per Month) (m = 49.10; SD = 13.62)
€30 101.6244.8896.02107.21
€6025.2320.1122.7227.74
€90−37.9726.62−41.29−34.65
€120−88.8828.87−92.48−85.28
None111.13141.7493.46128.81
1 Confidence interval.
Table 4. HB model estimation of mean utility values per segment.
Segment 1: Convenience SeekersSegment 2: Price-Sensitive WorriersSegment 3: Non-Adopters
Segment sizen = 77 (31.2%)n = 93 (37.6%)n = 77 (31.2%)
Transport Modes
PT + bike sharing−63.41−52.835.44
PT + bike sharing + e-scooter sharing−33.47−25.11−40.48
PT + bike sharing + e-car sharing36.1840.291.10
PT + bike sharing + e-car sharing + e-scooter sharing60.7037.6533.95
Contract Termination Modes
Annually−7.23−22.18−75.28
Bi-annually−11.31−0.17−6.97
Monthly8.0212.3025.09
Flexible10.5310.0557.16
Modes of Access
Mobility card18.02−0.72−6.04
Credit or debit card−7.69−2.41−5.58
Smartphone (via app)−6.61−7.88−0.83
Stadtwerke Klagenfurt user card−3.7211.0112.45
Price (per Month)
€30106.25131.43116.19
€6050.6035.75−58.44
€90−34.78−45.10−17.18
€120−122.08−122.08−40.57
None−150.90114.21353.73
Table 5. Attribute importance scores per segment.
SegmentSegment 1: Convenience SeekersSegment 2: Price-Sensitive WorriersSegment 3: Non-Adopters
Segment sizen = 77 (31.2%)n = 93 (37.6%)n = 77 (31.2%)
Transport modes31.023.318.6
Contract termination modes5.58.633.1
Modes of access6.44.74.6
Price (per month)57.163.443.7
Total100%100%100%
Table 6. Results for direct question on preferred transport modes to be included in MaaS bundle.
Should Definitely Be IncludedShould Be IncludedShould Not Be IncludedShould Not Be Included at AllSum of Columns “Should (Definitely) Be Included”
PT (e.g., bus, tram, metro)78.14%14.57%2.43%4.86%92.71%
Train (e.g., regional train)42.11%30.77%14.57%12.55%72.87%
E-car sharing38.06%30.77%11.34%19.84%68.83%
Car sharing33.20%29.96%15.38%21.46%63.16%
Bike sharing29.55%28.74%15.38%26.32%58.30%
E-bike sharing29.55%28.74%14.98%26.72%58.30%
Micro-PT21.86%22.27%19.84%36.03%44.13%
E-scooter sharing23.08%20.24%15.38%41.30%43.32%
Taxi19.84%18.62%15.38%46.15%38.46%
E-load-cycle sharing12.15%15.38%22.27%50.20%27.53%
Other4.17%5.56%6.94%83.33%9.72%
Publisher’s Note: MDPI stays neutral with regard to jurisdictional claims in published maps and institutional affiliations.

