
Design and Validation of BAT Algorithm-Based Photovoltaic System Using Simplified High Gain Quasi Boost Inverter

 ,
,  ,
,  , and
, and 
Abstract
1. Introduction
1.1. Literature Survey on MPPT Algorithms
1.2. Literature Survey on Converters and Inverters
1.3. Contributions
- To obtain efficient SPV conversion by implementing the mathematical model of BA for a 250 W solar panel;
- To improve the efficiency of the inverter using a novel SHGqBI for an SPV system, thereby reducing the voltage and current stress without additional components;
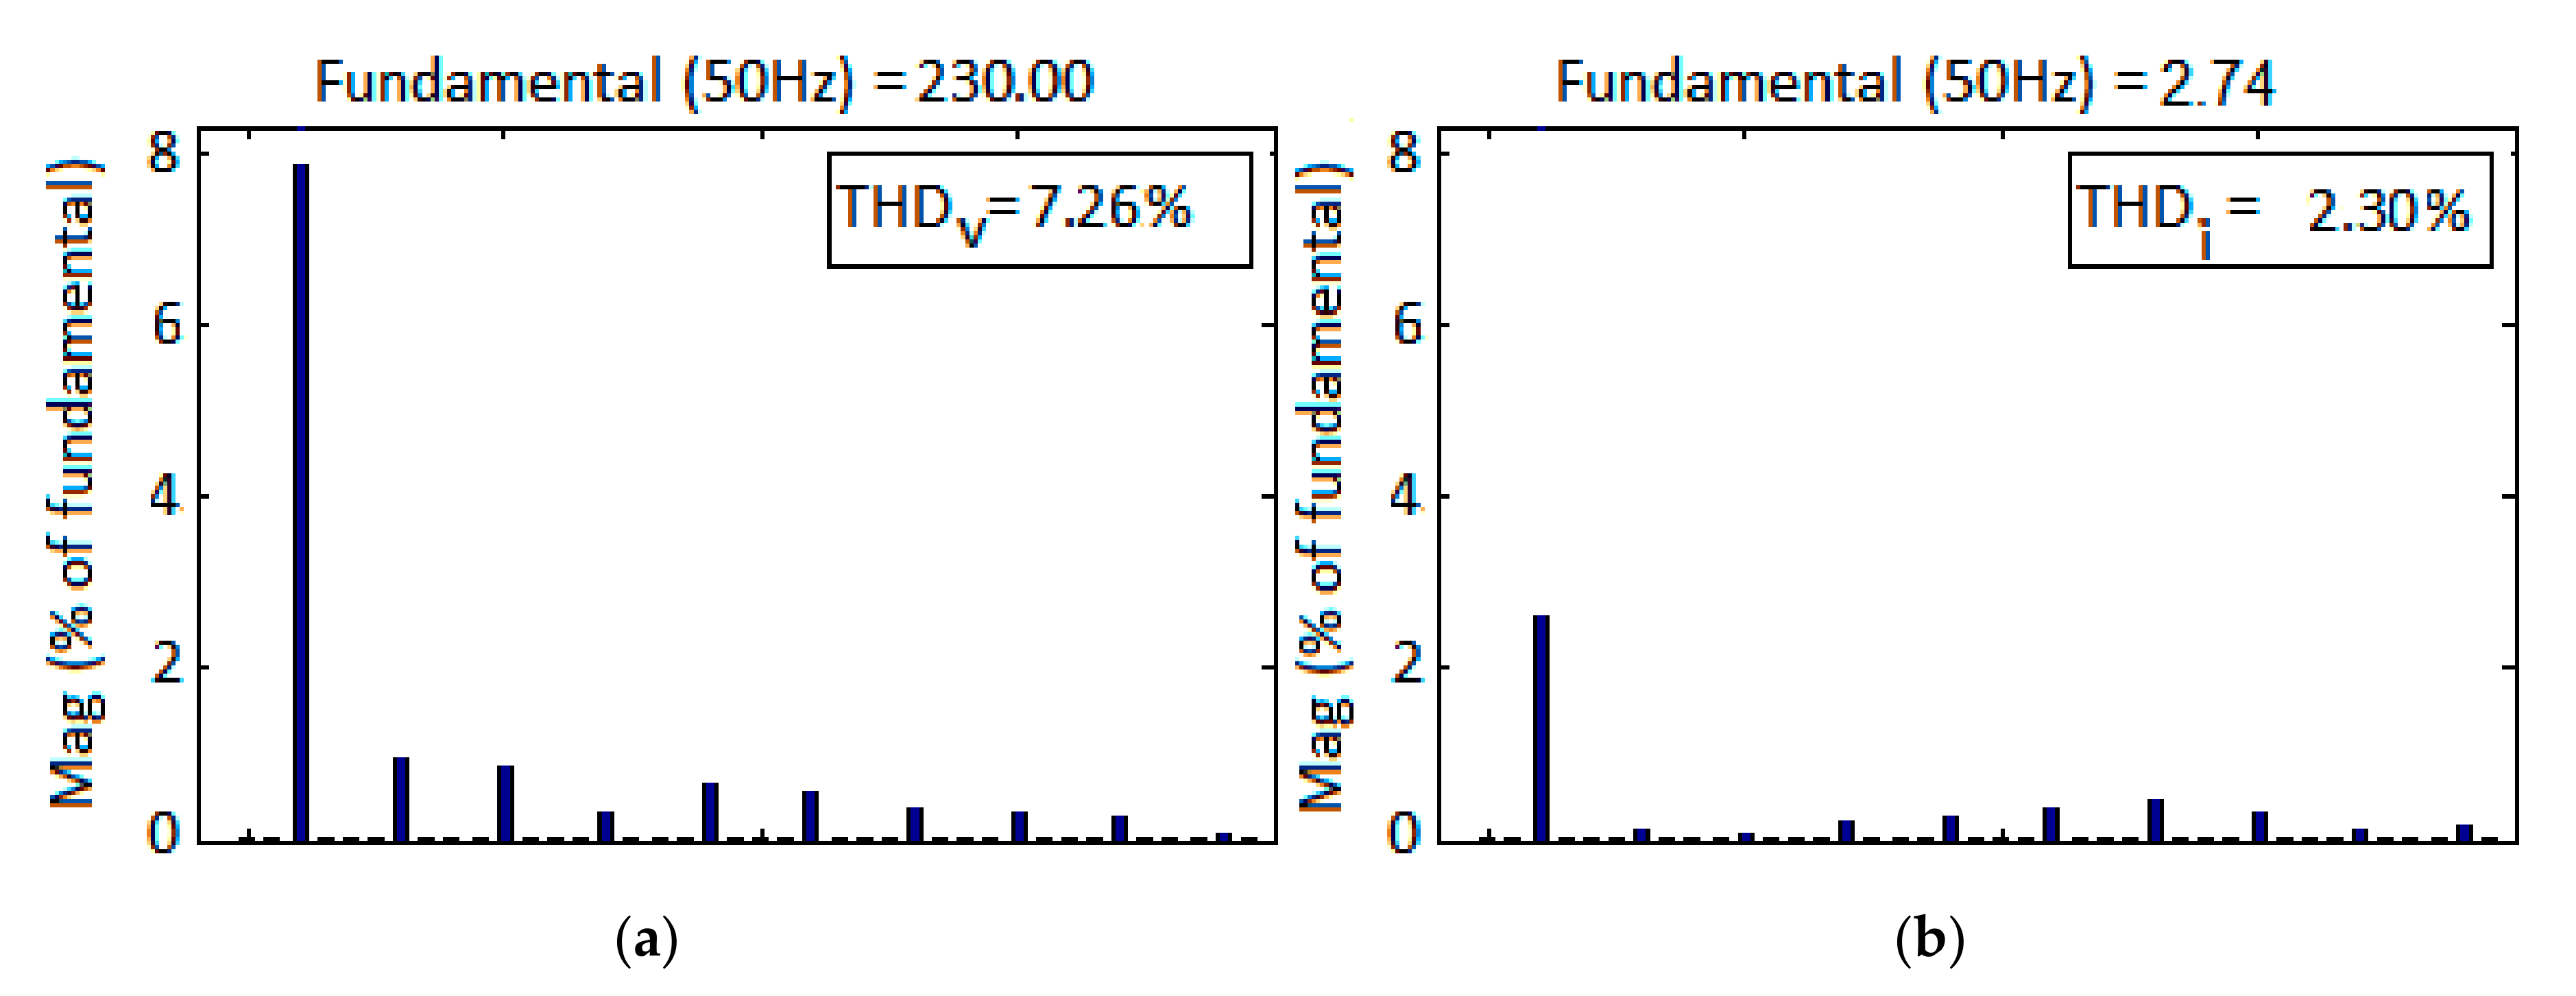
- To reduce the total harmonic distortion at the load side and provide high efficiency;
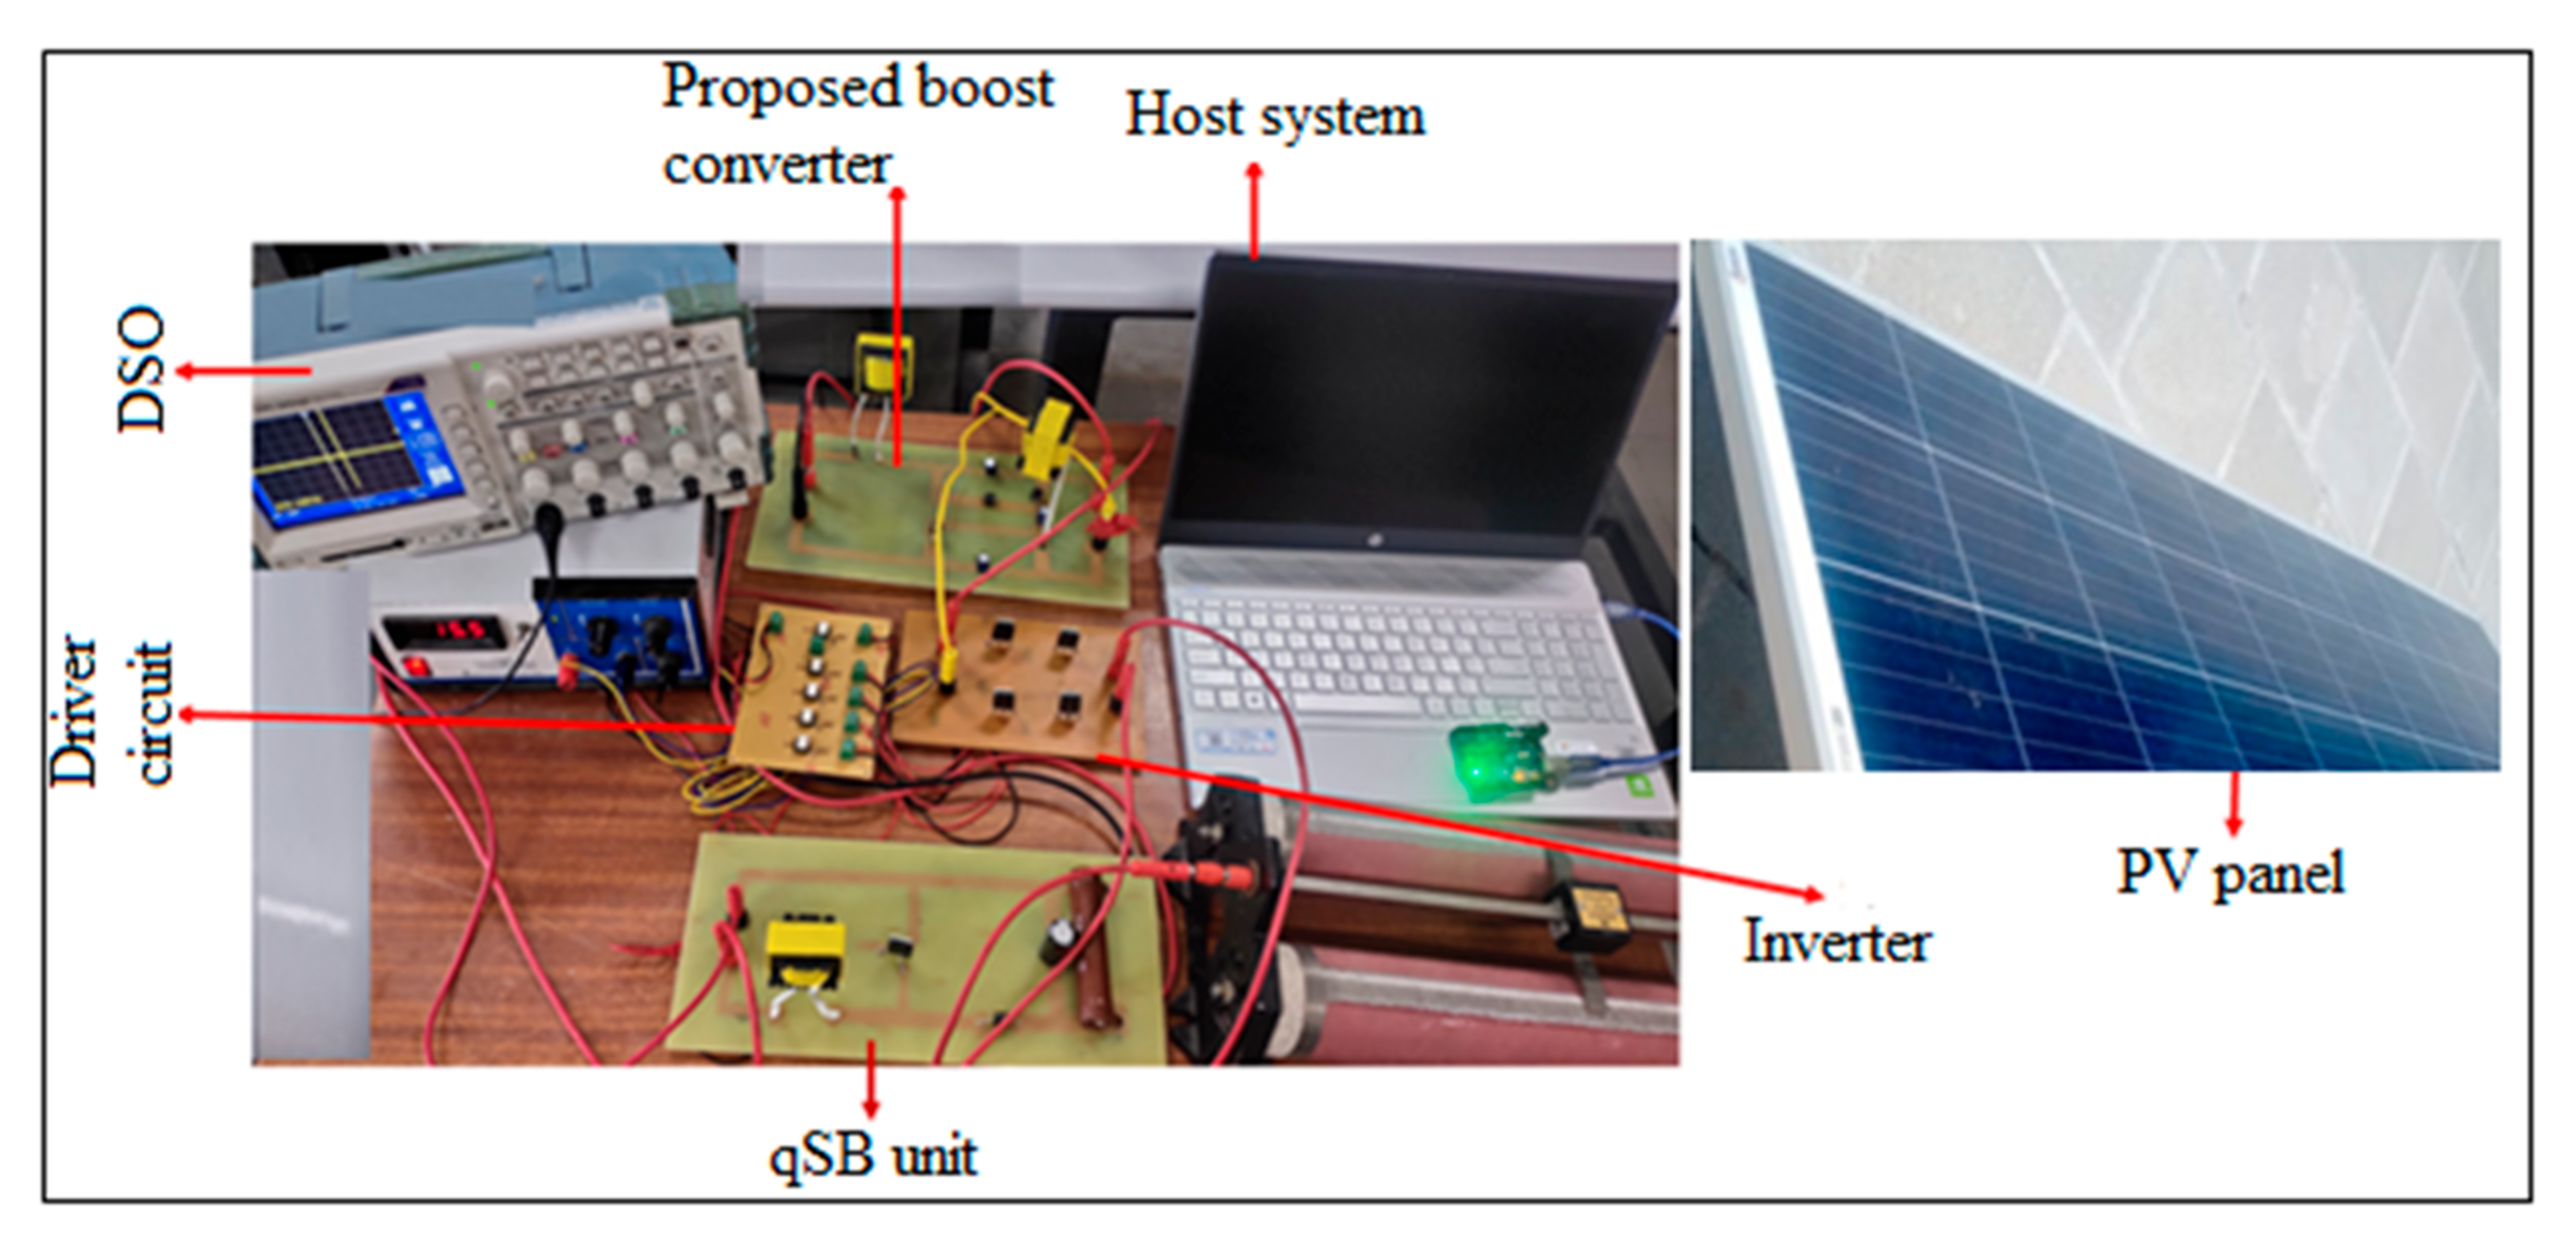
- To validate the proposed system using the experimental setup.
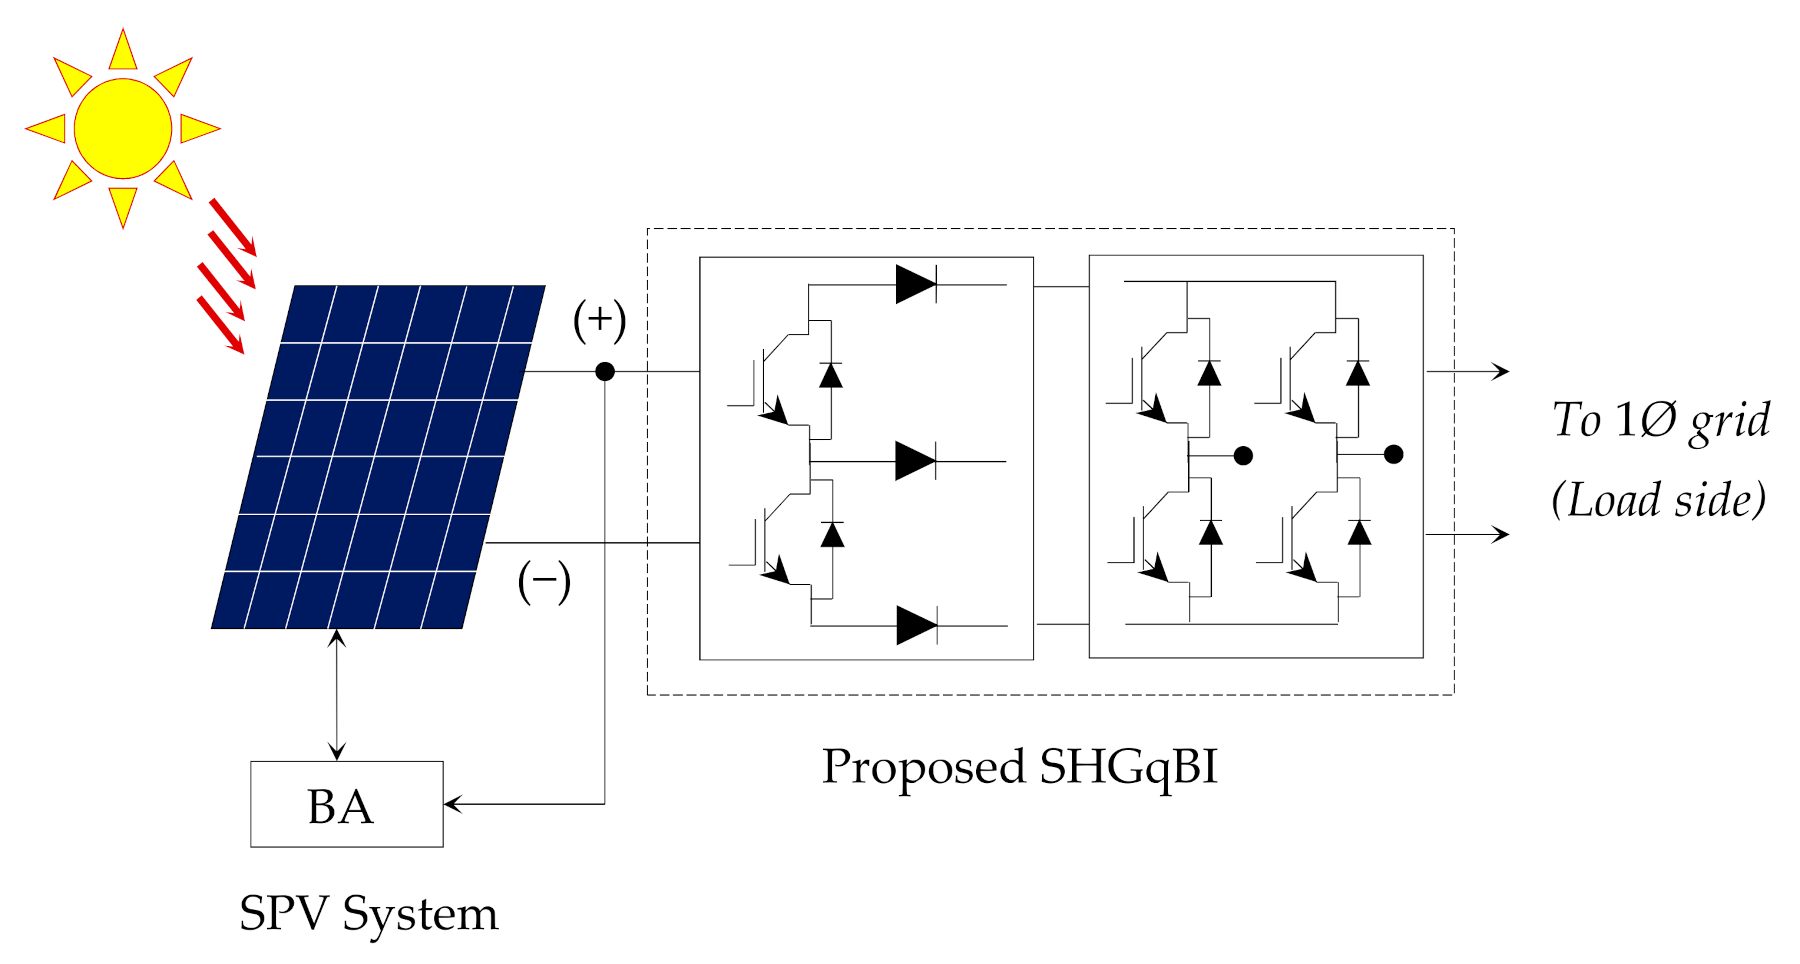
2. Modelling of the Proposed System
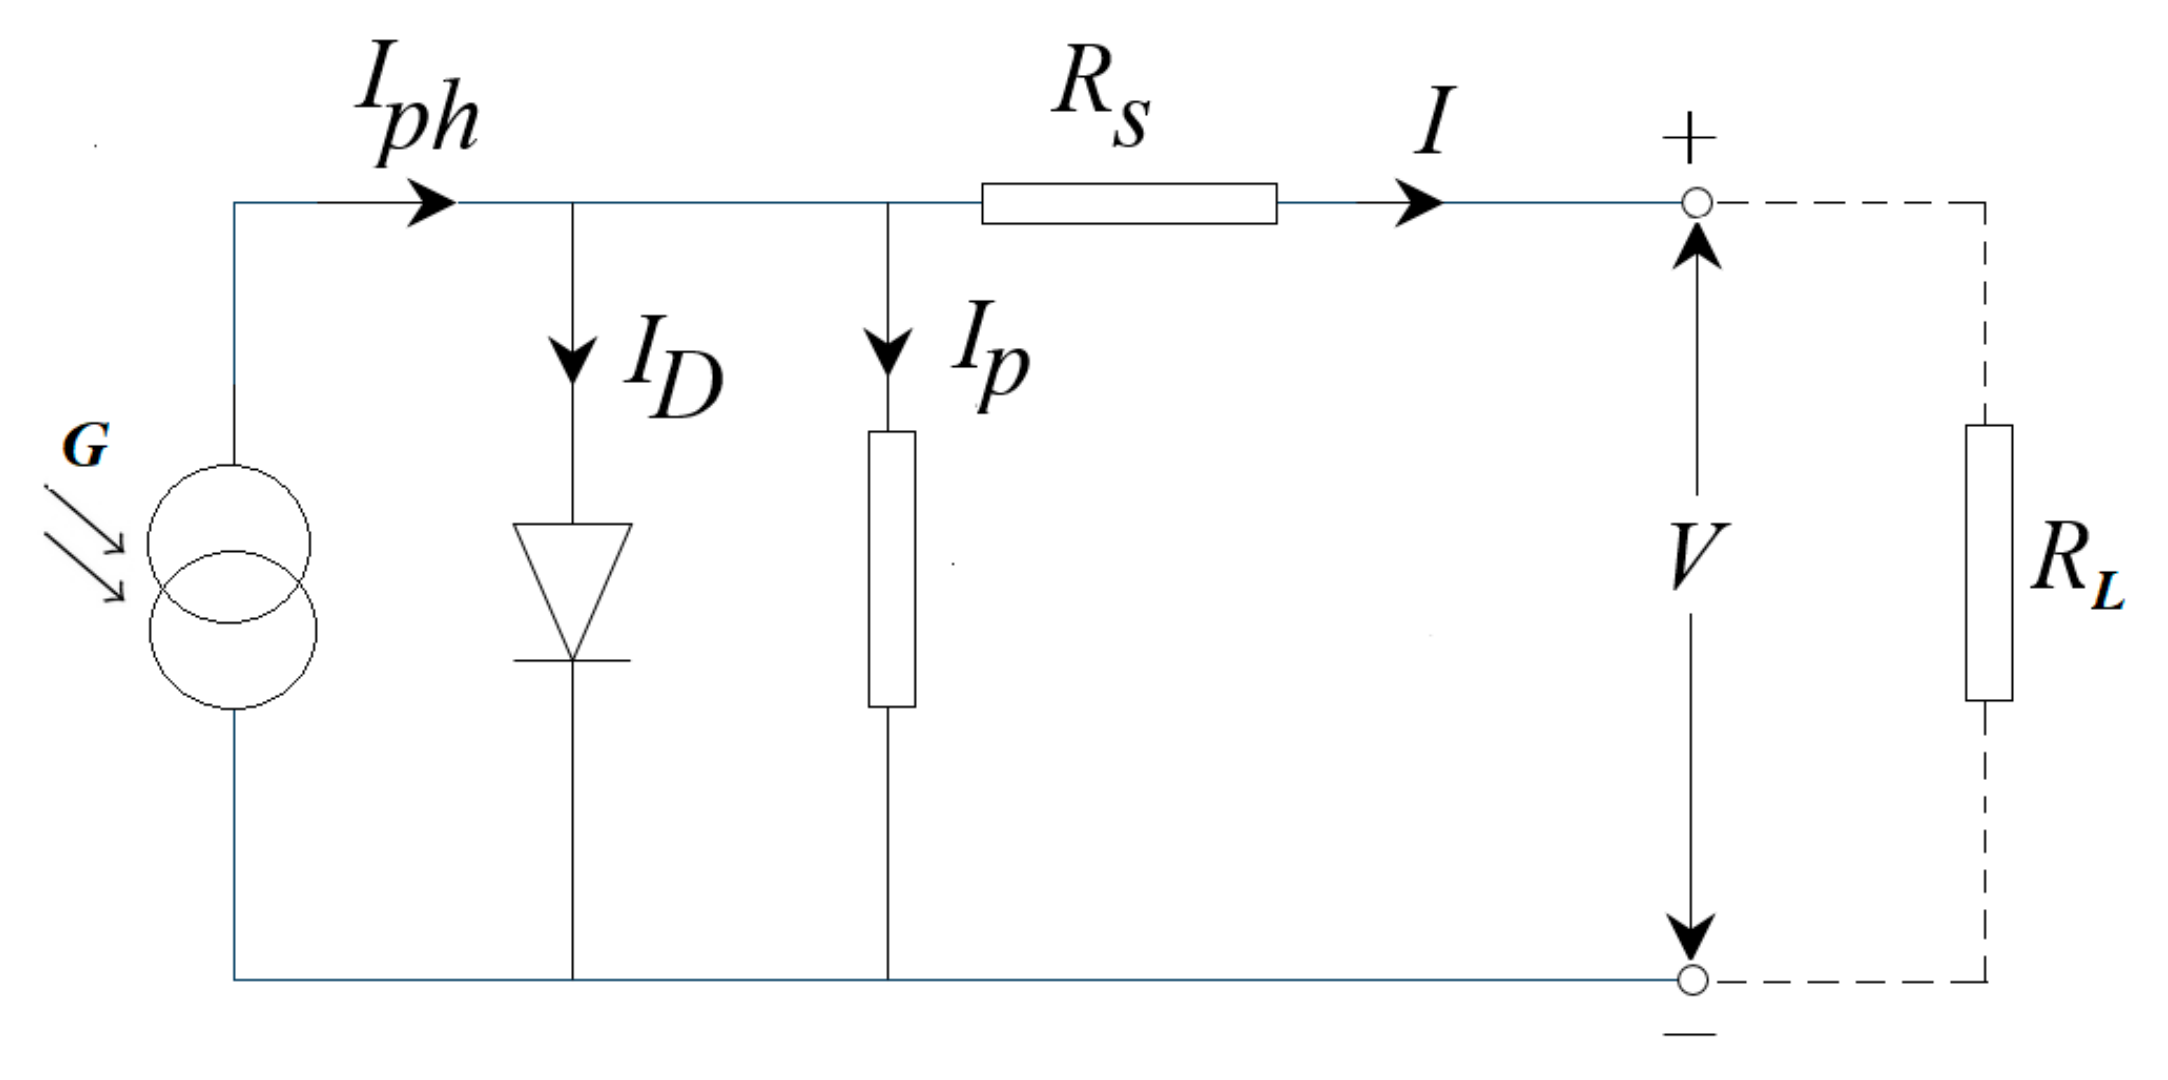
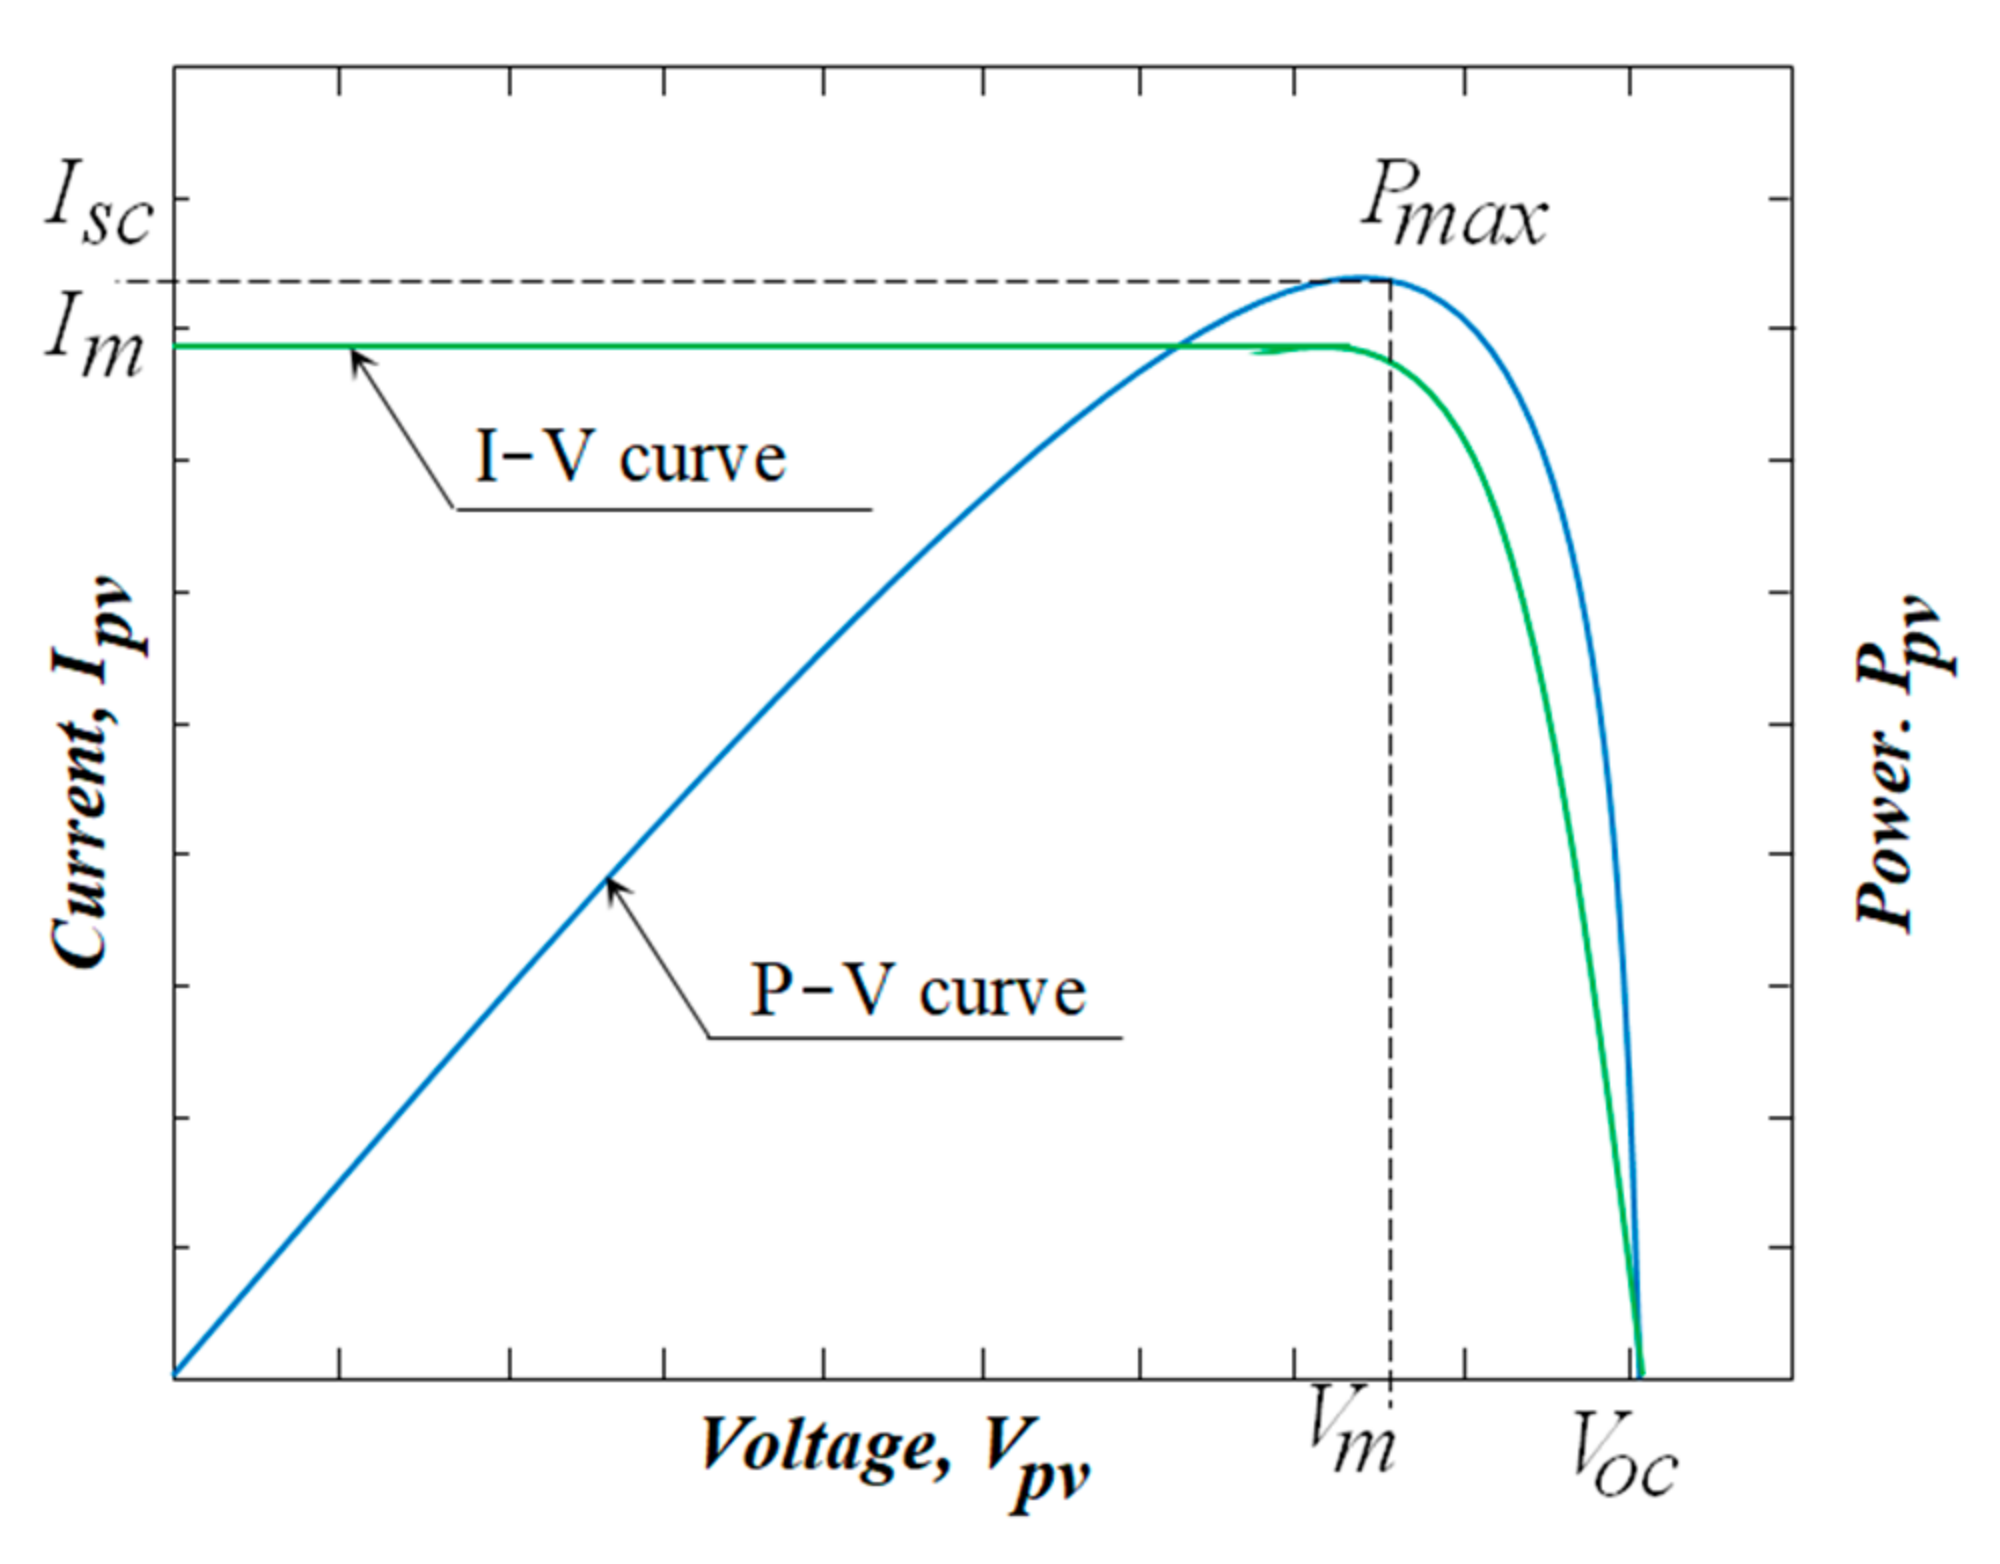
2.1. SPV System
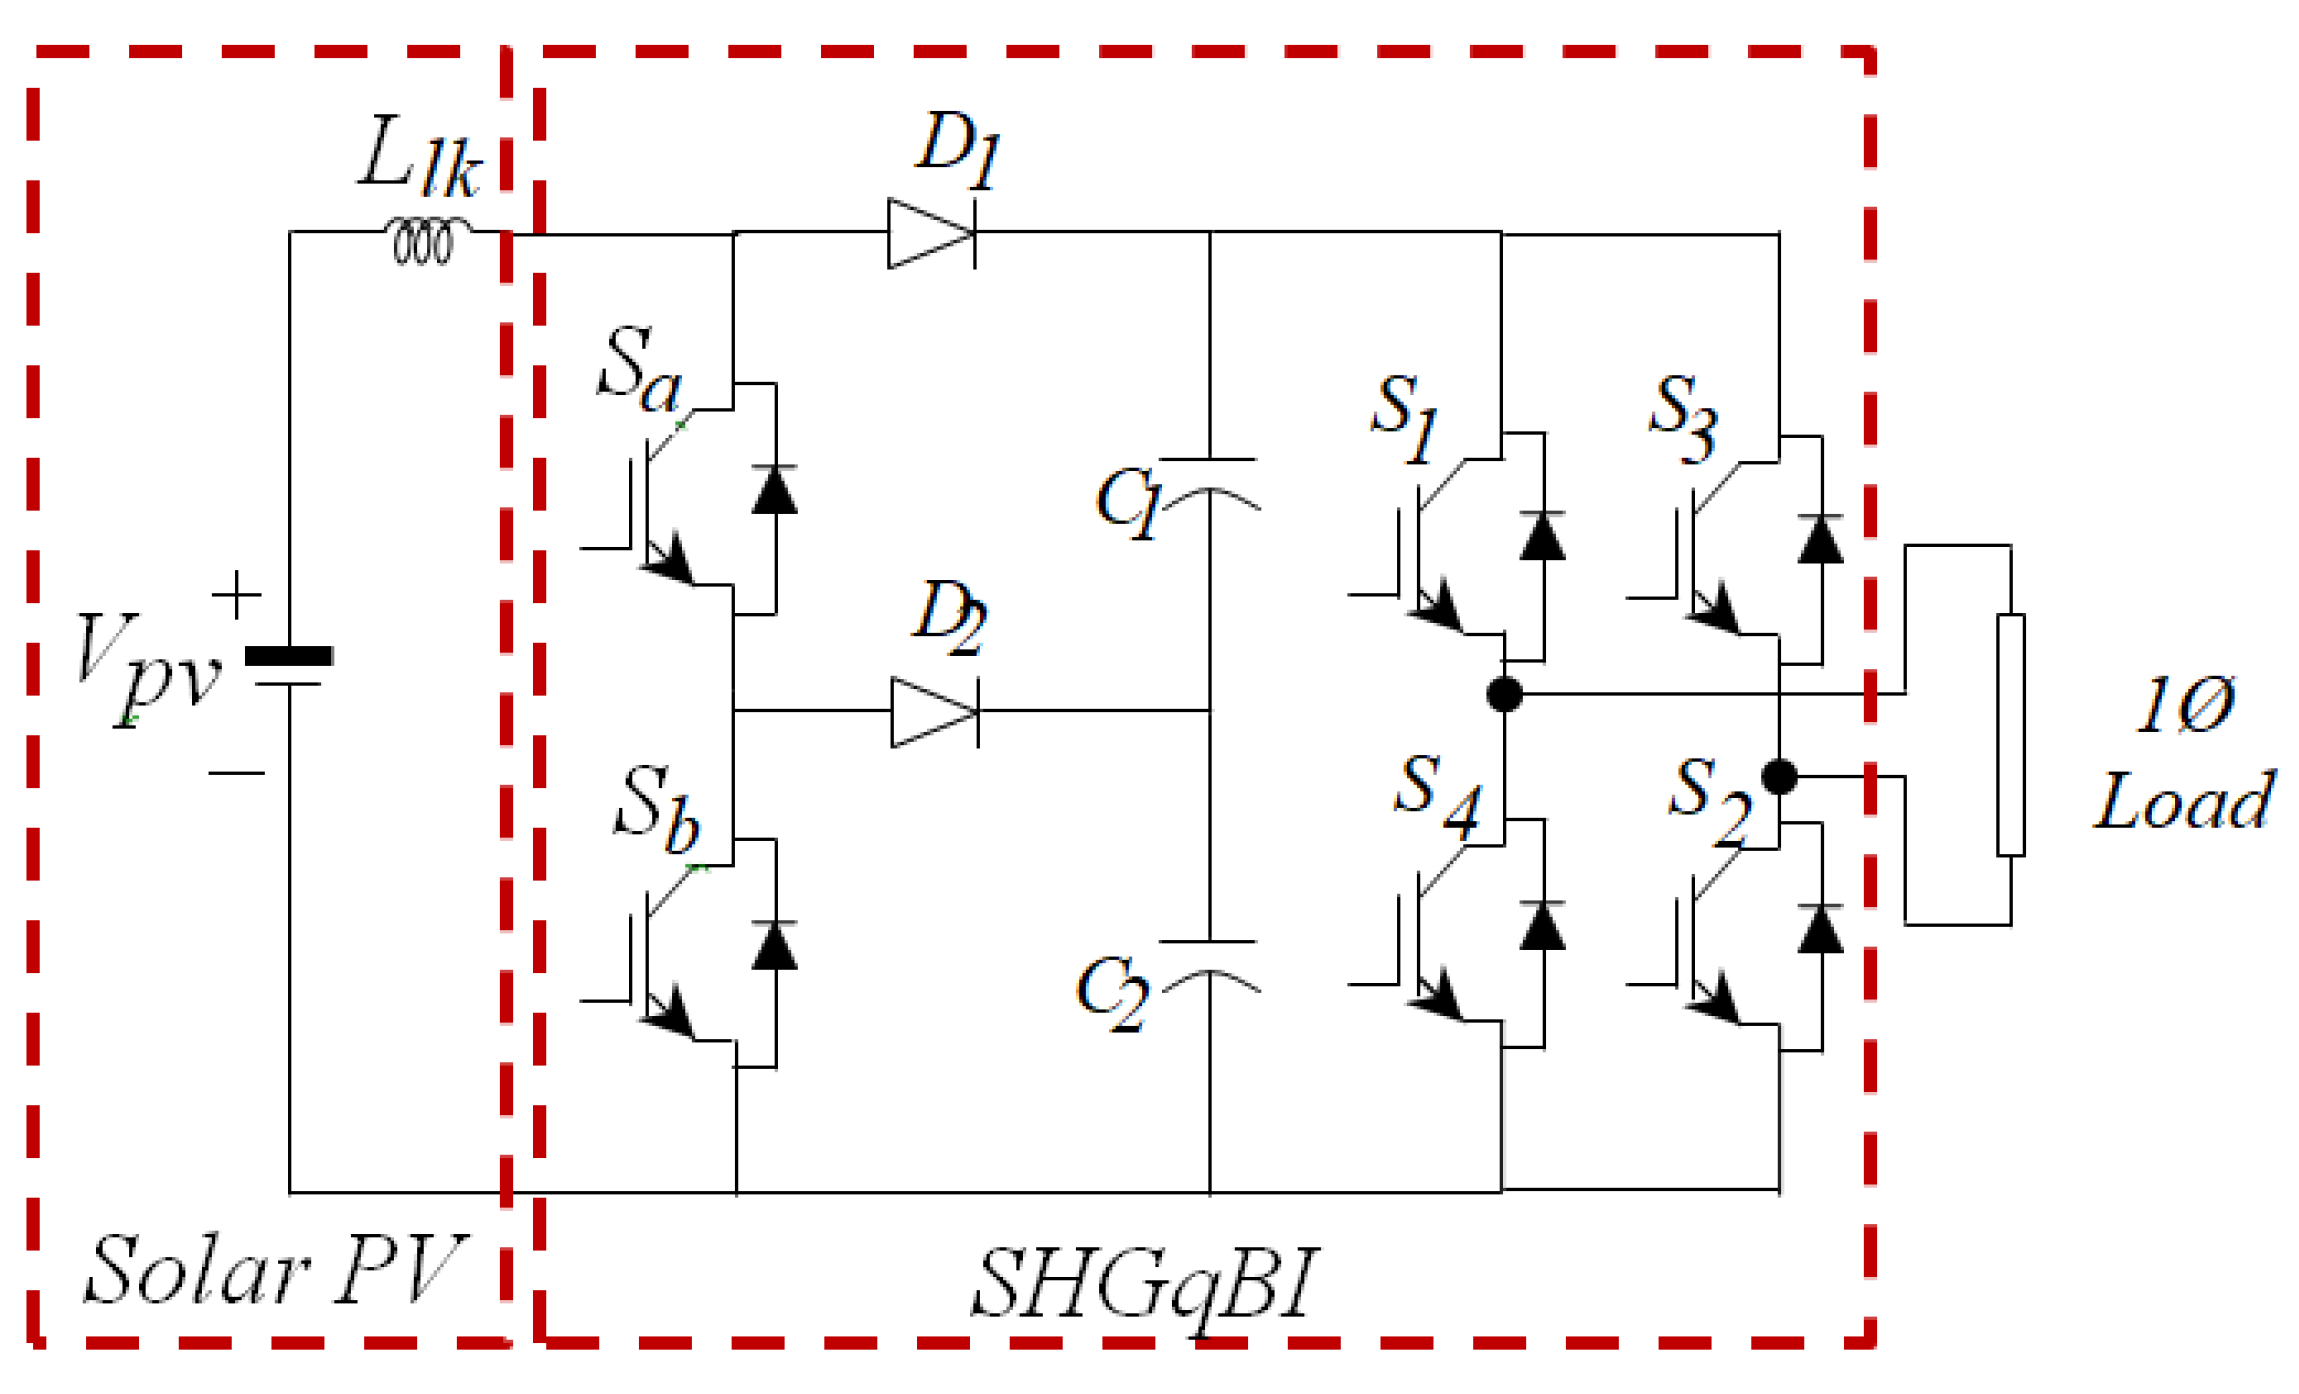
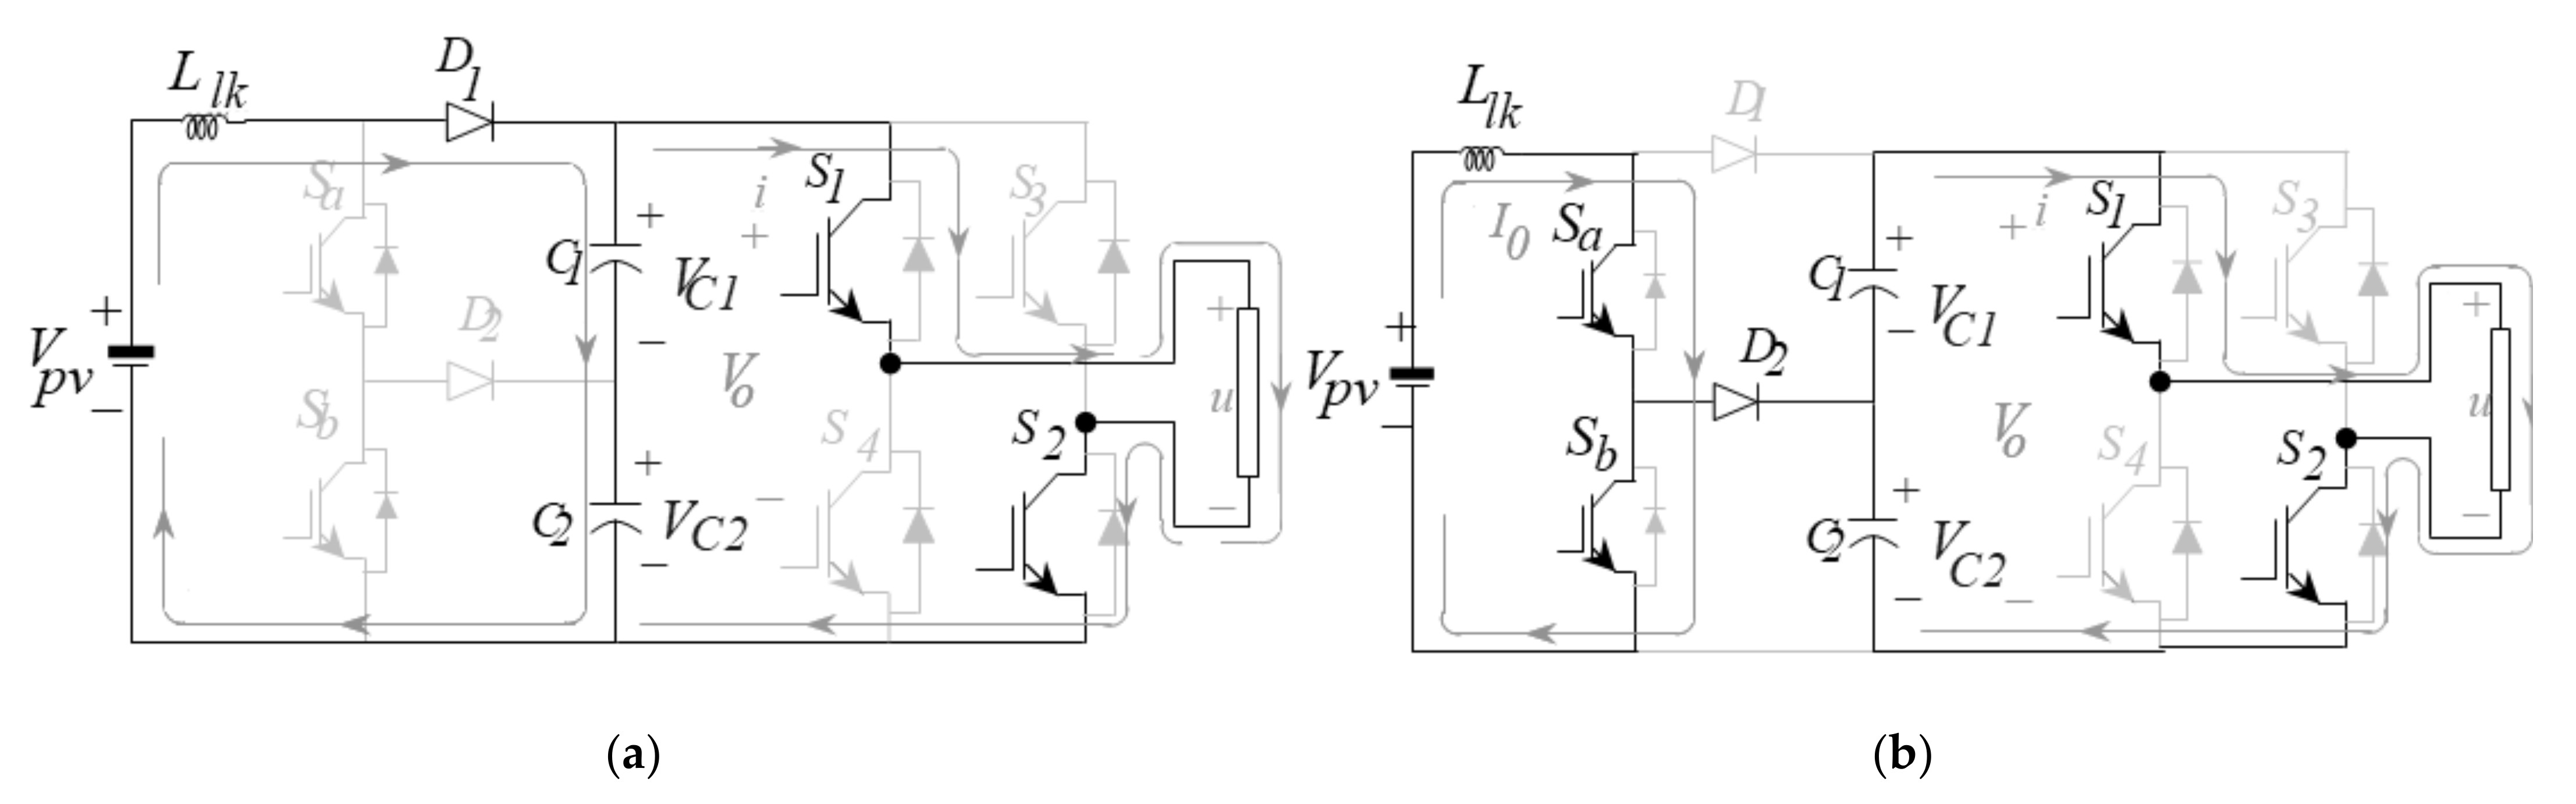
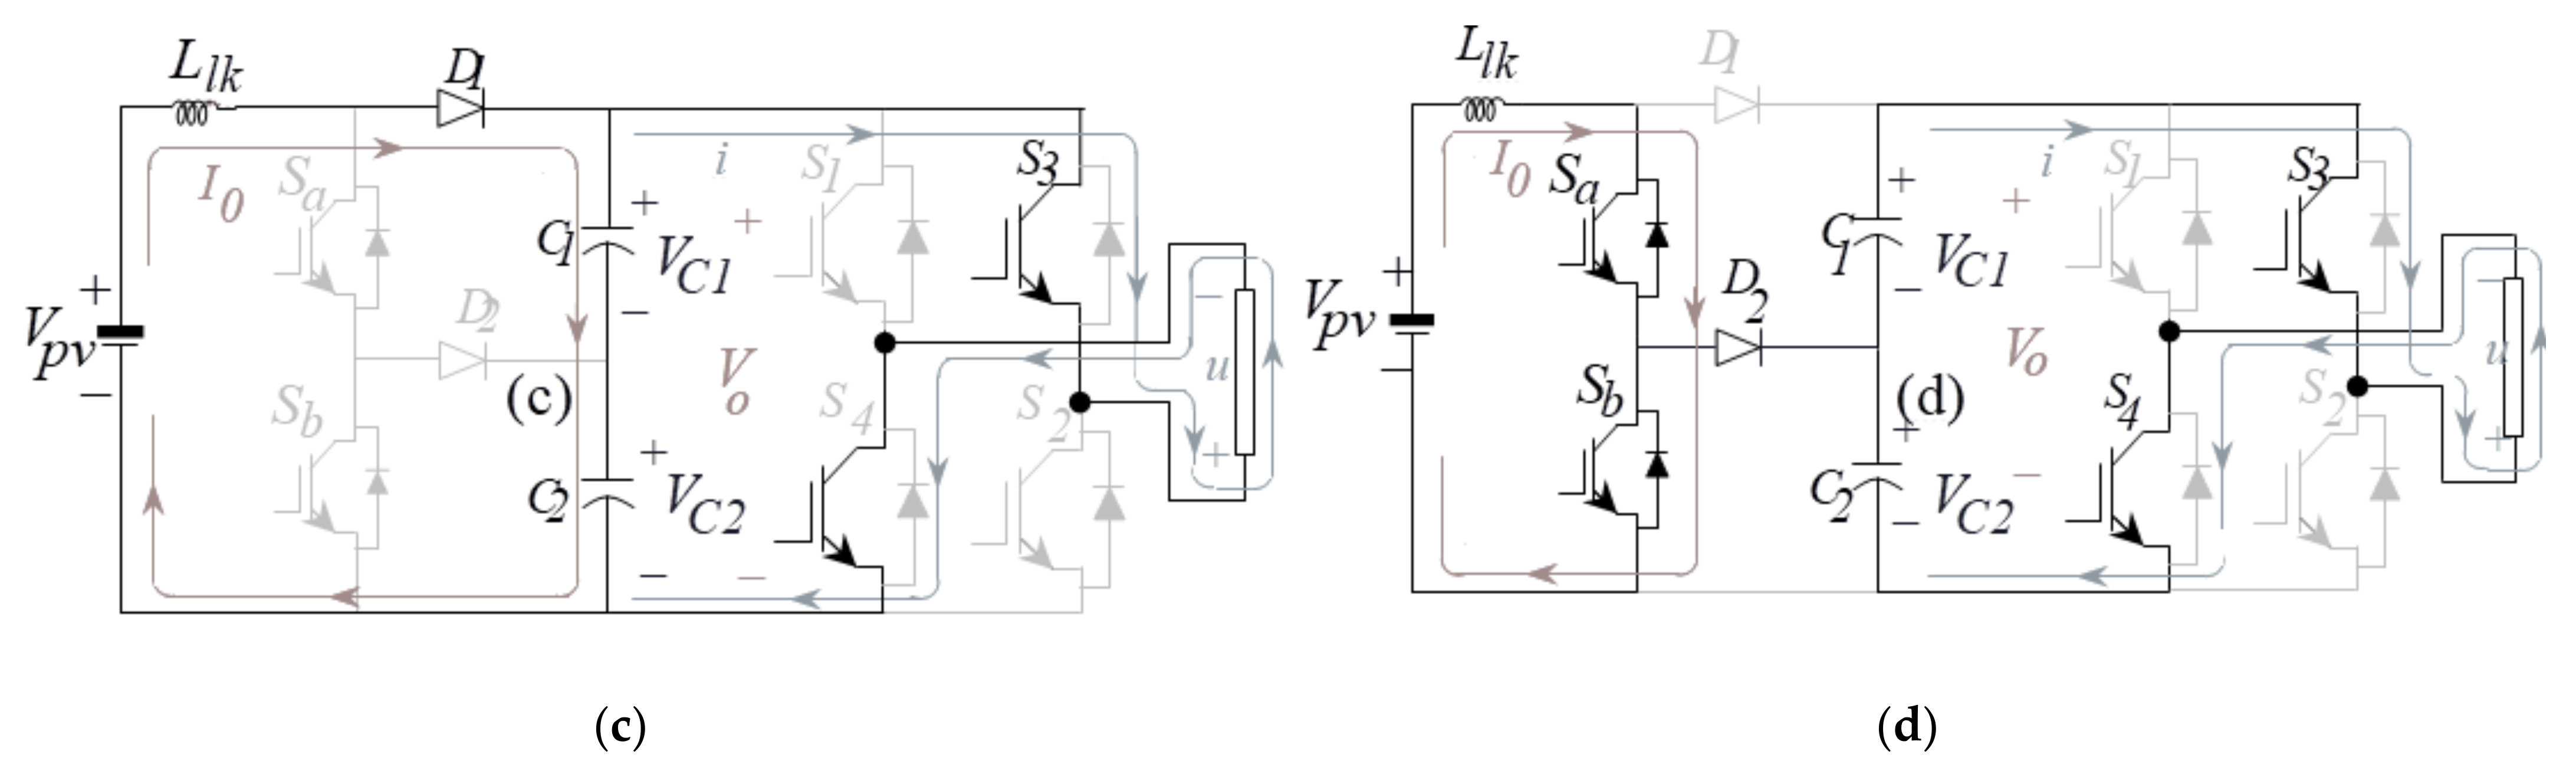
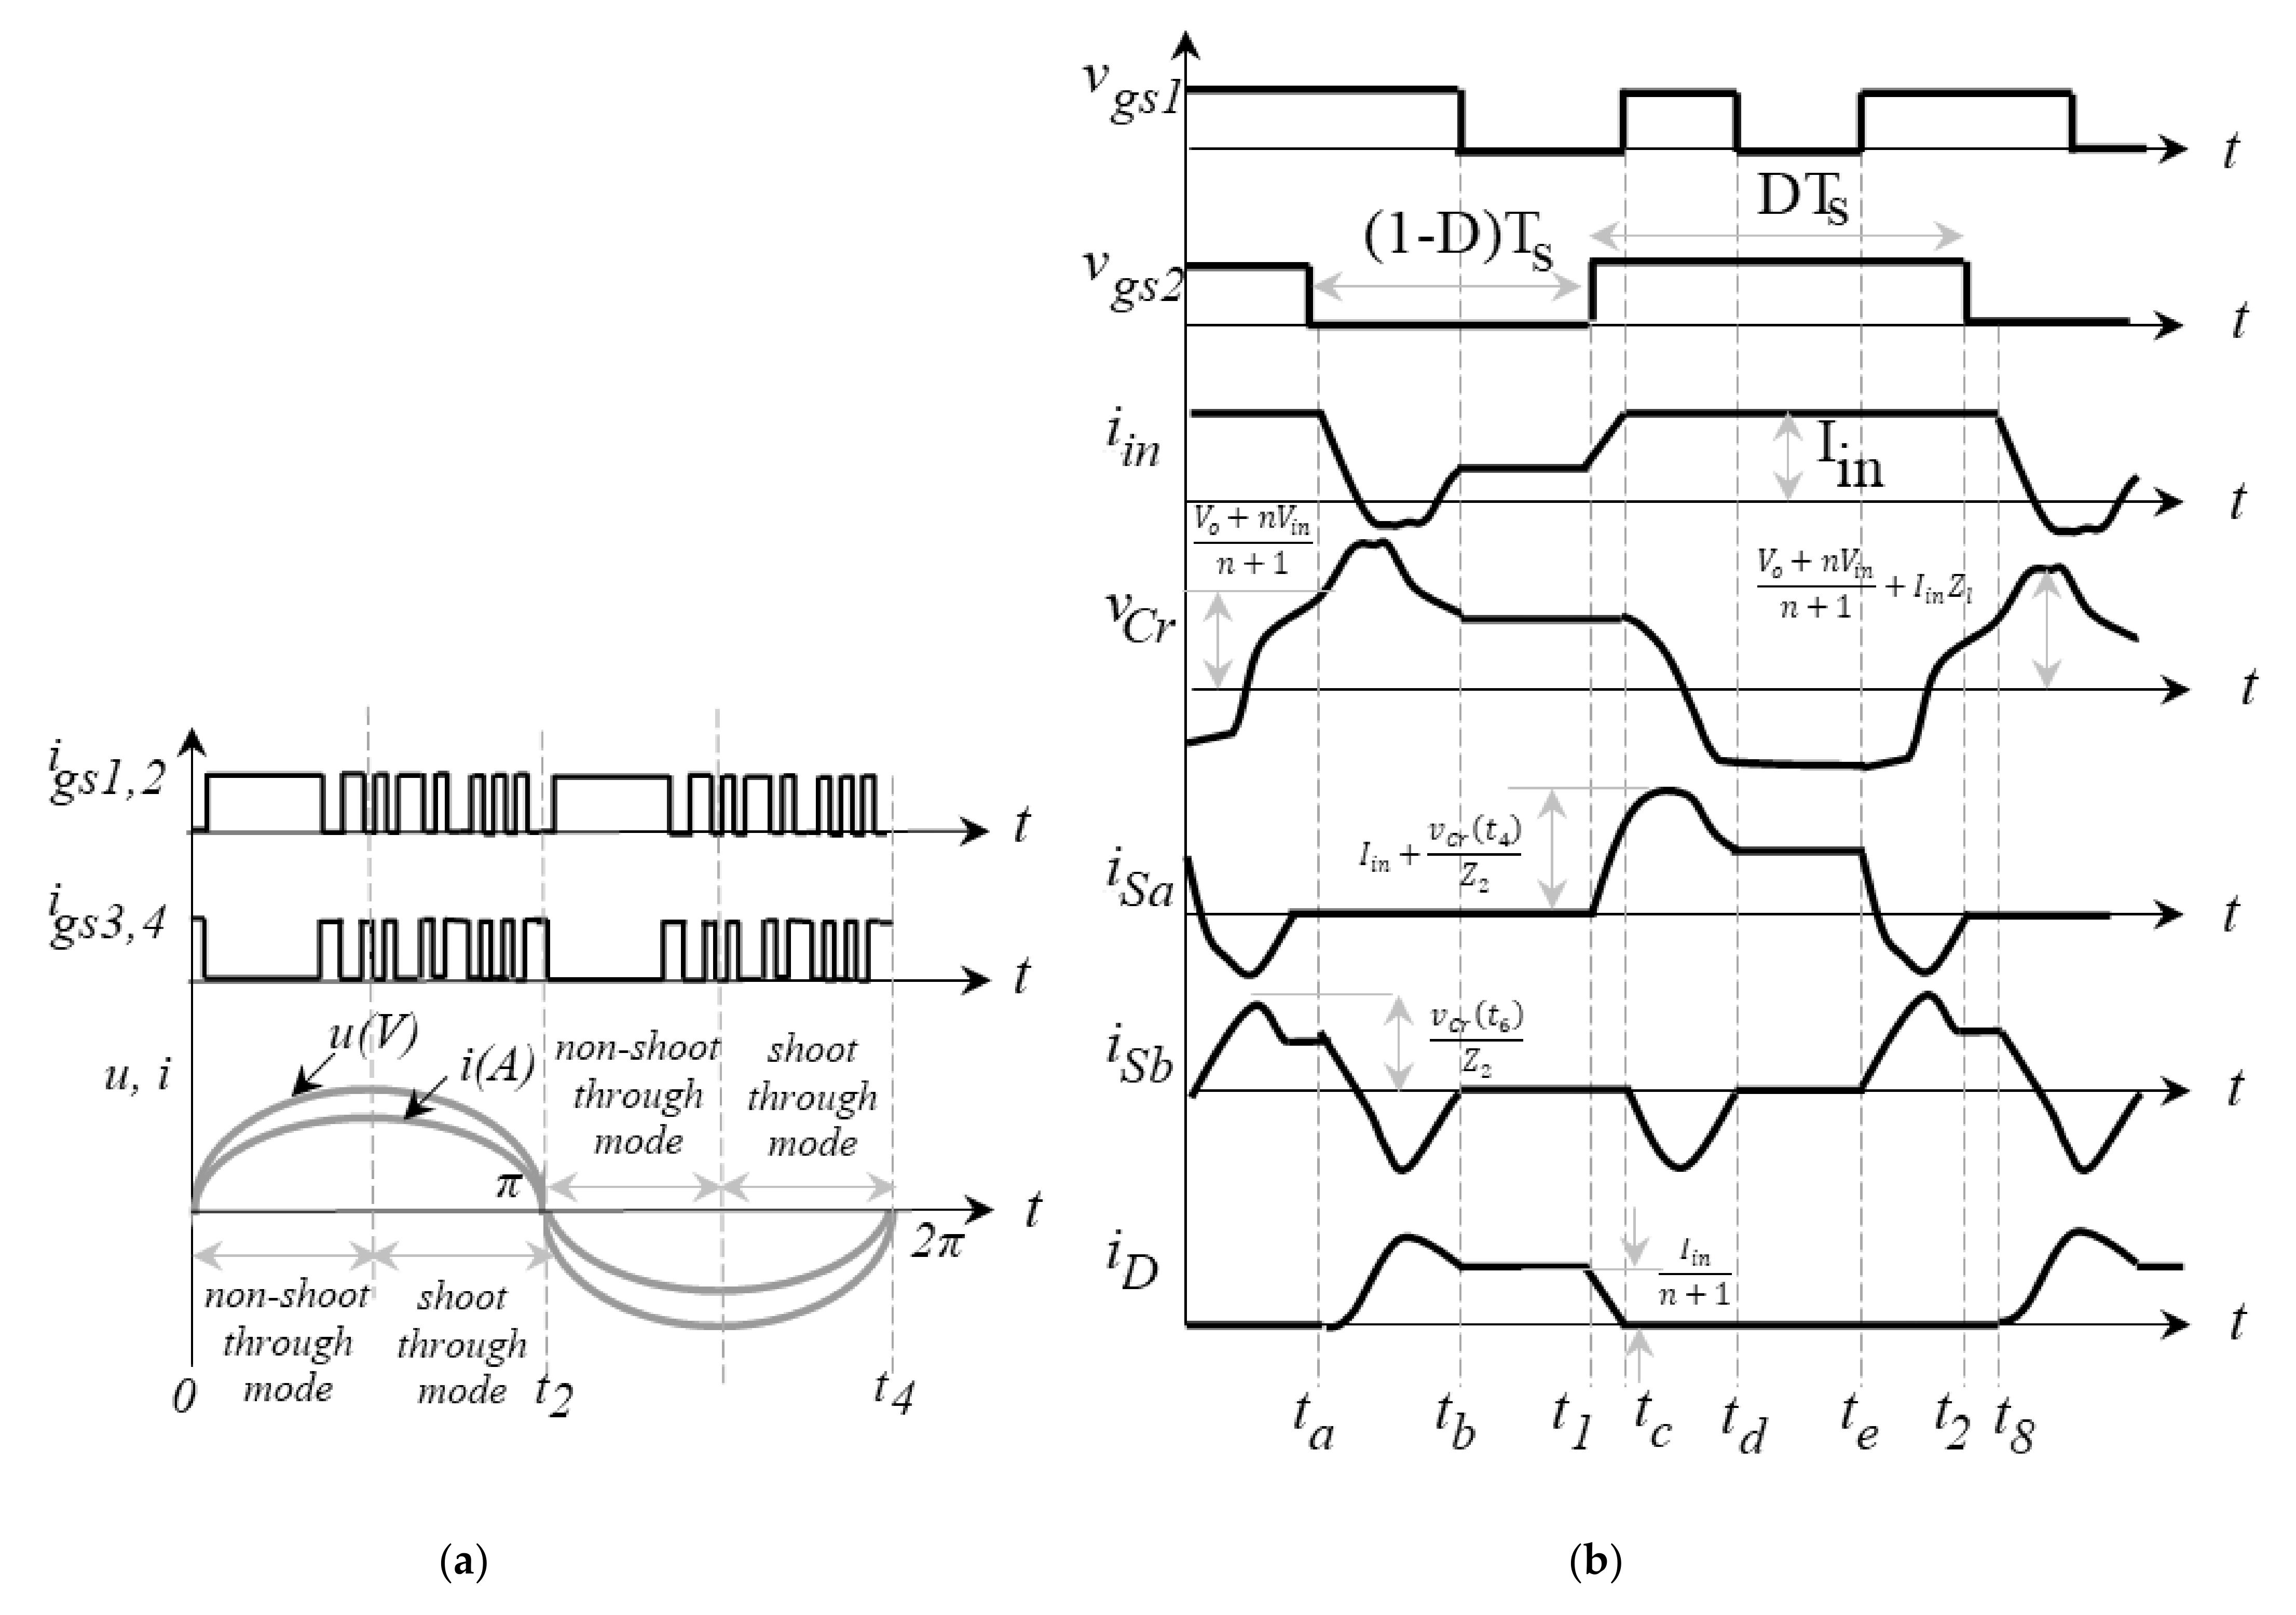
2.2. Proposed SHGqBI
- Mode 1: Inverter stage 01.
- (A)
- Non-shoot through mode.
- (B)
- Shoot through mode.
- Mode 2: Inverter stage 02.
- (A)
- Non-shoot through mode.
- (B)
- Shoot through mode.
2.2.1. Mode 1 : Inverter Non-Shoot through Mode
2.2.2. Mode 1 : Inverter Shoot through Mode
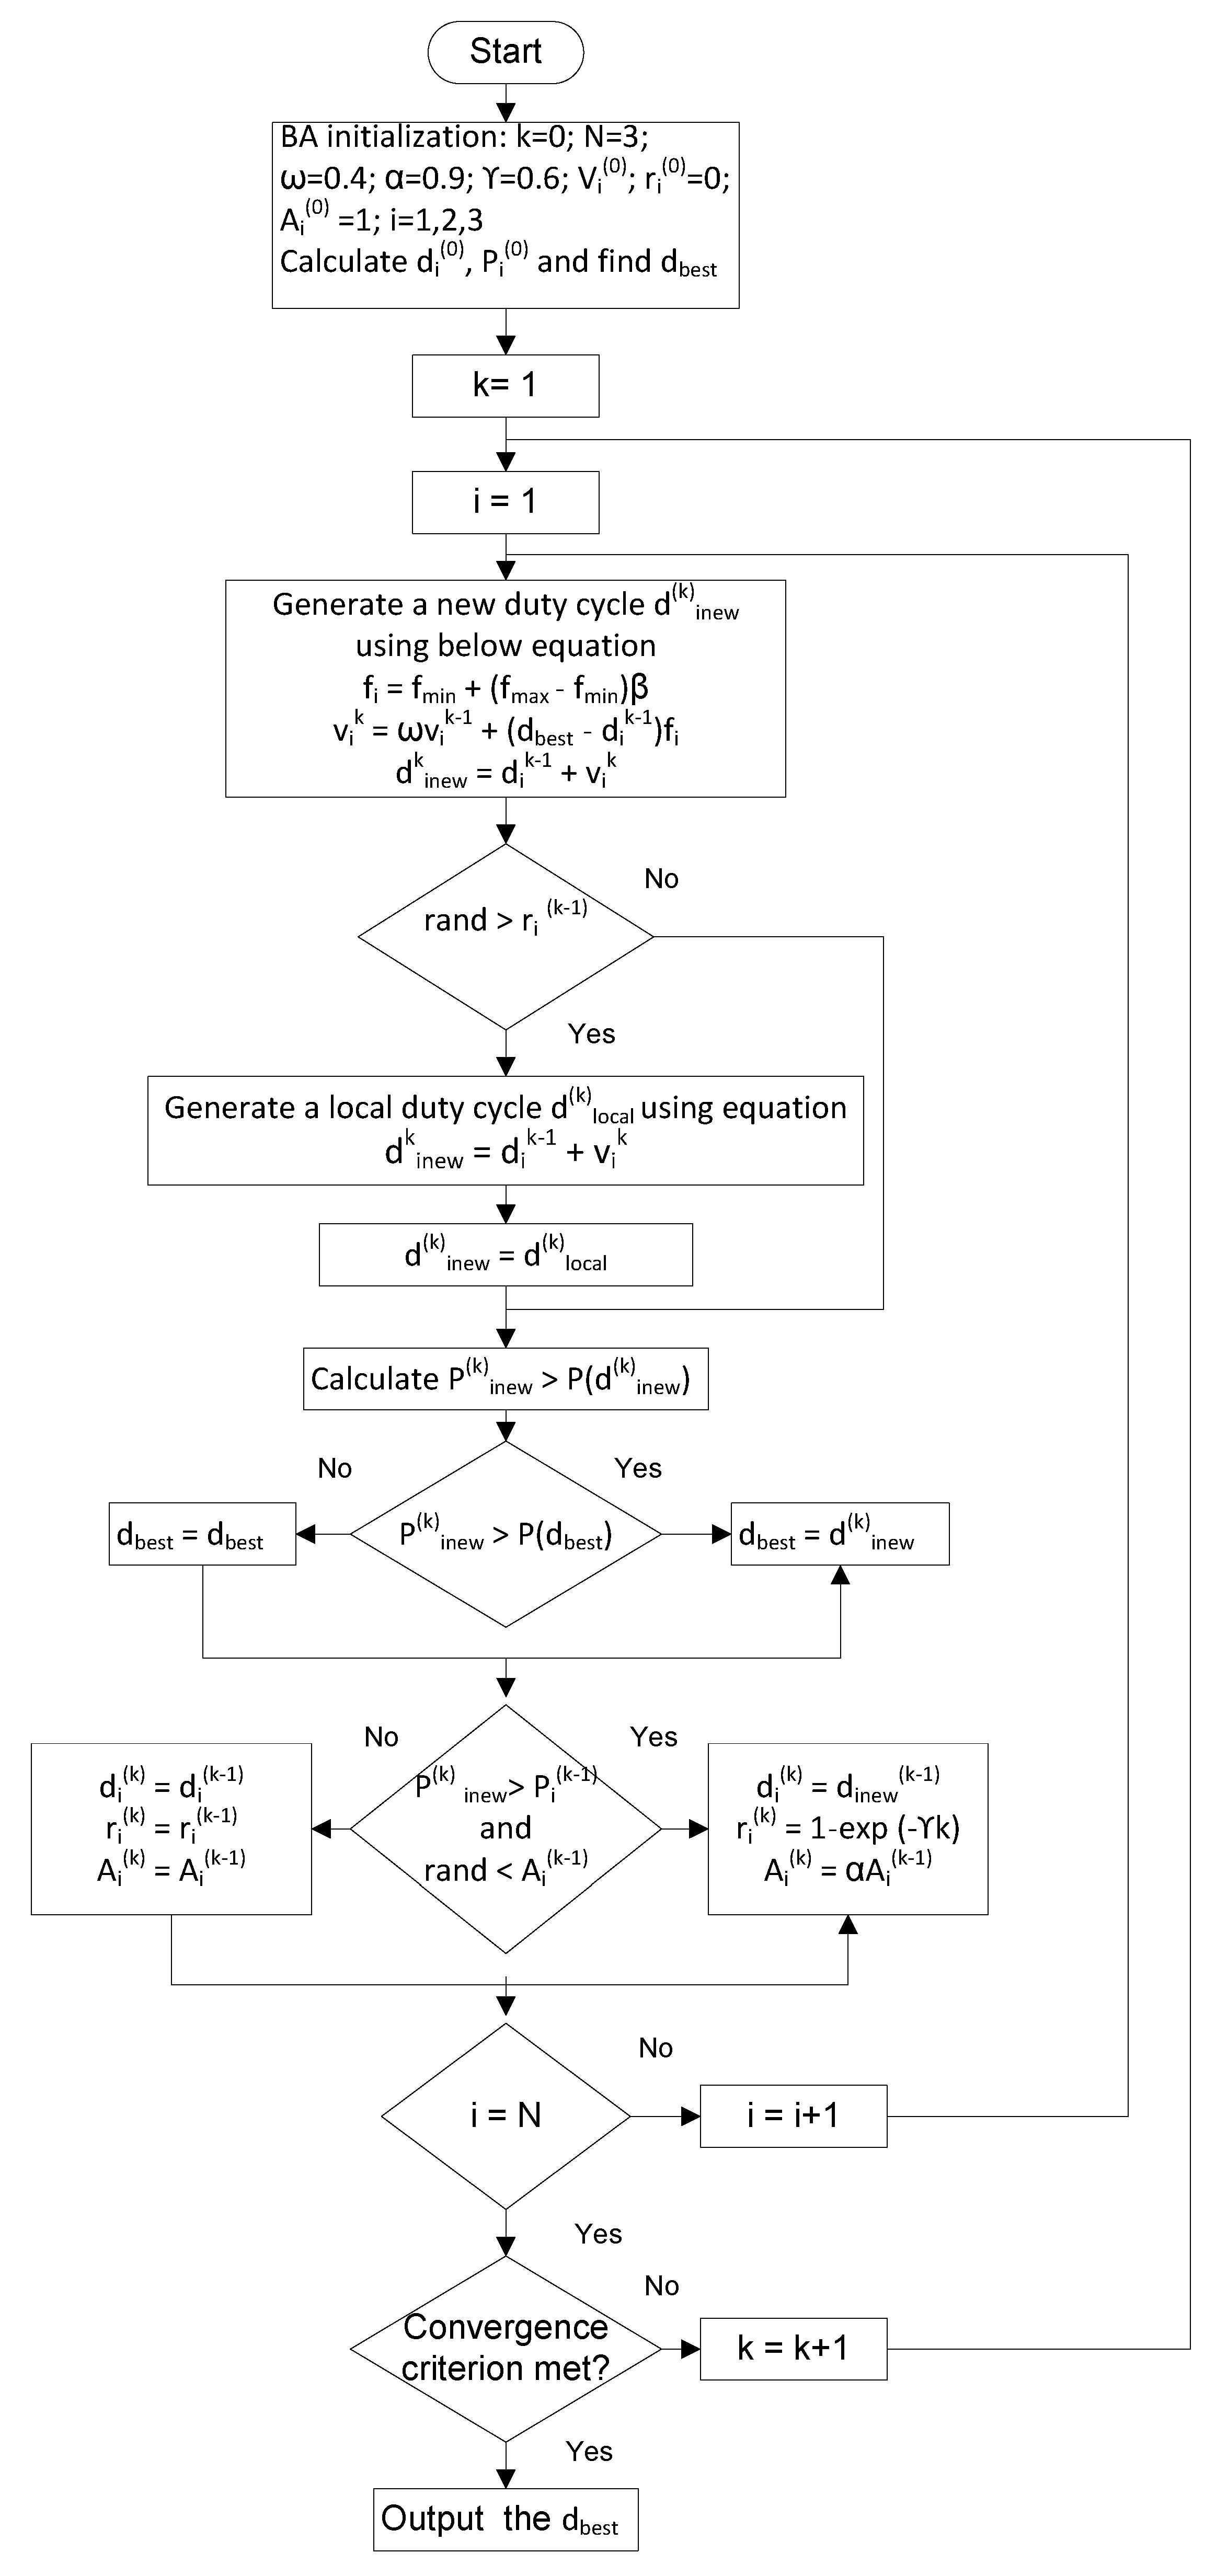
2.3. BAT Algorithm for SPV
3. Results and Discussions
3.1. Simulation Results
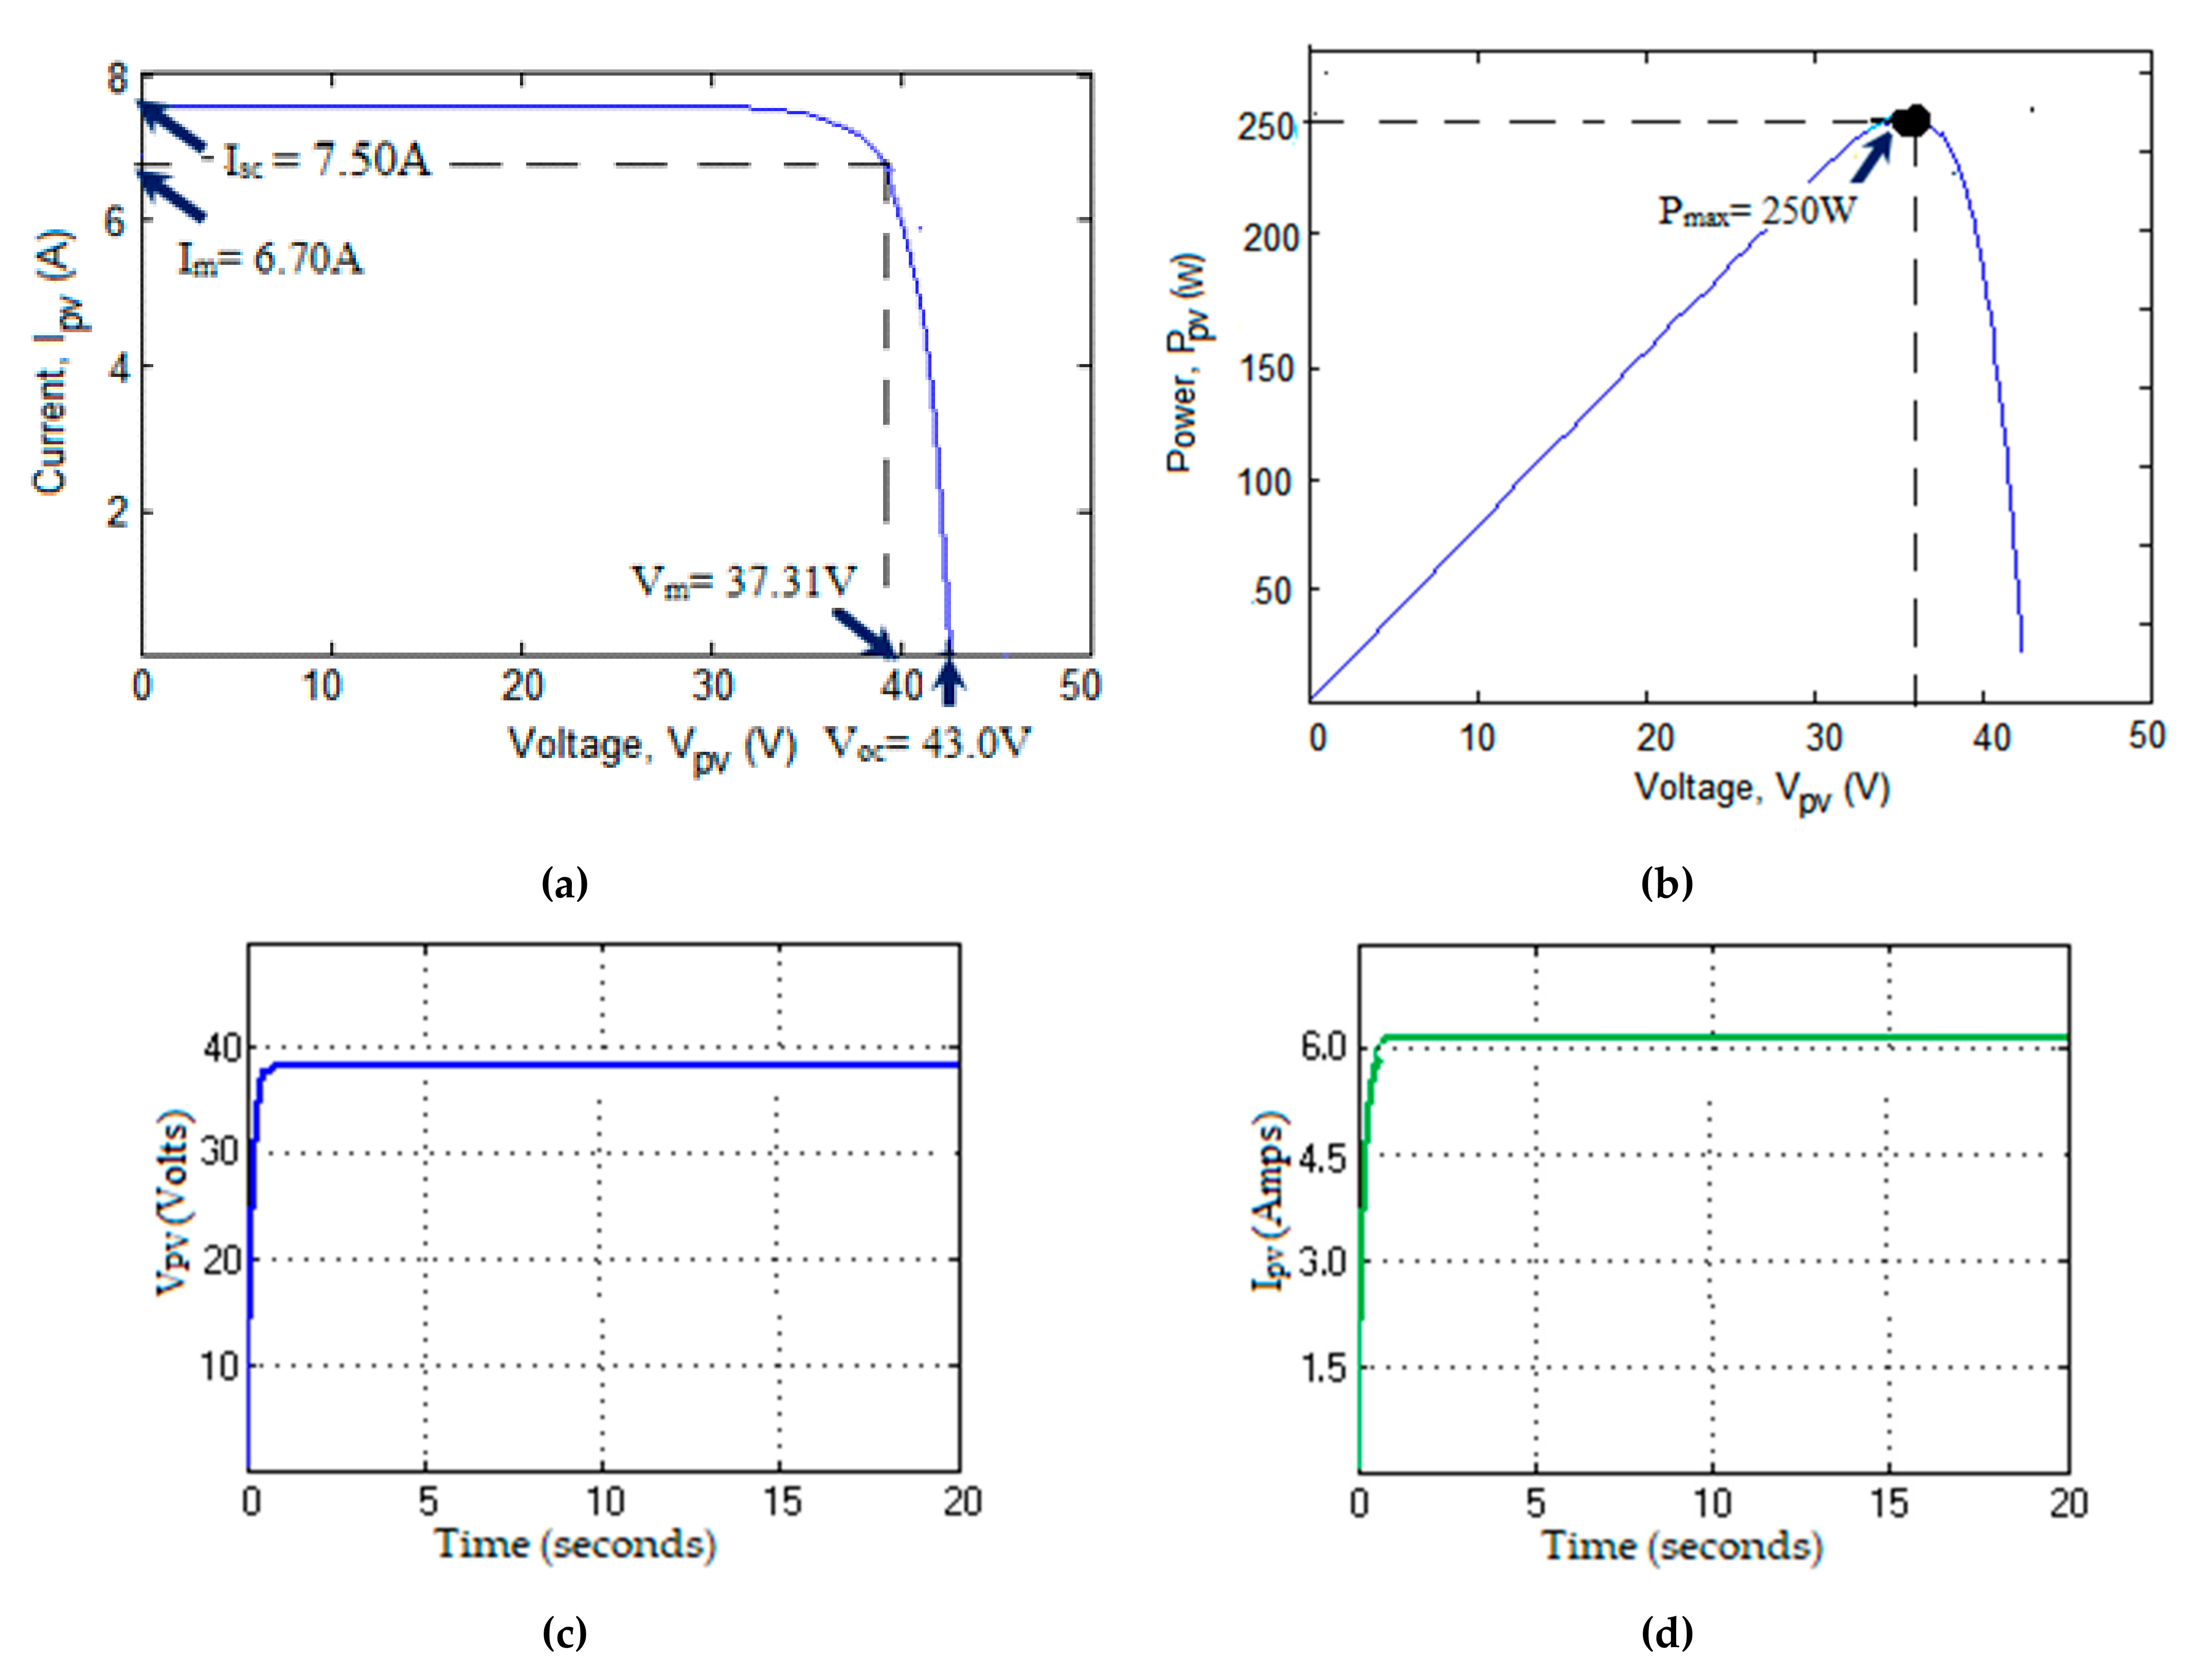
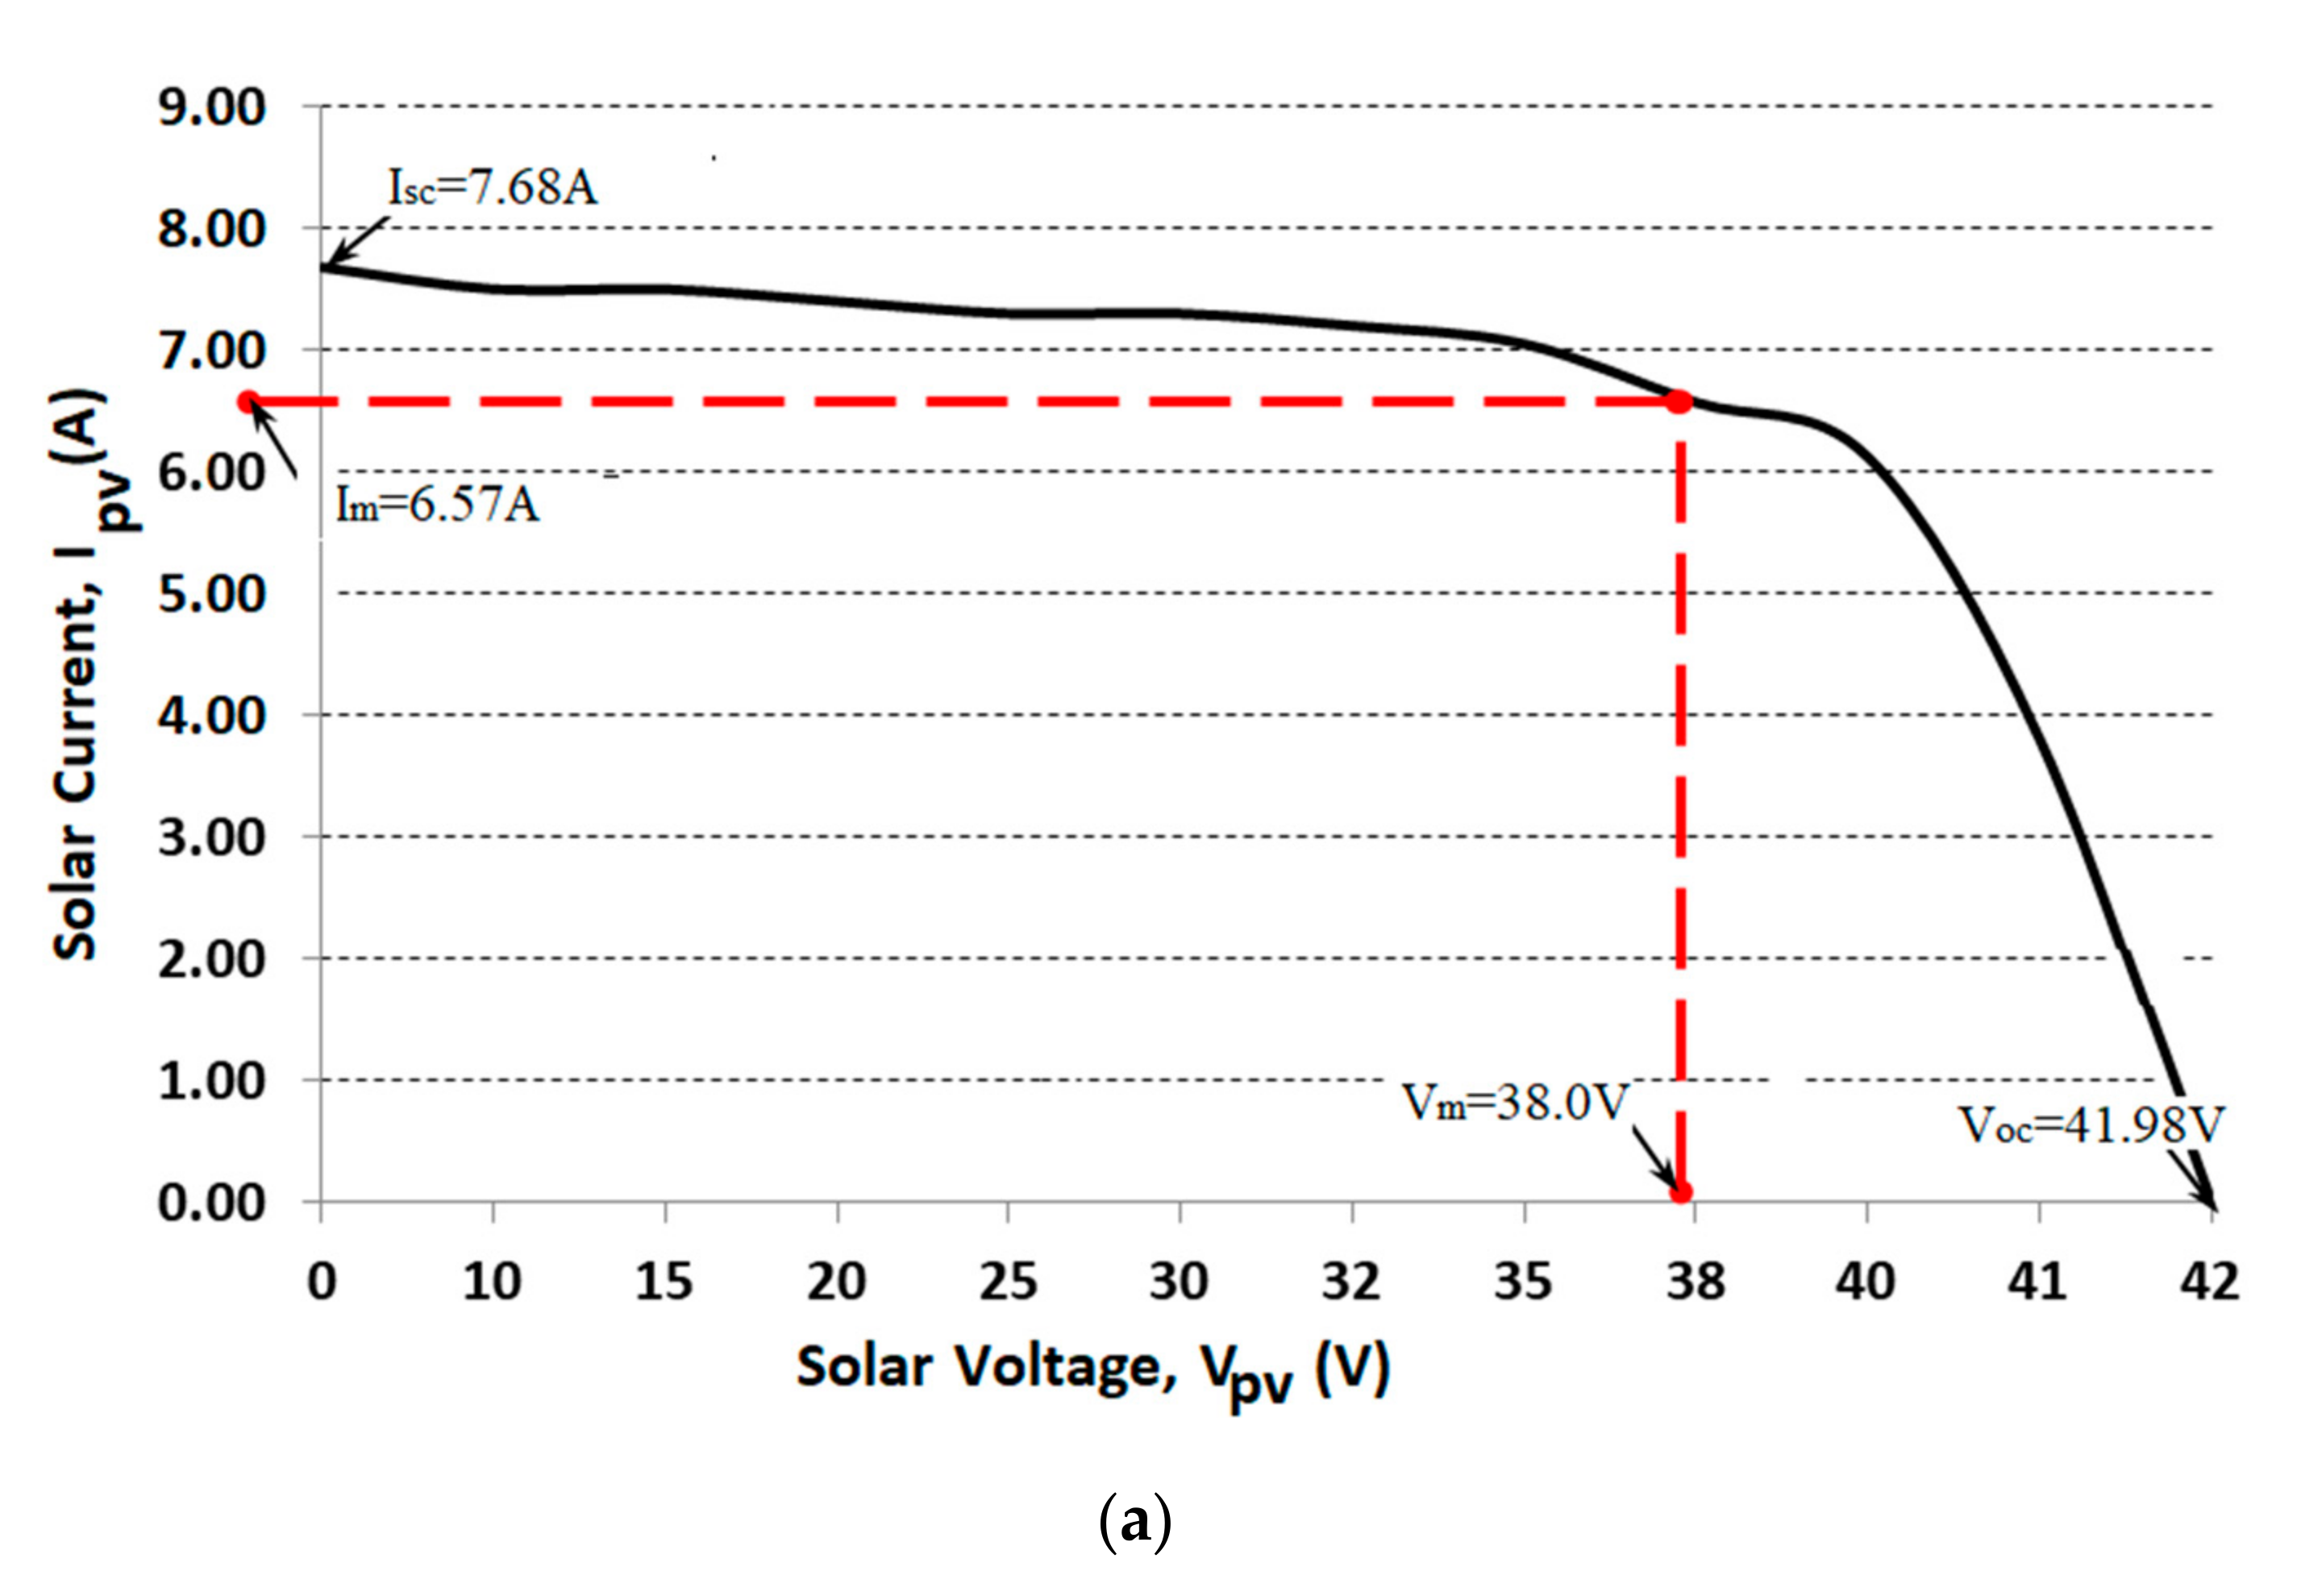
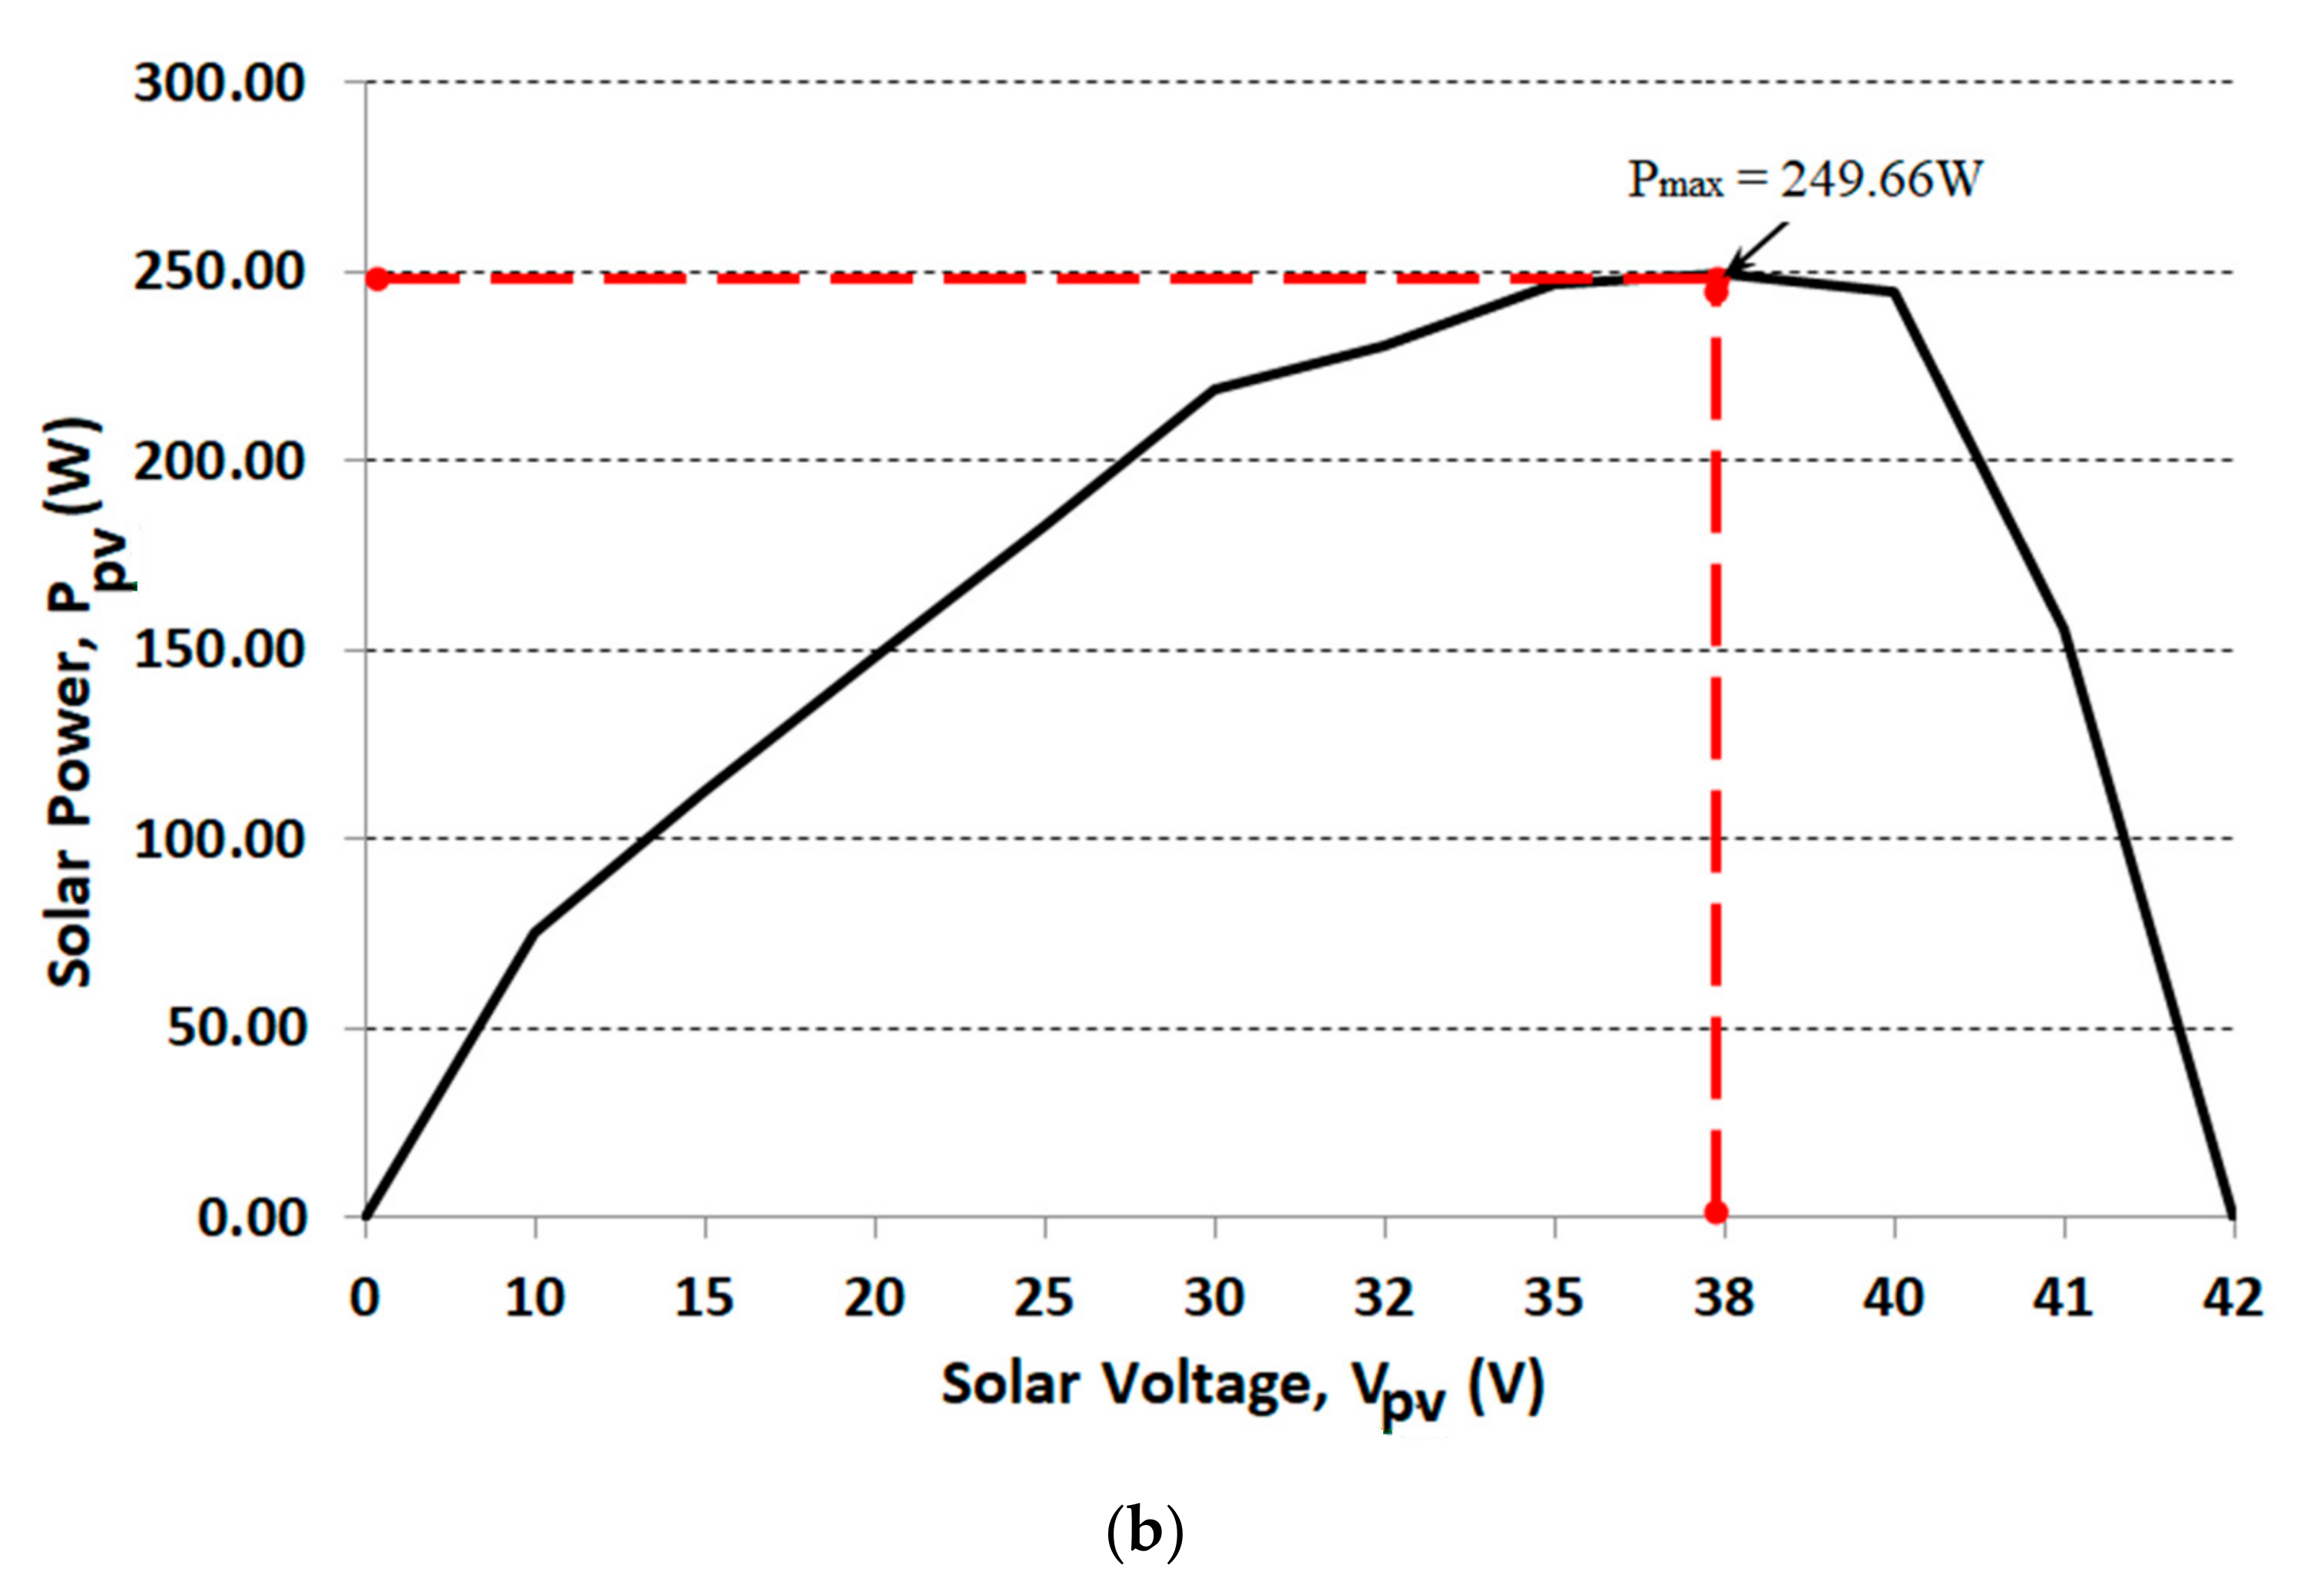
3.1.1. Solar PV
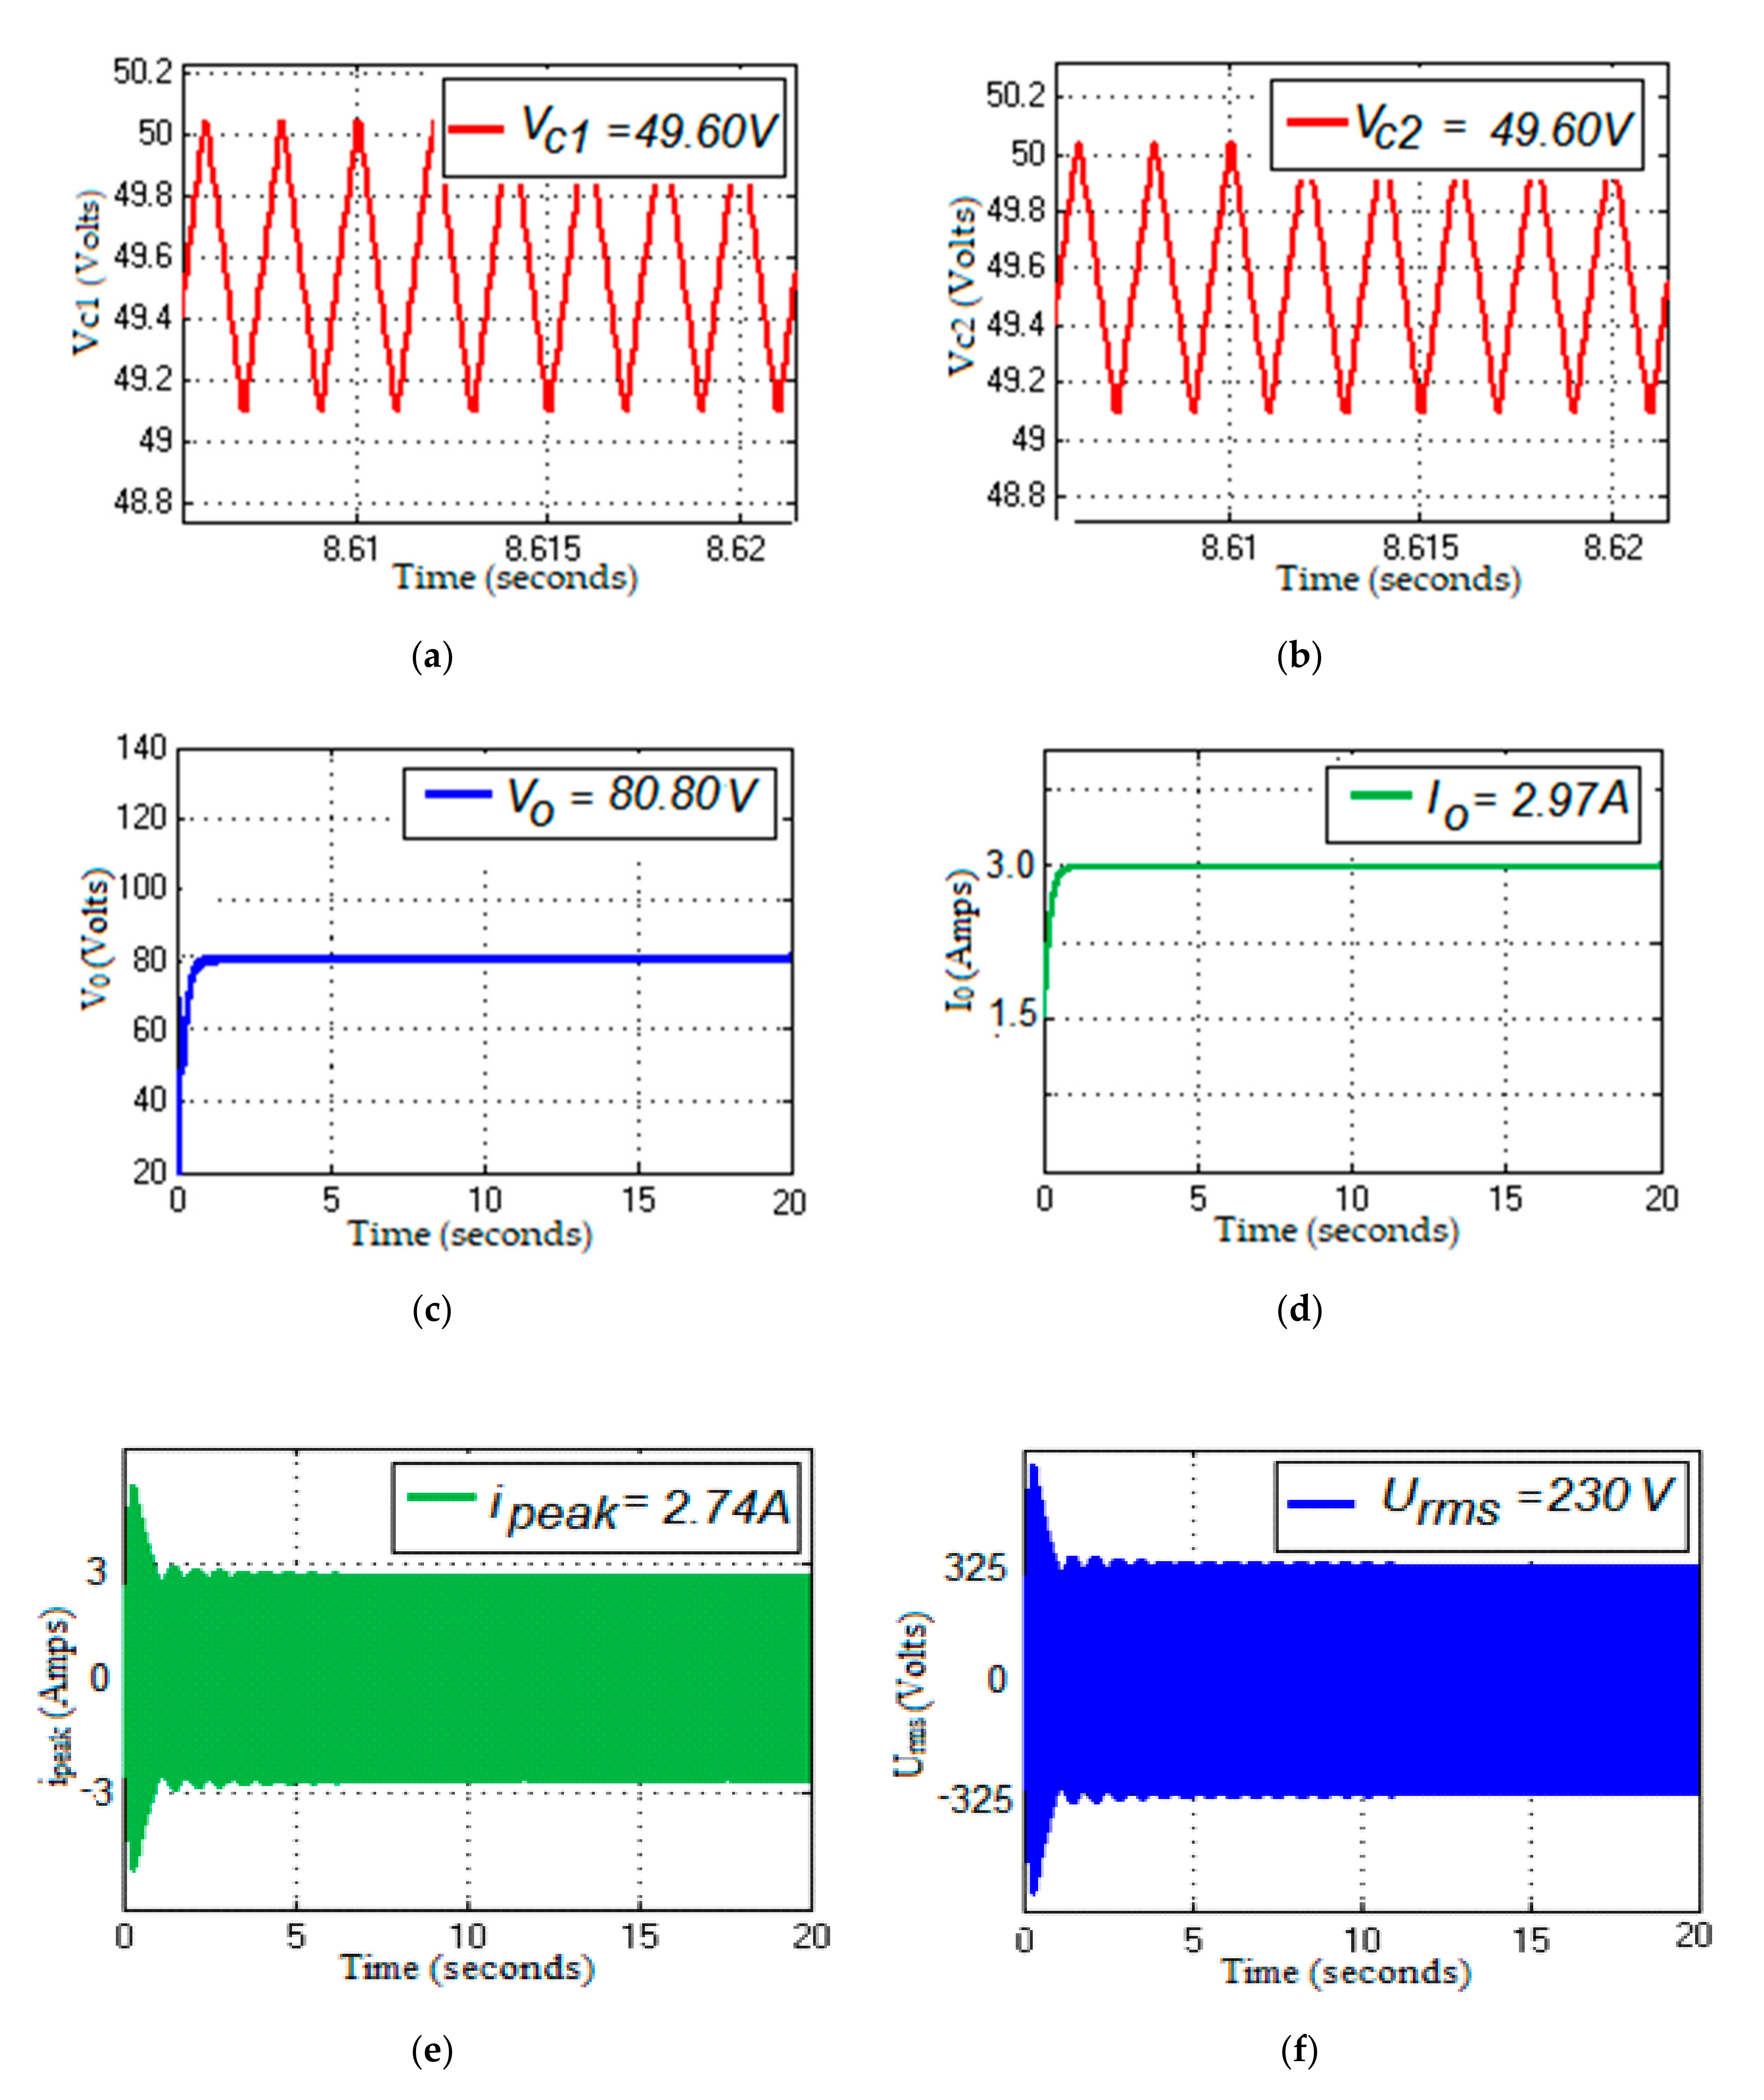
3.1.2. SHGqBI
3.2. Experimental Results
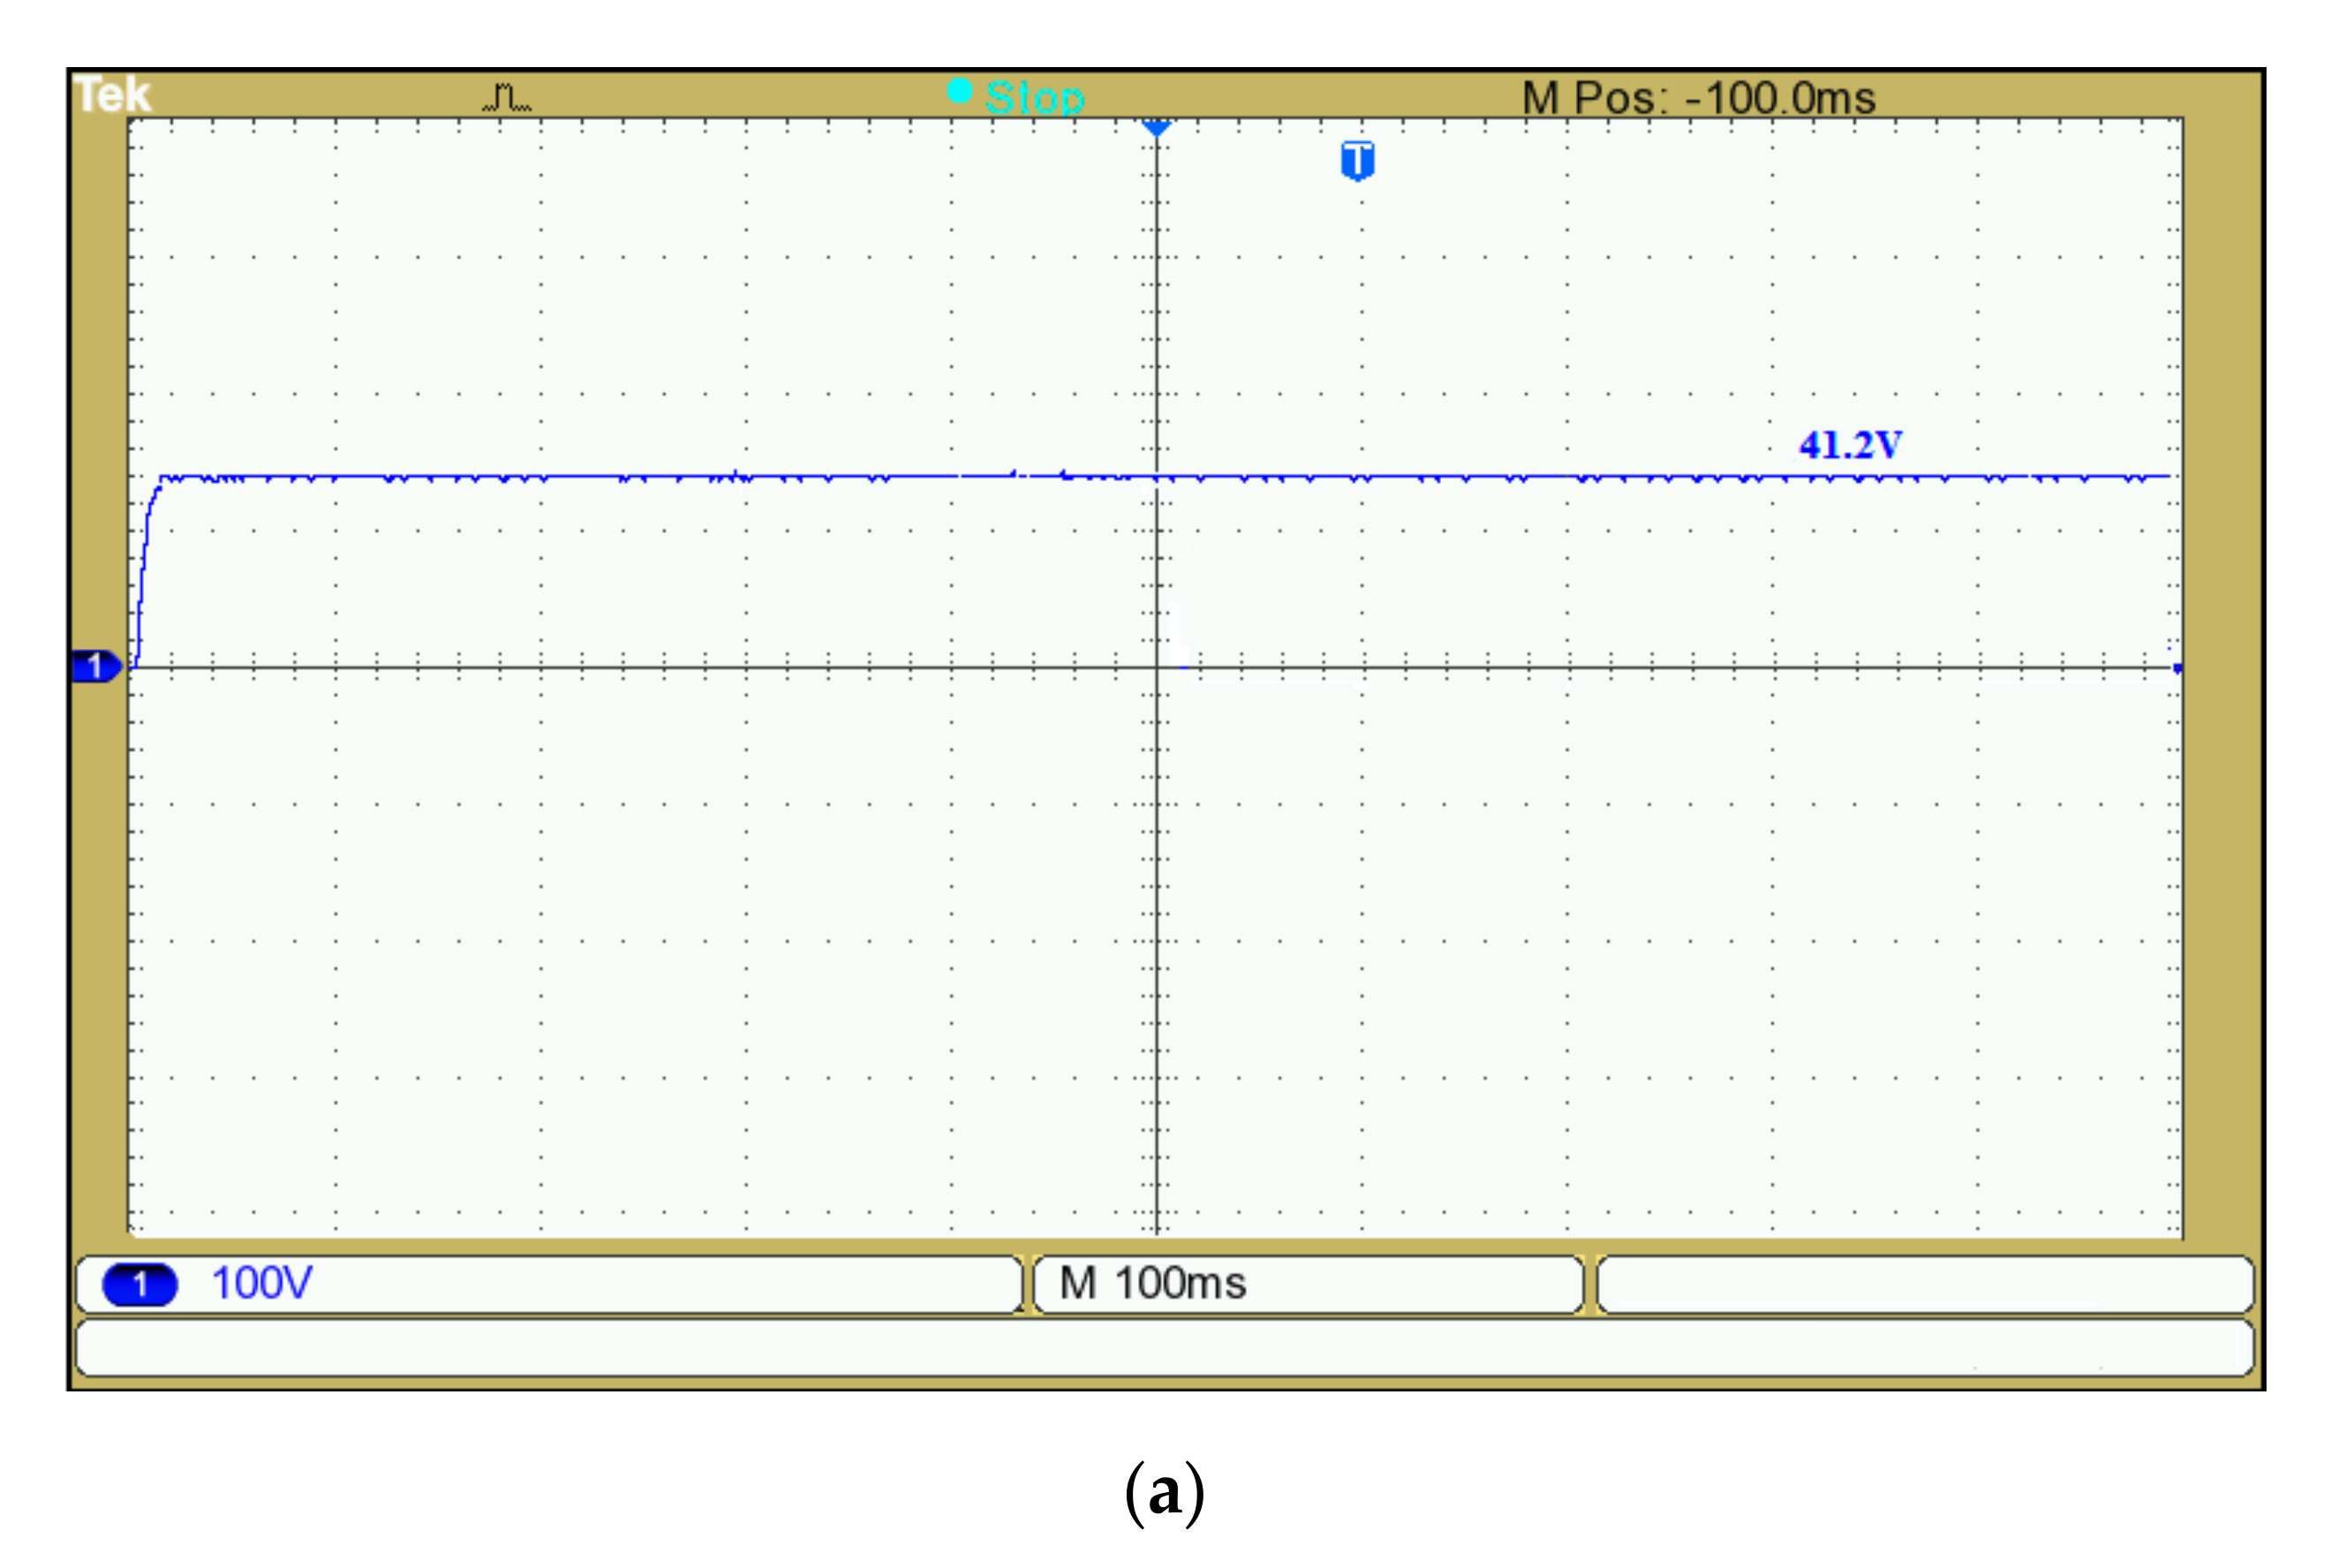
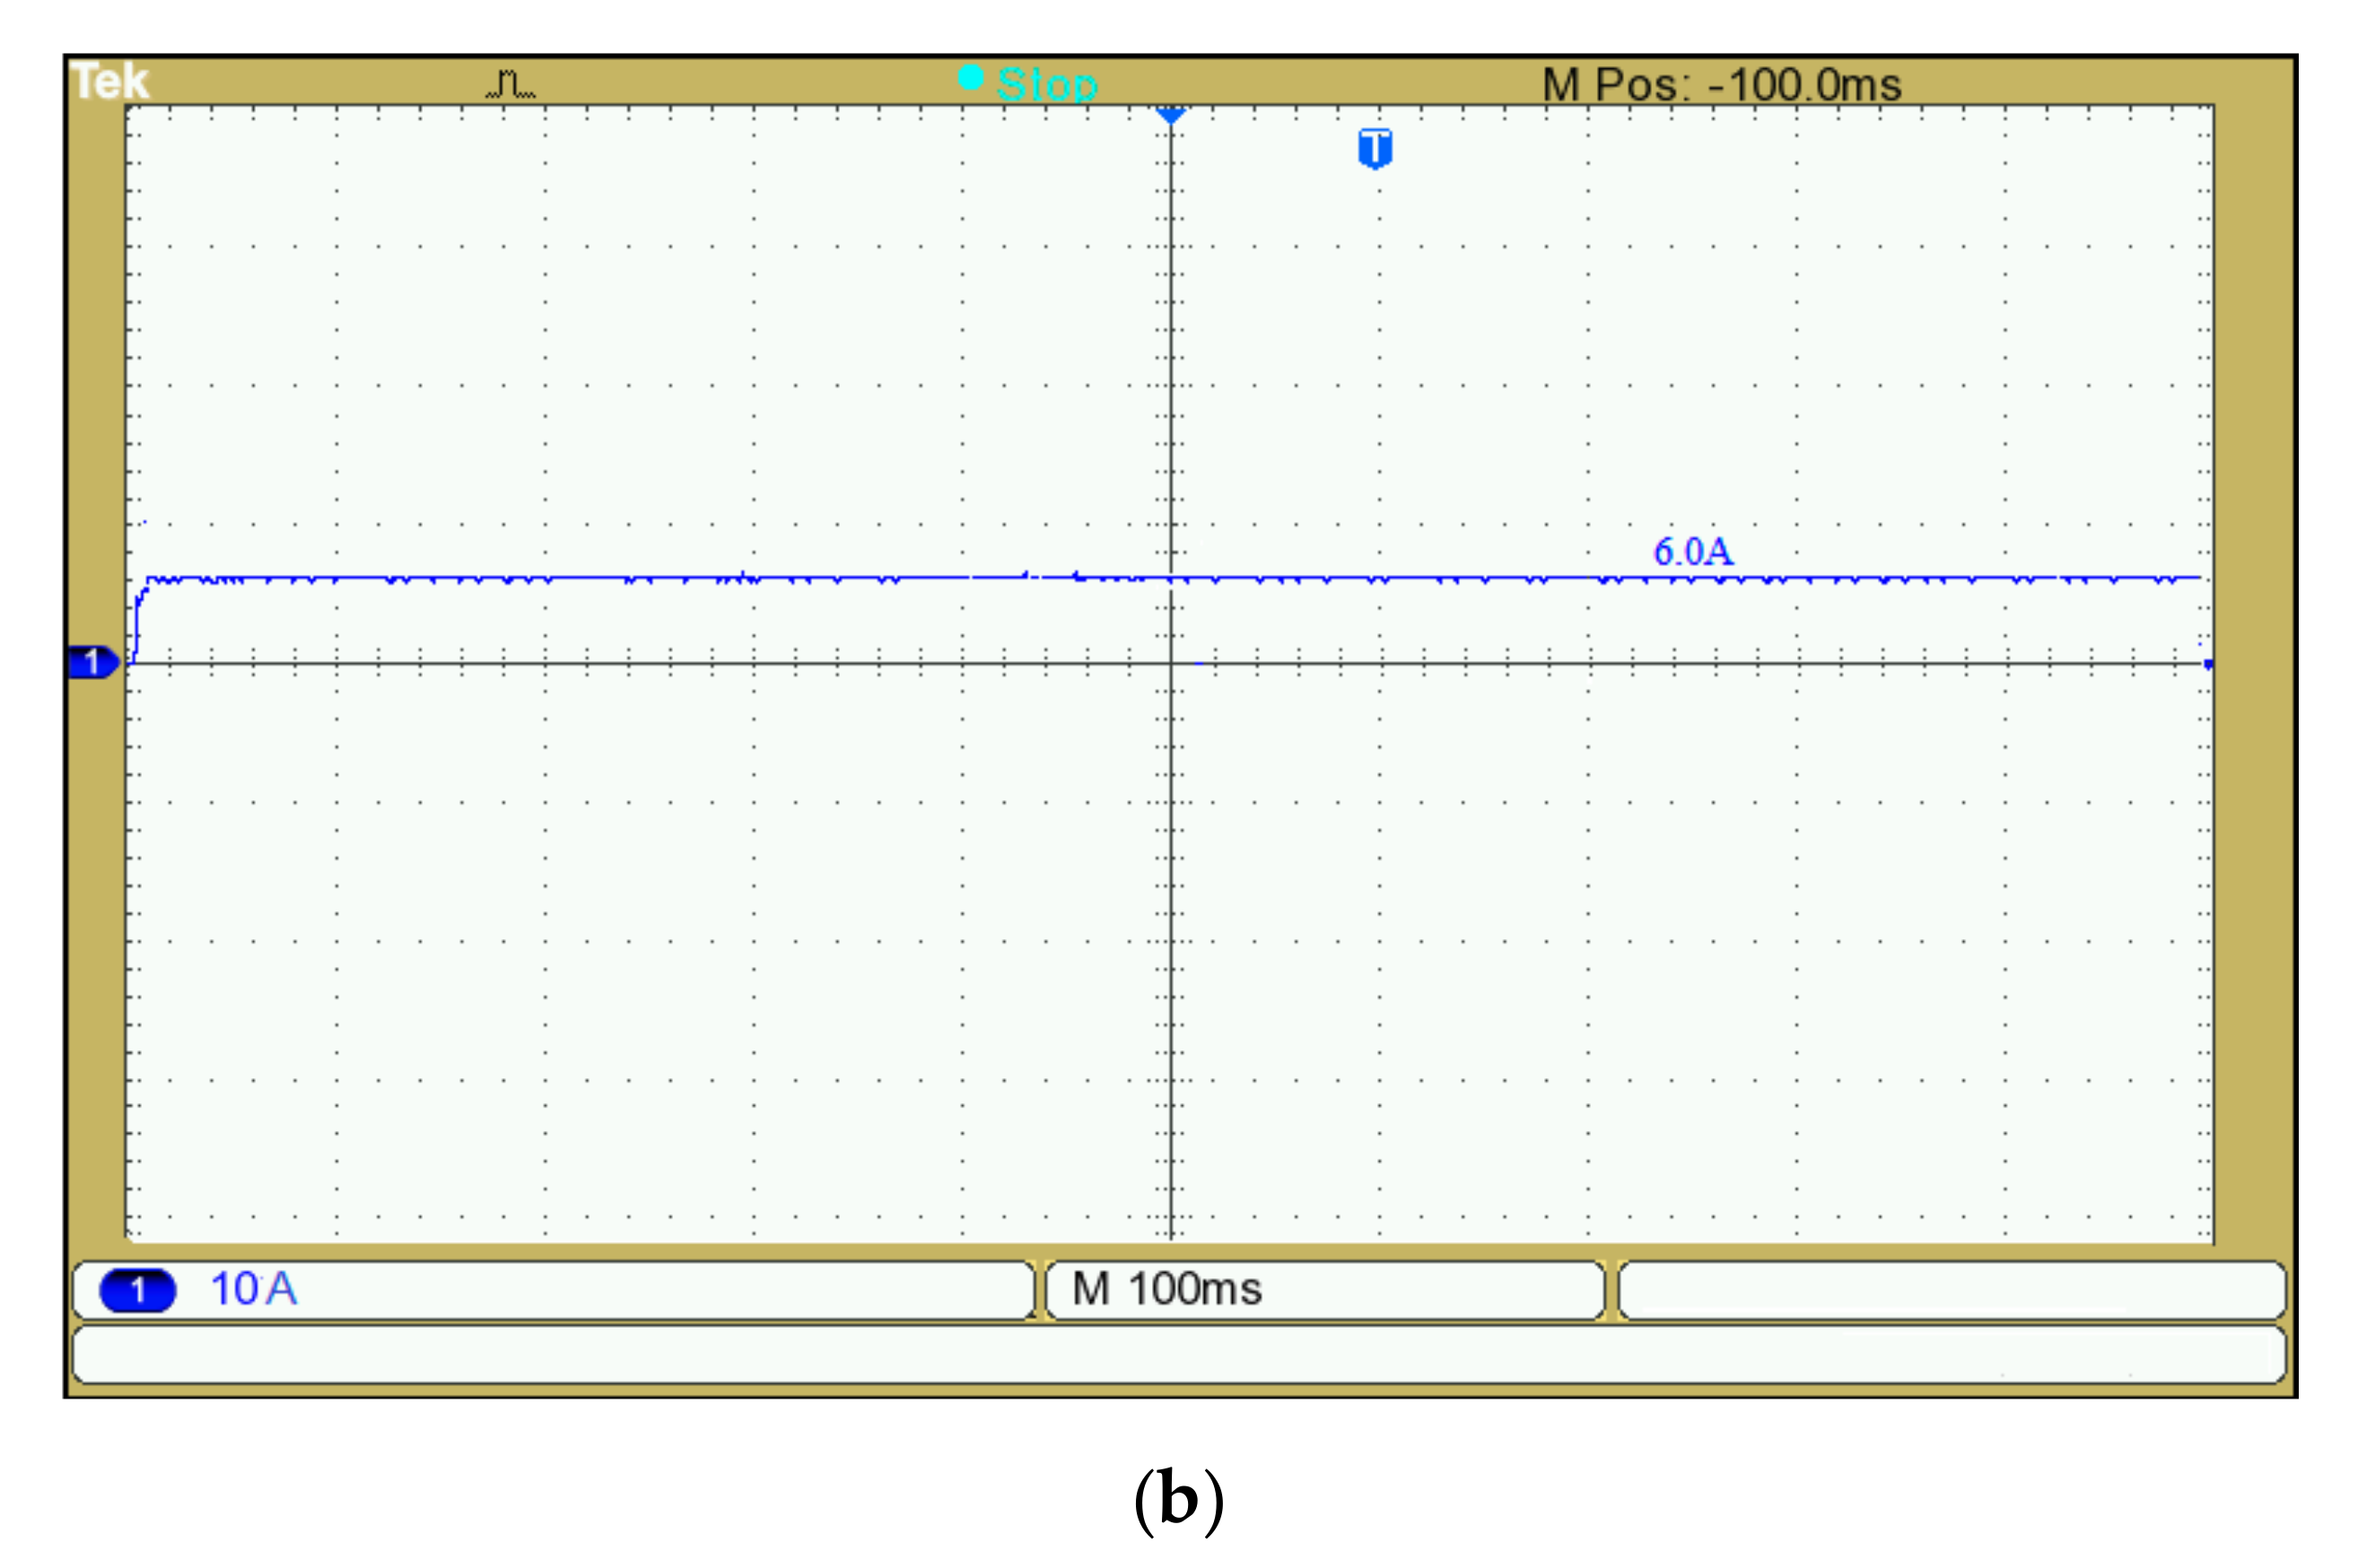
3.2.1. SPV
3.2.2. SHGqBI
4. Comparative Analysis and Validation
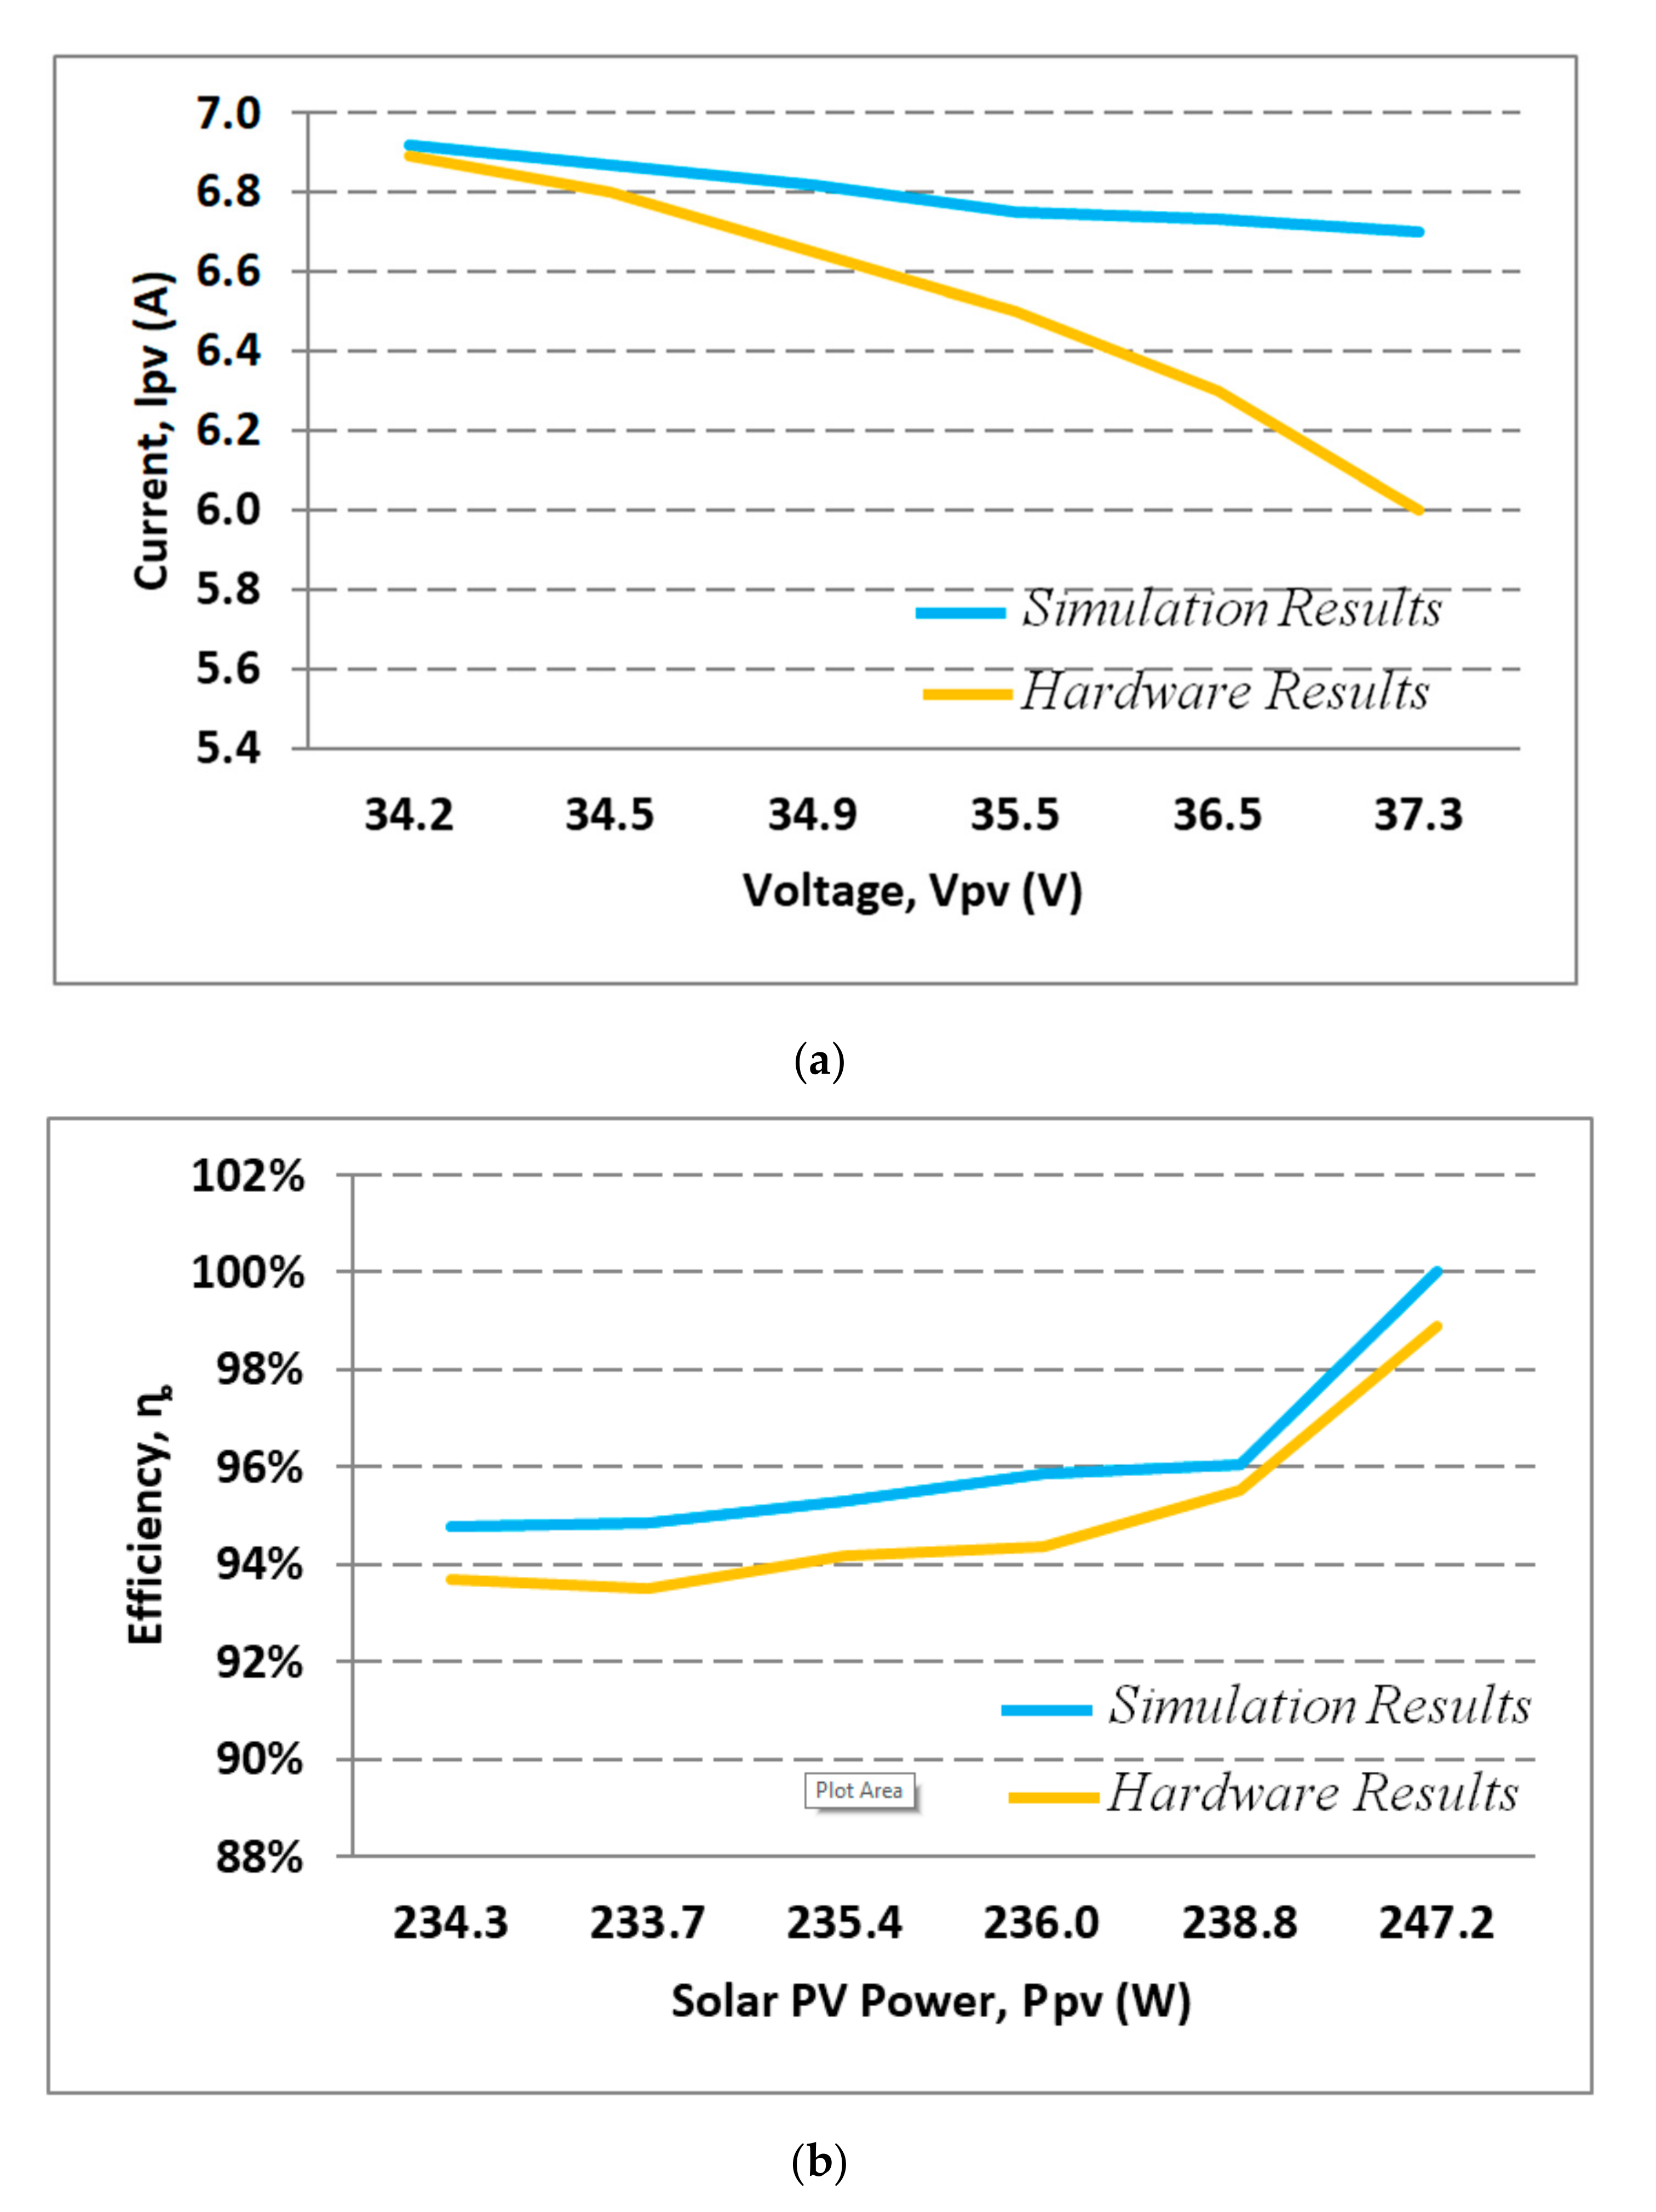
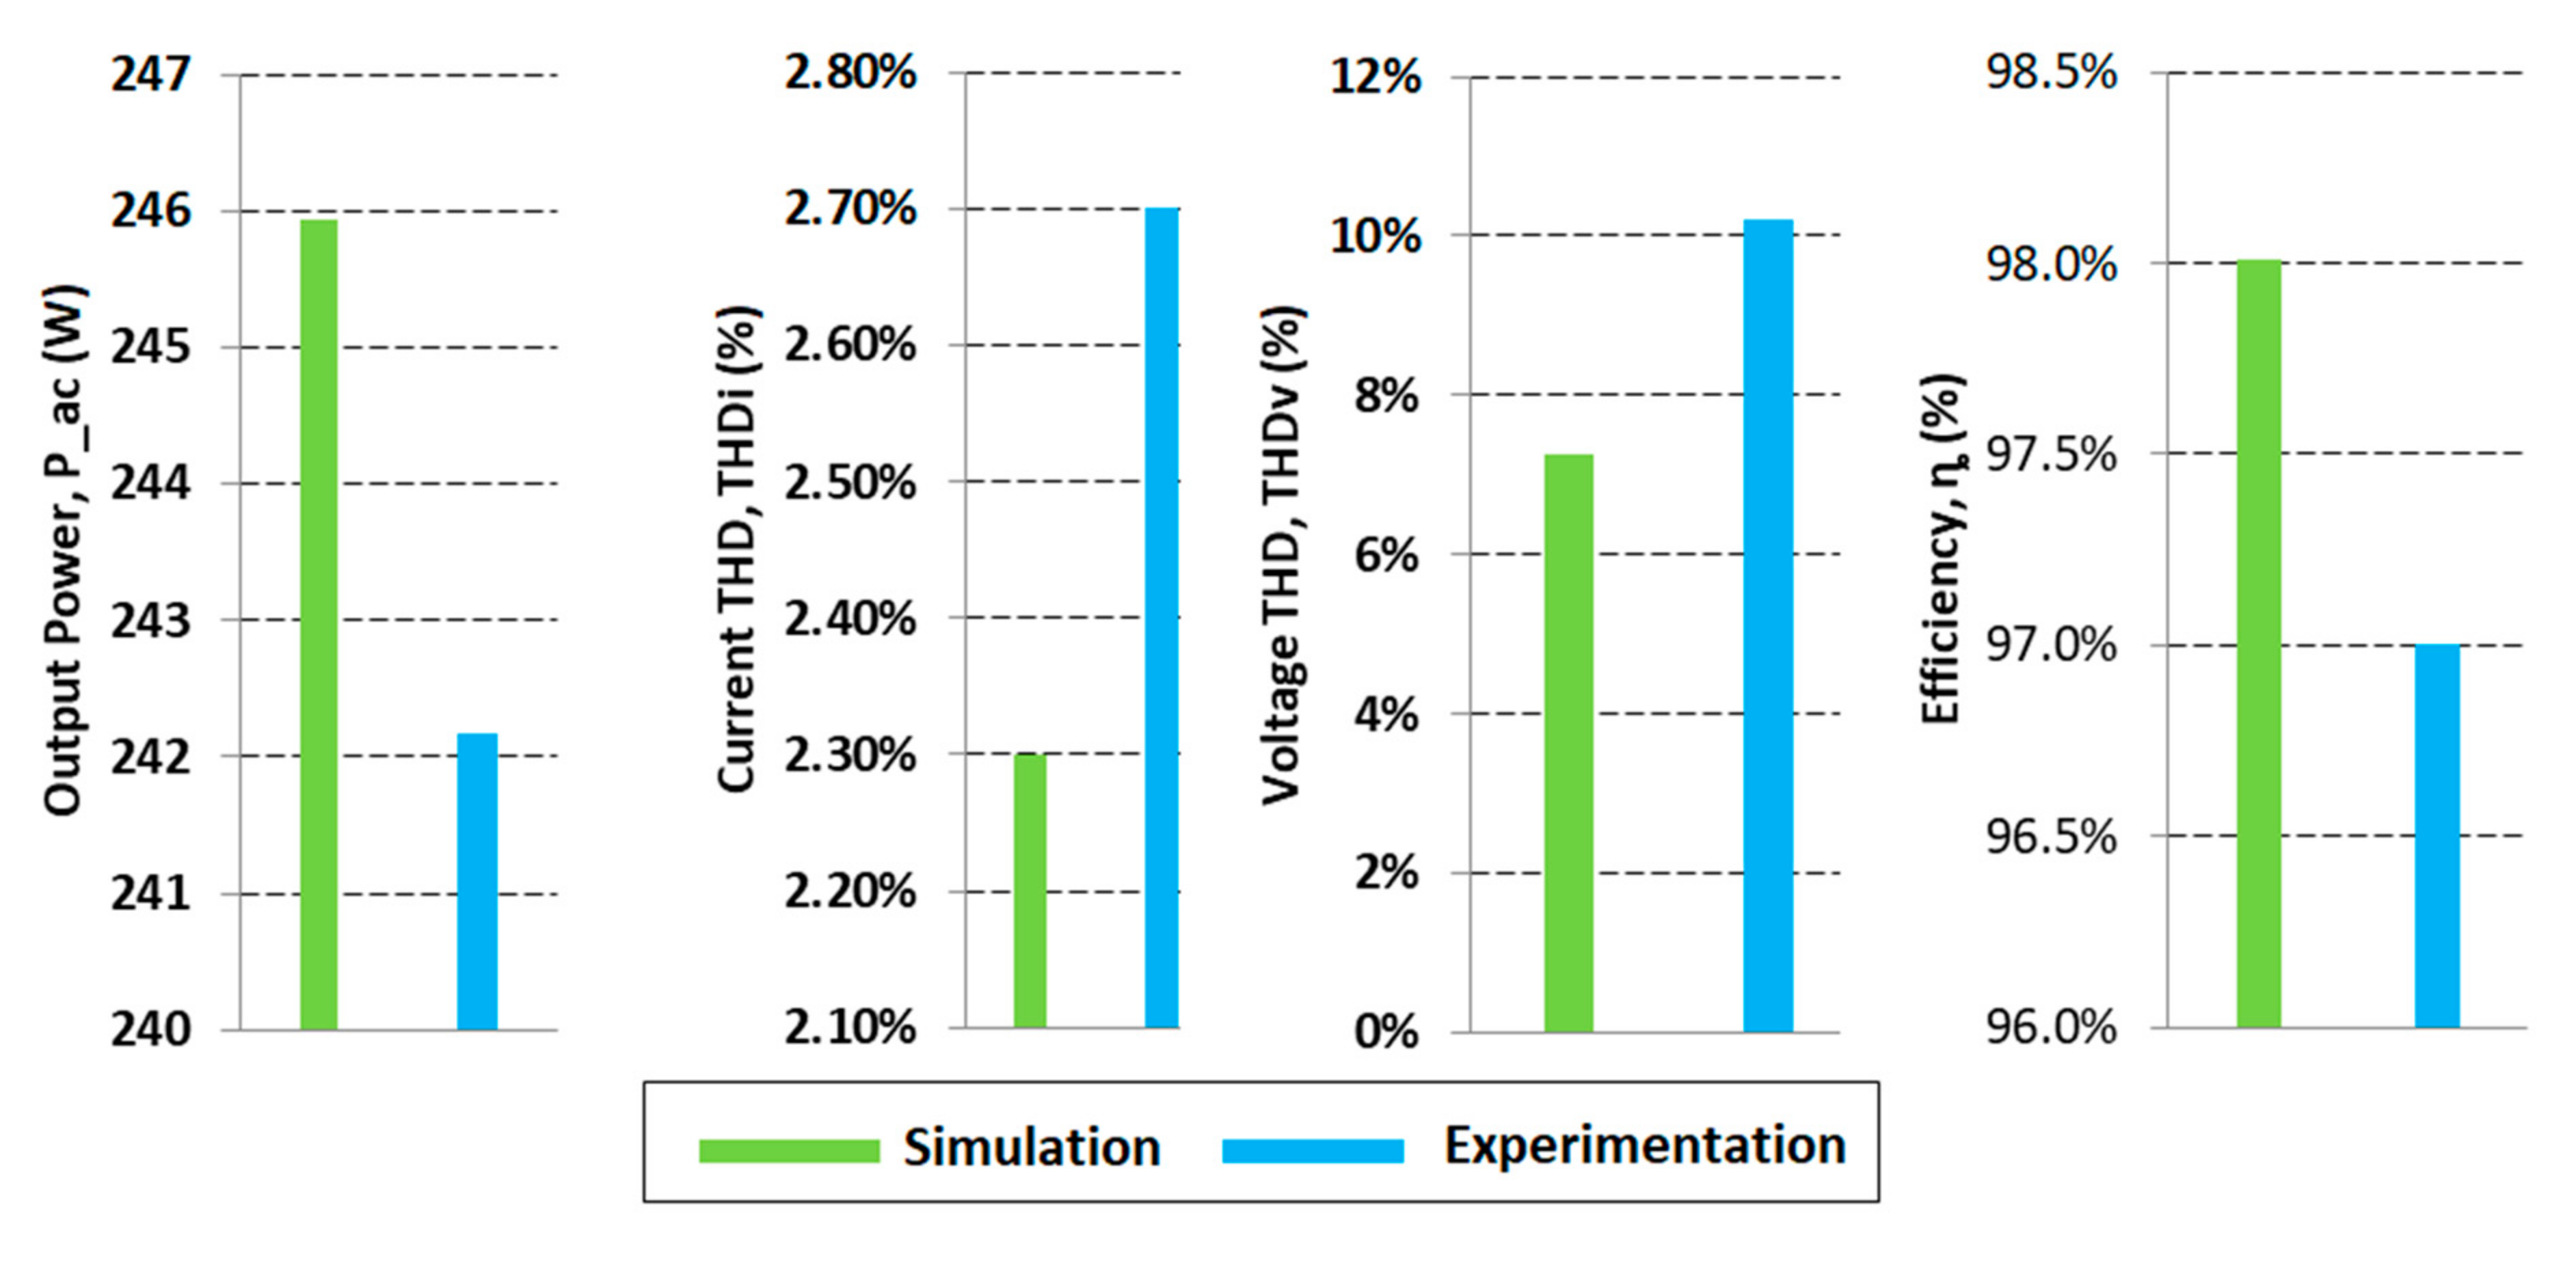
4.1. System Validation
4.2. Comparison with the Existing Technique
5. Conclusions
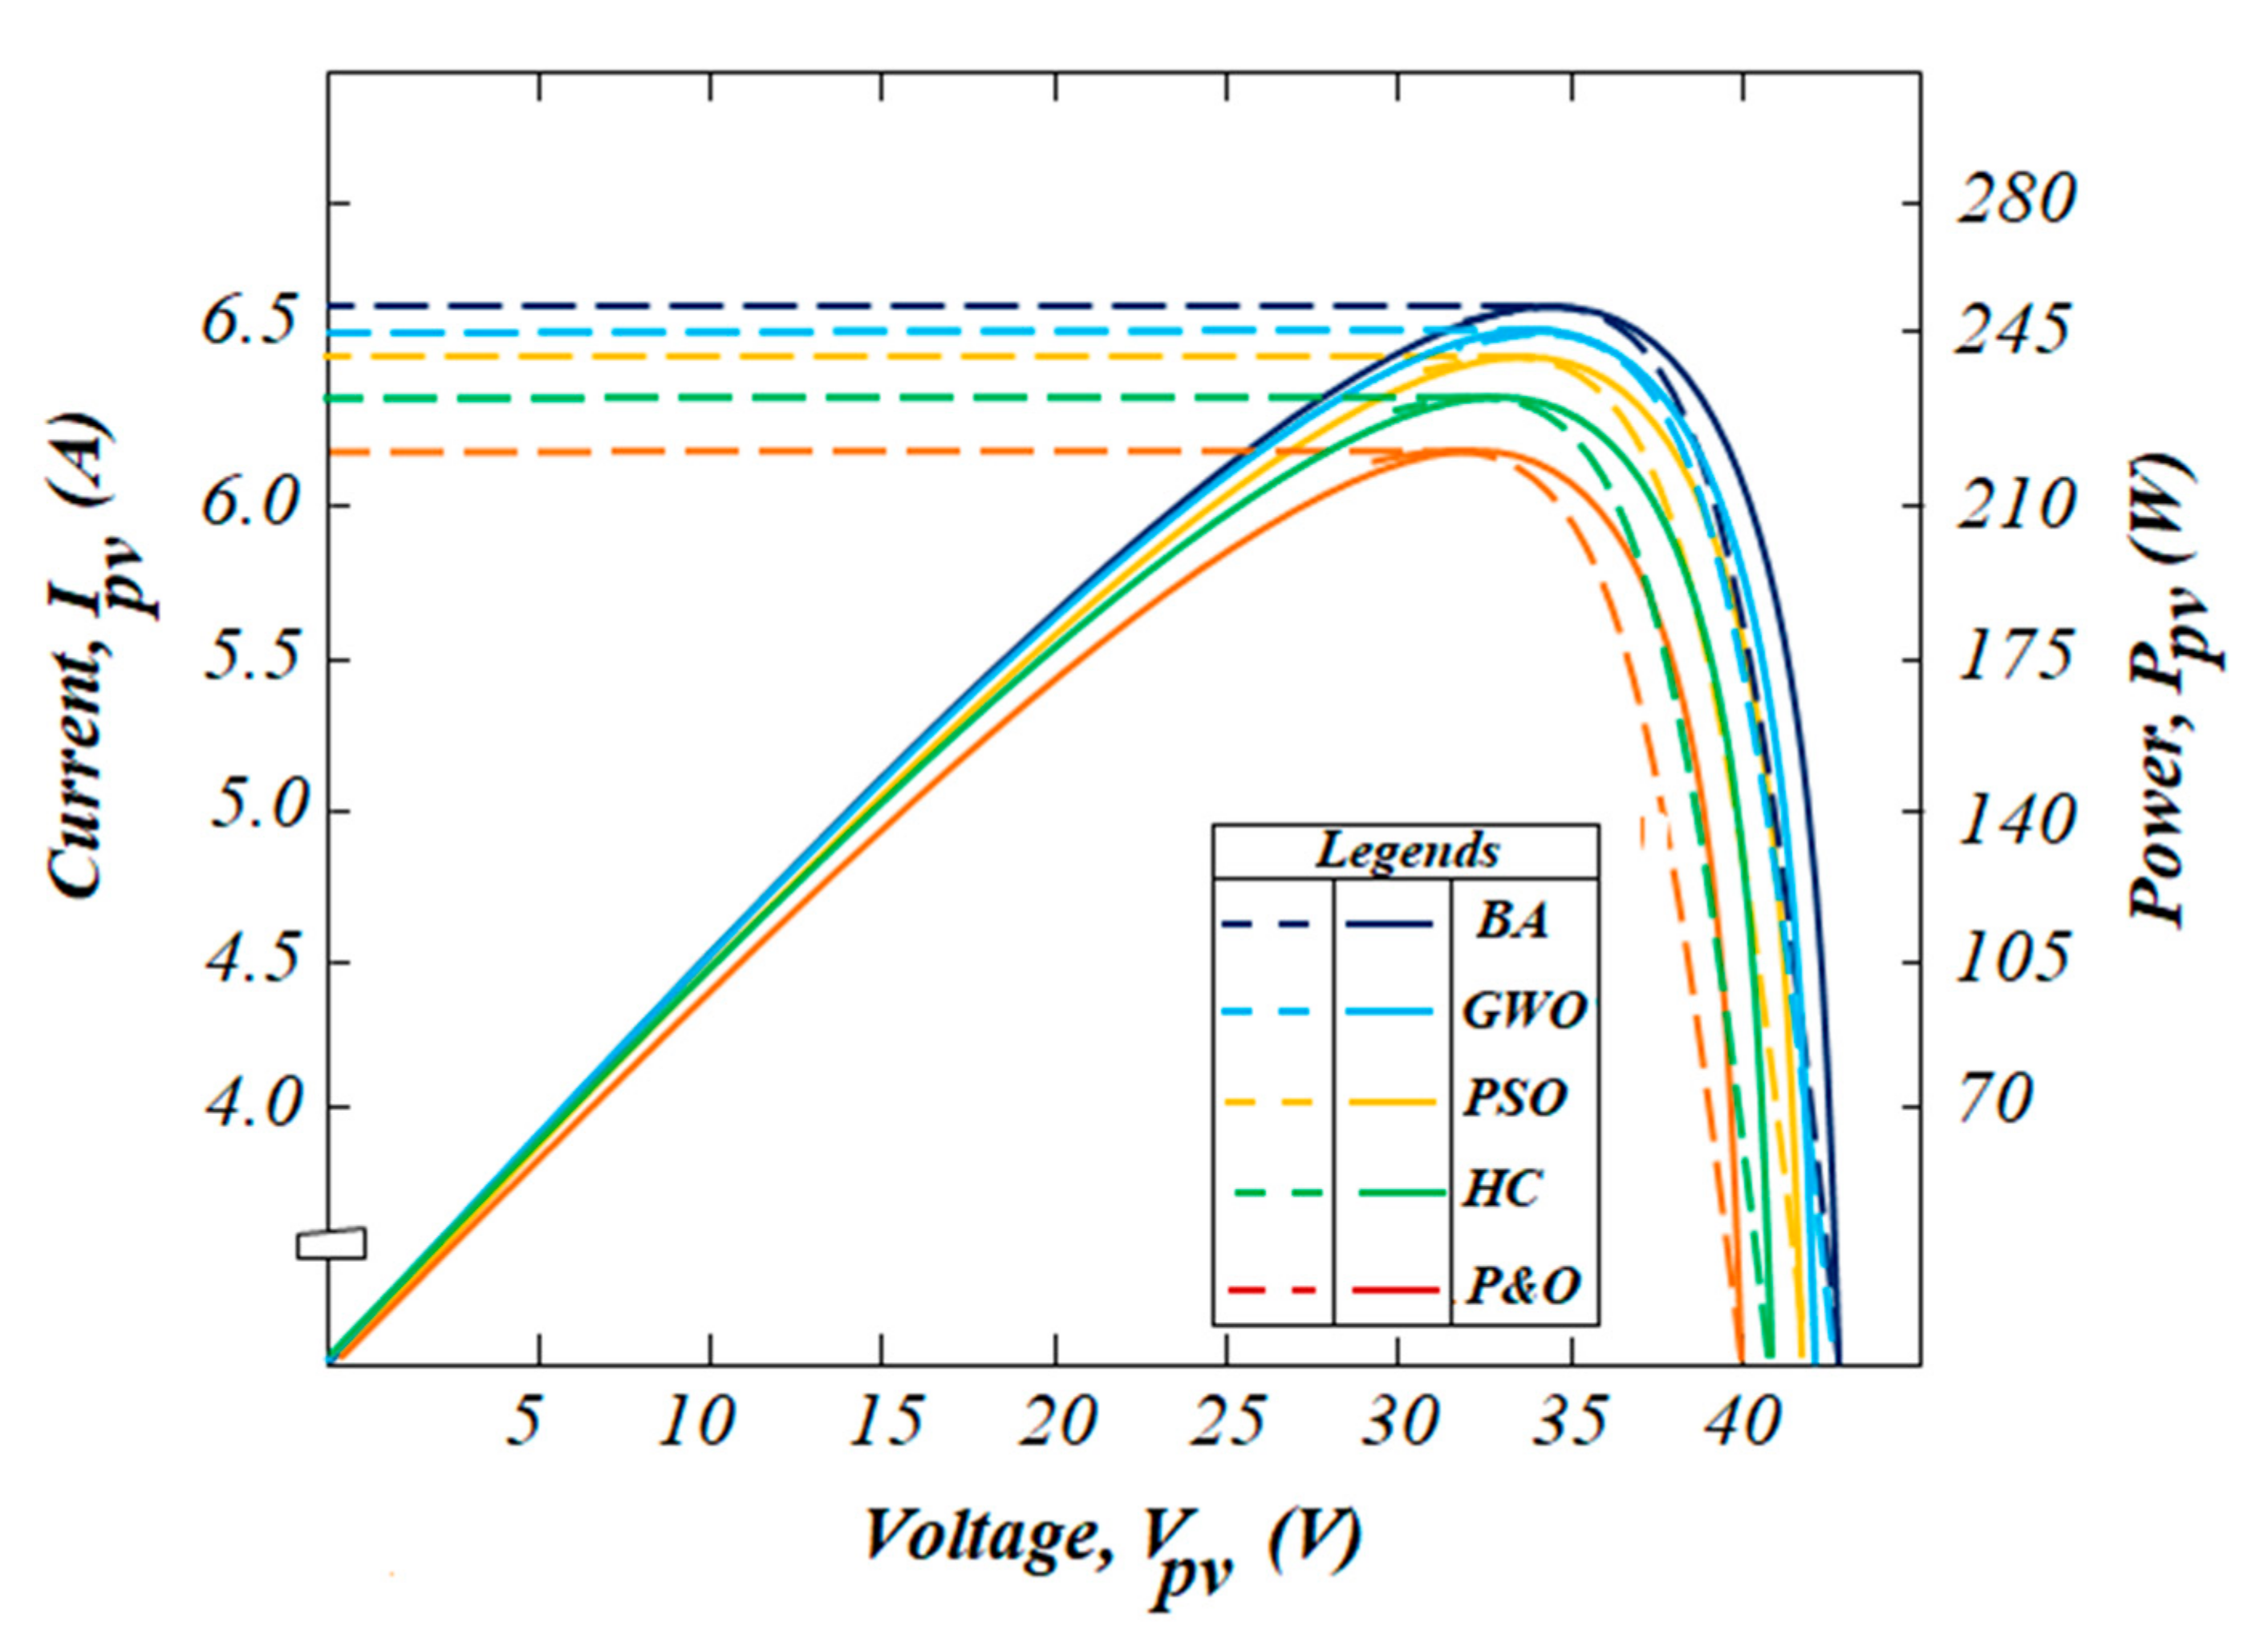
- The proposed algorithm extracted the power from the PV panel (250 W) effectively when compared with other existing techniques and attained an efficiency of about 98.8% owing to its extensive local search during the MPPT process.
- The SHGqBI can eliminate the additional dc-link components that enhances the compactness of the design and increases the efficiency by about 97%.
- The proposed inverter attained a reduced current and voltage THD percentile owing to its embedded version of the converter and inverter.
- The simulated results of the proposed scheme were validated with an experimental study that shows a closer mark with the least deviation.
- The overall performance of the system displayed significant outcomes, notably efficiency, and it can be incorporated with a standalone system effectually.
Author Contributions
Funding
Institutional Review Board Statement
Informed Consent Statement
Data Availability Statement
Conflicts of Interest
Abbreviations
| ABC | Artificial bee colony |
| ACO-P&O | Ant colony optimization and P&O |
| BA | Bat algorithm |
| BBI | Buck-boost inverter |
| CS | Cuckoo search |
| DBI | Differential boost inverter |
| DE | Differential evolution |
| DSO | Digital storage oscilloscope |
| EA-P&O | Enhanced adaptive P&O |
| FFT | Fast Fourier transform |
| FIR | Finite impulse response |
| GMPP | Global maximum power point |
| GMPPT | Global maximum power point tracking |
| GWO | Grey wolf optimizer |
| HC | Hill-climbing |
| HD | Harmonic distortions |
| I–V | Current–voltage |
| IDBI | Improved differential boost inverter |
| IPSO MBOA | Improved PSO Modified butterfly optimization algorithm |
| MHDC PLL | Multi-harmonic decoupling cell phase-locked loop |
| MIC | Modified incremental conductance |
| MPPT | Maximum power point tracking |
| P&O | Perturb and observe |
| PSC | Partial shading conditions |
| PSO | Particle swarm optimization |
| PV | Photovoltaic |
| P–V | Power–voltage |
| PWM | Pulse width modulation |
| qSBI | Quasi switched boost inverter |
| qZS | Quasi Z source |
| QZSI | Quasi Z-source inverter |
| REDG | Renewable energy distributed generation |
| RES | Renewable energy systems |
| RMS | Root mean square |
| SC | Switched capacitance |
| SCII | Switched-coupled inductor inverter |
| SHGqBI | Simplified high gain quasi–boost inverter |
| SIDBI-T1 | Split-inductor differential boost inverters type-I |
| SIDBI-T2 | Split-inductor differential boost inverters type-II |
| SL | Switched inductance |
| SPV | Solar photovoltaic |
| SSI | Split-source inverter |
| THD | Total harmonic distortion |
| ZCS | Zero current switching |
| ZSC | Impedance source converter |
| ZVS | Zero voltage switching |
References
- Krishnamoorthy, R.; Udhayakumar, K.; Raju, K.; Madurai Elavarasan, R.; Mihet-Popa, L. An Assessment of Onshore and Offshore Wind Energy Potential in India Using Moth Flame Optimization. Energies 2020, 13, 3063. [Google Scholar] [CrossRef]
- Madurai Elavarasan, R.; Selvamanohar, L.; Raju, K.; Rajan Vijayaraghavan, R.; Subburaj, R.; Nurunnabi, M.; Khan, I.A.; Afridhis, S.; Hariharan, A.; Pugazhendhi, R.; et al. A Holistic Review of the Present and Future Drivers of the Renewable Energy Mix in Maharashtra, State of India. Sustainability 2020, 12, 6596. [Google Scholar] [CrossRef]
- Ahmed, J.; Salam, Z. An Enhanced Adaptive P&O MPPT for Fast and Efficient Tracking Under Varying Environmental Conditions. IEEE Trans. Sustain. Energy 2018, 9, 1487–1496. [Google Scholar]
- Seyedmahmoudian, M.; Rahmani, R.; Mekhilef, S.; Oo, A.M.T.; Stojcevski, A.; Soon, T.K.; Ghandhari, A.S. Simulation and hardware implementation of new maximum power point tracking technique for partially shaded pv system using hybrid depso method. IEEE Trans. Sustain. Energy 2015, 6, 850–862. [Google Scholar] [CrossRef]
- Zhu, W.; Shang, L.; Li, P.; Guo, H. Modified hill climbing MPPT algorithm with reduced steady-state oscillation and improved tracking efficiency. J. Eng. 2018, 2018, 1878–1883. [Google Scholar] [CrossRef]
- Hu, K.; Cao, S.; Li, W.; Zhu, F. An Improved Particle Swarm Optimization Algorithm Suitable for Photovoltaic Power Tracking Under Partial Shading Conditions. IEEE Access 2019, 7, 143217–143232. [Google Scholar] [CrossRef]
- Guo, K.; Cui, L.; Mao, M.; Zhou, L.; Zhang, Q. An Improved Gray Wolf Optimizer MPPT Algorithm for PV System with BFBIC Converter Under Partial Shading. IEEE Access 2020, 8, 103476–103490. [Google Scholar] [CrossRef]
- Kumar, D.S.; Yagli, G.M.; Kashyap, M.; Srinivasan, D. Solar irradiance resource and forecasting: A comprehensive review. IET Renew. Power Gener. 2020, 14, 1641–1656. [Google Scholar] [CrossRef]
- Alsadi, S.Y.; Nassar, Y.F. Estimation of Solar Irradiance on Solar Fields: An Analytical Approach and Experimental Results. IEEE Trans. Sustain. Energy 2017, 8, 1601–1608. [Google Scholar] [CrossRef]
- Bi, Z.; Ma, J.; Wang, K.; Man, K.L.; Smith, J.S.; Yue, Y. Identification of Partial Shading Conditions for Photovoltaic Strings. Emerg. Technol. Energy Internet IEEE Access 2020, 8, 75491–75502. [Google Scholar] [CrossRef]
- Pachauri, R.K.; Mahela, O.P.; Sharma, A.; Bai, J.; Chauhan, Y.K.; Khan, B.; Alhelou, H.H. Impact of Partial Shading on Various PV Array Configurations and Different Modeling Approaches: A Comprehensive Review. IEEE Access. 2020, 8, 181375–181403. [Google Scholar] [CrossRef]
- Ali, A.; Almutairi, K.; Padmanaban, S.; Tirth, V.; Algarni, S.; Irshad, K.; Islam, S.; Zahir, M.H.; Shafiullah, M.; Malik, M.Z. Investigation of MPPT Techniques under Uniform and Non-Uniform Solar Irradiation Condition—A Retrospection. IEEE Access 2017, 8, 127368–127392. [Google Scholar] [CrossRef]
- Eltamaly, A.M.; Al-Saud, M.S.; Abokhalil, A.G. A Novel Bat Algorithm Strategy for Maximum Power Point Tracker of Photovoltaic Energy Systems under Dynamic Partial Shading. IEEE Access 2020, 8, 10048–10060. [Google Scholar] [CrossRef]
- Abbasi Aghdam Meinagh, F.; Yuan, J.; Yang, Y. Analysis and design of a high voltage-gain quasi-Z-source DC–DC converter. IET Power Electron. 2020, 13, 1837–1847. [Google Scholar] [CrossRef]
- Takiguchi, T.; Koizumi, H. Quasi-Z-Source dc-dc Converter with Voltage-Lift Technique; IECON: Vienna, Austria, 2013; pp. 1191–1196. [Google Scholar]
- Chen, Z.; Chen, Y.; Jiang, C.; Zhang, B.; Qiu, D. A Quasi-Z Source Network with Multiple Switch-Inductor Cells and Cockroft-Walton Voltage Multipliers; IECON: Beijing, China, 2017; pp. 8009–8014. [Google Scholar]
- Nguyen, M.; Lim, Y.; Cho, G. Switched-inductor quasi-Z-source inverter. IEEE Trans. Power Electron. 2011, 26, 3183–3191. [Google Scholar] [CrossRef]
- Raveendran, A.; Paul, E.; Ommen, A.P. Quasi-Z-source dc-dc converter with switched capacitor. Int. J. Eng. Res. Gen. Sci. 2015, 3, 1132–1137. [Google Scholar]
- Liu, J.; Wu, J.; Qiu, J.; Zeng, J. Switched Z-Source/Quasi-Z-Source DC-DC Converters with Reduced Passive Components for Photovoltaic Systems. IEEE Access 2019, 7, 40893–40903. [Google Scholar] [CrossRef]
- Zeng, J.; Ning, J.; Du, X.; Kim, T.; Yang, Z.; Winstead, V. A four–port DC-DC Converter for Stand Alone Wind and Solar Energy Systems. IEEE Trans. Ind. Appl. 2020, 56, 446–454. [Google Scholar]
- Zeng, J.; Ning, J.; Du, X.; Kim, T.; Yang, Z.; Winstead, V. High-Performance Quasi-Z-Source Series Resonant DC-DC Converter for Photovoltaic Module Level Power Electronics Applications. Trans. Power Electron. IEEE Trans. Power Electron. 2017, 32, 3634–3650. [Google Scholar]
- Levron, Y.; Canaday, S.; Erickson, R.W. Bus Voltage Control with Zero Distortion and High Bandwidth for Single Phase Solar Inverters. IEEE Trans. Power Electron. 2016, 31, 258–269. [Google Scholar] [CrossRef]
- Gonzalez, R.; Lopez, J.; Sanchis, P.; Marroyo, L. Transformerless Inverter for Single-Phase Photovoltaic Systems. IEEE Trans. Power Electron. 2007, 22, 693–697. [Google Scholar] [CrossRef]
- Levron, Y.; Erickson, R.W. High Weighted Efficiency in Single-Phase Solar Inverters by a Variable-Frequency Peak Current Controller. IEEE Trans. Power Electron. 2016, 31, 248–257. [Google Scholar] [CrossRef]
- Hadjidemetriou, L.; Yang, Y.; Kyriakides, E.; Blaabjerg, F. A Synchronization Scheme for Single-Phase Grid-Tied Inverters under Harmonic Distortion and Grid Disturbances. IEEE Trans. Power Electron. 2017, 32, 2784–2793. [Google Scholar] [CrossRef]
- Ishaque, K.; Salam, Z.; Taheri, H. Simple, fast and accurate two-diode model for photovoltaic modules. Solar Energy Mater. Solar Cells 2011, 95, 586–594. [Google Scholar] [CrossRef]
- Khan, A.A.; Cha, H. Dual-buck-structured high-reliability and efficiency single-stage buck-boost inverters. IEEE Trans. Ind. Electron. 2018, 65, 3176–3187. [Google Scholar] [CrossRef]
- Caceres, R.O.; Barbi, I. A boost dc-ac converter: Analysis, design, and experimentation. IEEE Trans. Power Electron. 1999, 14, 134–141. [Google Scholar] [CrossRef]
- Tang, Y.; Bai, Y.; Kan, J.; Xu, F. Improved dual boost inverter with half cycle modulation. IEEE Trans. Power Electron. 2017, 32, 7543–7552. [Google Scholar] [CrossRef]
- Kim, K.; Cha, H.; Kim, H.-G. A new single-phase switched-coupled inductor DC-AC inverter for photovoltaic systems. IEEE Trans. Power Electron. 2017, 32, 5016–5022. [Google Scholar] [CrossRef]
- Anderson, J.; Peng, F.Z. Four quasi-Z-source inverters. In Proceedings of the 2008 IEEE Power Electronics Specialists Conference, Rhodes, Greece, 15–19 June 2008; pp. 2743–2749. [Google Scholar]
- Nguyen, M.-K.; Lim, Y.-C.; Park, S.-J. A comparison between singlephase quasi-Z-source and quasi-switched boost inverters. IEEE Trans. Ind. Electron. 2015, 62, 6336–6344. [Google Scholar] [CrossRef]
- Abdelhakim, A.; Mattavelli, P.; Davari, P.; Blaabjerg, F. Performance Evaluation of the Single-Phase Split-Source Inverter Using an Alternative DC-AC Configuration. IEEE Trans. Ind. Electron. 2018, 65, 363–373. [Google Scholar] [CrossRef]
- Khan, A.A.; Lu, Y.W.; Eberle, W.; Wang, L.; Khan, U.A.; Cha, H. Single-Phase Split-Inductor Differential Boost Inverters. IEEE Trans. Power Electron. 2020, 35, 107–120. [Google Scholar] [CrossRef]
- Shams, I.; Mekhilef, S.; Tey, K.S. Maximum Power Point Tracking Using Modified Butterfly Optimization Algorithm for Partial Shading, Uniform Shading, and Fast Varying Load Conditions. IEEE Trans. Power Electron. 2021, 36, 5569–5581. [Google Scholar] [CrossRef]


| Parameters | Value | Units |
|---|---|---|
| Isolation | 1000 | W/m2 |
| Temperature | 32 | °C |
| No. of parallel cells | 2 | Nos |
| No. of series cells | 216 | Nos |
| Output power | 250 | Watts |
| Open circuit voltage | 43.0 | Volts |
| Short circuit current | 6.70 | Ampere |
| Parameters | Symbols | Values |
|---|---|---|
| Leakage inductance | Llk | 570 mH |
| Capacitance | C1 & C2 | 10 µF |
| Converter switching frequency | fs | 500 Hz |
| Duty cycle | 0.65 | |
| Inverter fundamental frequency | finv-0 | 50 Hz |
| Inverter switching frequency | finv-s | 20 kHz |
| Voltage (Vpv) in Volts | Current (Ipv) in Ampere | Power (Ppv) in Watts |
|---|---|---|
| 0 | 7.68 | 0.00 |
| 10 | 7.50 | 75.00 |
| 15 | 7.50 | 112.50 |
| 20 | 7.40 | 148.00 |
| 25 | 7.30 | 182.50 |
| 30 | 7.30 | 219.00 |
| 32 | 7.20 | 230.40 |
| 35 | 7.05 | 246.75 |
| 38 | 6.57 | 249.66 |
| 40 | 6.12 | 244.80 |
| 41 | 3.80 | 155.80 |
| 42 | 0 | 0.00 |
| Component | Parameters | Simulation Results | Experimental Results | Relative Differences |
|---|---|---|---|---|
| PV | 43.00 | 42.98 | 0.02 | |
| 7.50 | 7.68 | −0.18 | ||
| 37.31 | 38.00 | −0.69 | ||
| 6.70 | 6.57 | 0.13 | ||
| 250.00 | 249.66 | 0.34 | ||
| ȵpv (%) | 100 | 98.88 | 1.12 | |
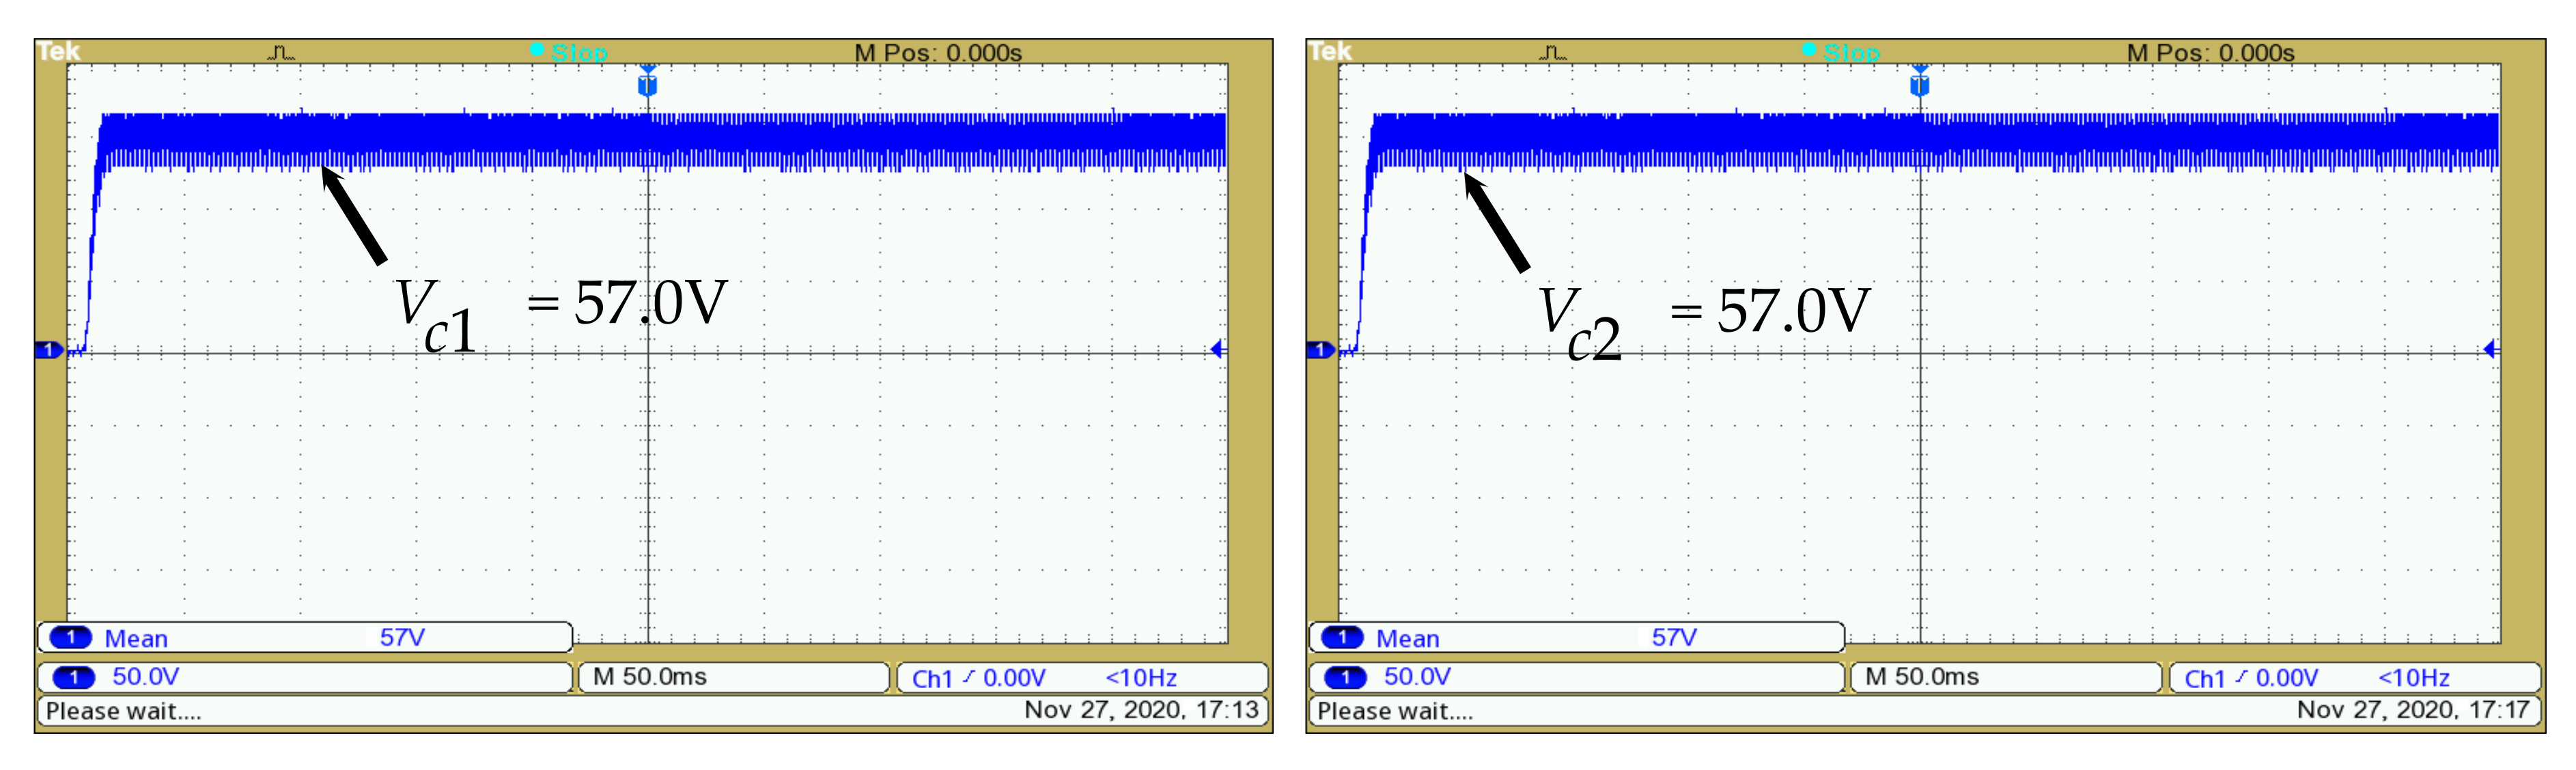
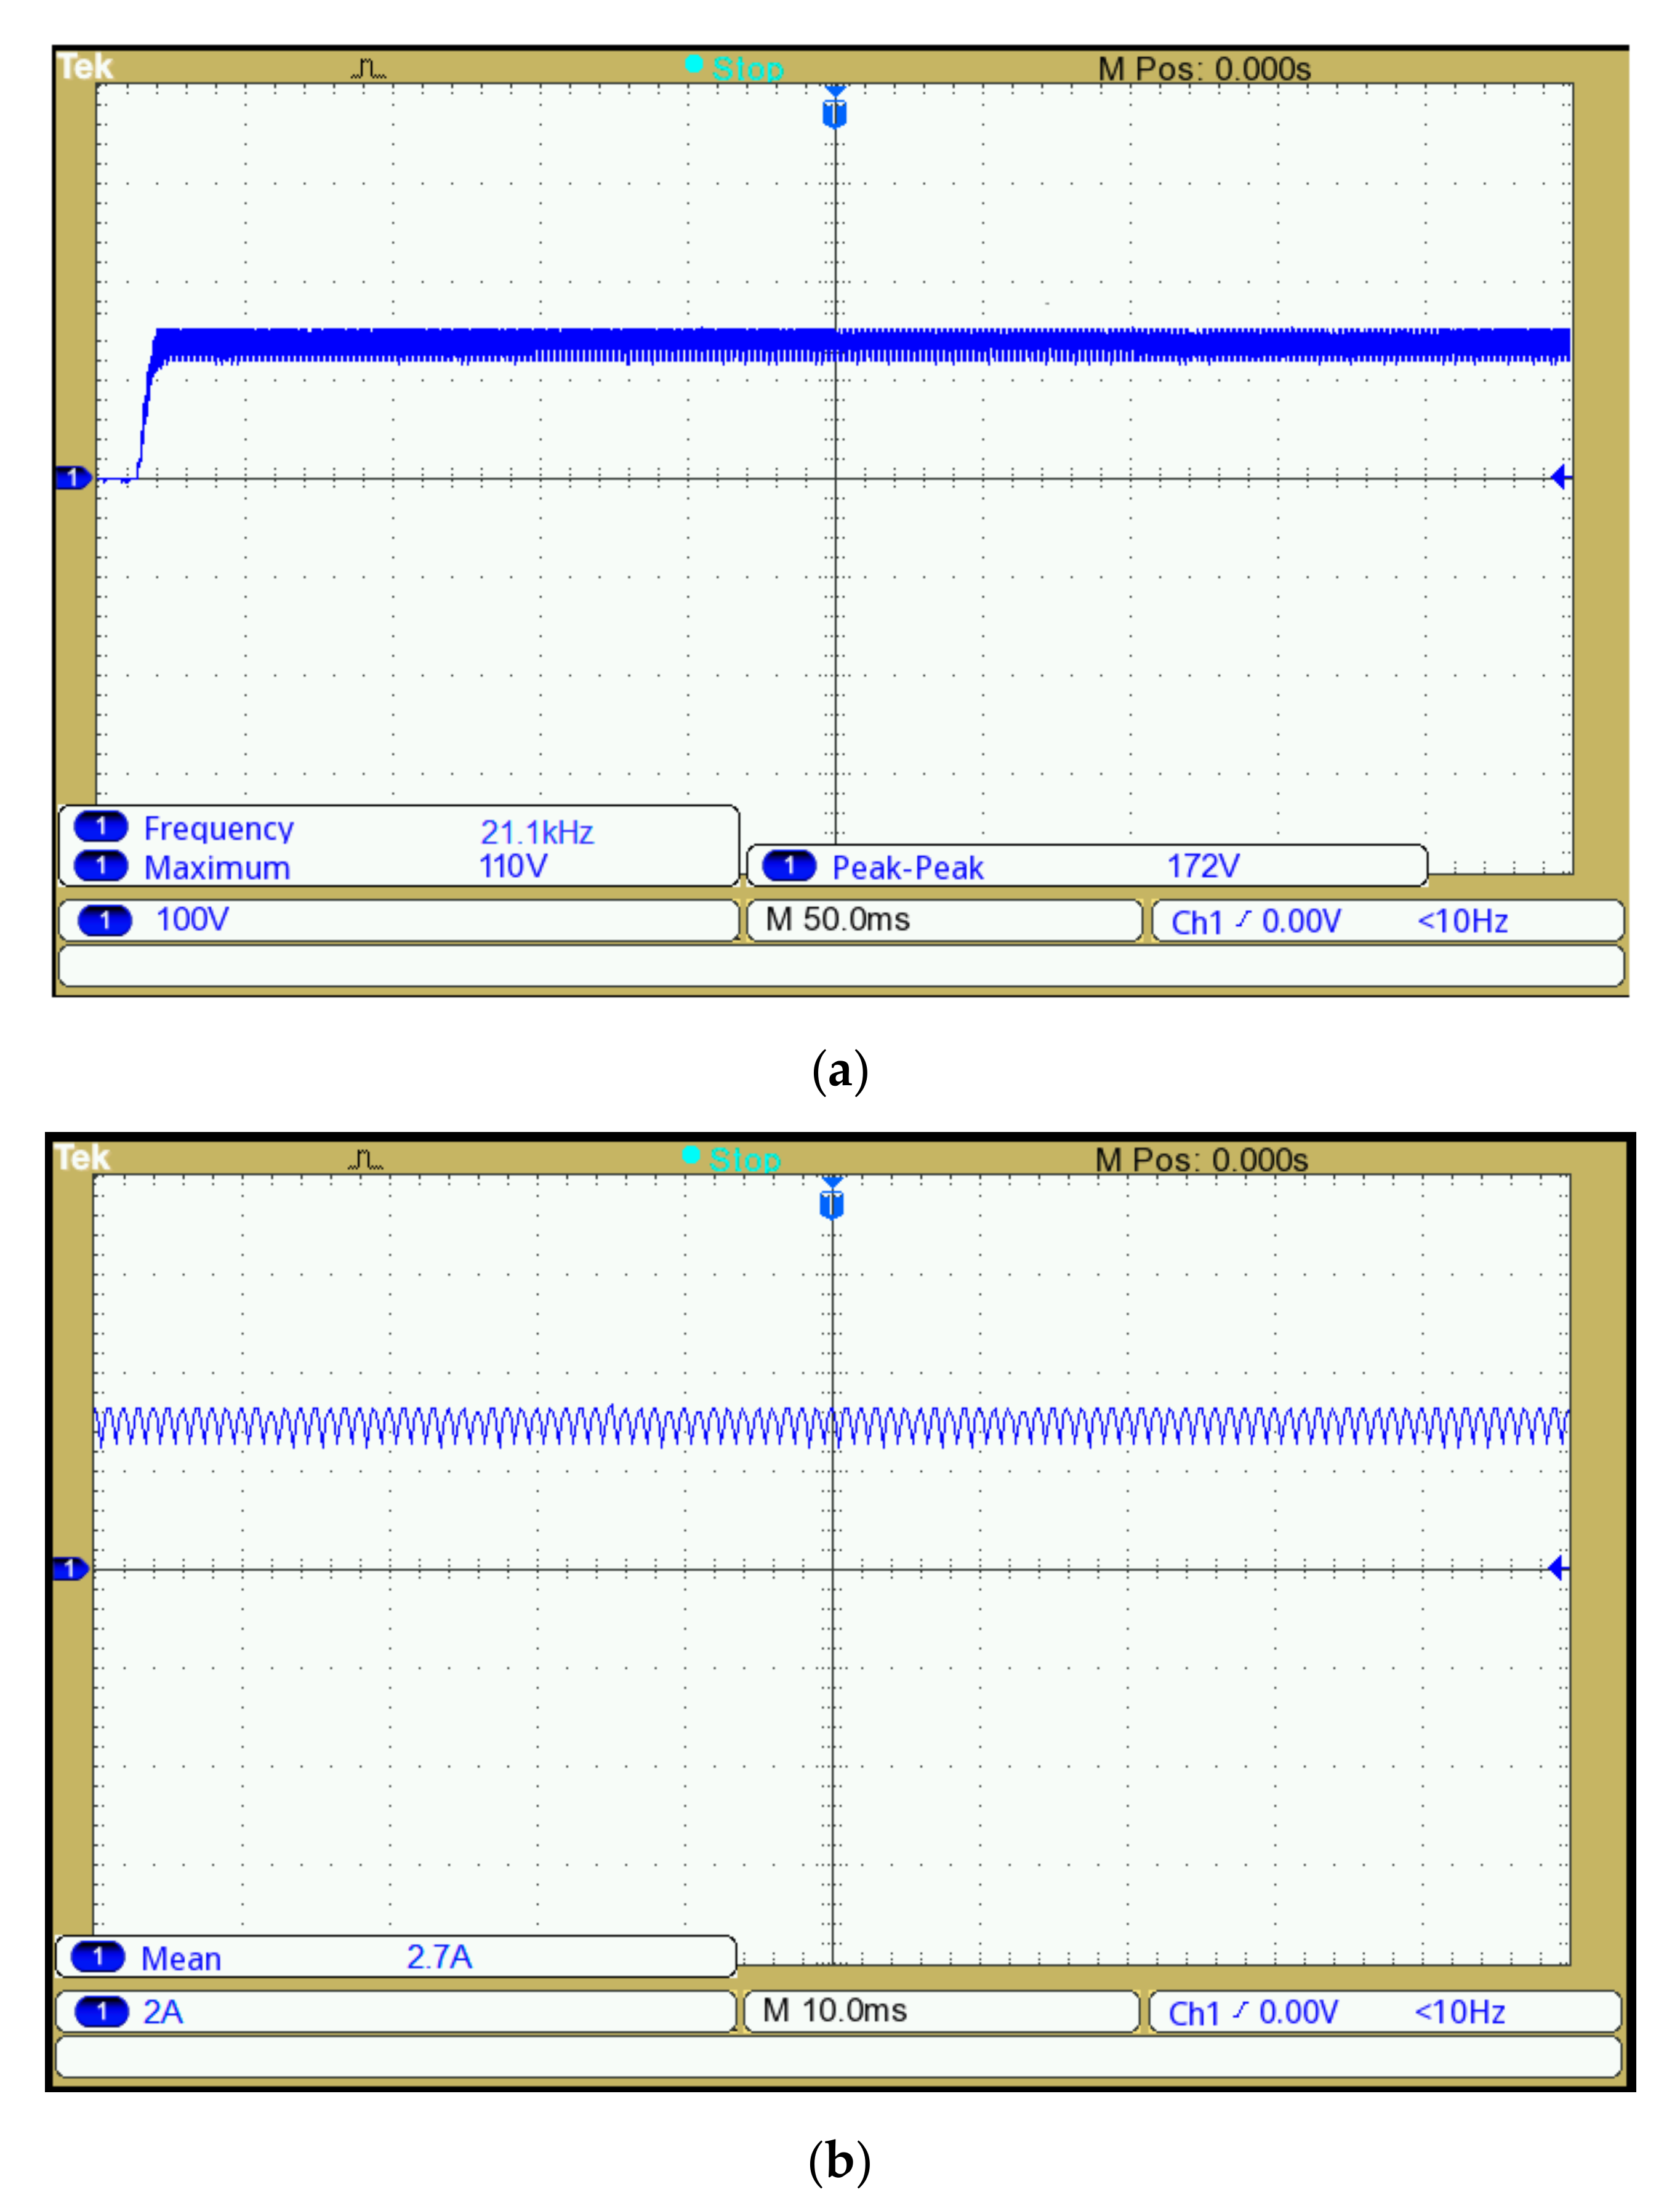
| SHGqBI | 49.60 | 57.00 | −7.4 | |
| 80.80 | 110.10 | −29.3 | ||
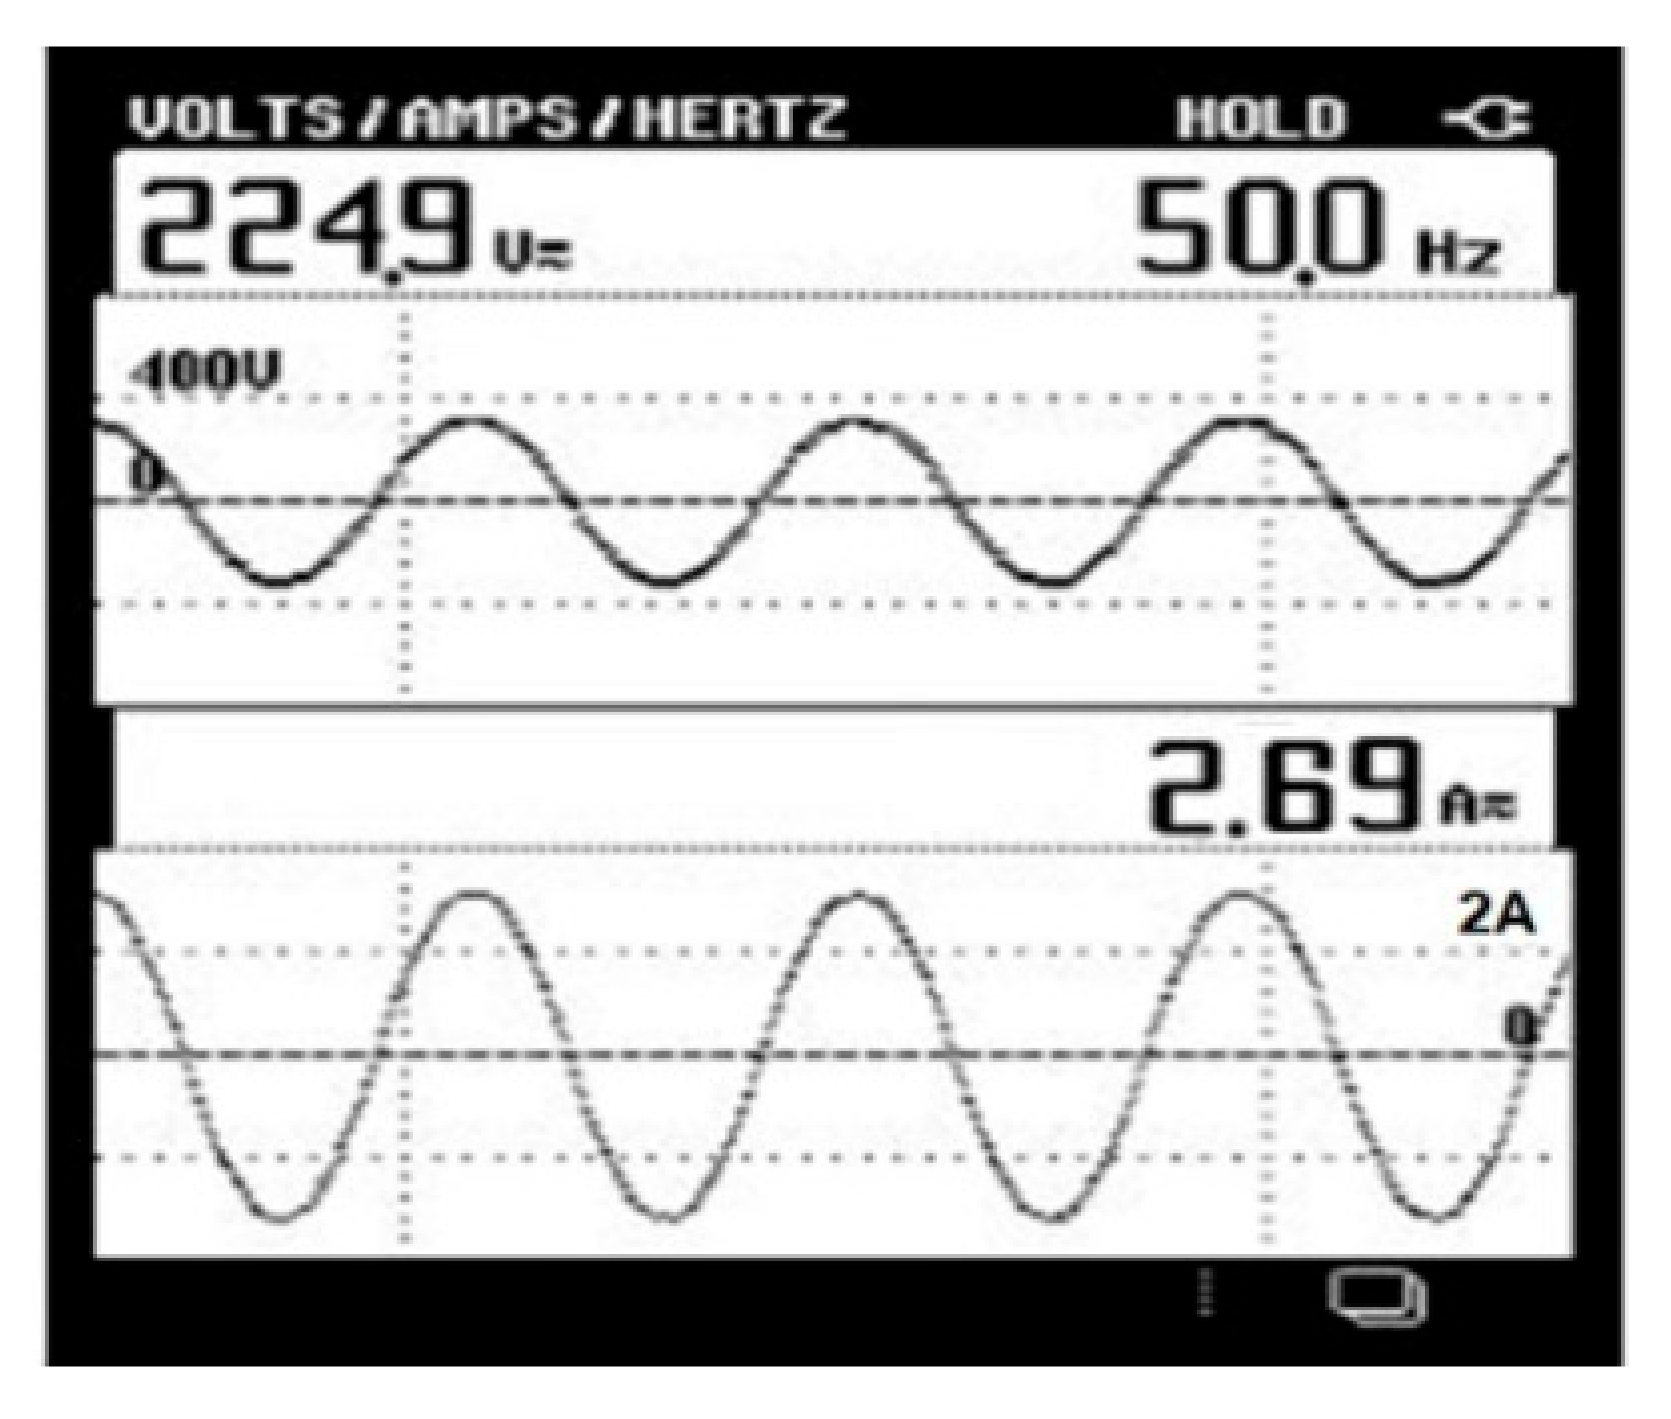
| (V) | 230 | 224.90 | 5.1 | |
| 2.74 | 2.69 | 0.05 | ||
| 1.93 | 1.90 | 0.03 | ||
| 245.94 | 242.17 | 3.77 | ||
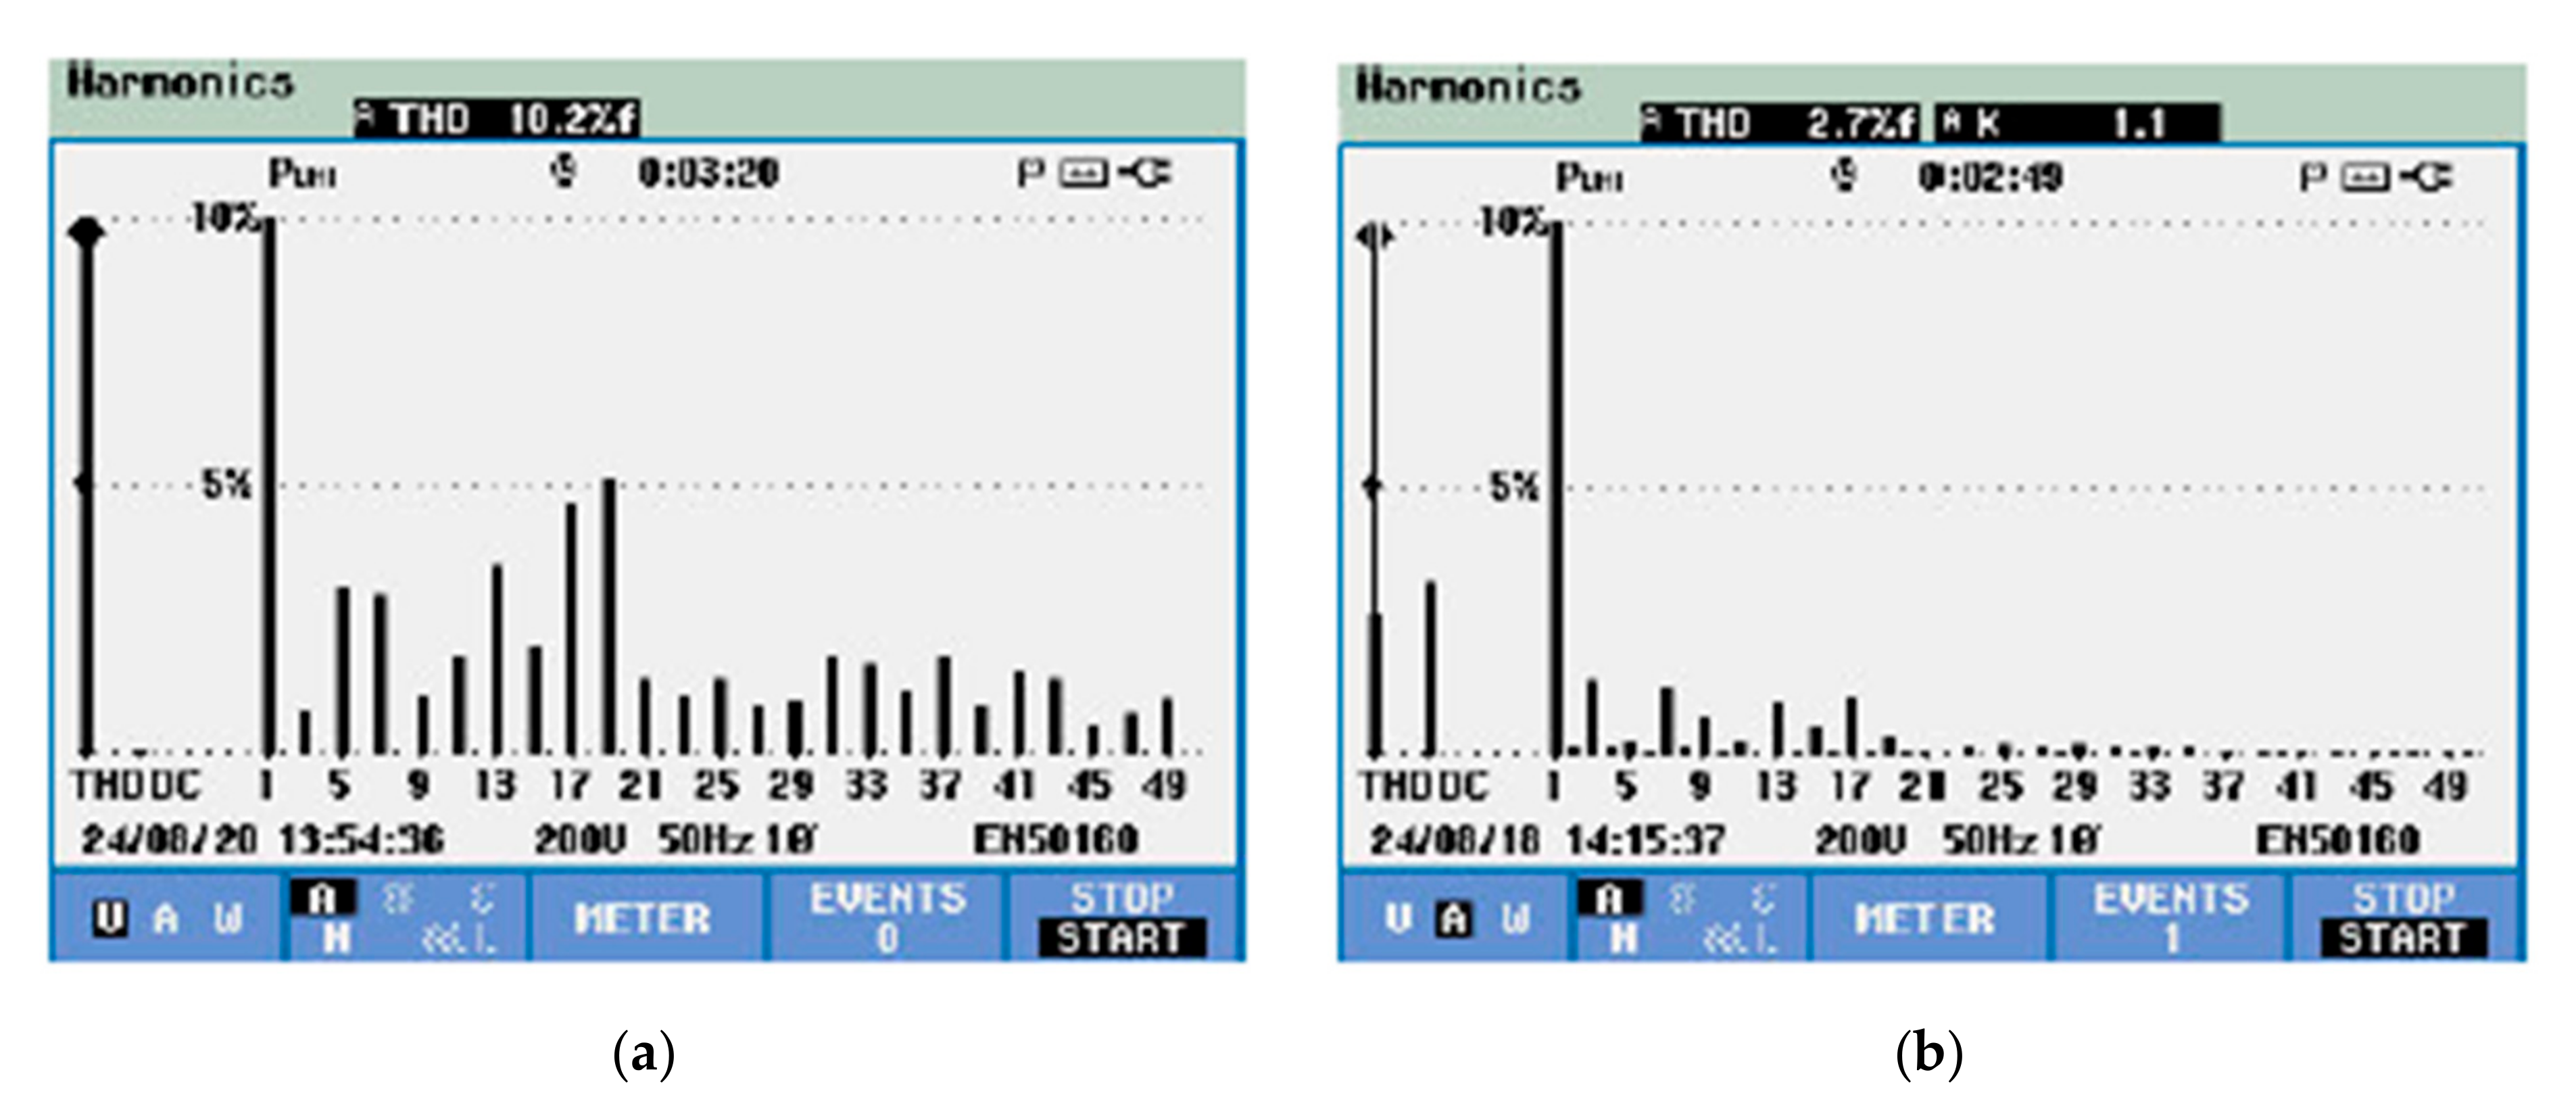
| (%) | 2.30 | 2.70 | −0.4 | |
| (%) | 7.26 | 10.20 | −2.94 | |
| ȵi (%) | 98.30 | 97.00 | 1.38 |
| Ref No. | Configuration | Efficiency (%) |
|---|---|---|
| [27] | BBI | 96.10 |
| [28] | DBI | 83.33 |
| [29] | IDBI | 92.60 |
| [30] | SCII | 90.50 |
| [31,32] | QZSI | 90.20 |
| [33] | SSI | 95.50 |
| [34] | SIDBI-T1 | 96.50 |
| [34] | SIDBI-T2 | 97.00 |
| Proposed method | SHGqBI | 98.30 |
Publisher’s Note: MDPI stays neutral with regard to jurisdictional claims in published maps and institutional affiliations. |
© 2021 by the authors. Licensee MDPI, Basel, Switzerland. This article is an open access article distributed under the terms and conditions of the Creative Commons Attribution (CC BY) license (http://creativecommons.org/licenses/by/4.0/).
Share and Cite
Rajalakshmi, M.; Chandramohan, S.; Kannadasan, R.; Alsharif, M.H.; Kim, M.-K.; Nebhen, J. Design and Validation of BAT Algorithm-Based Photovoltaic System Using Simplified High Gain Quasi Boost Inverter. Energies 2021, 14, 1086. https://doi.org/10.3390/en14041086
Rajalakshmi M, Chandramohan S, Kannadasan R, Alsharif MH, Kim M-K, Nebhen J. Design and Validation of BAT Algorithm-Based Photovoltaic System Using Simplified High Gain Quasi Boost Inverter. Energies. 2021; 14(4):1086. https://doi.org/10.3390/en14041086
Chicago/Turabian StyleRajalakshmi, Mani, Sankaralingam Chandramohan, Raju Kannadasan, Mohammed H. Alsharif, Mun-Kyeom Kim, and Jamel Nebhen. 2021. "Design and Validation of BAT Algorithm-Based Photovoltaic System Using Simplified High Gain Quasi Boost Inverter" Energies 14, no. 4: 1086. https://doi.org/10.3390/en14041086
APA StyleRajalakshmi, M., Chandramohan, S., Kannadasan, R., Alsharif, M. H., Kim, M.-K., & Nebhen, J. (2021). Design and Validation of BAT Algorithm-Based Photovoltaic System Using Simplified High Gain Quasi Boost Inverter. Energies, 14(4), 1086. https://doi.org/10.3390/en14041086