
Comparison between Concentrated Solar Power and Gas-Based Generation in Terms of Economic and Flexibility-Related Aspects in Chile


Abstract
:
1. Introduction

| Technology Type | Installed Capacity (MW) | Generated Energy 2019 (GWh) |
|---|---|---|
| Hydroelectric Dam | 3421.53 | 9199.12 |
| 14.20% | 12.0% | |
| Run-of-river hydropower | 3301.00 | 11,631.07 |
| 13.7% | 15.1% | |
| Solar Photovoltaic | 2750.41 | 6382.91 |
| 11.4% | 8.3% | |
| Wind | 1792.08 | 4818.10 |
| 7.4% | 6.3% | |
| Biomass | 501.41 | 1822.46 |
| 2.1% | 2.4% | |
| Geothermal | 39.70 | 201.64 |
| 0.2% | 0.3% | |
| Total Renewable | 11,806.13 | 33,841.79 |
| 48.9% | 43.3% | |
| Coal | 4774.94 | 28,390.26 |
| 19.8% | 36.9% | |
| Natural Gas | 4381.53 | 14,130.97 |
| 18.2% | 18.4% | |
| Diesel Oil | 3161.61 | 290.73 |
| 13.1% | 0.4% | |
| Total Conventional | 12,318.08 | 42,811.96 |
| 51.1% | 55.7% | |
| Total SEN | 24,124.21 | 76,867.27 |
| 100.0% | 100.0% |
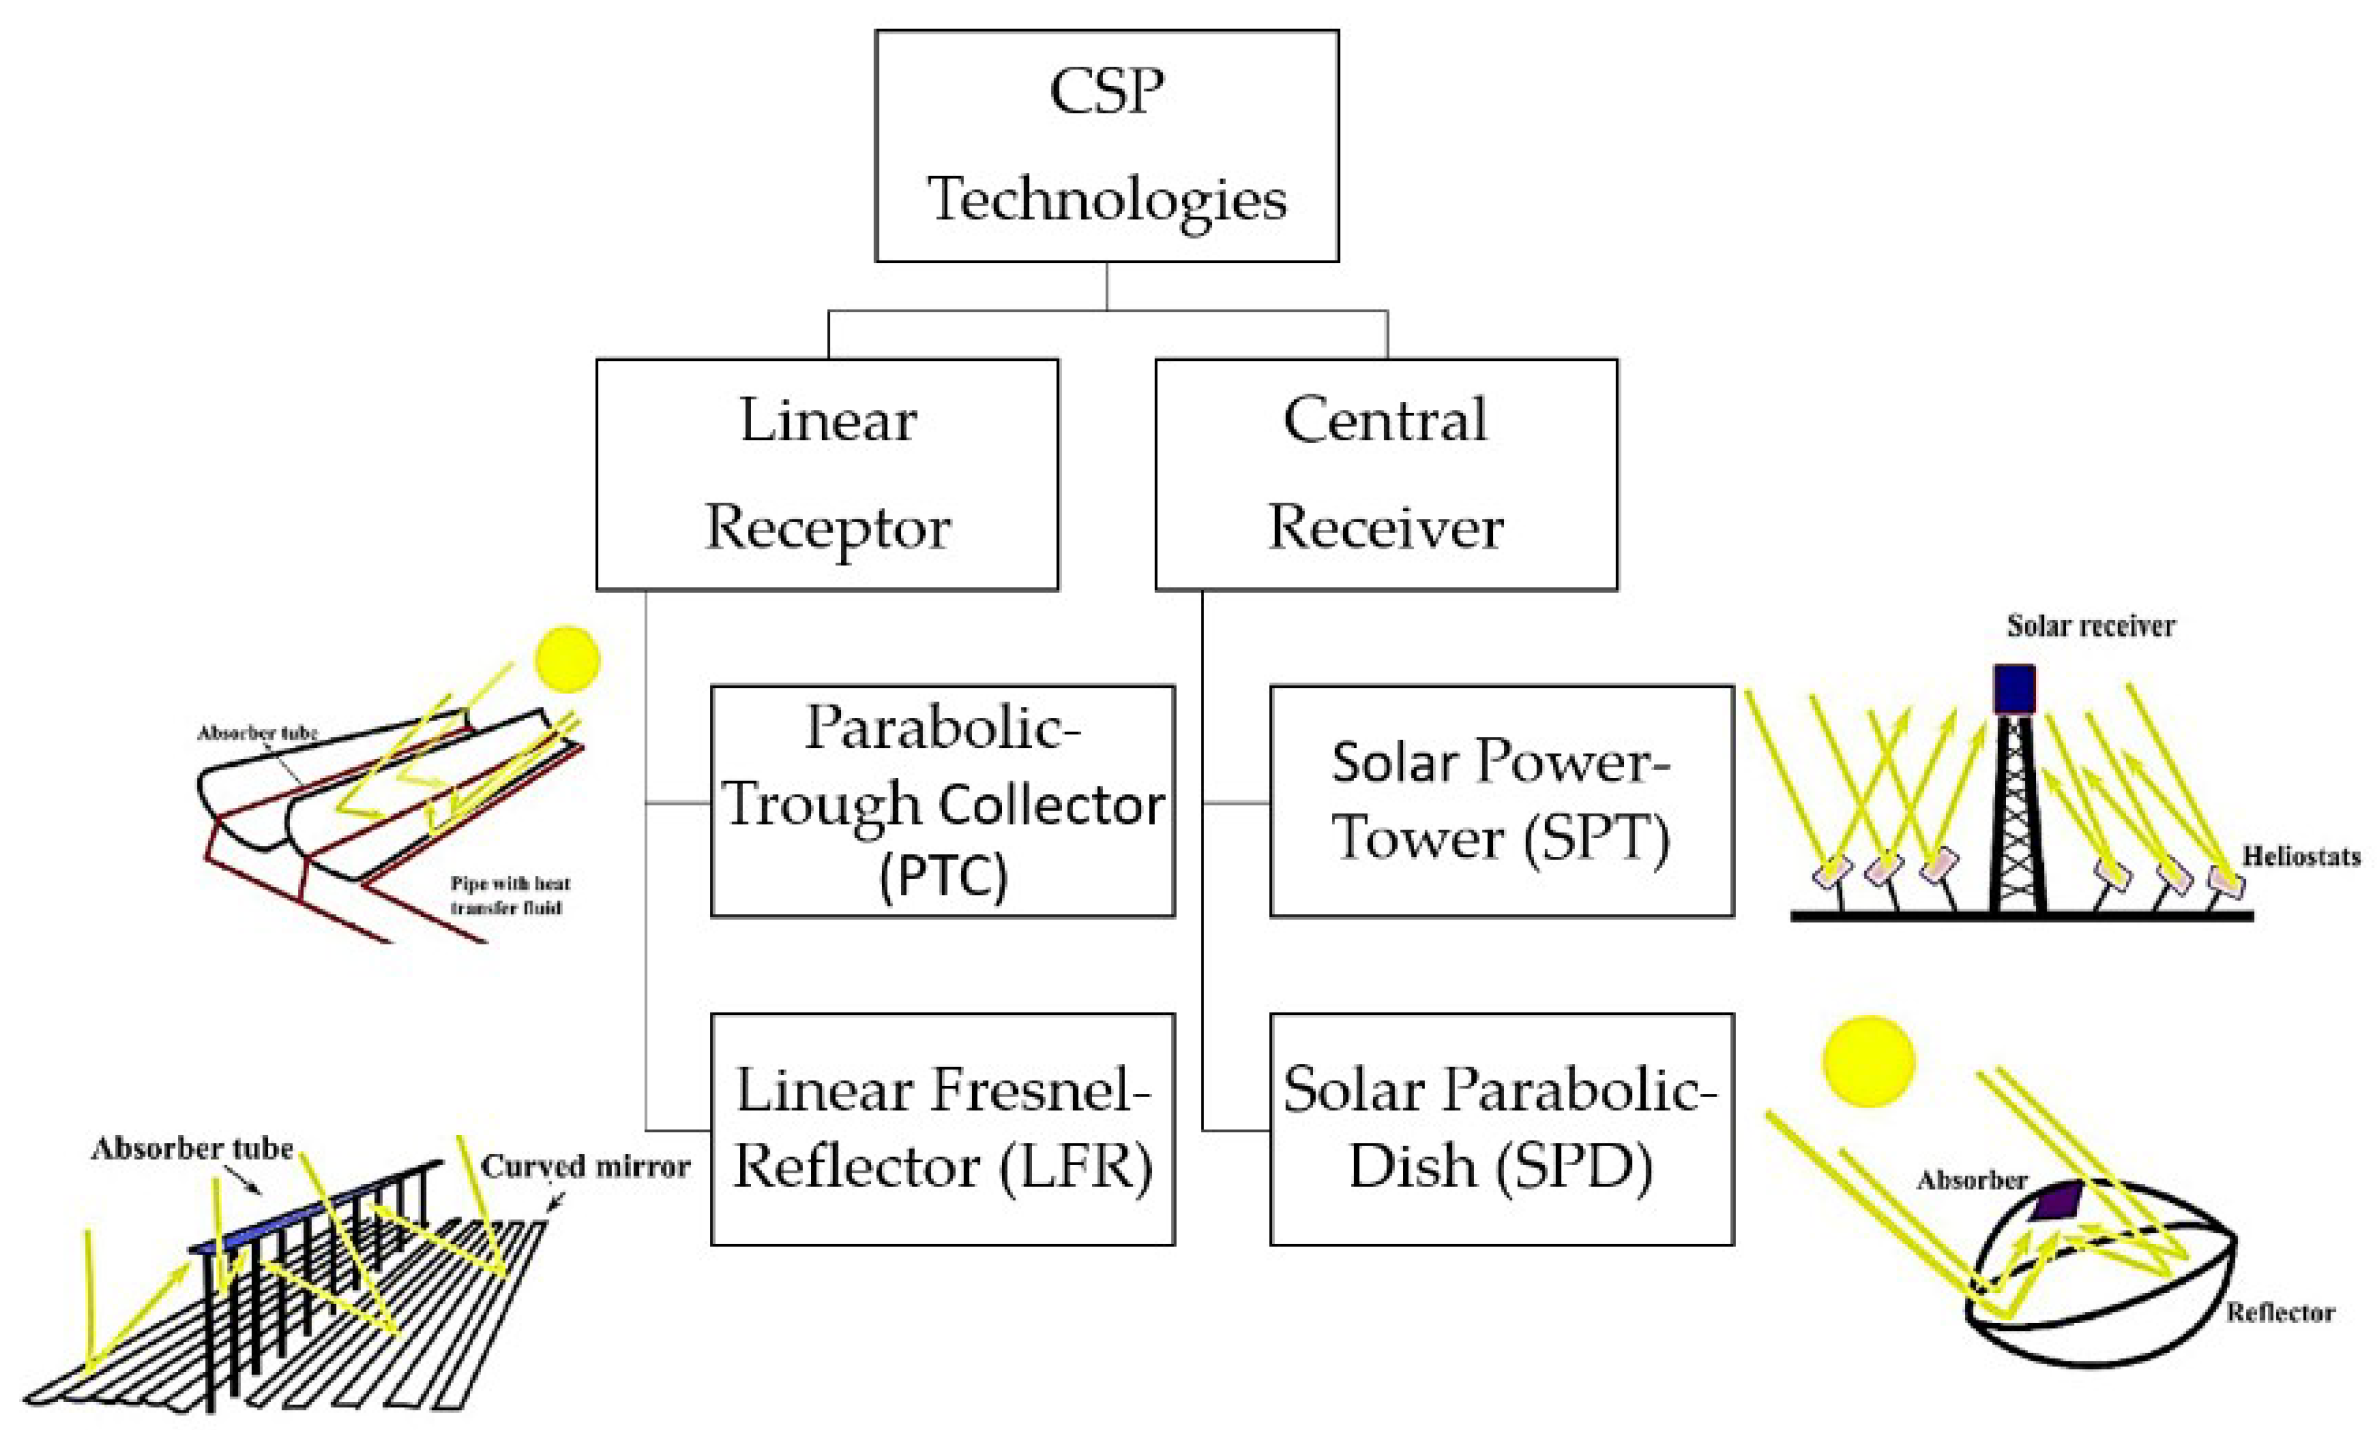
2. CSP Technology
- Tower systems reach higher temperatures in the receiver and therefore in storage,
- The annual energy production regime is more homogeneous, that is, the production difference does not show great differences depending on the time of year,
2.1. Environmental Benefits from CSP Technology
2.2. CSP Operation
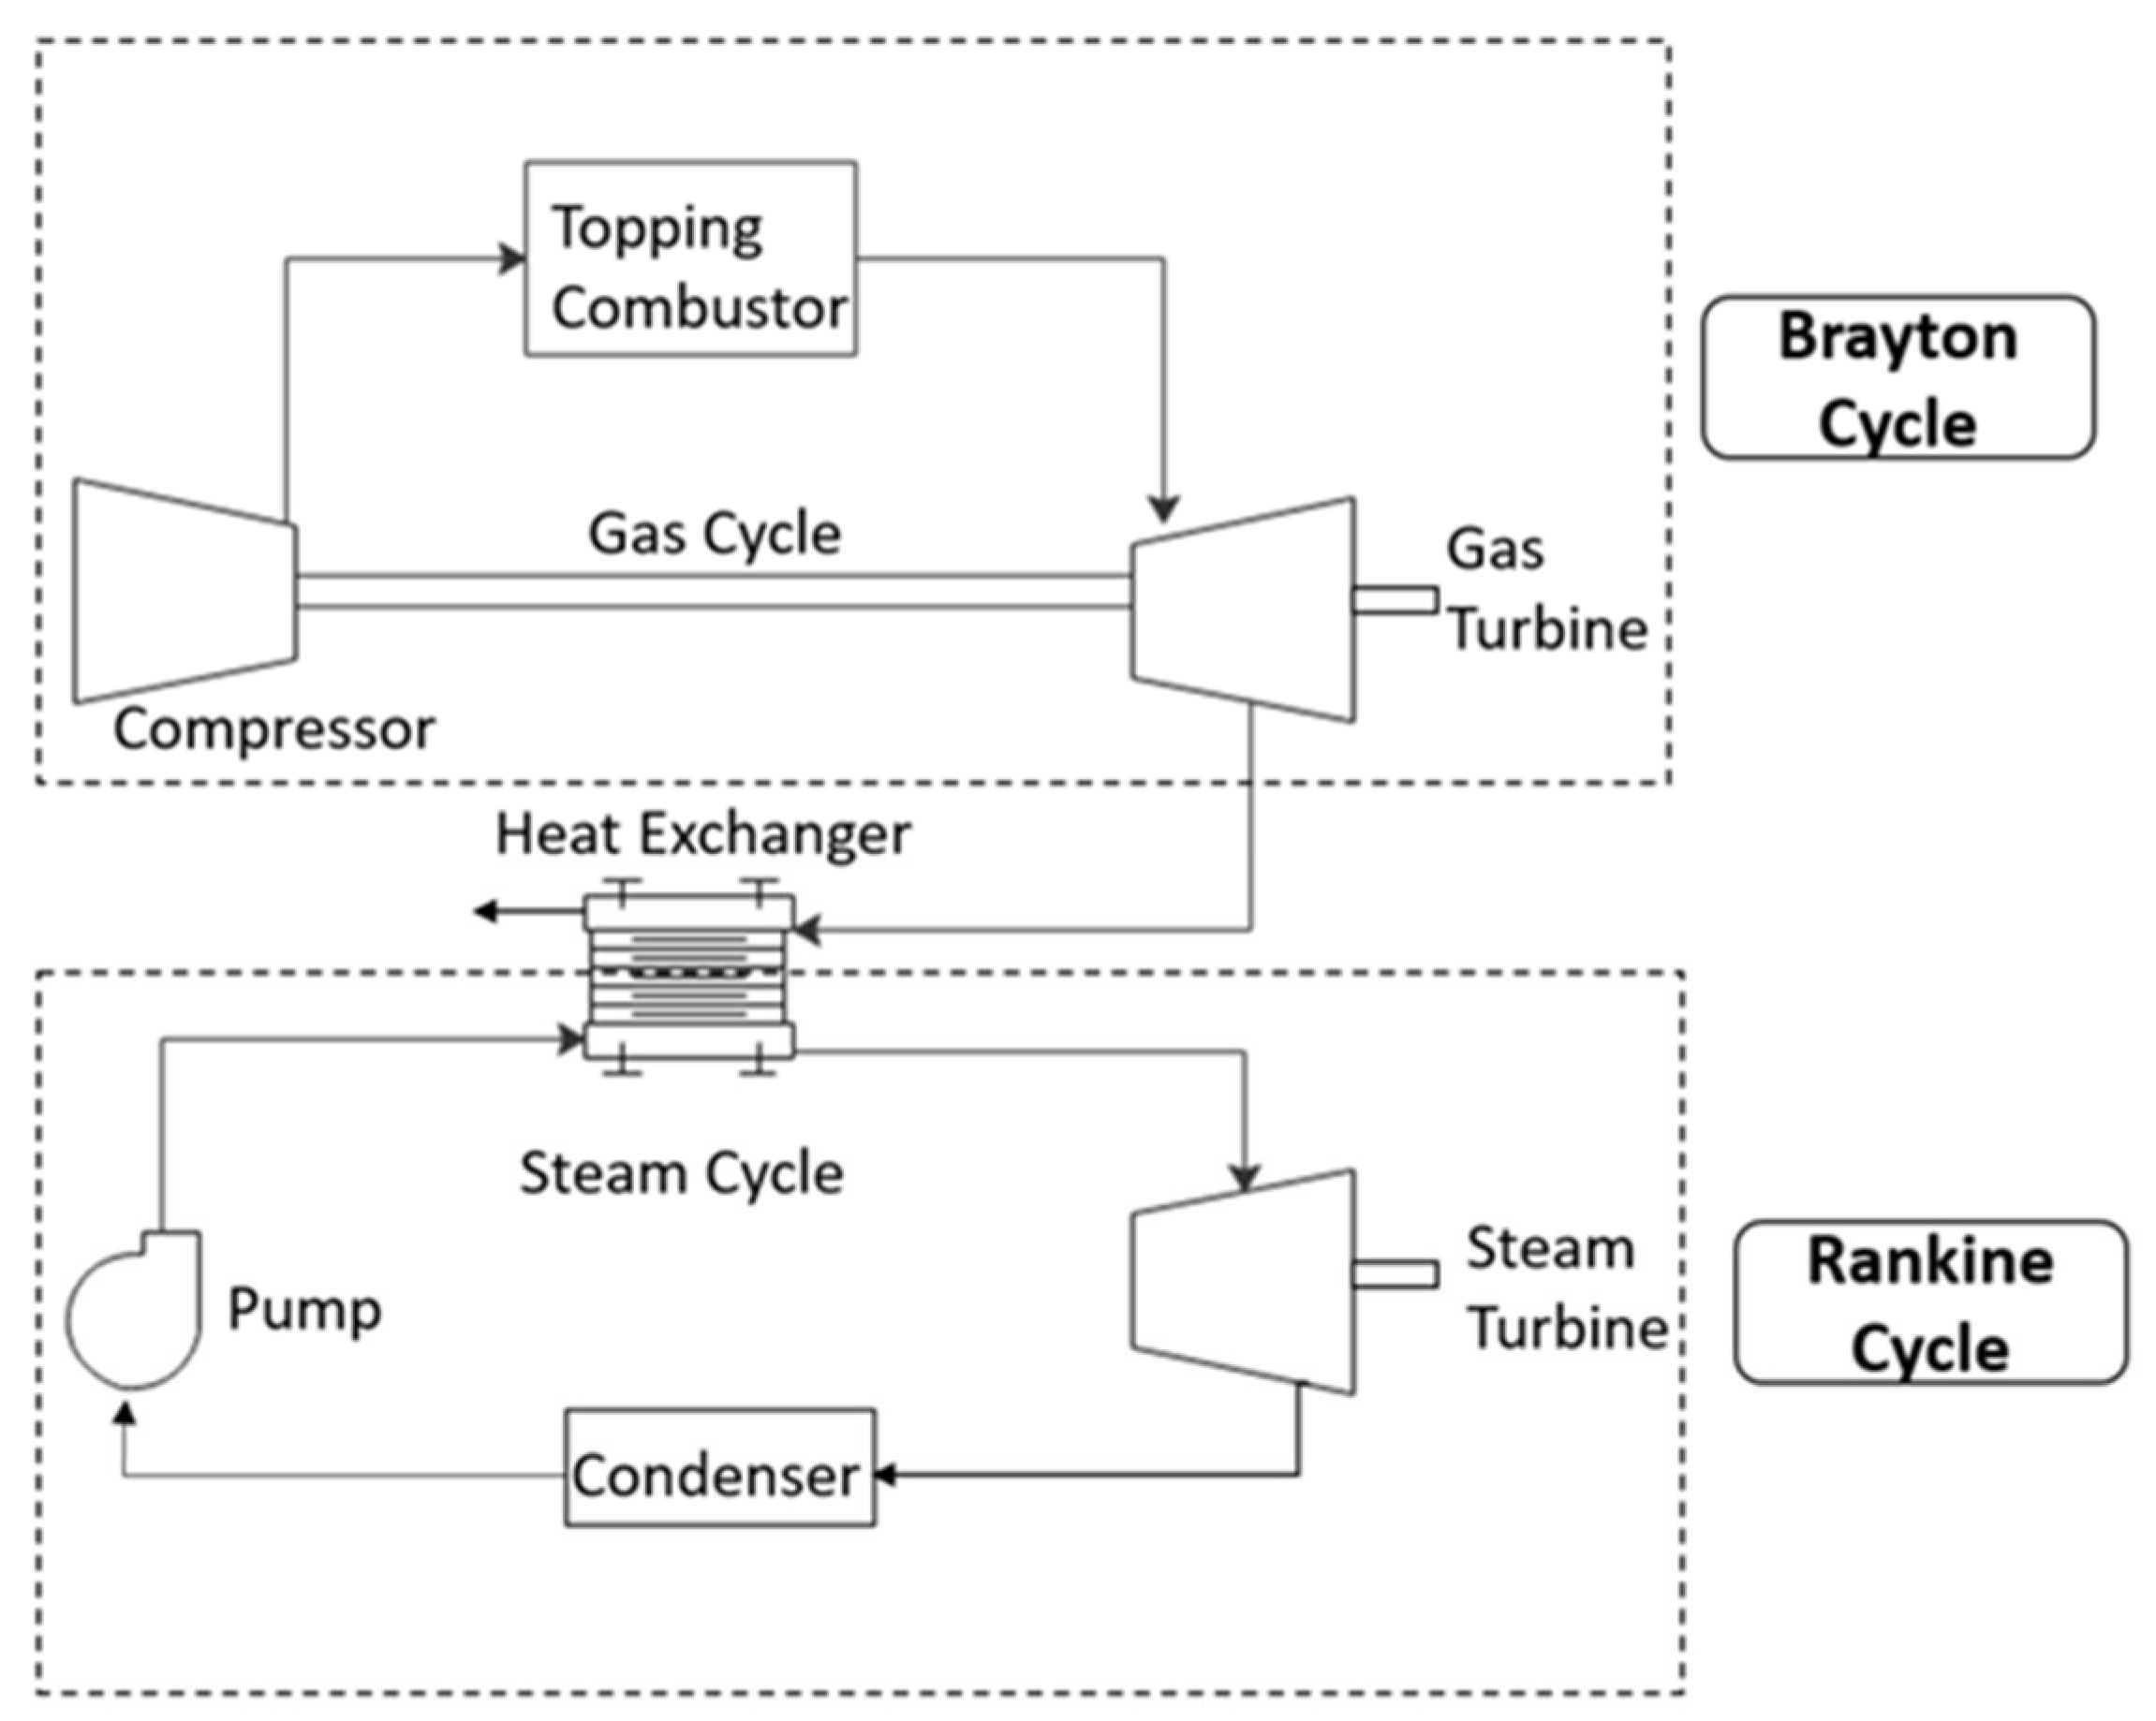
3. Gas Technology
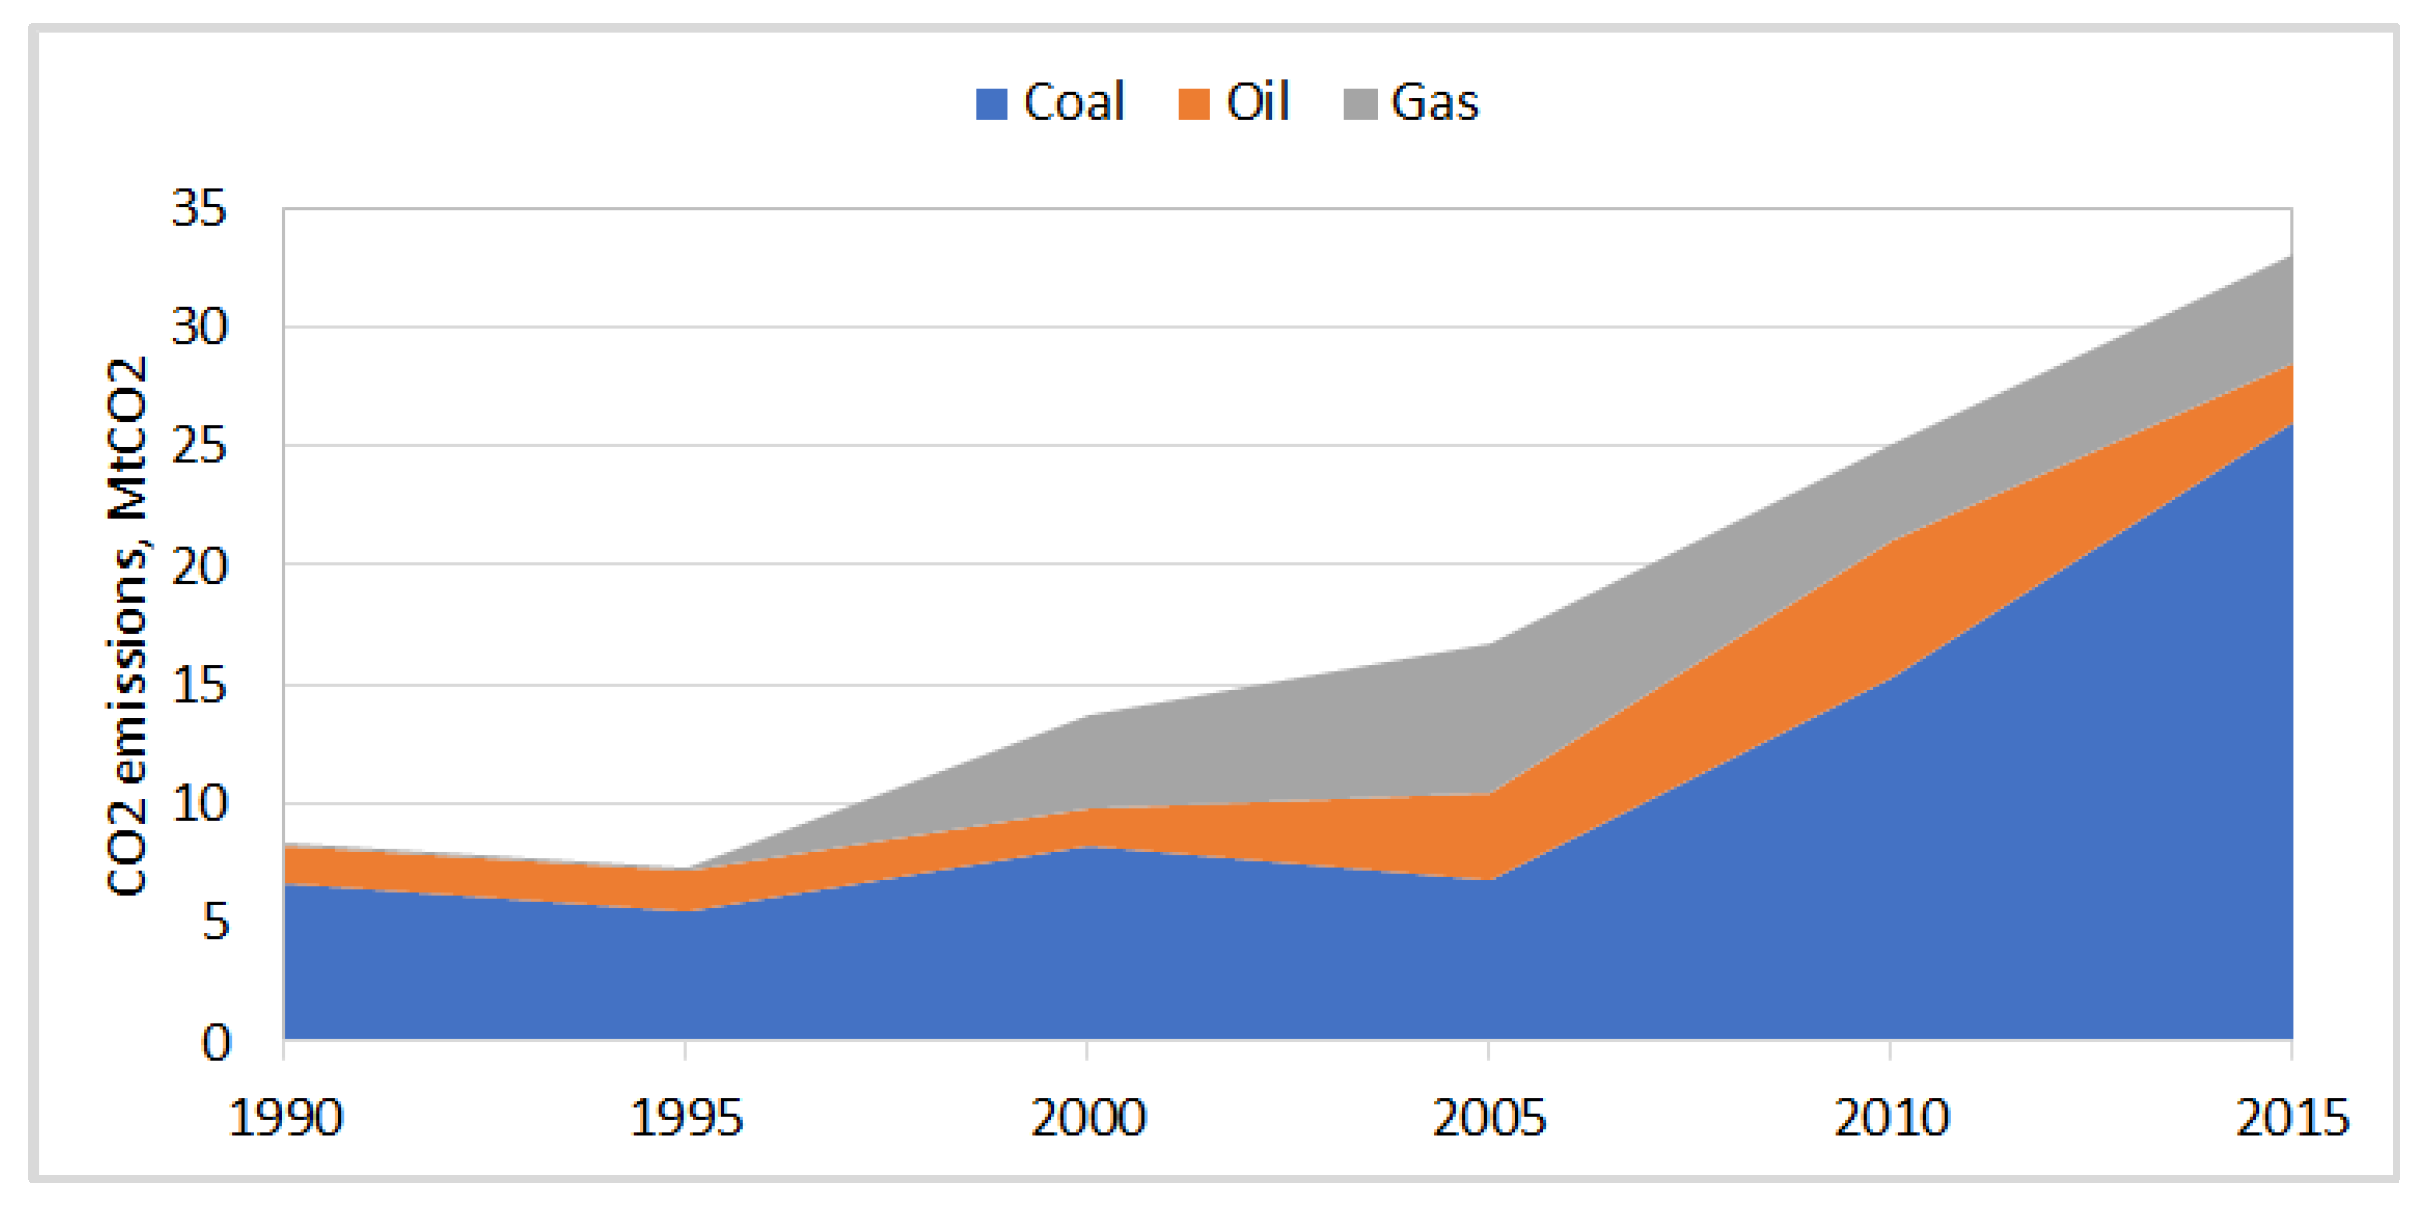
3.1. Environmental Impacts of Gas Generation
3.2. Gas Technology Operation
4. Economic Comparison between Hybrid CSP+PV Plant and Natural Gas Plant
4.1. Solar Energy
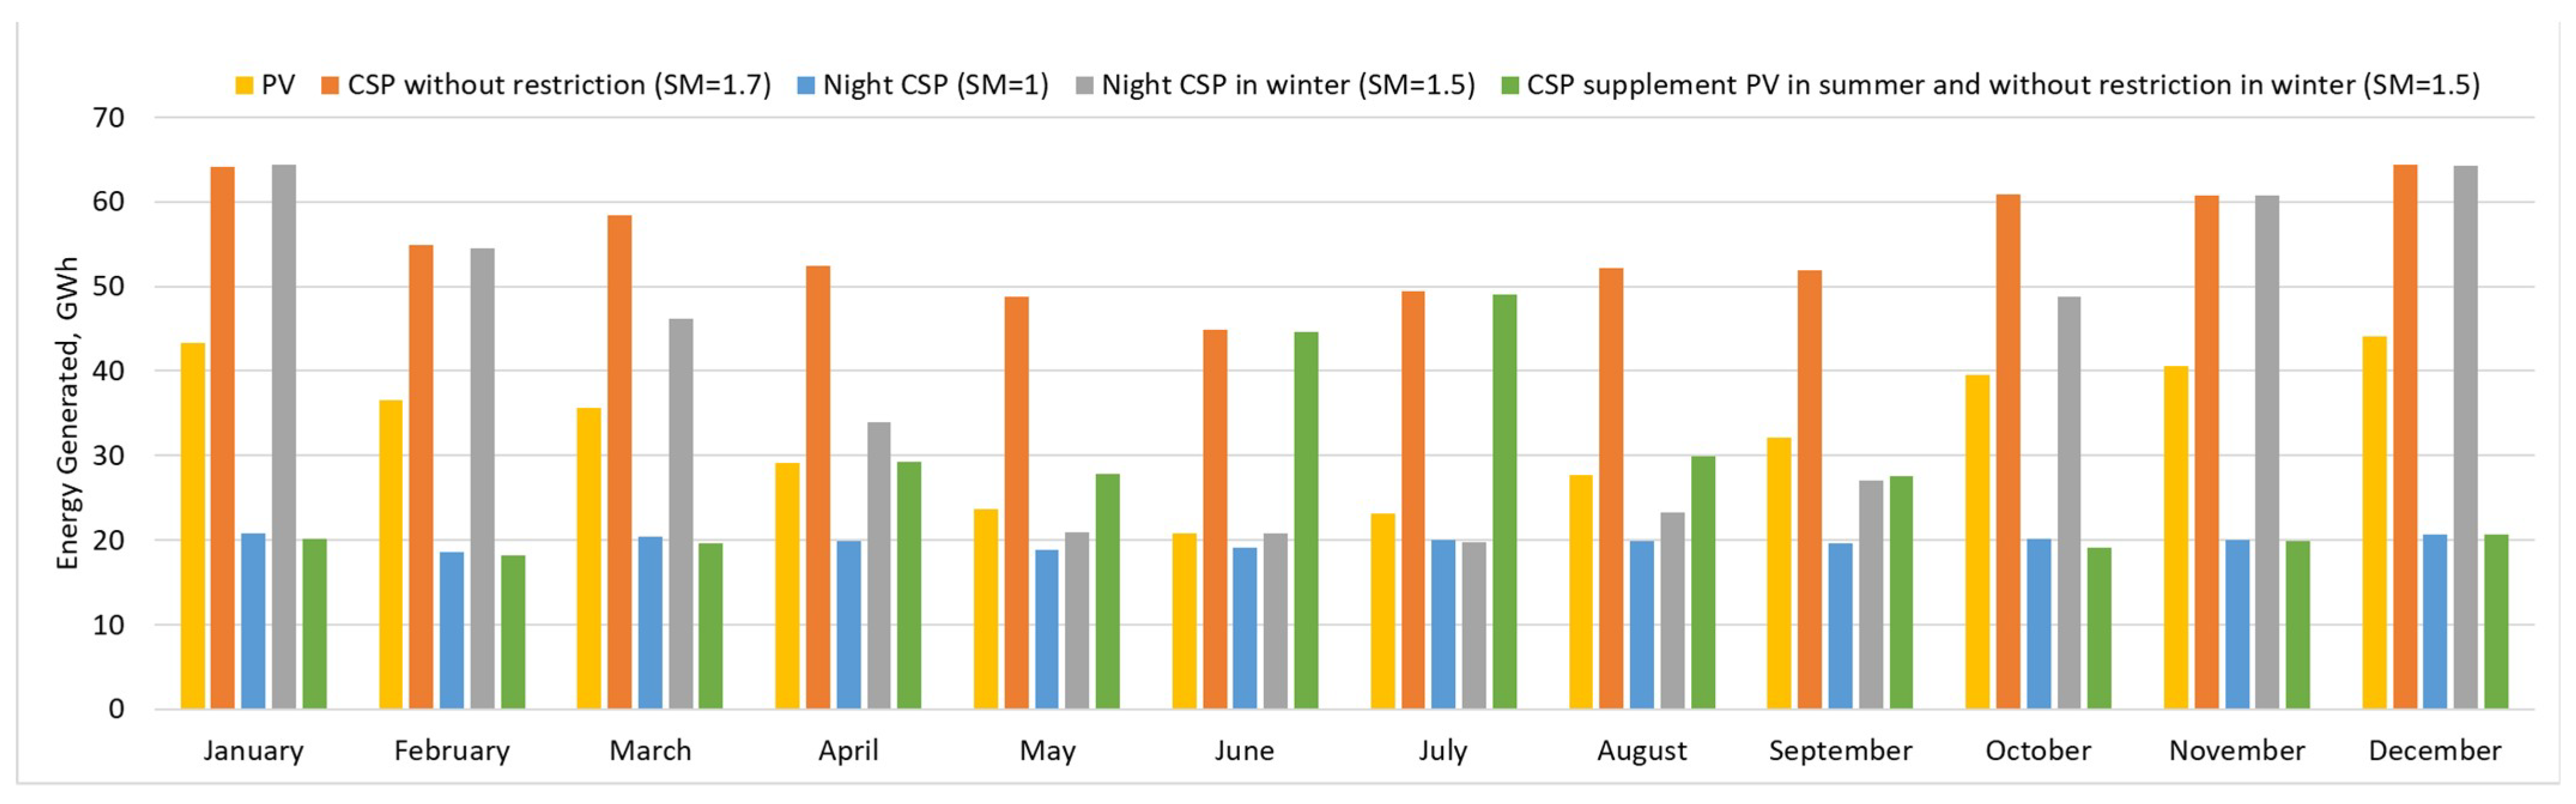
4.1.1. Base Case
4.1.2. Optimistic Summer and Winter Flat Profile
4.1.3. Summer Restriction and Optimistic Winter
4.1.4. Flat Profile
4.1.5. CSP with 6 h of Storage
4.2. Economic Analysis
4.3. Case of a Gas Plant
5. Discussion
5.1. Flexibility
5.2. Reliability
5.3. Economic Risk
5.4. Descarbonization Process
6. Conclusions
Author Contributions
Funding
Institutional Review Board Statement
Informed Consent Statement
Data Availability Statement
Acknowledgments
Conflicts of Interest
References
- Comité de Desarrollo de la Industria de la Energía Solar. Programa Energía Solar. Available online: https://www.comitesolar.cl/comite-solar/desierto-de-atacama/ (accessed on 8 October 2020).
- Starke, A.R.; Cardemil, J.M.; Escobar, R.; Lemos, L.L.; Colle, S. Assessing the performance of Concentrated Solar Power plants in selected locations of Chile. In Proceedings of the ECOS, 28th International Conference on Efficiency, Cost, Optimization, Simulation and Environmental Impact of Energy Systems, Pau, France, 30 June–3 July 2015. [Google Scholar]
- Comisión Nacional de Energía. Capacidad Instalada, Energía Abierta. 12 June 2020. Available online: http://energiaabierta.cl/visualizaciones/capacidad-instalada/ (accessed on 9 October 2020).
- Ministerio de Energía-Gobierno de Chile. Ruta Energética: Liderando la modernización energética con sello ciudadano. 2018. Available online: https://energia.gob.cl/iniciativas/ruta-energetica-liderando-la-modernizacion-energetica-con-sello-ciudadano (accessed on 1 October 2020).
- Séché Group Chile. El plan de descarbonización de Chile: Un doble desafío. 27 September 2019. Available online: https://www.sechegroup.cl/noticia/el-plan-de-descarbonizacion-de-chile-un-doble-desafio-2 (accessed on 12 June 2020).
- Departamento de Mitigación e Inventario de Contaminantes Climáticos; División de Cambio Climático, Ministerio de Medio Ambiente. Informe de Inventario Nacional de Gases de Efecto Invernadero de Chile, Serie 1990–2013. Paulo Cornejo. 2017. Available online: https://mma.gob.cl/wp-content/uploads/2017/12/2016_iin_cl.pdf (accessed on 1 October 2020).
- Coordinador Eléctrico Nacional, CEN. Operación Real Horaria, CEN. Available online: https://www.coordinador.cl/operacion/graficos/operacion-real/ (accessed on 18 November 2020).
- Ministerio de Energía. Plan de Descarbonización proceso histórico para Chile, Ministerio de Energía. Available online: https://energia.gob.cl/noticias/aysen-del-general-carlos-ibanez-del-campo/plan-de-descarbonizacion-proceso-historico-para-chile (accessed on 17 July 2020).
- Hernández Moro, J. Modelos de cálculo de Costes y Emisiones de CO2 Para la Electricidad Solar PV y CSP Según Diversos Escenarios (2010–2050). Ph.D. Thesis, Universidad Autónoma de Madrid, Madrid, Spain, 2013. [Google Scholar]
- Moro, J.H.; Martínez-Duart, J.M. Analytical model for solar PV and CSP electricity costs: Present LCOE values and their future evolution. Renew. Sustain. Energy Rev. 2013, 20, 119–132. [Google Scholar] [CrossRef]
- Parrado, C.; Marzo, A.; Fuentealba, E.; Fernández, A.G. 2050 LCOE improvement using new molten salts for thermal energy storage in CSP plants. Renewable Sustain. Energy Rev. 2016, 57, 505–514. [Google Scholar] [CrossRef]
- Musi, R.; Grange, B.; Sgouridis, S.; Guedez, R.; Armstrong, P.; Slocum, A.; Calvet, N. Techno-economic analysis of concentrated solar power plants in terms of levelized cost of electricity. In AIP Conference Proceedings; American Institute of Physics: College Park, MD, USA, 2017; Volume 1850, p. 160018. [Google Scholar]
- Hernández-Moro, J.; Martínez-Duart, J.M. CSP electricity cost evolution and grid parities based on the IEA road maps. Energy Policy 2012, 41, 184–192. [Google Scholar] [CrossRef]
- Freeman, J.M.; DiOrio, N.A.; Blair, N.J.; Neises, T.W.; Wagner, M.J.; Gilman, P.; Janzou, S. System Advisor Model (SAM) General Description (Version 2017.9. 5) (No. NREL/TP-6A20-70414); National Renewable Energy Lab. (NREL): Golden, CO, USA, 2018.
- Rashid, K. Design, Economics, and Real-Time Optimization of a Solar/Natural Gas Hybrid Power Plant. Ph.D. Thesis, The University of Utah, Salt Lake City, UT, USA, 2019. [Google Scholar]
- Xu, X.; Vignarooban, K.; Xu, B.; Hsu, K.; Kannan, A.M. Prospects and problems of concentrating solar power technologies for power generation in the desert regions. Renew. Sustain. Energy Rev. 2016, 53, 1106–1131. [Google Scholar] [CrossRef]
- Aboelmaaref, M.M.; Zayed, M.E.; Zhao, J.; Li, W.; Askalany, A.A.; Ahmed, M.S.; Ali, E.S. Hybrid solar desalination systems driven by parabolic trough and parabolic dish CSP technologies: Technology categorization, thermodynamic performance and economical assessment. Energy Convers. Manag. 2020, 220, 113103. [Google Scholar] [CrossRef]
- 4e, GIZ, Ministerio Federal de Medio Ambiente, Protección de la Naturaleza, Obras Públicas y Seguridad Nuclear de la República Federal de Alemania, Ministerio de Energía Gobierno de Chile. Sistema de Torre Solar-Estado y Perspectiva, Santiago de Chile. 2014. Available online: https://www.4echile.cl/publicaciones/sistemas-de-torre-solar/ (accessed on 10 July 2020).
- Behar, O.; Khellaf, A.; Mohammedi, K. A review of studies on central receiver solar thermal power plants. Renew. Sustain. Energy Rev. 2013, 23, 12–39. [Google Scholar] [CrossRef]
- Islam, M.T.; Huda, N.; Abdullah, A.B.; Saidur, R. A comprehensive review of state-of-the-art concentrating solar power (CSP). Renew. Sustain. Energy Rev. 2018, 91, 987–1018. [Google Scholar] [CrossRef]
- Rashid, K.; Mohammadi, K.; Powell, K. Dynamic simulation and techno-economic analysis of a concentrated solar power (CSP) plant hybridized with both thermal energy storage and natural gas. J. Clean. Prod. 2020, 248, 119193. [Google Scholar] [CrossRef]
- European Commission. Community Research, European Research on Concentrated Solar Thermal Energy; European Commission: Maastricht, The Netherlands, 2004. [Google Scholar]
- Giacomozzi, F.G.; Comité Solar. Factores Críticos en Diseño Y Operación de Centrales CSP de Torre con Almacenamiento en Sales Fundidas en el Desierto de Atacama. Comité Solar: Santiago, Chile, 2017. Available online: http://www.comitesolar.cl/wp-content/uploads/2018/08/Factores-cri%CC%81ticos-en-desarrollo-CSP-en-Chile-20170815.pdf (accessed on 10 July 2020).
- Zurita, A.; Mata-Torres, C.; Cardemil, J.M.; Escobar, R.A. Assessment of time resolution impact on the modeling of a hybrid CSP-PV plant: A case of study in Chile. Solar Energy 2020, 202, 553–570. [Google Scholar] [CrossRef]
- Castillejo-Cuberos, A.; Escobar, R. Understanding solar resource variability: An in-depth analysis, using Chile as a case of study. Renew. Sustain. Energy Rev. 2020, 120, 109664. [Google Scholar] [CrossRef]
- Marzo, A.; Zarzalejo, L.F.; Ibarra, M.; Navarro, A.A.; Soto, G.; Ramirez, L.; Escobar, R.; Silva-Perez, M. Towards the Chilean solar thermal potential knowledge for solar power tower plants. In AIP Conference Proceedings; American Institute of Physics: College Park, MD, USA, 2018; Volume 2033, p. 170008. [Google Scholar]
- Comisión Nacional de Energía. Informe de Costos de Tecnologías de Generación-Informe Anual; Comisión Nacional de Energía: Santiago, Chile, 2020. [Google Scholar]
- Mahto, D.; Pal, S. Thermodynamics and thermo-economic analysis of simple combined cycle with inlet fogging. Appl. Therm. Eng. 2013, 51, 413–424. [Google Scholar] [CrossRef]
- SolarPACES. Solar Power & Chemical Energy Systems. 11 October 2017. Available online: https://www.solarpaces.org/csp-competes-with-natural-gas-not-pv/ (accessed on 10 July 2020).
- PSR, Physicians For Social Responsibility, Concerned Health Professionals of NY, Heinrich BÖLL Stiftung, Compendio sobre hallazgos científicos, médicos y de los medios que demuestran los riesgos y daños del Fracking-Ex-tracción no convencional de gas y petróleo. December 2019. Available online: https://mx.boell.org/sites/default/files/2019-11/Fracking_libro_2019.pdf (accessed on 10 July 2020).
- BBC News. Qué es el fracking y por qué genera tantas protestas, Alejandra Martins, BBC Mundo. 17 October 2013. Available online: https://www.bbc.com/mundo/noticias/2013/10/131017_ciencia_especial_fracking_abc_am (accessed on 10 October 2020).
- International Energy Agency, IEA. Data and Statistics. Available online: https://www.iea.org/data-and-statistics?country=WORLD&fuel=Energy%20supply&indicator=TPESbySource (accessed on 9 October 2020).
- Chile Sustentable. Minuta Impuesto Verde. Available online: http://www.chilesustentable.net/wp-content/uploads/2019/04/Minuta-Impuesto-Verde_chs.pdf (accessed on 13 July 2020).
- Programa Chile Sustentable. Propuesta Ciudadana para el cambio, Impuesto verde para Fuentes Fijas en Chile, 29 January 2018. Available online: www.chilesustentable.net (accessed on 13 July 2020).
- Diaz, G.; Muñoz, F.D.; Moreno, R. Equilibrium Analysis of a Tax on Carbon Emissions with Pass-through Restrictions and Side-payment Rules. Energy J. 2020, 41. [Google Scholar] [CrossRef]
- Comisión Nacional de Energía. Informe técnico preliminar fijación de precios de nudo de corto plazo. June 2020. Available online: https://www.cne.cl/wp-content/uploads/2020/06/ITP-PNCP-Jun20.pdf (accessed on 3 August 2020).
- Libertex. Precio del Gas Natural. Available online: https://libertex.com/es/oil-gas/henry-hub-natural-gas (accessed on 10 July 2020).
- S&P Global Platts. Evaluación de precios de gas de Henry Hub. Available online: https://www.spglobal.com/platts/es/our-methodology/price-assessments/natural-gas/henry-hub-natural-gas-price-assessments# (accessed on 10 July 2020).
- FRED Economic Data, “Economic Research,” Federal Reserve Bank Of ST. Louis. Available online: https://fred.stlouisfed.org/ (accessed on 10 February 2021).
- Energía Abierta. Catálogo estadísticas-Gas Natural. Available online: http://energiaabierta.cl/?s=gas+natural+&t=api (accessed on 20 November 2020).
- Hernández, C.; Barraza, R.; Saéz, A.; Ibarra, M.; Estay, D. Potential Map for the Installation of Concentrated Solar Power Towers in Chile. Energies 2020, 13, 2131. [Google Scholar] [CrossRef]
- Ministerio de Energía. Explorador Solar,» Explorador Solar. Available online: http://www.minenergia.cl/exploradorsolar/ (accessed on 7 September 2020).
- Ju, X.; Xu, C.; Hu, Y.; Han, X.; Wei, G.; Du, X. A review on the development of photovoltaic/concentrated solar power (PV-CSP) hybrid systems. Solar Energy Mater. Sol. Cells 2017, 161, 305–327. [Google Scholar] [CrossRef]
- Sistema de Evaluación ambiental–SEA. Declaración de Impacto Ambiental Planta de Concentración Solar de Potencia Copiapo Solar. October 2014. Available online: https://seia.sea.gob.cl/archivos/2014/10/16/DIA_PCSP_Copiapo_Solar_-_Capitulo_06.pdf (accessed on 15 June 2020).
- Petrollese, M.; Cocco, D. Optimal design of a hybrid CSP-PV plant for achieving the full dispatchability of solar energy power plants. Solar Enery 2016, 137, 477–489. [Google Scholar] [CrossRef]
- Comisión Nacional de Energía-Juan Carlos Martina. Licitaciones de suministro en Chile 2017/01. May 2018. Available online: https://investchile.gob.cl/wp-content/uploads/2017/04/CNE-Licitaciones-Andre%CC%81s-Romero_Abr-17.pdf (accessed on 7 September 2020).
- Bellini, E.; Magazine, P.V. Available online: https://www.pv-magazine.com/2020/04/30/lcoe-from-large-scale-pv-fell-4-to-50-per-megawatt-hour-in-six-months/ (accessed on 7 August 2020).
- Comisión Nacional de Energía-CNE. Expansión de Transmisión. Available online: https://www.cne.cl/tarificacion/electrica/expansion-de-transmision/ (accessed on 20 November 2020).
- LAZARD. Lazard’s Levelized Cost of Energy Analysis-Version 13.0. November 2019. Available online: https://www.lazard.com/media/451086/lazards-levelized-cost-of-energy-version-130-vf.pdf (accessed on 2 November 2020).
- Gonzalez, C. Webinar ACSP 2020-Atributos y prestaciones de la tecnología CSP, de seminario CSP 2020–la respuesta a la estabilidad sustentable del sistema eléctrico de chile, Santiago de Chile. 19 November 2020. Available online: https://acsp.cl/2020/11/27/revive-los-detalles-del-seminario-csp-2020/ (accessed on 17 December 2020).
- Ministerio de Energía. Ministerio de Energía. 8 September 2020. Available online: https://energia.gob.cl/noticias/nacional/estrategia-de-flexibilidad-para-el-sistema-electrico-nacional (accessed on 11 November 2020).
- Fraunhofer Chile. Concentración Solar de Potencia: La mejor solución para Chile. 7 May 2019. Available online: https://www.fraunhofer.cl/es/Prensa/news/cset-notices/concentracion-solar-de-potencia---la-mejor-solucion-para-chile-.html#:~:text=Las%20plantas%20CSP%20son%20confiables,f%C3%A1cilmente%20valoradas%20y%20tambi%C3%A9n%20financiadas (accessed on 24 November 2020).
- International Renewable Energy Agency-IRENA. The Power to Change: Solar and Wind Cost Reduction Potential to 2025. June 2016. Available online: https://www.irena.org/publications/2016/Jun/The-Power-to-Change-Solar-and-Wind-Cost-Reduction-Potential-to-2025#:~:text=With%20the%20right%20policies%20in,Renewable%20Energy%20Agency%20(IRENA) (accessed on 2 November 2020).
- Casar, J.M.; Navarro, A. Informe Final-Centrales Termoeléctricas, Mercados e implicancias, Curso: Mercado Eléctricos. Available online: https://hrudnick.sitios.ing.uc.cl/alumno03/thermo/Web_mercados.htm (accessed on 25 November 2020).
- Coordinador Eléctrico Nacional (CEN). Documentos de Mercado, Indices de desempeño. 30 October 2020. Available online: https://www.coordinador.cl/mercados/documentos/indices-de-desempeno/calidad-de-suministro-indices-de-indisponibilidad/2020-calidad-de-suministro-indices-de-indisponibilidad/septiembre-2020-calidad-de-suministro-indices-de-indisponibilidad/ (accessed on 25 November 2020).
- Energía Estratégica. Opinión: En todas partes se cuecen habas y es con gas inflexible. Available online: https://www.energiaestrategica.com/opinion-en-todas-partes-se-cuecen-habas-y-es-con-gas-inflexible/ (accessed on 17 December 2020).
- Araneda, J.C. Planificación de transmisión Coordinador Eléctrico Nacional. In Proceedings of the de Seminario CSP 2020, Santiago, Chile, 19 November 2020; Available online: https://acsp.cl/2020/11/27/revive-los-detalles-del-seminario-csp-2020/ (accessed on 17 December 2020).


| Items | PTC | LFR | SPT | SPD |
|---|---|---|---|---|
| Capacity, MWe | 10–200 | 10–200 | 10–150 | 0.01–0.4 |
| Operating temperature range, °C | 150–400 | 150–400 | 300–1200 | 300–1500 |
| Annual efficiency from solar to electricity, % | 15 | 8–10 | 20–35 | 20–35 |
| Required area, m2/MWh | 4–6 | 6–8 | 8–12 | 30–40 |
| Maximum efficiency of the plant, % | 14–20 | ~18 | 23–45 | ~30 |
| Water requirement, m3/MWh | 3 (wet cooling) 0.3 (dry cooling) 0.4–1.7 (hybrid) | 3 (wet cooling) 0.2 (dry cooling) | 2–3 (wet cooling) 0.25 (dry cooling) 0.1–1 (hybrid) | 0.05–1 (For cleaning mirrors) |
| Molten salt storage | Commercially available | Possible but not proven | Commercially available | Possible but not proven |
| Steam conditions, °C/bar | 380 to 540/100 | 260/50 | 540/100 to 160 | Does not apply |
| Pollutant | Per Capita Cost, USD |
|---|---|
| Particulate Material (PM) | 0.9 |
| Nitrogen Oxides (NOx) | 0.01 |
| Sulfur Dioxide (SO2) | 0.025 |
| Carbon Dioxide (CO2)(*) | 5 |
| Energy | Global Horizontal Irradiance | Direct Normal Irradiance | Diffuse Horizontal Irradiance |
|---|---|---|---|
| Annual total energy, kWh/m2-year | 2544 | 3811 | 207 |
| Annual average daily total energy, kWh/m2 | 7.0 | 10.4 | 0.6 |
| Hybrid Case | Case Description |
|---|---|
| Base | PV + CSP without restriction |
| Optimistic summer and winter flat profile | PV + Night CSP in winter |
| Summer restriction and optimistic winter | PV + CSP supplement PV in summer and without restriction in winter |
| Flat Profile | PV + Night CSP |
| CSP Plant | PV Plant | ||
|---|---|---|---|
| Solar Field | Value | Orientation and monitoring | |
| Heliostat number | 10,014.0 | Arrangement type | Tracking on an axis (W–E) |
| Surface area | 1.15 km2 | ||
| Solar tower and receiver | PV module features | ||
| Tower height | 165 m | Types of modules | Standard |
| Receiver height | 40 m | DC/AC Ratio | 1.2 |
| Receiver diameter | 17 m | Investor Efficiency | 96% |
| Thermal energy storage (TES) | Loss | ||
| Storage capacity | 13 h | Global loss | 14% |
| Cold and hot storage temperature | 287–565 °C | ||
| Solar Multiple | 2 | ||
| Power Block | Power Block | ||
| Design power | 130 MWe | Design power | 150 MWe |
| Configuration | Optimal Solar Multiple | LCOE Conservative CSP, USD/MWh |
|---|---|---|
| CSP without restriction | 1.7 | 83.3 |
| Night CSP in winter | 1.5 | 112.7 |
| CSP supplement PV in summer and without restriction in winter | 1.5 | 153.7 |
| Night CSP | 1.0 | 225.5 |
| Parameter | Value | Reference |
|---|---|---|
| Lifetime | ||
| Lifetime of CSP systems | 40 years | [11] |
| Lifetime of PV Systems | 25 years | [10] |
| Degradation Rate | ||
| CSP degradation rate | 0.2%/year | [46] |
| PV degradation rate | 0.6%/year | [46] |
| Economic Rate | ||
| Annual interest rate | 7% | [45] |
| Inflation rate | 0% | |
| Parameter | Value |
|---|---|
| CAPEX CSP Plant (130 MWe) | 3.25 MMUSD/MWe |
| CAPEX PV Plant (150 MWe) | 0.713 MMUSD/MWe |
| CAPEX Substation 110 kV | 4.9 MMUSD |
| CAPEX Transmission 110 kV | 1.8 MMUSD |
| OPEX Substation 110 kV | 0.079 MMUSD/year |
| OPEX Transmission 110 kV | 0.016 MMUSD/year |
| OPEX CSP | 5 MMUSD/year |
| Variable Cost Operational CSP | 3.5 USD/MWe |
| Fixed OPEX CSP | 7.72 MMUSD/year |
| Fixed OPEX PV | 1.6 MMUSD |
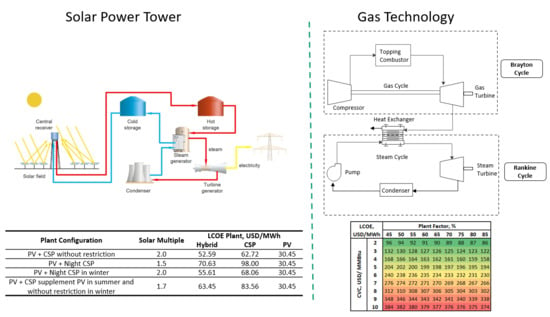
| Plant Configuration | Solar Multiple | LCOE Plant, USD/MWh | ||
|---|---|---|---|---|
| Hybrid | CSP | PV | ||
| PV + CSP without restriction | 2.0 | 52.59 | 62.72 | 30.45 |
| PV + Night CSP | 1.5 | 70.63 | 98.00 | 30.45 |
| PV + Night CSP in winter | 2.0 | 55.61 | 68.06 | 30.45 |
| PV + CSP supplement PV in summer and without restriction in winter | 1.7 | 63.45 | 83.56 | 30.45 |
| Configuration | Solar Multiple Optimal for 6 h, (-) | LCOE SAM 6 h (USD/MWh) | SAM 13 h (USD/MWh) | Δ SAM 6/SAM 13 h |
|---|---|---|---|---|
| CSP without restriction | 1.7 | 83.3 | 88.3 | −6% |
| Night CSP | 1.0 | 225.5 | 132.8 | +70% |
| Night CSP in winter | 1.5 | 112.7 | 92.2 | +22% |
| CSP supplement PV in summer and without restriction in winter | 1.5 | 153.7 | 118.1 | +30% |
| Items | Value |
|---|---|
| CAPEX | 0.898 MMUSD/MWe |
| Non-fuel Variable Cost | 3.5 USD/MWh |
| Fixed Cost | 1% CAPEX |
| Plant | LCOE, USD/MWh |
|---|---|
| Gas Combined Cycle | 44–68 |
| Solar PV–Crys | 36–44 |
| STP with Storage | 126–156 |
Publisher’s Note: MDPI stays neutral with regard to jurisdictional claims in published maps and institutional affiliations. |
© 2021 by the authors. Licensee MDPI, Basel, Switzerland. This article is an open access article distributed under the terms and conditions of the Creative Commons Attribution (CC BY) license (http://creativecommons.org/licenses/by/4.0/).
Share and Cite
Hernández Moris, C.; Cerda Guevara, M.T.; Salmon, A.; Lorca, A. Comparison between Concentrated Solar Power and Gas-Based Generation in Terms of Economic and Flexibility-Related Aspects in Chile. Energies 2021, 14, 1063. https://doi.org/10.3390/en14041063
Hernández Moris C, Cerda Guevara MT, Salmon A, Lorca A. Comparison between Concentrated Solar Power and Gas-Based Generation in Terms of Economic and Flexibility-Related Aspects in Chile. Energies. 2021; 14(4):1063. https://doi.org/10.3390/en14041063
Chicago/Turabian StyleHernández Moris, Catalina, Maria Teresa Cerda Guevara, Alois Salmon, and Alvaro Lorca. 2021. "Comparison between Concentrated Solar Power and Gas-Based Generation in Terms of Economic and Flexibility-Related Aspects in Chile" Energies 14, no. 4: 1063. https://doi.org/10.3390/en14041063
APA StyleHernández Moris, C., Cerda Guevara, M. T., Salmon, A., & Lorca, A. (2021). Comparison between Concentrated Solar Power and Gas-Based Generation in Terms of Economic and Flexibility-Related Aspects in Chile. Energies, 14(4), 1063. https://doi.org/10.3390/en14041063