1. Introduction
Germany is aiming for ambitious greenhouse gas (GHG) reduction goals to contribute adequately to the targets resulting from the Paris Climate Agreement. Germany committed itself to reduce GHG emissions by 80% compared to 1990 and increase the share of renewable energies (RE) to 60% of energy consumption by 2050 [
1]. These targets seem to be increased further by the recently proposed “green deal” of the EU.
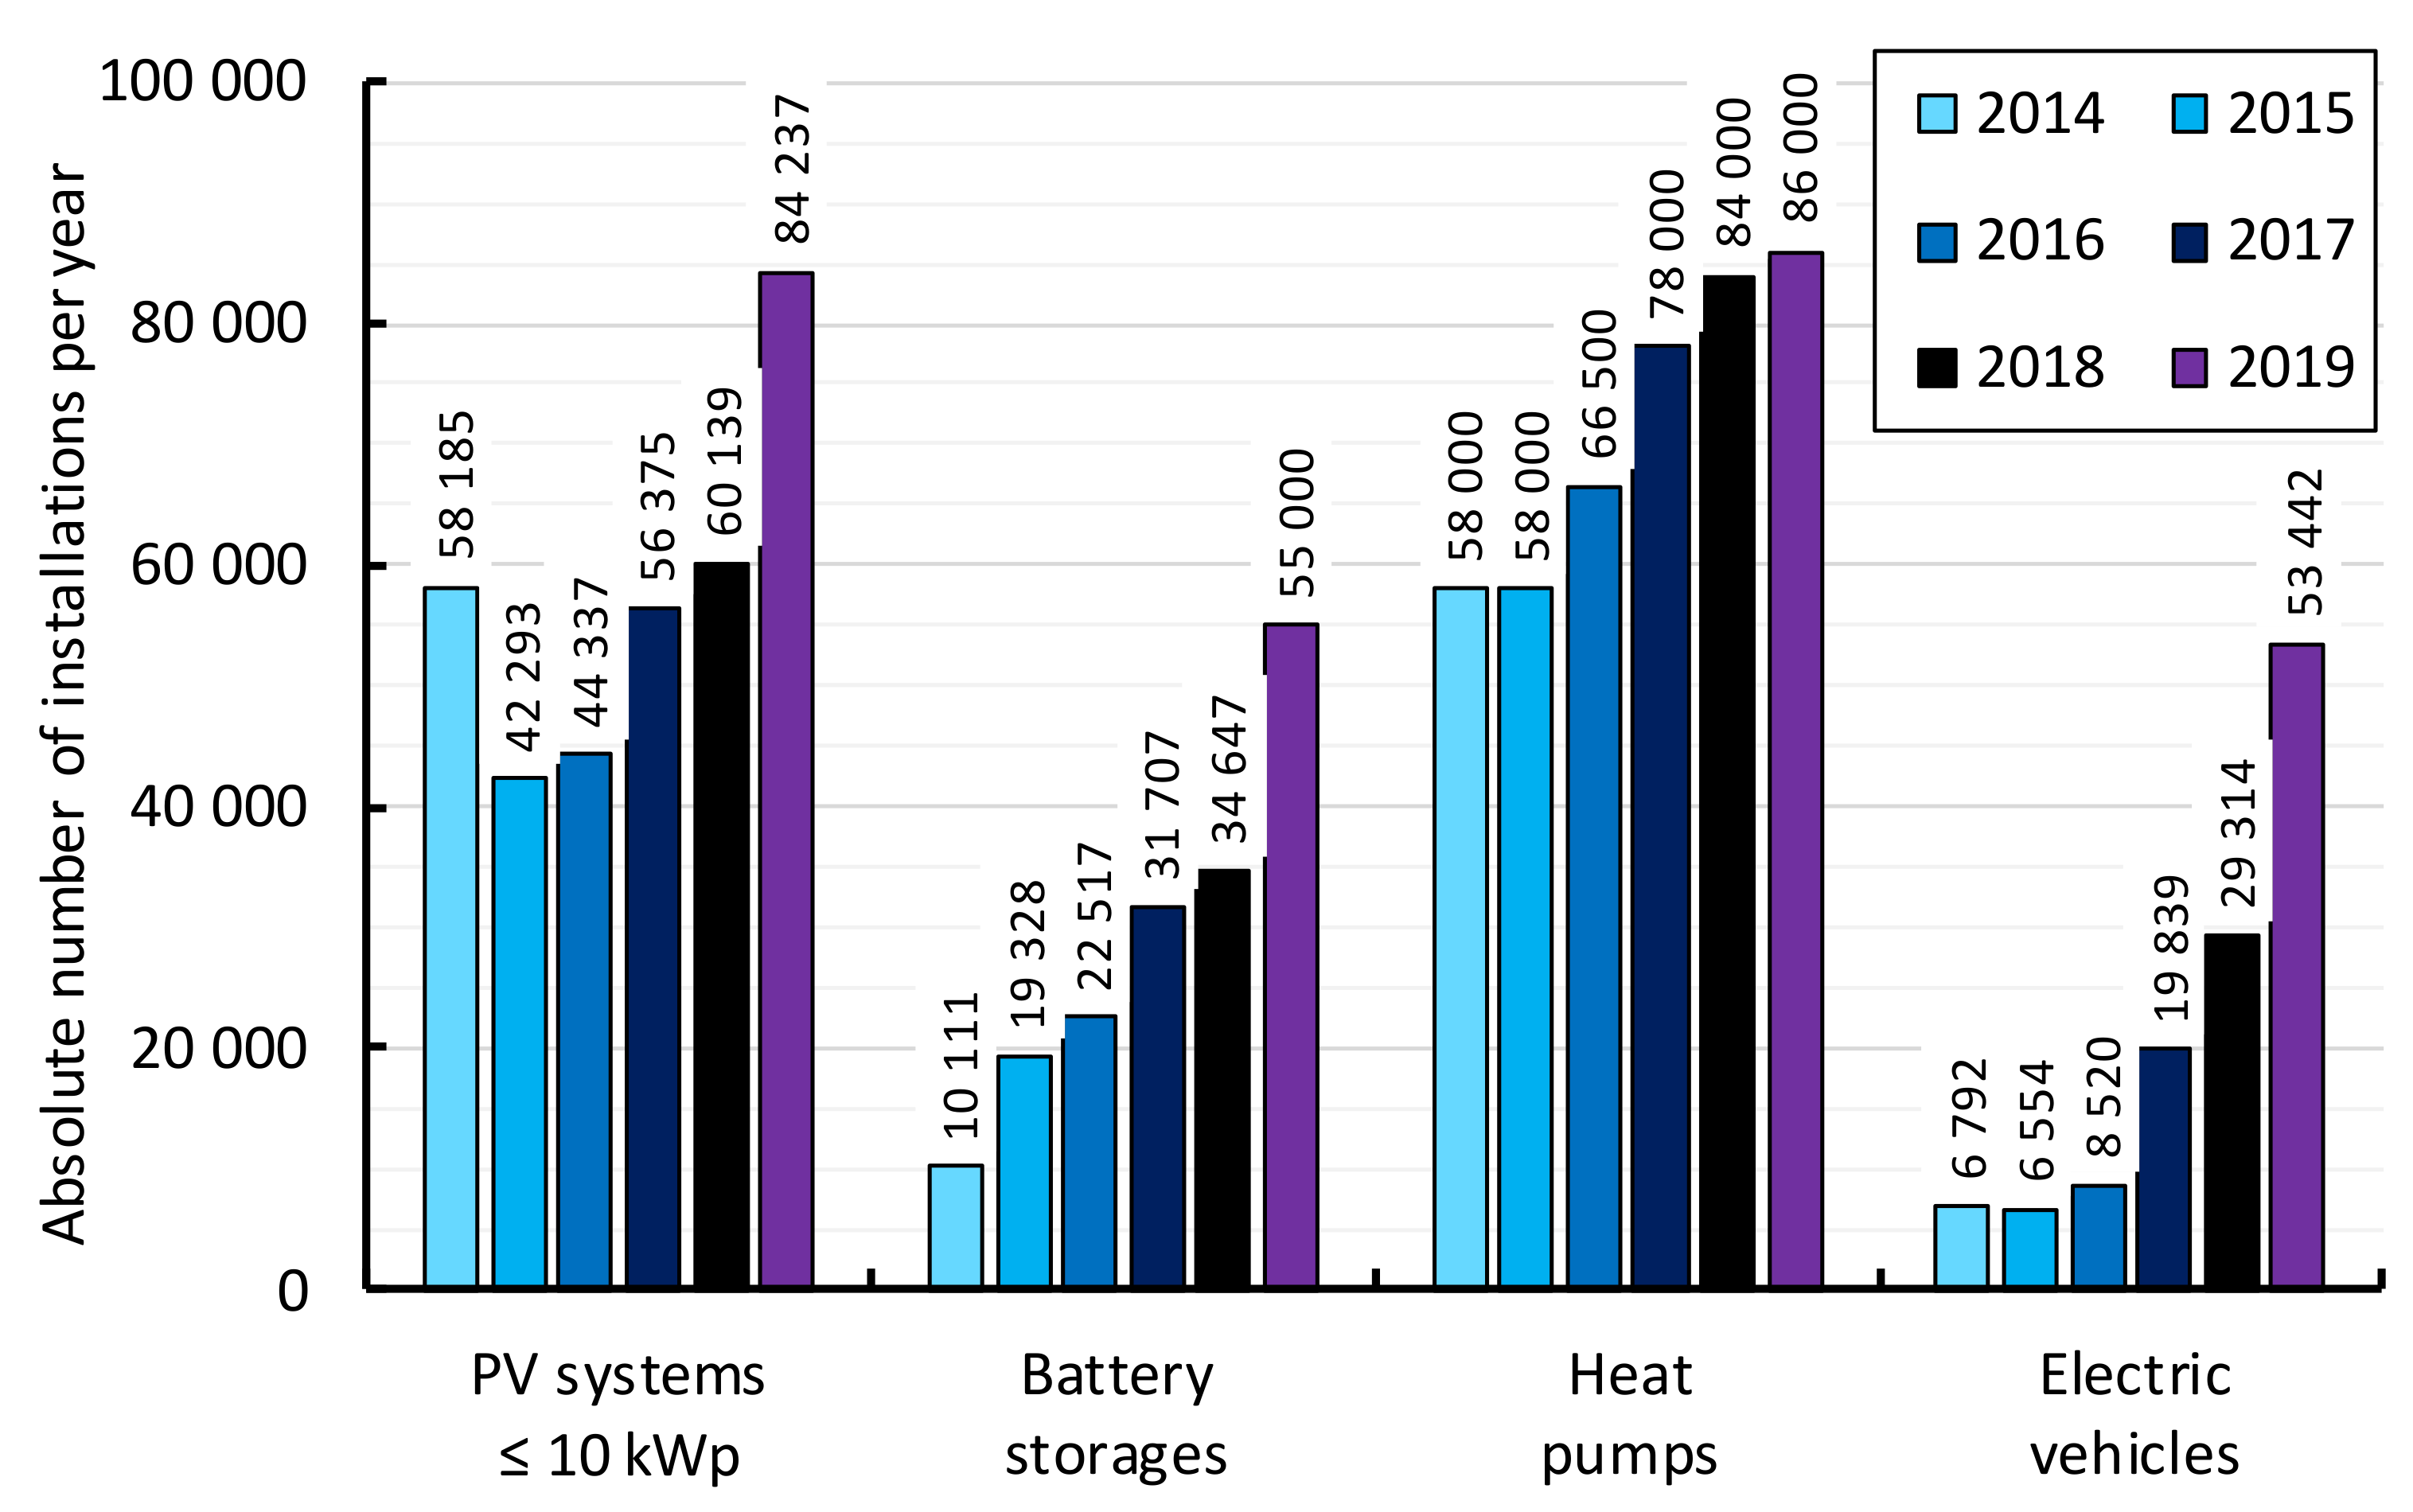
Due to the low energy density of RE as solar or wind power, the generation needs to spread into the plain calling for small distributed generation especially by photovoltaics (PV). Therefore it is expected, that the number of distributed installed generation and storage technologies, especially PV systems (PV) and battery storage (BS) will increase strongly. This expectation is supported by recent figures showing increased use of all this technologies already (
Figure 1). This means, that individual households (HH), living in single or multifamily houses, can integrate their heat and mobility demand resulting from electric heat pumps and battery electric vehicles (EV) with their local RE production by smart distributed energy systems.
First, the increasing number of distributed technologies as well as increased demand by electric heating and charging loads of EV results in a challenge for the distribution grid, e.g., inverted load flow and peaking loads. In contrast, the high degree of flexibility within the operation of these technologies allows for different operation strategies offering flexibility for the overall system or optimising different objectives for the individual household. Based on the number of EVs in
Figure 1 from 2014 to 2019, a flexibility potential of 0.46 GW and 4.43 GWh results for Germany, in case Volkswagen eGolf parameters are assumed as presented later. This potential is expected to grow in line with increasing EV fleet dramatically in the future. In Germany vehicles remain parked on average 16 h per day without a preceding or following trip [
7]. To exploit this energetic and temporal flexibility and enable optimum system integration, a smart charging control is required.
This smart control system simultaneously enables the optimal utilization of the exploited flexibility. The criterion for optimization depends on the target to be achieved. We analyse in general two objectives, which for us appear to be the most relevant for the perspective of an individual HH:
The target is to achieve a power supply of the EV and the entire local energy system of the HH at minimum cost. The target function contains the total operation and purchase cost of the individual HH, including the cost of local power generation or purchase as well as detailed cost components like the cost of degradation of the different system components, as well as the refund for power fed into the grid.
This approach is proposed by several researchers discussed in
Section 2 recently, aiming for improving climate protection. The target value is derived from specific GHG factors of each hour of the entire power system, shifting demand to times with high RE production and therefore lower GHG emissions.
At this point, it could also be argued that ensuring the comfort of the local HH should be considered as an objective as well. However, as we assume that comfort of the HH is rather a basic requirement, it has to be met in any case. Therefore, it is integrated as a restriction being observed at any time. Focusing the charging processes of EV, it must be guaranteed that the charging level of the EV is always sufficient to meet the upcoming mobility demand of the HH.
Although it is an important issue for reaching overall targets of integrating high fractions of RE in the entire system and reducing GHG emissions, we have not analysed the optimal application of local flexibility for the entire system as a further control objective. However, the effects will be discussed later and an analysis can be provided by the same approaches shown in this paper.
Most of the work in literature on integration of EV charging covers two main topics: The first topic targets the effect of applying the flexibility of EV charging, most often of a fleet of EVs, on the optimal system integration in the entire energy system. As a second topic, the effects of controlled vs. uncontrolled EV charging processes are compared, again from the perspective of the overall energy system integration. To our knowledge, there is just little publication focusing on the minimum charging cost of electric vehicles in a distributed energy system in combination with the minimisation of the locally assigned GHG emissions. In our opinion, these two objectives represent the owners basic motivation for the purchase and usage of EVs. Therefore, our approach aims at the optimising of the corresponding charging processes regarding these two objectives. However, the assumed cost components can certainly not yet be realised at all at the moment, but it is expected, that with increasing awareness of distributed energy systems and their flexibility, the regulatory framework will change in a likewise way. There is evidence already that individual households are aware of GHG effects and show a willingness to pay for GHG reduction as they contract green electricity tariffs. Therefore, we assume that the issue analysed is relevant for implementation in the real world.
The paper is organised as follows: We first provide an overview of related publications with a special focus on EV charging strategies for distributed energy systems in
Section 2. Following, we present our approach to optimise these charging processes in a cost- and simultaneously GHG emission minimum way in
Section 3. Then we developed three different smart charging strategies and, as a benchmark, a heuristic direct charging approach, which we apply to a representative individual HH with a distributed energy system. We describe this energy system as well as its interface to the entire system in more detail in
Section 4. In
Section 5, we present the results of the comparison of the three charging strategies with the heuristic direct charging approach. Hereby, we provide an overview of the resulting yearly cost savings and calculated emissions reductions of each charging strategy and discuss whether this achieves an effective reduction of the GHG emissions in the overall system. Finally, we summarize our key findings in
Section 6 and provide an outlook on further research issues.
2. Related Work on Smart Charging of Electric Vehicles
In the literature there is a huge number of publications focusing on smart charging of EVs: A detailed and comprehensive introduction to the topic of smart charging of EVs is given in [
8]. The authors show a large number of relevant publications and cluster them into different subcategories, but do not subdivide them according to the design of the charging process (uni- vs. bidirectional, static vs. mobility-aware, centralised vs. distributed) or the specific objective of the optimisation of the charging process (integration of REs, providing ancillary services). A deeper analysis of central charging control by an aggregator and distributed smart charging control, e.g., by the owner, is offered in [
9]. However, the comparison of the control approaches focuses exclusively on the charging of EVs: Other components involved in the distributed energy system of a household, such as battery storage or heat pumps are not considered, only a small outlook on the operation of EVs in virtual power plants or microgrids is given. The (information) technical integration of EVs is dealt with intensively in [
10]. In this context, the potential offered by smart charging processes is highlighted in particular, but no corresponding charging approaches are listed. Exemplary approaches to control the corresponding multitude of public EV charging processes while ensuring the distribution grid-side requirements are described in a highly detailed and comprehensive way in [
11,
12]. Reference [
13] classifies the benefits of system integrated EV charging processes into three categories: Improved technical grid efficiency, financial, for example for different stakeholders like the owner or the supplying utility, and socio-environmental benefits like the reduction of GHG emissions or an improved integration of renewable energies. These identified advantages show a strong alignment with our objectives, but are not applied as objectives for charging control. In conclusion, we can classify our smart charging approach according to this categorisation as a distributed, unidirectional and mobility-oriented charging strategy.
Following this overview of different publications on the classification of the smart integration of electric vehicles, we want to take a closer look at the charging strategies reported in literature aiming in particular at minimising costs and GHG emissions. The approach in [
14], comparable to our approach, intends to minimise costs as well as the GHG emissions of the charging processes, although these are centrally managed by the distribution system operator (DSO). The advantage is the immediate knowledge of the DSO about the feed-in of volatile renewable energies, in this case the local wind power production, which leads to it being maximally expoited for the charging of the EVs. However, with regard to the regulatory requirements of unbundling, such a scenario is difficult to realise under market conditions. An extensive comparison between conventional and electric vehicles is provided by [
15], but from the perspective of the overall energy system. With regard to EV charging, however, two simple charging strategies, uncoordinated and off-peak charging, are considered only. A similar approach is pursued by the main focus on smoothing the peaks of the load of a multitude of EVs [
16,
17]. An interesting approach to estimate the reduction of emissions by smart charging of EVs is reported in [
18], in which a centrally managed charging strategy is compared to a distributed charging strategy with a focus on the California electric grid. In this case, first the residual load, i.e., the absolute load minus the generation based on RE, is considered. The charging of the EVs is then determined and, in conjunction with the residual load, the conventional generation is scheduled to compare the benefits by means of the investigated emissions of CO
2 and NO
x, power plant requirements and levelized cost of electricity. At this point we can state that a large part of the relevant publications evaluates and optimises the charging processes from the overall energy perspective. However, since we focus on the optimization of distributed charging processes at the household level, we will discuss recent charging approaches from the perspective of an individual household.
This focus is rather described in other papers: A detailed analysis of the effects of three charging strategies (direct charging, uni- and bidirectional charging) on different user groups with varying driving profiles is carried out in [
19]. This analysis though, focuses on the costs of the loading processes only and does not consider any further objectives. In contrast, the GHG emissions of the charging process are minimized in [
20] applying a regional specific marginal emission factor and in [
21] considering probabilistic input data. Another possibility for GHG emission-minimised charging of EVs is given in [
22]. Here, emission factors are predicted for the potential charging time of the EV and the points of time with the lowest emission factors are chosen for the charging.
In [
23] two different charging strategies are investigated to achieve a maximum consumption of locally produced PV energy: A heuristic rule-based strategy examines the charging process, whether there is a surplus of PV energy or whether the state of charge falls below a required amount. The influence of four different emission factors as input variables for GHG emission minimization using the example of battery storage systems in industrial plants is intensively analysed in [
24]. The optimisation of the battery storage dispatch is executed in two steps: First, the cost-optimum capacity and dispatch of the battery storage is identified. Then, this dispatch is redefined to the most climate friendly way.
3. Methodology
To optimize the EV charging process, we apply the optimisation model E2M2_DES. Here, we present the general structure of the model with a special focus on the modelling of electric mobility. We then continue to explain the different charging strategies in order to quantify the potential of EV charging processes in more detail and allow for the comparison of the different strategies. We hereby intentionally refer to the term charging strategy instead of charging control because we only investigate a theoretical charging process. Focusing a real charging process, deviations of our calculated charging schedule occur: First, they result from the simplification of our modelling approach. Second, we assume a perfect foresight over the investigated energy system which in reality will never be attained.
3.1. The General Optimisation Model E2M2_DES
The optimization model E2M2_DES represents a mixed-integer linear programming (MILP) optimisation model formulated by GAMS minimising energy cost for a defined energy system by computing optimum schedules for its technologies. We have already introduced the model in [
25] for application to the heat supply of a single family household by a heat pump system. For the following analysis, we enhanced its functionalities, especially regarding its applicability to optimize EV charging processes and to consider different price incentives and GHG emission targets, which we will present in more detail below.
3.1.1. Objective Function
Applying the model for the optimum operation of a distributed energy system, we introduced the following objective function to minimise the total cost
VCostTotal of all technologies
TEC of the energy system over all time steps
as:
with:
Since the local energy system of the HH operates a PV generation which has not got any variable cost nor GHG emissions, we will focus on the cost of the power purchase and its GHG emissions in particular. We describe their evaluation in more detail in the following.
To cope with such different tariff structures in one modelling approach we apply time-specific energy purchase cost
COSTElecPurch,t. Therefore
VC,ElecPurch,t results per time step
t as:
with:
This parameter
COSTElecPurch,t
enables us to depict a constant or a time-dynamic electricity tariff. To minimise the GHG emissions of the energy system as well, we assign cost to them by:
with:
This term can be understood as a penalty term and increases influence especially in case of a high choice of the CO2-price, as CO2-costs are generally minimised.
3.1.2. Restrictions
To meet the electrical demand of the HH and to charge the EV, we define appropriate constraints to ensure the basic physical properties of the technical components. The electrical balance equation is therefore given for each time step
t as
with:
An electrical energy storage unit is included in this general formulation as it can either be a consumer of power (charging of the storage unit) or a generator of power (discharging of the storage unit) per time step t.
The charging of the EV is also modelled as an electrical storage unit. However, as we focus on unilateral charging only, it cannot be discharged. For accounting the availability of the EV at the charging point, a binary time series AVAILEV,t is introduced. The availability of the EV is derived from the individual trips per day presented in the following section. If the EV undergoes such a trip, the value 0 is assumed for AVAILEV,t, otherwise 1 for the respective time step t.
The balance equation for the EV for each time step
t result as
3.1.3. Application of the Optimisation Model
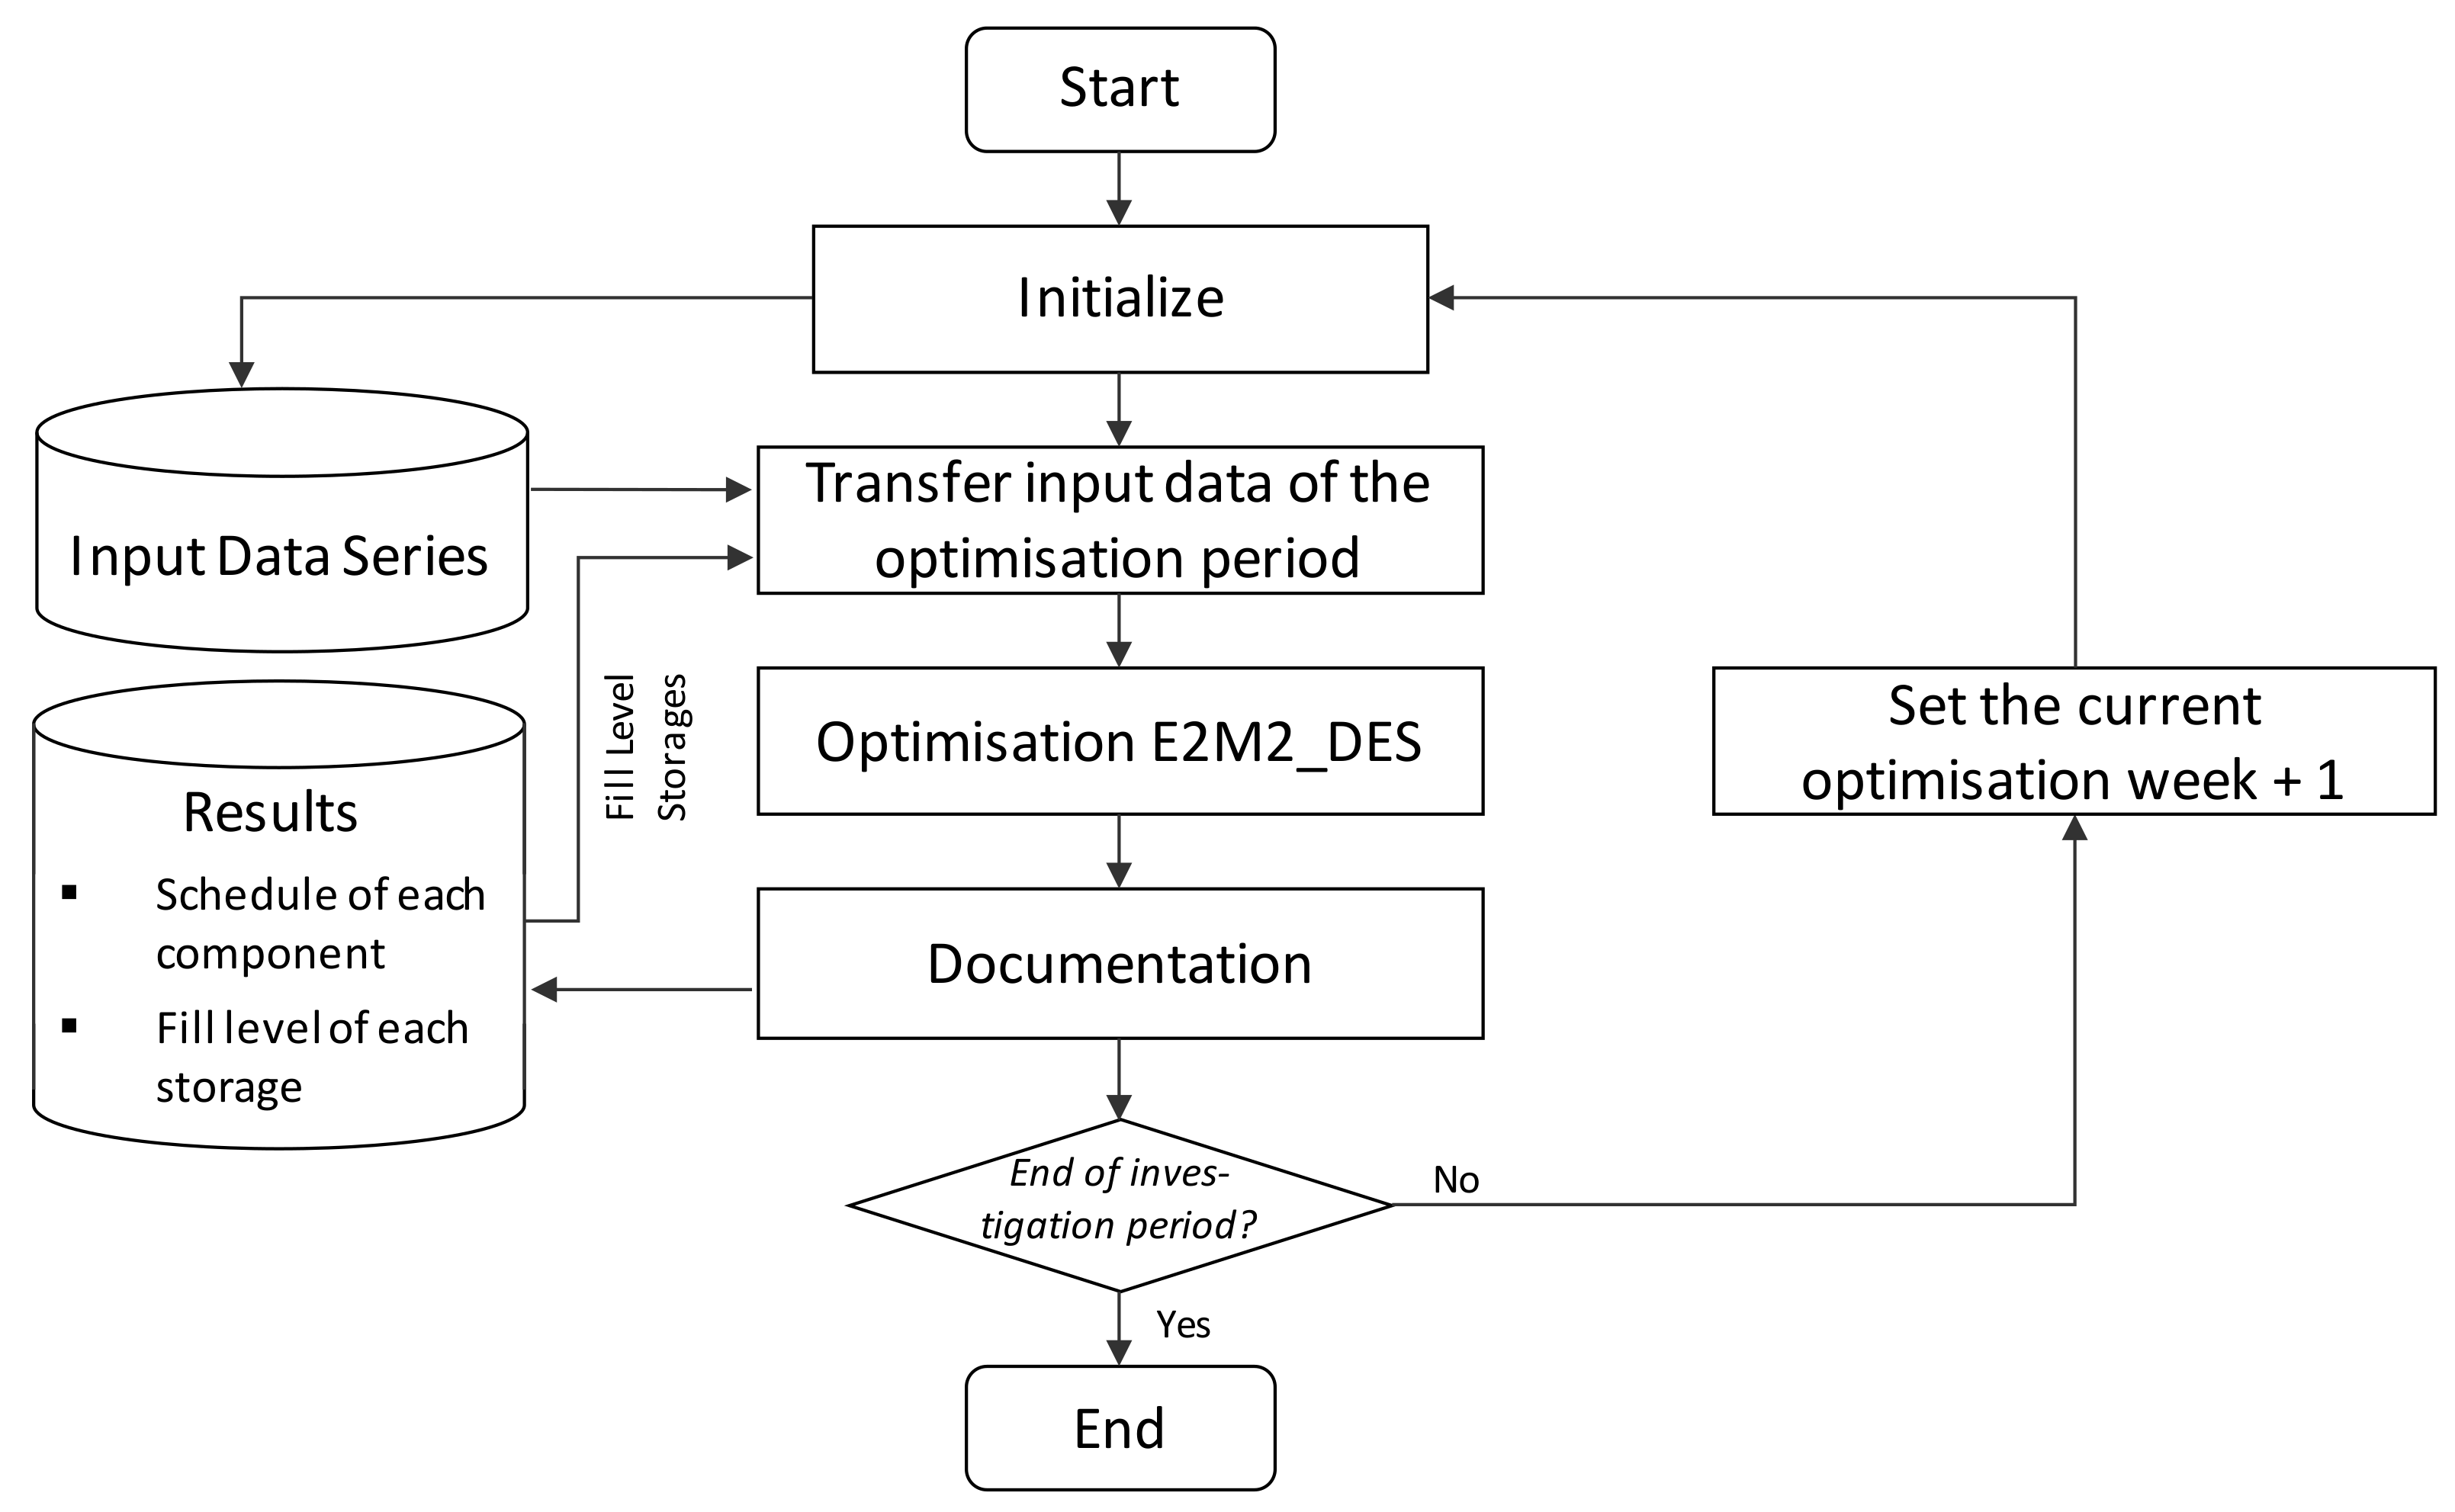
Aiming for the optimum schedule of the different components of the energy system, the schedule for the charging of the EV as well as the schedule for the charging and discharging of the local battery storage are determined. As input for these schedules, we assume perfect information about the required parameter time series we mentioned above. Applying this information, we calculate the optimum schedule for the defined control period by the Cplex optimizer.
In the following, we analyse the charging of the EV over the investigation period of one year. With regard to the computing time of the optimisation problem, we execute a rolling time horizon approach with a time period of one week as optimisation period. This seems adequate, as the utilisation of the EV mainly exhibits daily and weekly patterns and the capacity of the local battery storage is as small, that it cycles in this period already different times. The optimisation model repeatedly calculates the optimum schedule for each weekly period until the end of the investigation period is reached documenting each schedule (among other data). Since the optimisation model targets the minimum of the storage levels at the end of each optimisation period due to cost optimality, we apply an overlap of one day, i.e., we extend the optimisation period by one day which is cut off later in the documentation afterwards. After each model run for a certain week, the fill level of each storage is transferred as the new starting value for the next week. This process is described in more detail in
Figure 2.
The characteristics of the input variables vary depending on the charging strategy, e.g., with regard to the representation of a constant or dynamic electricity tariff. We will now present these different charging strategies in more detail in the following section.
3.2. Charging Strategies
To quantify the EV charging potential of a HH with local PV generation in more detail, we developed three different charging scenarios combined with appropriate charging strategies. All strategies are based on the previous presented optimisation model, but consider different targets and/or regulatory frameworks. These result are as follows:
- (1)
Charging strategy 1 (CS 1) considers a constant power purchase price at HH level and no GHG emissions effects of the grid purchase are taken into account, representing the typical regulatory framework in Germany at present.
- (2)
Charging strategy 2 (CS 2) assumes a dynamic power purchase price at HH level similar to the price at the power whole sale market, while GHG emissions will still not have to be remunerated and are therefore not considered in the optimisation.
- (3)
Charging strategy 3 (CS 3) continues to apply a dynamic power price at HH level and furthermore GHG emissions are to be minimised. Therefore, the price for COSTCO2Em,t is set at 1000 Euro/kWh constantly. This refers to the basic approach of multi-objective optimisation, where two objectives are combined in one objective function by applying weighting factors. The level of GHG price compared to power purchase prices corresponds to such a weighting factor and both objectives are optimised to a certain extent determined by this weighting.
As self-consumption of PV is not associated with variable cost and fed in remuneration is typically lower than power purchase prices at HH level, cost minimisation maximises self-consumption in each of the three scenarios. The scenario 3 was implemented to analyse the effect of including GHG reduction into the target function of the individual HH as this is proposed at present by some authors. However, there are two aspects to investigate: (1) we will analyse how much including such target leads to different charging schedules compared to scenario 1 and 2 and (2) whether it generates an effective GHG reduction effect in the overall system.
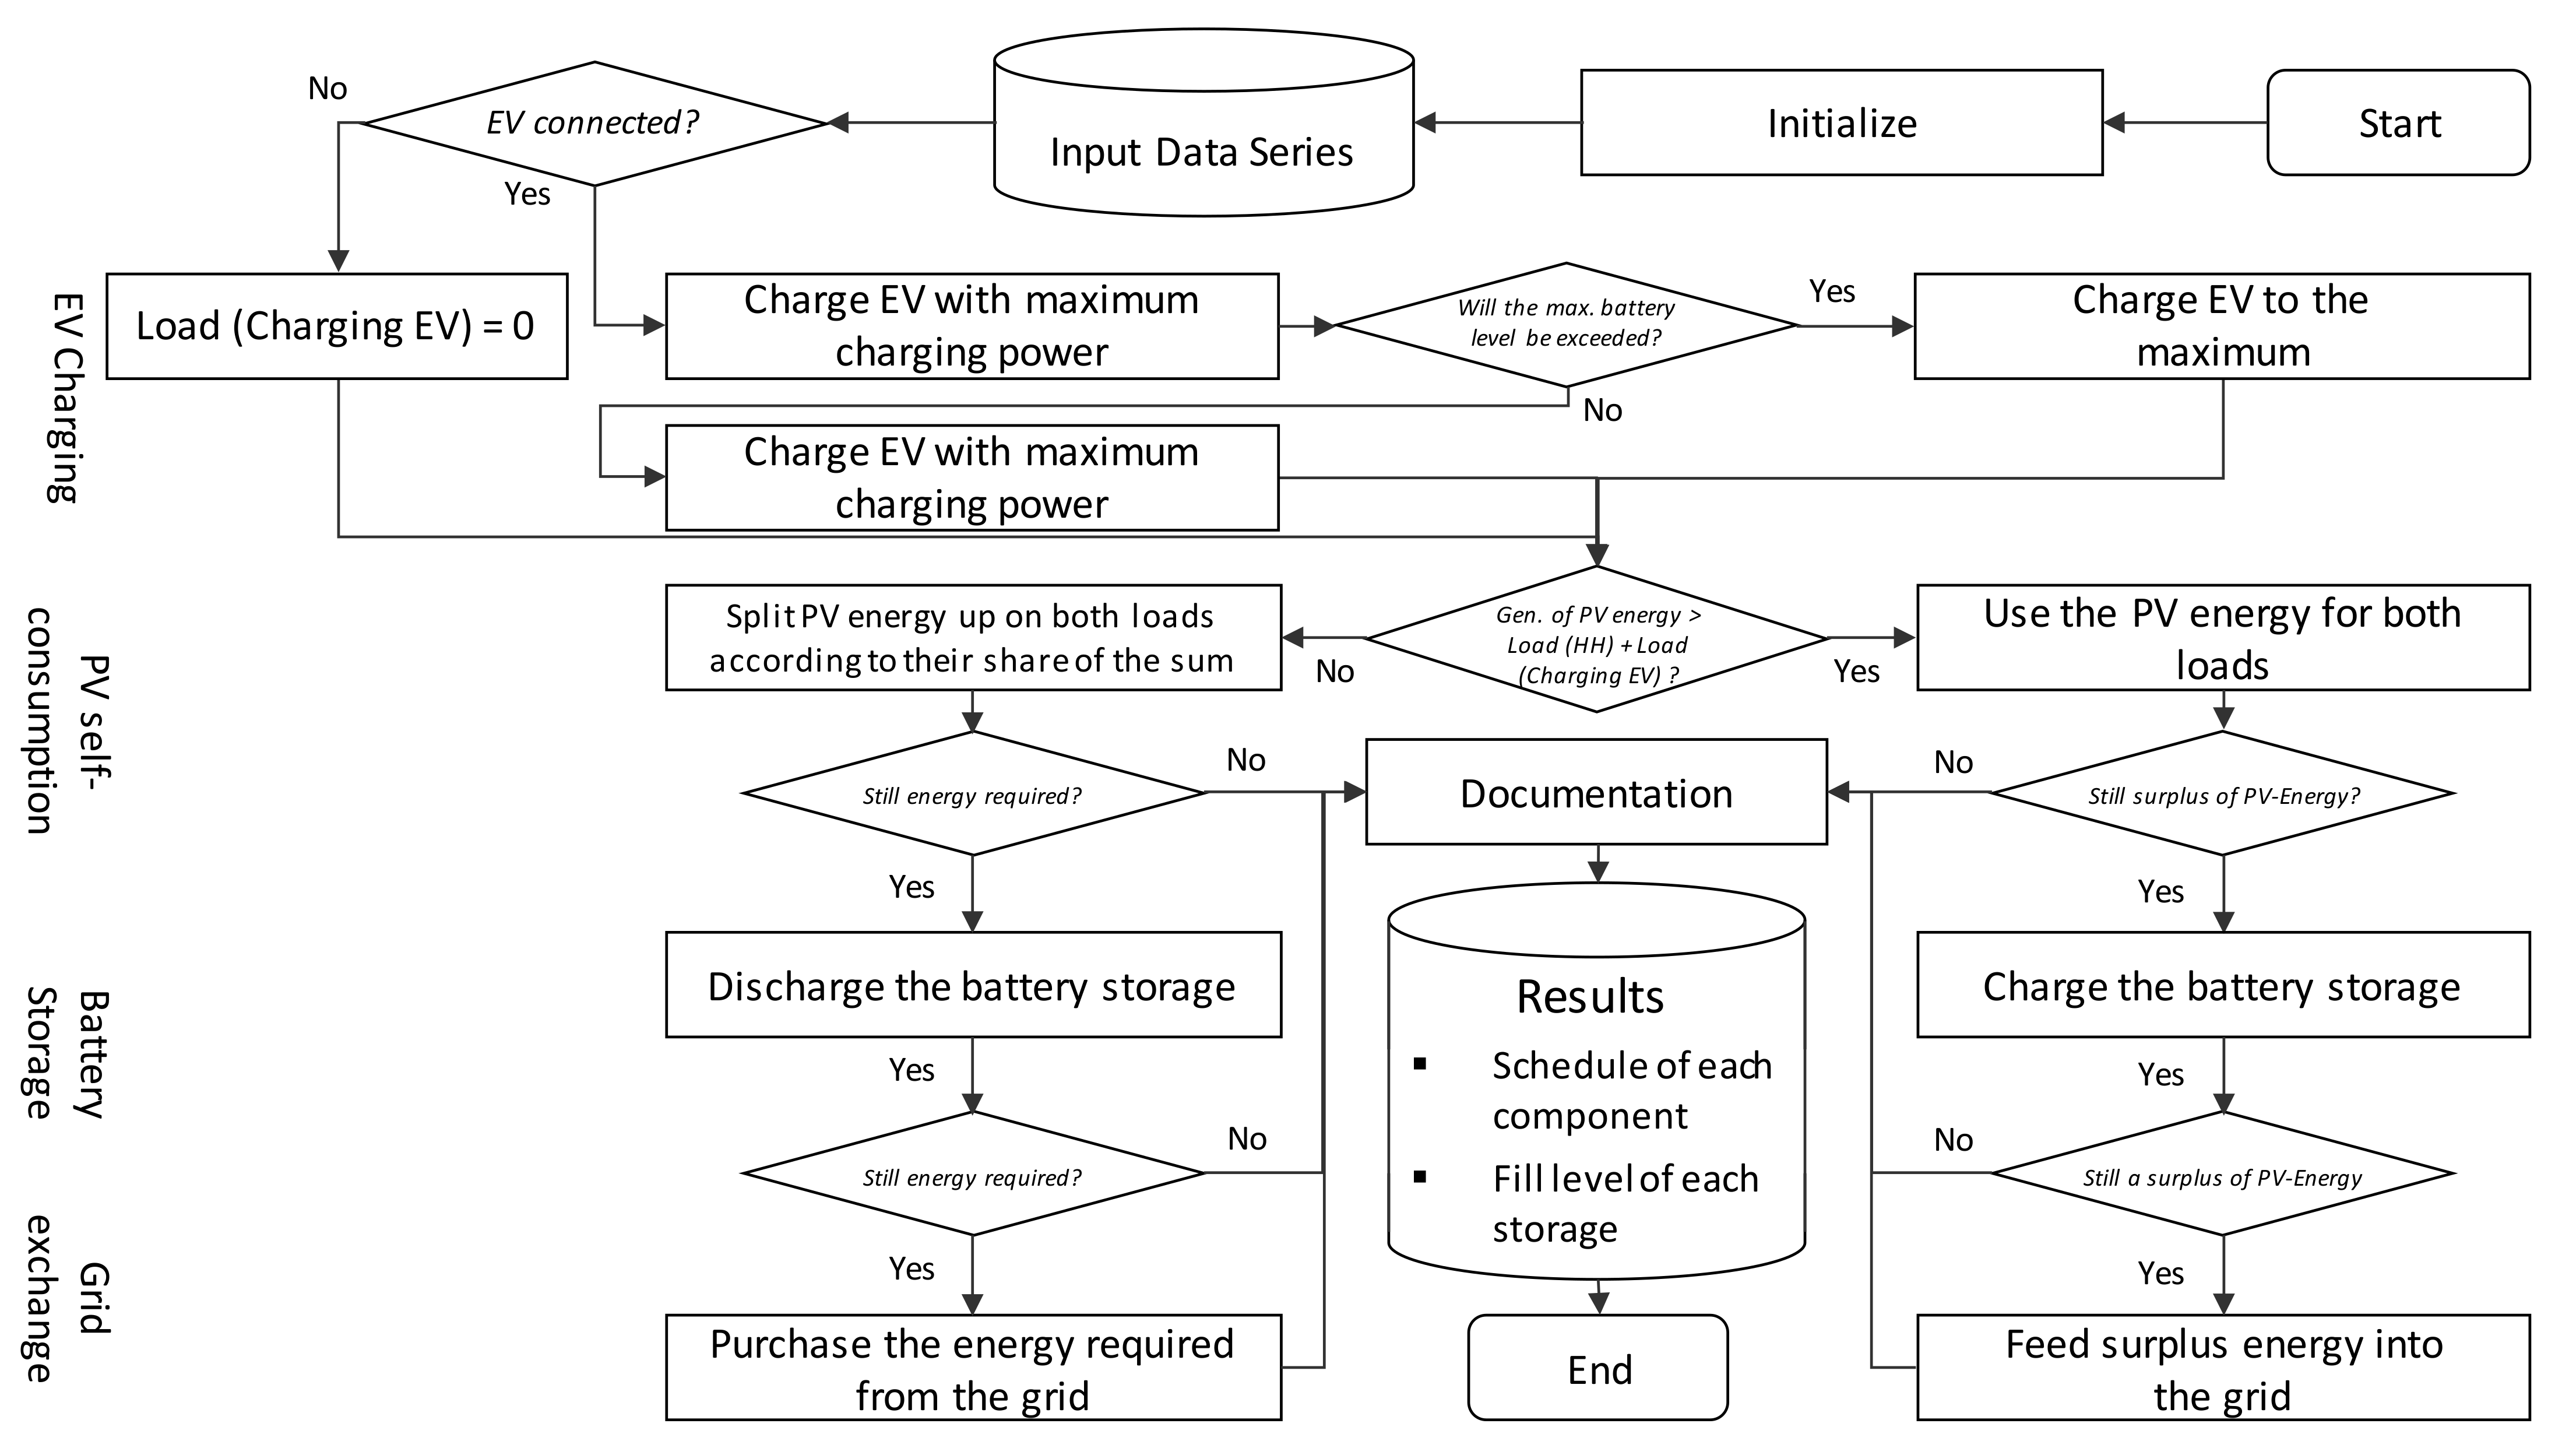
In order to get a better understanding of these three scenarios on the basis of an optimisation module, we have implemented as a 4th scenario an heuristic direct charging approach as a reference. This approach represents a simple rule-based charging strategy for each time step. Since each time step covers 15 min, we convert electrical energy with a factor of 60 min/15 min to power and vice versa. The rules for the heuristic approach are defined in the following. Since this algorithm only serves as a benchmark for the results of our optimum charging strategies, we have attached a detailed description in the form of a flowchart diagram in
Appendix A.
- (1)
Charging restrictions: If the EV is connected to the charging station, charge with the maximum charging power. If the maximum battery level is exceeded, charge the battery only up to the maximum level.
- (2)
PV self-consumption: If there is a surplus of power generated by the PV system, supply it to the power demand of the HH as well as the charging demand as far as possible. If there is not enough energy, split it on the demand of the HH and the EV charging demand according to their respective share.
- (3)
Self-consumption discharging batterie storage: If there is no local power production, discharge the power required from the battery storage as long as the fill level of the battery is sufficient.
- (4)
Grid purchase: If the available power is not adequate, purchase the remaining power from the grid.
- (5)
Charging batterie storage with PV surplus: If there is still a surplus of power generated by PV, while load of HH and EV charging is supplied, charge the batterie storage.
- (6)
Grid Feed-In: If this power exceeds the maximum charging power or the maximum capacity of the battery system, feed the surplus into the grid.
4. Investigated Local Energy System
Key for charging strategies is the energy system in which the charging process will be integrated. The presented charging strategies are evaluated by their application to a typical grid-connected single-family household with an electrical demand and a demand for mobility, equipped with a distributed generation system based on PV and a stationary battery storage. First, we present this energy system by its technical and economical characteristics in more detail. Afterwards, we take a closer look at the representative HH mobility profile. Finally, we describe the interface of the distributed energy system with the overall system, the purchase from and feed-in of power via the public grid.
4.1. Structure of the Local Energy System of the Indivdual Household
The behaviour of the HH characterises the profile of the power as well as the mobility demand. The latter is described by various EV trips while the power demand without EV charging is described by a typical HH profile. For supplying the required power demand, the local energy system consists of a PV plant, an electrical battery storage unit and a connection to the power grid enabling power purchase and feed-in. The specific values of the purchase costs and feed-in revenues are predefined for each scenario to enable the analysis of the effects of the pricing structure. Focusing on EV charging processes, we don’t consider a thermal demand in our investigation, leaving scope for future work.
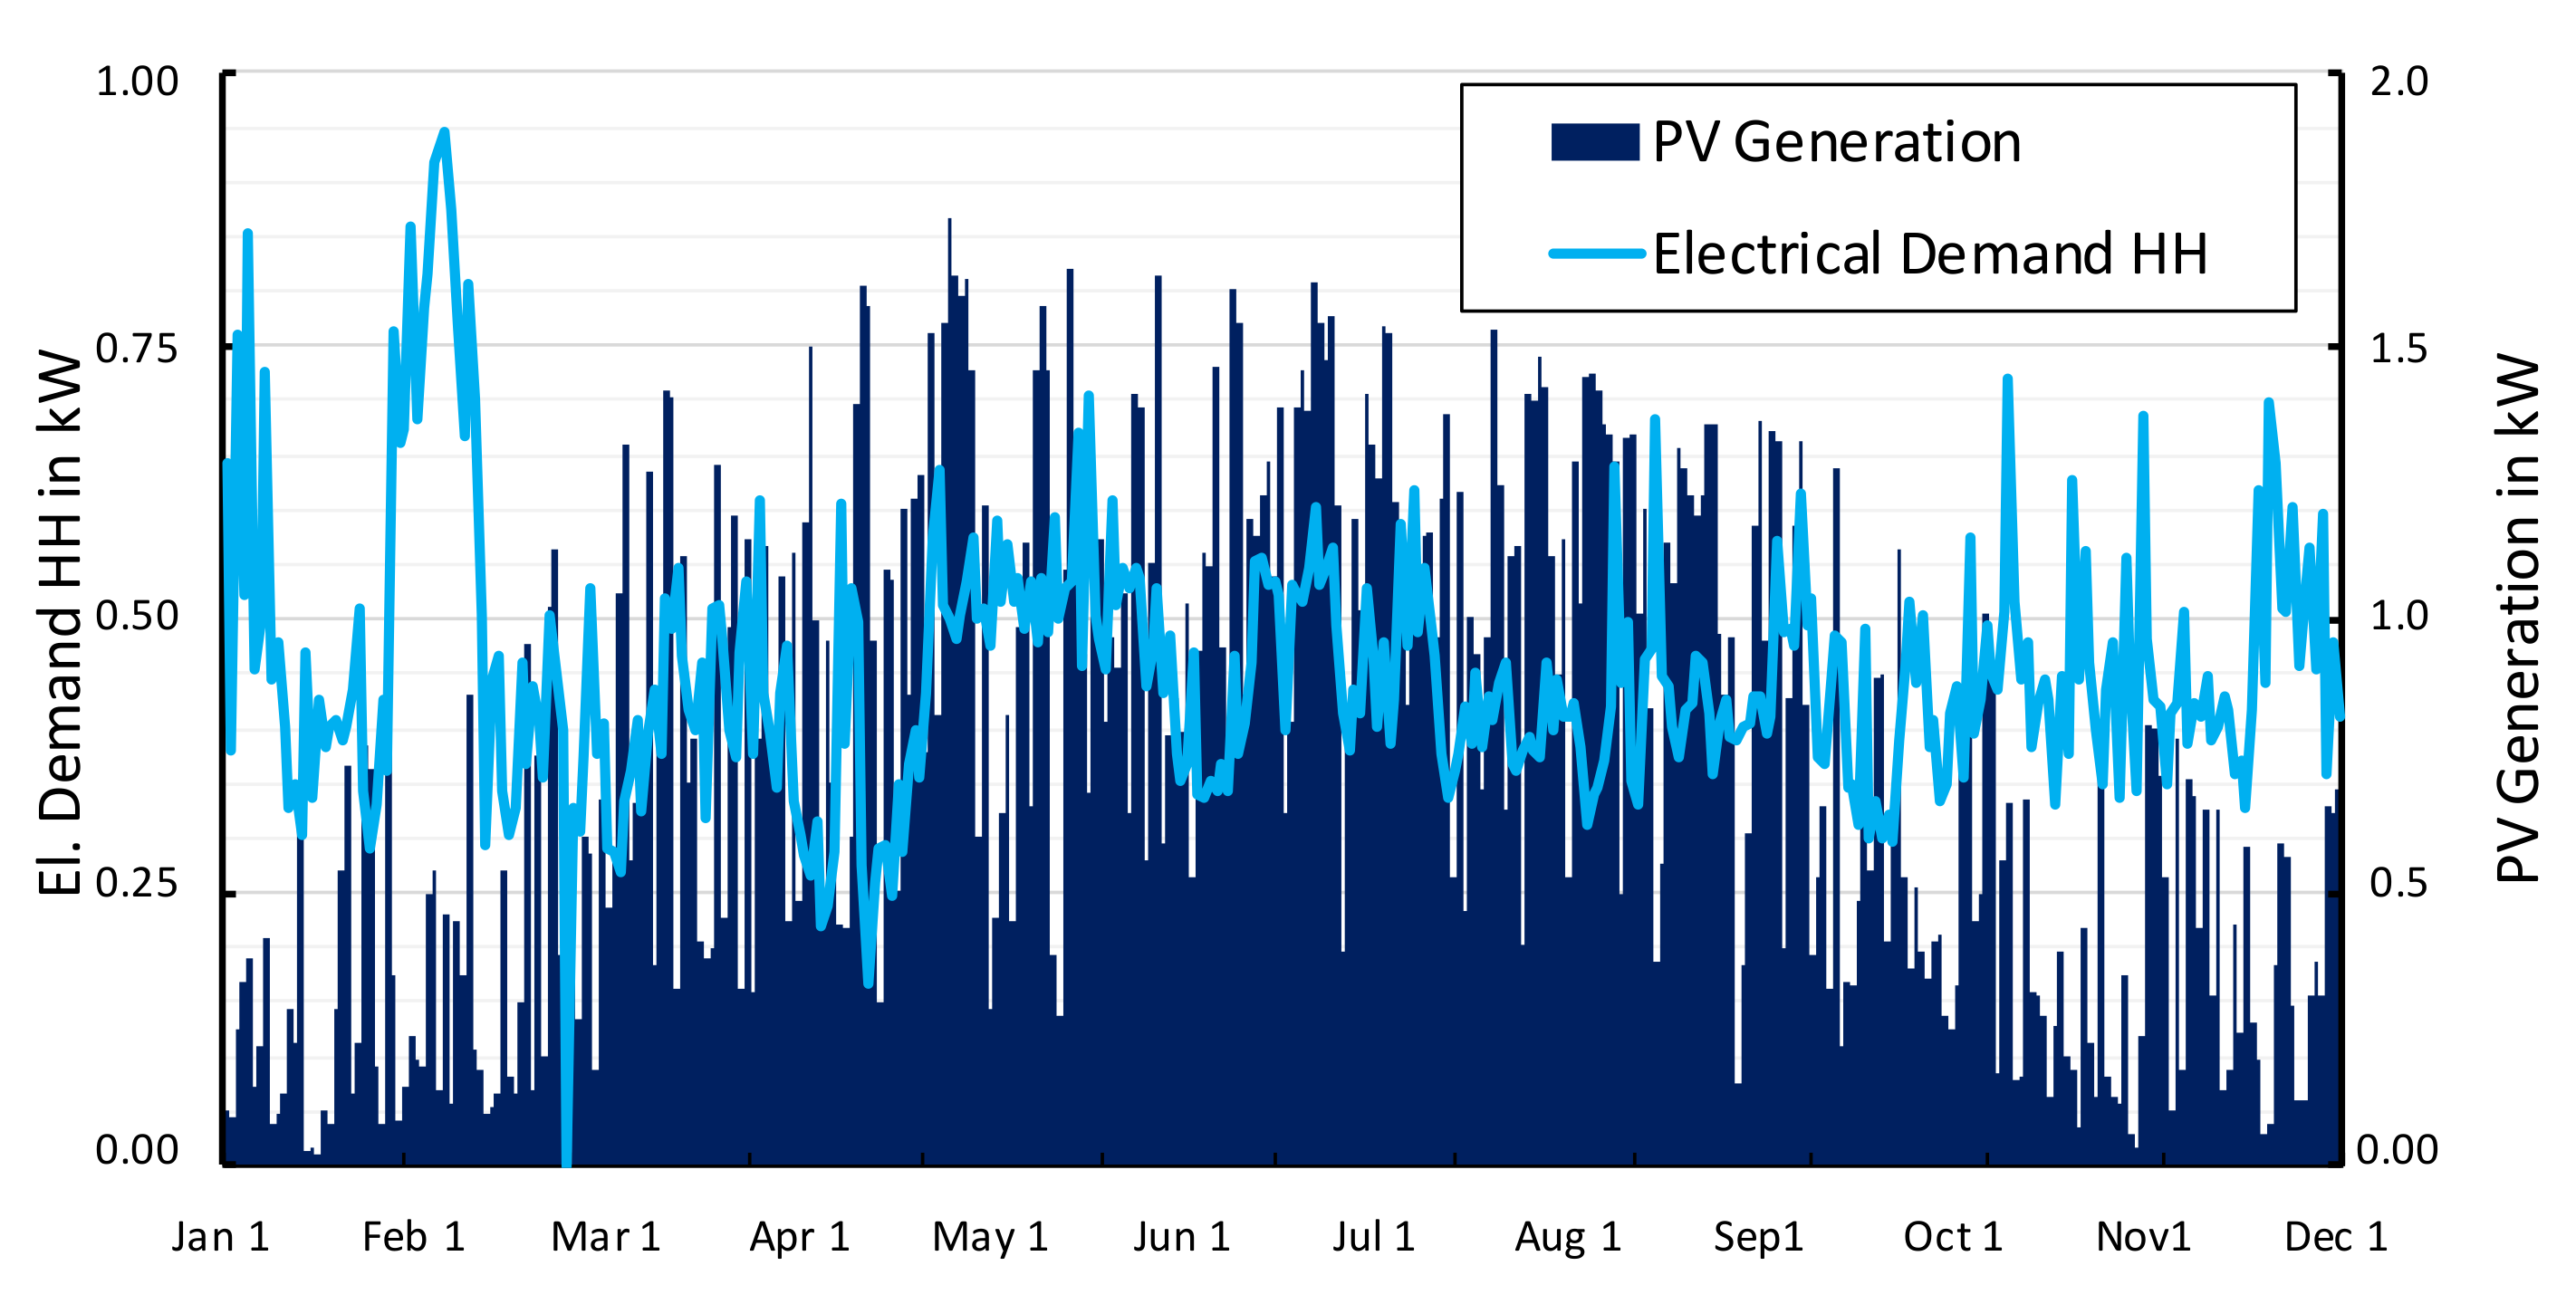
The electrical demand profile of the HH and the PV generation profile stems from real measured data, corresponding to [
25], presented in more detail in
Figure 3. Both profiles show a time resolution of 15 min, referring to relevant time intervals for billing and balancing in the German system.
The dimensioning of the stationary battery storage corresponds to the average installation of a solar power battery storage packs in Germany in 2018 [
2]. We have selected the e-Golf of Volkswagen as representative for the characteristics of the electric vehicle with a battery capacity of 35.8 kWh and an average EV power consumption of 15.8 kWh per 100 km [
26]. The choice of this battery size may at first seem rather small as more up to date models already offer higher battery capacities. However, regarding the subsequent optimisation for unidirectional charging, the optimisation model will charge at maximum the energy, required for the next journey only. With our focus on a representative household profile, which predominantly consists of short journeys in the local area, as opposed to, e.g., longer journeys taken on holiday, this battery size with a maximum range of around 237 km already proves to be sufficient, though higher capacity will offer increased flexibility to the user of the EV rather than different charging patterns. The local charging facility is a wallbox with 3.7 kW maximum power, analogous to [
27]. This is the minimum charging power you will find for sensible operation. However, as there is plenty of immobilisation time at home for the EV, even this power offers some flexibility already.
If higher charging power, like 11 kW, which seems to get the standard for charging at home, will be considered, the flexibility and therefore the advantage of an optimisation approach increases. In
Table 1, we sum up the specific technical and economical properties of the investigated local energy system.
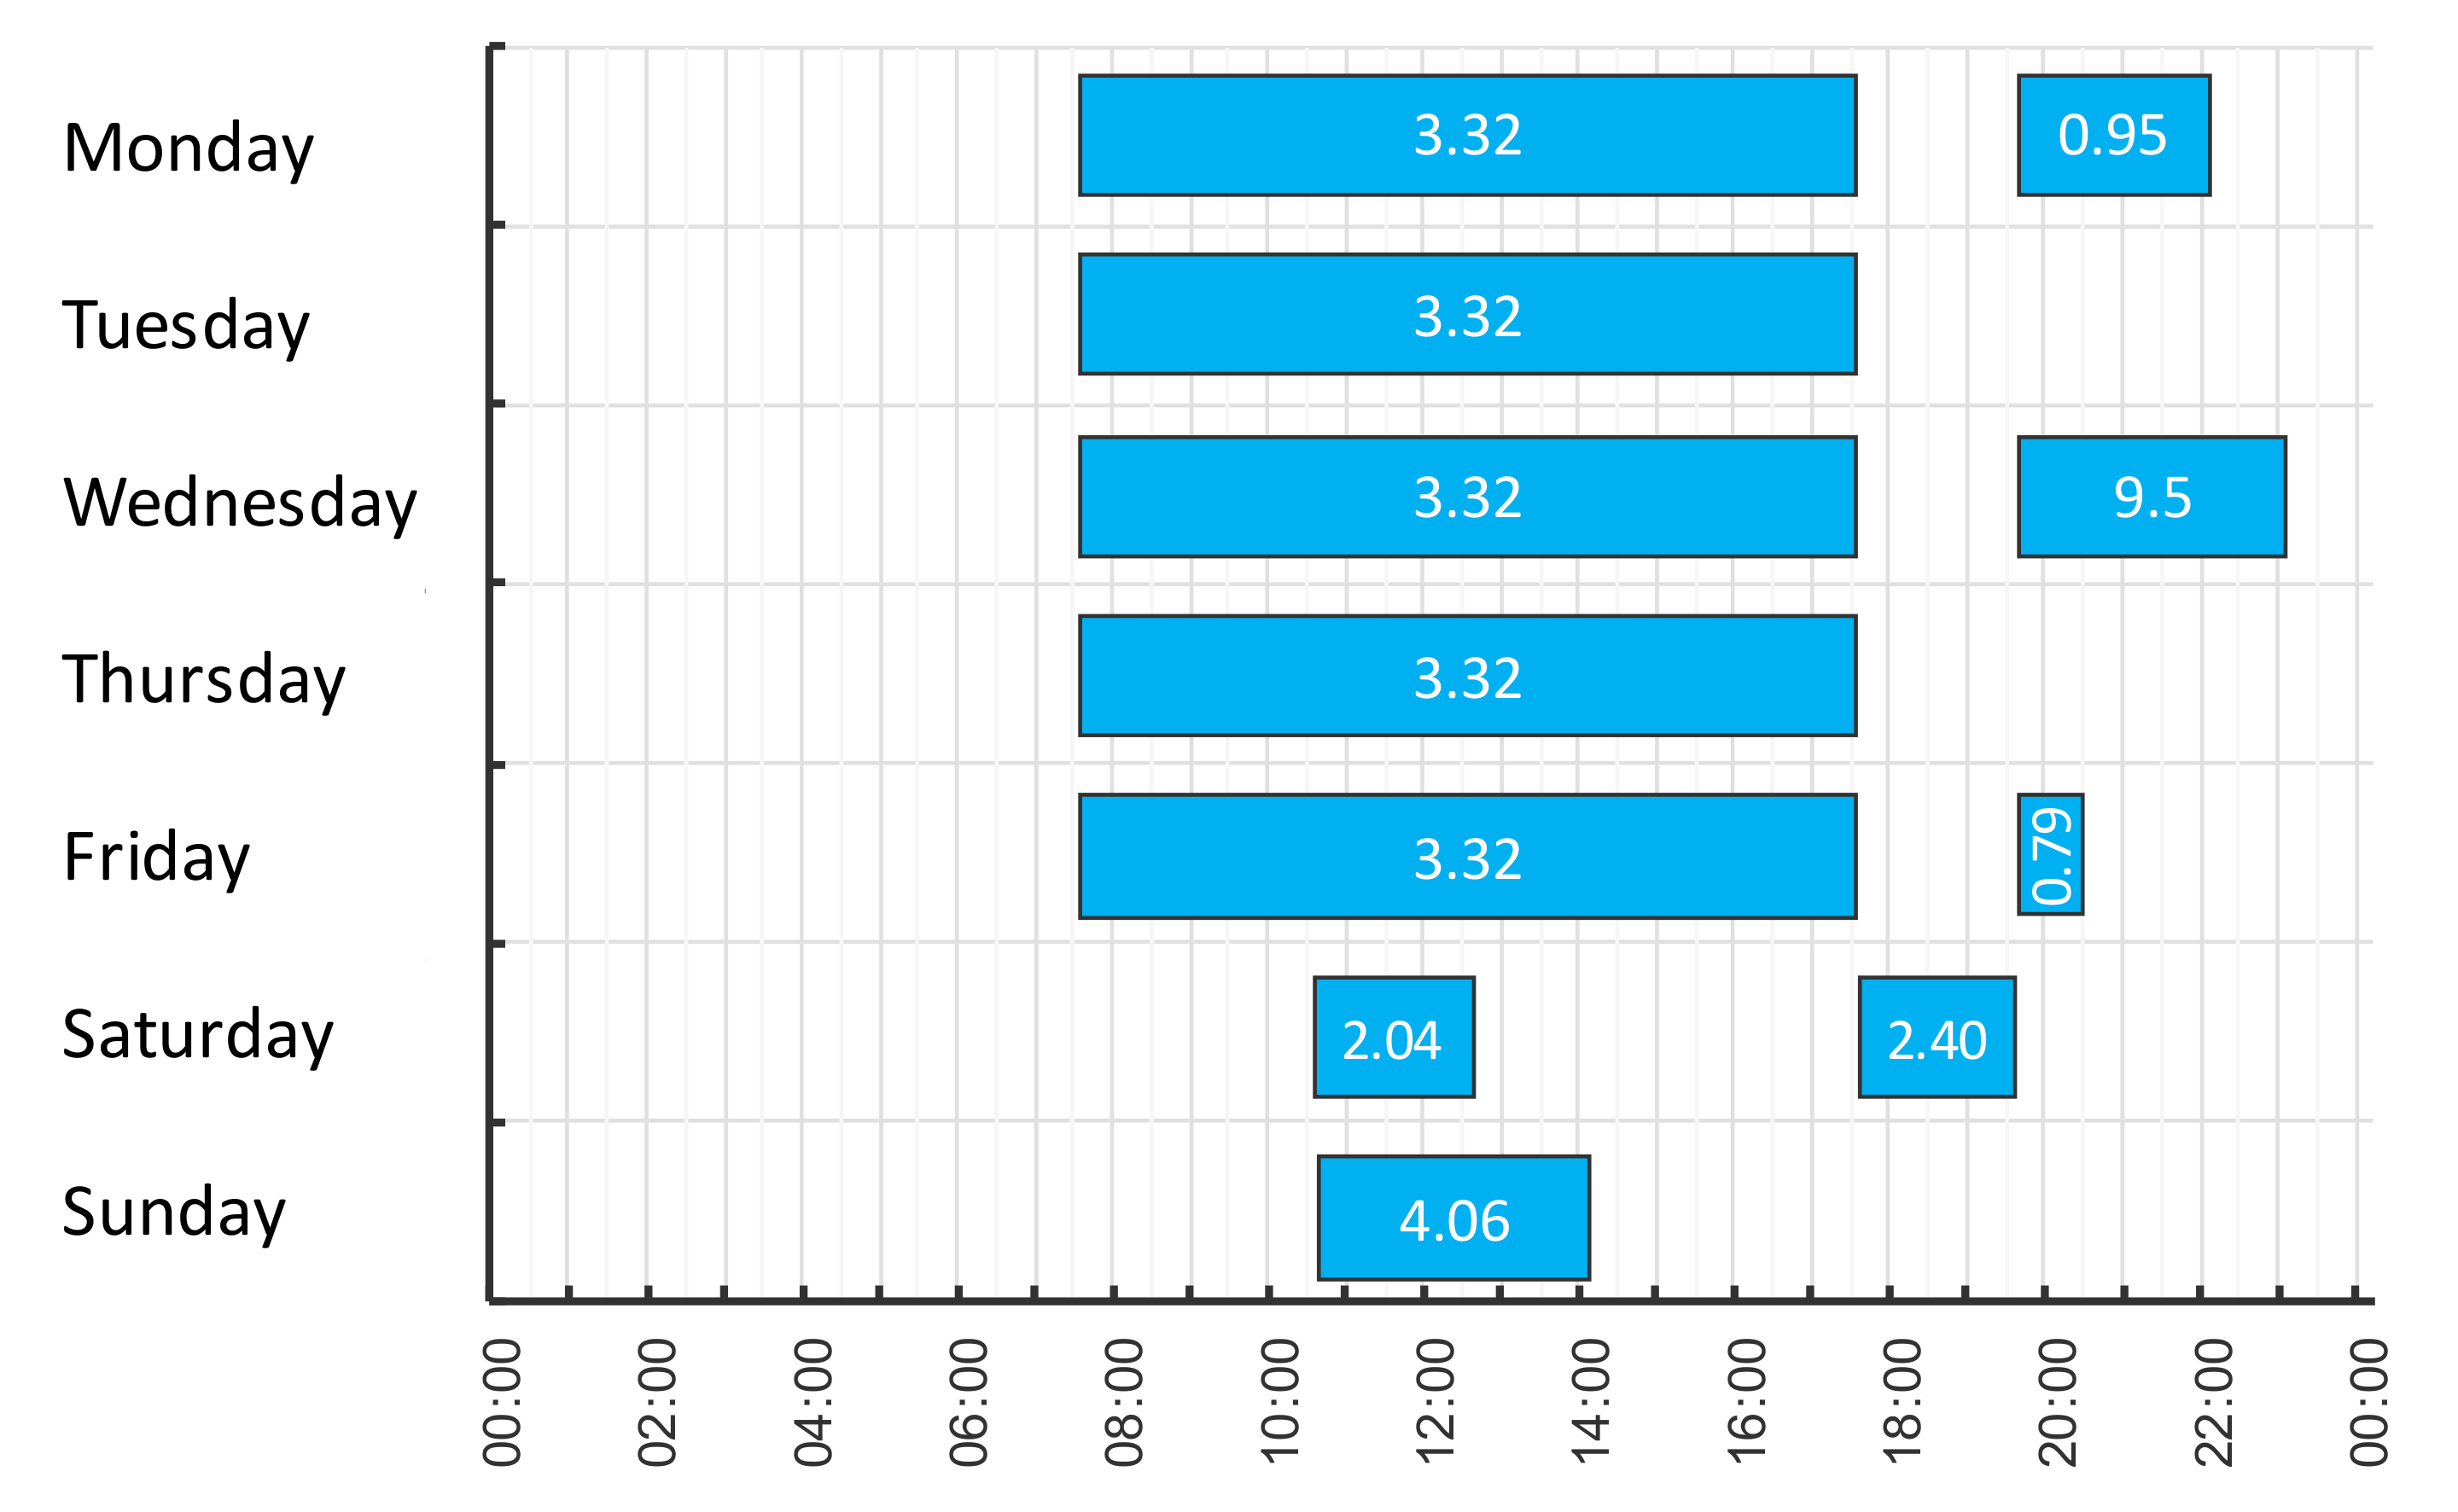
4.2. Mobility Profile of the Household
The mobility demand of the household results from the trips of the household on each day. We characterise those trips by two factors: First the time slot the EV is on the trip, it is not available for charging at home (
VEV,Avail = 0) and second the energy consumed by the trip in kWh.
Figure 4 displays the resulting mobility profile for a typical week.
Since empirical data were not available for the mobility demand, we synthesied this mobility demand considering individual trips. For this, we assume, that the EV user commutes to work every weekday like 77% of the working population in Germany. For most of the individuals surveyed, this commuting to work takes 30 min [
28].
A full-time employee stays an average of 41 h per week, i.e., 8.2 h per day at his place of work [
29]. The average distance of a trip to the workplace is 10.5 km per trip [
30].Beyond this information regarding the journeys to work, there is no further information available on other trips by individual verhicles for other purposes. Therefore, we assumed that the EV is used on Mondays, Wednesdays and Fridays in the evening in addition. On Mondays a short trip is assumed (6 km), on Wednesdays a longer trip (60 km) and on Fridays a short trip (5 km). These short trips represent e.g., smaller purchases on site, like a trip to a supermarket, the longer distance a trip to a neighbouring town. The EV usage during weekends is described in detail in [
31] for the average behaviour in Germany, from where we have deduced therefore two medium trips on Saturday (each 13 km) and one on Sunday (29 km).
4.3. Tariffs and Average GHG Emissions of Purchased Power
The interface to the overall energy system of our local energy system represents the connection to the power grid, where power can be purchased and fed-in due to defined tariff structures designed different for the different scenarios. This exchange of power via the public grid is connected on the one hand with costs or remunerations for the household and on the other hand with an impact of GHG emissions caused by change in generation in the overall system, which we allocate to the household by dynamic GHG emission factors of the power mix in a hourly time resolution.
Both parameters are derived by investigations of the project ENavi (part of the Kopernikus-projects funded by German Ministry for Education and Research (BMBF)) [
32]. In this project, the electricity market model E2M2 has been applied and validated to model historic generation of the German power market. The model results show the hourly merit order of the unit commitment in Germany. The corresponding results have been taken up in [
33], where the hourly GHG emissions have been investigated more closely. The model provides an annual hourly price for the power at the whole sale market and at the same time their average GHG emissions for each hour. Because [
33] provides both time series, we do not provide a more detailed description at this point. Instead, we now focus on how we have further utilized both parameters in the present study.
Focusing the purchase cost, we converted the hourly generation prices to a representative household’s power tariff. The German customer power price deviates significantly from the above mentioned whole sale price due to a large fraction of allocated taxes, duties and fees. The average power purchase price for a household in July 2020 amounts to 0.3171 Euro per kWh, whereby 52% is for taxes, duties and fees, 25% for grid fees (incl. measurement, metering point operation and billing) and 23% for procurement and sales [
34].
As for our purpose comparing different charging strategies and pricing structures for the end consumer the exact price is not relevant, we assumed the purchase of our HH to be 10 times the average generation cost of 30.84 EUR/MWh, i.e., 0.3094 EUR/kWh which approximates the purchase price for households mentioned above. For one scenario we applied this price as constant price for power purchases of our HH. In another scenario we used the modelled wholesale power prices of E2M2 model in an hourly resolution and multiplied each by 10 for gaining a purchase price for HHs as well. Though this does not comply with present German regulation, such ideas where proposed by some researchers, e.g., in [
19]. However, for the analysis reported in this work, this assumption is suitable, as we want to show the effect of dynamic pricing on charging strategies. We argue, that level of price differences will be relevant as well, but determining the minimum level of price fluctuation to gain impact is not in the scope of this work and left to future research.
With regard to the GHG emissions, the GHG emissions caused by our individual HH result from the households power purchase resulting from power generation in fossil plants. To keep analysis simple, we apply the pragmatic approach of considering a grid emission factor, e.g., analogous to [
22,
24]. However, we will discuss the validity and the impact of this approach later on in
Section 5.3.
In order to guarantee comparability and reproducibility, we need to consider the GHG emissions related to the production, installation and removal of our local energy system and its components, which do not change with the charging strategy. We have therefore assumed specific emissions of 50 g CO
2/kWh for the electricity from the PV system [
35].
In the literature, we could not find any specific emissions for the electricity from the battery storage, but only the absolut CO
2 emissions of 150–200 kg CO
2/kWh battery capacity, resulting from the production of the storage [
36]. Here, we have chosen the more pessimistic value of 200 kg CO
2/kWh in order not to underestimate the CO
2 emissions, which we allocated over the first 10 years by means of a linear amortization with the annual amount of electrical energy to be discharged. This results in specific CO
2 emissions per discharged electrical energy of 80.03 g CO
2/kWh.
5. Comparison of Charging Strategies
In this section we present the results of the application of the different analysed charging strategies to the described energy system. Therefore, we first give a qualitative comparison between two exemplary schedules, the one of the direct charging and the other one of the optimised schedule considering the energy purchase costs as well as the GHG emissions. We then compare the different charging strategies quantitatively due to the absolute annual energy procurement costs and the estimated induced GHG emissions. Finally, we discuss the results with regard to GHG emission reduction effects and dispute, whether the GHG reductions will impact on the overall system.
5.1. Simulation of the Charging Strategies
We applied all 3 charging strategies based on the optimisation model as well as the heuristic reference charging strategy on the previously described energy system over the period of one year. Each simulation produces a charging schedule for the EV in this process.
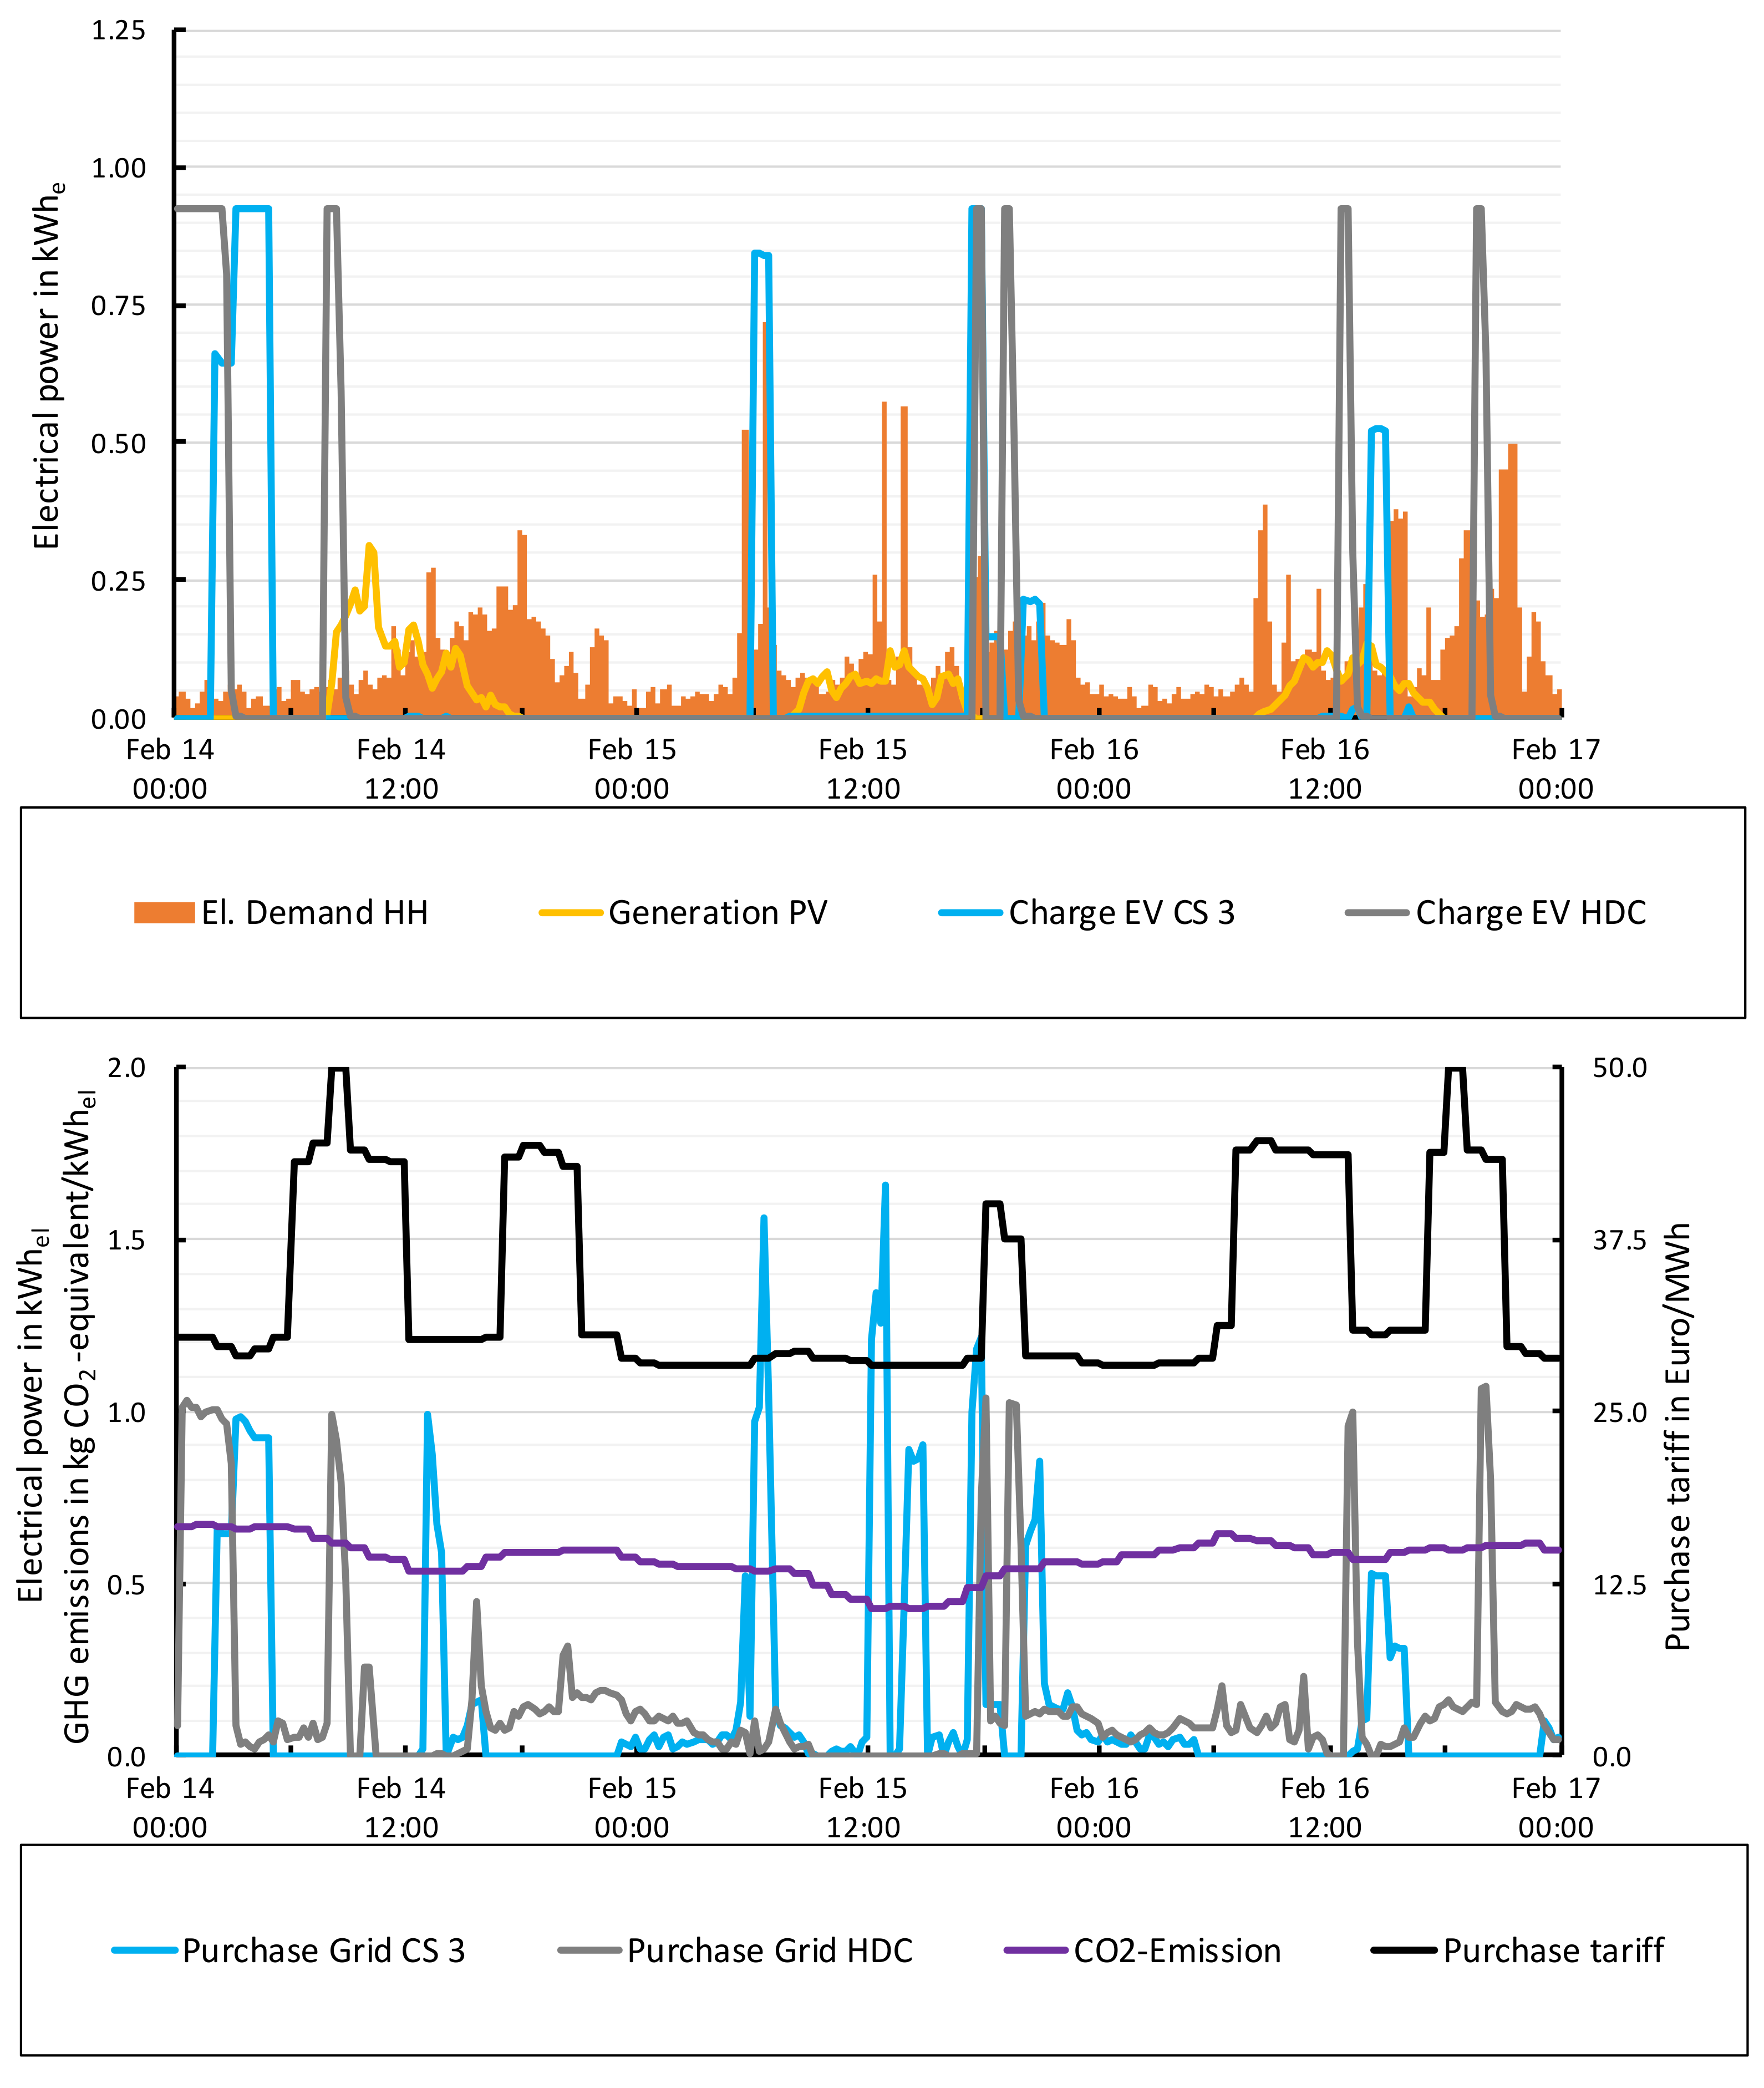
Figure 5 exemplarily shows the charging schedules of the heuristic charging scenario (HCS) as well as scenario 3 over the time of 3 days. For better analysis of the interdependencies in the local energy system, the feed-in or demand of the other components of the local energy system of the HH are shown as well.
In the Figure, it can be realised that there is no charging during the day except on the third day, though there is PV generation available as well as low purchase prices and low GHG emission factors. The reason for this is, that the EV is not connected to the charging station during daytime onthe other days. Comparing the light blue (CS 3) and the dark blue (HCS) line, it can be detected, that the charging in scenario 3 is moved to time slots offering low specific GHG emission factors. We see this for example in the morning of Feb 14th and in the afternoon of 16th February, where the optimisation of CS 3 selects times with lower GHG emissions and purchase prices for the charging process. Since GHG emissions are linked to very high prices of 1000 Euro/kg CO2, the objective of GHG emissions is preferred. This can be realised by the shifting of the schedule into a higher-priced period of purchase-power price but lower GHG emissions in the morning of 15th February, in order to reduce GHG emissions.
Compared to HCS the charging strategy CS3 prefers the target value of reducing GHG emissions compared to minimisation of purchase cost due to the high prices for GHG emissions chosen by this scenario. The HSC, in contrast, is completely insensitive to the PV electricity generated on site, the purchase costs and the GHG emissions as they are not implemented in the HSC approach.
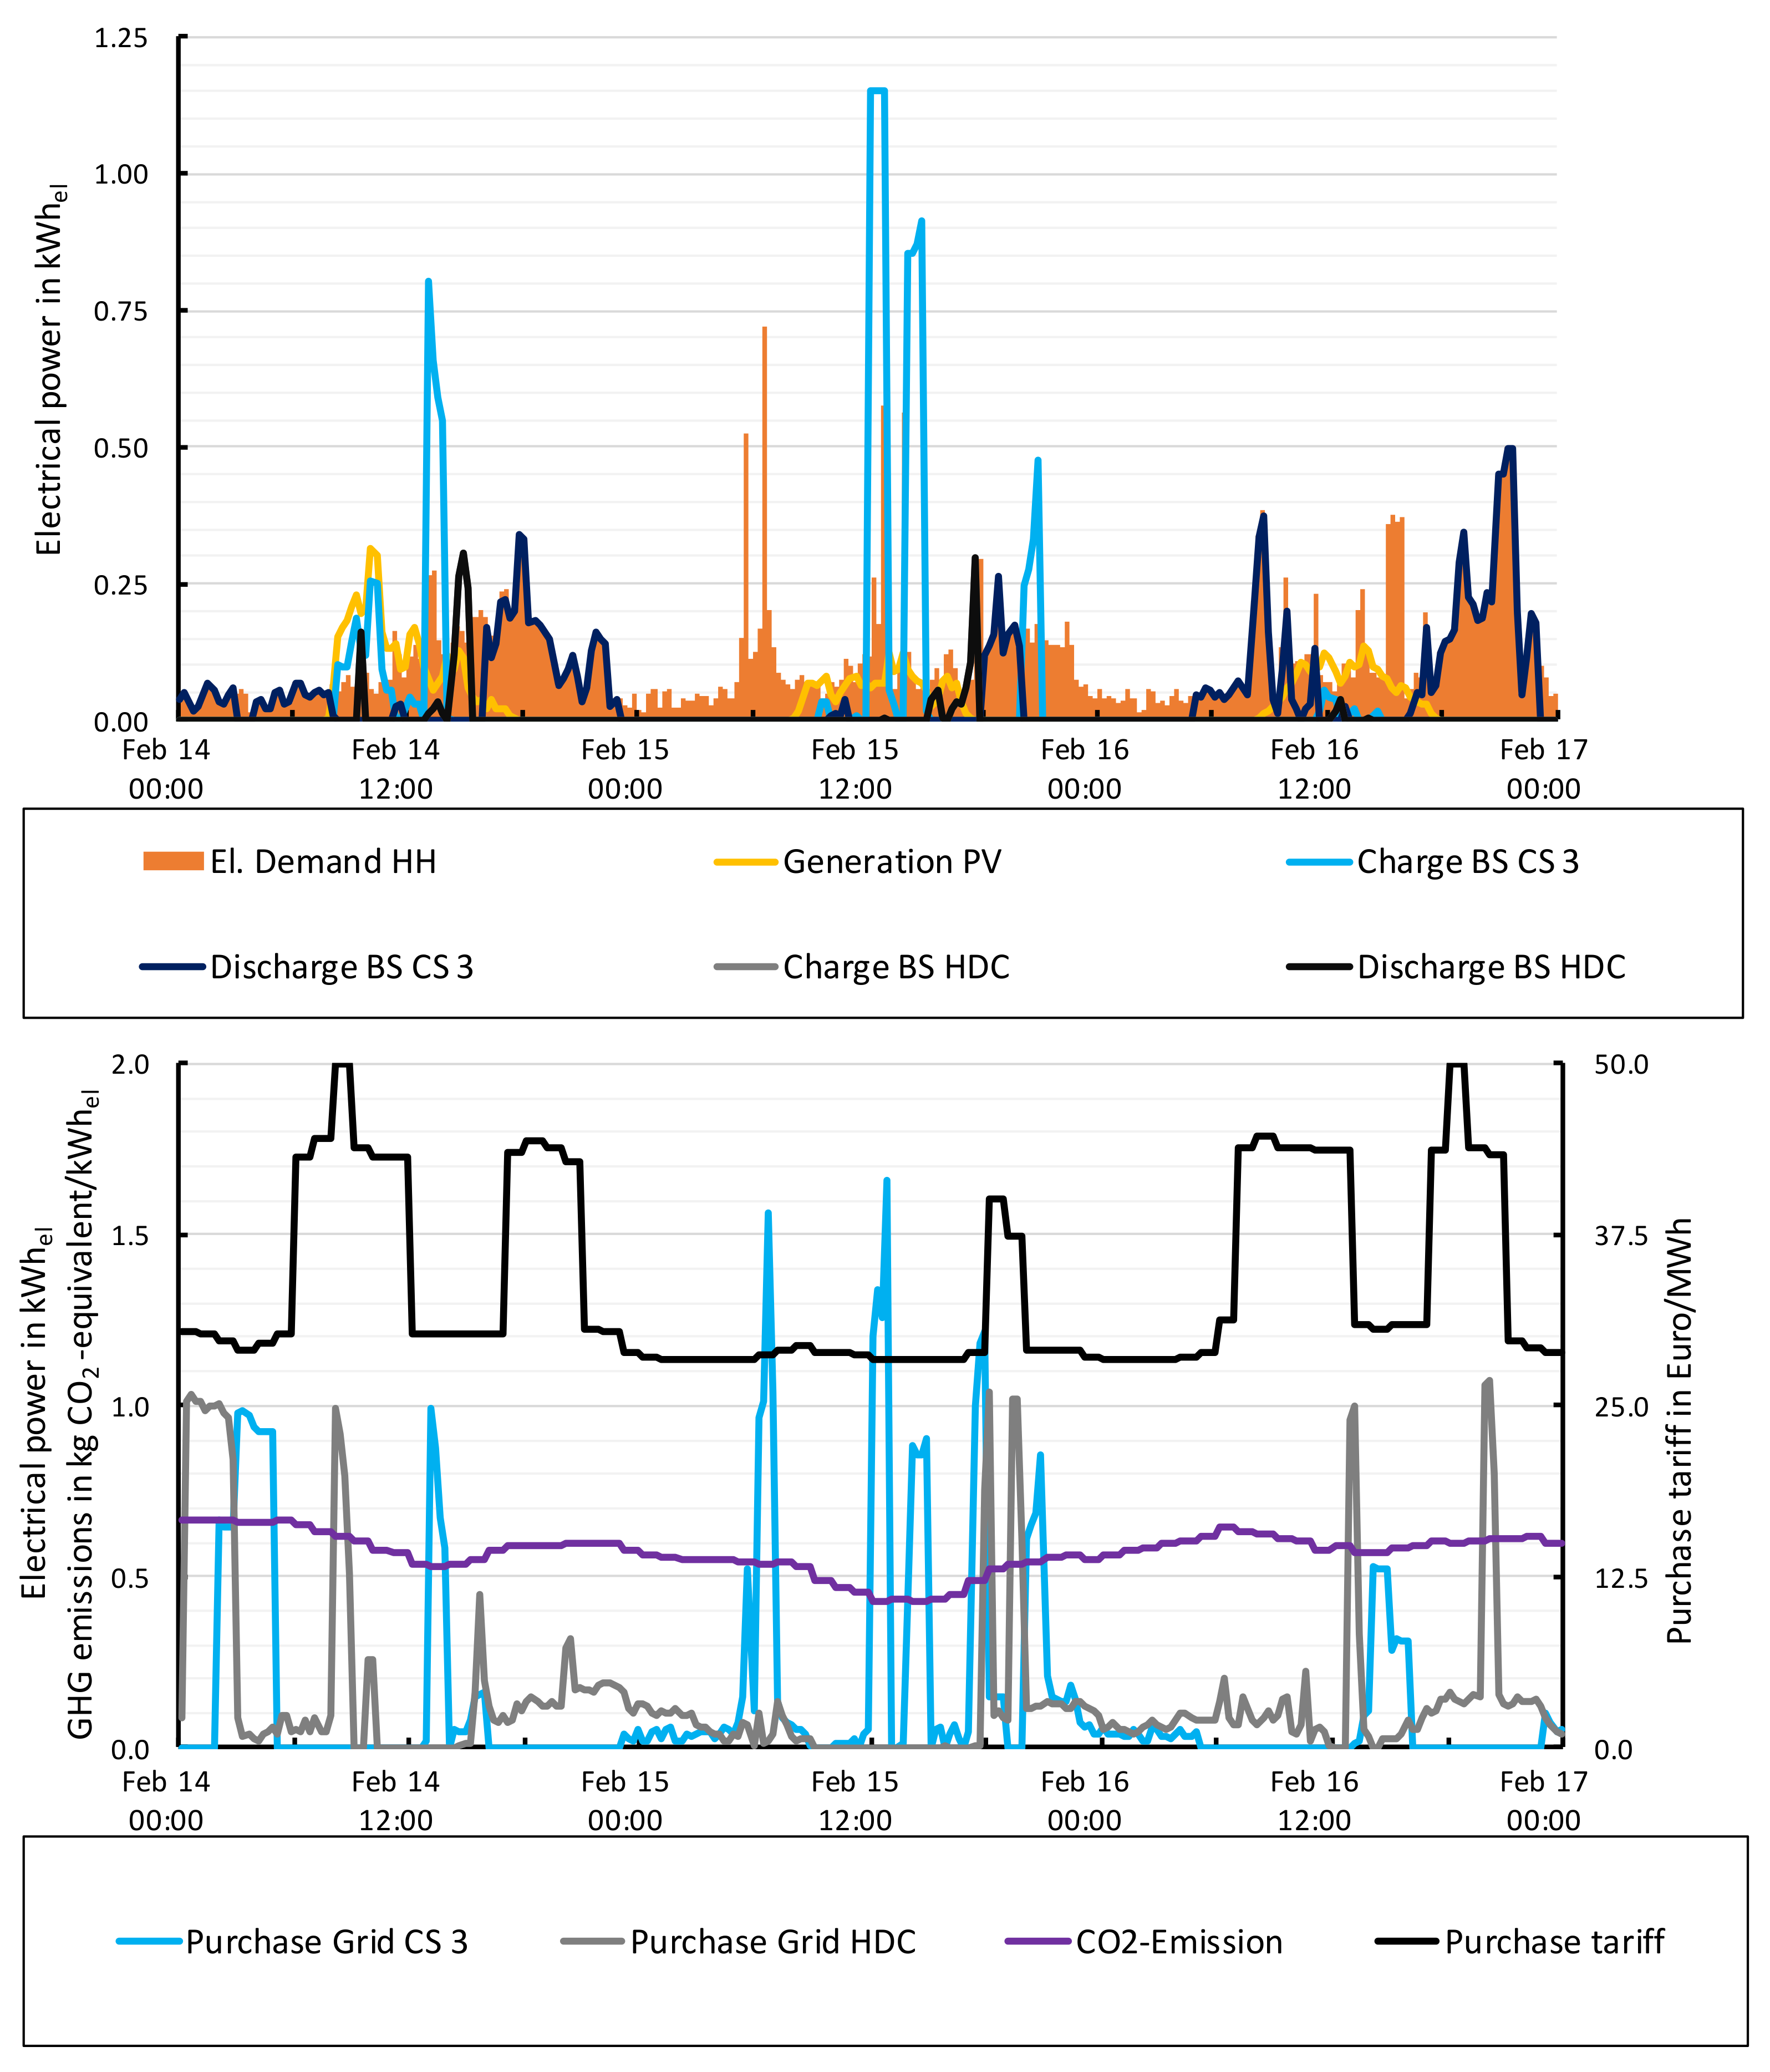
Following, we analyse the interaction with the energy system via the the exchange of electrical power, represented in the following
Figure 6. Here, this exchange via the public grid is shown as a dotted line (CS 3 blue, HDC grey). Additionally, there are solid lines for charging (light blue/grey) and discharging (dark blue/grey) of the stationary battery unit of the local energy system.
In the figure, it can be seen, that the smart charging strategy CS 3 covers almost the entire electrical load of the household by the stationary battery storage, although the PV system does not generate much power during this period. This demonstrates that the charging strategy CS 3 also optimises the flexibility of the stationary battery storage in times of low procurement costs and GHG emissions, e.g., on the 15th February. Simultaneously, we identify a potential disadvantage of the charging strategy CS 3: By optimising to the most beneficial time of day, the power supply via grid is concentrated on individual time steps, resulting in clearly visible power peaks. In order to prevent these peaks and to shape them more smoothly, we could consider them as a further objective in the optimisation. For this purpose, we could extend the objective function by costs for the maximum power purchase over the optimisation horizon referring to a peak power pricing and—in case it is appropriate—we could do the same for the feed-in. As typical for multi-objective optimisation, the weighting factor of this maximum power peak pricing refers to the level of peak power prices compared to the prices of the other objectives. Since our approach initially aims to minimize purchase costs and GHG emissions, we have not examined this approach in detail.
5.2. Comparison of the Charging Strategies
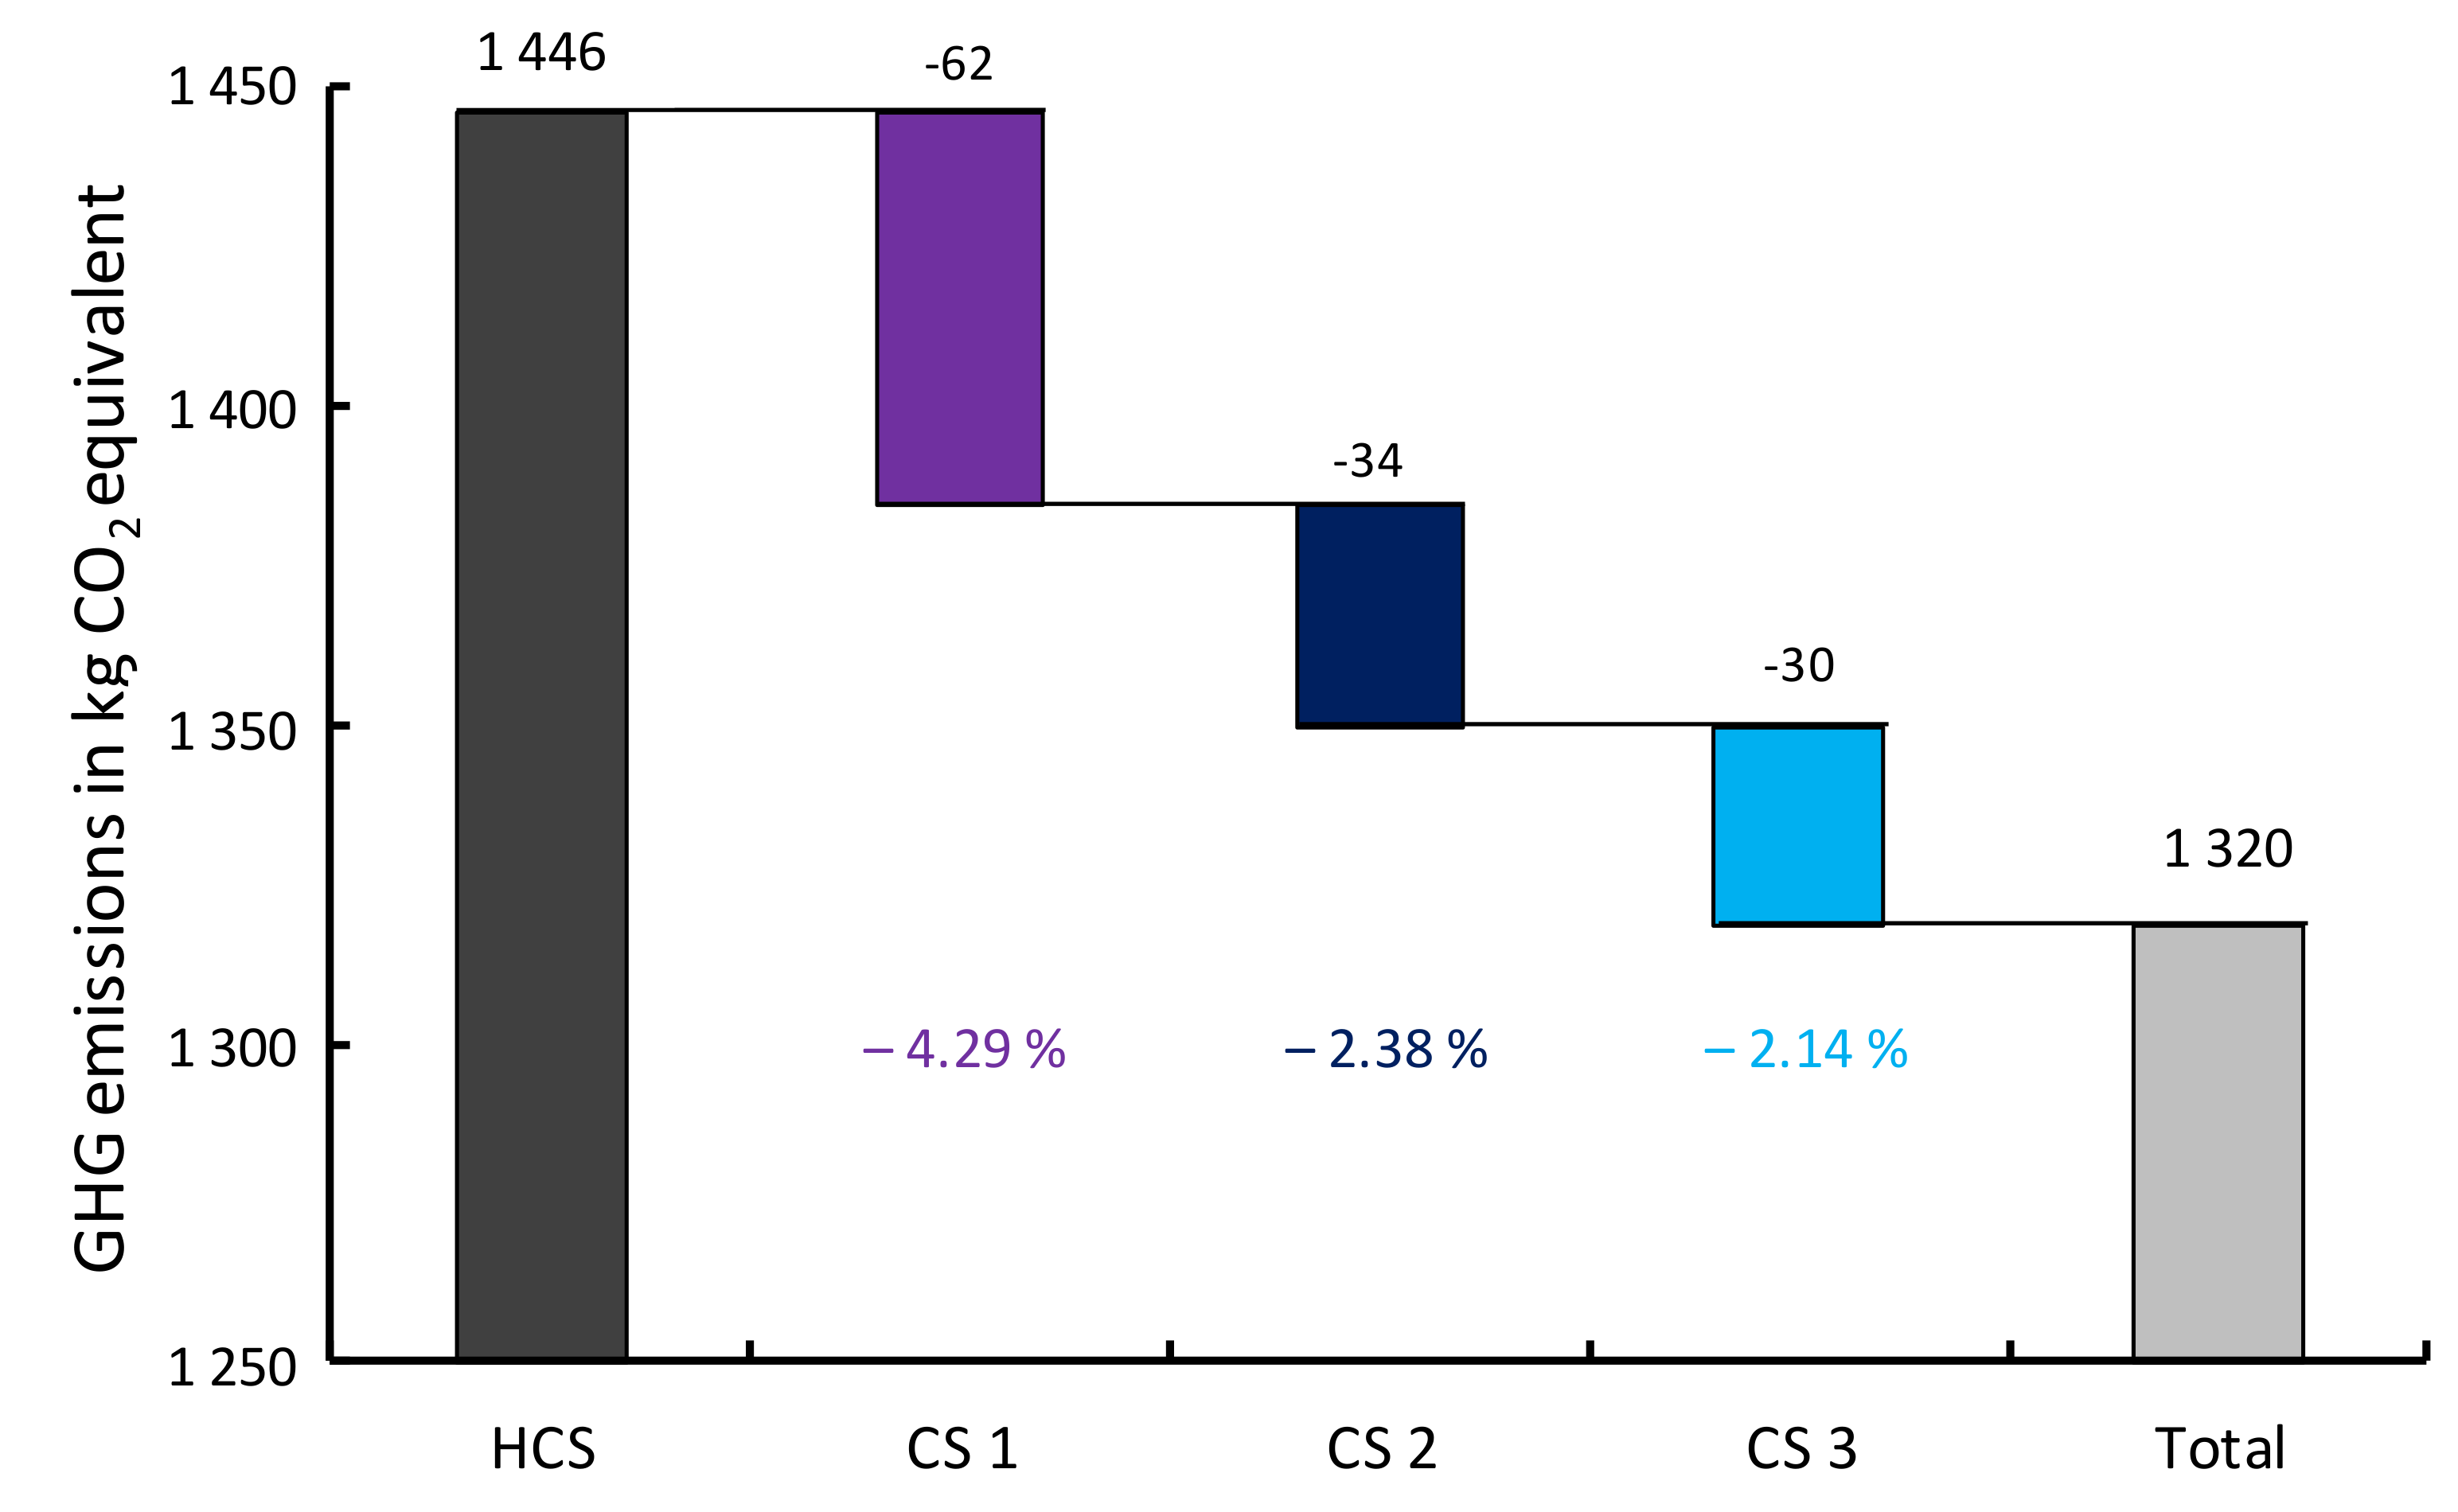
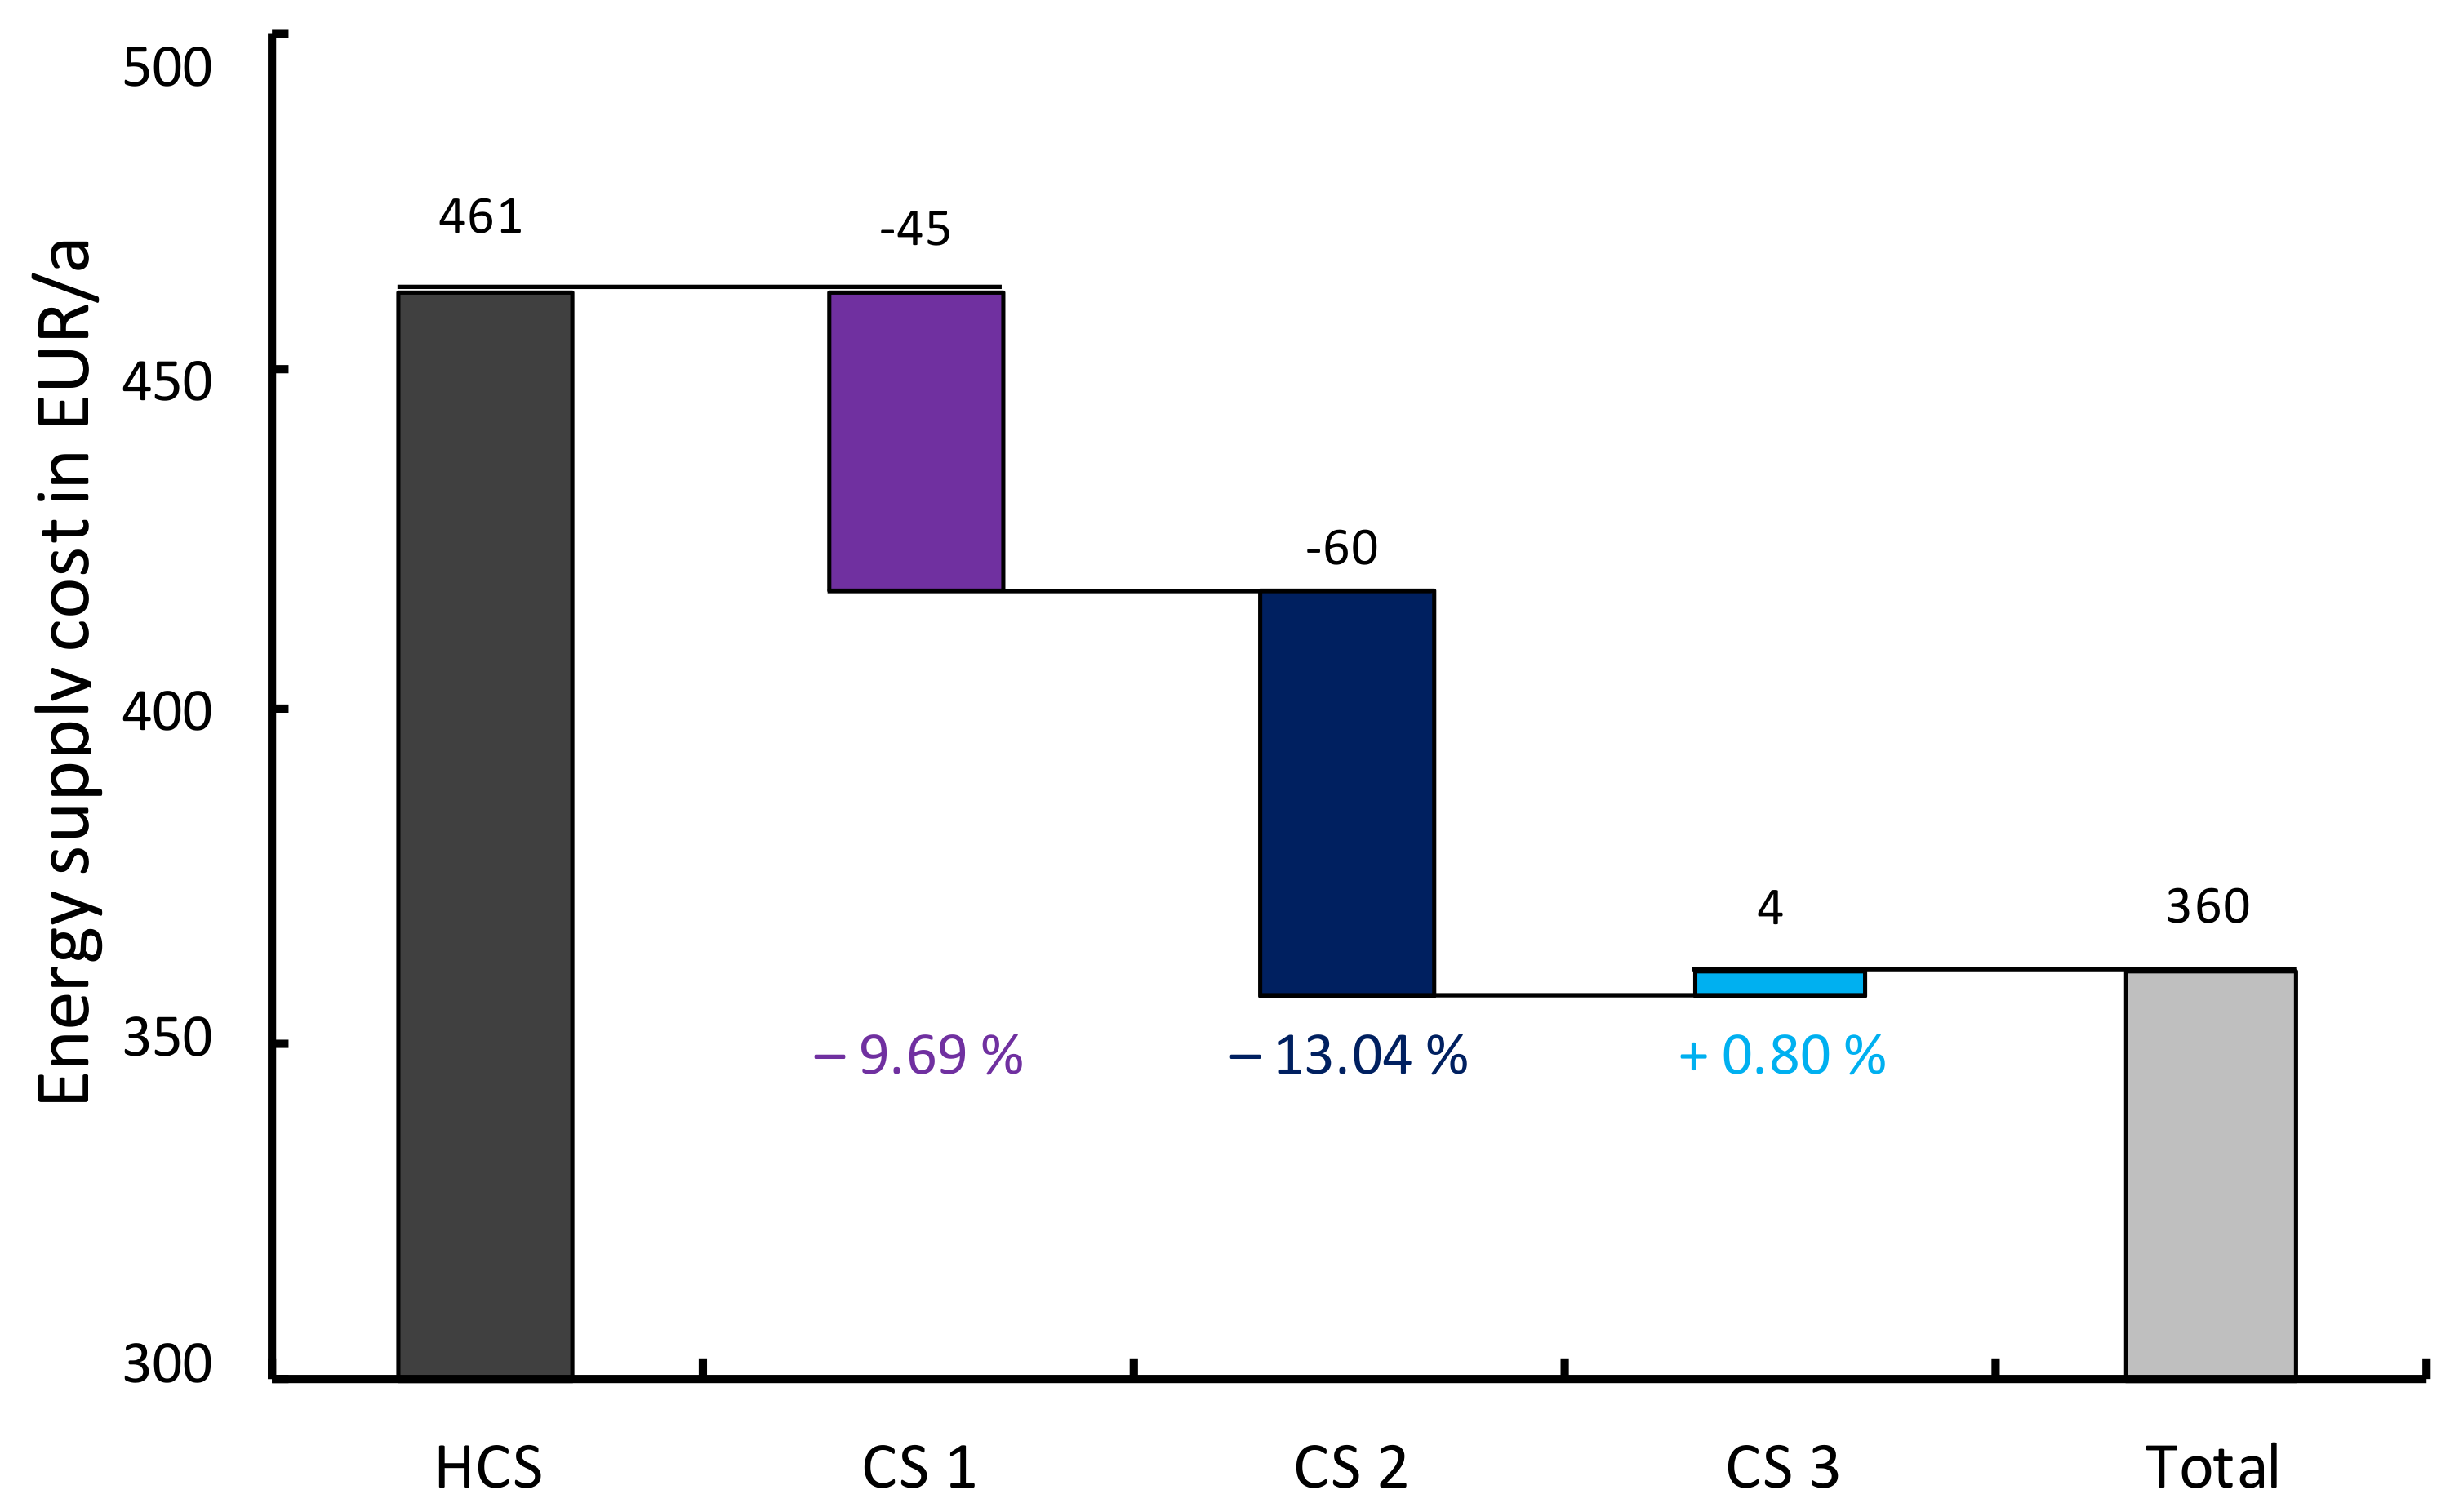
Figure 7 shows the annual results of the four charging strategies: Heuristic charging, optimised charging with minimised purchase cost and constant (CS 1) or dynamic purchase prices (CS 2) as well as conditions of CS 2 with adding the second objective of minimisation of assigned GHG emissions (CS 3).
It can be clearly seen, that applying a charging strategy based on an optimisation approach reduces yearly power cost significantly in the range from 10% to 20% depending on the pricing structure of power purchase pricing. In absolute terms we can show a cost saving of 45 EUR/a or 105 EUR/a respectively. In case of dynamic purchase prices, the higher cost saving can be achieved. Thereby, it is obvious, that introducing the second optimisation objective of minimising GHG emissions at the same time results in a cost increase, due to the reduced solution space concerning the cost minimisation in this case. However, the increase in cost by applying CS 3 is rather small. This is not astonishing: the whole sale price itself contains GHG pricing induced by the EU ETS and the dynamic pricing structure relays on the whole sale prices, so that an additional (virtual) GHG pricing at the end customer level, as introduced for CS 3, does not change that much.
In summary, we can conclude that the smart charging strategies can reduce the specific annual procurement costs for power by 22.73%, but the absolute savings seem to be rather challenging, as at present regulation there are just 45 EUR/a to be invested in such improved systems. And this is the breakeven case, i.e., if this sum is invested, there will be no incentive left for the HH. This figure increases to 105 EUR/a in CS 2, but the assumed dynamic of the purchase price structure is overly optimistic, as the high fluctuation of the assumed prices do not reflect causally determined cost structures. Within the power price for end customers, there are several significant inflexible components (e.g., refund of feed-in renumeration of renewable energy supporting scheme or grid fees), which do not reflect system cost appropriately, in case they are differentiated over time.
As the second objective analysed was GHG reduction,
Figure 8 shows the assigned GHG emssions for each scenario resulting from estimated GHG emission changes in the overall system caused by power purchase or feed-in via the grid of our local energy system by the different scenarios.
It is not astonishing that the lowest assigned GHG emissions are related to CS 3, as this strategy is the only one including this target into the objective function. It achieves almost 9% less assigned GHG emissions compared to HCS. However, power cost minimisation of the HH leads to a reduction of assigned GHG emissions even in CS 1, due to the pricing structures in place in Germany. This assumed reduction of GHG emissions estimated by the chosen approach relies on the effect, that the objective function maximises local consumption of low GHG emission generation of the PV system, as feed-in remuneration of local produced PV power is less than the cost of power purchase at end customer level. CS 2 reduces the assigned GHG emissions by almost 7% (compared to HCS). This additional assigned GHG emissions are caused by the effect mentioned above, that the dynamic whole sale price includes a GHG pricing component already and drives the power purchase prices at end customer level in this scenario.
5.3. Discussion of the Impact of the Charging Strategies
There are two aspects assumed to be different to up to date incentive structures in place in Germany at present. The present situation is reflected by CS 1 while CS 2 and CS 3 rely on assumed changes in pricing structures and an assignment of GHG emissions proposed in literature. However, it is important to investigate, whether it can be expected that those assumptions proposed in literature will reach the goals striving for. We will discuss this further in the following.
- (1)
Dynamic pricing at the end customer level:
The assumed prices in CS 2 and CS 3 contain dynamic components for taxes, duties and fees as well as dynamic grid fees accounting for about 77% of the cost at end customer level and therefore the largest component while procurement cost relying on the dynamic prices of the whole sale market are included in the component accounting just for 23% of the end customer price. There is no good reason for assuming that the price dynamic of taxes (e.g., VAT), grid fees or duties (EEG remuneration) should exhibit the same price pattern than the whole sale market. From an economic point of view, prices should reflect cost structures and scarcities. The grid bottlenecks are not at all related to the bottlenecks in generation of the overall system as well as the generation of renewables. Low prices at whole sale markets relate especially to high renewable generation, which in consequence this leads to high supporting cash flows. Applying the assumed pricing at end customer level in CS 2 and CS 3, this would lead to especially low duty components for EEG remuneration at the same time, which is the polar opposite of supporting the situation at the same period. Therefore, in our judgement, the proposed structure for purchase prices at end customer level are contradictory to our main goal, designing a most cost-efficient overall system with less (or in the long run no) GHG emissions, as such correlations do not lead to the appropriate incentives governing the system in an economic efficient way. Restricting the price dynamic to the price component relying on the wholesale market, reduces the fluctuation in prices at end customer level and therefore reduces the savings shown in CS 2. However, there will be some additional saving never the less, but it is assumed to be quite small compared to CS 1.
- (2)
Assignment of GHG emissions at the end customer level by GHG emission factors:
The assignment of GHG emissions at the end customer level by applying hourly GHG emission factors derived from a unit commitment model seems to be reasonable at first approximation. For increased simplicity, we applied factors representing the average emission of the grid purchase and withdraw of electrical energy in each time step in this work. This does clearly not reflect the GHG reductions in case of any change of production linked to additional feed-in or power purchase by our local energy system. The more appropriate value would be the marginal GHG factor in each time step. This is somewhat more difficult to evaluate by a conventional unit commitment model as E2M2, but could be used in principle in the same way. Those figures were not available for this work, but could be generated for future work. Anyhow, it is assumed that those values will not differ significantly for a lot of time steps, as the overall system contains a lot of flexibility itself leading to the reduction of the impacts of shifting feed-in or demand along the time line in cost minimum production of fossil plants. In addition, in some more extreme situation (e.g., curtailment of renewable feed-in), there will definitely be some impact on marginal GHG emissions.
However, there is another issue we need to consider necessarily: Most of the GHG emissions originated from power production of the overall system are included in the EU emission trading system (EU ETS). That means, any reduced emission in any time step is linked to a reduced demand for an EU allowance (EUA) in this system in that time step. The saved up EUA is free to be used to cover additional GHG emissions in any other time step or sector (e.g., iron & steel). As the EU ETS is a cap and trade system, it ensures to achieve an absolute limit of GHG emissions during a defined period corresponding to the GHG emission targets set. As the cap is not affected by the behaviour of any player in the energy system, the estimated GHG reduction shown in this work, is just a figure depending on the assumptions, but does not reduce any GHG emission in fact as the cap in the EU ETS is not affected. Following our judgement, the approach of integrating the objective of GHG emission into any control strategy at local energy system level is therefore useless. Furthermore, we consider it as even counterproductive, as the HH is given the impression it could reduce GHG emissions further by another strategy, which does not reflect reality and then results in additional useless costs. The approach supports the motivation of climate-friendliness of the HH, though the intended target of the HH is not achieved in reality at all. For achieving an optimal GHG reduction overall, optimal system integration of the local energy system is crucial. This can be easily achieved by a cost minimisation of power cost of HH in case the appropriate incentives are provided in the pricing structures, which is not always achieved today [
37]. However, this calls rather for adapting pricing structures and regulation as an appropriate way rather than changing objective functions for the operation of the local energy system.
6. Conclusions and Outlook
In the context of the German energy transformation, distributed energy systems are becoming increasingly important due to different sectors (power, heat, transport) being increasingly integrated on the end customer level. The high degree of flexibility in their operation results in an enormous flexibility potential for the overall energy system, which in view of the increase in electric vehicles has resulted in controllable flexibility of 0.46 GW and 4.43 GWh over the last six years. In this paper we have presented an approach to control the respective charging processes at minimum cost and we have tested an approach proposed by other authors to impact GHG emissions by adapted operation of such systems. This approach is based on an optimisation model, which can easily be extended by further objectives besides cost minimization and climate friendliness and is able to approach multi-objective targets as well (e.g., minimum cost and minimum GHG emissions).
For this purpose, we compared three different charging strategies, with minimisation of power cost for an exemplary household and different settings of structure of power purchase price at end customer level as well as explicit minimisation of GHG emissions as additional objective at HH level, with a simple heuristic charging approach. The results of our charging strategies undercut the costs of the heuristic charge control, as can be expected, byt 10% to 20%, though 10% should be achievable with the present regulatory framework in Germany already.
At the same time, we discussed the impact of such a charging strategy and the impact that can be reached in reality. This leads to the conclusion by deductive reasoning, that the 20% savings do not comply with cost savings in the entire system, as the applied dynamic pricing structure at end customer level does not reflect causality of cost and therefore leads to inappropriate incentives missing the most efficient system behaviour in the end. The estimated assigned GHG emission reduction on the other hand will not lead to any GHG reduction in reality, as the cap and trade system of EU ETS will keep emissions exactly in the cap level in any case. The introduction of the second objective into the optimisation of operation of the local energy system leads to increased system cost as well as increased cost for the HH while no GHG emission reduction is achieved in fact. This approach proposed in literature is, due to our judgement, counterproductive, as it increase the cost of energy transition while not achieving any significant GHG reduction.
However, we were able to show, that applying appropriate optimisation approaches to scheduling of local energy systems, including charging strategies of EVs, show clear potential to improve system operation from local as well as overall system perspective. Therefore research in this field should be intensified in several aspects. First, we recommend to improve data on characteristics of EV utilization and limitations of charging processes. For a better integration in real systems, the stochastic characteristic of the EV usage pattern has to be taken into account in addition. Second, additional components of local energy systems should be added like heat pumps and heat storage to consider the ongoing comprehensive electrification of distributed energy systems. Third, further research on the appropriate regulating framework should be intensified for generating appropriate incentives leading to an optimum for local HH as well as entire system.
However, we believe that this approach is one of the basic fundamentals for the comprehensive integration of distributed energy systems including EV charging into the overall energy system by means of smart control systems.


