1. Introduction
By the end of 2019, Austria featured grid-connected photovoltaic (PV) power plants with a total power capacity of approximately 1702 Megawatt peak (MWp), generating approximately one percent of the electricity production in Austria [
1].
The objective of the Austrian Government Program stipulated within the National Energy and Climate Plan is to produce 100% of the electricity consumed in Austria from renewable energy sources by 2030 [
2]. To reach this objective, it will be necessary to:
increase the capacity of small hydropower (plant capacity <10 MW) by 50%;
increase the electricity output of biomass and biogas by 2100 Gigawatt-hours (GWh);
install 500 MW of wind power capacity per year; and
increase the peak power capacity of PV power plants tenfold (to 15 Gigawatt peak (GWp)) compared to 2018 [
3].
In light of the annual PV power additions of 97 GWp worldwide and of 8.2 GWp in 2018 in Europe [
4], the challenge of reaching the goal of a PV power capacity in Austria of 15 GWp has become evident. Considering the physical, technical, and economic requirements to actually install PV power plants, the feasible potential for PV power plants on Austrian buildings is considered to amount to 4 Terawatt-hours (TWh; equaling roughly 4 GWp), 1.8 TWh (equaling roughly 1.8 GWp) of which is the feasible technical potential on industrial and commercial building roofs, which amounts to 12 % of the necessary capacity increase by 2030 [
5]. Essential impediments for extensive installations of PV power plants on buildings go along with comparably long pay-back periods (especially when compared to the usual payback periods in the industry) and high upfront costs in combination with the current low interest rates for classical forms of savings [
6], PV-CPIs can be an alternative method of financing PV power plants on company roofs while at the same time integrating small (local) investors.
PV-CPIs in Austria have traditionally been implemented on the basis of subsidized feed-in-tariffs (FIT) that were provided by the federal government [
7,
8,
9]. Ever since their introduction, the FIT for PV power plants have been continuously decreased as the installation of PV power plants has turned from a niche market to annual installations of around 200 MWp [
10,
11,
12]. Current subsidized FITs in Austria—set at a little over 0.07 €/kilowatt-hour (kWh) and below most commercial electricity prices [
10,
11,
12]—make it, on one hand, economically reasonable to self-consume generated electricity without feeding into the grid if possible, and on the other hand, it is ever more challenging for PV-CPIs to offer notable interest rates to participants [
13,
14,
15]. Implementing PV-CPIs on the primary economic pillar of self-consumption therefore seems like a potential alternative to assure the economic feasibility of PV-CPIs.
Past research on PV-CPIs, energy cooperatives, and citizen participation (in Austria) has focused largely on motives for taking part in such a project [
7,
16,
17,
18] or the evaluation of their effect in the energy transition [
19,
20,
21,
22]. Whereas a lot of research has also been conducted on the issue of the self-consumption of PV-generated electricity both on commercial and residential levels (e.g., [
23,
24,
25,
26]), the feasibility of PV-CPIs with a focus on the self-consumption of PV-generated electricity embedded in industrial energy cooperation has thus far not been addressed by research.
In this context of PV-CPIs and the self-consumption of PV-generated electricity, the aim of this paper was therefore to (i) analyze the costs of PV power plants in a real-life environment by using five companies in the Austrian Ennshafen industrial business park as a case study, (ii) evaluate the joint purchase of PV installation by the five companies, and (iii) illustrate the potentials and advantages of applying a PV-CPI.
2. Methodology
The following paragraphs show how the potential for PV installations on the respective company roofs was determined and how costs were derived to evaluate the feasibility.
2.1. Semi-Standardized Expert Interviews
The Ennshafen industrial business park and port, home to approximately 60 companies and more than 2300 employees, is located at the border of the Austrian states of Upper Austria and Lower Austria on the Danube, part of the Rhine–Main–Danube Canal transportation system, allowing continuous waterway transport from the Black Sea to the Atlantic Ocean [
27].
As of today, the Ennshafen is operated by two private public partnerships, one located in Upper Austria, the Ennshafen OÖ GmbH, and one located in Lower Austria, the Ennshafen NÖ GmbH, which are responsible for marketing and operational activities at the Ennshafen and the business parks in the local communities Enns and Ennsdorf.
Most of the companies located at the Ennshafen are completely independent from each other and have no competing interests, given that they operate in different economic sectors. With respect to company size, several categories can be found at the Ennshafen: from small to medium-sized as well as companies belonging to national or international business groups. Companies resident at the Ennshafen include a wood processing company, an industrial laundry service company, recycling companies, producers of animal feed, companies specialized in the storage and shipping of raw and processed materials, automotive suppliers and machine manufacturers as well as the largest Austrian container terminal [
28].
Within the S-PARCS project that is financed by the European Commission and addresses energy cooperation in industrial parks, businesses in the Ennshafen industrial business park were interviewed using a semi-standardized interview guideline in order to evaluate potential energy cooperation possibilities [
29]. During these interviews, resident companies where asked—among other questions—whether they:
already had a PV power plant installed;
had internally already discussed the possibility of installing a PV power plant;
were interested in potentially installing a PV power plant on their roof;
disposed of utilizable roof space;
had already evaluated the potential for the installation of a PV power plant on their roof; and
were already planning to install a PV power plant.
Based on the answers provided by the expert interview partners—namely general, operations or energy managers—of the respective companies, a group of companies was defined that proved suitable for the installation of PV power plants in the sense that they had not already installed or planned one, were interested in installing one, and could provide a reasonable amount of available roof space. The answers provided in the interviews were reviewed and updated one more time during a workshop held at the Ennshafen industrial business compound.
In a next step, those companies that had proven suitable were contacted via email and telephone to question whether they were willing to share their previous year’s electricity load profile as well as recent electricity and grid infrastructure invoices.
Of the eight companies that had been defined as suitable, five were willing to share the required information and where thus integrated into those companies that intended to install PV power plants on their roofs as part of a potential CPI-scheme.
2.2. Estimation of Available Roof Space and Potential Photovoltaic (PV) Power Output
The available roof space, slope, and azimuth were defined using the regional geographical information system platforms DORIS for companies in Upper Austria and NÖGIS for companies in Lower Austria, where the assumed available roof space was adjusted based on obvious superstructures on the roofs. DORIS and NÖGIS are freely available online platforms that provide a range of geographical and other information on the respective federal state as well as aerial images. DORIS and NÖGIS provide a limited image resolution and the images are historical images dating back to 2017 [
30,
31], which is why the assumed available roof space might need to be readjusted accordingly during future technical planning of the PV power plants.
Installing PV power plants on roofs requires the latter to meet static requirements in order to ensure a safe and long-lasting performance of the PV power plant. Since it was not the goal of this paper to evaluate the technical feasibility of potential PV power plants on the respective company roofs, but rather to evaluate the effects of setting up a PV-CPI, the de-facto technical suitability of the respective company roofs has to be asserted in the future. This paper therefore does not presume to serve as proof of the meeting of the technical requirements of the respective companies.
2.3. Evaluation of PV Load Profiles
The load profiles of the potential PV power plants were calculated using the European Commission’s Photovoltaic Geographical Information System (PVGIS) [
32] and more specifically, the website’s PV performance tool for grid-connected PV, assuming the default radiation database (PVGIS-SARAH), crystalline silicon PV panels, an installed peak PV power of 1 kWp, and system losses of 5%. The mounting options were defined using the real values from the respective available roof spaces. Using the aforementioned input data, load profiles with a resolution of one hour between 2012 and 2016 were generated, which in turn were used to generate an average annual PV load profile for each roof space. The 1 kWp-load-profiles where then scaled up to the available roof space, assuming a demand of 5.67 m²/kWp based on 60-cell-300-Wattpeak-poly-cystalline-panels.
2.4. Calculation of Self-Consumption Rate
Self-consumption in this paper was defined as the simultaneous consumption of electricity generated by a PV power plant by an electricity load connected to the same metering point. For example, if the PV power plant on the roof of a company produces 10 kW of electric power and the same company requires an electric supply of 5 kW at the same time, the rate of self-consumption at this point in time is 50%, meaning that 5 kW of the power generated by the PV power plant supplies the demand of the current 5-kW-load, whereas the remaining 5 kW are fed into the grid. Integrating these momentary results over the period of one year, results in the annual rate of self-consumption, referring to the share of energy generated by this PV power plant that can be directly used by the load (in this example, the company) without feeding into the distribution grid. The rate of self-consumption is a defining factor in the feasibility of a PV power plant, the output of which is not remunerated with a subsidized feed-in-tariff. This is due to the fact that not-subsidized feed-in into the Austrian grid is remunerated with the current market price (in the case study, the not-subsidized feed-in-tariff (FIT) was 0.04 €/kWh) [
33,
34,
35], whereas self-consumed PV-generated electricity is not subject to any fees and merely reduces the amount of electricity bought from the utility and thus the costs. For example, if the PV power plant of a company with an electricity price of 0.10 €/kWh produces 10 kWh during one day, 5 kWh of which is consumed by the companies’ loads, 5 kWh of which is fed into the grid, the company generates an income of 0.50 € (0.10 €/kWh × 5 kWh = 0.50 €) for the avoided electricity costs plus 0.20 € (assumed FIT of 0.04 €/kWh × 5 kWh = 0.20 €) for feeding the surplus into the grid on that day.
The rate of self-consumption in this case study was calculated by converting the companies’ ¼-h-load profile to 1-h-load profiles and matching it with the respective PV power plant load profile.
The rate of self-consumption for the five companies was assumed to amount either to the rate of self-consumption resulting from using all of the “suitable” available roof space or a minimum of 80% in the one-company case, where using all of the available roof space would result in a significantly lower rate of self-consumption. The term “suitable” in the context of available roof spaces refers to solar azimuths between −90° and 90° (with 0° marking the South). Other surfaces, meaning roofs with an azimuth of <−90° or >90°, facades, or available space on the ground were not considered despite the fact that the latter surfaces do generate power output and using them would in most cases still have resulted in high rates of self-consumption. The reason for not including the facades’ surfaces is the resulting reduced specific power output whereas potential ground-mounted installations were not included because they are not eligible for subsidies under current legislation and the corresponding spaces are or can be used for different business-related purposes.
2.5. Cost Assessment
2.5.1. Investment Costs
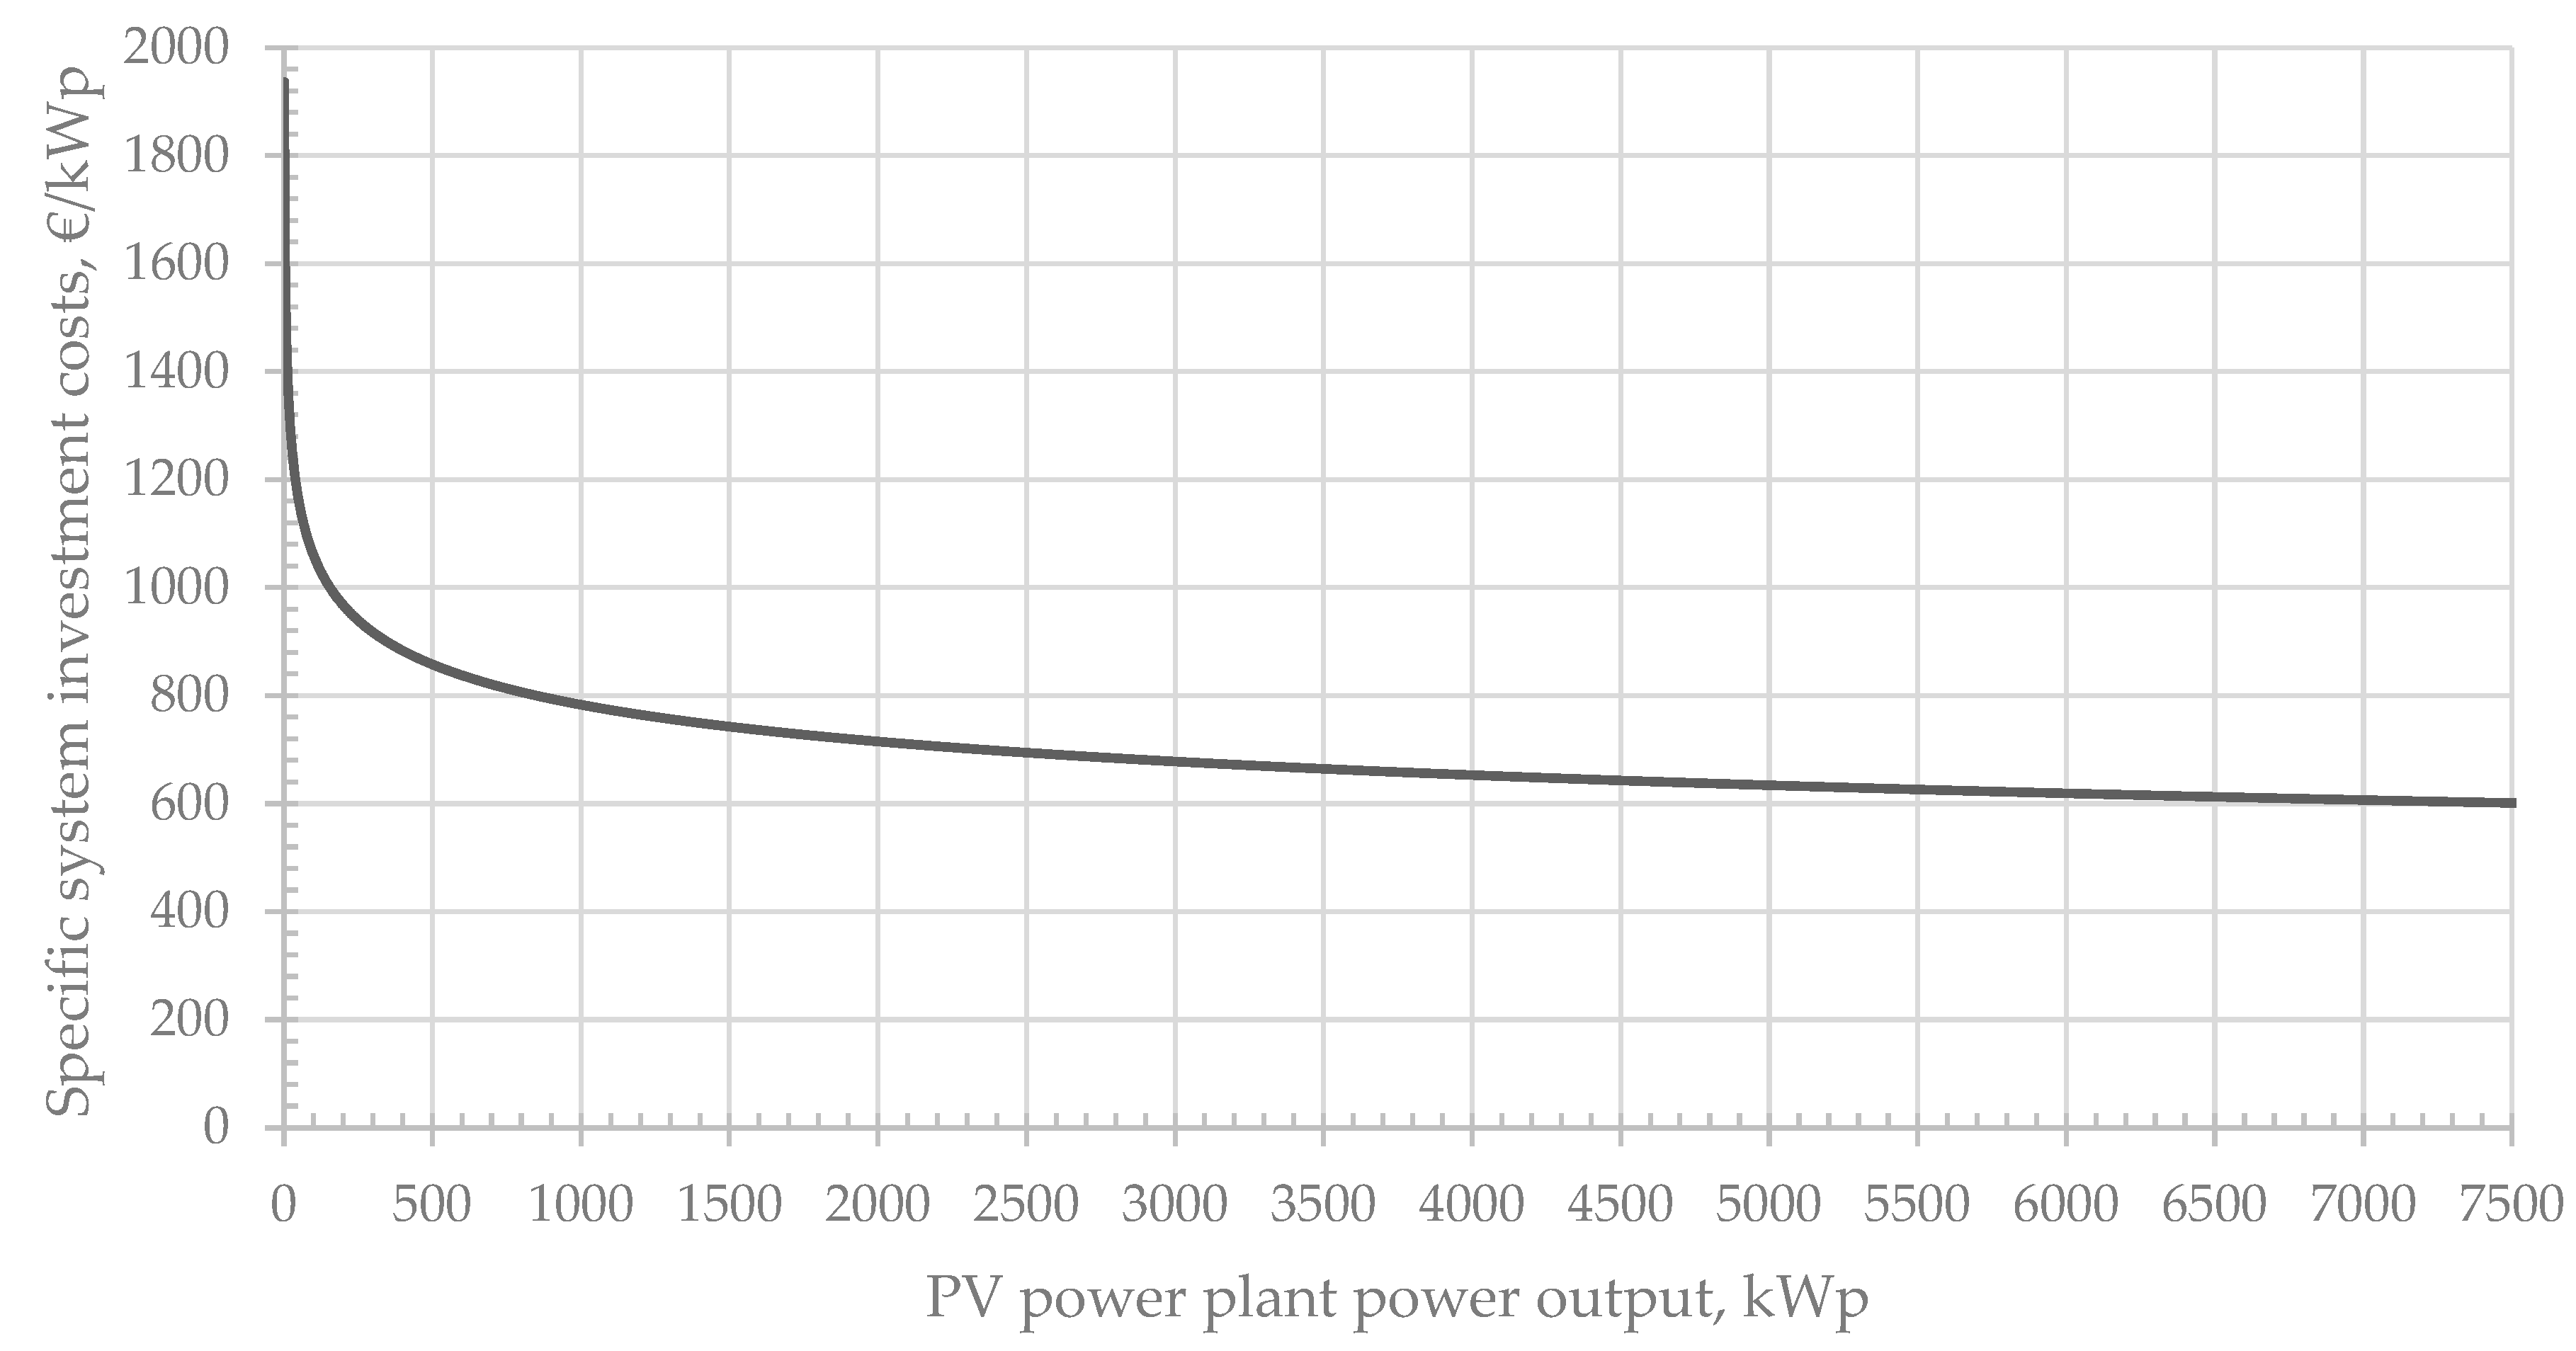
The assumed specific investment costs (excl. value added tax of 20%) as a function of the installed peak power of the PV power plant are shown
Figure 1 and are based on studies by [
1,
36] and start at 1936 €/kWp for a PV power plant with 1 kWp and are assumed to reach a minimum value of 600 €/kWp at 7613 kWp and above.
2.5.2. Investment Subsidies
Investments in the potential PV power plants were assumed to be eligible and would in fact also obtain subsidies from the Austrian federal eco power fund (OeMAG Ökostromabwicklungsstelle). These federal subsidies can be obtained for the installation of a grid-connected PV power plant or the increase of the capacity of an existing PV power plant on an existing building or on commercial premises with the exception of installation on green space. Investment subsidies for PV power plants up to 100 kWp amount to 250 €/kWp. Investment subsidies for PV power plants >100 kWp and up to a 500 kWp amount to 200 €/kWp. PV power plants >500 kWp receive an investment subsidy for the maximum subsidized power output (500 kWp) [
37].
2.5.3. Operating Costs
The operating costs are assumed to amount to 2.5% of the investment costs, given that the operating costs of PV power plants amount to between 1 and 2.5% of the investment costs and include the following [
36,
38]:
Potential costs for the dismantling and the recycling or waste treatment of system components were not taken into consideration as these costs do not necessarily occur after the assumed useful lifetime of 25 years as PV power plants can be operated and still generate electricity past the assumed useful lifetime [
39,
40], and several producers already produce PV modules with a performance guarantee for 30 years of operation [
41].
2.5.4. Administrative Costs
The assumed administrative costs of the PV-CPI-scheme are based on a confidential interview with a company experienced in establishing PV-CPIs and amount to one-time upfront costs of €15,000 for setting up the CPI-scheme and finding investors as well as annual costs of €7500 for the administration of the CPI-scheme and the paying out of interest.
2.5.5. Interest Rates
Interest rates for small (private) investors were set to amount to 3.0% during a 10-year-period. The 3.0% interest rate was chosen in order to provide an attractive opportunity to private investors compared to alternative forms of investment and to cover the necessity of a PV-CPI to satisfy the primary reason for private investors to invest in PV-CPIs, namely financial returns [
9]. The assumed interest rate was significantly higher than the interest rates of comparable current PV-CPIs offered by utilities in Austria that provide interest rates of below 2% [
14,
15]. The interest rate for debt capital is assumed to amount to 1.8% [
42] and will be applied to both the PV power plants financed through standard debt-financing as well as to the remaining debt of the PV-CPI-scheme after the 10-year PV-CPI project runtime. The interest rate
i, equaling the interest rate of an alternative investment, was assumed to amount to 3.5%.
2.5.6. Additional Cost and Determining Factors
Table 1 shows the other input that was used in calculating the net present value (NPV).
The assumed changes in the electricity price as well as the Austrian feed-in-tariff (that is based on current market prices) in
Table 1 have been assumed to equal inflation for the simple reason that the volatility of electricity prices in Austria and in Europe make a forecast of the development of electricity prices impossible. Looking back over the past 10–15 years, both on a European level as well as on the Austrian level, the development of non-household electricity prices has experienced both increases as well as decreases. Electricity prices could thus be forecasted to either increase or decrease depending on the chosen reference period, both assumptions having their merits. In the light of the just mentioned price developments, events that have happened during the past 15 years (e.g., global economic crisis starting in 2008 or the current COVID-19 pandemic) as well as recent developments (e.g., the EU’s green deal), the authors used the inflation rate as the assumed change in both the electricity price and the FIT, given that whatever the assumption made, a period of 25 years is very difficult to project [
11,
44].
2.5.7. Net Present Value and Discounted Pay-Back Period
The feasibility of the PV-CPI was expressed using the net present value shown in Equation (1) [
45] based on assuming an expected technical lifetime of the PV power plant of 25 years. The reduction of payments due to reduced amounts of electricity bought from the utility as a result of self-consumed PV power is considered direct income. Opportunity costs (based on the definition of the NPV) are not taken into consideration. Operating costs of contracting as well as the price for the remuneration for the self-consumed electricity are assumed to be subject to inflation and will therefore be adjusted at yearly intervals.
NPV0—net present value in year 0, €
I0—investment costs in year 0, €
n—expected useful life (25 years)
Rt—net cash inflow-outflows during a single period t, €
i—interest rate, assumed to amount to 3.5%, representing the potential interest rate of an alternative investment
t—year of cashflow
The discounted pay-back period (DPB) was considered to be the duration from the installation of the PV power plant to the year of operation in which the NPV is equal to or above 0.
2.5.8. Scenario Analysis
To account for the potential gains in a joint purchase and installation and compare the results with the individual purchase of each company, three different cases (based on the specific investment costs shown in
Figure 1) were observed, namely:
Case 1 (Individual purchase): The specific investment costs of each company correspond with the individual costs based on the cost curve derived from
Figure 1.
Case 2 (Joint purchase with economies of scale): The specific investment costs for all companies correspond with the lowest individual specific costs of the companies involved. In other words, all companies pay the same price in €/kWp as the company with the lowest price pays (i.e., the company with the largest plant).
Case 3 (Joint purchase with lowest price): The specific investments costs correspond with the specific investment costs of one single PV power plant and the corresponding cost digression, assuming that all five PV power plants are treated as one.
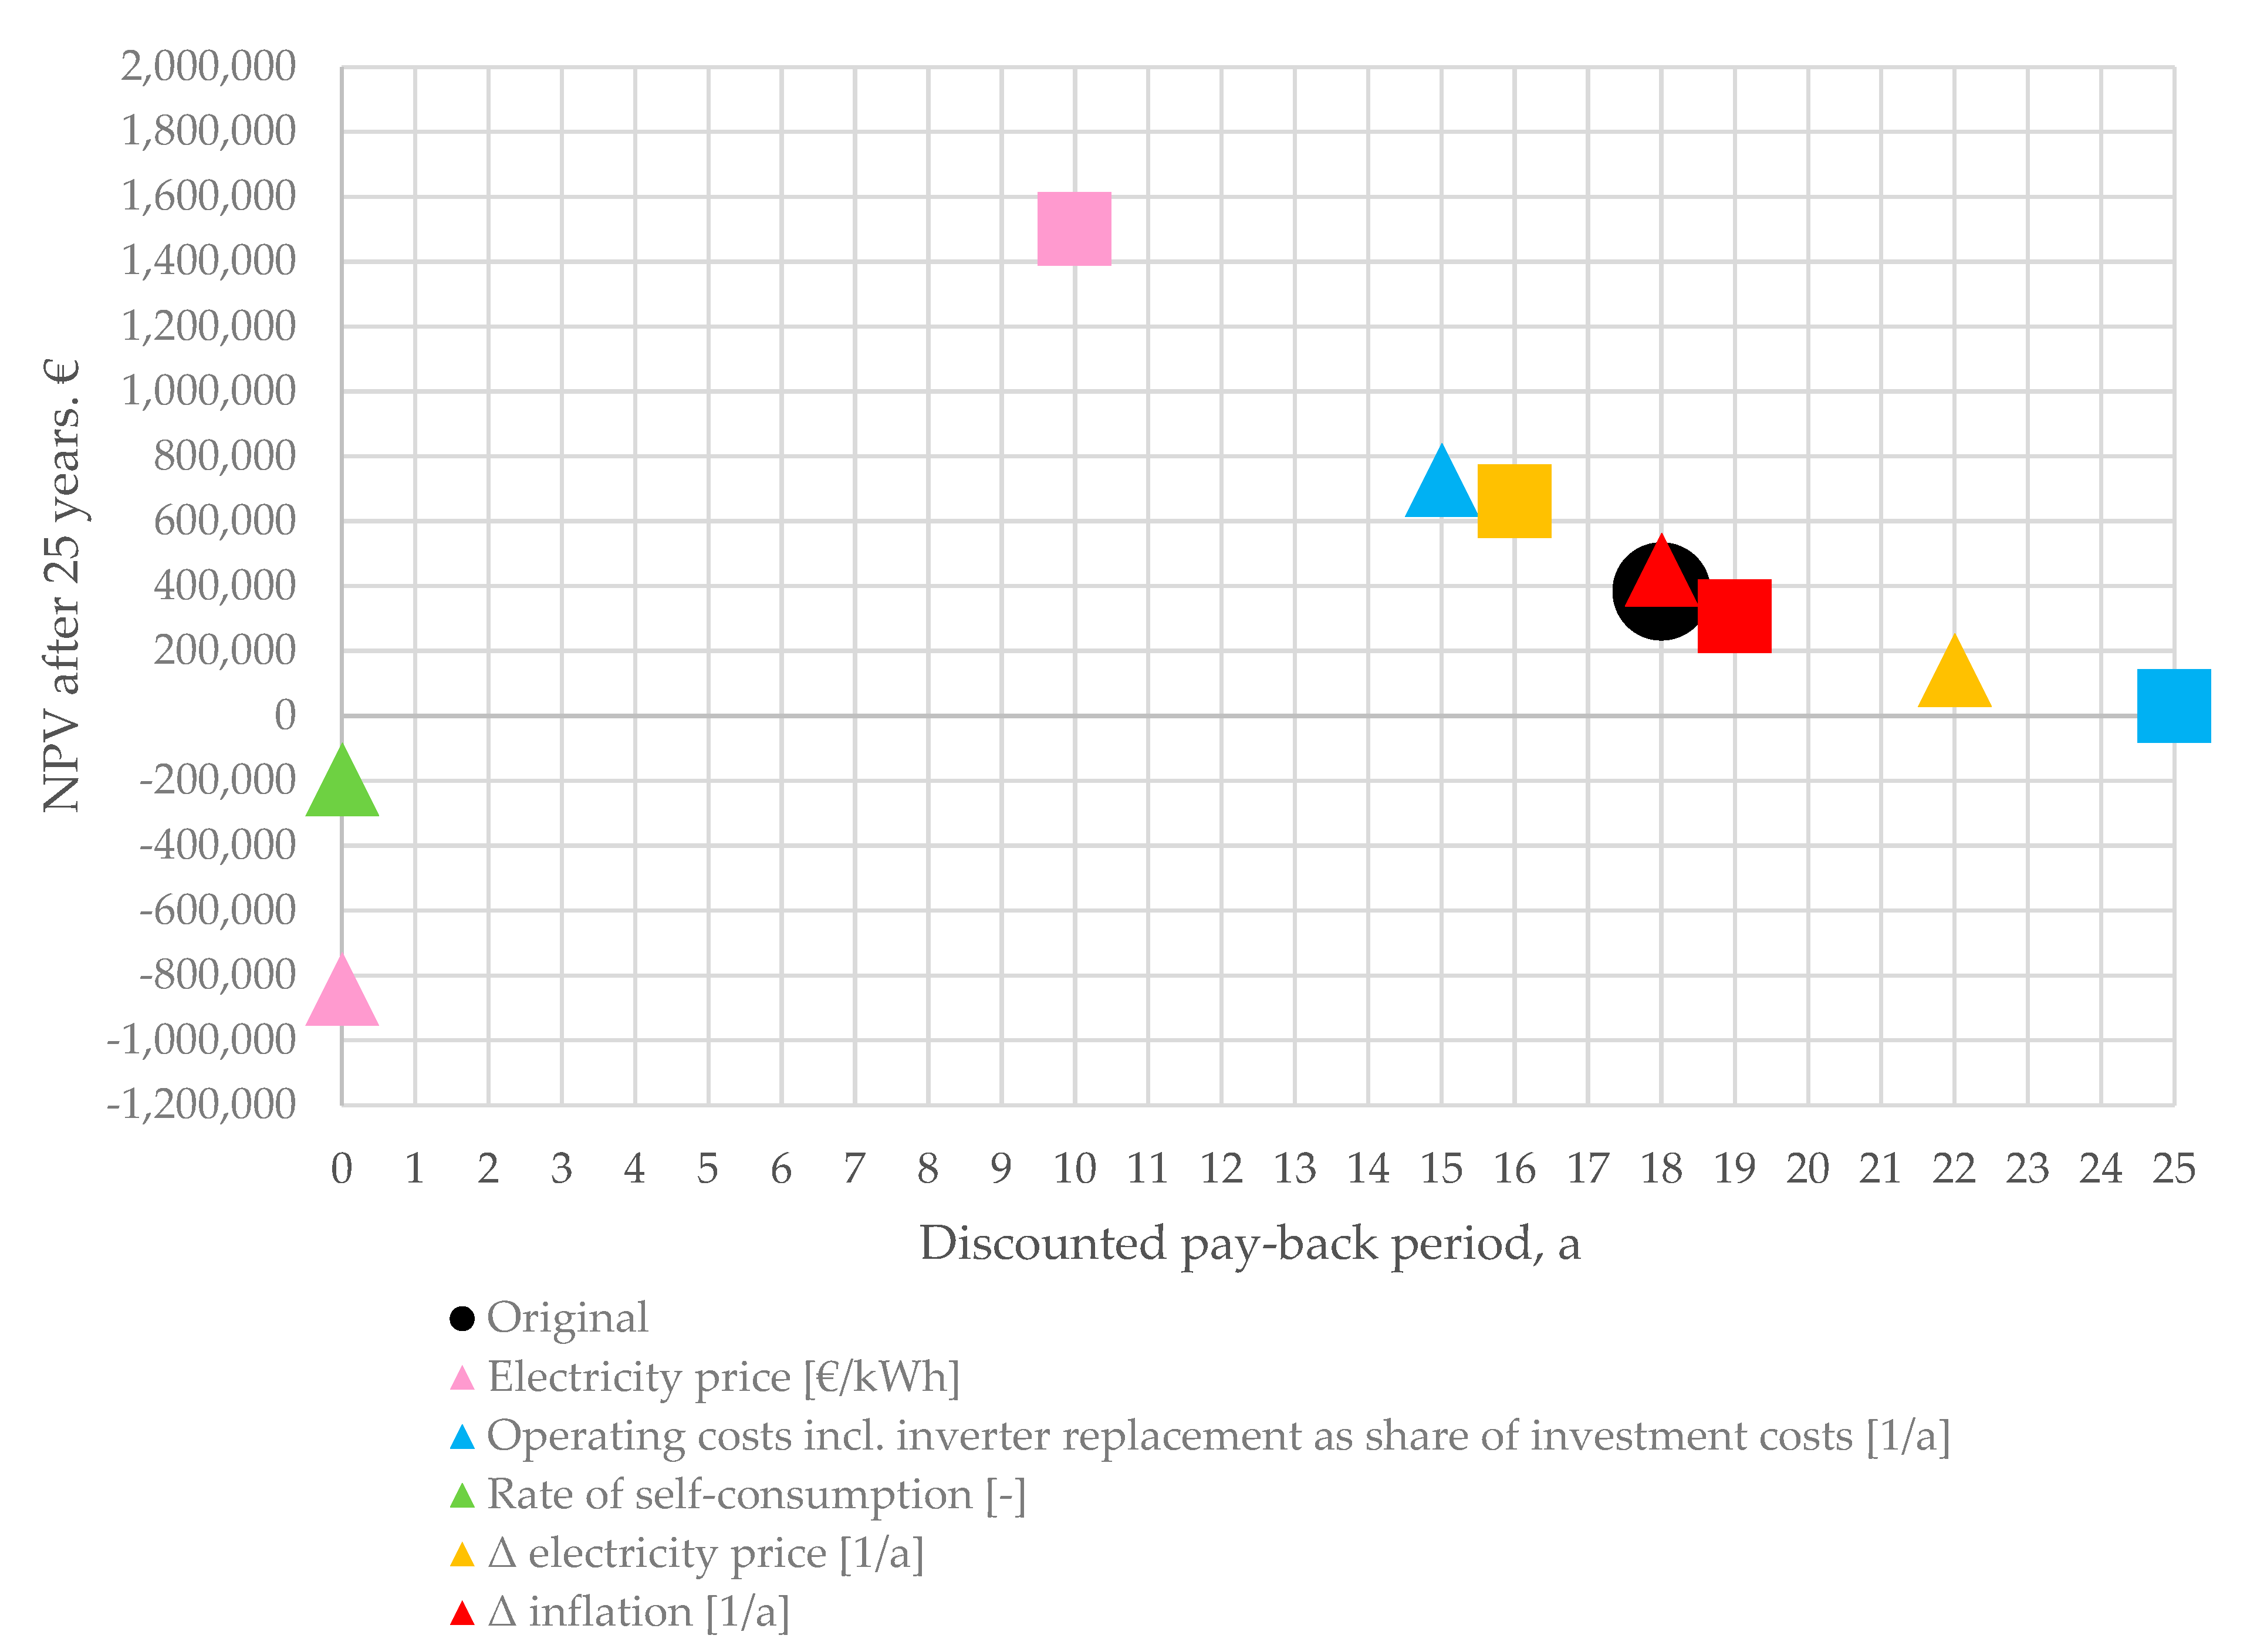
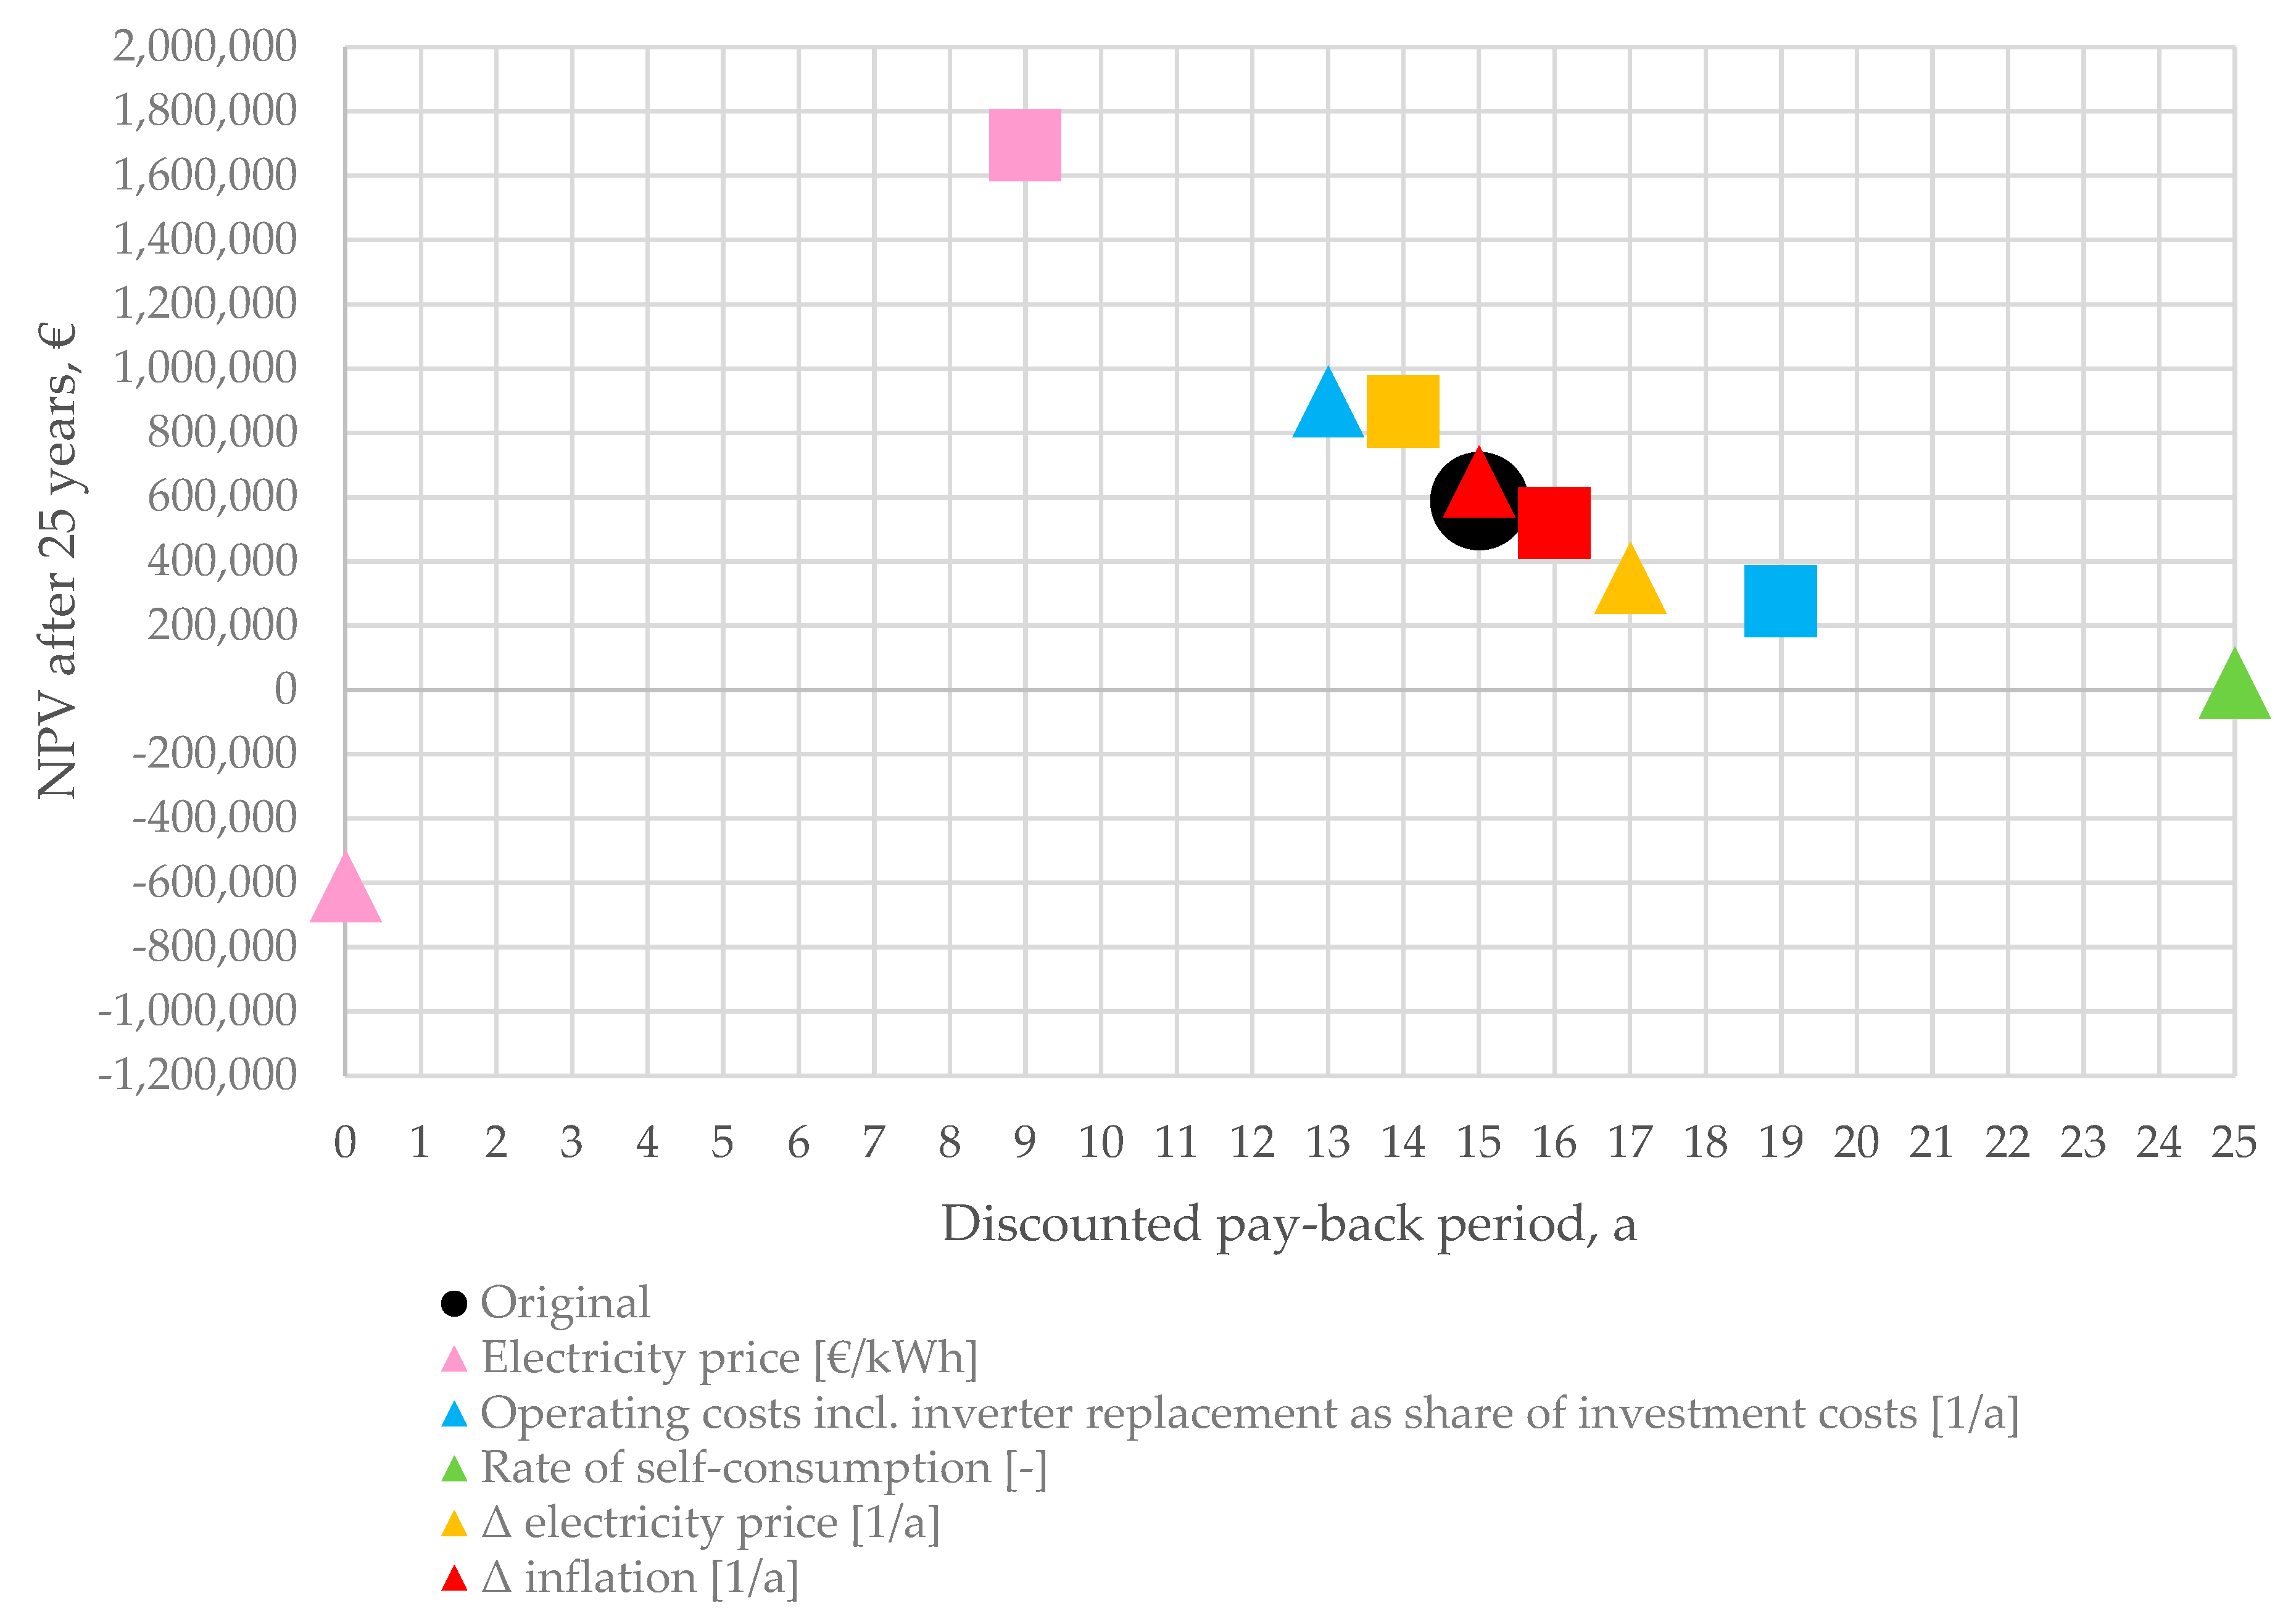
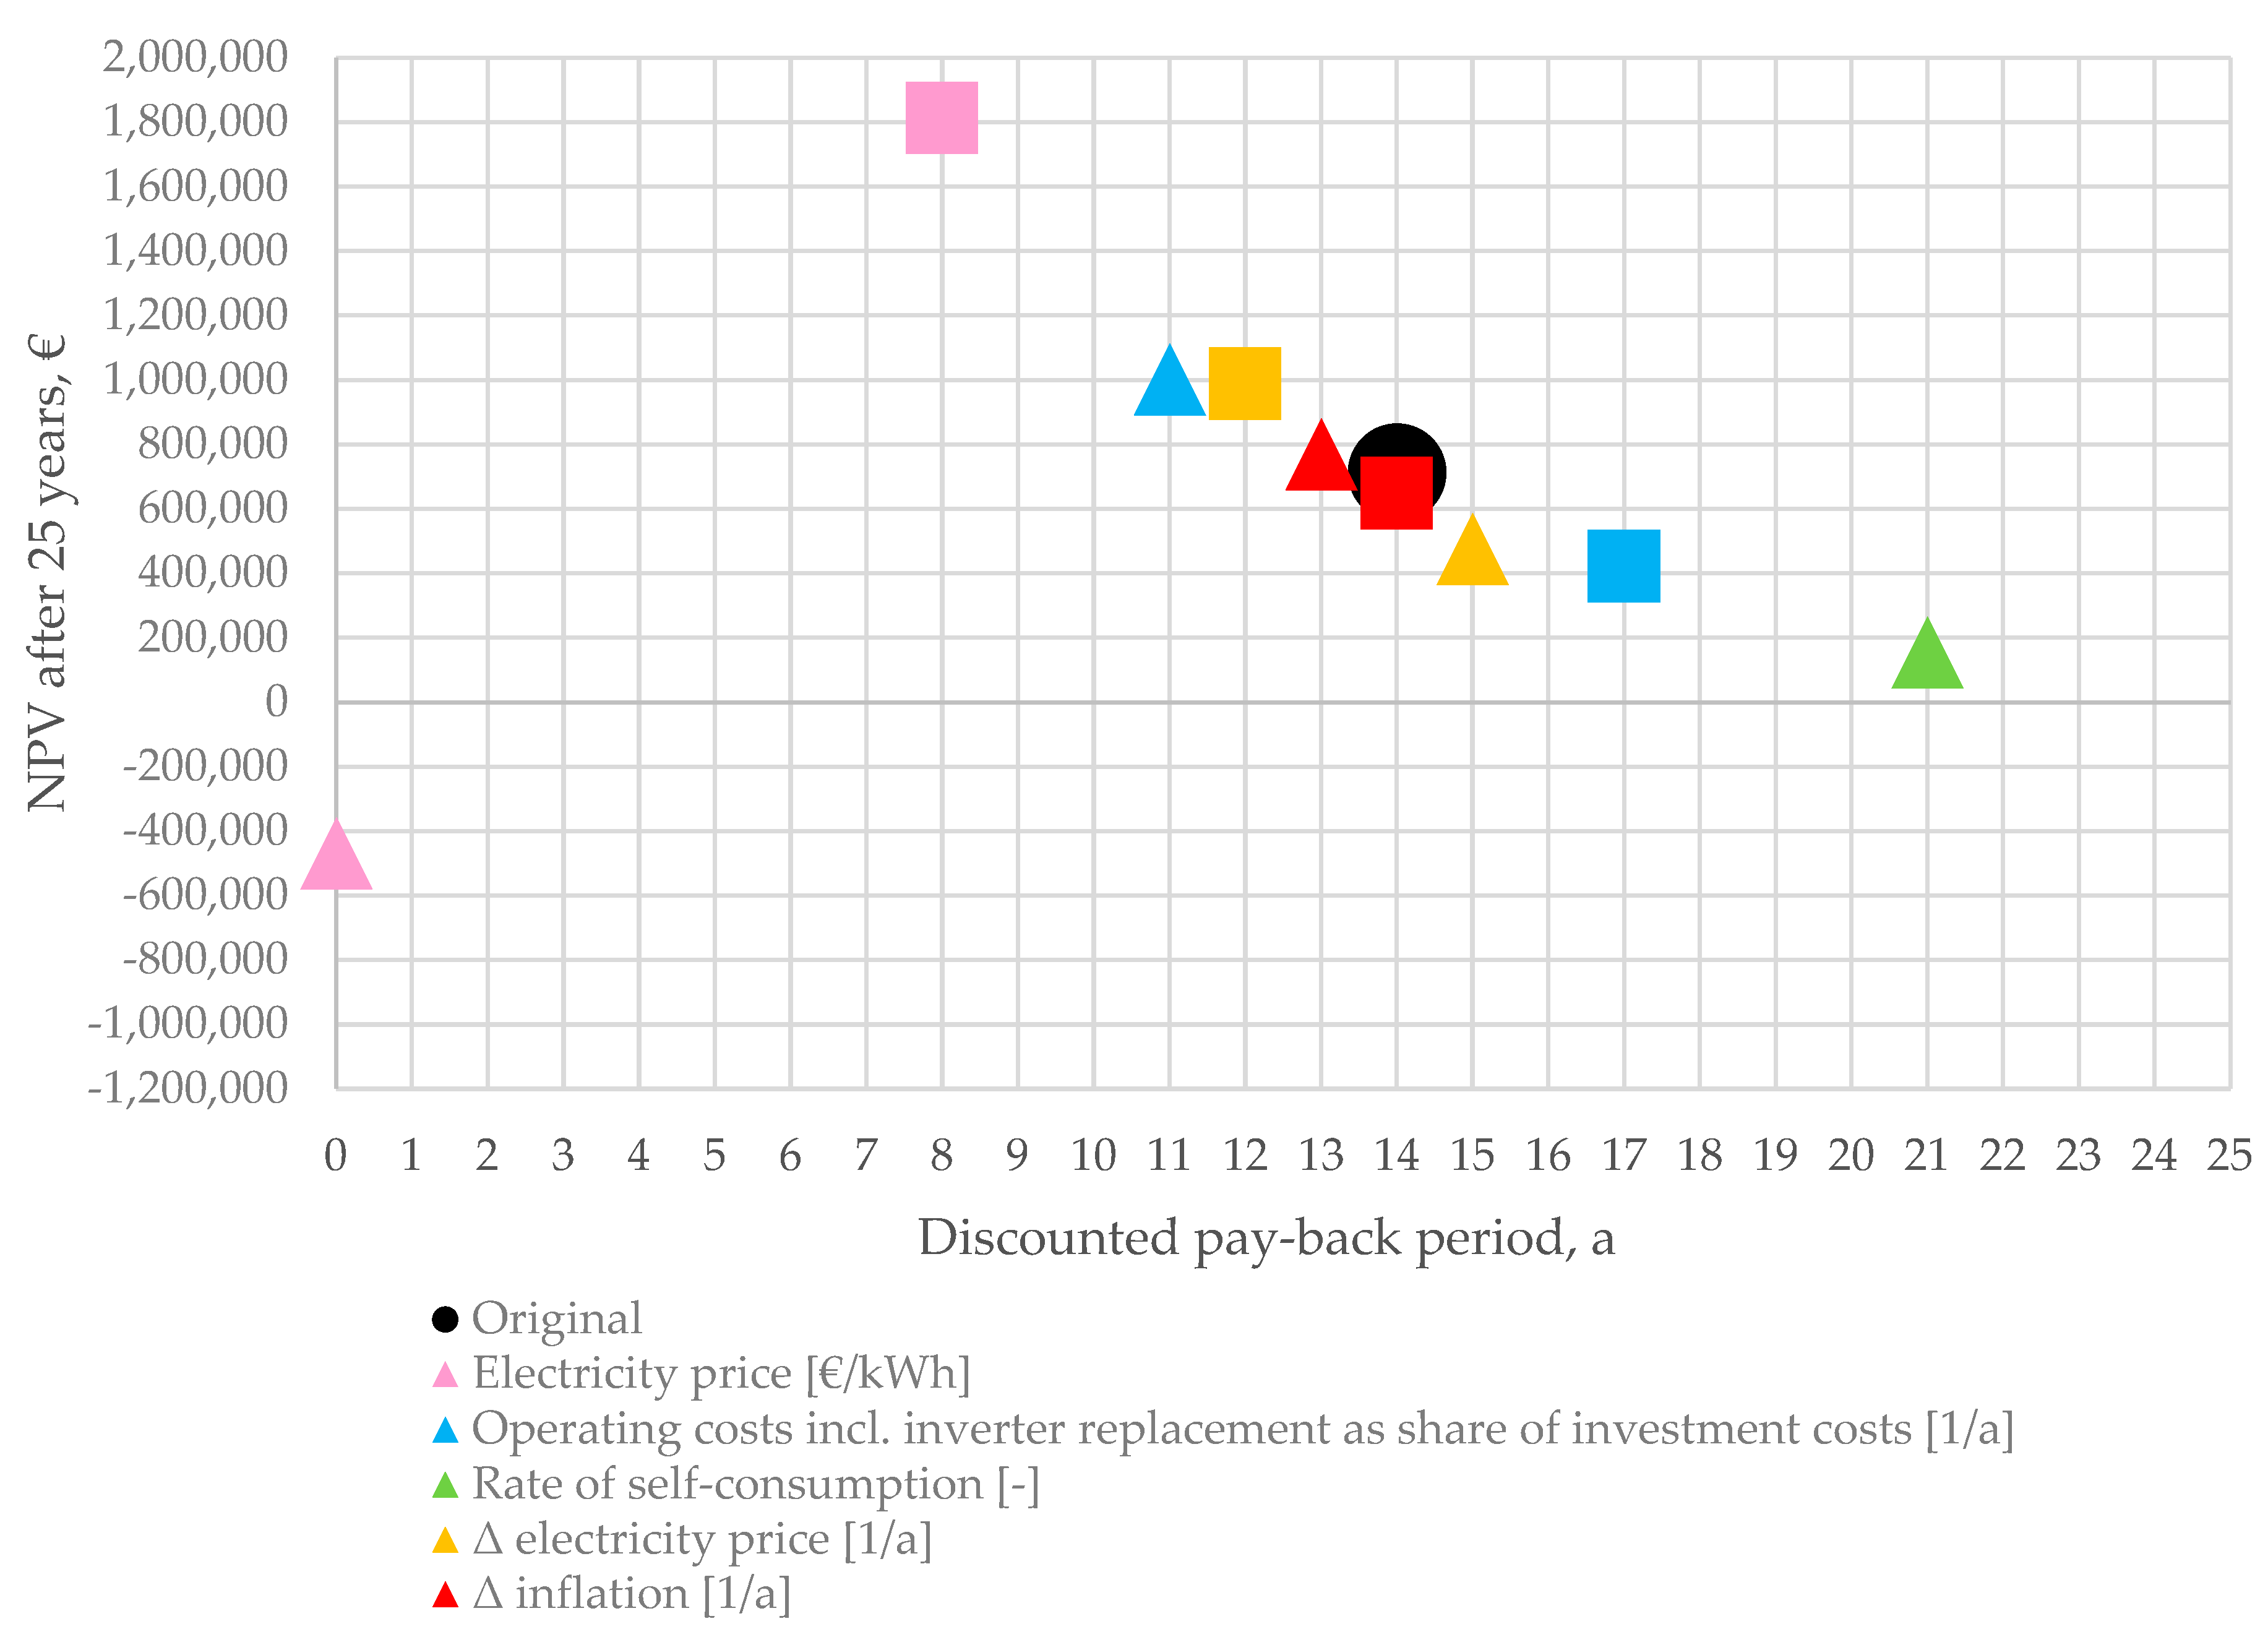
2.5.9. Sensitivity Analysis
In order to evaluate the effects of the various input parameters presented in this chapter, a sensitivity analysis was also conducted. The conducted sensitivity analysis evaluated the effects on the NPV and the DPB for Cases 1, 2, and 3 for both debt-financing and CPI-financing by adapting a number of input parameters by +/−50%. The respective input parameters as well as their respective original and in-/decreased values are shown in
Table 2. The effects of the specific investment costs have deliberately not been evaluated in the sensitivity analysis given that Cases 1, 2 and 3 already indicate the importance of the specific investment costs on the NPV as has already been implied by [
33].
3. Results
Table 3 shows the site-specific input data of the five separate PV power plants considered as one PV power plant, given that all five PV power plants are to be implemented and financed as one cohesive PV-CPI.
Table 3 uses Equations (2) through (4), as shown below, to calculate the weighted average of the five companies that are part of this case study.
WAseg—weighted average specific electricity generation, kWh/kWp/a
Pi—Power PV power plant per company, kWp
segi—specific electricity generation per company, €/kWp
WAep—weighted average electricity price, €/kWh
Ei—annual electricity consumption per company, kWh/a
epi—electricity price per company, €/kWh
WAsc—weighted average self-consumption, %
Gi—annual PV electricity generation per company, kWh/a
sci—self-consumption per company, %
In addition,
Table 4 shows the specific investment costs considered for the scenario analysis that also serves the purpose of evaluating potential financial gains that can be obtained through a joint purchase of these PV power plants as well as differences in offers for the installation of a PV power plant from different providers. The weighted average of specific investment costs for Case 1, as shown in
Table 4, were calculated using Equation (5) below.
WAic—weighted average specific investment costs, €/kWp
Pi—power PV power plant per company, kWp
ici—specific investment costs per company, €/kWp
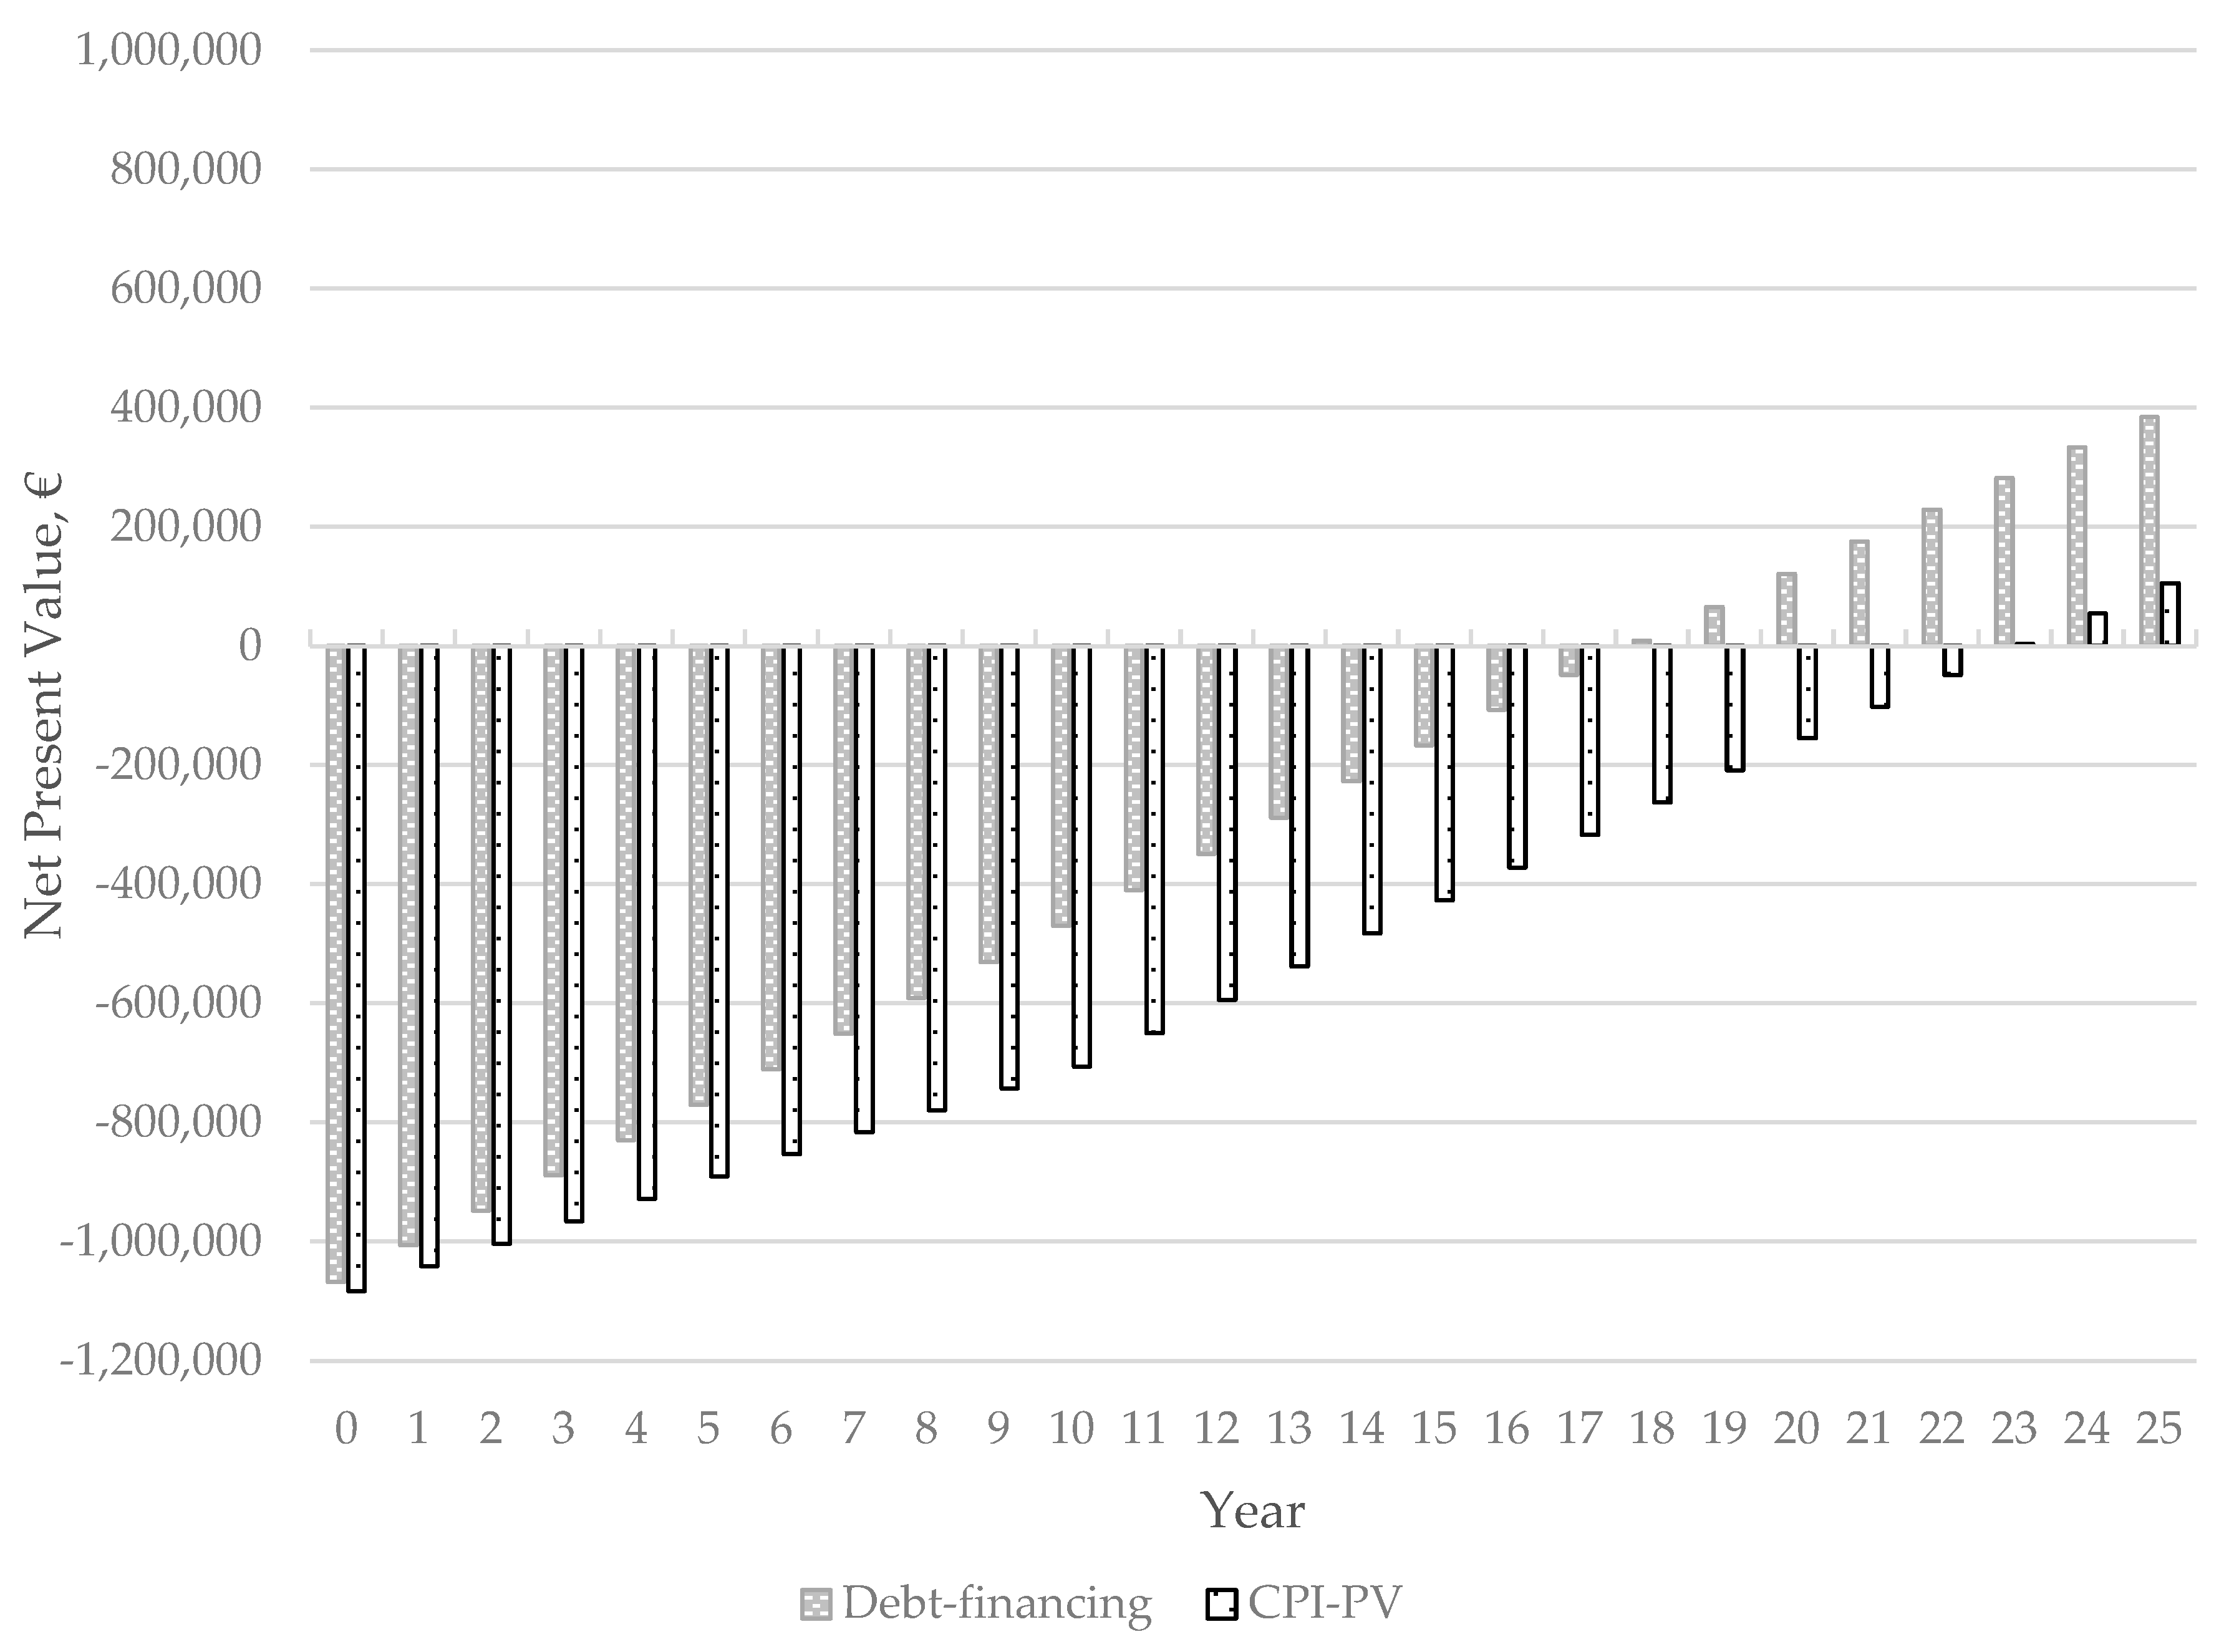
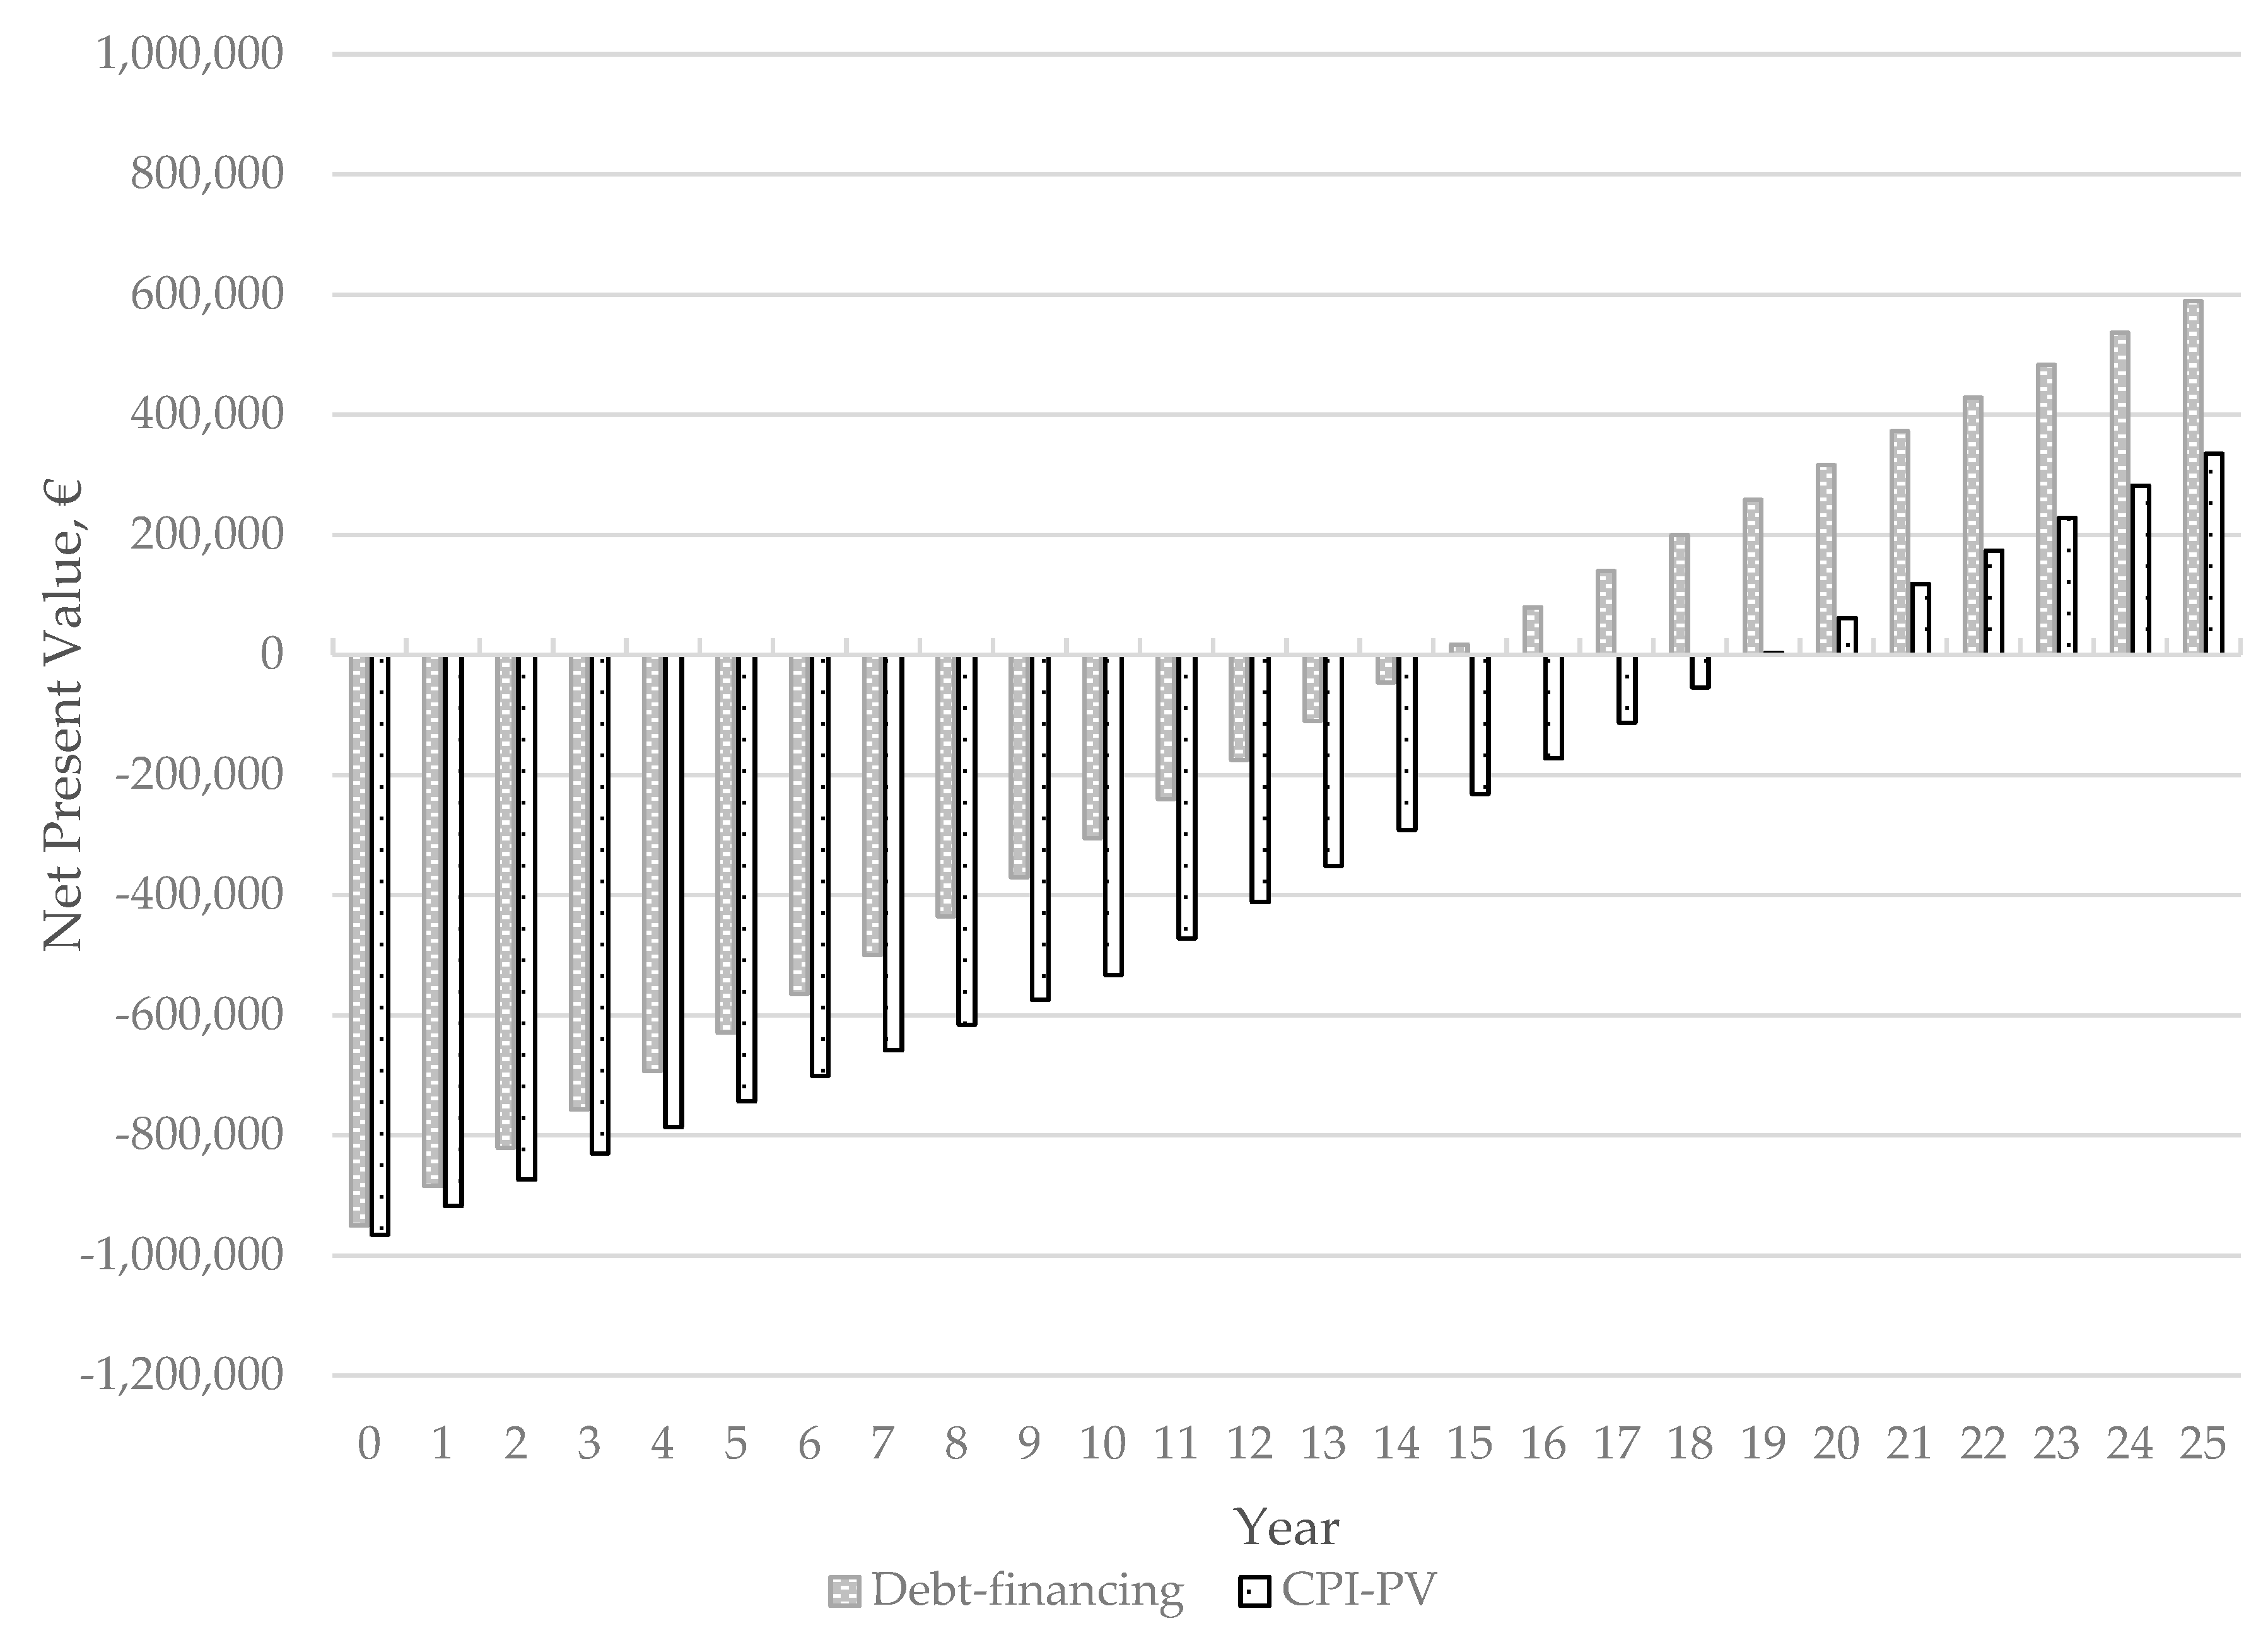
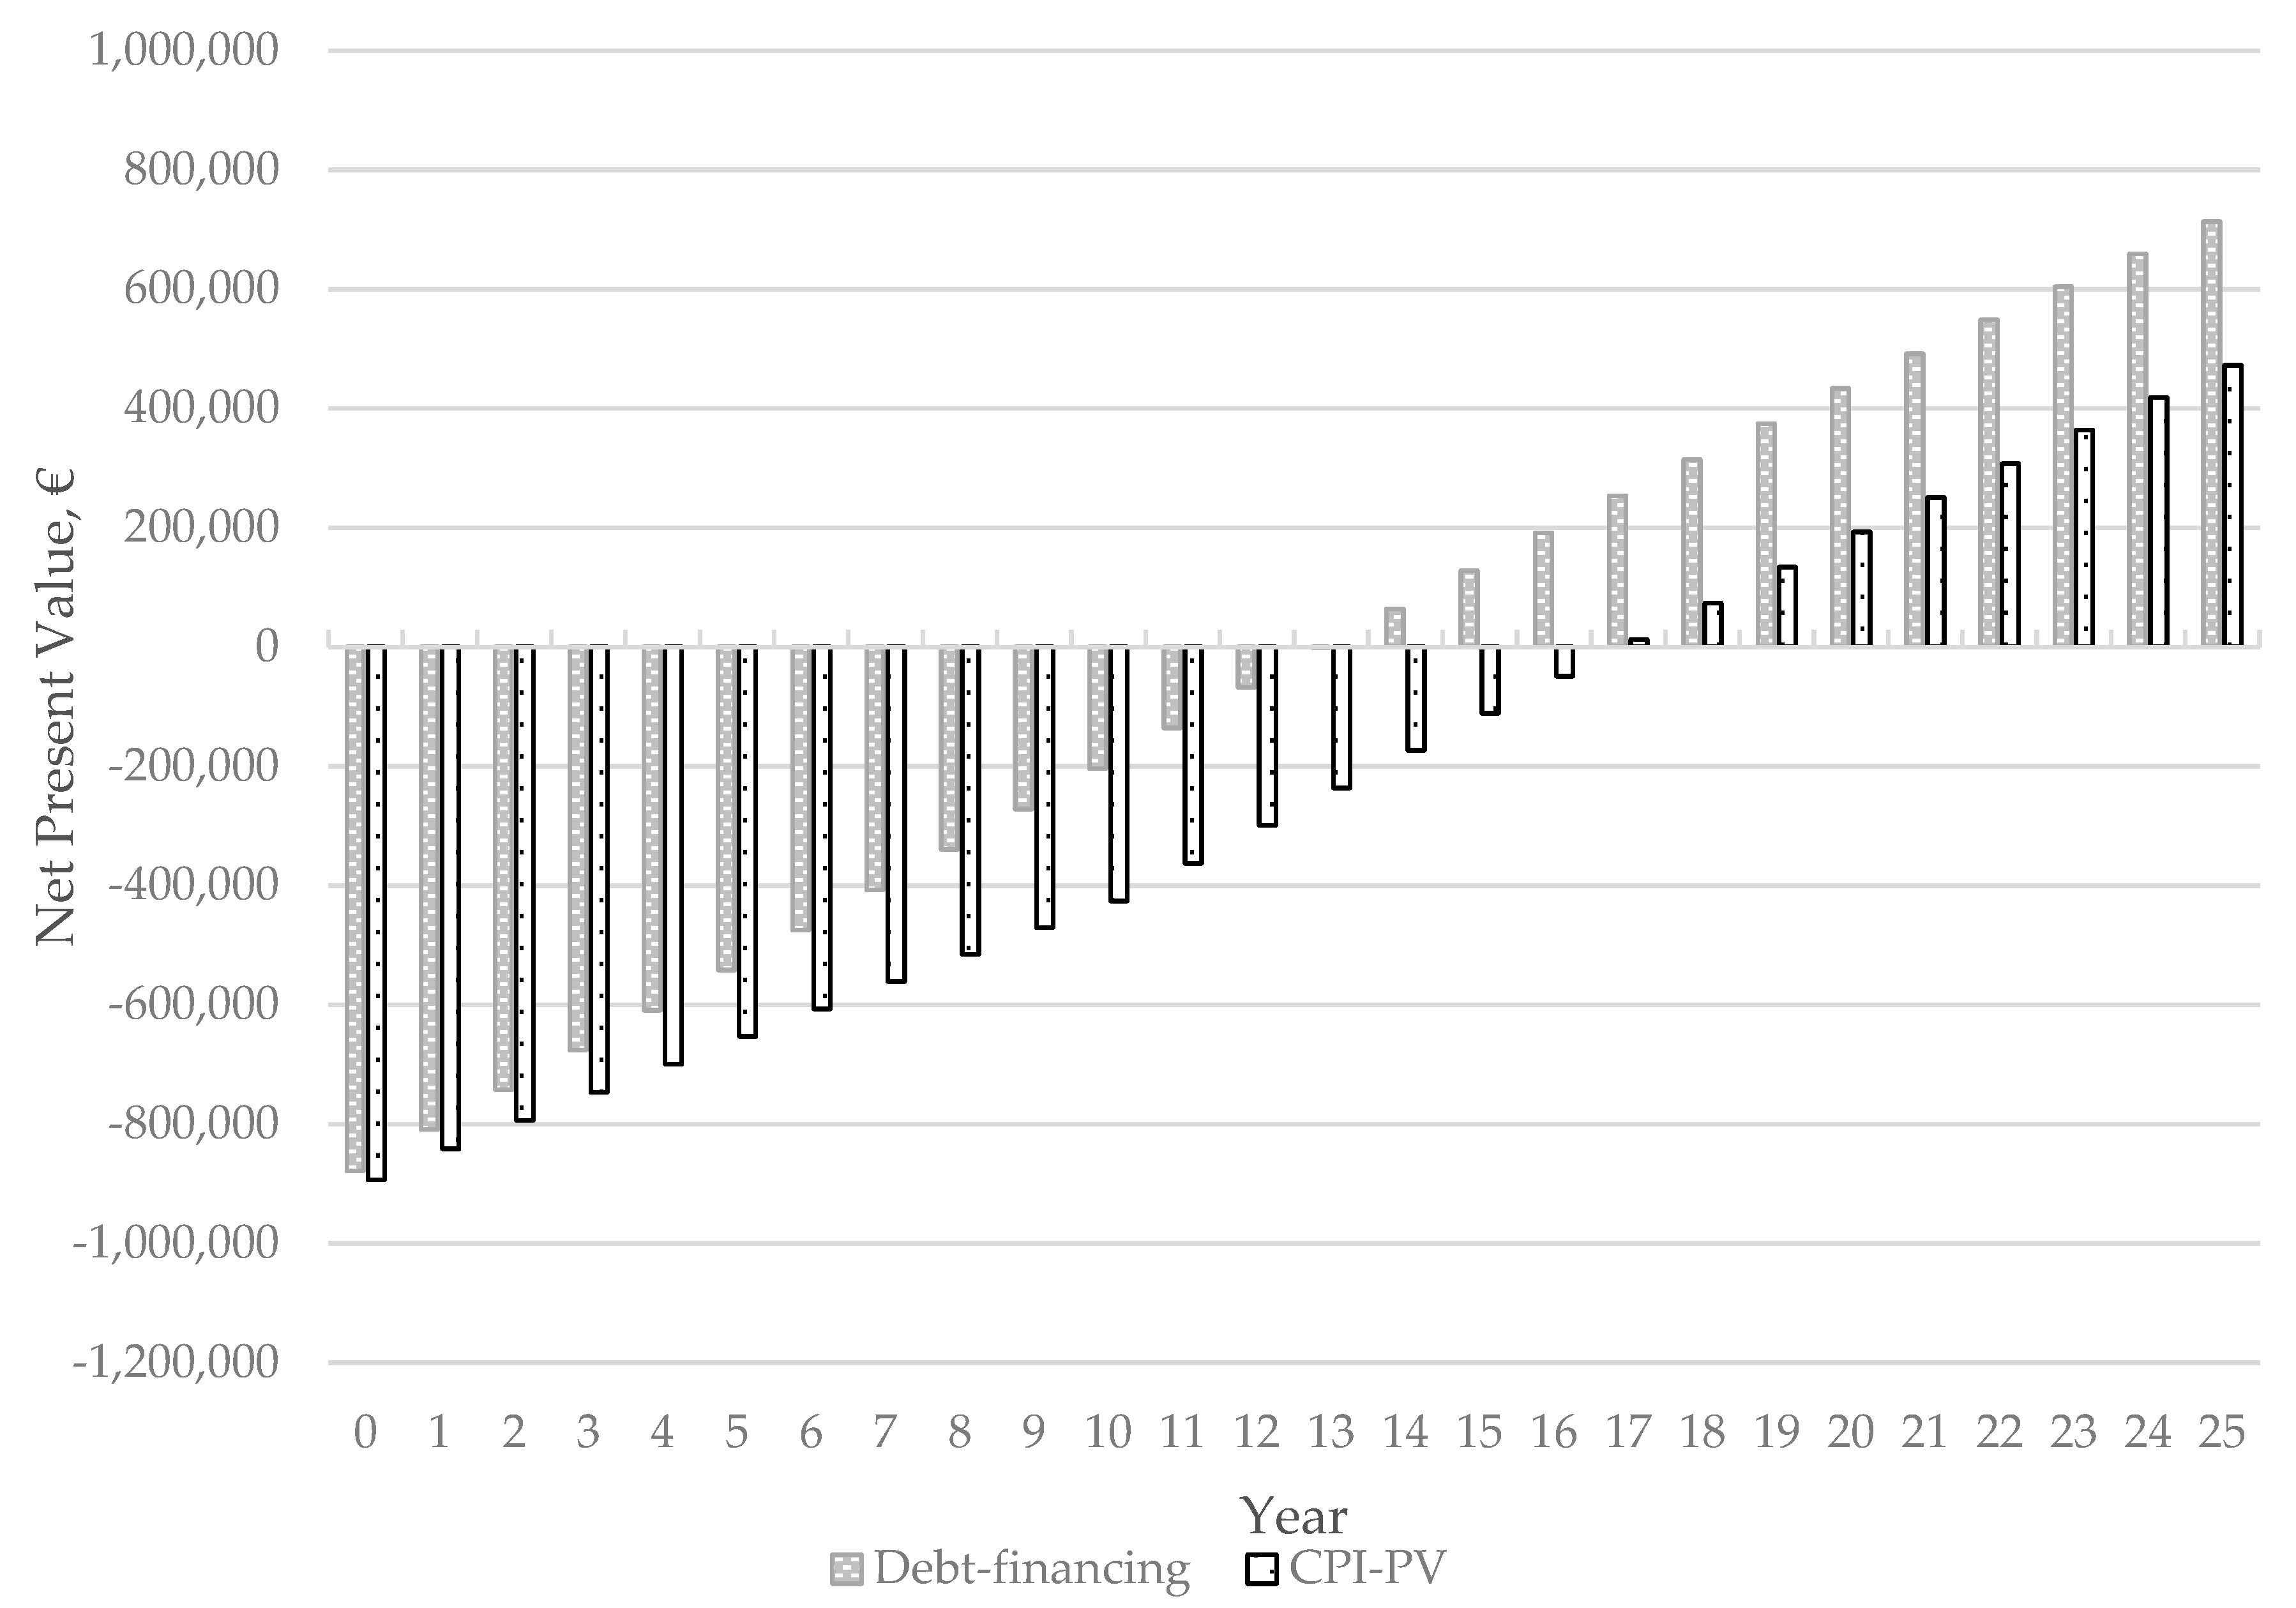
Figure 2,
Figure 3 and
Figure 4 show the results of the NPV for the different cases, where the difference in the NPV as well as the DPB between a standard debt-financing and the PV-CPI financing as well as the improved results that are assumed to occur due to a joint purchase of the PV power plants can be seen.
Table 5 shows a summary of the results for the NPV after the useful lifetime of 25 years as well as the break-even year (i.e., NPV ≥ 0).
Furthermore, the sensitivity analysis (see
Appendix A for the most relevant variations) showed that based on the model applied to calculate the NPV, the most relevant input parameters on the NPV are the:
- (1)
electricity price,
- (2)
rate of self-consumption,
- (3)
operating costs,
- (4)
annual change in electricity price,
- (5)
inflation, and
- (6)
and the interest rate of the CPI-scheme (in case of CPI-financing).
4. Discussion
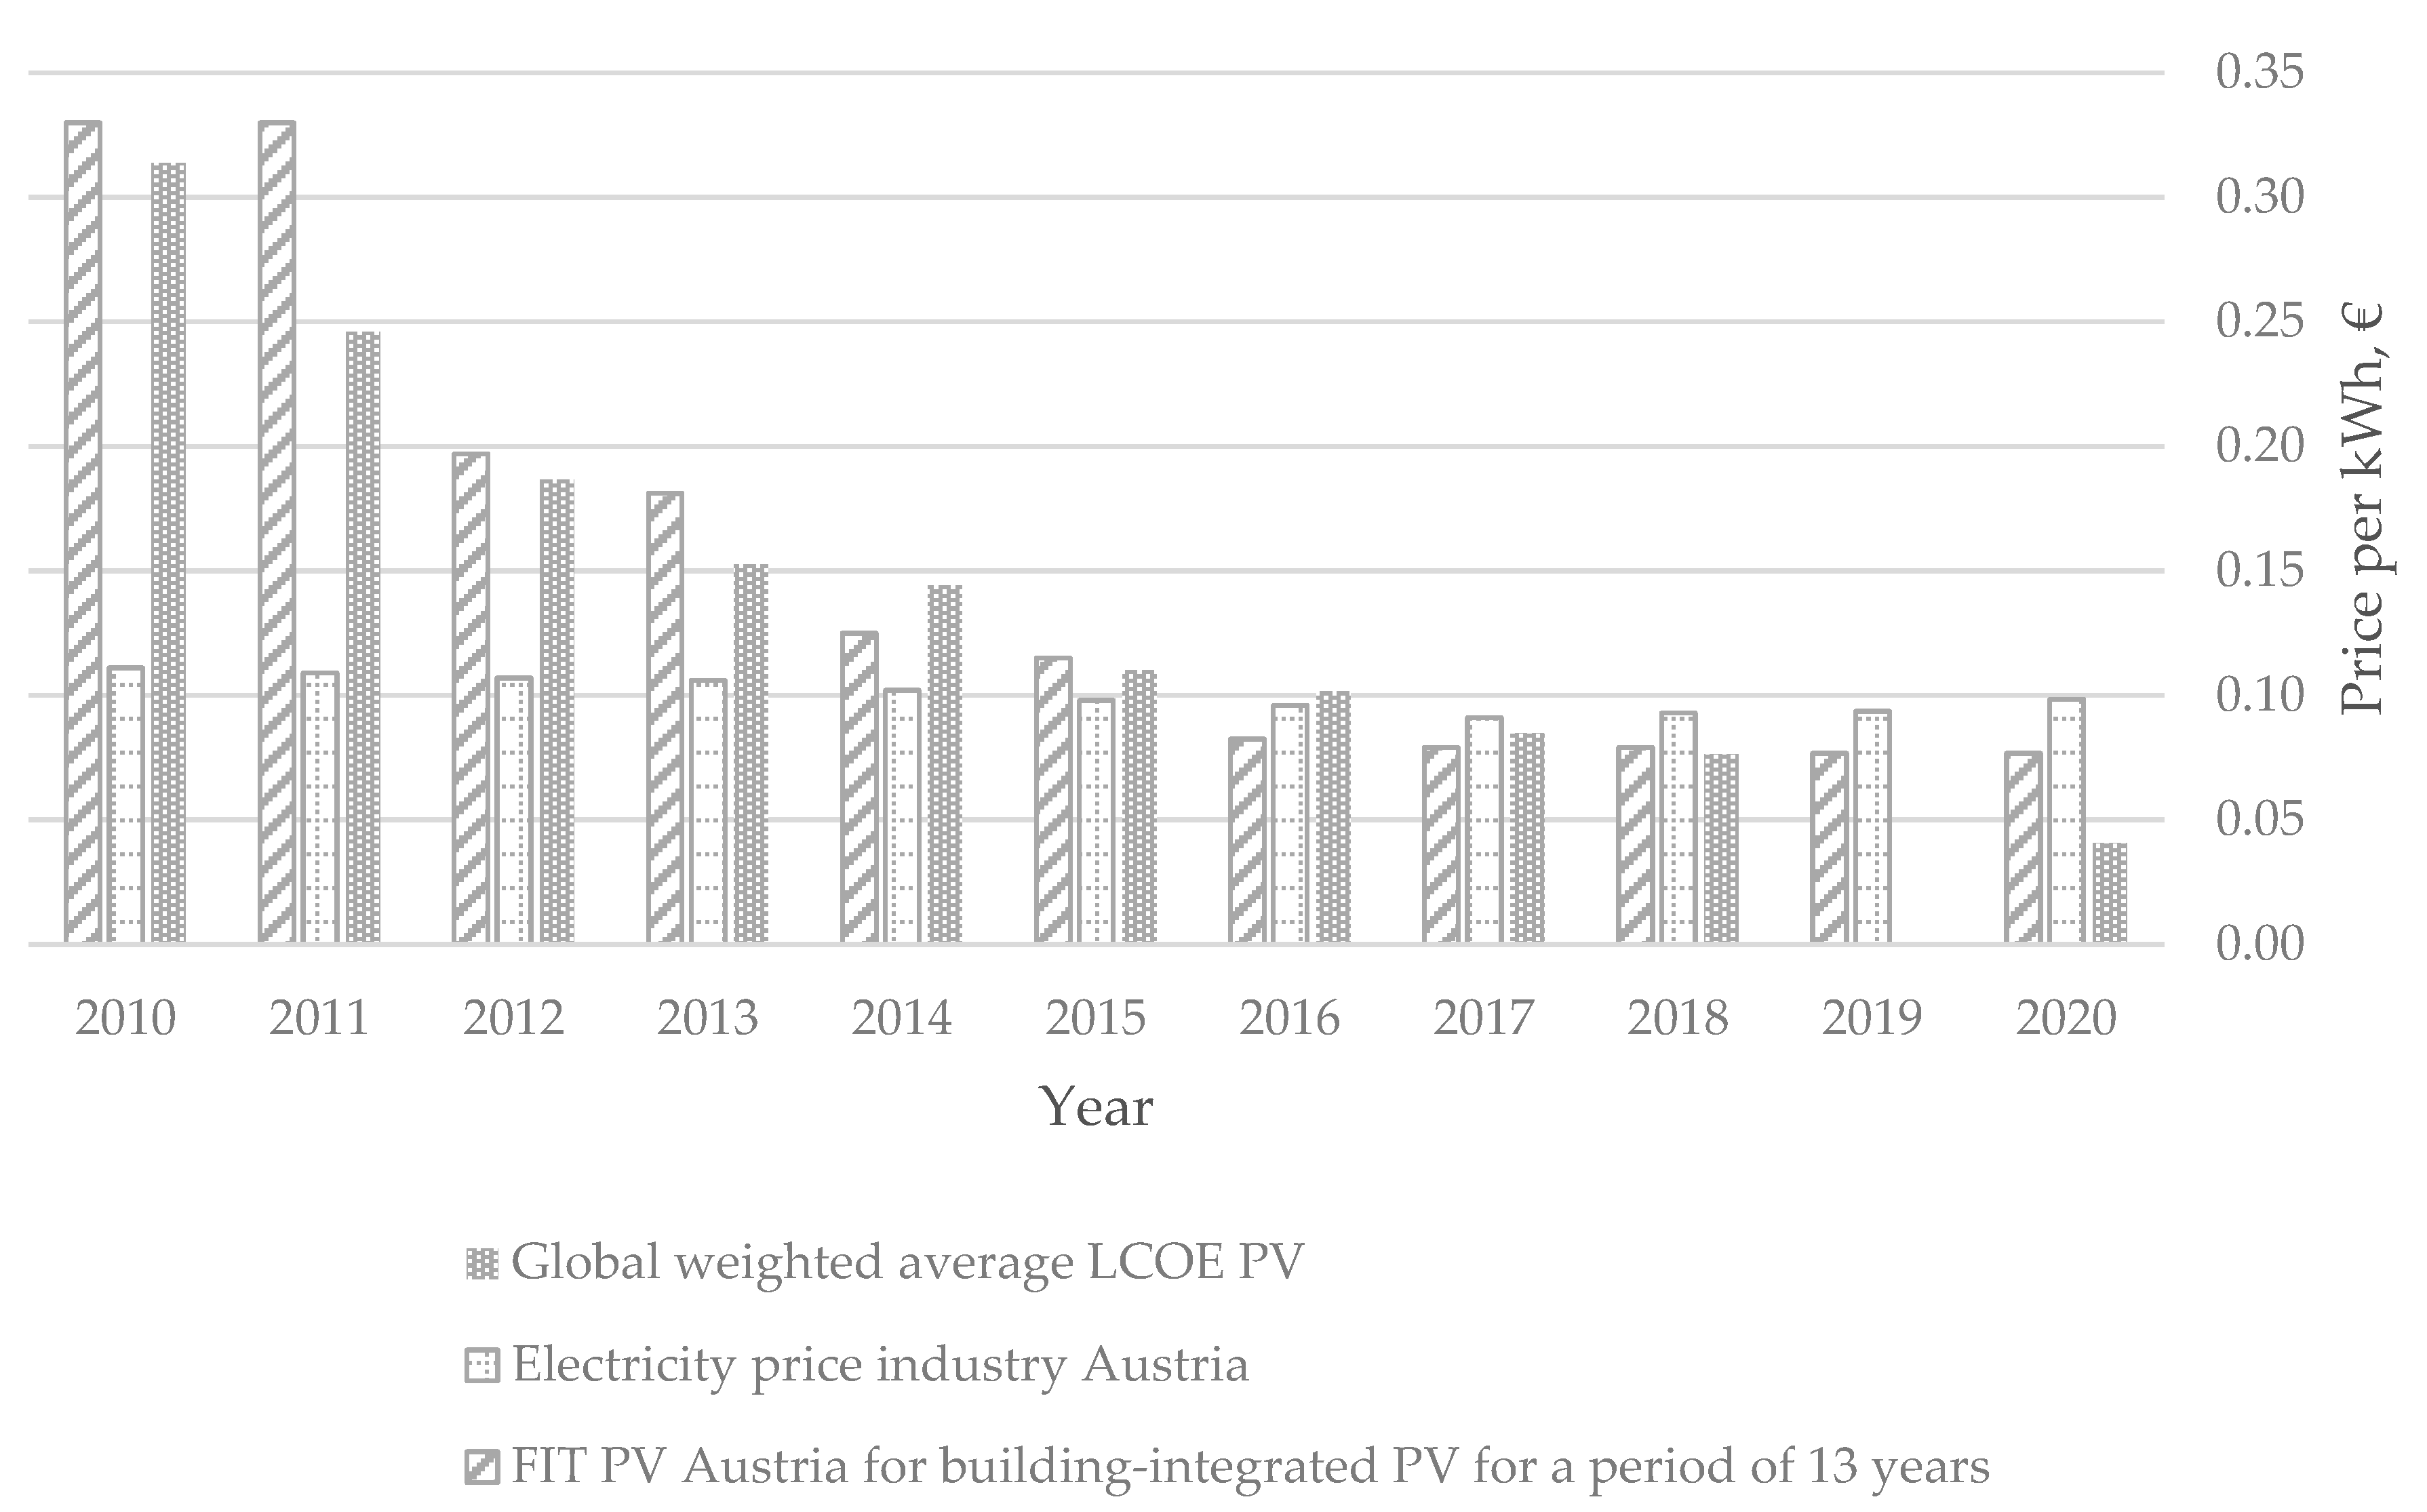
In all five companies, the installed PV power plants and the induced costs of installing and running them showed competitive prices when comparing them to the companies’ current electricity bills. This result mirrors a comparison of current average levelized costs of electricity (LCOE) generated from PV power plants as well as average electricity prices for the Austrian industrial sector, as shown in
Figure 5 of the comparable LCOE values for rooftop PV power plants on Austrian business.
Looking back at the historical development, it can be noted that the LCOE generated by PV power plants has decreased significantly (on average 16.75% per year between 2010 and 2018) in the past [
46]. Even though regional/Austrian LCOEs of PV-generated electricity will differ (mainly due to varying amounts of annual global irradiance) from the global weighted average LCOE shown in
Figure 5, studies by the Fraunhofer-Institut ISE indicate that LCOE decreases of PV power plants in Germany (showing similar conditions as Austria) have also taken place over the last few years, having reached an LCOE range of between 0.0371 €/kWh and 0.1154 €/kWh in 2018 down from a range of 0.078 €/kWh to 0.142 €/kWh in 2013 [
36,
47].
This decrease in the global as well as regional LCOE has happened in parallel to the reduction of the feed-in-tariff (on average 14.96% per year between 2010 and 2018) in Austria [
10]. At the same time, the industrial sector’s electricity price has remained almost constant over the past 10 years while experiencing a drop in prices between 2010 and 2017 and slightly rising again after 2017 [
12].
Figure 5 also shows that around 2015, the average electricity prices of the industrial sector, the LCOE of PV power plants, and the FIT provided in Austria almost reached parity, with FITs falling below the average electricity price in 2016 and LCOE falling below the average electricity price in 2017. Between 2015 and 2017—with deviations depending on specific situations—it has thus become more economically feasible to invest in PV power plants on company roofs with a strong focus on self-consumption as opposed to feeding all of the generated PV electricity into the grid. The potential PV power plants on the company roofs under consideration do meet the requirement of a high rate of self-consumption, but it remains unclear whether they will actually be installed. Despite positive net present values over the plant’s useful lifetime, businesses are hesitant to invest in PV power plants given that the pay-back periods exceed 10 years and the usual industrial payback-periods of one to seven years [
48] cannot be achieved.
In the results presented above, applying the same specific PV investment costs when comparing debt-financing with PV-CPI financing naturally shows clear financial advantages of debt-financing over PV-CPI financing. However, when comparing results of debt-financing and PV-CPI financing of different cases, the NPV of the PV-CPI financing in Case 3 was higher than the NPV of the debt-financing scheme in Case 1 due to assumed economies of scale with respect to the specific investment costs. Therefore, limiting the energy cooperation of the five companies to only a joint purchase would lead to the highest financial return under the assumptions made, but a mere energy cooperation would fail to incorporate non-financial benefits that are associated with energy CPI-projects or crowdfunding such as:
- (a)
renewal of or adding to a company’s value proposition;
- (b)
increasing customer/employee/investor engagement and satisfaction [
49];
- (c)
enabling people to take part in the energy transition without hosting a renewable energy plant on their home;
- (d)
staying closely in touch with the project (in this case the PV power plant/the company);
- (e)
providing investors with the chance to voice their own attitudes by investing in the project;
- (f)
addressing underserved groups of people to invest in renewable energies,
- (g)
community participation [
50];
- (h)
identification with the energy project/the company;
- (i)
allowing investors to contribute to measures that potentially help to mitigate climate change [
18];
- (j)
increasing the degree of acceptance of renewable energy power plants; and
- (k)
increasing trust and support for the project developer [
51].
Given that currently no examples of such PV-CPI projects on company roofs that generate income through self-consumption of generated electricity are known in Austria and research on company-internal debt-crowdfunding is scarce, it has yet to be investigated whether the above-mentioned non-financial benefits of investing in a PV-CPI also hold true for cases such as the one analyzed in this paper. Moreover, further research will have to determine whether these non-financial benefits are deemed sufficient by participating companies to compensate the additional costs of establishing and operating such a CPI-scheme (as opposed to a simple joint purchase with debt- or equity-financing).
Combining a PV-CPI with the focus of generating income through self-consumption should also allow commercial operators to increase the PV capacity offered under such PV-CPIs by no longer relying on FIT that are the predominant source of income of PV-CPIs in Austria [
52]. In addition, establishing such a self-consumption PV-CPI with a contracting scheme that reduces the financial risk for participating companies can potentially increase the attractiveness for involved stakeholders, especially if the operator of the PV-CPI also acts as the contractor.
Increasing the number of companies that take part in such a PV-CPI is likely to also increase the economies of scale with respect to the specific investment costs, which may provide opportunities for commercial operators.
Since both a joint purchase of PV power plants as well as setting up a PV-CPI scheme that involves several companies is a form of energy cooperation, it seems evident that establishing a project of this kind can be more easily implemented by the inclusion of some sort of facilitator as has also been noted by [
53].
5. Conclusions
The companies taken into consideration were all suited for the installation of PV power plants with respect to a high rate of self-consumption. In four out of the five companies, usage of the maximum rooftop area resulted in self-consumption rates above 80%. One of the companies featured a rooftop space that exceeded the amount necessary to provide a self-consumption rate of 80%, in which case the PV power plant was set to equal the power output that resulted in a self-consumption rate of 80%.
Even though price discounts for a joint purchase of PV systems will be subject to negotiations, it is plausible to assume that a discount (to some extent) will be provided in the case of a joint purchase, which would result in significant improvements with respect to the NPV as well as the break-even point. In all considered cases, the break-even point will be reached within the technical useful lifetime of the PV system of 25 years. Moreover, it can be assumed that the real life-time of the PV panels is above 25 years and will thus likely produce electricity longer [
54].
For private investors, investing in a PV-CPI shows clear advantages over conservative options for accumulating savings. This is clearly shown in
Figure 6, depicting the development of interest rates for bank deposits (which are one of the most used financial saving options in Austria [
55]) as well as the inflation, which clearly illustrates that not only are current interest rates below the 3% assumed in the PV-CPI, but also that the inflation is above current interest rates, resulting in a de facto depreciation of financial assets that are saved as bank deposits, making PV-CPIs competitively interesting for private investors. Especially when establishing the participation scheme in such a way that interest rates are returned to investors in the form of product vouchers, this kind of investment scheme is well suited to promote participating businesses.
The interest rate of 3% offered is—despite being higher than in utility PV-CPI cases where interest payments are returned as actual money—still lower than exemplary interest rates provided for investing in PV-CPIs where the interest is paid back in the form of vouchers [
58,
59], which shows that offering interest in the form of product vouchers can allow for the possibility to offer higher interest rates while at the same time directing income back into the regional economy.
Whether the additional costs for establishing and administering a PV-CPI are deemed enough compensation and thus considered acceptable to participating companies and/or whether these additional costs can be compensated by the joint purchase of PV power plants will be based on the individual decisions of each company participating in a PV-CPI project.
In light of the challenges that the necessary transition toward a carbon neutral society poses, however, it seems reasonable to support such participation schemes on company roofs both by mitigating barriers for their implementation as well as through financial support in order to positively affect the number of successfully implemented installations.
In addition, pushing such PV-CPI schemes on company roofs is expected to increase the realistic potential for PV power plants on company roofs in Austria of currently 1.8 TWh by 2030 toward the economically feasible potential of 3.6 TWh by 2030, thus helping to achieve 100% electricity from renewable energy sources by 2030 in Austria [
5].
Author Contributions
Conceptualization, M.L. and V.R.; Methodology, M.L., V.R., and S.M. and A.K.; Formal analysis, V.R. and S.M.; Writing—original draft preparation, M.L.; Writing—review and editing, M.L., V.R., S.M., and A.K.; Visualization, M.L. All authors have read and agreed to the published version of the manuscript.
Funding
This research has received funding from the European Union’s Horizon 2020 research and innovation program under grant agreement No. 785134.
Institutional Review Board Statement
Not applicable.
Informed Consent Statement
Not applicable.
Data Availability Statement
Data sharing not applicable.
Acknowledgments
This study was conducted as part of the project S-PARCS-Envisioning and Testing New Models of Sustainable Energy Cooperation and Services in Industrial Parks, which is funded by the European Union’s Horizon 2020 research and innovation program under grant agreement no. 785134. We cordially thank all stakeholders at the Ennshafen industrial business park for their support and contributions.
Conflicts of Interest
The authors declare no conflict of interest.
Abbreviations
| CPI | Citizen participation initiative |
| DPB | Discounted pay-back period |
| FIT | Feed-in tariff |
| GWh | Gigawatt-hour |
| GWp | Gigawatt peak |
| kWh | Kilowatt-hour |
| kWp | Kilowatt peak |
| LCOE | Levelized costs of electricity |
| MW | Megawatt |
| MWp | Megawatt peak |
| NPV | Net present value |
| PV | Photovoltaic |
| PV-CPI | photovoltaic citizen participation initiative |
| TWh | Terrawatt-hour |
Appendix A
The following
Figure A1,
Figure A2,
Figure A3,
Figure A4,
Figure A5 and
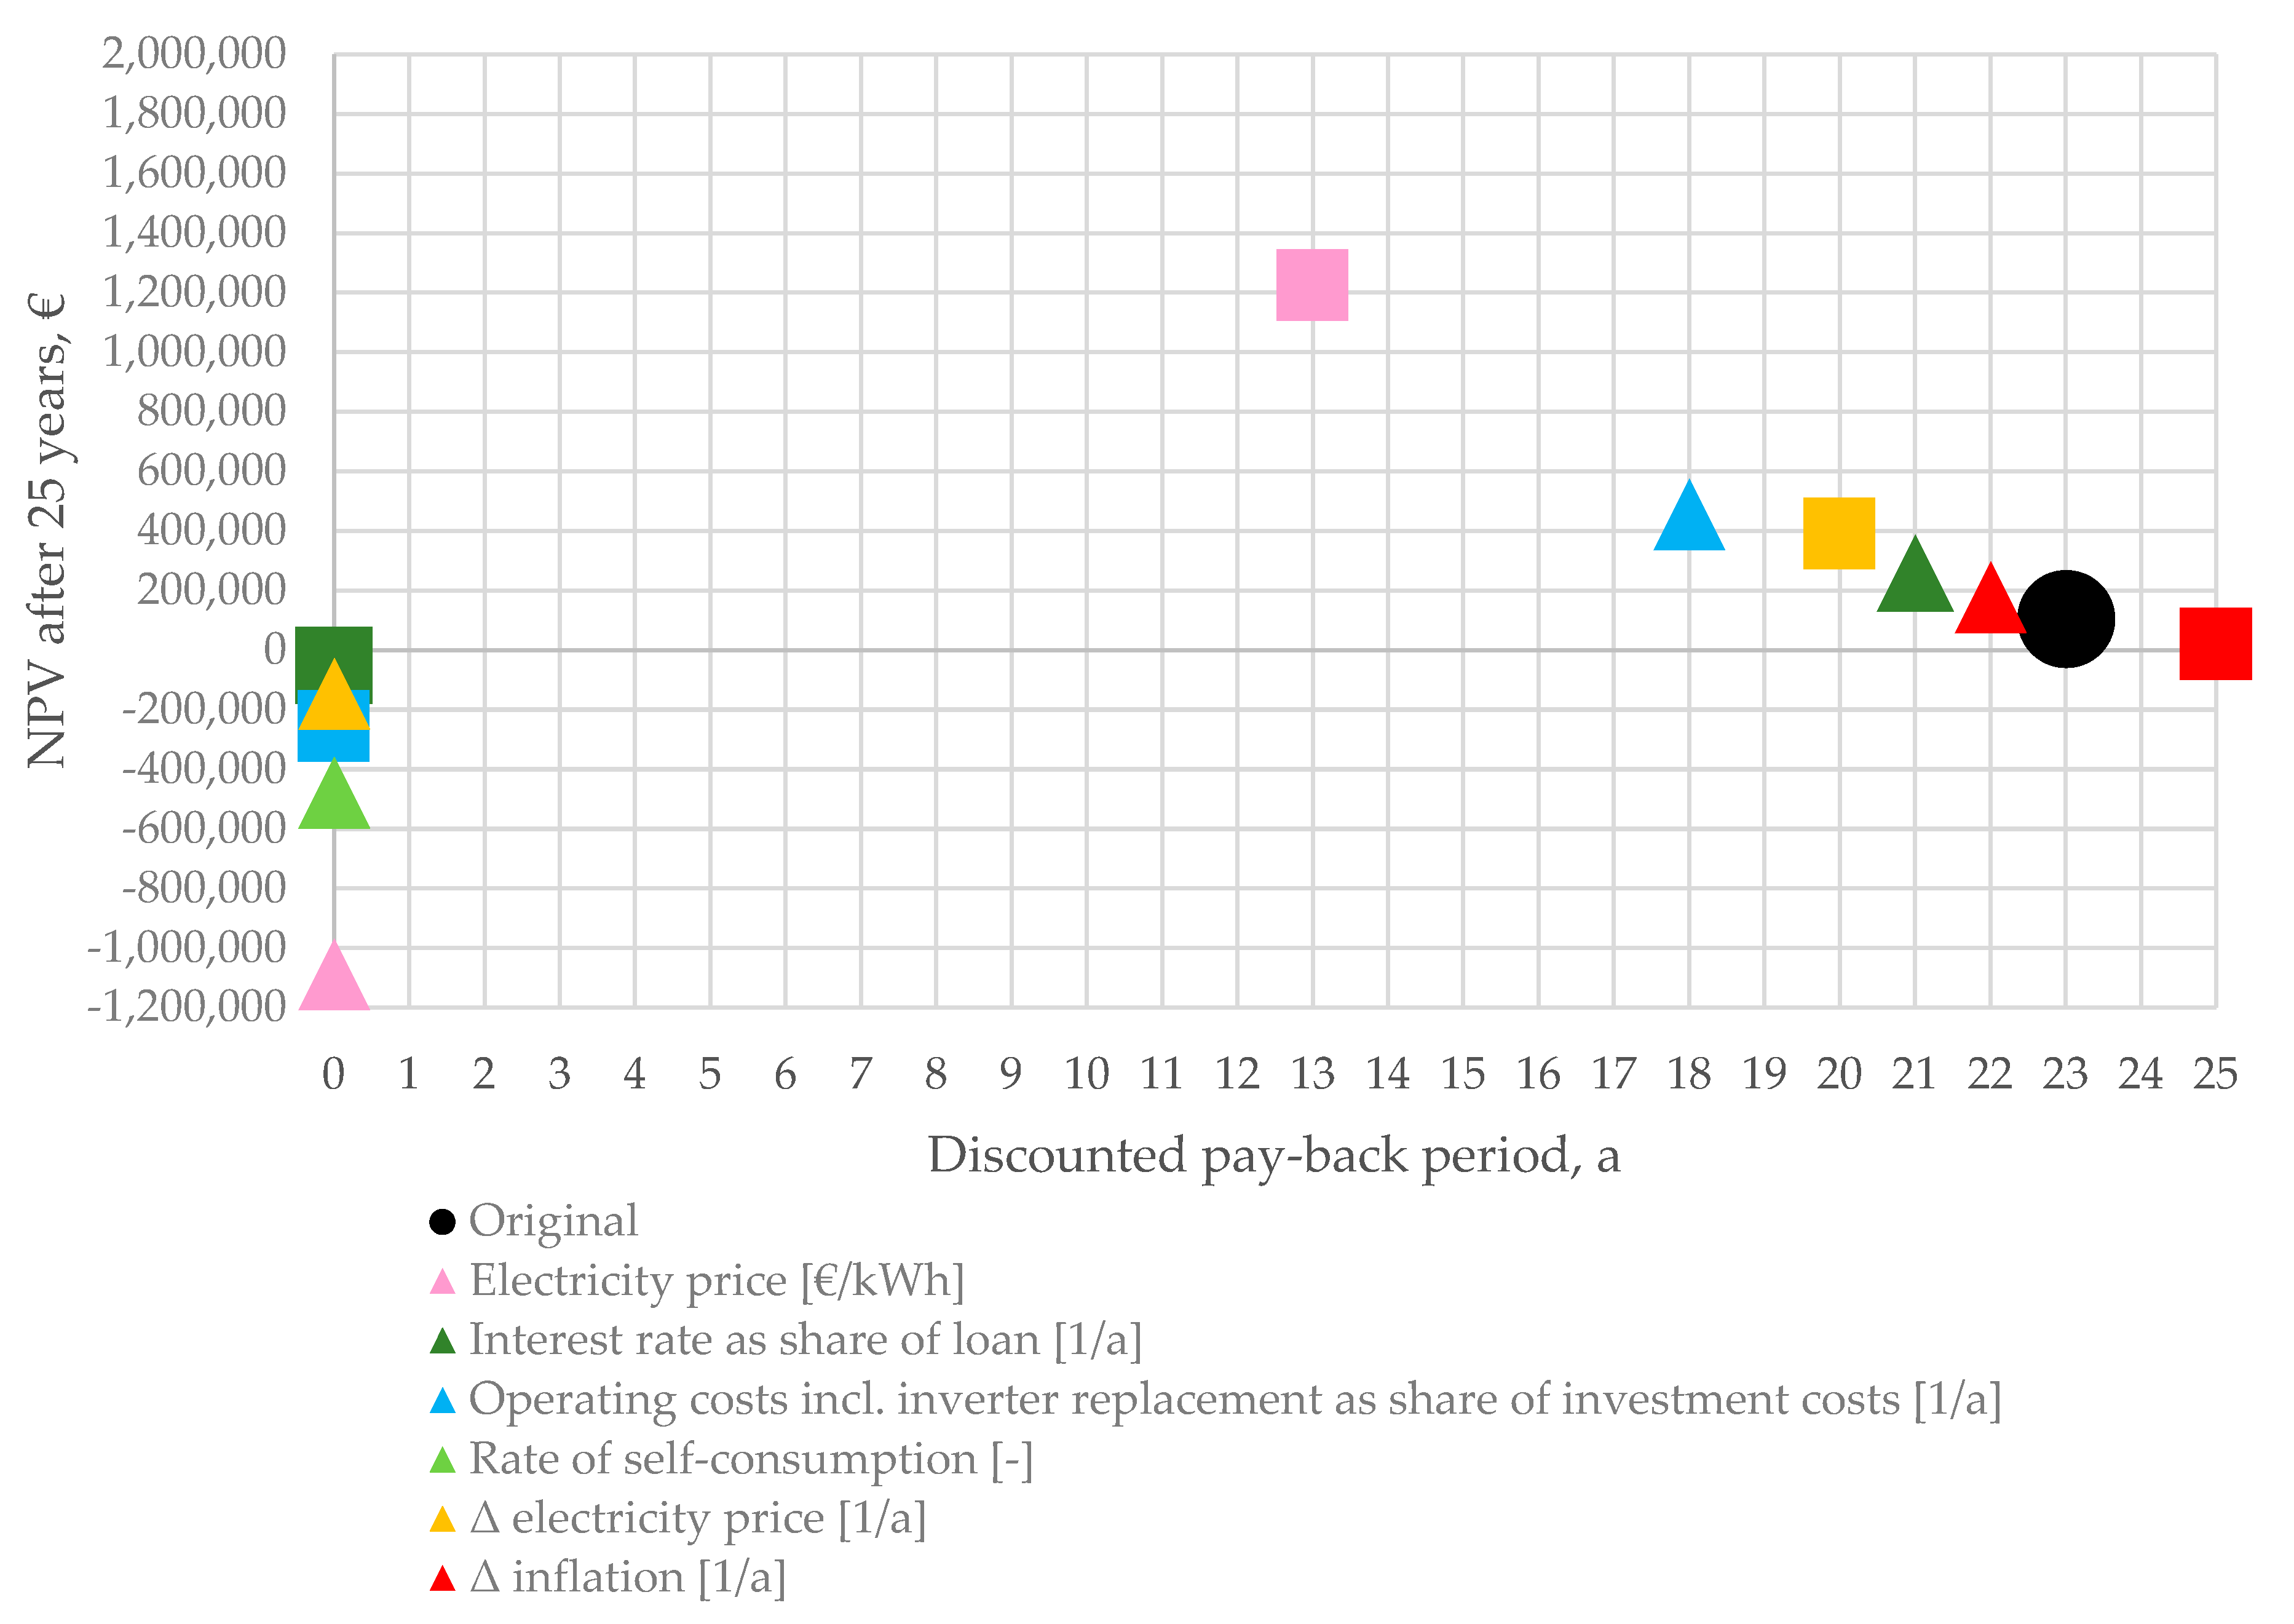
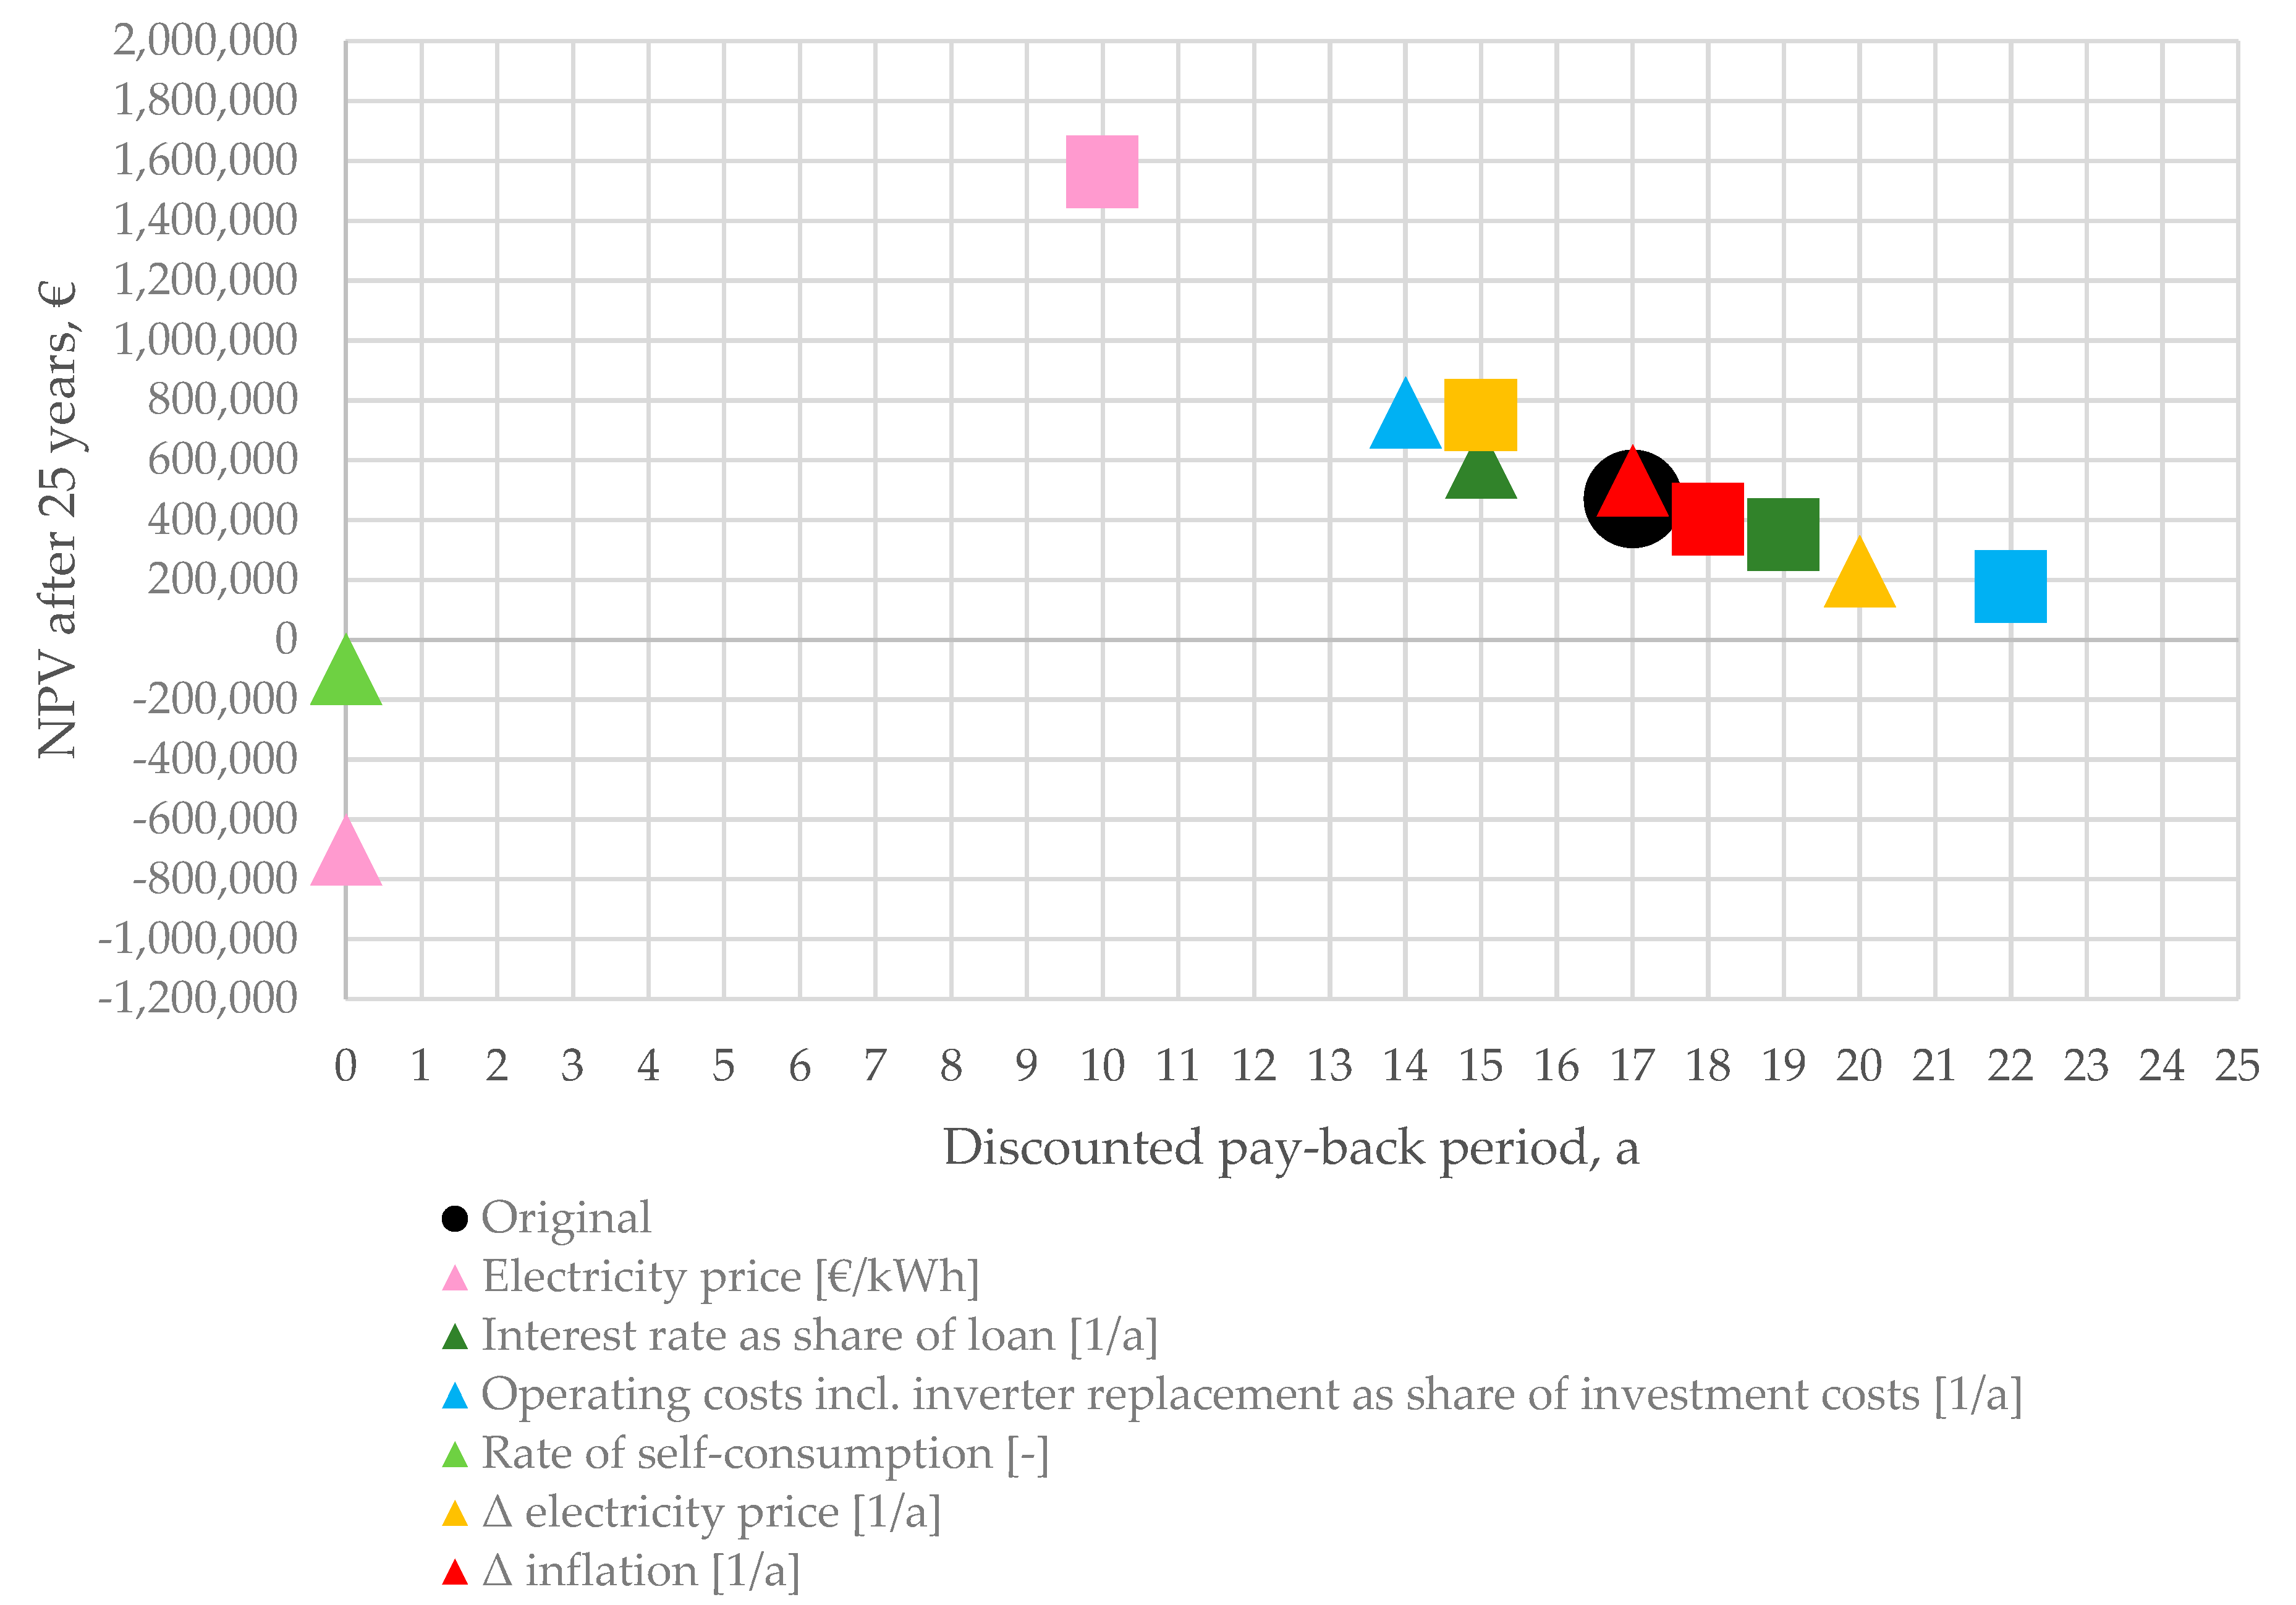
Figure A6 show the most important results of the sensibility analysis for Cases 1–3 in the case of debt- and CPI-financing (i.e., the results on the NPV and the DPB of the most influential input parameters based on a +/−50%-change of the latter). In
Figure A1,
Figure A2,
Figure A3,
Figure A4,
Figure A5 and
Figure A6, squares represent the NPV/DPB as a result of +50%-changes of the original value, whereas triangles represent the NPV/DPB as a result of −50%-changes of the original value. The black dot represents the NPV/DPB based on the original values. DPB-values of 0 represent a pay-back-period after the assumed useful lifetime of 25 years.
Figure A1.
Sensibility analysis of Case 1 debt financing.
Figure A1.
Sensibility analysis of Case 1 debt financing.
Figure A2.
Sensibility analysis of Case 2 debt financing.
Figure A2.
Sensibility analysis of Case 2 debt financing.
Figure A3.
Sensibility analysis of Case 3 debt financing.
Figure A3.
Sensibility analysis of Case 3 debt financing.
Figure A4.
Sensibility analysis of Case 1 CPI-financing.
Figure A4.
Sensibility analysis of Case 1 CPI-financing.
Figure A5.
Sensibility analysis of Case 2 CPI-Financing.
Figure A5.
Sensibility analysis of Case 2 CPI-Financing.
Figure A6.
Sensibility analysis of Case 3 CPI-Financing.
Figure A6.
Sensibility analysis of Case 3 CPI-Financing.
References
- Biermayr, P.; Dißauer, C.; Eberl, M.; Enigl, M.; Fechner, H.; Fürnsinn, B.; Jaksch-Fliegenschnee, M.; Leonhartsberger, K.; Moidl, S.; Prem, E.; et al. Innovative Energietechnologien in Österreich Marktentwicklung 2019; Bundesministerium: Vienna, Austria, 2020. [Google Scholar]
- Bundesministerium für Nachhaltigkeit und Tourismus. Integrierter Nationaler Energie- und Klimaplan für Österreich Periode 2021–2030; Bundesministerium für Nachhaltigkeit und Tourismus: Vienna, Austria, 2019; p. 107. [Google Scholar]
- 100% Strom aus Erneuerbaren Energien bis 2030. Available online: https://static1.squarespace.com/static/5b978be0697a98a663136c47/t/5c0944c0352f53e744eb3548/1544111379098/20181030_Position_kostromfrderung.pdf (accessed on 3 April 2020).
- Tracking Power. Available online: https://www.iea.org/reports/tracking-power-2019/solar-pv (accessed on 3 April 2020).
- Fechner, H. Ermittlung des Flächenpotentials für den Photovoltaik-Ausbau in Österreich: Welche Flächenkategorien Sind für Die Erschließung von Besonderer Bedeutung, um das Ökostromziel Realisieren zu Können; Endbericht: Vienna, Austria, 2020; p. 27. [Google Scholar]
- Wirtschaftslage und Prognose–Zinsen, Wechselkurse, Statistik Österreich, Wirtschaftsforschungsinsitut. 2020. Available online: http://wko.at/statistik/prognose/zinsen.pdf (accessed on 7 October 2020).
- Schreuer, A.; Weismeier-Sammer, D. Energy Cooperatives and Local Ownership in the Field of Renewable Energy-Country Cases Austria and Germany; Research Report; Vienna University of Economics and Business: Vienna, Austria, 2012; pp. 12–25. [Google Scholar]
- Haslinger, R.; Brandstetter, G. Sonnenstrom in Bürgerhand. Sonnenstrom 2012, 2, 23–29. [Google Scholar]
- Fleiß, E.; Hatzl, S.; Seebauer, S.; Posch, A. Money, not morale: The impact of desires and beliefs on private investment in photovoltaic citizen participation initiatives. J. Clean. Prod. 2017, 141, 921–926. [Google Scholar] [CrossRef]
- Ökostromverordnung. Available online: https://www.oem-ag.at/de/gesetze-regelwerk/ (accessed on 5 October 2020).
- Development of Electricity Prices for Non-Household Consumers, EU-27, 2008–2020. Available online: https://ec.europa.eu/eurostat/statistics-explained/index.php?title=File:Development_of_electricity_prices_for_non-household_consumers,_EU-27,_2008-2020_(EUR_per_kWh)_v4.png (accessed on 5 October 2020).
- Preisentwicklungen–Berichtsjahr 2020. Available online: https://www.e-control.at/statistik/strom/marktstatistik/preisentwicklung (accessed on 5 October 2020).
- Photovoltaikanlagen Mit Bürgerbeteiligung. Available online: https://www.aee.at/zeitschrift-erneuerbare-energie/99-zeitschrift/zeitschriften/2019-01-dv/1182-photovoltaikanlagen-mit-buergerbeteiligung (accessed on 5 October 2020).
- Niederösterreich Wird Zum Sonnenkraftwerk, Land Niederösterreich. Available online: https://www.sonnenkraftwerk-noe.at/ (accessed on 2 December 2020).
- BürgerInnenkraftewerke: Gemeinsam Klima Schützen. Available online: https://www.wienenergie.at/blog/buergerinnenkraftwerke/ (accessed on 2 December 2020).
- Hatzl, S.; Seebauer, S.; Fleiß, E.; Posch, A. Market-based vs. grassroots citizen participation initiatives in photovoltaics: A qualitative comparison of niche development. Futures 2016, 78–79, 63–68. [Google Scholar] [CrossRef]
- Reinsberger, K.; Posch, A. Bottom-up Initiatives for Photovoltaic: Incentives and Barriers. J. Sustain. Dev. Energy Water Environ. Syst. 2014, 2, 108–117. [Google Scholar] [CrossRef]
- Der Schmitten, N.A. Motive von Bürgerinnen und Bürgern zur Teilnahme bzw; Nichtteilnahme an der Photovoltaik-Energiegenossenschaft Donau-Böhmerwald, BOKU: Vienna, Austria, 2016. [Google Scholar]
- Wierling, A.; Schwanitz, V.J.; Zeiß, J.P.; Bout, C.; Candelise, C.; Gilcrease, W.; Gregg, J.S. Statistical Evidence on the Role of Energy Cooperatives for the Energy Transition in European Countries. Sustainability 2018, 10, 3339. [Google Scholar] [CrossRef]
- Soeiro, S.; Dias, M.F. Energy cooperatives in southern European countries: Are they relevant for sustainability targets? Energy Rep. 2020, 6, 448–453. [Google Scholar] [CrossRef]
- Klemisch, H.; Boddenberg, M. Energiegenossenschaften und Nachhaltigkeit Aktuelle Tendenzen und soziologische Überlegungen. Soziologie Nachhalt. 2016, 6, 5–15. [Google Scholar]
- de Brauwer, C.P.S.; Cohen, J.J. Analysing the potential of citizen-financed community renewable energy to drive Europe’s low-carbon energy transition. Renew. Sustain. Energy Rev. 2020, 133, 110300. [Google Scholar] [CrossRef]
- Allouhi, A. Solar PV integration in commercial buildings for self-consumption based on life-cycle economic/environmental multi-objective optimization. J. Clean. Prod. 2020, 270, 122375. [Google Scholar] [CrossRef]
- Tongsopit, S.; Junlakarn, S.; Wibulpolprasert, W.; Chaianong, A.; Kokchang, P.; Hoang, N.V. The economics of solar PV self-consumption in Thailand. Renew. Energy 2019, 138, 395–408. [Google Scholar] [CrossRef]
- Ghiani, E.; Vertuccio, C.; Pilo, F. Techno-Economic Evaluation of Photovoltaic Installations Located on the Premises of an End-Use Electric Consumer; University of Cagliari: Cagliari, Italy, 2015; pp. 3–6. [Google Scholar]
- European Commission. Best Practices on Renewable Energy Self-Consumption; European Commission: Brussels, Belgium, 2015; pp. 1–14. [Google Scholar]
- History. Available online: https://www.ennshafen.at/history/ (accessed on 7 October 2020).
- Infrastructure. Available online: https://www.ennshafen.at/infrastructure/ (accessed on 7 October 2020).
- Mieg, H.A.; Näf, M. Experteninterviews; Institut für Mensch-Umwelt-Systeme (HES), ETH Zürich: Zurich, Switzerland, 2005; pp. 4–23. [Google Scholar]
- Orthophotos & Topographie. Available online: https://www.doris.at/themen/basiskarten/orthofotos.aspx (accessed on 13 October 2020).
- NÖ Atlas. Available online: https://atlas.noe.gv.at/webgisatlas/(S(gnokxhwnw5ksuwc0bw0xdurl))/init.aspx?karte=atlas_gst (accessed on 13 October 2020).
- Photovoltaic Geographical Information System (PVGIS). Available online: https://ec.europa.eu/jrc/en/pvgis (accessed on 10 June 2020).
- Linhart, M. Wirtschaftlichkeit von PV-Anlagen auf Mehrparteienhäusern im Netzgebiet der Linz Netz GmbH. Master’s Thesis, FH Pinkafeld, Pinkafeld, Austria, 11 April 2019. [Google Scholar]
- Linhart, M. Wirtschaftlichkeit von PV-Anlagen auf Hotelbetrieben im Salzburger Land ohne Förderung, Salzburg. Bachelor’s Thesis, FH Pinkafeld, Pinkafeld, Austria, 11 September 2014. [Google Scholar]
- Ermittlung des Marktpreises für das 1. Quartal 2020 (auf Basis Phelix-AT). Available online: https://www.e-control.at/de/marktteilnehmer/oeko-energie/marktpreis (accessed on 3 April 2020).
- Kost, C.; Shammugam, S.; Jülch, V.; Nguyen, H.T.; Schlegl, T. Stromgestehungskosten Erneuerbare Energien; Research Report; Fraunhofer-Institut für Solare Energiesysteme ISE: Freiburg, Germany, 2018; p. 10. [Google Scholar]
- Federal Act on Supporting Electricity Produced from Renewable Energy Sources (Green Electricity Act 2012) BGBl. I No. 75/2011 in version BGBl. I No. 24/2020. Available online: https://www.ris.bka.gv.at/Ergebnis.wxe?Abfrage=Erv (accessed on 6 June 2020).
- PV Eigenverbrauchsanlagen Checkliste & Planungshilfe. Available online: https://www.energiesparverband.at/fileadmin/esv/Broschueren/PV-Eigenverbrauchsanlagen-Betriebe.pdf (accessed on 6 June 2020).
- Glas-Glas-Module Verlängern Lebensdauer von Solarmodulen. Available online: https://.ihks-fachjournal.de%2Ffachartikel%2Fdownload.php%3Ftitle%3Dglas-glas-module-verlaengern-lebensdauer-von-solarmodulen&usg=AOvVaw0rKQ3U40mecqbrtkDxOY18 (accessed on 5 May 2020).
- Benchmarking Utility-Scale PV Operational Expenses and Project Lifetimes: Results from a Survey of U.S. Solar Industry Professionals, Lawrence Berkeley National Laboratory. Available online: https://eta-publications.lbl.gov/sites/default/files/solar_life_and_opex_report.pdf (accessed on 6 June 2020).
- Solarmodule mit Hoher Lebensdauer. Available online: https://www.solarwatt.de/solarmodule/anwendung/lebensdauer (accessed on 3 April 2020).
- Österreichische Nationalbank. Statistiken Daten & Analysen Q4/2020; Österrreichische Nationalbank: Vienna, Austria, 2020; p. 88. [Google Scholar]
- Inflationsraten und Indizes des VPI von 1999 bis 2019. Available online: http://www.statistik.at/web_de/statistiken/wirtschaft/preise/verbraucherpreisindex_vpi_hvpi/index.html (accessed on 3 April 2020).
- Preise Steuern. Available online: http://www.statistik.at/web_de/statistiken/energie_umwelt_innovation_mobilitaet/energie_und_umwelt/energie/preise_steuern/index.html (accessed on 5 October 2020).
- Galli, A. Kapitalwertmethode und Unvollkommener Kapitalmarkt. Grundlagen der Investitionsrechnung; Schaeffer-Poeschel Verlag für Wirtschaft Steuern Recht GmbH: Stuttgart, Germany, 2017; pp. 56–80. [Google Scholar]
- IRENA. Renewable Power Generation Costs in 2018; International Renewable Energy Agency: Abu Dhabi, UAE, 2019. [Google Scholar]
- Huld, T.; Amillo, A.M.G. Estimating PV Module Performance over Large Geographical Regions: The Role of Irradiance, Air Temperature, Wind Speed and Solar Spectrum. Energies 2015, 8, 5159–5181. [Google Scholar] [CrossRef]
- Moser, S.; Puschnigg, S.; Rodin, V. Designing the Heat Merit Order to determine the value of industrial waste heat for district heating systems. Energy 2020, 200, 117579. [Google Scholar] [CrossRef]
- Horváth, D.; Szabó, R.Z. Evolution of photovoltaic business models: Overcoming the main barriers of distributed energy deployment. Renew. Sustain. Energy Rev. 2018, 90, 623–635. [Google Scholar] [CrossRef]
- Jenik, I.; Lyman, T.; Nava, A. Crowdfinding and Financial Inclusion; CGAP: Washington, DC, USA, 2017. [Google Scholar]
- Roessl, D. Energy Cooperatives and Local Ownership in the Field of Renewable Energy Technologies as Social Innovation Processes in the Energy System; Inter-University Research Centre for Technology, Work and Culture (IFZ): Graz, Austria, 2012; pp. 84–90. [Google Scholar]
- Mautz, R.; Fleiß, E.; Hatzl, S.; Reinsberger, K.; Posch, A. Bottom-up-Initiativen im Bereich Photovoltaik in Deutschland und Österreich: Rahmendbedingungen und Handlungsressourcen. In Handbuch Energiewende und Partizipation; Springer VS: Wiesbaden, Germany, 2018; pp. 599–610. [Google Scholar]
- Rodin, V.; Moser, S. Ennshafen Case Study–Insights into Real-Life Industrial Energy Cooperation Development, Linz, Austria. Unpublished work. 2020. [Google Scholar]
- Weckend, S.; Wade, A.; Heath, G. End-of-Life Management Solar Photovoltaic Panels; International Renewable Energy Agency: Abu Dhabi, UAE, 2016. [Google Scholar]
- Welche dieser Möglichkeiten, Geld zu Sparen oder Anzulegen, Halten Sie Derzeit für Besonders Interessant? Available online: https://de.statista.com/statistik/daten/studie/346160/umfrage/umfrage-zu-spar-und-anlageformen-in-oesterreich/ (accessed on 5 November 2020).
- Einlagen- und Kreditzinssätze–Bestand. Available online: https://www.oenb.at/isaweb/report.do;jsessionid=9F635A17E531A62EB97B6A8FED29A2AB?report=2.8 (accessed on 5 November 2020).
- Verbraucherpreisindex. Available online: http://www.statistik.at/web_de/statistiken/wirtschaft/preise/verbraucherpreisindex_vpi_hvpi/index.html (accessed on 5 November 2020).
- Wir Wollen die Energiewende Jetzt! Available online: https://gea-waldviertler.de/engagement/sonnenbeteiligung/ (accessed on 1 December 2020).
- Trumer Sonnenfunding. Available online: https://gemeinsam.trumer.at/ (accessed on 1 December 2020).
| Publisher’s Note: MDPI stays neutral with regard to jurisdictional claims in published maps and institutional affiliations. |
© 2021 by the authors. Licensee MDPI, Basel, Switzerland. This article is an open access article distributed under the terms and conditions of the Creative Commons Attribution (CC BY) license (http://creativecommons.org/licenses/by/4.0/).


