1. Introduction
Fuel cells are attracting attention as energy conversion devices owing to their high energy efficiency, near-zero emission, and low noise [
1,
2]. Among them, polymer electrolyte membrane fuel cells (PEMFCs) are recognized as the most promising candidates for various applications such as vehicles, distributed power systems, aerospace applications, and submarines [
3,
4,
5]. The performance of fuel cells is affected by various conditions (operating temperature, pressure, humidification, etc.), and optimization of these conditions is a practical approach to improve their performance. In addition, the use of a flow field with a suitable design is known to improve the performance [
6,
7,
8].
Many researchers focusing on improving the operating conditions of PEMFCs have studied the effect of varying the operating pressure on the operating mechanism. Reshetenko et al. [
9] confirmed the operating mechanism of a spatial fuel cell by studying segmented cells. They discovered that an increase in the backpressure not only improves the overall cell performance but also lowers activation and mass transport losses to improve the performance homogeneity. Zhang et al. [
10] reported that, as the backpressure increases, the exchange current density of the reactants increases, and the gas diffusion from the catalyst layer to the active sites of the catalyst increases. Larbi et al. [
11] studied the effect of pressure when the pressure at the anode and cathode were not equal, and found that the potential of the electrolyte depends on the cathode pressure. Rohendi et al. [
12] confirmed that when the performance of the membrane electrode assembly (MEA) was degraded after an operating time of 100 h followed by the application of backpressure, the cell conductivity was improved, and the open circuit voltage (OCV) was maintained compared with that under ambient conditions. Lu et al. [
13] applied a 3D computational fluid dynamics (CFD) model to inspect the effect of pressure on the PEMFC performance and found that high backpressure leads to high relative humidity in the cathode channel, which contributes to high membrane water content.
In this PEMFC operation, the cathode processes account for most of the electrochemical losses in all the cells and have a crucial influence on the cell performance [
14,
15]. Therefore, many scientific studies have been conducted on the design and optimization of cathode channels to increase the performance and efficiency of fuel cells. Baik et al. [
16] developed metallic bipolar plates with a multi-hole structure in the rib region to improve the cell performance at high current density. Application thereof to the cathode increased the current density by 37.8%. Kumar et al. [
17] evaluated the performance of air-breathing PEMFCs by comparing the cathode channel design. Thomas et al. [
18] researched the effect of changing the dimensions such as the width and depth of the cathode channel in open-cathode high-temperature PEMFCs. Henriques et al. [
19] investigated the effect of the cathode geometry with the aim of improving the efficiency of portable PEMFCs and used a 3D CFD model to analyze the cell performance. However, an investigation of the fuel cell operation also requires the effect of the anode channel to be considered, as in Zhong’s study [
20]. Zhong et al. [
20] optimized the anode parallel flow field structure to ameliorate starvation during PEMFC operation. Therefore, to maximize the performance of the fuel cell, it is necessary to examine the complex effect of both the cathode and anode channels. An understanding of this effect would require both of these channels to be optimized.
In a previous study [
21], we analyzed the variation in the performance of fuel cells by changing the operating pressure and channel width of the serpentine bipolar plate. As the channel width was decreased and the operating pressure was increased, the maximum power density, which is a performance index of fuel cells, was enhanced. Moreover, the results confirmed that when bipolar plates with wide channels were used, the rate at which the performance increased as a result of the operating pressure was the most remarkable. To investigate the diffusion characteristics in the flow channel resulting from the change in these conditions, the Sherwood number (
Sh), which is a dimensionless number representing the degree of diffusion acting perpendicular to the electrode, was introduced and discussed.
Sh was derived as a correlation between the Reynolds (
Re) and Schmidt (
Sc) numbers. In this study, we examined the effect of these experimental settings on the performance of fuel cells under pressurized operating conditions while varying the channel width of the bipolar plates used in the anode and cathode. In this regard, it is considered that this research will fill the knowledge gap in this area. In particular, the effect on diffusion in the flow channel was analyzed by using anode and cathode bipolar plates that were mismatched. The diffusion characteristics in the channels of the fuel cells were investigated by analyzing the single-phase model using
Sh followed by experimental verification of these results.
This study hypothesized that the mismatched channel would affect performance to some extent. In order to arrive at this hypothesis, an experiment was conducted with the mismatched situation, and a pressurized condition was also applied following the previous study [
21]. Quantitative performance was secured for the experiment conducted in this way, and analysis was attempted by introducing a dimensionless number. This offers the possibility of discussing most flow scenarios using the diffusion characteristics, as in this study. At this time, by re-introducing dimensionless numbers based on previous experience, we investigate the way in which changes in the width of the anode and cathode flow channels along with the operating pressure improve the mass transport by analyzing the diffusion characteristics. The findings of this hydrodynamic-based study are expected to facilitate the design and optimization of the operation of fuel cells. The significance of this study lies therein that we conducted an experimental analysis of the diffusion that occurs in the flow channel.
3. Results and Discussion
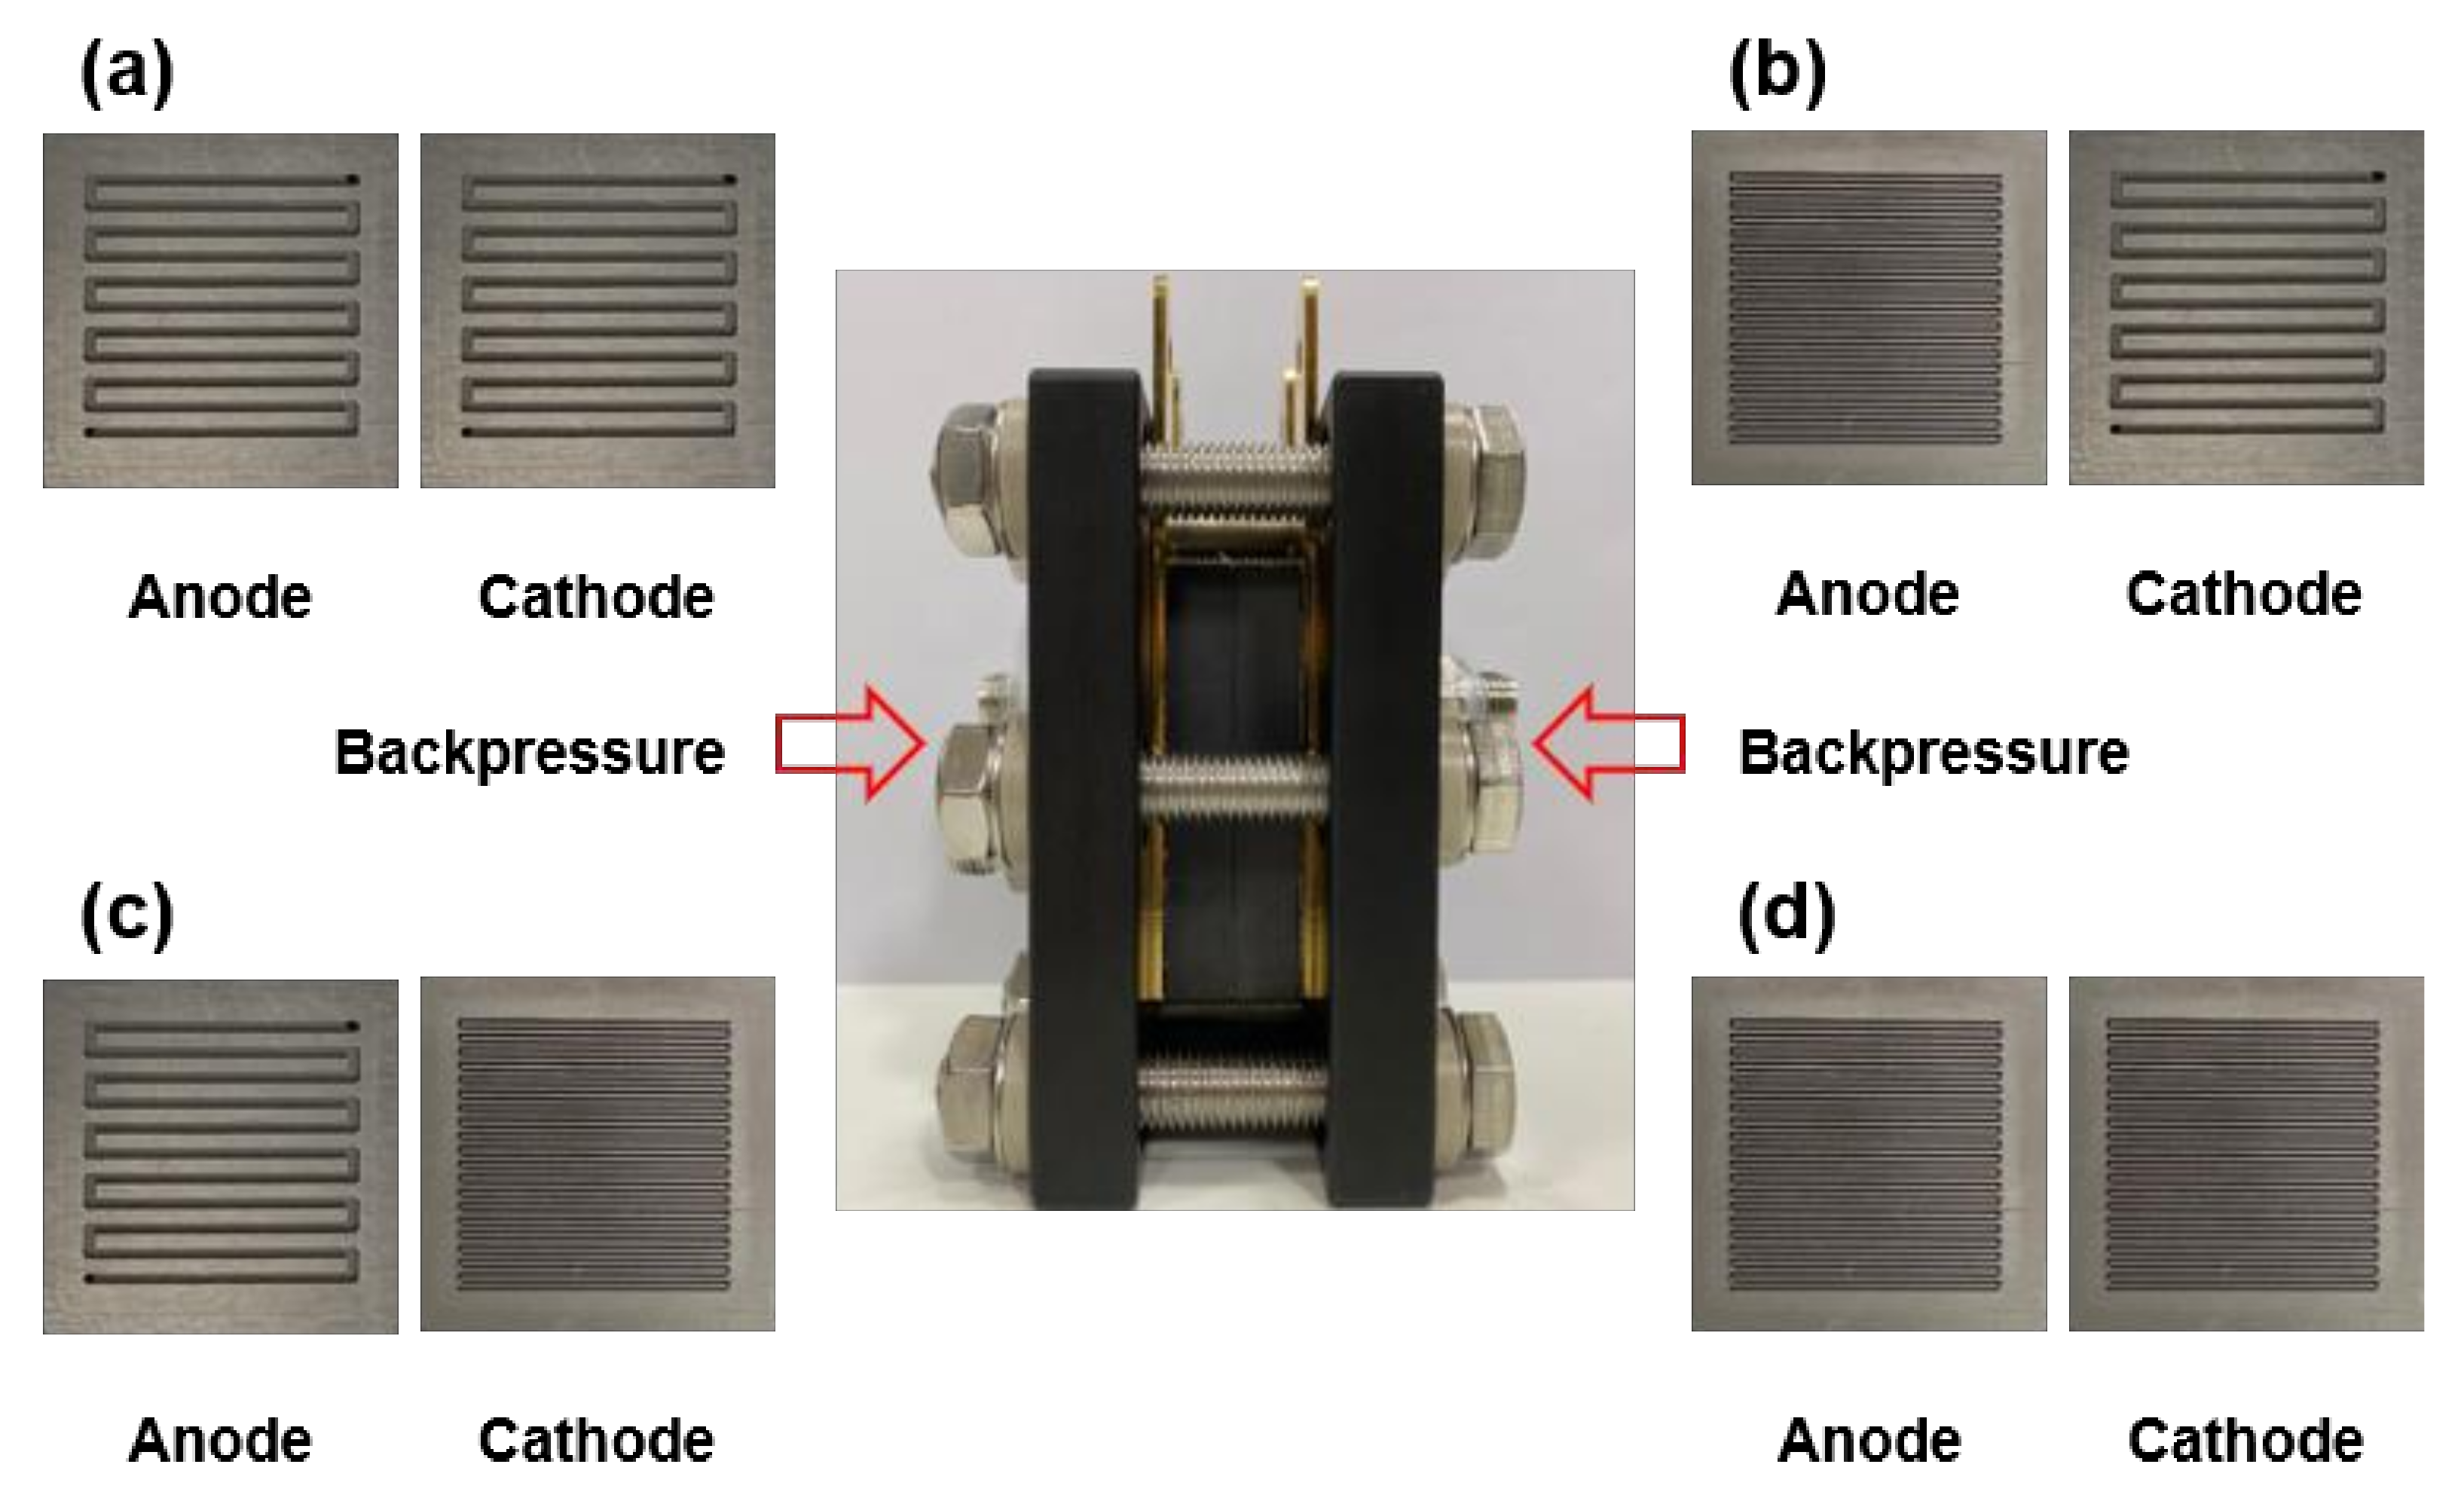
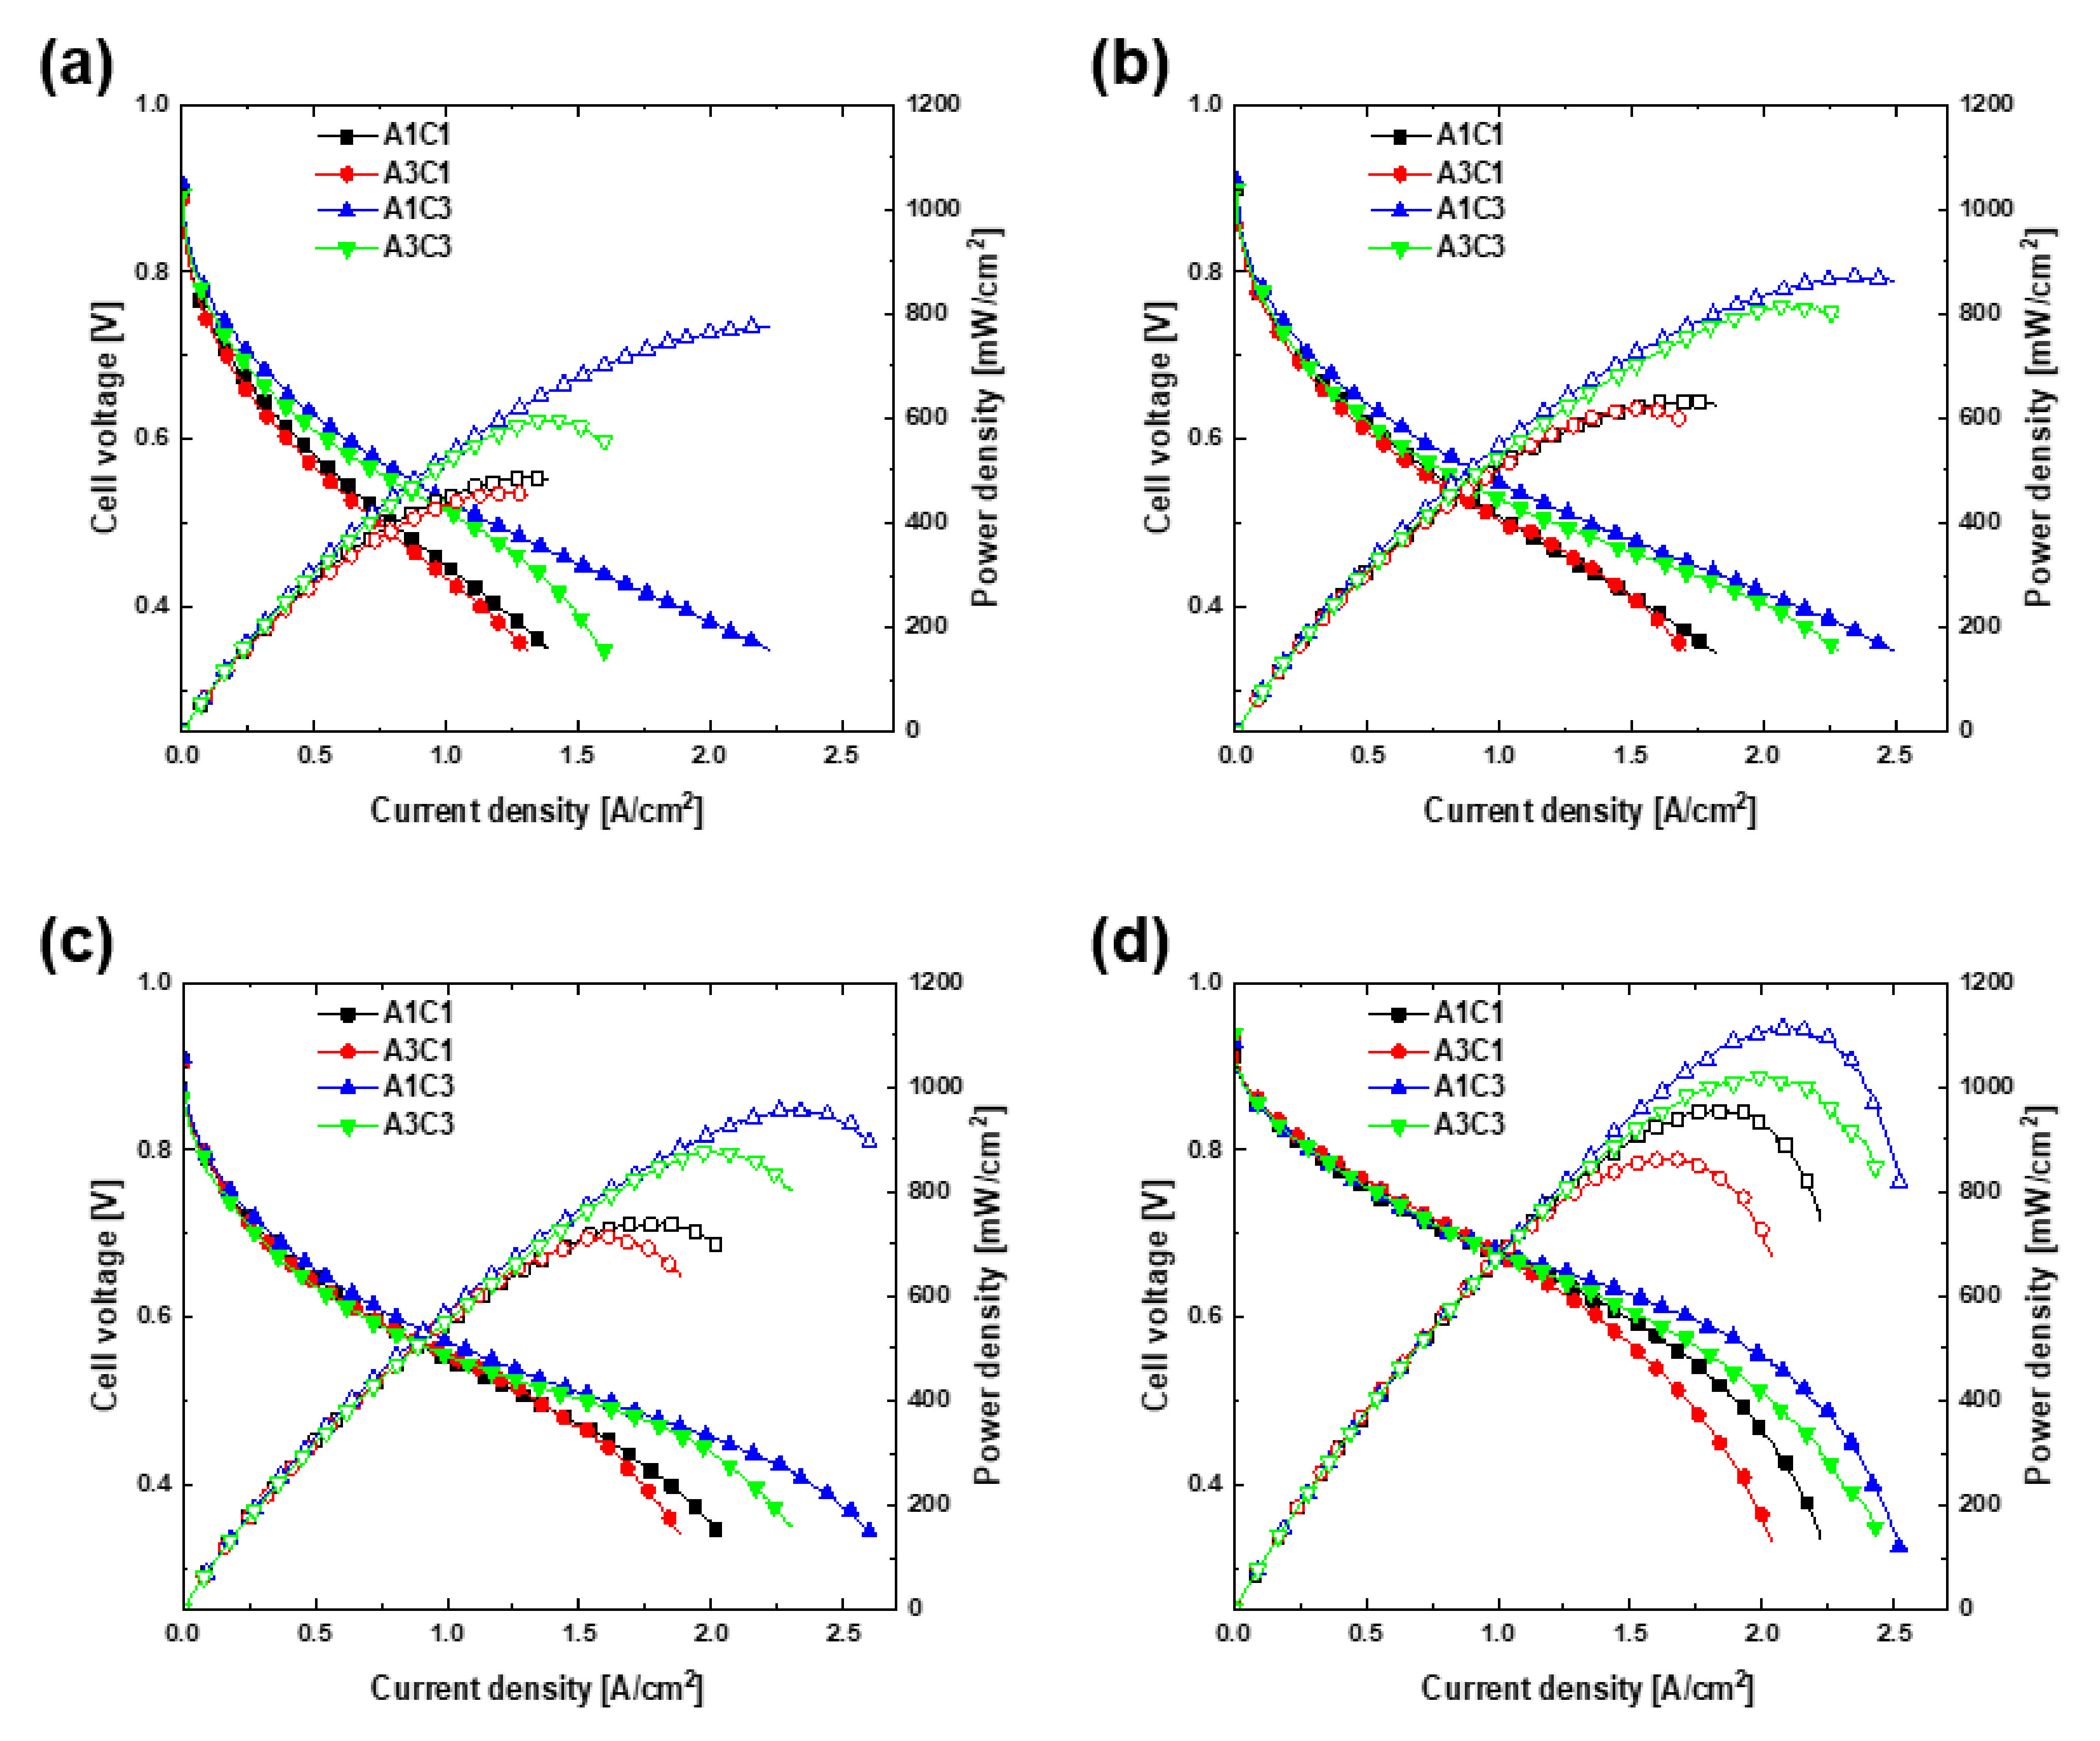
Figure 2 shows the polarization curves for (a) A1C1, (b) A3C1, (c) A1C3, and (d) A3C3.
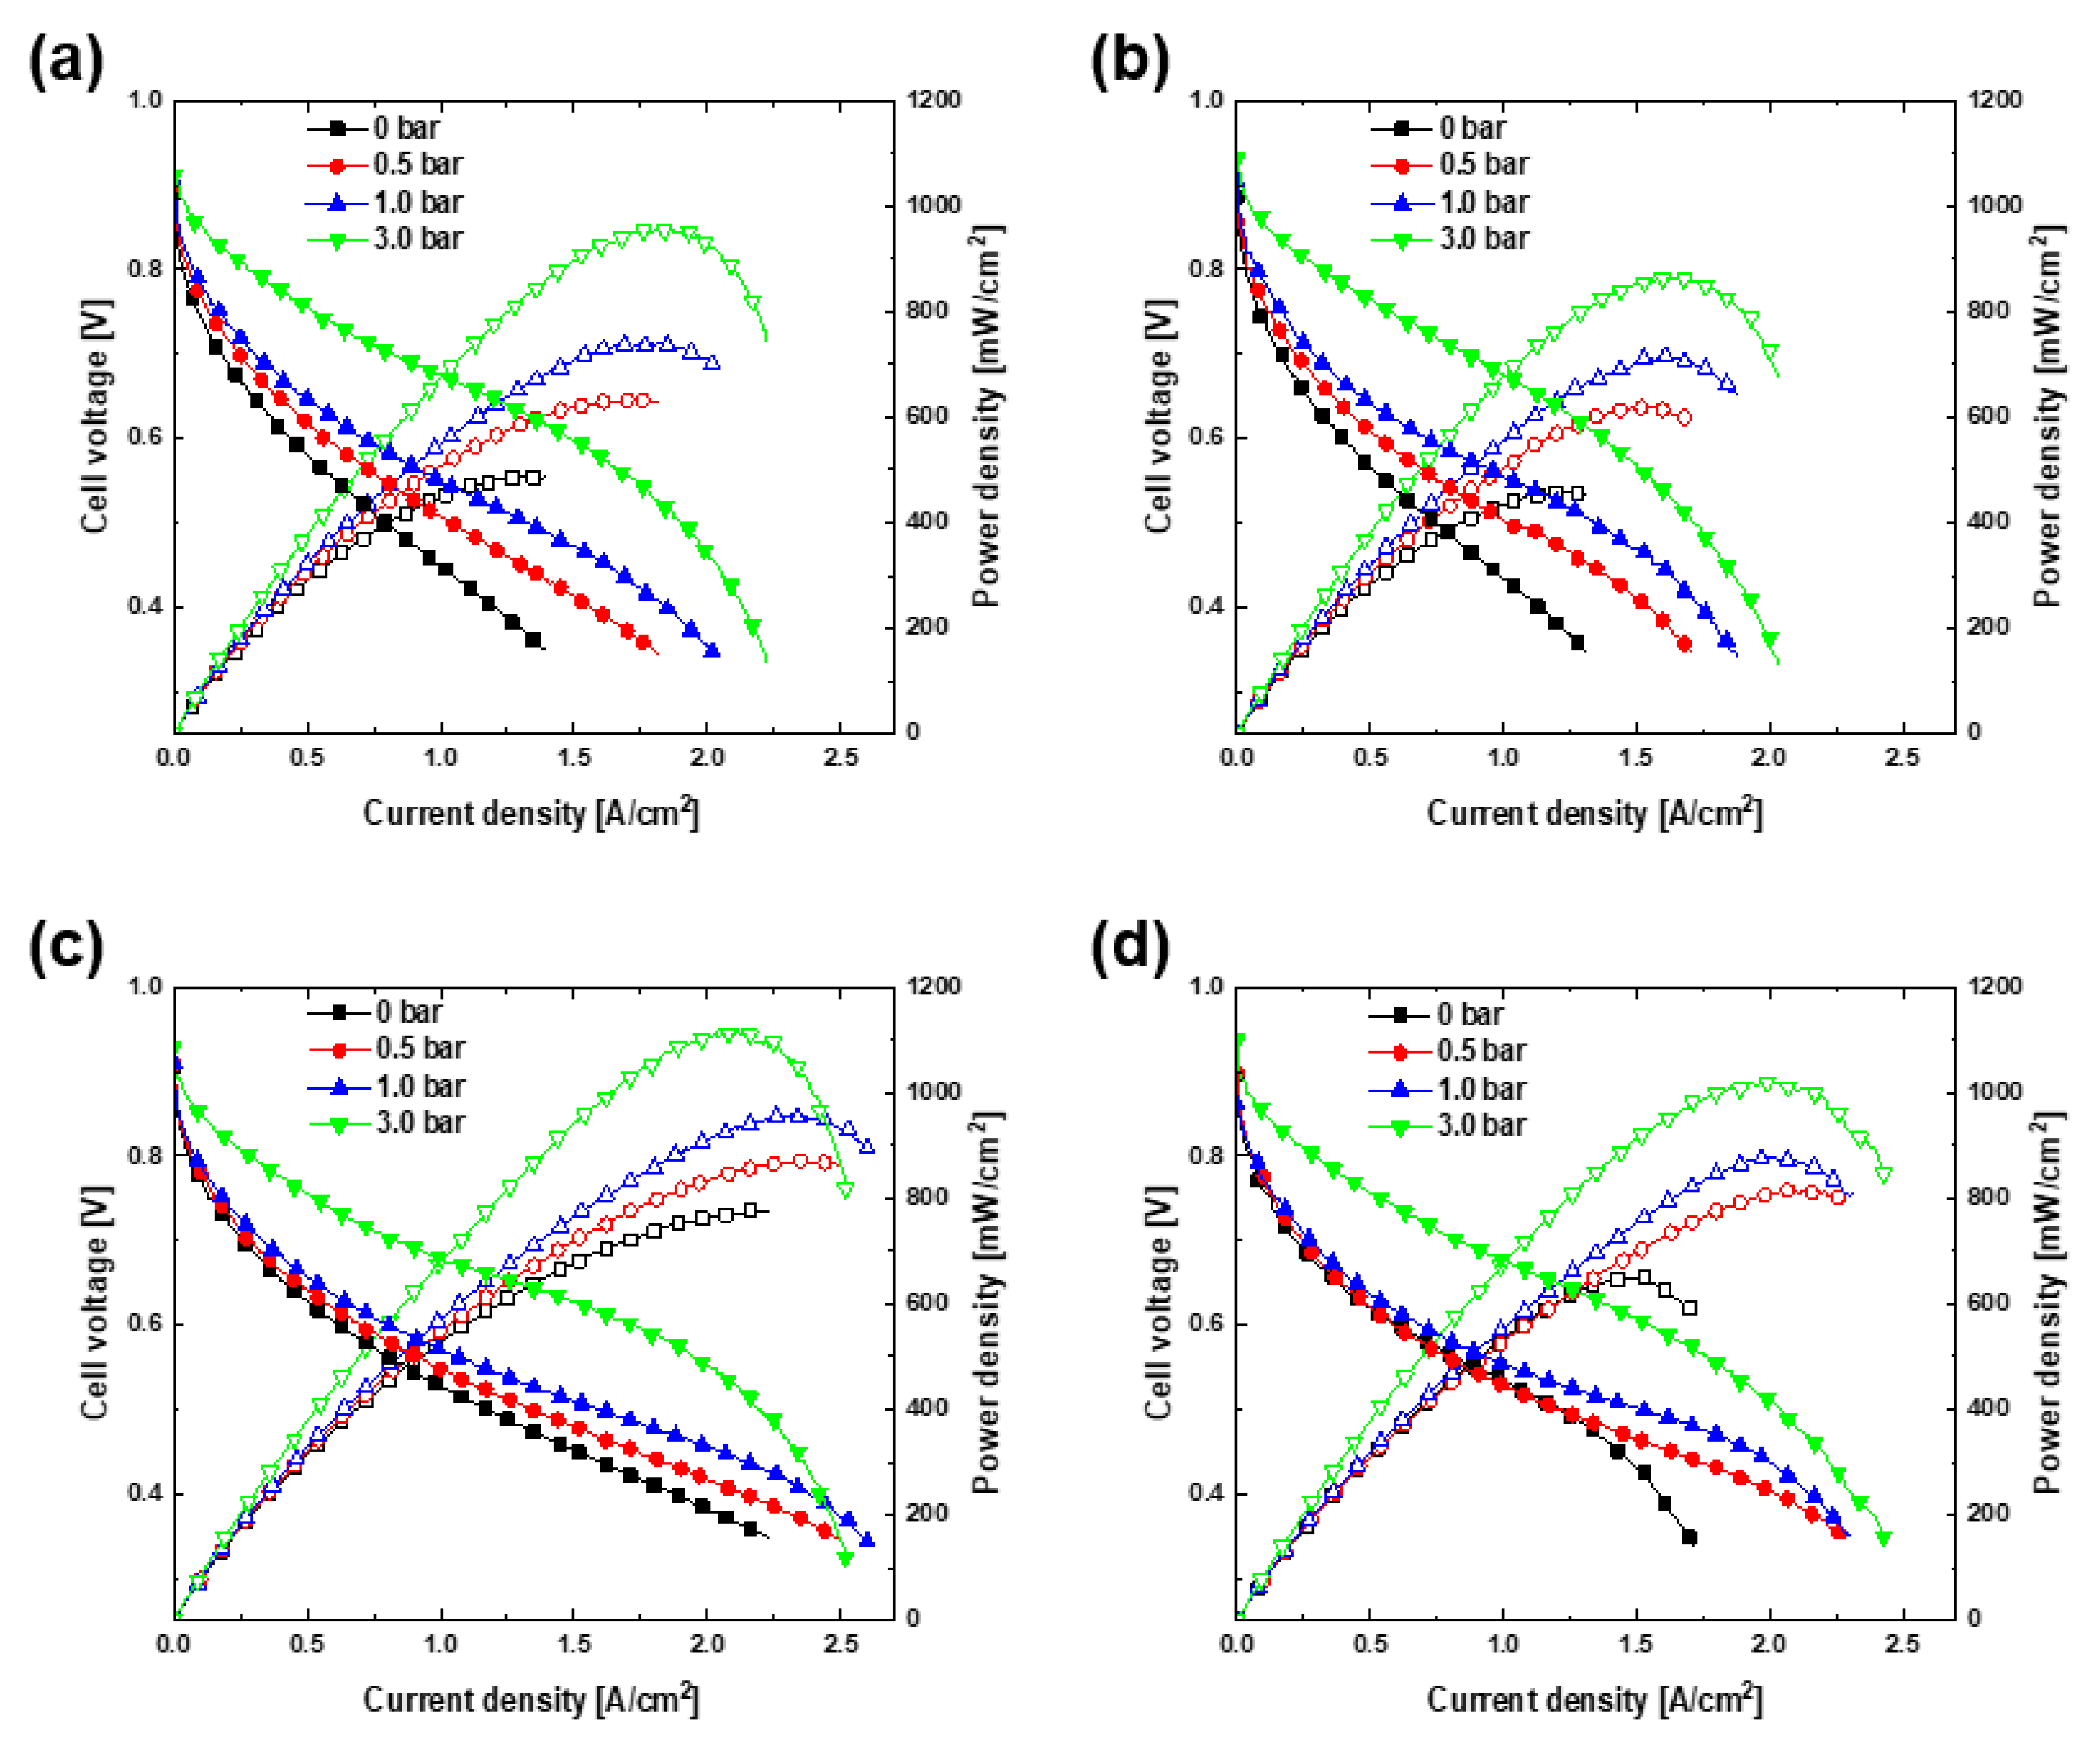
Figure 3 shows the same polarization curves for the different pressure levels of (a) 0, (b) 0.5, (c) 1.0, and (d) 3.0 bar. The cathode pressure drop is 0.045 bar for A1C1 and A3C1, and 3.004 bar for A1C3 and A3C3. This is obtained using the same method for calculating the cathode pressure drop in the previous study [
21]. At this time, the cathode inlet pressure can be obtained by adding the atmospheric pressure and the backpressure applied to the outlet to the cathode pressure drop. For all combinations, as the operating pressure increased, the j-V curves tended to move upward and to the right, and the OCV also increased. As the operating pressure increases, the concentration of the reactant and the reaction rate increase, and as a result, the activation loss and concentration loss gradually decrease, and this is considered to be the reason for the curves shifting to the upper right [
1]. The downward bending of the right end of the j-V curves intensified as the operating pressure increased. In addition, the partial pressure of the reaction gases increased, which increased the reversible voltage, which improved the OCV [
10,
23]. The j-V curve reflects the higher overall limiting current density resulting from the narrower channel width of the bipolar plate on the cathodic side of 0.3 mm (A1C3, A3C3) compared with the wider channel of 1.0 mm (A1C1, A3C1). In this experiment, the value of the actual limiting current density could not be obtained by measuring the voltage up to 0.35 V. Instead, the current density was calculated at 0 V by using auto fitting of the j-V curve. The current density at this time was assumed to be the limiting current density, which is expressed by the following equation:
where
is the number of electrons transferred in the reaction,
is Faraday’s constant,
is the effective reactant diffusivity,
is the reactant bulk concentration value, and
is the diffusion layer thickness. The effective reactant diffusivities were calculated based on the cathode and are provided in
Table 1. Only the limiting current density of oxygen is considered when determining the mass transport losses of most fuel cells. This is because oxygen diffuses more slowly than hydrogen, thus the limitation of mass transport by the movement of oxygen is generally much more severe than that of hydrogen [
1,
11]. The typical value for the effective reactant diffusivity, 0.01 cm
2/s [
1], is similar to the corresponding value calculated in this work, which is therefore considered to be appropriately calculated. Because the effective reactant diffusivity values of A1C3 and A3C3 are larger than those of A1C1 and A3C1, the value of the limiting current density seems to mirror this trend.
The power density curves in
Figure 2 and
Figure 3 confirmed that the peak power density increased as the operating pressure increased. In the case of A1C1, the maximum power density was 488 mW/cm
2 under ambient conditions and increased to 959 mW/cm
2 when the cell was pressurized to 3.0 bar. In the case of A3C1, the maximum power density was 461 and 868 mW/cm
2 at 0 and 3.0 bar, respectively. These values increased to 776 mW/cm
2 at 0 bar and 1115 mW/cm
2 at 3.0 bar in the case of A1C3, the highest of all the operating pressures among the four experimental sets. Lastly, in the case of A3C3, the corresponding values were 650 and 1024 mW/cm
2 at 0 and 3.0 bar, respectively. According to the experimental results, the performance of the fuel cells is largely determined by the width of the flow channel on the cathodic side. In
Figure 3, it is remarkable that the polarization curves are divided according to the width of the cathodic flow channel. Compared with A1C1 and A3C1, the j-V curves of A1C3 and A3C3, which have narrow cathodic flow channels, are extended to the upper right, and accordingly, the power density curves are also different. When the operating pressure reached 3.0 bar, the slope of the high current density portion of all sets of j-V curves increased. This is responsible for the active reaction of high-concentration reactants as a result of the high pressure, causing flooding [
24]. In addition, for the two cases in which the width of the flow channel on the cathodic side is the same, the performance differs slightly as the width of the flow channel on the anodic side is different. A comparison of the performance by comparing the power density reveals that A1C3 outperforms A3C3, and the performance of A1C1 is superior to that of A3C1. In the case of A1C3 and A3C3, the overall performance was excellent owing to the narrow width of the cathode channel, although A1C3 delivered excellent performance in the low-voltage region with high maximum power density. This is attributed to a change in the distribution patterns of the channel and rib. Liu et al. [
25] showed that the rib-to-channel (RTC) distribution outperforms the rib-to-rib (RTR) distribution. Here, the RTR and RTC distributions refer to structures in which the ribs of one bipolar plate face the ribs of the other bipolar plate, and the ribs of one bipolar plate face the flow channel of the other bipolar plate, respectively. They confirmed that the performance in both cases was the same in the high-voltage region of the cell, but the performance of the RTC distribution was higher in the low-voltage region. Hoppe et al. [
26] observed that CCM was bent through a computer tomograph in the state of the flow field plate misalignment similar to the concept of RTC distribution above but confirmed that there was no significant difference in performance compared to the case without misalignment. However, when the pressurization experiment is performed on flow field plate misalignment, it is considered that the CCM will be damaged beyond bending, and the contact resistance will increase, which will significantly affect the performance [
27,
28]. The advantage of the experimental setting used in this study is that because the widths of the flow channels of both bipolar plates differ, one channel and several ribs on the other side overlap. This maximizes the performance of the electrochemical reaction by supporting the MEA and reducing the contact resistance, even if the cell were to be operated under pressure. In fact, there was no severe noticeable damage when checking the MEA after the pressurization test up to 3.0 bar. On the other hand, A1C1 and A3C1 exhibited the opposite tendency. A1C1, for which both bipolar plates have the same flow channel width, seems to have more effective mass transport in the low-voltage region. Hydrogen, the reactant on the anodic side, has outstanding diffusivity; thus, the wider the flow channel, the higher the performance because a large amount of hydrogen exists in the channel [
1,
29]. An anode with a narrow flow channel would generate differential pressure; so, diffusion to the GDL is considered to be difficult. Therefore, the performance of the fuel cells is excellent under the same conditions when the flow channel on the cathodic side is narrow and the flow channel on the anodic side is wide. In previous research, because the same bipolar plate was used for the anode and cathode, the performance improved as the flow channel was unconditionally narrow. However, in this study, the influence of the anodic flow channel was confirmed by changing the width of the flow channel of both of the bipolar plates.
To investigate the diffusion that occurs in the cathode flow channel when the two bipolar plates are mismatched in terms of their channel width, the dimensionless numbers
Re,
Sc, and
Sh were calculated as in previous research [
21]. These values are summarized in
Table 1. In this case, they are estimated in single-phase fluid. First, the calculated values of
Re depend on the width of the cathode channel. The overall
Re values were higher when the cathode flow channel was narrower, and
Re developed as the operating pressure increased. A larger
Re indicates the momentum in the channel; that is, the flow is active, which means that the diffusion from the channel to the catalyst layer improves. On the other hand,
Sc is generally small when the cathode flow channel is narrow and tends to decrease as the operating pressure increases. This trend in
Sc indicates that the hydrodynamic boundary layer becomes shorter, and mass transport predominates. This implies that the narrower the cathode flow channel and the higher the operating pressure are, the more active the diffusion in the channel becomes. Unlike the value of
Re, the value of
Sc changes as the width of the anode channel changes when the width of the cathode channel remains the same. Although the calculation of this non-dimensional number is done on the cathode side, the value of
Sc, which means the overall diffusion, changes in this situation. This shows that the width of the anode channel also affects the diffusion in the cathode channel, and that diffusion is excellent when the anode channel is wide. The values of
Sh, which is a non-dimensional number representing vertical diffusion, are small when the cathode channel is narrow and follows a decreasing trend as the operating pressure increases. By changing the width of the anodic flow channel, which was not investigated in previous research, the value of
Sh was found to be large for a wide anodic channel and the same cathodic channel width. Vertical diffusion decreases because of excessive flooding in the flow channel as the overall diffusion increases when the cathodic channel is narrow and the operating pressure increases; however, it seems that this phenomenon is more effectively eliminated by increasing the anodic channel width. Therefore, to summarize the analysis based on the calculation of these dimensionless numbers, the overall diffusion improves when the cathodic flow channel, which greatly affects the performance, is narrow, and the operating pressure increases. The width of the anodic channel also affects the diffusion on the cathodic side. The results also showed a wide anodic channel not only improves the vertical diffusion but also the overall diffusion, which has a positive effect on mass transport. In the same way as in the previous research [
21], a correlation of mismatched cases is derived from the calculated non-dimensional numbers in
Table 1. This is as follows:
It is slightly different from the correlation obtained in previous research, but it seems to be because there is a change in the flow channel width on the anode compared to the general study. Since the bipolar plates of the anode and cathode are different, as described above, the overlapping of one channel and several ribs or the overlapping of one rib and several channels is considered to create uncertain variables.
Figure 4 shows the change rate of the maximum power density and enables us to observe the variation in the performance of fuel cells for each experimental set by using the power density curve. The rate of change is the amount of variation in the maximum power density at each operating pressure compared to the maximum power density at 0 bar. In the case of A1C1, when the backpressure was increased to 3.0 bar, the change rate was 96.5%, showing the largest shift. At the same operating pressure, the change rate for A3C1 was 88.3%, showing a relatively large increase in performance. The corresponding change rates of A1C3 and A3C3 were 43.7% and 57.5%, respectively. As the operating pressure increased, the performance variation of A1C1 and A3C1, which had wide cathodic channels, exhibited a remarkable increase in performance, but the use of an alternative width for the anodic channel did not seem to have a significant effect on the magnitude of the performance change. Hence, for absolute performance, it is more effective to use a bipolar plate with a narrow channel on the cathode; however, when the fuel cells are operated under pressure, using a wider channel on the cathode increases the performance to a greater extent because its change rate compared to the initial performance is larger.
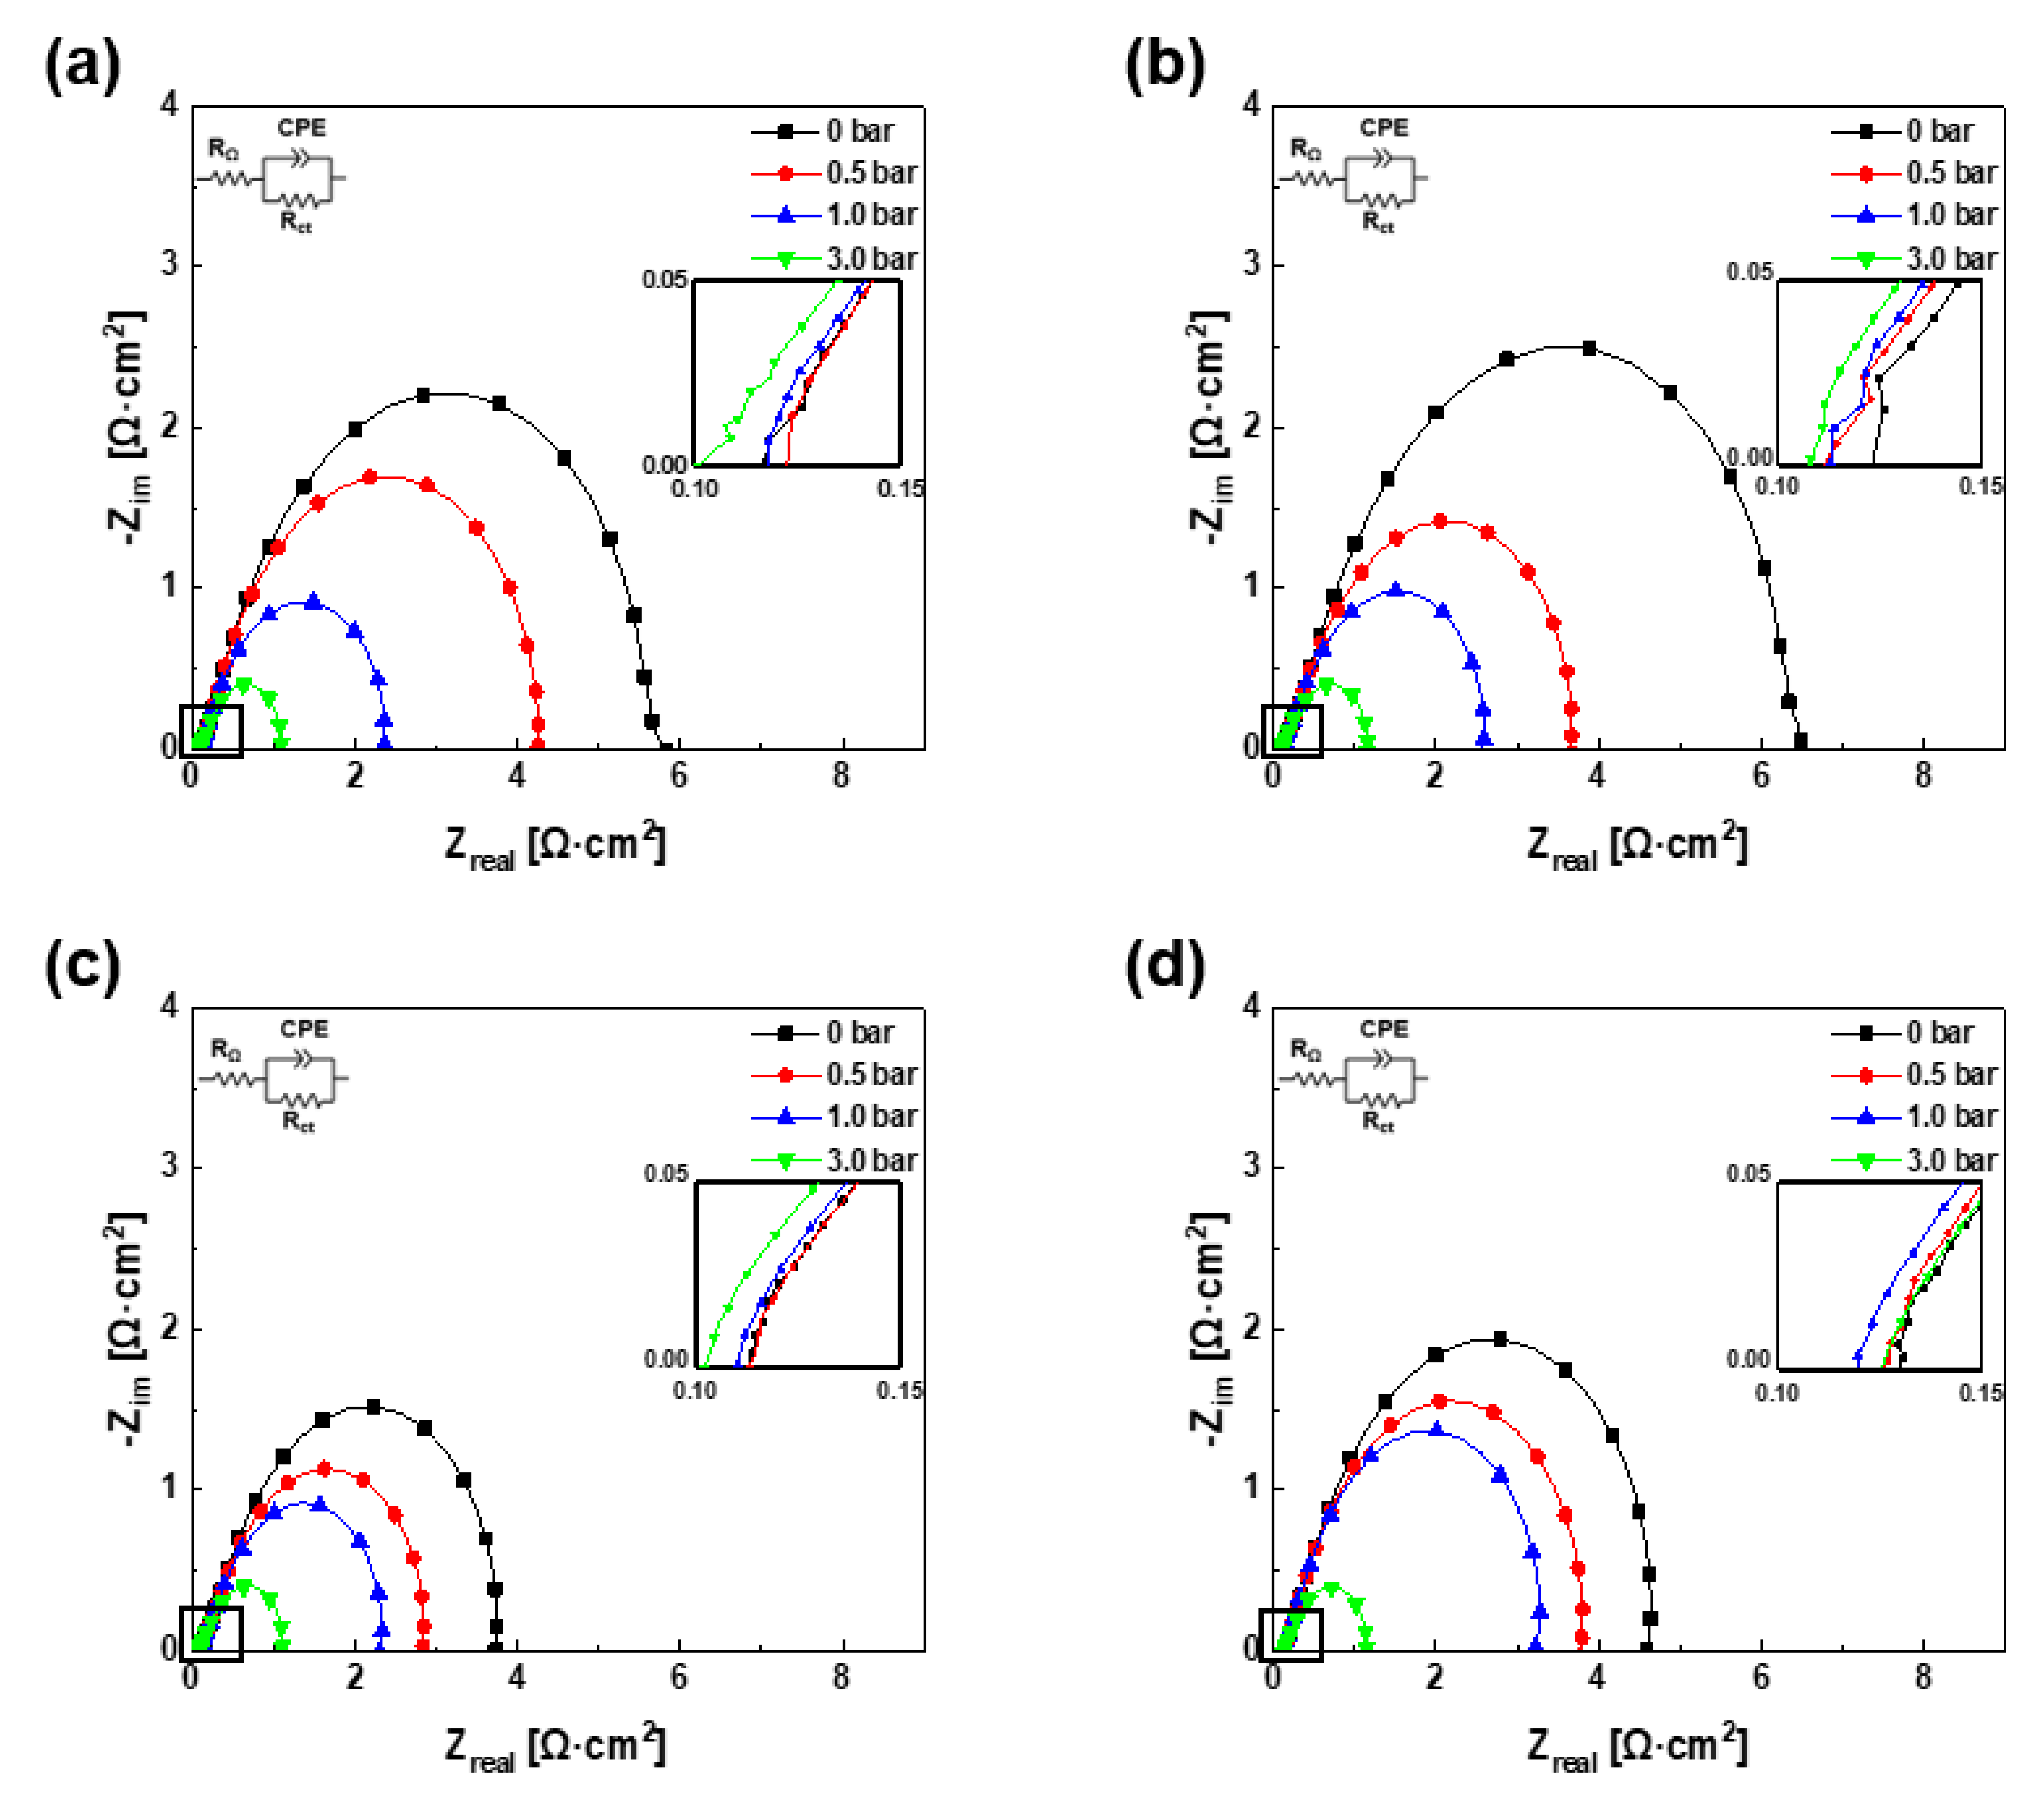
To further analyze the polarization curves above, the EIS results of each experiment were evaluated, as summarized in
Figure 5. At this time, because the oxidation reaction of hydrogen is very fast, the impedance spectrum of the full cell was almost the same as the impedance spectrum of the cathode. In addition, because the electrochemical impedance spectrum was recorded at a low current density, the concentration loss was not detected when the spectra were recorded. Accordingly, the reaction that occurred in the cells in this experiment was modeled as an equivalent circuit. The equivalent circuit consists of the ohmic resistance (
RΩ), charge transfer resistance (
Rct), and constant phase element (CPE), representing the double-layer capacitance and appears in the top left corner of each subfigure in
Figure 5. These spectra present the impedance when the voltage is 0.85 V vs. RHE. The size of each semicircle represents the activation loss, and the first value of
Zreal when −
Zim is zero indicates the ohmic loss [
1,
30]. In all cases, the graphs directly indicate that the activation loss decreases as the backpressure increases. The activation loss of A1C1 decreases from 5.61 Ω∙cm
2 to 4.13, 2.25, and 0.98 Ω∙cm
2 with increasing operating pressure and that of A3C1 decreases from 6.37 Ω∙cm
2 to 3.55, 2.47, and 1.04 Ω∙cm
2. Likewise, that of A1C3 decreases from 3.62 Ω∙cm
2 to 2.73, 2.21, and 1.01 Ω∙cm
2, and that of A3C3 decreases from 4.46 Ω∙cm
2 to 3.65, 3.11, and 1.01 Ω∙cm
2. The magnitude of the activation loss of A1C3 and A3C3 when no operating pressure was applied was smaller than that of the other two combinations (A1C1 and A3C1). In all cases, as the operating pressure increased, the magnitude of the activation loss decreased, and when the operating pressure was 3.0 bar, the magnitude of the activation loss became almost the same. Moreover, the ohmic loss was shown in the inset on the right side of each subfigure in
Figure 5. In most cases, as the operating pressure increased, the tendency of the value of the ohmic loss to decrease was confirmed. In addition, the ohmic loss did not differ distinctly between the general situation and the state in which the bipolar plates were mismatched. Even when both bipolar plates were mismatched and the cells were pressurized, the loss due to contact resistance seemed negligible.


 ,
, 


