Article

Potential Energy Savings from Circular Economy Scenarios Based on Construction and Agri-Food Waste in Italy

1
Department of Engineering, University of Naples “Parthenope”, 80143 Naples, Italy
2
International PhD Programme/UNESCO Chair “Environment, Resources and Sustainable Development” Department of Science and Technology, University of Naples “Parthenope”, 80143 Naples, Italy
3
Department of Civil Engineering, University of Salerno, 84080 Salerno, Italy
4
Department of Science and Technology, University of Naples “Parthenope”, 80143 Naples, Italy
5
School of Environment, Beijing Normal University, Beijing 100875, China
*
Authors to whom correspondence should be addressed.
Energies 2021, 14(24), 8561; https://doi.org/10.3390/en14248561
Submission received: 10 November 2021 / Revised: 7 December 2021 / Accepted: 13 December 2021 / Published: 19 December 2021

Abstract

:
In this study, our aim was to explore the potential energy savings obtainable from the recycling of 1 tonne of Construction and Demolition Waste (C&DW) generated in the Metropolitan City of Naples. The main fraction composing the functional unit are mixed C&DW, soil and stones, concrete, iron, steel and aluminium. The results evidence that the recycling option for the C&DW is better than landfilling as well as that the production of recycled aggregates is environmentally sustainable since the induced energy and environmental impacts are lower than the avoided energy and environmental impacts in the life cycle of recycled aggregates. This LCA study shows that the transition to the Circular Economy offers many opportunities for improving the energy and environmental performances of the construction sector in the life cycle of construction materials by means of internal recycling strategies (recycling C&DW into recycled aggregates, recycled steel, iron and aluminum) as well as external recycling by using input of other sectors (agri-food by-products) for the manufacturing of construction materials. In this way, the C&D sector also contributes to realizing the energy and bioeconomy transition by disentangling itself from fossil fuel dependence.

1. Introduction

The main research context of the present study is the Construction and Demolition Waste (C&DW) management system of the Metropolitan City of Naples (Italy). This section starts by introducing the relevant environmental and energy impacts of the C&D sector as a whole (Section 1.1), highlighting the need for transitioning to a Circular Economy (CE) (Section 1.2). The goal of this study is described in Section 1.3.

1.1. The Environmental Impacts of C&D Sector

The New Circular Economy Action Plan [1] suggests the urgence of taking actions towards the implementation of CE, particularly in some key product value chains such as C&D (a list of the acronyms used is provided at the end of the manuscript) and agri-foods. In the European Union (EU), around 460 million t/year of C&DW are generated [2], while food waste amounts to 88 million t/year (20% of total food production). The lack of sustainability practices in these sectors largely contributes to the worsening of climate change [3] and other environmental problems [1]. The construction sector in particular is the largest consumer of natural resources [4,5] and this figure is expected to continue in the future [6,7] since urban areas are growing and contributing to the increase of the demand of construction materials and products [8,9]. Sand and gravel are the raw materials most used after water on Earth and their use largely exceed their regeneration rate [10], needed by natural processes to concentrate the raw material [11], and thus is not sustainable [12]. The direct environmental impacts at the extractive sites of such materials are also huge [13,14] (such as to the flora, fauna, habitats, landscape, biodiversity, water bodies) [15] and can be partially mitigated by the adoption of cleaner and more sustainable practices also in compliance with the legislation when available, as in the EU [16].

1.2. Circular Economy Opportunities for C&D Sector

Currently, at the global level it is calculated that about 20–30% of C&DW is recycled or reused. Thus, a change in this pattern is an imperative given the scarcity of natural resources and the associated just above-mentioned environmental impacts due to their extraction [5]. The transition to the CE with a focus on the reduction of the generation of C&DW [16,17] and the increase of their recycling would reduce the dependence on primary resources and improve the efficiency in their use. It will be also beneficial to mitigate the fossil energy demand [18,19] and the related environmental impacts such as global warming [20], simultaneously contributing to the achievement of climate neutrality by 2050 as envisaged in the EU Green Deal [1] and very recently confirmed by EU parliament and the G-20 Rome meeting. In the EU, the production and use of energy accounts for a large share (75%) of GHGs emissions [1]. Moreover, the CE practices for the construction sector also offer the opportunity of improving its environmental performances through the creation of synergistic relationships with other sectors such as agri-food [21] and the use as input of its by-products (e.g., hemp by-products) [22] for the production of construction materials.

1.3. Goal of the Present Study

In this explorative study we mainly evaluate the potential energy savings coming from the recycling of the current annual flows of C&DW available in the Metropolitan City of Naples (Southern Italy). As found by previous literature, the reintroduction of secondary materials from C&DW streams in a new production cycle generates energy savings from avoided landfill disposal as well as limited extraction of raw materials [23,24,25,26,27,28,29,30]. The extent of the life cycle energy savings depends on the recycling potential of the secondary raw materials to substitute the virgin materials of the new products [31]. For example, steel scraps from C&D can be re-converted into valuable materials similar to the virgin materials, whereas in the case of recycled aggregates (RA) their value is currently lower compared to the natural substitutes, resulting in less energy savings [31]. However, in the future should the CE model be more extensively applied to the C&DW sector, the RA could become more suitable substitutes of natural aggregates (NA) [32,33]. This study contributes to the evaluation of CE scenarios in C&DW management that potentially may be beneficial to the achievement of the following United Nations’ Sustainable Development Goals: 11 (Sustainable cities and communities), 12 (Responsible consumption and production), and 13 (Climate action) [34].
The present study develops over five sections. In Section 2, we briefly summarize previous studies on the field, whereas in Section 3 (Material and Methods), the main features of the investigated system, the type of data used, and the stages of this Life Cycle Assessment (LCA) study are presented. Section 4 presents the main results, its limitations and proposals for future research avenues, and Section 5 concludes by presenting the main findings, the added value of the present study and their political and managerial implications.

2. Previous Literature on LCA of C&DW Management Systems

So far LCA as a method has been extensively used to analyse the environmental impacts and benefits (including the energy benefits) deriving from the adoption of the CE framework in the C&D sector [5,18,20,23,35,36,37]. Entire C&DW management systems located in different geographical areas (Italy, Finland) have been investigated by means of LCA [24] or in combination with other tools such as GIS as in [30] or methods such as Life Cycle Costing and Material Flow Accounting [38]. Further analytical frameworks have been also proposed to study C&DW management systems in a more comprehensive sustainability perspective such as by [39], integrating environmental and resource-related impacts, and social and economic impacts.
The energy aspects are key factors that affect the environmental competitiveness of recycled aggregates compared to NA [13]. Studies have found that energy consumption for the extraction and production of NA is higher (1664.11 MJ) compared to the amount used for the recycling of C&DW (246.41 MJ). The largest contribution to the Cumulative Energy Demand (CED) is due to the non-renewable energy category because of the prevalent use of fossil fuels in the processes [28].
Many LCA studies have also found that the transport stage is significant in the life cycle of RA and their collection and re-use should be considered within a limited distance [10,19,20,23,28,40,41,42]. This highlights that the main market both for the recycling and the delivery of RA should be local. As a result, e.g., the planning of recycling facilities should take into account the relevance of the transport distances for the sustainability of C&DW recycling option and the associated energy, environmental and economic costs [28,43].
With regard to LCA studies analysing entire C&DW management systems, [25] found that the avoided impacts of the life cycle of C&DW in the province of Torino (Italy) are higher than the energy and environmental impacts generated in the life cycle of C&DW. The net energy savings resulted 250 MJ/t whereas the total net contribution to global warming amounted to about 14 kg CO2 eq. [25]. Reference [38] reported higher avoided environmental impacts (−360 kg CO2 eq.) for the life cycle of C&DW in Finland including the pre-treatment stage, treatment (landfilling), recovery/utilization, transportation, and avoided production, whereas [19], by modelling three scenarios (current scenario, landfilling scenario and best-case scenario), found that only the latter yielded avoided energy impacts equal to −24 MJ-eq./tonne of managed C&DW whereas the contribution to climate change was −1.78 kg CO2 eq. Finally, [39] also considered three scenarios: baseline, linear with total disposal of C&DW in landfilling and best practice scenario based on the adoption of selective demolition and an increased amount of high-quality RA produced in stationary recycling plants compared to the baseline scenario. Their indicators in the best practice scenario show that the management of 1 t of C&DW can save 18 kg CO2 -eq./t and about 6 kg oil-eq./t.

3. Material and Methods

In this section we summarize the main features of the C&DW system under investigation as well as of the Life Cycle Assessment (LCA) model developed in the present study. LCA, as a well-known tool for evaluating the environmental aspects and potential impacts of products, processes and services, was chosen as the main method of analysis and performed according to the standard ISO 14040:2006 [44].

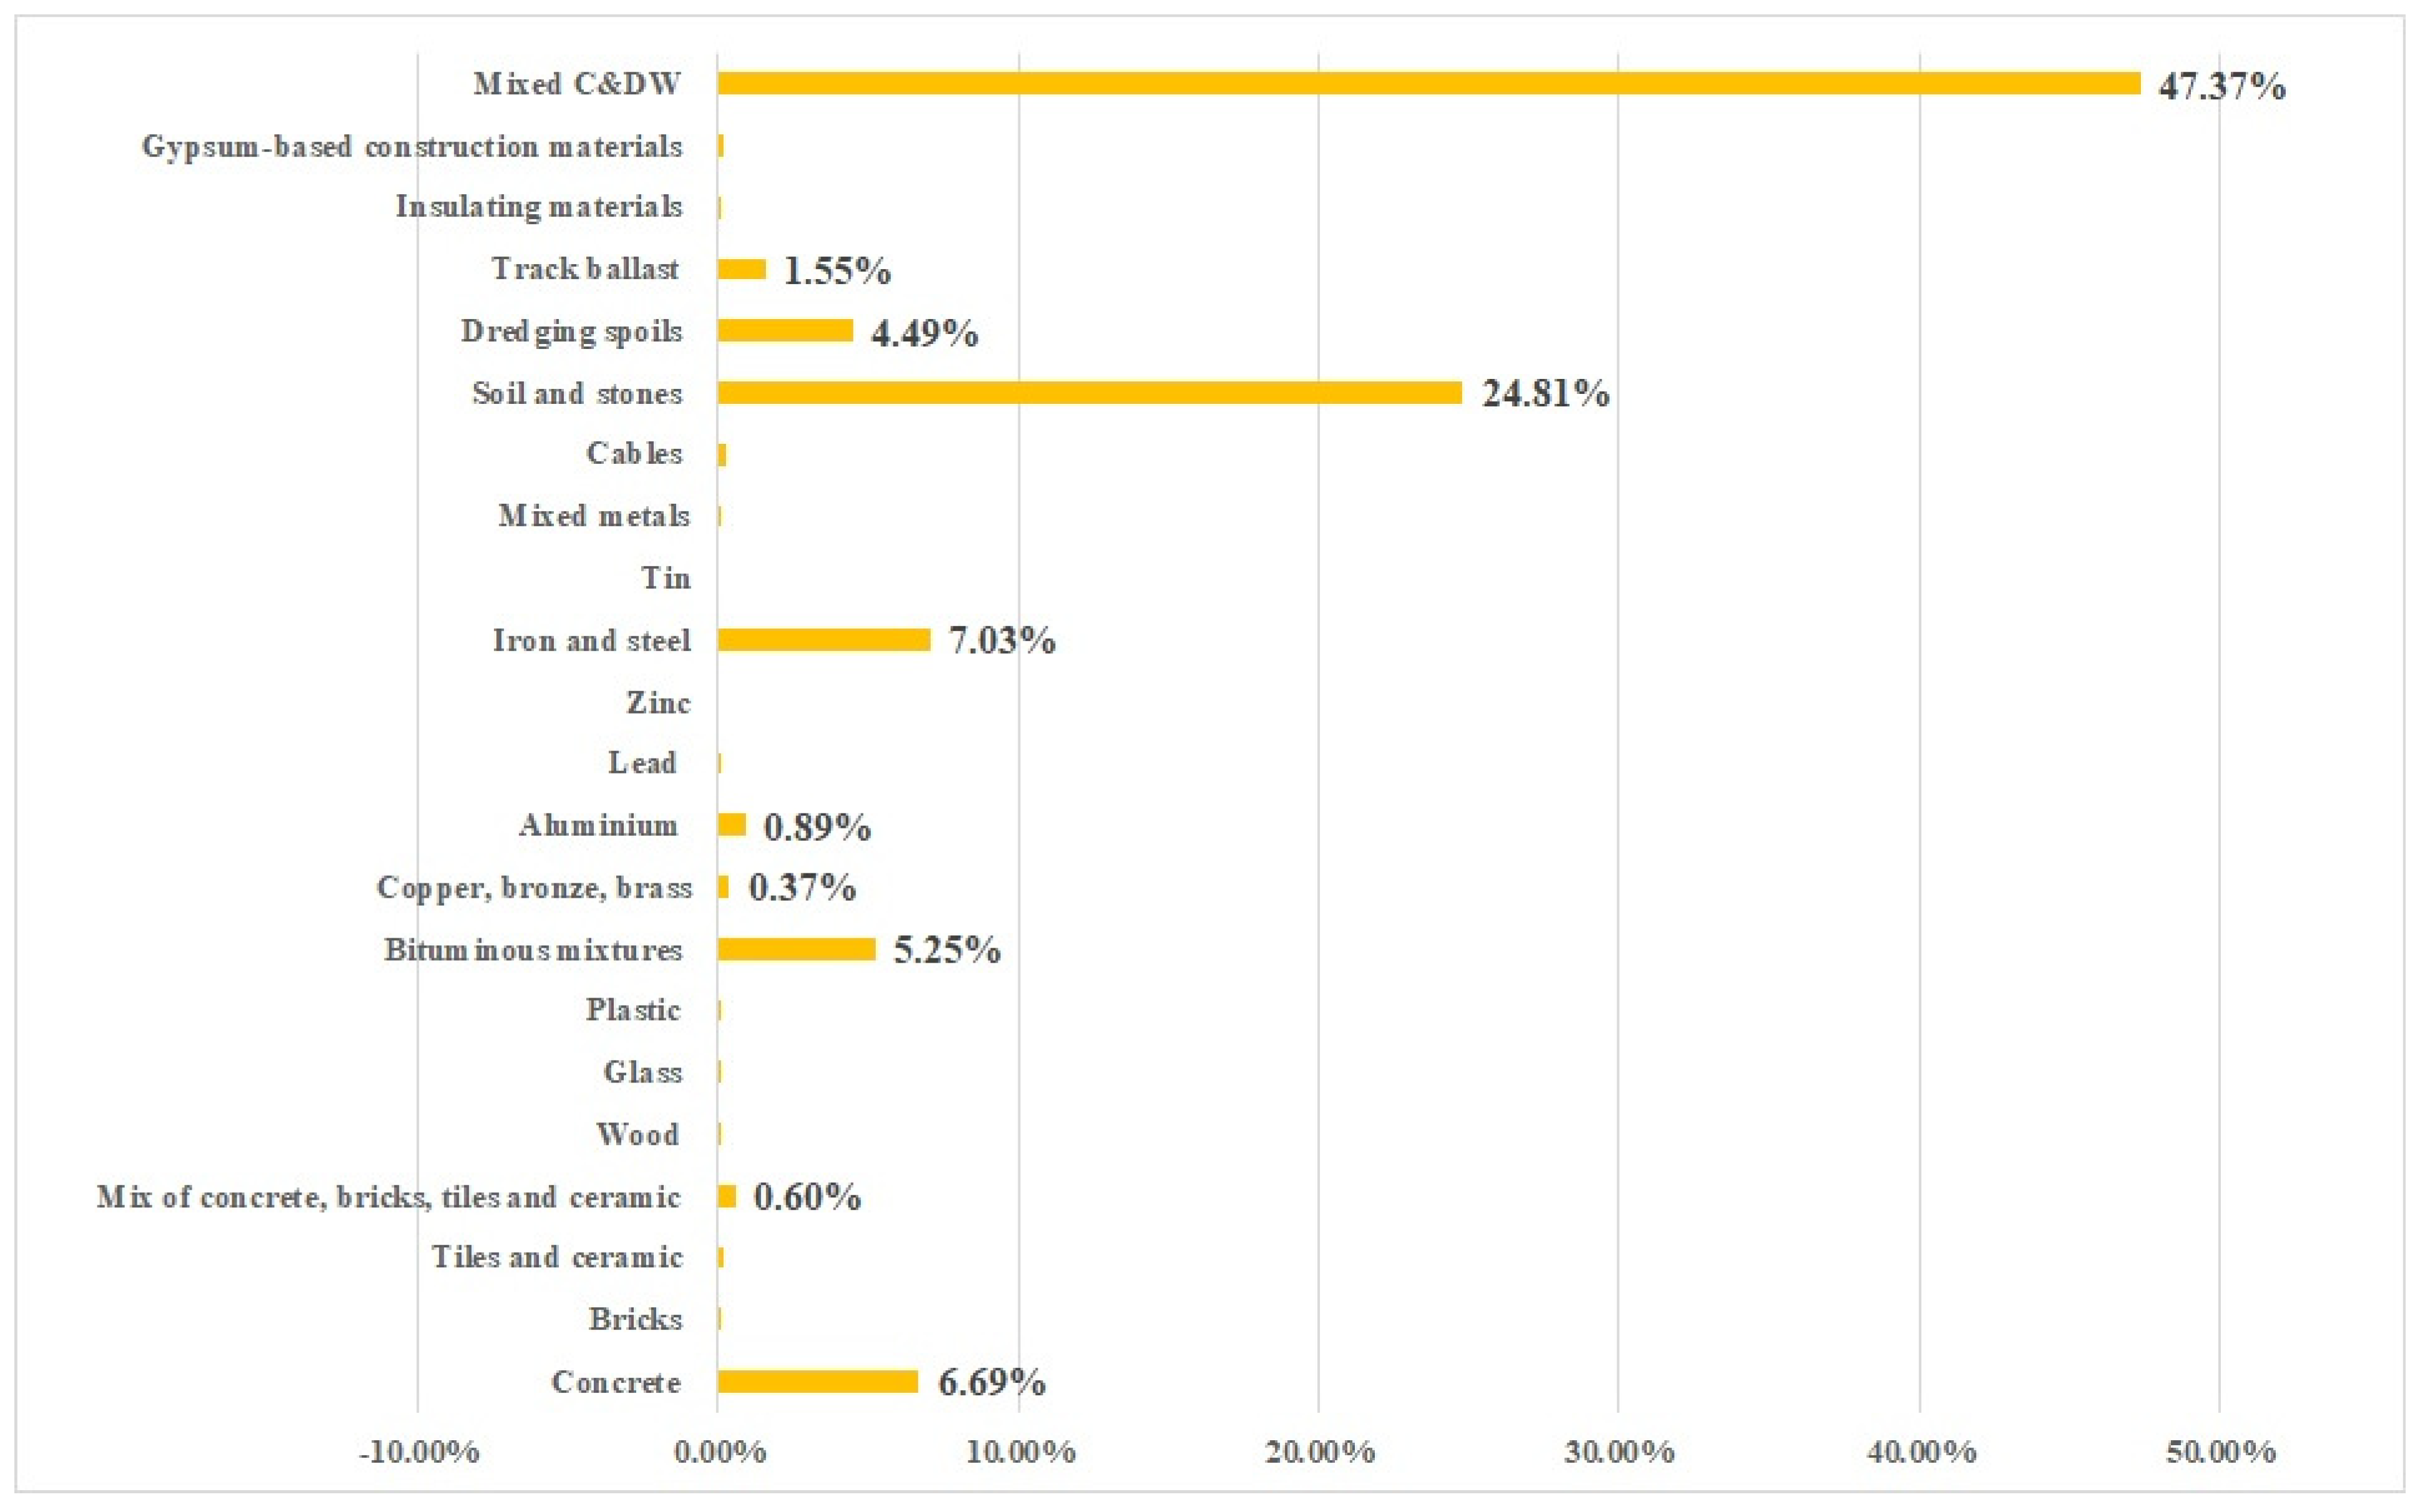
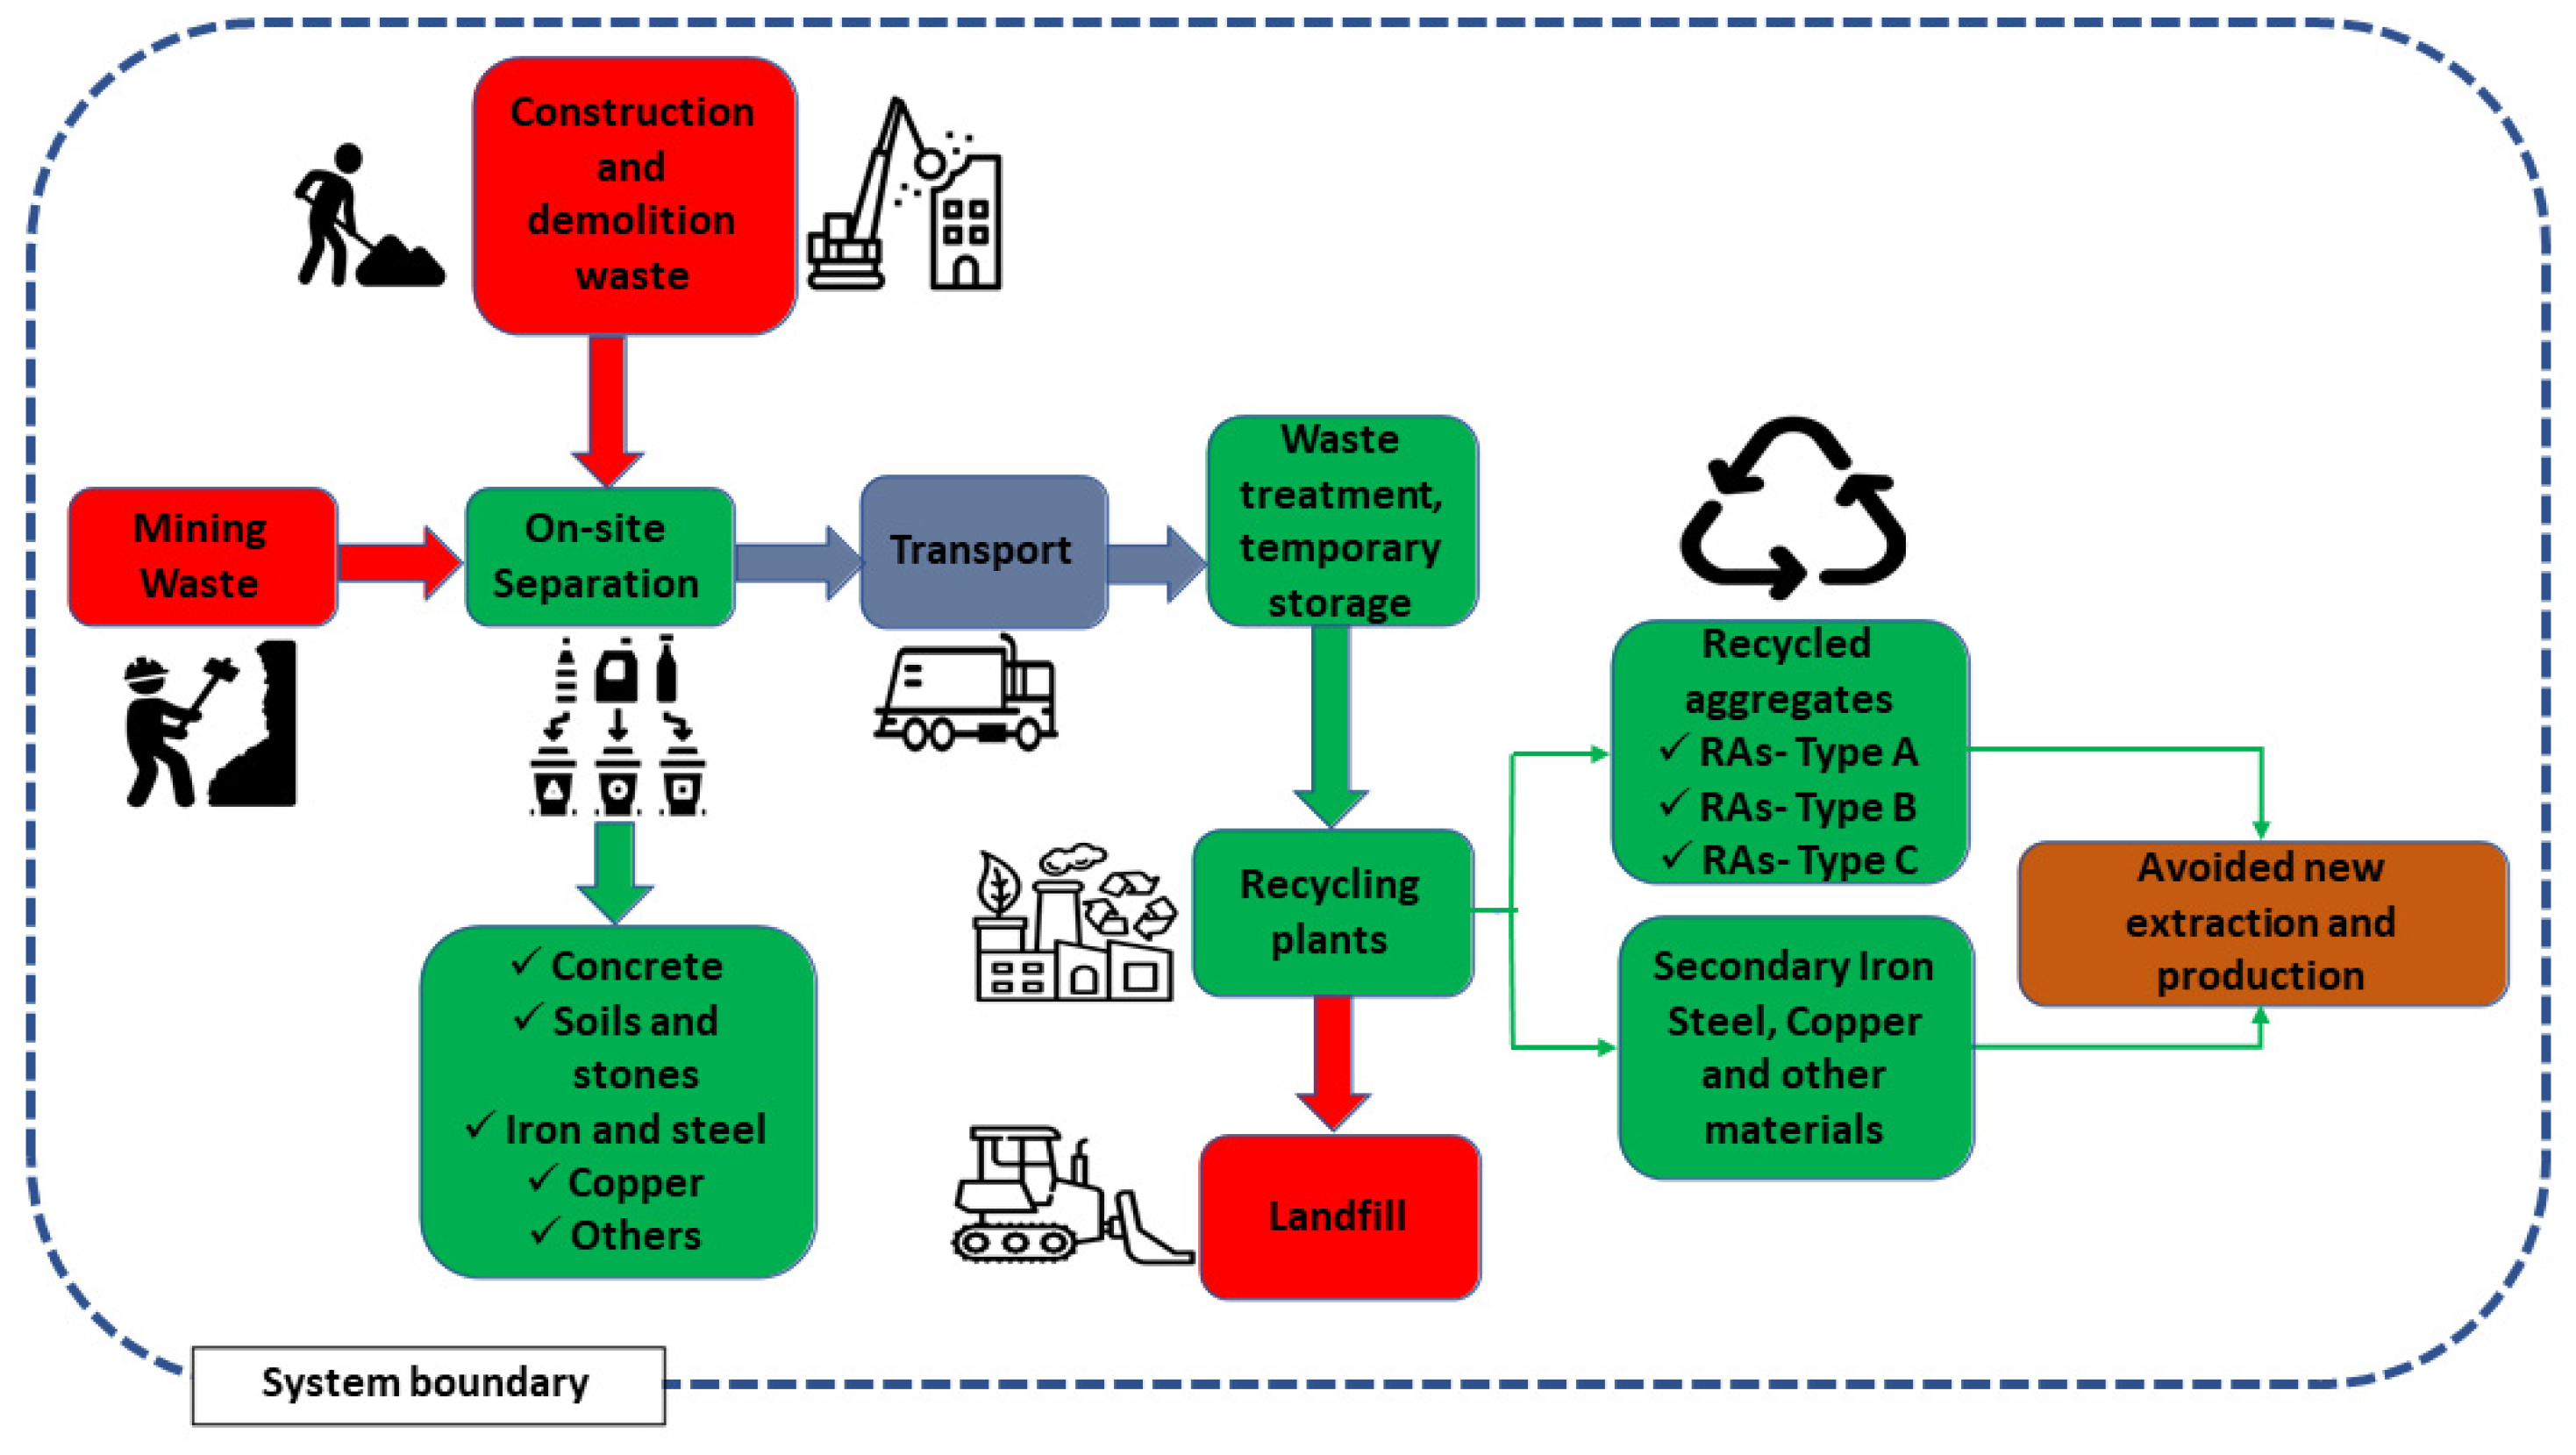
3.1. The Investigated C&DW Generating System

The C&W management system of the Metropolitan City of Naples is considered in this study. The Metropolitan City of Naples is one of the five provinces of Campania Region (Southern Italy) (Figure 1). Its total surface covers a small area (1179 km2, 8.6%) of the whole regional territory but hosts more than the half of the total regional population. The population density is very high (2630 inhabitants/km2) both compared to the other provinces of Campania Region and Italy. In administrative terms, the Metropolitan City of Naples was established under the Italian Law No. 56/2014 replacing the Province of Naples from 1 January 2015 while maintaining the same land area.
With regard to C&DW, the available primary data evidence that its production amounted to 9.13 × 10⁵ tonnes in the year 2017 consisting of non-hazardous C&DW (9.02 × 10⁵ tonnes) and hazardous C&DW (1.12 × 10⁵ tonnes). Figure 2 shows the composition of the generated non-hazardous C&DW in the Metropolitan City of Naples. The main fractions composing the total amount are mixed C&DW (47.37%), soil and stones (24.81%), iron and steel (7.03%), concrete (6.69%), and bituminous mixtures (5.25%).
After the collection on the construction or demolition sites, the C&DW are sent to the available recycling plants in the Metropolitan City of Naples. The data evidence that, in the year 2017, they were almost entirely treated under the management option “R5” (87% of the total amount), that entails the recycling/recovery of other inorganic substances, whereas minor fractions (10%) were treated under the option “R4”, that regards the recycling/recovery of metallic compounds. A low fraction (3%) was stocked at the end of the year (31 December 2017). Hazardous C&DW were a minor fraction of the total annual C&DW (1%) and after the generation they were mainly disposed of under the category “D15”, involving a preliminary disposal of C&DW before other kinds of disposal options. After that, only a small fraction (973 tonnes) of the total amount of hazardous C&DW produced annually remains in the Metropolitan City, as most of them are sent to other Italian Regions.

3.2. Life Cycle Assessment Method

The LCA as a technique has been developed since the sixties to better understand and address the environmental impacts of products, services and activities [44,46,47] in a wide range of sectors [48,49], including construction [50,51,52,53] and demolition [54,55] activities. The ISO 14040 (2006) [44], that is the main normative framework for the LCA, suggests its use for many purposes:
  • Improvement of the environmental performance of products throughout their life cycle;
  • Support to decision-makers in industry, government or non-government organizations (e.g., strategic planning, priority setting, product or process design or redesign);
  • Selection of relevant indicators of environmental performance, including measurement techniques;
  • Marketing (e.g., implementation of an ecolabelling scheme of type I (ISO 14024) such as the Eco-label), or making an environmental claim (e.g., the environmental labelling of type II regulated by the ISO 14021) or adhering to an environmental product declaration (e.g., the environmental labelling of type III within the ISO 14025 standards).
The LCA takes into account the environmental aspects and the potential environmental impacts of a product (e.g., the use of natural resources and the environmental consequences of their use) in a holistic manner given that it considers the whole life cycle of a product from raw material extraction, through production, use, end-of-life treatment, recycling and final disposal (i.e., cradle-to-grave). In so doing, the LCA stimulates industrial activities to look beyond the traditional focus on production sites and manufacturing processes, so to include the environmental impacts of a product in all the other stages, including the end-of-life stages and the return to the original or new production cycle, by means of the reuse of products or components [56,57,58] or the recycling of materials [59]. This contributes to closing the production and consumption cycle as suggested by the CE framework while maximizing resource reuse (also avoiding their future extraction) and the reduction of waste disposed of in landfills [25,60].
The procedural framework for performing an LCA consists of four phases that comprises: the definition of the goal and scope of the LCA study, the life cycle inventory analysis (LCI), the life cycle impact assessment (LCIA), the life cycle interpretation, reporting and critical review of the LCA, limitations of the LCA, the relationship between the LCA phases, and conditions for use of value choices and optional elements (ISO 14040: 2006) [44].
In waste management, the LCA is useful in the comparison of the environmental impacts of products made of natural and recycled materials since it provides the opportunity to expand the system boundaries beyond the waste management processes [61]. In this perspective, it is also applied to identify the best management options for waste products available in the waste hierarchy (e.g., reuse, recycling, waste to energy and landfilling), being considered a very good scientific alternative to the latter [27].

3.2.1. Goal and Scope

The LCA methodology is applied in this study with the aim of evaluating the energy savings coming from the implementation of recycling scenarios for the different fractions of non-hazardous C&DW generated in the Metropolitan City of Naples in the year 2017.
The present study further integrates previous works of the research group [62,63], having the goal of providing scientific support and useful feedback to the Public Administration of Campania Region that is in charge of the management of C&DW. These latter are classified as special waste in Italy, and are a specific matter of regional authorities, that by means of regional plans, decide the main strategies for such kind of special waste. The functional unit considered in this study is 1 tonne of recycled non-hazardous C&DW.
The system boundaries include the stages and associated processes to the recycling of the main fractions composing the total non-hazardous C&DW (mixed C&DW, soil and stones, iron and steel, aluminium, concrete and bituminous mixtures) (Figure 2). Therefore, the stages considered in this LCA study for the recycling scenario are the following:
  • Collection and transportation of the generated C&DW to the recycling plants of the Metropolitan area;
  • Recycling of the most relevant materials (mixed waste, iron and steel, Aluminium, soil and stones, concrete) into recycled aggregates of different types (A, B, C) and recycled metals;
  • Delivery of the RA and secondary metals and their reintroduction in the production cycle (it was assumed to occur in the local market so as to reduce as much as possible the contribution of this stage);
  • Avoided landfilling;
  • Avoided extraction and production of virgin materials.
The above first three steps require energy and materials for collection and processing in order to make the recycled materials available to the user. These costs and related impacts are referred to in the following section of this study as “induced”, in so meaning that they are needed to implement the recycling process. However, the recycled products allow additional savings in that the landfill and mine operations are avoided. We will refer with the term “avoided” to these much larger costs and impacts that will be no longer needed thanks to the recycling processes, in so pointing out the huge benefit of C&DW recovery.
Figure 3 considers the boundaries of the system and the main unit of process. With regard to the output of the recycling stage, due to the lack of data of the quality of the recycled aggregates, we assumed that all the concrete C&DW could be recycled into recycled aggregates of higher quality (Type A) that can be used in concrete production (UNI EN 12620 Standard). We assumed that the other C&DW fractions could be recycled into aggregates of type B and type C in conformity to the UNI EN 13242 standard. Our assumptions are based on the data of the ARPAC Campania from which result that almost the whole amount of non-hazardous C&DW inert fraction generated annually is recovered under the category R5 (recycling/recovery of other inorganic substances) as described in the annual reports by the Italian Institute for Environmental Protection and Research (ISPRA).
In addition to the evaluation of the recycling scenario for C&DW into recycled aggregates of different types, this study also considers expanding the analyses to the production of concrete to indicate (as an example) the end-use of recycled aggregates in the Metropolitan City of Naples. In that, a comparison of concrete produced from natural, recycled and green aggregates (using agro-industry by-products) is proposed. We assumed the use of hemp-integrated aggregates (aggregates enriched with hemp by-products) for the production of green concrete in agreement with our goal of exploring synergies between the construction and the agri-food sector. In this case we applied the allocation procedure for the partitioning of the energy impacts on the basis of the fact that “when a process has two co-products, the allocation is performed to both of them, generally based on their energy content or their mass or their fraction of economic value” [44,64].
The cumulative energy demand (CED) method [65] was chosen in the present study as LCA impact assessment method to assess the energy consumption and savings related to the recycling of 1 tonne of C&D waste in the Metropolitan City of Naples. Considering a zero-burden approach, CED represents all the direct and indirect energy input flows including the collection and transportation of C&D waste to the recycling plant [66]. According to [67], CED has been criticized as a single-score life cycle impact assessment method and in order to counter this constraint, this paper chose to incorporate the ReCiPe MidPoint and Endpoint method [68] pointing towards decision-making to include environmental impact indicators affecting human health, resources and ecosystems scores. The SimaPro version 9.1.1 [69] software tool is used to both the CED and ReCiPe impact scores.
We complement this study with a further assessment where we evaluated and compared the energy impacts (CED) of conventional concrete with two alternative concretes made of RA and hemp by-products in order to explore the sustainability of this latter material. There is an increasing interest in reintroducing the hemp crop in Italy and in the Campania Region due to the wide range of applications in industry that this crop could have. This latter analysis can be considered preliminary to future research works of the research team of the authors.

3.2.2. Life Cycle Inventory (LCI)

This second phase in the LCA consists of an inventory of input/output data of the system under investigation and then involves the collection of the data that are necessary for achieving the goal of the study (ISO 14040: 2006) [44].
The data in this LCA study consist of both primary and secondary data. The primary data regard the annual flows of C&DW generated in the Metropolitan City of Naples in the year 2017 in all projects of construction and demolition of buildings or infrastructures. The data were kindly provided by the Campania Regional Agency for the Environmental Protection (ARPAC).
The secondary data collected regarded the transport stage of the C&DW waste from the construction sites to the modelled recycling plants: Ecoinvent 3.8 database [70] and previous literature [24,31,39]. We assumed to cover a distance of 30 km which aligns with the distance considered by [39]. This latter study was applied to the Campania Region which hosts the Metropolitan City of Naples as one of the five provinces and the area of investigation in this LCA. The data of the treatment of C&D waste at the recycling plant were adopted from [19] based on a number of recycling facilities in the Lombardia Region in Northern Italy.
The landfill option was adopted from the Ecoinvent 3.8 [70] database for a sanitary landfill treatment of inert waste (Europe without Switzerland).
Table 1 and Table 2 show the specific inventories (input and output) relating to the recycling of C&D waste, avoided extraction and production of virgin construction materials and finally the production of concrete from natural, recycled and agri-food (hemp–concrete) aggregates. Table 1 includes as input 1 tonne of recycled C&DW composed of mixed C&DW (47.37%), soil and stones (24.81%), iron and steel (7.03%), concrete (6.69%) and bituminous mixtures (5.25%). Table 2 does not include the input flow of C&D waste considering a zero-burden approach but instead includes resources for collection and treatment.
For the comparison of the different types of concrete (made of NA, RA and hemp by-products), we collected the data from the study by [71] related to the production of conventional and recycled concrete as well as from [22] for the production of hemp concrete.

3.2.3. Life Cycle Impact Assessment

As the third phase in an LCA study, the impact assessment allows to determine the potential contribution on the environment and human health generated by a product or service in its life cycle. The inputs and outputs of the inventory phase are assigned to specific impact categories concerning internationally recognized environmental effects as significant (classification), so as to be able to quantify, through specific characterization methods, the total contribution that the product or service generates to each of the environmental effects considered. In that, the purpose of this phase is elaborating the information resulting from the LCI and better understand their environmental significance (ISO 14040: 2006). The results of this phase are presented in detail in the following Section 4.

4. Results

This section shows the results obtained after processing the inventory data (reported in Table 1 and Table 2) of the recycling scenario for the main fractions of C&DW by means of the LCA SimaPro 9.1.1. software tool [69]. In the second part of this section, we show the results of an explorative analysis where we compare the concrete blocks made of NA and RA as well as of hemp by-products.

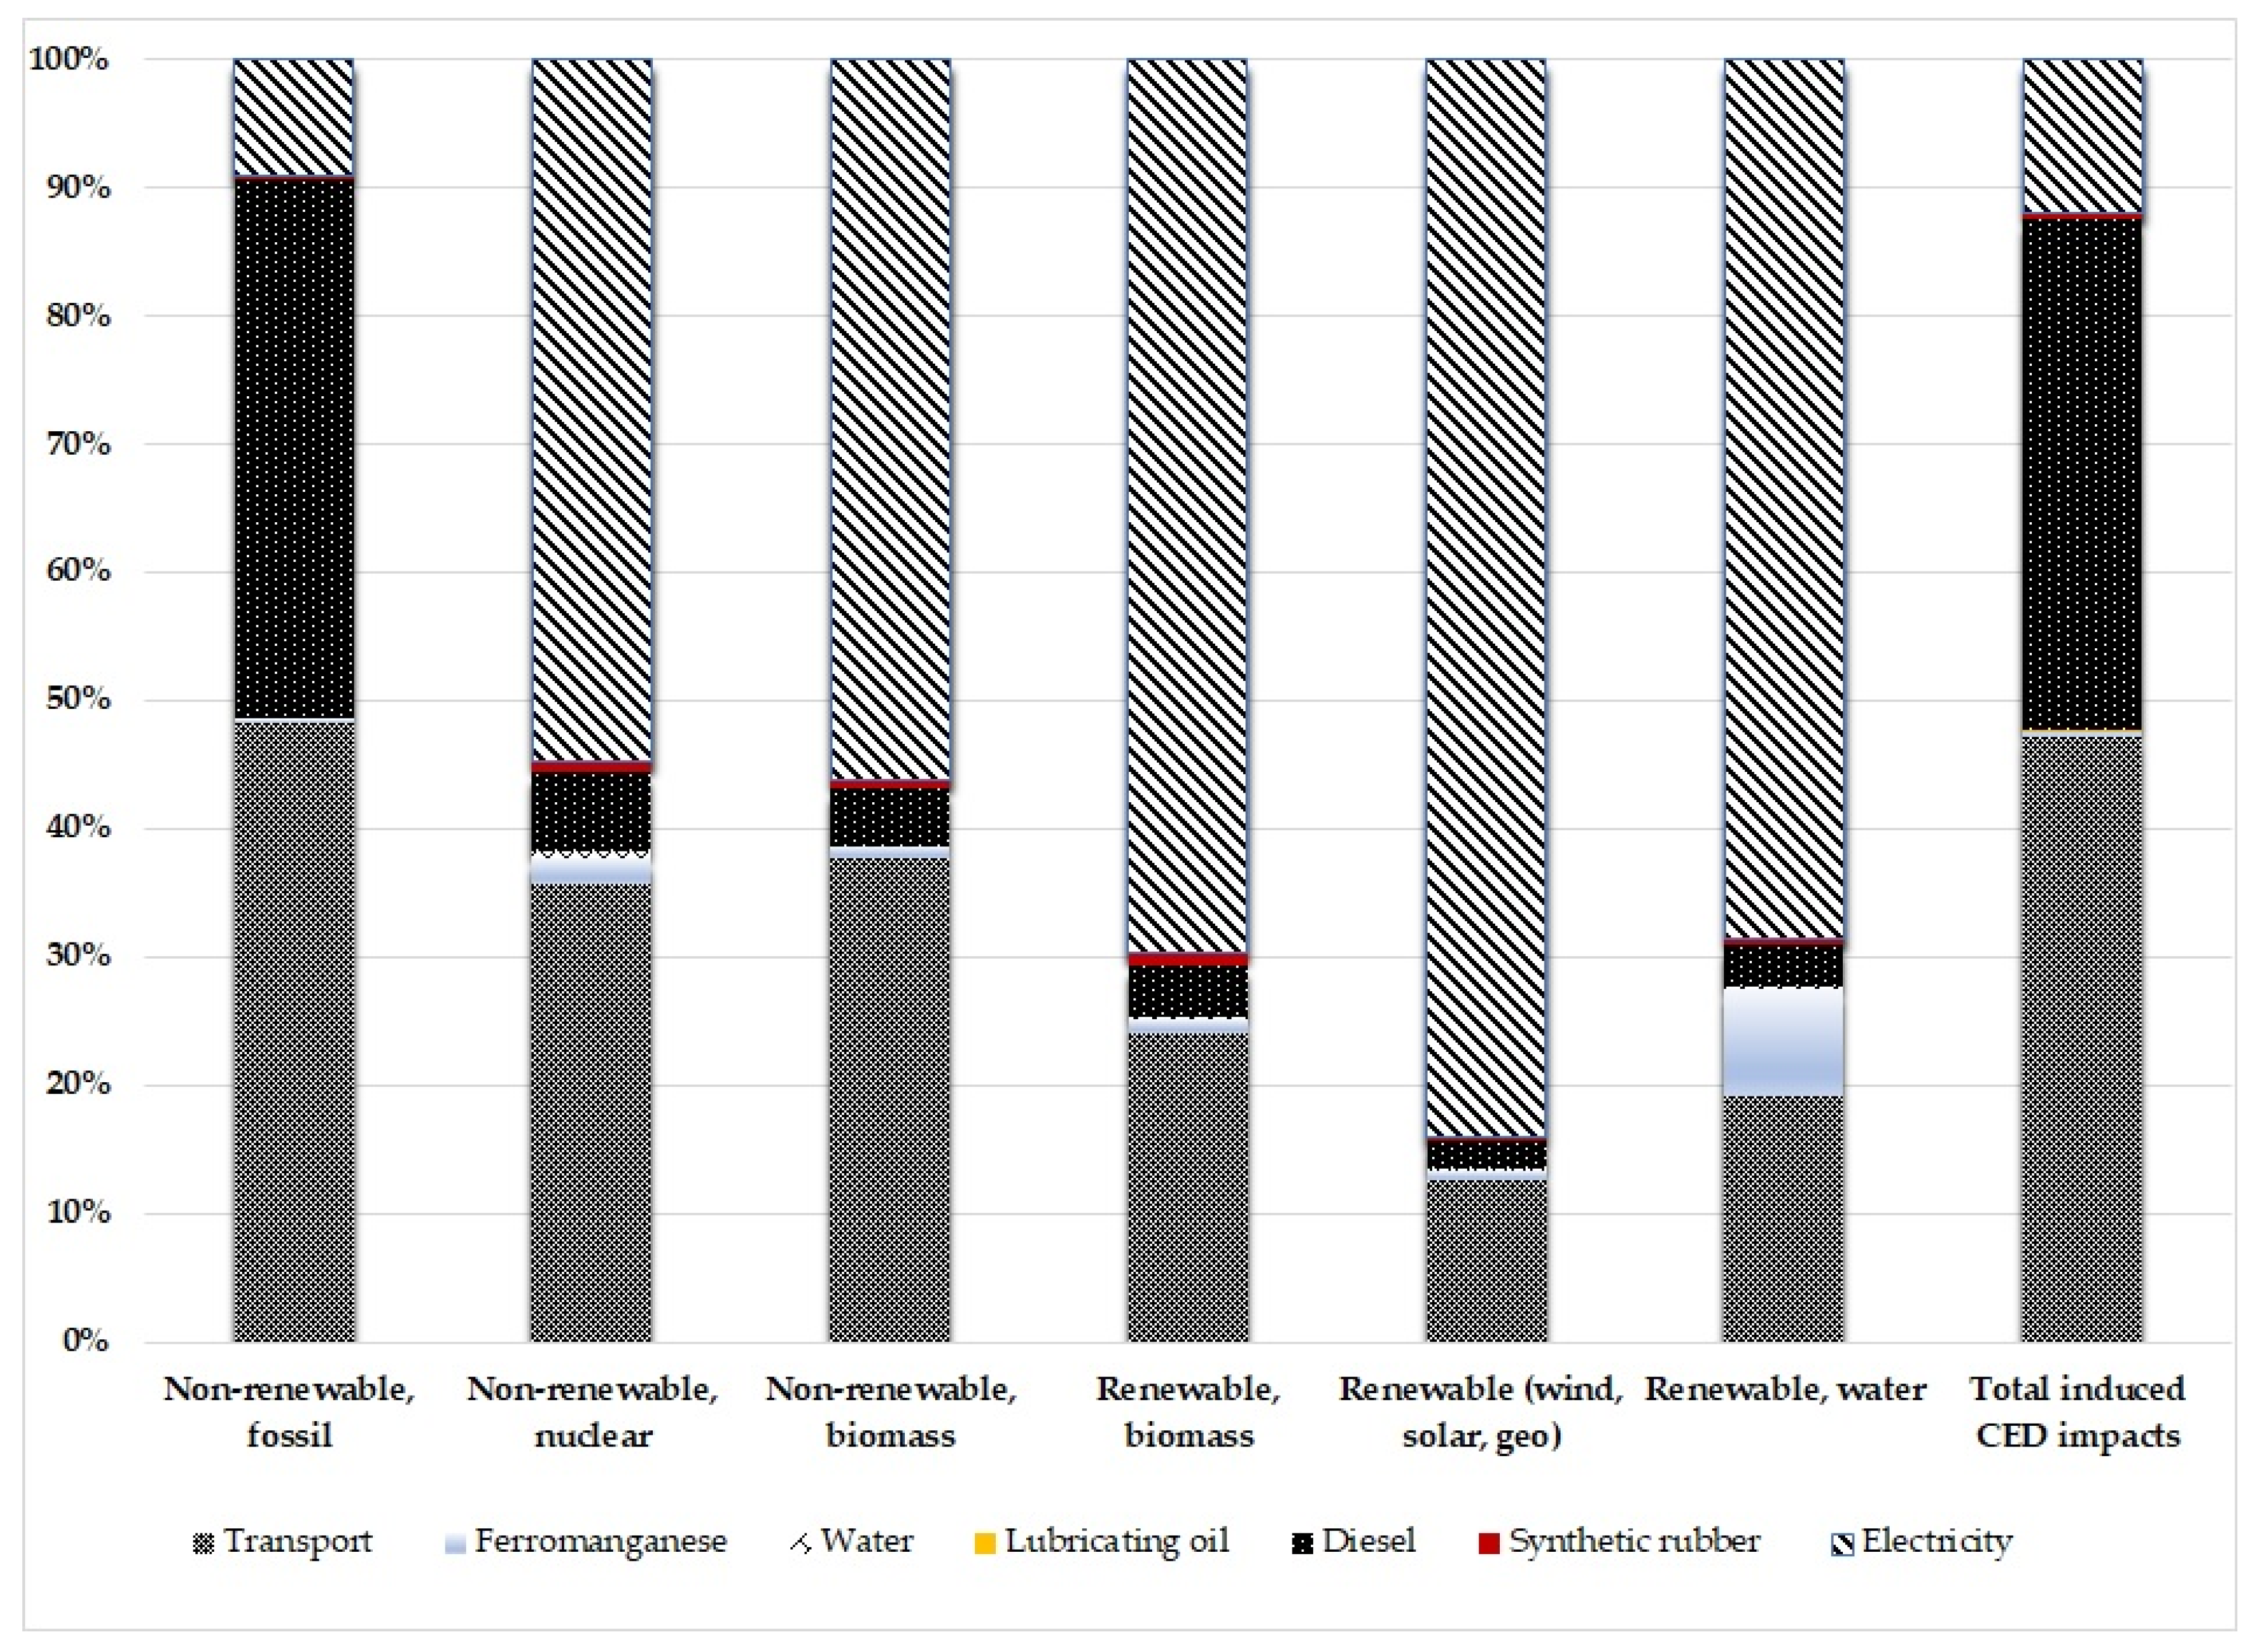
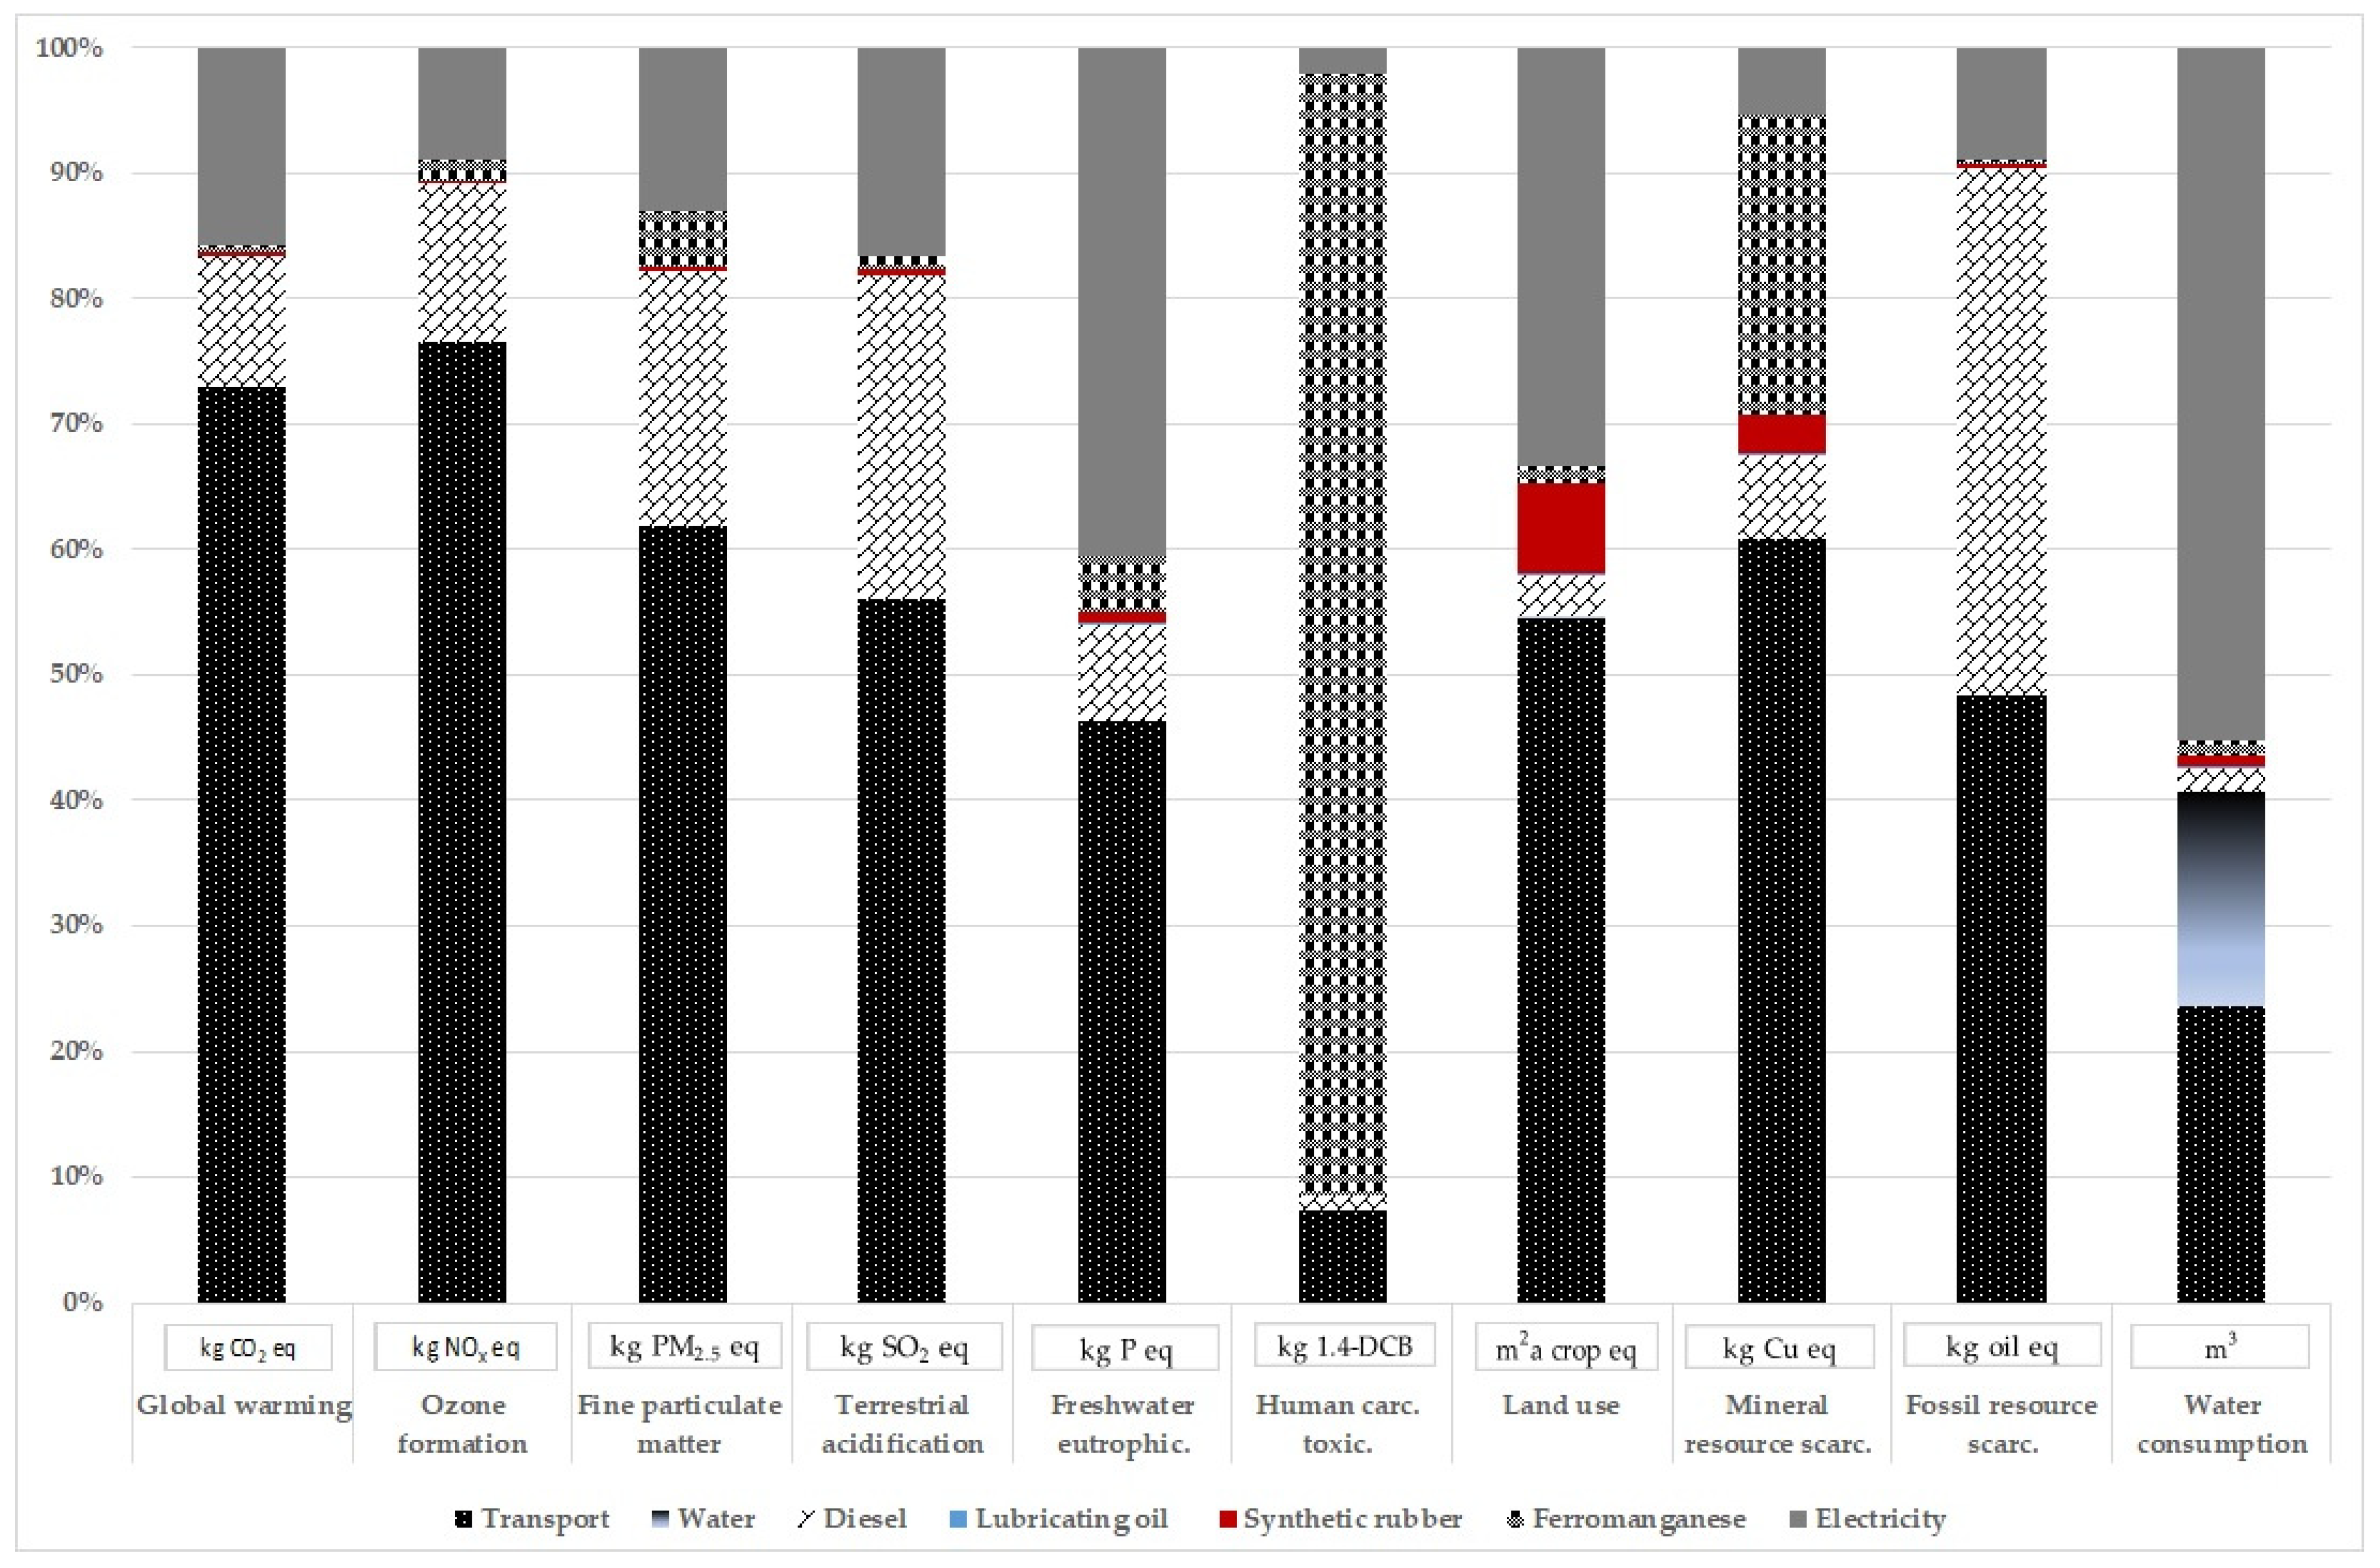
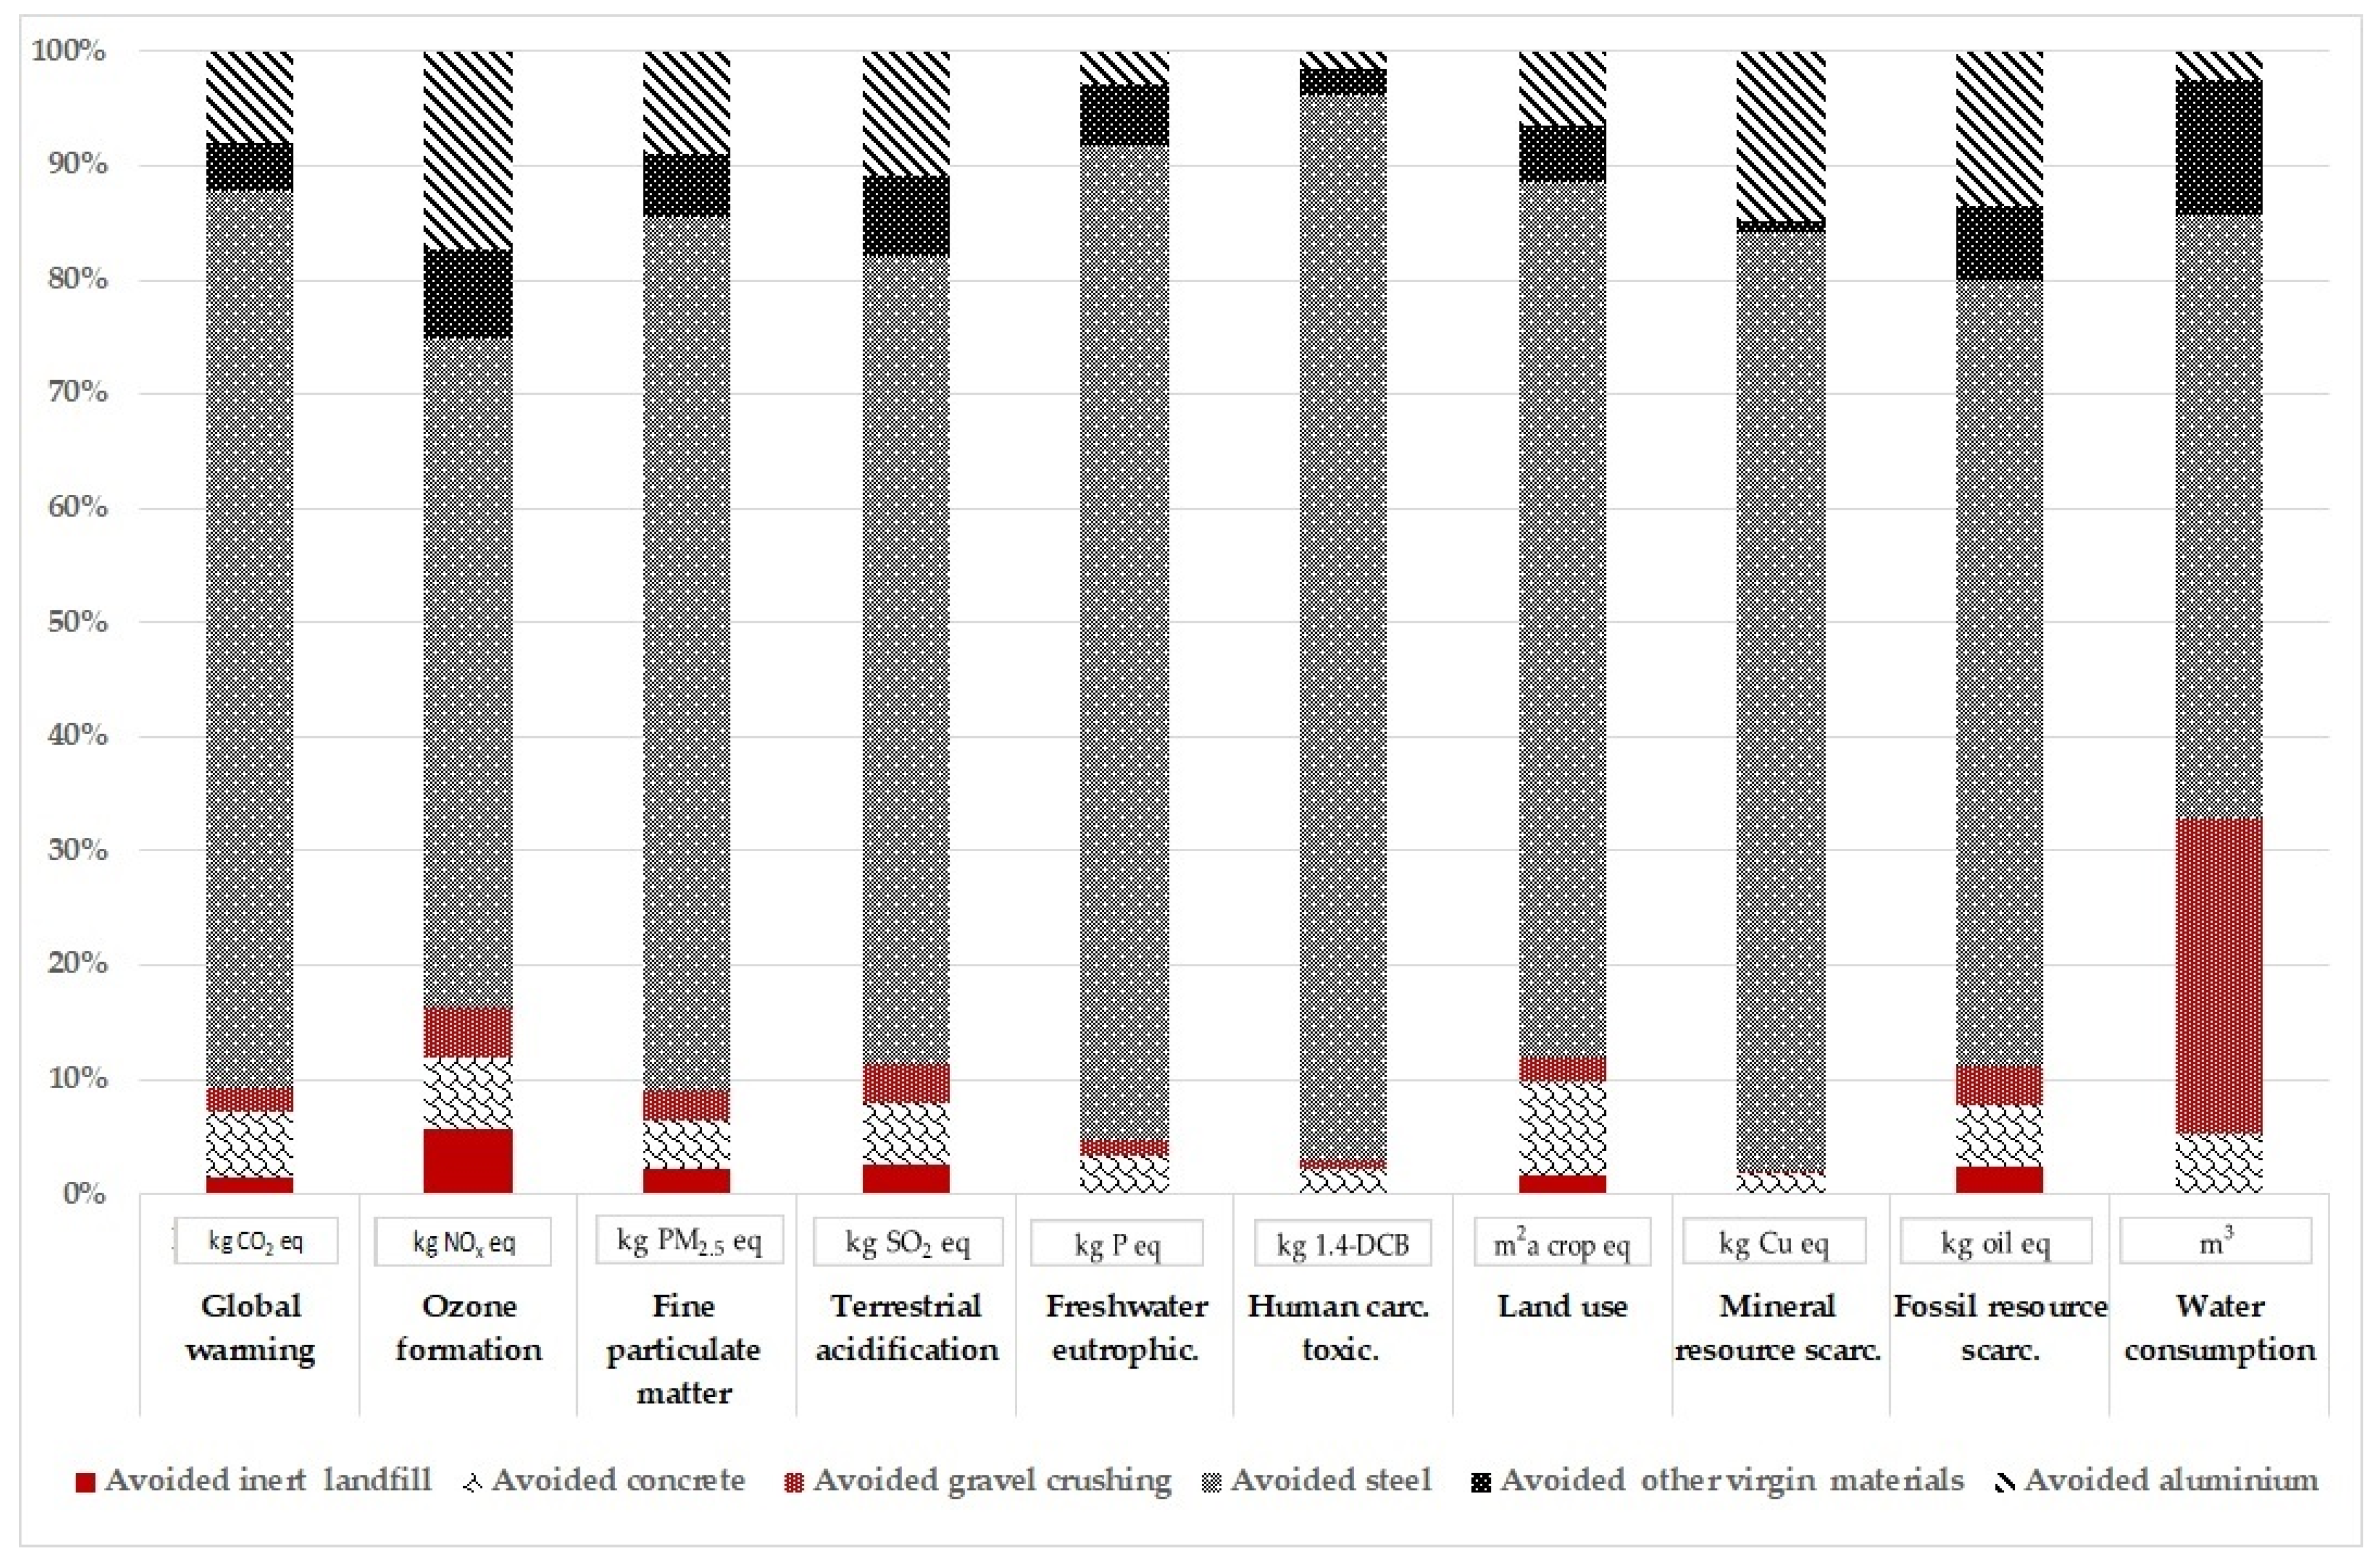
4.1. Energy and Environmental Impacts of the Recycling Scenario for C&DW

Table 3 shows the results in terms of energy related characterized CE impacts associated with the functional unit (1 tonne of collected and recycled C&DW). The transport stage and the recycling plant stage, both due to the use of diesel, are the most significant energy upstream factors as shown by the higher values compared to the other inputs. The transport and recycling stages mainly contribute to the non-renewable fossil energy category (91.31 MJ) within the total CED. This leads to determine that the life cycle of 1 tonne of C&DW mainly generate impacts related to the non-renewable fossil category with small contributions by the other non-renewable (nuclear and biomass) and renewables (biomass, wind, solar and geothermal) categories.
These results are clearly evidenced in Figure 4 that shows the percentage contribution of each input to the different energy impact categories (fossil, hydro, nuclear, etc). The last column is the total CED, indicating that transport stage and diesel used in the recycling plant contribute to about 90% of the total CED impacts (non-renewable and renewable sources). Electricity and diesel (non-renewable fossil energy) contribute significantly to the energy demand of the recycling facility, due to the mechanical operations for sorting waste and their treatment for the production of RA.
In the year 2018, the Italian electricity mix was composed of 45% natural gas (a fossil fuel), followed by hydroelectricity for 16.5% and other renewable energy sources accounting for less than 25% combined (biomass, solar and wind). If the energy transition is realized, in the light of the need for reducing the contribution to climate change and greenhouse emissions, there is a possibility to completely replace fossil fuels with renewable fuels (at least for the production of electricity) enabling the reduction of the impacts caused by non-renewable fossils [72,73]. In order to reduce the contribution to global warming it would be important to understand how to replace fossil fuels with renewables in the light of the recent IPCC report on climate change. On the other hand, the avoided extraction and production of virgin construction material replaced by secondary materials will favour the transition to CE thus improving overall energy savings.
Table 4 shows the avoided characterized CED impacts in the life cycle of 1 tonne of C&DW. The high share of prevented impacts (1181.13 MJ) comes from the avoidance of steel production in all the CED categories (non-renewables and renewables). Moreover, avoided aluminium and avoided virgin materials also led to non-negligible avoided CED impacts. The same impacts are shown in Figure 5, as percentage values in each category.
The last column of the Table 4 shows the net energy savings arising from the difference between the induced and avoided CED impacts. In total they amount to −1628.98 MJ. The highest contribution to the total is due to the savings realized in the non-renewable fossil component of the CED (−1498.40 MJ).
The contribution of steel in total avoided CED impacts is also well highlighted in Figure 5 showing the percentage values of all avoided factors in the life cycle of 1 tonne of C&DW.
As a complement to Table 4, Table 5 summarizes the LCA induced environmental characterized impacts associated with the collection and recycling of 1 tonne of C&DW. The latter contributes to global warming by realizing in total 3.74 kg CO2 equiv. with the transport stage mainly contributing with 2.73 kg CO2 equiv. Lower absolute values of GHG emissions are released by the diesel and electricity used in the recycling plants. The use of fossil fuels in the transport and recycling stages translates into environmental impacts in the fossil resource scarcity category. Percentage impacts for this process are also shown in Figure 6, for easier identification of the most contributing steps and flows.
For the sake of clearer identification of the main contributing inflows to the LCA impacts, Figure 6 expresses selected environmental impact categories highlighting transport, electricity and diesel as dominating input flows which are carrying a significant proportion of the environmental burden associated with the collection and recycling of 1 tonne of C&D waste.
Table 6 evidences the avoided environmental impacts resulting in the life cycle of 1 tonne of C&DW. The avoidance of landfilling generates environmental benefits in terms of avoided GHG emissions of 2.56 kg CO2 equiv. The environmental benefits of steel recycling are relevant as they avoid the production of primary steel and the associated release of GHG emissions (−145.29 kg CO2 equiv.).
The difference from induced (Table 5) and avoided (Table 6) environmental components result in a negative net contribution to global warming (−181.13 kg CO2 equiv.) and to fossil resource scarcity (−32.56 kg oil eq.) evidencing the environmental benefits of recycling.
Figure 7 (with percentage values derived from Table 6) highlights very clearly the highest shares of avoided steel, aluminium and virgin materials production in all the environmental impact categories. Moreover, a non-negligible share results from avoided gravel crushing in the environmental category “water consumption”.

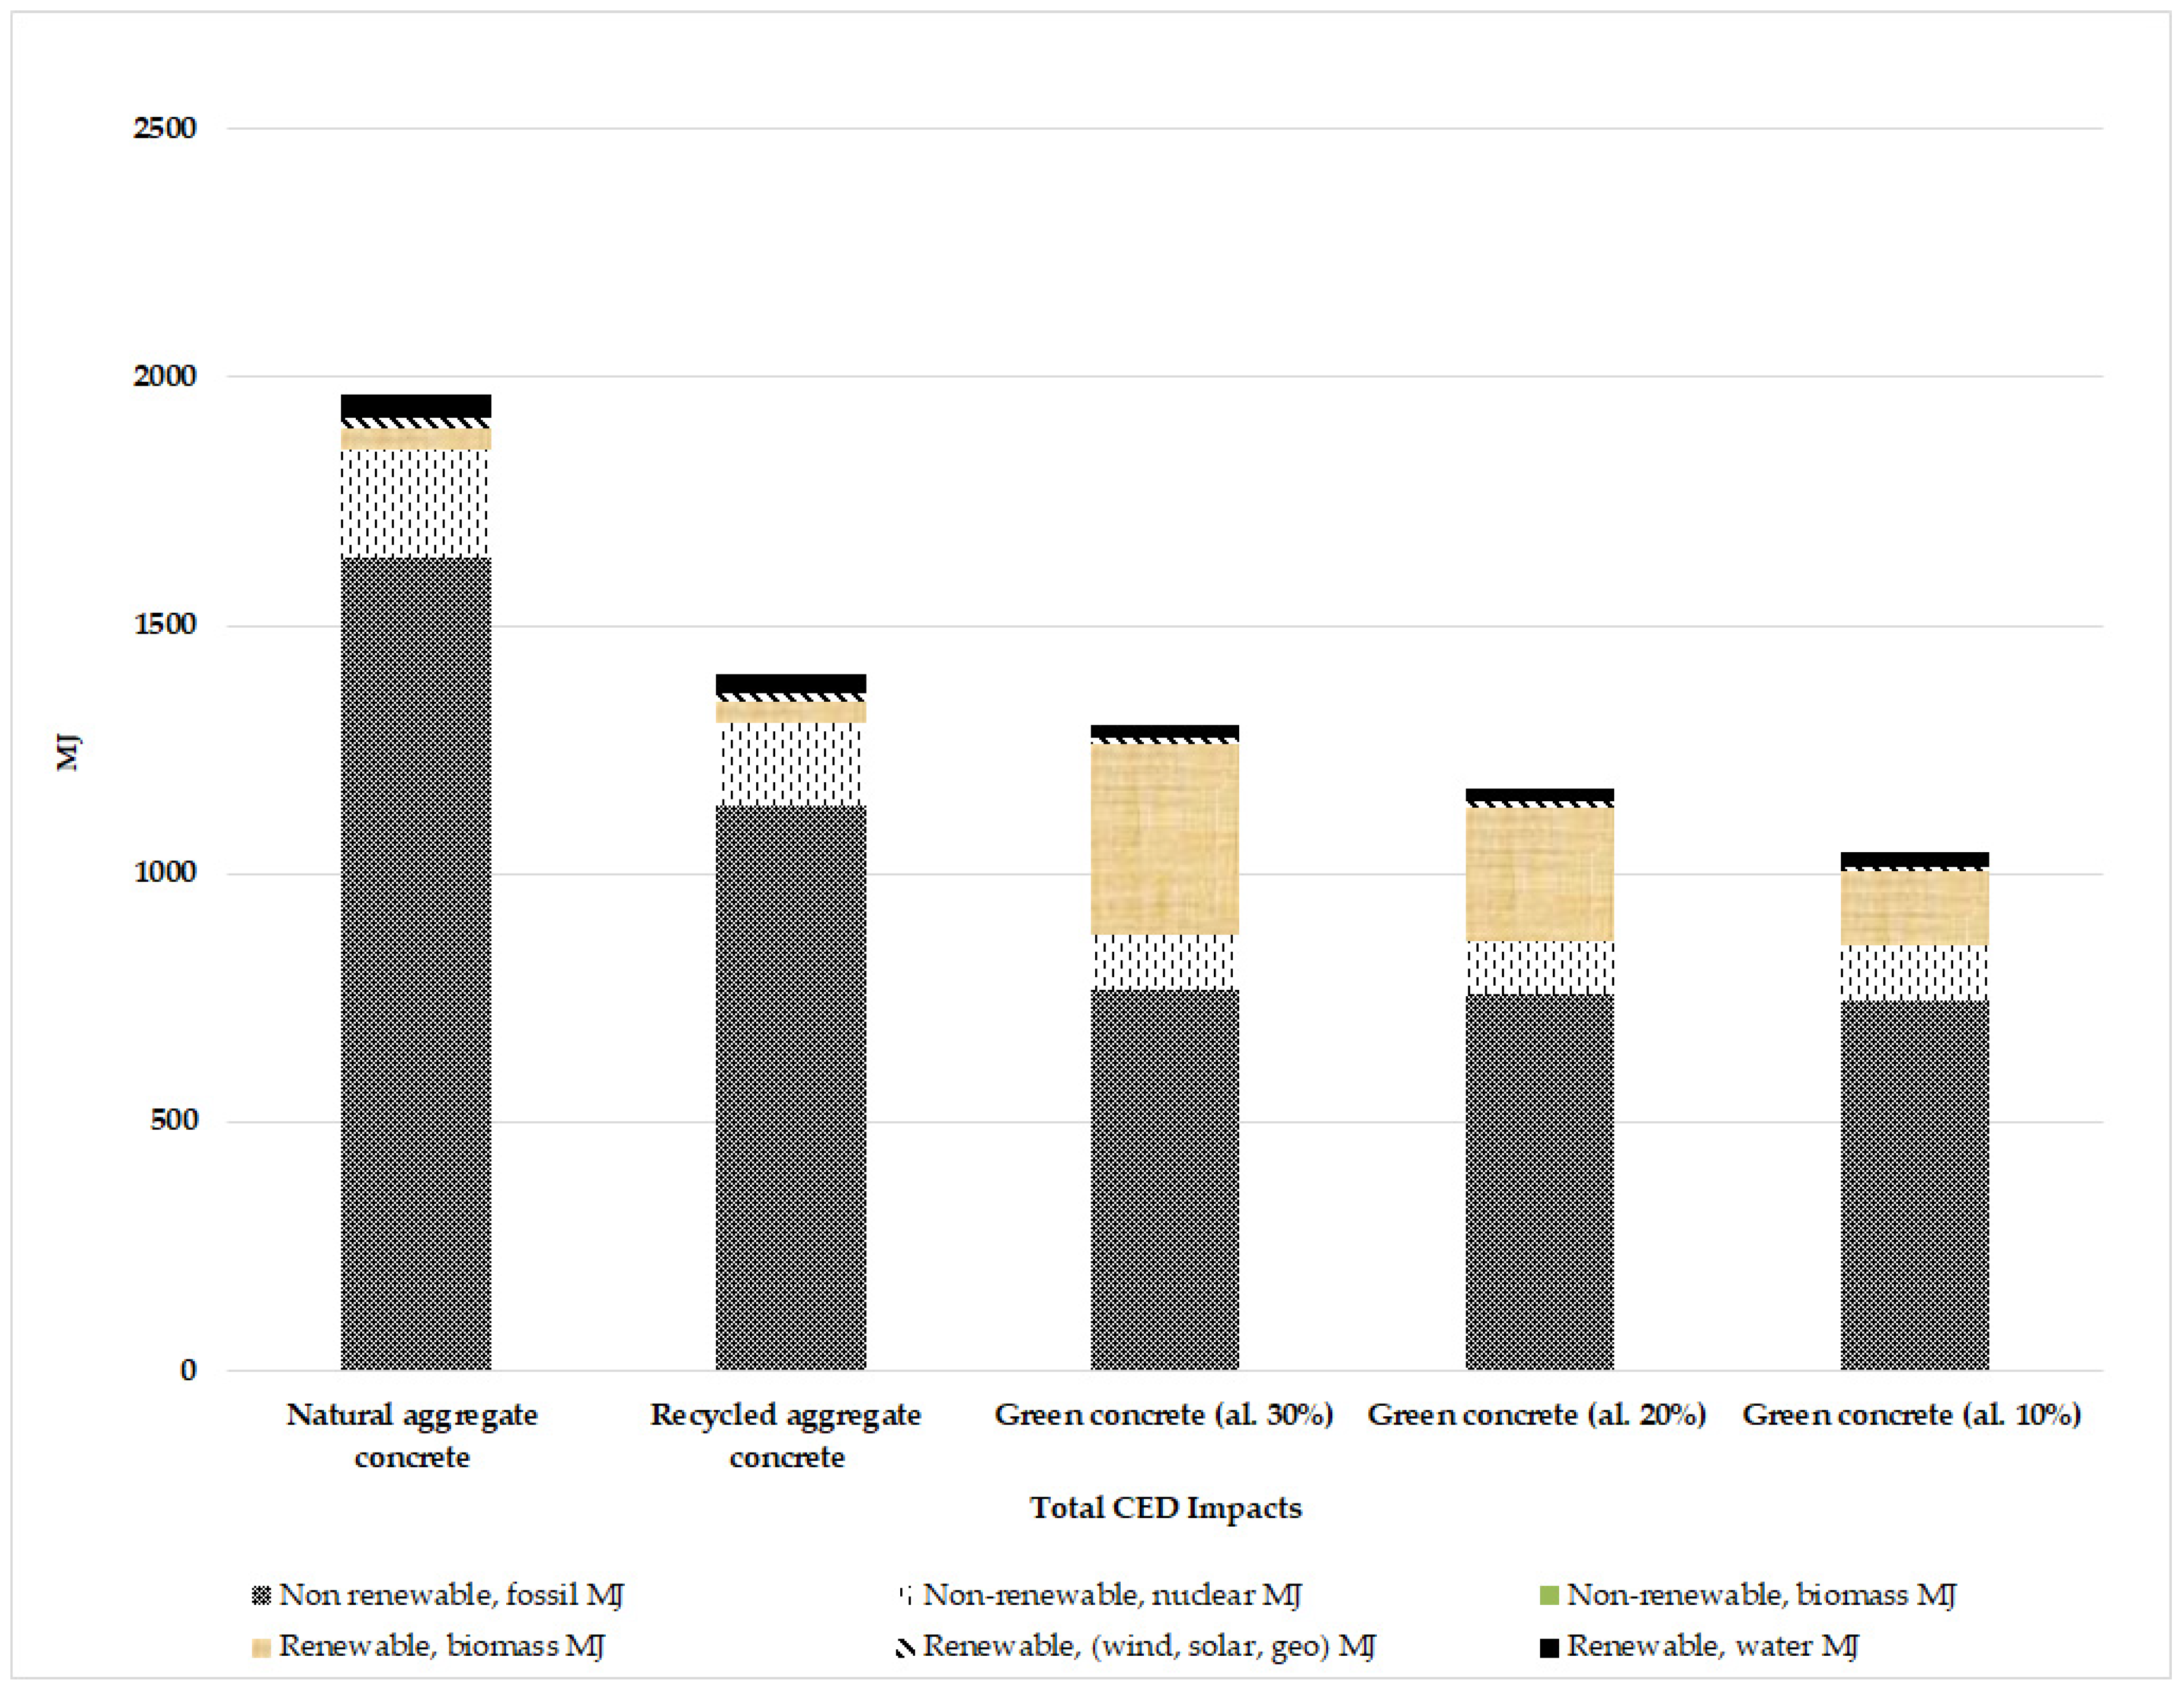
4.2. Comparison of Conventional, Recycled and Green Concrete Aggregates

After understanding the performances of the recycling plant in processing and treating 1 tonne of C&D waste, and the avoided extraction and mining of virgin construction materials, the next step considers expanding the analyses to the production of concrete to indicate (as an example) the end-use of recycled aggregates in Naples. A comparison of concrete produced from natural, recycled and green aggregates (using agro-industry by-products) is proposed and presented in Table 7 and Figure 8. All concrete production systems include raw materials production such as cement, additive, hemp production (in the case of green concrete) and water supply to produce 1 m3 of concrete as an output. Table 7 shows the energy costs to produce 1 m3 of concrete of different characteristics and production process. The first one, conventional concrete (made with natural aggregates), requires 1963.67 MJ of energy, out of which 1635.53 MJ is fossil sources, 217.51 MJ is nuclear source, 42.08 MJ is biomass source, 21.43 MJ from wind, solar and geothermal sources, and finally 46.62 MJ from hydro sources. The total is carried out vertically and provides the CED calculated by the LCA software. The second kind of concrete, from recycled aggregates, of course requires less energy (total: 1401.02 MJ) because the raw material is not primary mineral but recycled one and therefore there are no mining energy costs. The non-renewable demand is less, while the other typologies are more or less the same. Finally, the third typology (green concrete) is produced by means of agro-industrial hemp by-products. Its total demand is lower, depending on the allocation of the energy costs, and has a larger fraction of renewable energy demand from biomass compared to natural and recycled aggregate concretes. Concerning green concrete, a sensitivity test was performed by allocating by 30%, 20%, and 10%, independently on the choice of mass, energy or economic based allocation.
Table 7 and Figure 8 show that the total CED characterized impacts decrease from values for natural aggregates concrete down to lower values for green concretes, due to the replacement of the fossil energy component by means of different percentages of biomass source.

4.3. Discussion

The results of this LCA study show that the avoidance of landfilling (that in the waste hierarchy is the less preferable option for waste management) by means of the recycling of non-hazardous C&DW fractions into aggregates of different types and secondary materials (iron, steel and aluminium) has the potential of providing many energetic and environmental benefits contributing to reduce the dependence of the sector on fossil energy and associated environmental impacts. The performances of recycling scenarios can be further improved by reducing the share of fossil energy use in the recycling plants by means of electricity from renewable sources (e.g., the installation of PV panels) as found by previous studies [40].
The results agree with previous LCA studies that have analysed the environmental and energy impacts of entire C&DWM systems (national, regional or provincial) such as [24,30]. However, in [24], the avoided energy and environmental impacts of the recycling of C&DW are higher than the energy and environmental impacts of landfilling (for almost all impact categories), only in the best-case scenario. In the best-case scenario the authors [24] assumed that all the C&DW are sent to recycling; all the recycling plants are powered by electricity; transport distances have been reduced at the minimum value of their range with the exception of NAs selling distance that was unchanged; 90% of the produced RAs are considered of high quality and the related replacement coefficient has been maximized so it was set equal to 1 (10% of the produced RAs are still considered of low quality because of the presence of fine non-removable material in the C&DW [24]. The only category that performs worst in the best-case scenario compared to landfilling scenario is freshwater ecotoxicity. Other studies evaluating the recycling of C&DW compared to other options such as waste to energy and landfilling found that recycling is a better option compared to landfilling [27,74,75,76,77,78,79] even if it is dependent on the transport distances [25,36,80].
In the present study, the above benefits are definitely already achieved for iron, steel and aluminium that have well developed markets, whereas for RA, as evidenced in our previous research, the market is still underdeveloped, and the demand is low [48]. The primary data collected about the annual generation and recovery of non-hazardous C&DW evidence that they are almost recovered for the whole amount in the Metropolitan City of Naples, but their value is still underestimated both from an environmental and purely economic point of view due to the very low demand [63,81]. This is in contrast with previous studies where, e.g., the market price of NA is lower than the price of RA [82,83].
The next steps in our research will be to further improve the knowledge on the recycling stage in the Metropolitan City of Naples in order to rely on primary data about the recycling plants and related processes and products and their market. This would overcome one of the limits in this LCA study due to the reliance on secondary data from Ecoinvent database and previous LCA literature. Another limit is due to our assumption about the replacement ratio of RA with NA that we assumed to be 1:1 which is not currently the real case in the Metropolitan City of Naples due to the lack of confidence on RA.
Finally, the explorative analysis in this LCA study involving the comparison of alternative concrete blocks made of virgin materials, recycled aggregates and agri-food by-products from hemp crop show the potential of further improving the environmental sustainability of the construction sector by using alternative concretes. From our results, 1 m3 of green concrete made with hemp by-products requires an energy cost in terms of CED ranging from 1301.50 to 1042.07 MJ/m3 that is much lower than the energy cost of conventional concrete made of virgin materials (1963.67 MJ/m3). There is an increasing interest in Italy on construction products and materials made of agri-food by-products [64,84,85]. In this view it is worth highlighting that the available certified construction products in the Italian market made of hemp by-products are designed to be recyclable and biodegradable at the end-of-life [22,64,86,87], contributing to the opportunity of a better alignment of the construction sector to the principles of CE [88].

4.4. Policy Implications

The results of this study confirm the importance, in this initial phase of transition to CE, of the political support to favour the substitution of NA with RA whenever possible in non-structural applications so as to reduce the huge environmental impacts of NA. The political support in the creation of circular supply chains and networks is needed, to reduce the uncertainties and risks embedded in the use of circular products and in general of the adoption of the CE model. Currently, in the Metropolitan City of Naples, the main barrier to the use of RA is the lack of confidence by the designers or contractors [63].
It is important to underline that if the RA would be considered as perfect substitutes, the annual amount of generated C&DW, assuming their complete recycling, might even not be enough to cover the demand for aggregates for non-structural applications This is according to our calculation and previous research including interviews to stakeholders in the Metropolitan City of Naples [63]).
Hopefully, in the Metropolitan City and Campania Region, the current transition to the CE, also supported by the adoption of the Environmental Minimum Criteria decree [89,90], would be a driver for boosting the use and production of certified recyclable construction materials and products such as those bearing the “Remade in Italy” [91]. This latter certification scheme, in turn, will encourage the traceability and transparency of the life cycle of RA, further integrating the information provided by the CE marking and declaration of performance with those related to the environmental quality of the RA in terms of recycled content and Italian origin [91].
If the Environmental Minimum Criteria is extended beyond the public buildings, to cover private buildings, the effects could be much higher. Given the lack of confidence by the stakeholders of the sector on the use of RA, only within a strict legislative framework, their use could increase and progress.

5. Conclusions

This explorative LCA study aimed to evaluate the energy savings coming from the implementation of recycling scenarios for the different fractions of non-hazardous C&DW generated in the year 2017 in the Metropolitan City of Naples (Southern Italy). We also included the results of other environmental impact categories such as global warming, fossil resources scarcity and land use for a more complete environmental assessment. The main results are highlighted in the following:
The construction sector as the biggest consumer of natural resources, by means of the adoption of CE recycling scenarios (as showed in this LCA study), has the potential of contributing to tackling the current environmental challenges also caused by the fossil energy use for mining and manufacturing of construction materials;
The results show that prolonging the value of construction and demolition materials by means of their recycling has the potential of realizing environmental and energetic savings compared to the disposal in landfill in line with the waste hierarchy.
Recycling of C&DW into RA should be encouraged at the political level to favour their use. The political support should occur in an integrated framework along with the other CE strategies (e.g., reduce, reuse) throughout the waste hierarchy.
In a circular product design perspective, the recycling of C&DW into RA is an intended strategy and not an end-of-pipe solution, as it is still now, and then its adoption in the C&DW sector would be important for further progressing their recyclability including the quality of RA and increase the trust in their use.
The circular designer may also decide to replace the use of technical conventional materials with bio-based construction materials and this study can be also useful for that purpose as it shows how the energy and environmental performances of concrete change according to the feed stock materials (natural aggregates, recycled aggregates, hemp by-products).
Finally, the funding of research projects is essential for educating professionals that have the technical and knowledge skills on the CE model in order to be applied in the C&D sector and favour its technological renewal in line with the CE principles [92].

Author Contributions

Conceptualization, P.G., A.N. and S.U.; methodology, P.G., A.N. and S.U.; software, A.N.; data curation, P.G. and G.D.; writing—original draft preparation, P.G.; writing—review and editing, P.G., A.N., R.P. and S.U.; visualization, P.G.; supervision, R.P. and S.U.; project administration, R.P. and S.U.; funding acquisition, R.P. and S.U. All authors have read and agreed to the published version of the manuscript.

Funding

The research described in this paper received funding from the European Commission’s research programmes Horizon 2020-SC5-2020-2 scheme, Grant Agreement 101003491 (JUST Transition to the Circular Economy project) and Horizon 2020-Marie Sklodowska-Curie Actions-Innovative Training Networks-2018 programme (Grant Number: 814247) (Realizing the Transition to Circular Economy project); Patrizia Ghisellini and Sergio Ulgiati also gratefully acknowledge the China-Italy High Relevance Bilateral Project funded by the Ministry of Foreign Affairs and International Cooperation (MAECI), General Directorate for the Promotion of the Country System (Grant No. PGR05278).

Institutional Review Board Statement

Not applicable.

Informed Consent Statement

Not applicable.

Data Availability Statement

The data about the annual generation and management of C&DW in the Metropolitan City of Naples in the year 2017 were kindly provided by the Environmental Protection Agency of Campania Region. The authors greatly acknowledge the Agency for providing the data for this study.

Conflicts of Interest

The authors declare no conflict of interest. The funders had no role in the design of the study; in the collection, analyses, or interpretation of data; in the writing of the manuscript, or in the decision to publish the results.

Nomenclature

APOSAt Point of Substitution
C&DWConstruction and Demolition Waste
CECircular Economy
CEDCumulative energy demand
EUEuropean Union
GHGGreenhouse gas
IPCCIntergovernmental Panel on Climate Change
ISOInternational Organization for Standardization
LCALife Cycle Assessment
MJMegaJoules
NANatural aggregates
RARecyled aggregates
Non-renew.Non-renewable
Renew.Renewable
Renew. (w, solar, geo)Renewable (wind, solar, geothermal)
Total Av. CED impactsTotal avoided CED impacts

References

  1. European Commission, 2020. Communication from the Commission to the European Parliament, the Council, the European Economic and Social Committee and the Committee of the Regions. A new Circular Economy Action Plan for a Cleaner and More Competitive Europe, 2020; COM/2020/98 Final. Available online: https://eur-lex.europa.eu/legal-content/EN/TXT/?qid=1583933814386&uri=COM:2020:98:FIN (accessed on 8 November 2021).
  2. European Cement Association (Cembureau). Construction and Demolition Waste. Available online: https://www.cembureau.eu/policy-focus/sustainable-construction/construction-demolition-waste/ (accessed on 22 November 2021).
  3. Ritchie, H. Our World in Data. Sector by Sector: Where Do Global Greenhouse Gas Emissions Come From? Available online: https://ourworldindata.org/ghg-emissions-by-sector (accessed on 22 November 2021).
  4. Liu, Y.; Li, H.; Huang, S.; An, H.; Santagata, R.; Ulgiati, S. Environmental and economic-related impact assessment of iron and steel production. A call for shared responsibility in global trade. J. Clean. Prod. 2020, 269, 122239. [Google Scholar] [CrossRef]
  5. World Economic Forum. Can the Circular Economy Transform the World’s Number One Consumer of Raw Materials? Available online: https://www.weforum.org/agenda/2016/05/can-the-circular-economy-transform-the-world-s-number-one-consumer-of-raw-materials (accessed on 8 November 2021).
  6. Meglin, R.; Kytzia, S.; Habert, G. Regional circular economy of building materials: Environmental and economic assessment combining Material Flow Analysis, Input-Output Analysis and Life Cycle Assessment. J. Ind. Ecol. 2021, 1–15. [Google Scholar] [CrossRef]
  7. Ginga, C.P.; Ongpeng, J.M.C.; Daly, M.K.M.; Klarissa, M. Circular economy on construction and demolition waste: A literature review on material recovery and production. Materials 2020, 13, 2970. [Google Scholar] [CrossRef] [PubMed]
  8. Jain, S.; Singhal, S.; Pandey, S. Environmental life cycle assessment of construction and demolition waste recycling: A case of urban India. Resour. Conserv. Recycl. 2020, 155, 104642. [Google Scholar] [CrossRef]
  9. Ma, M.; Tam, V.W.Y.; Le, K.N.; Li, W. Challenges in current construction and demolition waste recycling: A China study. Waste Manag. 2020, 118, 610–625. [Google Scholar] [CrossRef] [PubMed]
  10. UNEP (United Nations Environment Programme). March 2014. Sand, Rarer Than One Thinks. Available online: https://wedocs.unep.org/bitstream/handle/20.500.11822/8665/GEAS_Mar2014_Sand_Mining.pdf?sequence=3&isAllowed=y (accessed on 27 October 2021).
  11. Brown, M.T.; Buranakarn, V. Emergy indices and ratios for sustainable material cycles and recycle options. Resour. Conserv. Recycl. 2003, 38, 1–22. [Google Scholar] [CrossRef]
  12. Pearce, D.W.; Turner, R.K. Economics of Natural Resources and the Environment, Italian ed.; Harvester Wheatsheaf: London, UK, 1991; Il Mulino: Bologna, Italy, 1991; pp. 1–362. [Google Scholar]
  13. Villagrán-Zaccardi, Y.A.; Marsh, A.T.M.; Sosa, M.E.; Zega, C.J.; De Belie, N.; Bernal, S.A. Complete re-utilization of waste concretes–Valorisation pathways and research needs. Resour. Conserv. Recycl. 2021, 177, 105955. [Google Scholar] [CrossRef]
  14. Gavriletea, M.D. Environmental Impacts of Sand Exploitation. Analysis of Sand Market. Sustainability 2017, 9, 1118. [Google Scholar] [CrossRef] [Green Version]
  15. Cochran, J.K.; Bokuniewicz, H.J.; Yager, P.L. Encyclopedia of Ocean Sciences, 3rd ed.; Academic Press: Cambridge, MA, USA, 2019; p. 4306. ISBN 978-0-12-813082-7. [Google Scholar]
  16. European Commission. Environmental Impacts along the Supply Chain. Available online: https://rmis.jrc.ec.europa.eu/?page=environmental-impacts-along-the-supply-chain-3dfccf (accessed on 22 January 2021).
  17. Ambrosini, C. Prevenire è Meglio Che Smaltire, Il Caso Dell’edilizia Italiana, Atlante dell’Economia Circolare. Available online: https://economiacircolare.com/prevenire-e-meglio-che-smaltire-il-caso-delledilizia-italiana/ (accessed on 28 October 2021).
  18. Quattrone, M.; Angulo, S.C.; John, V.M. Energy and CO2 from high performance recycled aggregate production. Resour. Conserv. Recycl. 2014, 90, 21–33. [Google Scholar] [CrossRef]
  19. Halkos, G.; Petrou, K.N. Analysing energy efficiency of EU Member States: The potential of energy recovery from waste in the circular economy. Energies 2019, 12, 3718. [Google Scholar] [CrossRef] [Green Version]
  20. Yu, Y.; Yazan, D.M.; Bhochhibhoya, S.; Volker, L. Towards Circular Economy through Industrial Symbiosis in the Dutch construction industry: A case of recycled concrete aggregates. J. Clean. Prod. 2021, 293, 126083. [Google Scholar] [CrossRef]
  21. Ambrosini, C. Ripensare L’edilizia Attraverso L’economia Circolare, Lo Studio Della Luiss, Atlante dell’Economia Circolare. Available online: https://economiacircolare.com/ripensare-ledilizia-attraverso-leconomia-circolare-lo-studio-della-luiss/ (accessed on 28 October 2021).
  22. Arrigoni, A.; Pelosato, R.; Melià, P.; Ruggieri, G.; Sabbadini, S.; Dotelli, G. Life cycle assessment of natural building materials: The role of carbonation, mixture components and transport in the environmental impacts of hempcrete blocks. J. Clean. Prod. 2017, 149, 1051–1061. [Google Scholar] [CrossRef]
  23. Farina, I.; Colangelo, F.; Petrillo, A.; Ferraro, A.; Moccia, I.; Cioffi, R. LCA of concrete with construction and demolition waste. In Advances in Construction and Demolition Waste Recycling: Management, Processing and Environmental Assessment; Pacheco-Torgal, F., Ding, Y., Colangelo, F., Tuladhar, R., Koutamanis, A., Eds.; Woodhead Publishing, Elsevier: Sawston, UK, 2020; pp. 520–594. [Google Scholar]
  24. Borghi, G.; Pantini, S.; Rigamonti, L. Life cycle assessment of non-hazardous Construction and Demolition Waste (CDW) management in Lombardy Region (Italy). J. Clean. Prod. 2018, 184, 815–825. [Google Scholar] [CrossRef]
  25. Bowea, M.D.; Powell, J.C. Developments in life cycle assessment applied to evaluate the environmental performance of construction and demolition wastes. Waste Manag. 2016, 50, 151–172. [Google Scholar]
  26. Penteado, C.S.G.; Rosado, L.P. Comparison of scenarios for the integrated management of construction and demolition waste by life cycle assessment: A case study in Brazil. Waste Manag. Res. 2016, 34, 1026–1035. [Google Scholar] [CrossRef] [PubMed]
  27. Vossberg, C.; Mason-Jones, K.; Cohen, B. An energetic life cycle assessment of C&D waste and container glass recycling in Cape Town, South Africa. Resour. Conserv. Recycl. 2014, 88, 39–49. [Google Scholar]
  28. Simion, I.M.; Fortuna, M.E.; Bonoli, A.; Gavrilescu, M. Comparing environmental impacts of natural inert and recycled construction and demolition waste processing using LCA. J. Environ. Eng. Landsc. Manag. 2013, 21, 273–287. [Google Scholar] [CrossRef]
  29. Yuan, H.P.; Shen, L.-Y.; Li, Q.-M. Emergy analysis of the recycling options for construction and demolition waste. Waste Manag. 2011, 31, 2503–2511. [Google Scholar] [CrossRef] [PubMed]
  30. Blengini, G.A.; Garbarino, E. Resources and waste management in Turin (Italy): The role of recycled aggregates in the sustainable supply mix. J. Clean. Prod. 2010, 18, 1021–1030. [Google Scholar] [CrossRef]
  31. Blengini, G.A. Life cycle of buildings, demolition and recycling potential: A case study in Turin, Italy. Build. Environ. 2009, 44, 319–330. [Google Scholar] [CrossRef]
  32. Garcia-Gonzalez, J.; Rodriguez-Robles, D.; De Belie, N.; Morán-del Pozo, J.M.; Guerra-Romero, M.I.; Juan-Valdés, A. Self-healing concrete with recycled aggregates. In Advances in Construction and Demolition Waste Recycling, Management, Processing and Environmental Assessment; Pacheco-Torgal, F., Ding, Y., Colangelo, F., Tuladhar, R., Koutamanis, A., Eds.; Woodhead Publishing, Elsevier: Sawston, UK, 2020; pp. 355–377. ISBN 978-0-12-819055-5. [Google Scholar]
  33. Tam, V.W.Y.; Soomro, M.; Evangelista, A.C.J. A review of recycled aggregate in concrete applications (2000–2017). Constr. Build. Mater. 2018, 172, 272–292. [Google Scholar] [CrossRef]
  34. United Nations. Department of Economic and Social Affairs, Sustainable Development. The 17 Goals. Available online: https://sdgs.un.org/goals (accessed on 23 November 2021).
  35. Hossain, M.U.; Ng, S.T.; Antwi-Afari, P.; Amor, B. Circular economy and the construction industry: Existing trends, challenges and prospective framework for sustainable construction. Renew. Sustain. Energy Rev. 2020, 130, 109948. [Google Scholar] [CrossRef]
  36. Colangelo, F.; Forcina, A.; Farina, I.; Petrillo, A. Life cycle assessment (LCA) of different kinds of concrete containing waste for sustainable construction. Buildings 2018, 8, 70. [Google Scholar] [CrossRef] [Green Version]
  37. Ghisellini, P.; Ripa, M.; Ulgiati, S. Exploring environmental and economic costs and benefits of a circular economy approach to the construction and demolition sector. A literature review. J. Clean. Prod. 2018, 178, 618–643. [Google Scholar] [CrossRef]
  38. Dahlbo, H.; Bachér, J.; Lähtinen, K.; Jouttijärvi, T.; Suoheimo, P.; Mattila, T.; Sironen, S.; Myllymaa, T.; Saramäki, K. Construction and demolition waste management e a holistic evaluation of environmental performance. J. Clean. Prod. 2015, 107, 333–341. [Google Scholar] [CrossRef]
  39. Iodice, S.; Garbarino, E.; Cerreta, M.; Tonini, D. Sustainability assessment of Construction and Demolition Waste management applied to an Italian case. Waste Manag. 2021, 128, 83–98. [Google Scholar] [CrossRef] [PubMed]
  40. Faleschini, F.; Zanini, M.A.; Pellegrino, C.; Pasinato, S. Sustainable managment and supply of natural and recycled aggregates in a medium-size integrated plant. Waste Manag. 2016, 49, 146–155. [Google Scholar] [CrossRef]
  41. Rosado, L.P.; Vitale, P.; Penteado, C.S.G. Life cycle assessment of natural and mixed recycled aggregate production in Brazil. J. Clean. Prod. 2017, 151, 634–642. [Google Scholar] [CrossRef]
  42. Pantini, S.; Rigamonti, L. Effectiveness and efficiency of construction and demolition waste in Lombardy: A life cycle based evaluation, 2019. In Proceedings of the 5th Conference on Final Sinks, Vienna, Austria, 8–11 December 2019; Available online: http://www.icfs2019.org/wp-content/uploads/2019/11/Se08-03_Rigamonti_Effectiveness-And-Efficiency-Of-Construction-And-Demolition-Waste-Recycling-In-Lombardy-A-Life-Cycle-Based-Evaluation.pdf (accessed on 5 November 2021).
  43. Yuan, H. A SWOT analysis of successful construction waste management. J. Clean. Prod. 2013, 39, 1–8. [Google Scholar] [CrossRef]
  44. ISO 14040:2006 Environmental Management—Life Cycle Assessment—Principles and Framework. Available online: https://www.iso.org/standard/37456.html (accessed on 5 August 2021).
  45. Metropolitan City of Naples, Tavole di Progetto (In Italian). Available online: https://www.cittametropolitana.na.it/tavole-di-progetto (accessed on 23 November 2021).
  46. Baldo, G.L.; Marino, M.; Rossi, S. Analisi del Ciclo di Vita LCA. Materiali, Prodotti, Processi; Edizioni Ambiente: Milano, Italy, 2005; pp. 1–289. [Google Scholar]
  47. Ciacci, L.; Passarini, F. Life cycle assessment (LCA) of environmental and energy systems. Energies 2020, 13, 5892. [Google Scholar] [CrossRef]
  48. Al-Khori, K.; Al-Ghami, S.G.; Boulfraud, S.; Koç, M. Life cycle assessment for integration of solid oxide fuel cells into gas processing operations. Energies 2021, 14, 1–19. [Google Scholar]
  49. Nastro, R.A.; Leccisi, E.; Tuscanesi, M.; Liu, G.; Trifuoggi, M.; Ulgiati, S. Exploring avoided environmental impacts as well as energy and recource recovery from micribial desalination cell treatment of brine. Energies 2021, 14, 1–16. [Google Scholar]
  50. Buyle, M.; Braet, J.; Audenaert, A. Life cycle assessment in the construction sector: A review. Renew. Sustain. Energy Rev. 2013, 26, 379–388. [Google Scholar] [CrossRef]
  51. Buyle, M.; Braet, J.; Audenaert, A. Life Cycle Assessment of an Apartment Building: Comparison of an Attributional and Consequential Approach. Energy Procedia 2014, 62, 132–140. [Google Scholar] [CrossRef] [Green Version]
  52. Cabeza, L.F.; Rincón, L.; Vilariño, V.; Pérez, G.; Castell, A. Life cycle assessment (LCA) and life cycle energy analysis (LCEA) of buildings and the building sector: A review. Renew. Sustain. Energy Rev. 2014, 29, 394–416. [Google Scholar] [CrossRef]
  53. Asdrubali, F.; Roncone, M.; Grazieschi, G. Embodied energy and embodied GWP of windows: A critical review. Energies 2021, 14, 1–17. [Google Scholar]
  54. Vilches, A.; Garcia-Martinez, A.; Sanchez-Montanes, B. Life cycle assessment (LCA) of building refurbishment: A literature review. Energy Build. 2017, 135, 286–301. [Google Scholar] [CrossRef]
  55. Vitale, P.; Arena, N.; Di Gregorio, F.; Arena, U. Life cycle assessment of the end of-life phase of a residential building. Waste Manag. 2017, 60, 311–321. [Google Scholar] [CrossRef]
  56. Thormark, C. Environmental analysis of a building with reused building materials. Int. J. Low Energy Sust. Build. 2000, 1, 1–18. [Google Scholar]
  57. Da Rocha, C.G.; Sattler, M.A. A discussion on the reuse of building components in Brazil: An analysis of major social, economical and legal factors. Resour. Conserv. Recycl. 2009, 54, 104–112. [Google Scholar] [CrossRef]
  58. Diyamandoglu, V.; Fortuna, L.M. Deconstruction of wood-framed houses: Material recovery and environmental impact. Resour. Conserv. Recycl. 2015, 100, 21–30. [Google Scholar] [CrossRef]
  59. Silva, R.V.; De Brito, J.; Dhir, R.K. Availability and processing of recycled aggregates within the construction and demolition supply chain: A review. J. Clean. Prod. 2017, 143, 598–614. [Google Scholar] [CrossRef] [Green Version]
  60. Huang, B.; Wang, X.; Kua, H.; Geng, Y.; Bleischwitz, R.; Ren, J. Construction and demolition waste management in China through the 3R principle. Resour. Conserv. Recycl. 2018, 129, 36–44. [Google Scholar] [CrossRef]
  61. Ekvall, T.; Assefa, G.; Björklund, A.; Eriksson, O.; Finnveden, G. What life cycle assessment does and does not do in assessments of waste management. Waste Manag. 2007, 27, 989–996. [Google Scholar] [CrossRef]
  62. Ghisellini, P.; Cristiano, S.; Santagata, R.; Gonella, F.; Dumontet, S.; Ulgiati, S. Report on the Construction and Demolition Waste Management and the Potential for Circular Options in the Metropolitan City of Naples. China-Italy Bilateral Project, Analysis on the Metabolic Process of Urban Agglomeration and the Cooperative Strategy of Circular Economy; Dipartimento di Scienze e Tecnologie, Università degli Studi Napoli “Parthenope”: Naples, Italy, 2019; Available online: http://www.urbancirculareconomy.it/wp-content/uploads/2019/09/Annex-7.pdf (accessed on 10 November 2021).
  63. Cristiano, S.; Ghisellini, P.; D’Ambrosio, G.; Xue, J.; Nesticò, A.; Gonella, F.; Ulgiati, S. Construction and demolition waste in the Metropolitan City of Naples, Italy: State of the art, circular design, and sustainable planning opportunities. J. Clean. Prod. 2021, 293, 125856. [Google Scholar] [CrossRef]
  64. Zampori, L.; Dotelli, G.; Vernelli, V. Life Cycle Assessment of Hemp Cultivation and Use of Hemp-Based Thermal Insulator Materials in Buildings. Environ. Sci. Technol. 2013, 47, 7413–7420. [Google Scholar] [CrossRef]
  65. Frischknecht, R.; Wyss, F.; Büsser Knöpfel, S.; Lützkendorf, T.; Balouktsi, M. Cumulative energy demand in LCA: The energy harvested approach. Int. J. Life Cycle Assess. 2015, 20, 957–969. [Google Scholar] [CrossRef]
  66. Puig, R.; Fullana-i-Palmer, P.; Baquero, G.; Riba, J.R.; Bala, A. A Cumulative Energy Demand indicator (CED), life cycle based, for industrial waste management decision making. Waste Manag. 2013, 33, 2789–2797. [Google Scholar] [CrossRef] [PubMed]
  67. Huijbregts, M.A.J.; Hellweg, S.; Frischknecht, R.; Hendriks, H.W.M.; Hungehbühler, K.; Hendriks, A.J. Cumulative energy demand as predictor for the environmental burden of commodity production. Environ. Sci. Technol. 2010, 44, 2189–2196. [Google Scholar] [CrossRef] [Green Version]
  68. National Institute for Public Health and the Environment. ReCiPe 2016 v1.1 A Harmonized Life Cycle Impact Assessment Method at Midpoint and Endpoint Level, Report I: Characterization; RIVM Report 2016-0104a; National Institute for Public Health and the Environment: Bilthoven, The Netherlands, 2016; Available online: https://pre-sustainability.com/legacy/download/Report_ReCiPe_2017.pdf (accessed on 6 December 2021).
  69. SimaPro. SimaPro, Version 9.1.1., Full Update Instruction. Available online: https://simapro.com/wp-content/uploads/2020/10/FullUpdateInstructionsToSimaPro911.pdf (accessed on 24 November 2021).
  70. Ecoinvent 3.8 Database. Available online: https://ecoinvent.org/the-ecoinvent-database/data-releases/ecoinvent-3-8/ (accessed on 24 November 2021).
  71. Knoeri, C.; Sany_e-Mengual, E.; Althaus, H.-J. Comparative LCA of recycled and conventional concrete for structural applications. Int. J. Life Cycle Assess. 2013, 18, 909–918. [Google Scholar] [CrossRef] [Green Version]
  72. Gargiulo, A.; Carvalho, M.L.; Girardi, P. Life cycle assessment of Italian Electricity Scenarios to 2030. Energies 2020, 13, 3852. [Google Scholar] [CrossRef]
  73. Cellura, M.; Cosenza, M.A.; Guarino, F.; Longo, S.; Mistretta, M. Life cycle assessment of electricty generation scenarios in Italy. In Life Cycle Assessment of Energy Systems and Sustainable Energies Technologies; Springer: Cham, Switzerland, 2018; pp. 3–15. [Google Scholar]
  74. Roussat, N.; Méhu, J.; Dujet, C. Indicators to assess the recovery of natural resources contained in demolition waste. Waste Manag. Res. 2009, 27, 159–166. [Google Scholar] [CrossRef]
  75. Dewulf, J.; Van der Vorst, G.; Versele, N.; Janssens, A.; Van Langenhove, H. Quantification of the impact of the end-of-life scenario on the overall resource consumption for a dwelling house. Resour. Conserv. Recycl. 2009, 53, 231–236. [Google Scholar] [CrossRef]
  76. Carpenter, A.; Jambeck, J.R.; Gardner, K.; Weitz, K. Life cycle assessment of end-of-life management options for construction and demolition debris. J. Ind. Ecol. 2012, 17, 396–406. [Google Scholar] [CrossRef]
  77. Kucukvar, M.; Egilmez, G.; Tatari, O. Evaluating environmental impacts of alternative construction waste management approaches using supply chainlinked life-cycle analysis. Waste Manag. Res. 2014, 32, 500–508. [Google Scholar] [CrossRef]
  78. Ortiz, O.; Pasqualino, J.C.; Castells, F. Environmental performance of construction waste: Comparing three scenarios from a case study in Catalonia, Spain. Waste Manag. 2010, 30, 646–654. [Google Scholar] [CrossRef]
  79. Ding, T.; Xiao, J.; Tam, V.W.Y. A closed-loop life cycle assessment of recycled aggregate concrete utilization in China. Waste Manag. 2016, 56, 367–375. [Google Scholar] [CrossRef]
  80. Ferronato, N.; Lizarazu, G.E.G.; Portillo, M.A.G.; Moresco, F.; Conti, F.; Torretta, V. Environmental assessment of construction and demolition waste recycling in Bolivia: Focus on transportation distances and selective collection rates. Waste Manag. Res. 2021, 1–13. [Google Scholar] [CrossRef] [PubMed]
  81. Giorgi, S.; Lavagna, M.; Campioli, A. Circular economy and regeneration of building stock in the Italian context: Policies, partnership and tools. IOP Conf. Ser. Earth Environ. Sci. 2019, 225, 012065. [Google Scholar] [CrossRef]
  82. Ghisellini, P.; Ulgiati, S. Economic assessment of circular patterns and business models for reuse and recycling of construction and demolition waste. In Advances in Construction and Demolition Waste Recycling: Management, Processing and Environmental Assessment; Pacheco-Torgal, F., Ding, Y., Colangelo, F., Tuladhar, R., Koutamanis, A., Eds.; Woodhead Publishing, Elsevier: Sawston, UK, 2020; pp. 31–50. ISBN 978-0-12-819055-5. [Google Scholar]
  83. Wijayasundara, M.; Mendis, P.; Crawford, R.H. Integrated assessment of the use of recycled concrete aggregate replacing natural aggregate in structural concrete. J. Clean. Prod. 2018, 174, 591–604. [Google Scholar] [CrossRef]
  84. Capucci, M.G.; Ruffini, V.; Barbieri, V.; Siligardi, C.; Ferrari, A.M. Life cycle assessment of a wall made with agro-concrete blocks with wheat husk. In Proceedings of the EM4SS’21–Engineered Materials for Sustainable Structures, Modena, Italy, 26–28 April 2021; p. 101. [Google Scholar]
  85. Annibaldi, V.; Cucchiella, F.; D’Adamo, I.; Gastaldi, M.; Rotilio, M. Recycled materials for circular economy in construction sector. A review. In Proceedings of the EM4SS’21–Engineered Materials for Sustainable Structures, Modena, Italy, 26–28 April 2021; p. 95. [Google Scholar]
  86. Ghisellini, P.; Passaro, R.; Ulgiati, S. The role of product certification in the transition towards the circular economy for construction sector. In Proceedings of the EM4SS’21–Engineered Materials for Sustainable Structures, Modena, Italy, 26–28 April 2021; p. 103. [Google Scholar]
  87. Legambiente, 2016. Rapporto dell’Osservatorio Recycle Legambiente, Cento Materiali per una Nuova Edilizia. Available online: https://www.legambiente.it/sites/default/files/docs/cento_materiali_rapporto_osservatorio_recycle.pdf (accessed on 5 November 2021).
  88. Equilibrium, Natural Beton (Italian Company and Product). Available online: https://www.equilibrium-bioedilizia.it/it/prodotto/natural-beton (accessed on 24 November 2021).
  89. Decree 56/2017 establishing “Minimal Criteria for the Design Services and Works for the Construction, Restoring, and Refurbishing of Public Buildings. (In Italian). Available online: https://www.mite.gov.it/sites/default/files/archivio/allegati/GPP/dlgs_19_04_2017_56.pdf (accessed on 24 November 2021).
  90. The Italian Decree October 2017 “Minimum Environmental Criteria for the Assignment of Design Services and Works for the New Construction, Renovation and Maintenance of Buildings and for the Management of Public Administration Sites”. (In Italian). Available online: https://www.mite.gov.it/sites/default/files/archivio/allegati/GPP/allegato_tec_CAMedilizia.pdf (accessed on 24 November 2021). (In Italian)
  91. ReMade in Italy. Frantoio Fondovalle (Italian Company). Available online: https://www.remadeinitaly.it/portfolio-tag/frantoio-fondovalle/ (accessed on 24 November 2021).
  92. Stahel, W.R. Circular Economy. Nature 2016, 531, 435–438. [Google Scholar] [CrossRef] [PubMed] [Green Version]
Figure 1. The location of the Metropolitan City of Naples (in Campania Region, Southern Italy). Adapted from [45]. Note: the small box in the Figure 1 depicts the main urban centres of the Metropolitan City of Naples with green circles. Naples is the most important city in the area and has the largest circle compared to the other towns.
Energies 14 08561 g001
Figure 2. Main fractions composing the amount of C&DW produced in the year 2017 in the Metropolitan City of Naples.
Energies 14 08561 g002
Figure 3. System boundaries of the LCA study.
Energies 14 08561 g003
Figure 4. Percentage values of induced CED impacts associated to collection and recycling of 1 tonne of C&DW (from Table 3). Note: Renewable category comprises wind, solar and geothermal (wind, solar, geo).
Energies 14 08561 g004
Figure 5. Percentage values of avoided CED impacts associated to the collection and recycling of 1 tonne of C&DW.
Energies 14 08561 g005
Figure 6. Percentage values of environmental induced impacts coming from the collection and recycling of 1 tonne of C&DW (from Table 5).
Energies 14 08561 g006
Figure 7. Percentage values of environmental avoided impacts in the life cycle of 1 tonne of C&DW.
Energies 14 08561 g007
Figure 8. Comparison of CED characterized impacts for the different concrete types: conventional (with natural aggregates) and alternatives (with recycled aggregates and hemp by-products with different allocation percentages).
Energies 14 08561 g008
Table 1. Inventory data for 1 tonne of C&DW collected and recycled in the Metropolitan City of Naples.
1ProcessesAmountUnitCED (MJ)
Collection and recycling of C&D waste (functional unit)1tonne
Avoided landfilling
Inert waste (Europe without Switzerland) | landfill (Ecoinvent 3.8) 1tonne
Materials/fuels (Input)
Diesel, low sulphur0.68kg38.58
Ferromanganese, high-coal, 74.5% Mn (GLO)| market for | APOS, S0.02kg0.44
Transport, freight, lorry >32 metric ton, EURO5 (RER)| market for transport, freight, lorry >32 metric ton, EURO5 | APOS, S30tkm45.52
Water3.7kg0.03
Lubricating oil (RER) | market for lubricating oil | APOS, S0.001kg0.07
Synthetic rubber (GLO) | market for | APOS, S0.0043kg0.38
Electricity, medium voltage (IT)| market for | APOS, S1.13kWh11.58
Total CED 96.59
Outputs
Recycled aggregates Type A66.9kg
Recycled aggregates Type B336.28kg
Recycled aggregates Type C504.52kg
Recycled Iron and Steel 70.3kg
Recycled aluminium 22.10kg
2Potentially avoided landfilling and mining and production of virgin construction material1tonne
Avoided landfilling of inert material 1tonne
Avoided steel production70.3kg
Avoided aluminium production22.1kg
Avoided production of other virgin construction materials504.42kg
Avoided extraction of gravel336.28kg
Concrete production 66.9kg
Table 2. Inventory data for the production of conventional concrete and the alternative options made of recycled aggregates and hemp by-products.
Input and Output AmountUnits
Concrete from natural aggregates *1m3
Materials/fuels (input) *
Cement, Portland (Europe without Switzerland) | market for | APOS, S300kg
Gravel, crushed (RoW) | market for gravel, crushed | APOS, S1890kg
Water, deionized (Europe without Switzerland) | market for water, deionized | APOS, S105kg
Adhesive mortar (GLO) | market for | APOS, S3.3kg
Transport, freight, lorry 7.5–16 metric ton, EURO5 (RER)| market for transport, freight, lorry 7.5-16 metric ton, EURO5 | APOS, S50tkm
Concrete from recycled aggregates *1m3
Materials/fuels (input) *
Cement, Portland (Europe without Switzerland) | market for | APOS, S320kg
Water, deionized (Europe without Switzerland) | market for water, deionized | APOS, S130kg
Concrete mixing factory (CH) | construction | APOS, S4.57 × 10−7p
Lubricating oil (GLO) | market for | APOS, S1.19 × 10−2kg
Steel, low-alloyed, hot rolled (GLO) | market for | APOS, S2.38 × 10−2kg
Synthetic rubber (GLO) | market for | APOS, S7.13 × 10−3kg
Electricity/heat
Electricity, medium voltage (IT)| market for | APOS, S4.36kWh
Heat, district or industrial, natural gas (RER)| market group for | APOS, S1.04MJ
Recycled aggregates1890kg
Green concrete from Agri-industry (Hemp by-products) aggregates 1m3
Materials/fuels (Input) (**) and (*)
Water, deionized (Europe without Switzerland) | market for water, deionized | APOS, S130kg
Concrete mixing factory (CH)| construction | APOS, S4.57 × 10−7p
Lubricating oil (GLO)| market for | APOS, S1.19 × 10−2kg
Steel, low-alloyed, hot rolled (GLO) | market for | APOS, S2.38 × 10−2kg
Synthetic rubber (GLO) | market for | APOS, S7.13 × 10−3kg
Sun hemp plant, harvested (GLO) | market for sun hemp plant, harvested | APOS, S1570kg
Cement, pozzolana and fly ash 36–55% (Europe without Switzerland) | market for cement, pozzolana and fly ash 36–55% | APOS, S (*)320kg
(*) [71]; (**) [22].
Table 3. Characterized induced CED impacts associated with the collection and recycling of 1 tonne of C&DW.
CED Impact CategoriesUnitTransportFerromang.WaterLubricat. OilDieselSynthetic RubberElectricityTotal CED
Non-renew. FossilMJ44.130.250.020.0638.340.348.1791.31
Non-renew. NuclearMJ0.820.050.010.000.140.021.262.29
Non-renew. BiomassMJ0.000.000.000.000.000.000.000.00
Renew. BiomassMJ0.170.010.000.000.030.010.500.72
Renew. (w. Solar, geo.)MJ0.080.010.000.000.010.000.560.66
Renew. WaterMJ0.310.130.000.000.050.011.101.61
Total induced CED impacts MJ45.520.440.030.0738.580.3811.5896.59
Note: Renew. (w. solar, geo), renewables (wind, solar, geothermal).
Table 4. Avoided versus induced characterized CED impacts associated to the collection and recycling of 1 tonne of C&DW.
CED IMPACT CategoriesUnitAvoided Inert LandfillAvoided Concrete Avoided Gravel CrushingAvoided Steel Avoided Other Virgin MaterialsAvoided Aluminium Total Avoided CED ImpactsTotal Induced CED Impacts Net Energy Savings
Non-renew. FossilMJ−37.19−85.88−54.46−1095.94−102.23−214.01−1589.7191.31−1498.40
Non-renew. NuclearMJ−0.32−4.06−2.59−38.26−16.10−6.57−67.892.29−65.60
Non-renew. BiomassMJ0.00−0.020.00−0.05−0.010.00−0.090.00−0.09
Renew. BiomassMJ−0.33−3.73−0.55−14.90−1.76−1.86−23.120.72−22.40
Renew. (w, Solar, geo)MJ−0.04−0.43−0.29−4.56−1.48−0.78−7.590.66−6.92
Renew. WaterMJ−0.17−2.06−1.13−27.42−3.58−2.81−37.171.61−35.56
Total Av. CED impacts MJ−38.05−96.18−59.03−1181.13−125.15−226.03−1725.5896.59−1628.98
Notes: Non-renew. (non-renewable); Renew. (renewable); Renew. (w, sol, geo), renewable (wind, solar, geothermal). Total Av. CED Impacts (total avoided CED impacts).
Table 5. LCA induced environmental characterized impacts associated to the collection and recycling of 1 tonne of C&DW.
Impact CategoriesUnitTransportWaterDieselLubric. OilSynthetic RubberFerromang.ElectricityTotal ind. env. imp.
Global Warmingkg CO2 eq.2.730.000.390.000.010.020.593.74
Ozone Formation kg NOx eq.0.010.000.000.000.000.000.000.01
Fine Partic. Matter kg PM2.5 eq.0.000.000.000.000.000.000.000.01
Terrestrial Acidific.kg SO2 eq.0.010.000.000.000.000.000.000.01
Freshwater Eutroph.kg P eq.0.000.000.000.000.000.000.000.00
Human carc. Toxicitykg 1,4-DCB0.050.000.010.000.000.610.010.68
Land Usem2a crop eq.0.360.000.020.000.050.010.220.65
Miner. Resour. Scarc.kg Cu eq.0.010.000.000.000.000.000.000.01
Fossil Resour. Scarc.kg oil eq.0.960.000.840.000.010.010.181.99
Water Consumptionm30.010.000.000.000.000.000.010.02
Table 6. Environmental avoided characterized impacts in the life cycle of 1 tonne of C&DW.
Impact CategoriesUnitAvoided Inert LandfillAvoided Concrete Avoided Gravel CrushingAvoided Steel Avoided Other v. MaterialsAvoided Aluminium Total Av. env. ImpactsNet Environ. Impacts
Global Warmingkg CO2 eq.−2.56−10.60−3.91−145.29−7.75−14.75−184.87−181.13
Ozone Formationkg NOx eq.−0.03−0.03−0.02−0.31−0.04−0.09−0.53−0.52
Fine Partic. Matterkg PM2.5 eq.−0.01−0.01−0.01−0.23−0.02−0.03−0.30−0.30
Terrestrial Acidific.kg SO2 eq.−0.01−0.03−0.02−0.37−0.04−0.06−0.52−0.51
Freshwater Eutroph.kg P eq.0.000.000.00−0.050.000.00−0.06−0.06
Human carc. Toxicitykg 1,4-DCB−0.05−0.47−0.18−21.01−0.54−0.35−22.59−21.90
Land Usem2a crop eq.−0.49−2.55−0.62−23.47−1.54−2.00−30.67−30.01
Miner. Resour. Scarc.kg Cu eq.0.00−0.11−0.02−5.51−0.07−0.99−6.71−6.70
Fossil Resour. Scarc.kg oil eq.−0.81−1.87−1.19−23.77−2.23−4.68−34.55−32.56
Water Consumptionm30.00−0.09−0.48−0.92−0.20−0.04−1.74−1.72
Table 7. Energy characterized CED impacts for production of 1 m3 of conventional, recycled and green concretes aggregates.
Impact CategoriesUnitNatural agg. ConcreteRecycled agg. ConcreteGreen Concrete *** Green Concrete **Green Concrete *
Non-renewable, FossilMJ1635.531138.80766.92757.02747.12
Non-renewable, NuclearMJ217.51165.94110.06109.62109.18
Non-renewable, BiomassMJ0.500.520.370.350.33
Renewable, BiomassMJ42.0840.75385.46266.35147.25
Renewable, (Wind, Solar, geo)MJ21.4318.0112.3812.3312.27
Renewable, WaterMJ46.6237.0026.3126.1225.93
Total CED impactsMJ1963.671401.021301.501171.781042.07
*** Green concrete made of hemp by-products (allocation to hemp by-products 30%); ** green concrete made of hemp by-products (allocation to hemp by-products 20%); * green concrete made of hemp by-products (allocation to hemp by-products 10%).
Publisher’s Note: MDPI stays neutral with regard to jurisdictional claims in published maps and institutional affiliations.

