Article

Artificial Neural Network Model Prediction of Bitumen/Light Oil Mixture Viscosity under Reservoir Temperature and Pressure Conditions as a Superior Alternative to Empirical Models

1
Resources Production and Safety Engineering Laboratory, Department of Earth Resources Engineering, Kyushu University, Fukuoka 819-0935, Japan
2
Faculty of Geology and Petroleum Engineering, Ho Chi Minh City University of Technology, VNU-HCMC, Ho Chi Minh City 70000, Vietnam
3
Department of Petroleum Engineering, College of Petroleum and Geosciences, King Fahd University of Minerals & Petroleum, Dhahran 3225, Saudi Arabia
*
Author to whom correspondence should be addressed.
Energies 2021, 14(24), 8520; https://doi.org/10.3390/en14248520
Submission received: 9 November 2021 / Revised: 8 December 2021 / Accepted: 9 December 2021 / Published: 17 December 2021
(This article belongs to the Topic Enhanced Oil Recovery Technologies)

Abstract

:
Herein, we show the prediction of the viscosity of a binary mixture of bitumen and light oil using a feedforward neural network with backpropagation model, as compared to empirical models such as the reworked van der Wijk model (RVDM), modified van der Wijk model (MVDM), and Al-Besharah. The accuracy of the ANN was based on all of the samples, while that of the empirical models was analyzed based on experimental results obtained from rheological studies of three binary mixtures of light oil (API 32°) and bitumen (API 7.39°). The classical Mehrotra–Svrcek model to predict the viscosity of bitumen under temperature and pressure, which estimated bitumen results with an %AAD of 3.86, was used along with either the RVDM or the MVDM to estimate the viscosity of the bitumen and light oil under reservoir temperature and pressure conditions. When both the experimental and literature data were used for comparison to an artificial neural network (ANN) model, the MVDM, RVDM and Al-Besharah had higher R2 values.

Graphical Abstract

1. Introduction

Bitumen has become extremely vital, since conventional oil resources are currently being depleted, yet the former is still abundant [1]. The recovery of these vast resources usually involves the injection of solvents [2], the use of diluents [3,4,5,6] or heat in the form of steam [7,8,9,10]. All of these methods aim at lowering the viscosity of the stranded crude oil. The literature reports that the recovery of bitumen by dilution with light oils can be economical, as it provides the possibility to retrieve the blended light oils via well-known fractionation processes, and also to use the recovered bitumen [11]. However, the use of this approach requires a good understanding of the rheology of the resulting oil blend [12,13].
Several models have been proposed to predict the viscosity of crude oils, including both light oils and their binary or tertiary mixtures with solvents [14]. These include theory-based models, e.g., corresponding states model [15], friction theory [16,17], and free-volume theory [18]; however, these models are not applied practically. The empirical correlations and mixing rules are more commonly used [19,20,21,22,23]. Furthermore, at reservoir temperature conditions, the complex composition of bitumen complicates the accurate prediction of the viscosity of blended oil [22]. As such, we believe that simple mixing rules should be used [11,21].
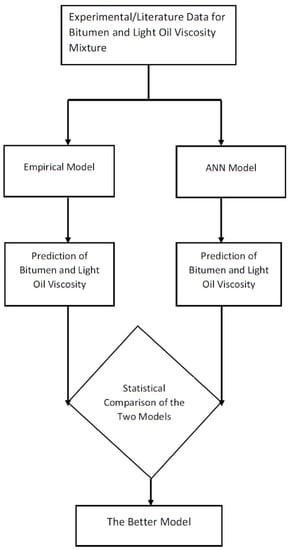
We previously proposed two models—the reworked van der Wijk model (RVDM), and the modified van der Wijk model (MVDM)—with both used in tandem with the Mehrotra–Svrcek model to accurately predict the viscosity of diluted bitumen under reservoir conditions [23]. The two models were accurate in predicting the viscosity of heavy oil diluted with light oil using literature data. The major drawback associated with the RVDM was finding coefficient values for every new mixture (highly unstable). We therefore proposed the use of artificial neural networks (ANNs) as an alternative to the RVDM, under the same reservoir conditions and using a similar number of data points.
ANNs are some of the most useful machine learning tools in deep learning, used as universal function approximators [24]. They are able to improve the accuracy of predicted values by simply changing the network structure or hyperparameters, and in some cases by adding more data. The empirical models that they are compared to in this study, on the other hand, cannot be changed after they have been developed. ANNs also have very large degrees of freedom for fitting parameters and, thus, capture the systems’ nonlinearity better than regression models. They can learn any nonlinear function by mimicking the biological neural network behavior between inputs and outputs [25,26,27]. Machine learning—particularly ANNs—has been widely used in solving many problems in the petroleum industry [27,28,29,30,31,32,33,34,35,36]. For example, Ref. [37] used machine learning to propose proxy models for optimizing a water-alternating-gas (WAG) process in a real geological field [37]. The same has been applied in proposing advanced data-driven methods for modeling the solubility of hydrogen sulfide in ionic liquids [38,39] developed many machine learning models—such as multilayer perceptrons, radial basis function neural networks, and least-squares support-vector machines—which were combined with a committee machine with intelligence systems to achieve a more accurate predictive model for the relative thermal conductivity of nanofluids using 3200 experimental points. Ref. [40] also demonstrated the application of multiple time-dependent artificial neural networks as a dynamic proxy to the optimization of a WAG process in a synthetic field [40].
Ref. [29] presented an ANN model to predict the viscosity of crude oil. However, the model was limited to single-component heavy oil [24,29] reported a study that involved the prediction of the viscosity of heavy oils as well as of their mixtures with solvents under formation conditions [24]. To construct their model, they used only very large datasets, and also represented the viscosity input into the ANN model as a natural log, and mostly used the power-law representation of the heavy oil–solvent mixtures. These two studies also did not involve any analysis of which of the input parameters most influences the final predicted viscosity value using the ANN.
To the best of our knowledge, none of the available literature uses as small a dataset as ours [11] in predicting the viscosity of bitumen, light oil, and their binary mixtures using ANNs. A comparison was conducted to determine which approach was better between the empirical and machine learning approaches. We also introduced the use of ANNs to solve the coefficient problem associated with the RVDM model, since ANNs can also be saved and loaded whenever datasets of similar properties and within a similar range are to be used to make viscosity predictions.
The remainder of this work is organized as follows: Section 2 presents the materials and methods, and Section 3 details the theory. Section 4 presents the results and discussion. Finally, Section 5 summarizes the major findings of this study. Furthermore, the meanings of all the terms in the equations used in this study have been provided in the Appendix A.

2. Materials and Methods

2.1. Experimental Section

2.1.1. Mixing of the Crude Oils

Five different oil samples were used in the experimental work. Bitumen of API 7.39° and specific density 1.0188 was mixed with light oil of API 32° and specific density of 0.866 to produce three different binary mixtures. For each specific mixture, given amounts (wt. %) of bitumen and light oil were accurately weighed and poured into a 200 mL glass flask. The blend was then homogenized using a homogenizer (Model AHG 160A). The mixture was further filtered through a pre-weighed filter paper (0.32 µm). This step was intended for removing any aggregate formed due to mixing. The properties of the crude oil and those of the mixtures are outlined in Table 1.

2.1.2. Preparation of Viscosity Datasets

The viscosities of the light oil, bitumen, and their respective mixtures were obtained experimentally using an equipment setup schematized in Figure 1.
The crude oil viscosity was measured at varying temperatures and pressures using a high-pressure and -temperature Cambridge Viscosity Viscopro2000 viscometer (Model P300617), which can measure viscosity in the range of 0.2 to 20,000 mPa.s, and up to a temperature and pressure of 190 °C and 7 MPa, respectively.
The viscometer was calibrated using standard solutions whose viscosity ranges were bigger than for any of the crude oil samples used. Then, 8 mL of bitumen (or bitumen blended with light oil) was poured into the sample container and pushed to the sensor. The temperature was controlled with the aid of an air bath, as shown in the schematic. The temperature in the chamber was monitored using a platinum resistance temperature detector (RTD). This equipment was operated in a range of temperatures between 40 and 120 °C, and in a pressure range from atmospheric to 6 MPa.
Nitrogen gas was transferred from a gas cylinder to a holding cell within the air bath in order to cater for changes in pressure due to temperature. The gas in that cell was injected at a desired pressure into the high-pressure cell connected to the viscometer under temperature controlled by a thermostat on the air bath. A command to display the measured viscosity from the computer processing unit that was linked to the viscometer’s output device through the terminal connection helped to obtain the measured data.

3. Theory

3.1. Models

3.1.1. ANN Model

Fine-Tuning of the ANN Model

Although most ANN models are trained using large datasets, this is not always practical in the field, because obtaining such data is quite difficult and expensive. In this work, we used only 125 experimentally obtained data points, and the ANN model was fine-tuned by modification of its hyperparameters, such as by increasing the number of nodes of the hidden layers and increasing the number of epochs in the code. The multilayer perceptron network structure used two hidden layers due to increased complexity (few data points were used). When the nodes for the two hidden layers increased from (10, 10) to (100, 100) for the experimental dataset, the R2 increased from 0.8793 to 0.9995 when testing was done. In addition, the choice of those parameters was also important. For the optimizer we used ‘Adam’, and the activation function as ‘ReLU’ in addition to employing early stopping.

Description of the ANN Model

The feedforward neural network with backpropagation model used in this study was made in Python using Spyder IDE and the Keras library by considering four inputs of pressure, temperature, light oil mass fraction, and bitumen mass fraction (Figure 2).
This ANN model takes a vector of input features such as X1, X2,… Xn, and each is multiplied by a specific weight, w1, w2,…,wn. The weight inputs are summed together, and a constant value called bias (b) is added to them to produce the net input of the neuron:
Z = i = 1 n X i w i + b
The net input is then passed through an activation function (g) to produce the output a = g(Z), which is then transmitted to the other neurons [41]:
a = g ( Z ) = g ( i = 1 n X i w i + b )
Many activation functions are normally used, such as ReLU, logsig, sinusoid, tansig, and arctan [42]. Having employed an MLP with a regular backpropagation that uses the gradient descent step strategy, apart from the logistic, the two other popular activation functions that can be applied are the hyperbolic tangent function ( t a n h   ( z ) = 2 σ ( 2 Z ) 1 ) and the ‘ReLU’ function (Y = max(0, X)).
In this study, the latter—which is fast to compute and has no maximum output value—was found to be the most suitable after some heuristics were performed.

Neuron

The output or activation of the neuron takes the form:
a = g(Z) = g(wTX + b),
The data for this model were imported using the Pandas library and the train_test_split command run using the sklearn library. The same library was used to define and compile the model with the ReLU activation function and using the Adam optimizer.
We also used early stopping in the model to stop it before overfitting in case such a scenario arose; this was done with the aid of considerable patience according to the number of epochs. In this ANN model, metrics such as the absolute percentage deviation of error (%AAD), root-mean-square error (RMSE), and coefficient of determination (R2) were obtained using the sklearn machine learning tool. For the ANN model, the statistical results for the experimental data were summarized according to the combined value, shown as the norm, and the training and testing results, which were both divided into the training subset of ~80% and 20% for the testing subset. In addition, data normalization was carried out by scaling the data between 0.1 and 0.9.

3.1.2. Empirical Viscosity Models

Mehrotra–Svrcek Model

Mehrotra–Svrcek [23] correlation (Equation (1)), originally developed for Athabasca and Cold Lake bitumen, was used to predict the bitumen viscosity under reservoir conditions.
Inln(μ) = c1 + c2lnT + c3lnP

Models Chosen for Comparison to the ANN Model

The modified van der Wijk model (MVDM) and reworked van der Wijk model (RVDM), which are based on consideration of intermolecular interactions between the different fluid components, were considered. These models employ the use of the bitumen predicted by Equation (4) under reservoir temperature and pressure.
RVDM:
lnμ = a1 + a2XB2lnμB + a3XB2lnμL + a4XB(μL + μB) + a5lnμL2XL−1
MVDM:
lnμ = a1 + a2XB2lnμB + a3XB2lnμL + a4XB(μL + μB) + a5lnμL2XL−1 + a6XBXLln(XBμB + XLμL)
In addition, the comparison was also extended to the Al-Besharah model by making use of the experimental data reported by its authors [14].

3.2. Statistical Error Analysis

The accuracy of the empirical models as well as that of the ANN was evaluated using the statistical parameters %AAD, RMSE, and R2, expressed in Equations (7)–(9), respectively.
The arithmetic average of the absolute values of the relative errors (%AAD) is an indication of the accuracy of the model.
% A A D = 100 N d i = 1 N d | μ exp μ c a l μ exp |
A low value of %AAD shows better correlation and lower error for the predicted values of viscosity.
RMSE is a measure of similar performance as that indicated by the %AAD.
R M S E = 1 N d i = 1 ( μ exp μ c a l ) 2
The coefficient of determination (R2) is a measure of the precision of the fit of the data.
R 2 = 1 i = 1 N d ( μ exp μ c a l ) 2 i = 1 N d ( μ exp μ c a l ) 2
The maximum value of the R2 is unity, and a high value indicates a high degree of agreement between the experimental and predicted viscosity.

4. Results and Discussion

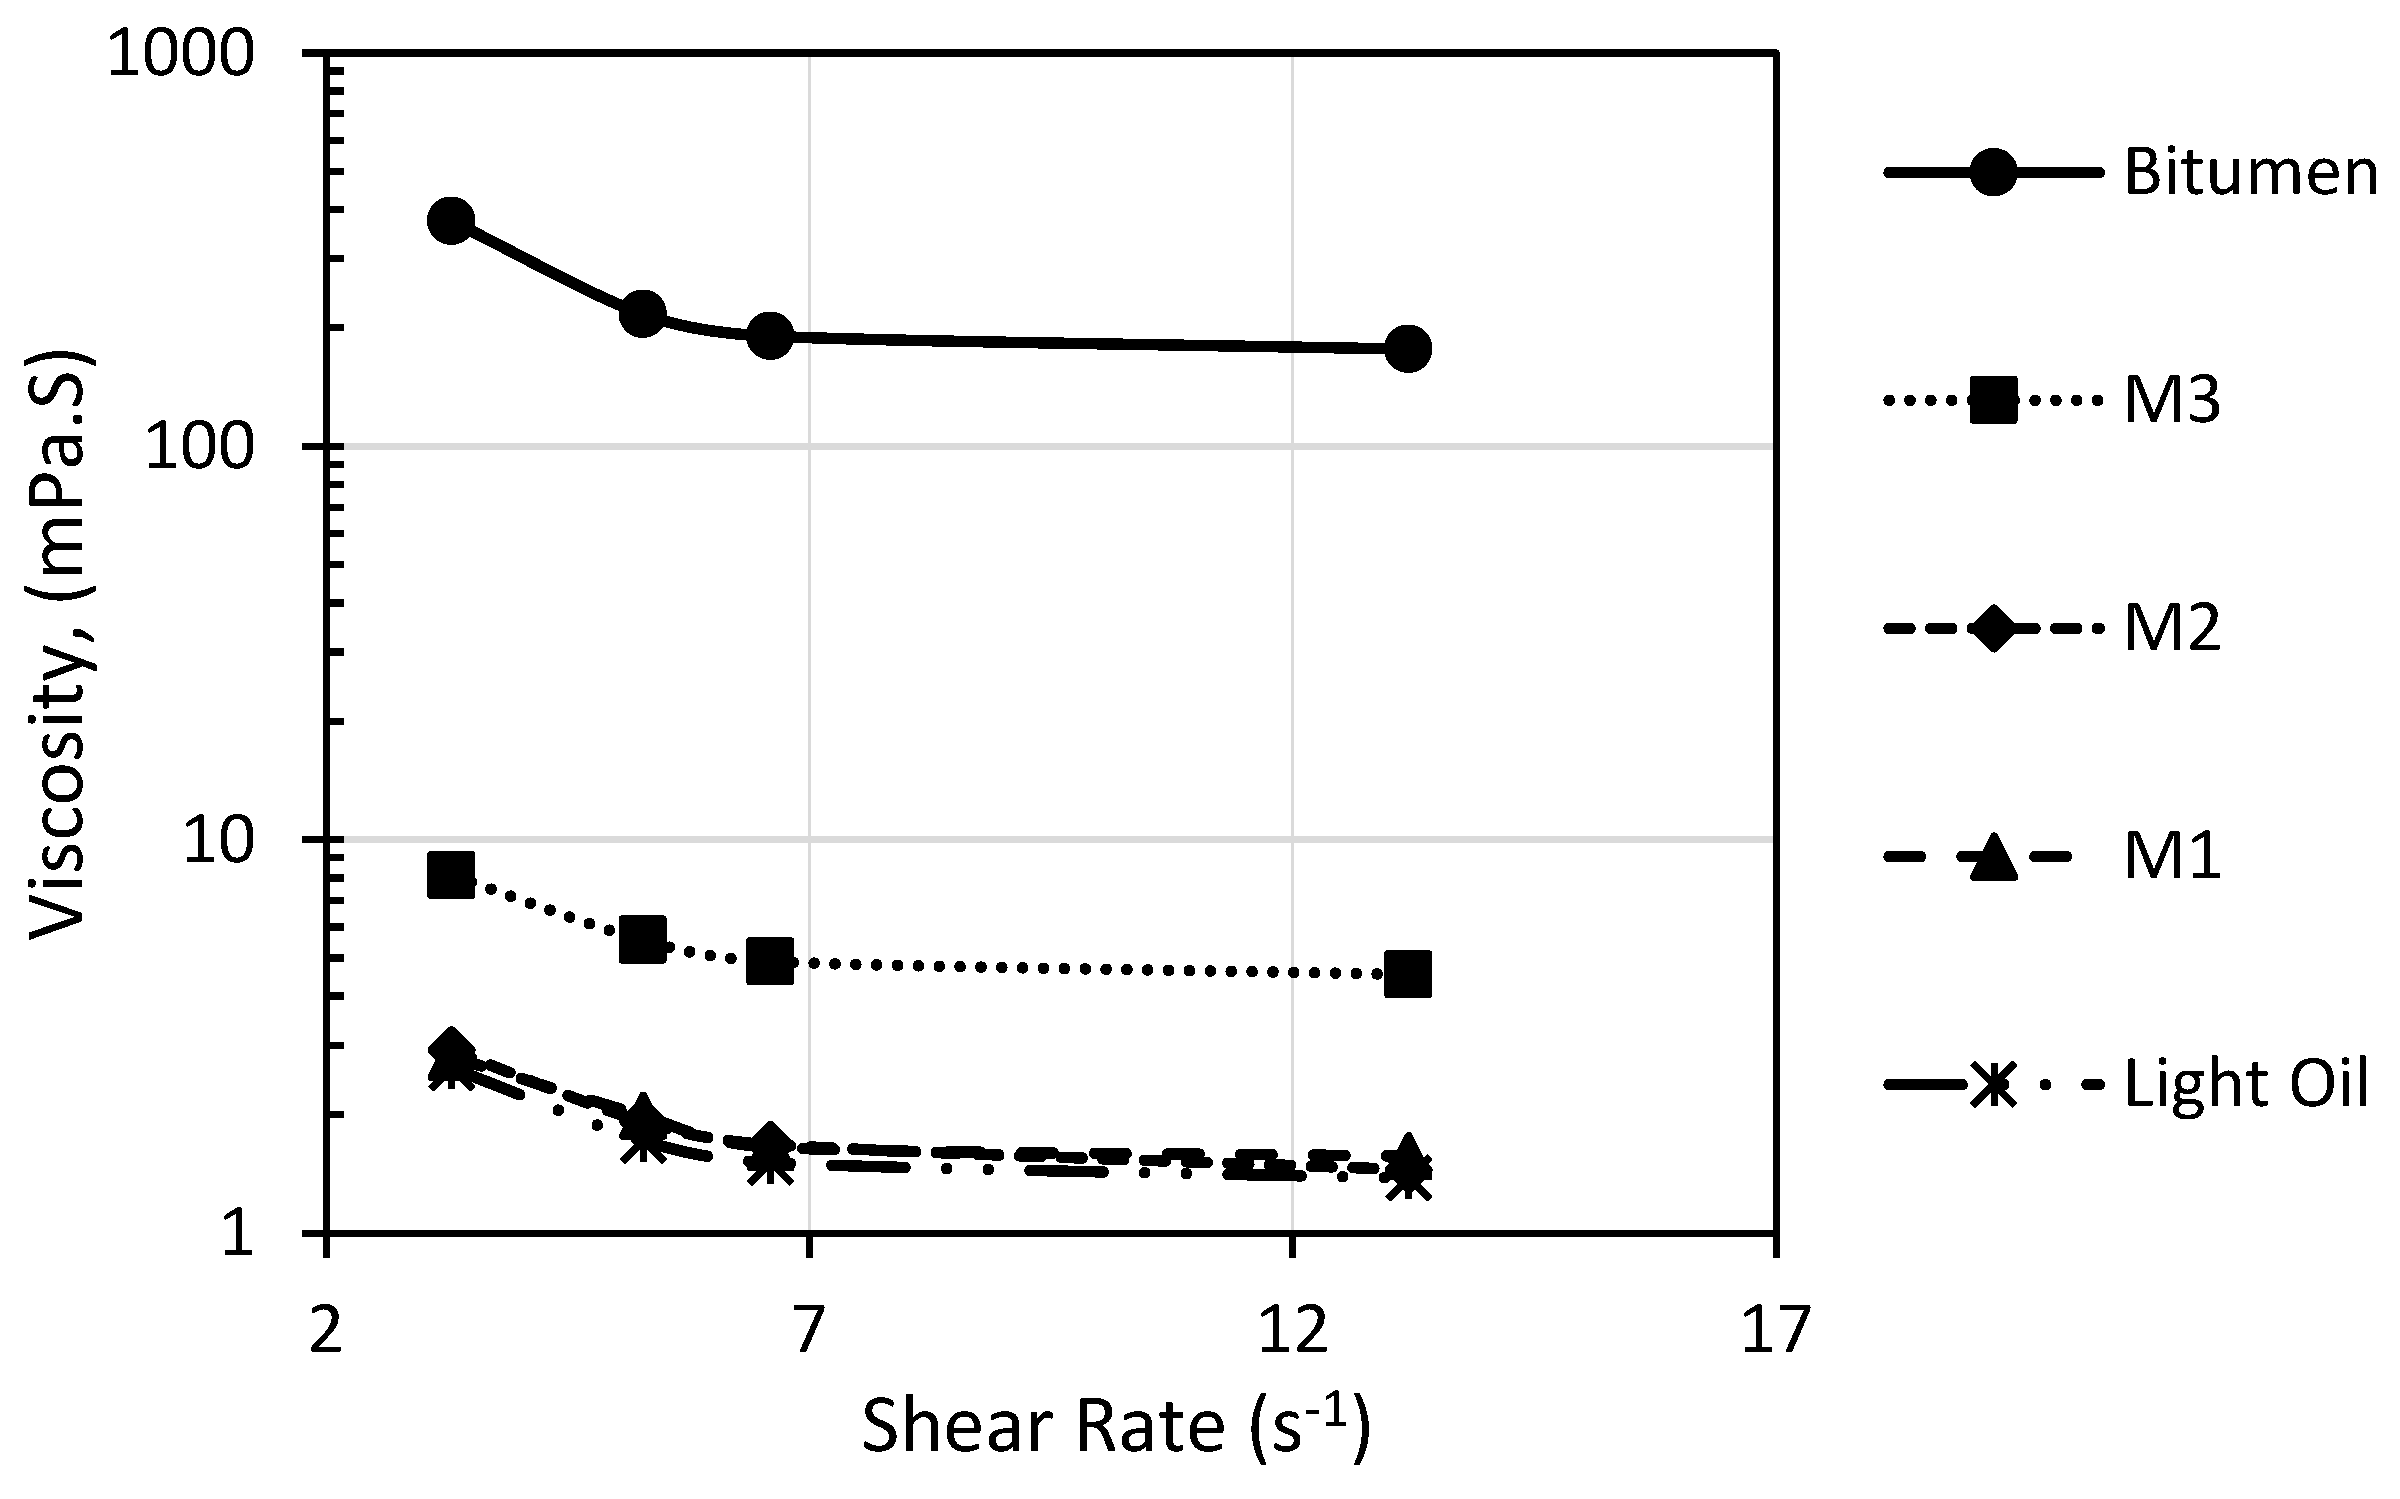
Table 2 summarizes the viscosity measurements of the bitumen, light oil, and blended bitumen.
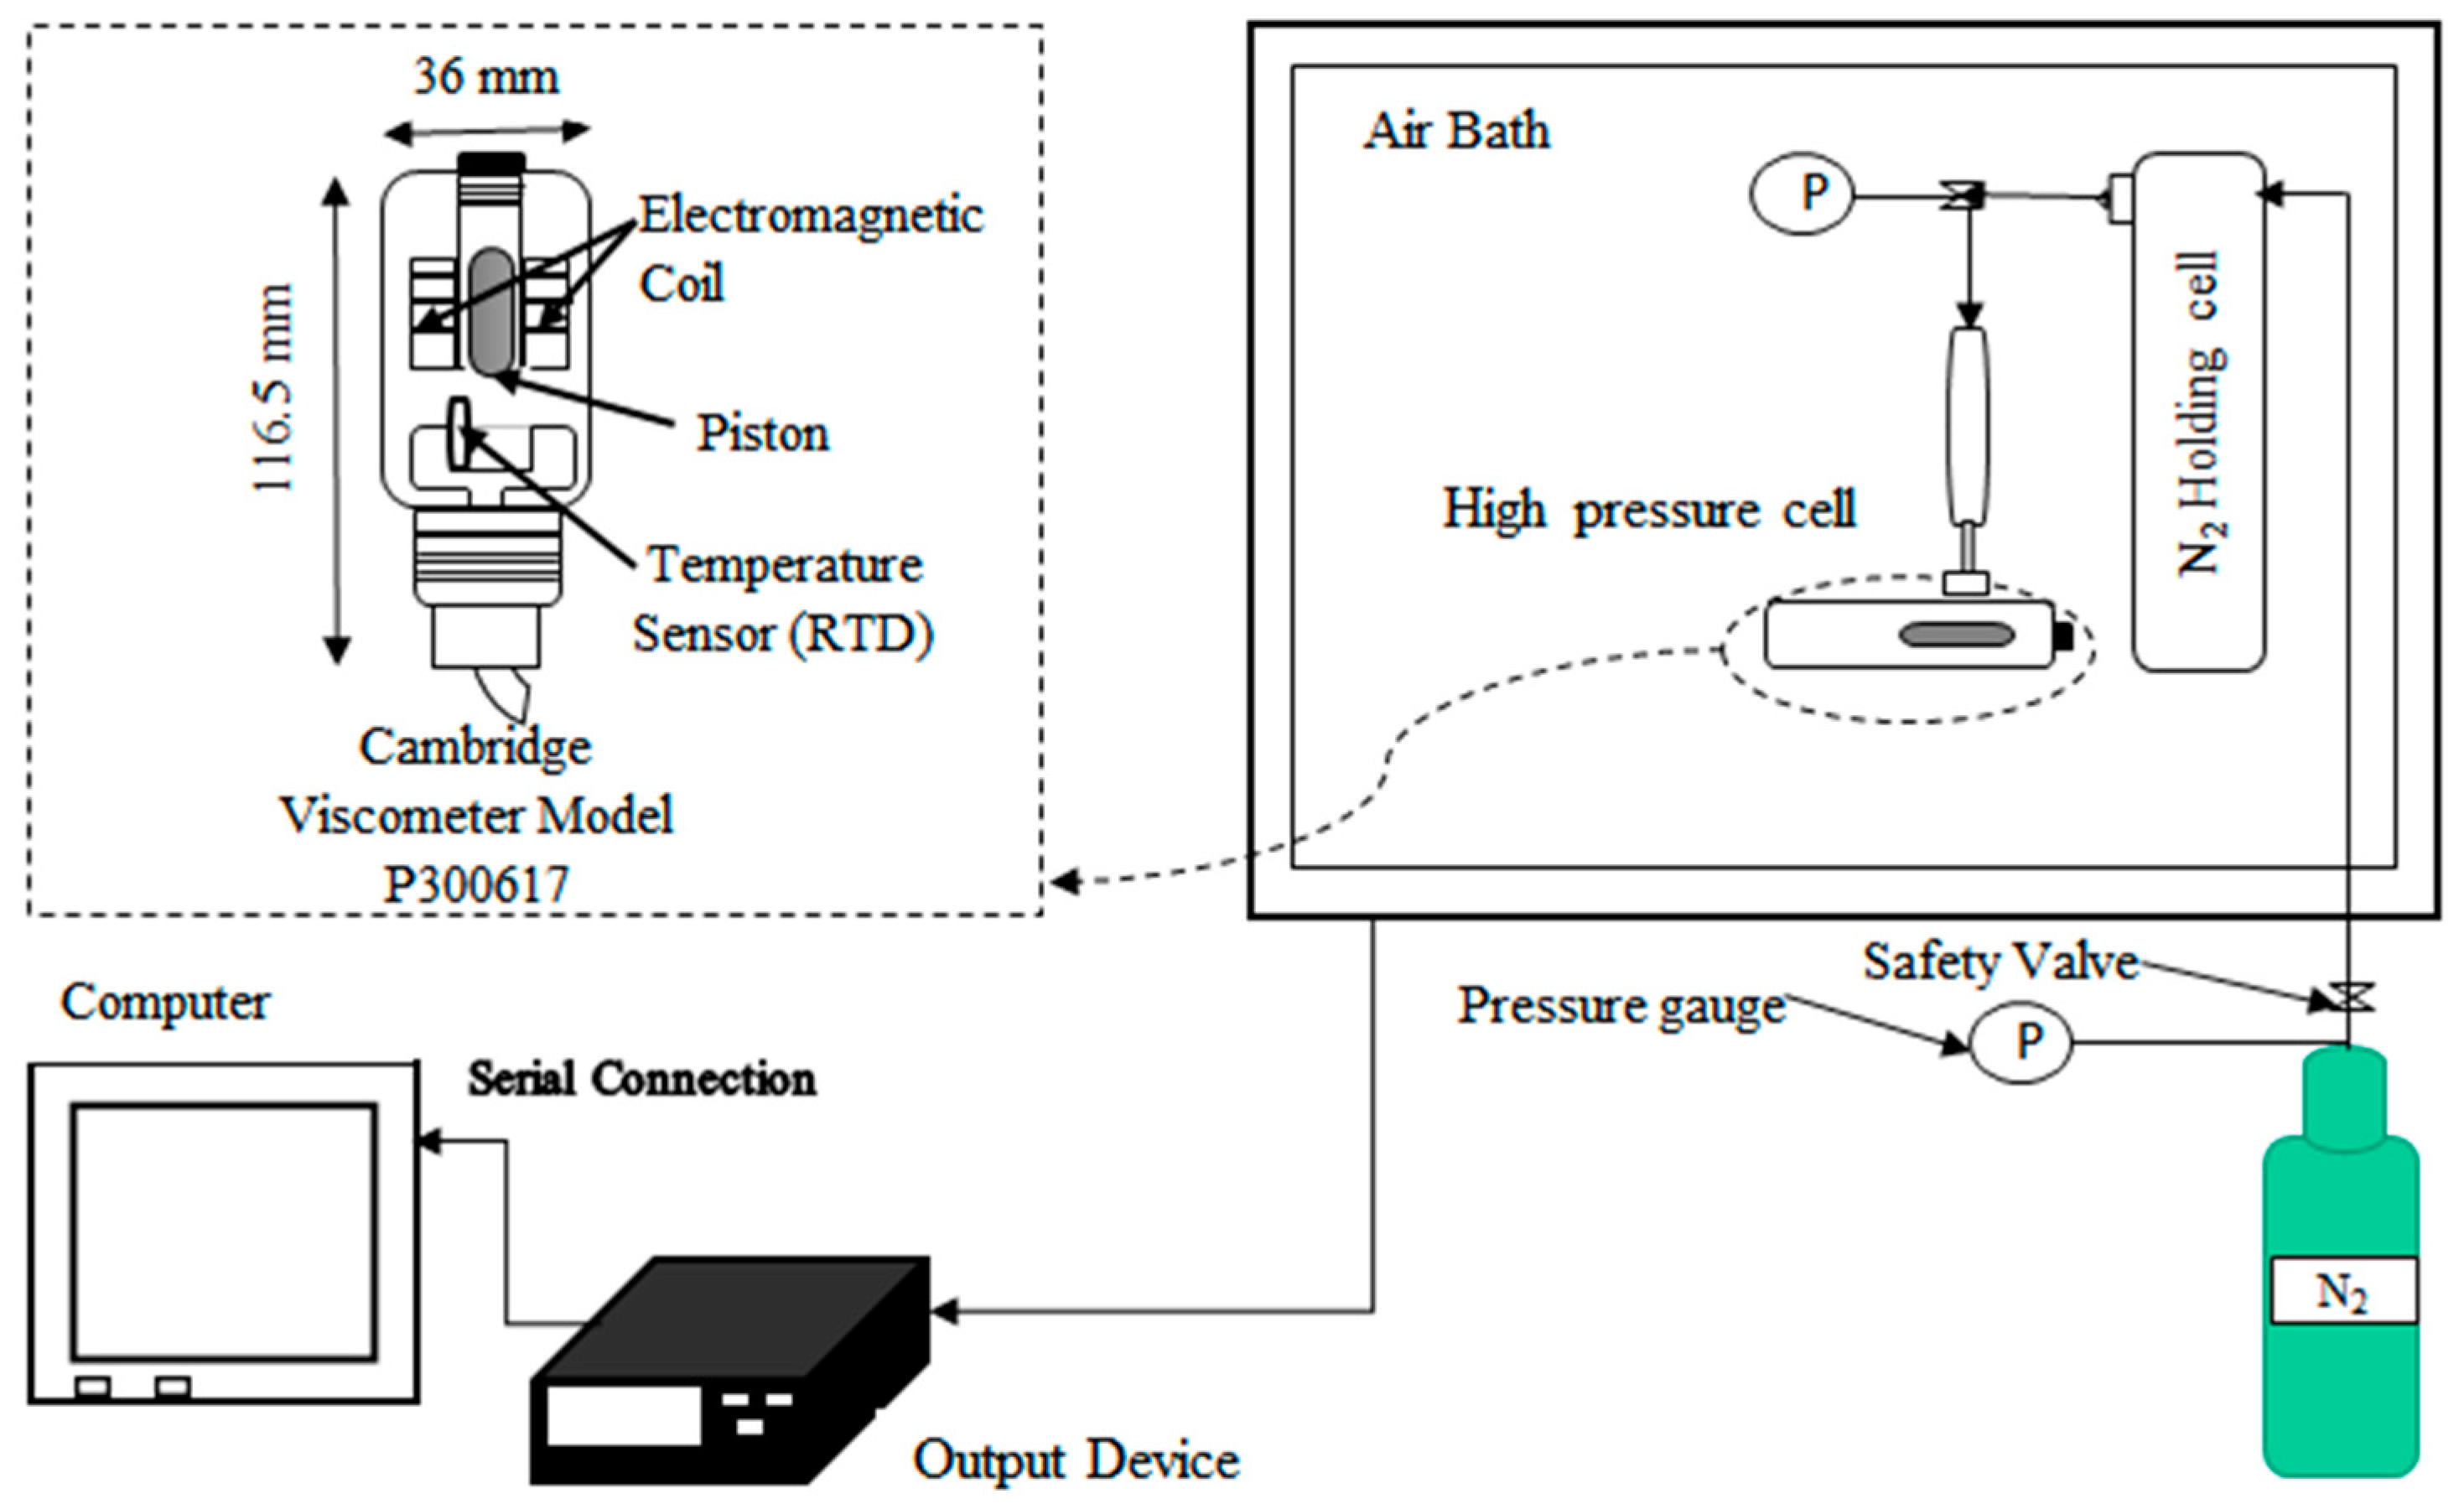
To determine the rheological behavior of the crude oils used in this study, their viscosity was measured at atmospheric pressure and 110 °C using a Brookfield LVDV-1 Prime viscometer. The oil was shown to behave like a pseudoplastic, especially at lower shear rates (3–7 s−1), yet tended to be Newtonian beyond 7 s−1. Since the oil samples used in this study are akin to those reported by Ssebadduka et al., the rheological behavior is also similar, as shown in Figure 3 below [11].

4.1. Bitumen Viscosity Prediction Using Both ANN and Equation
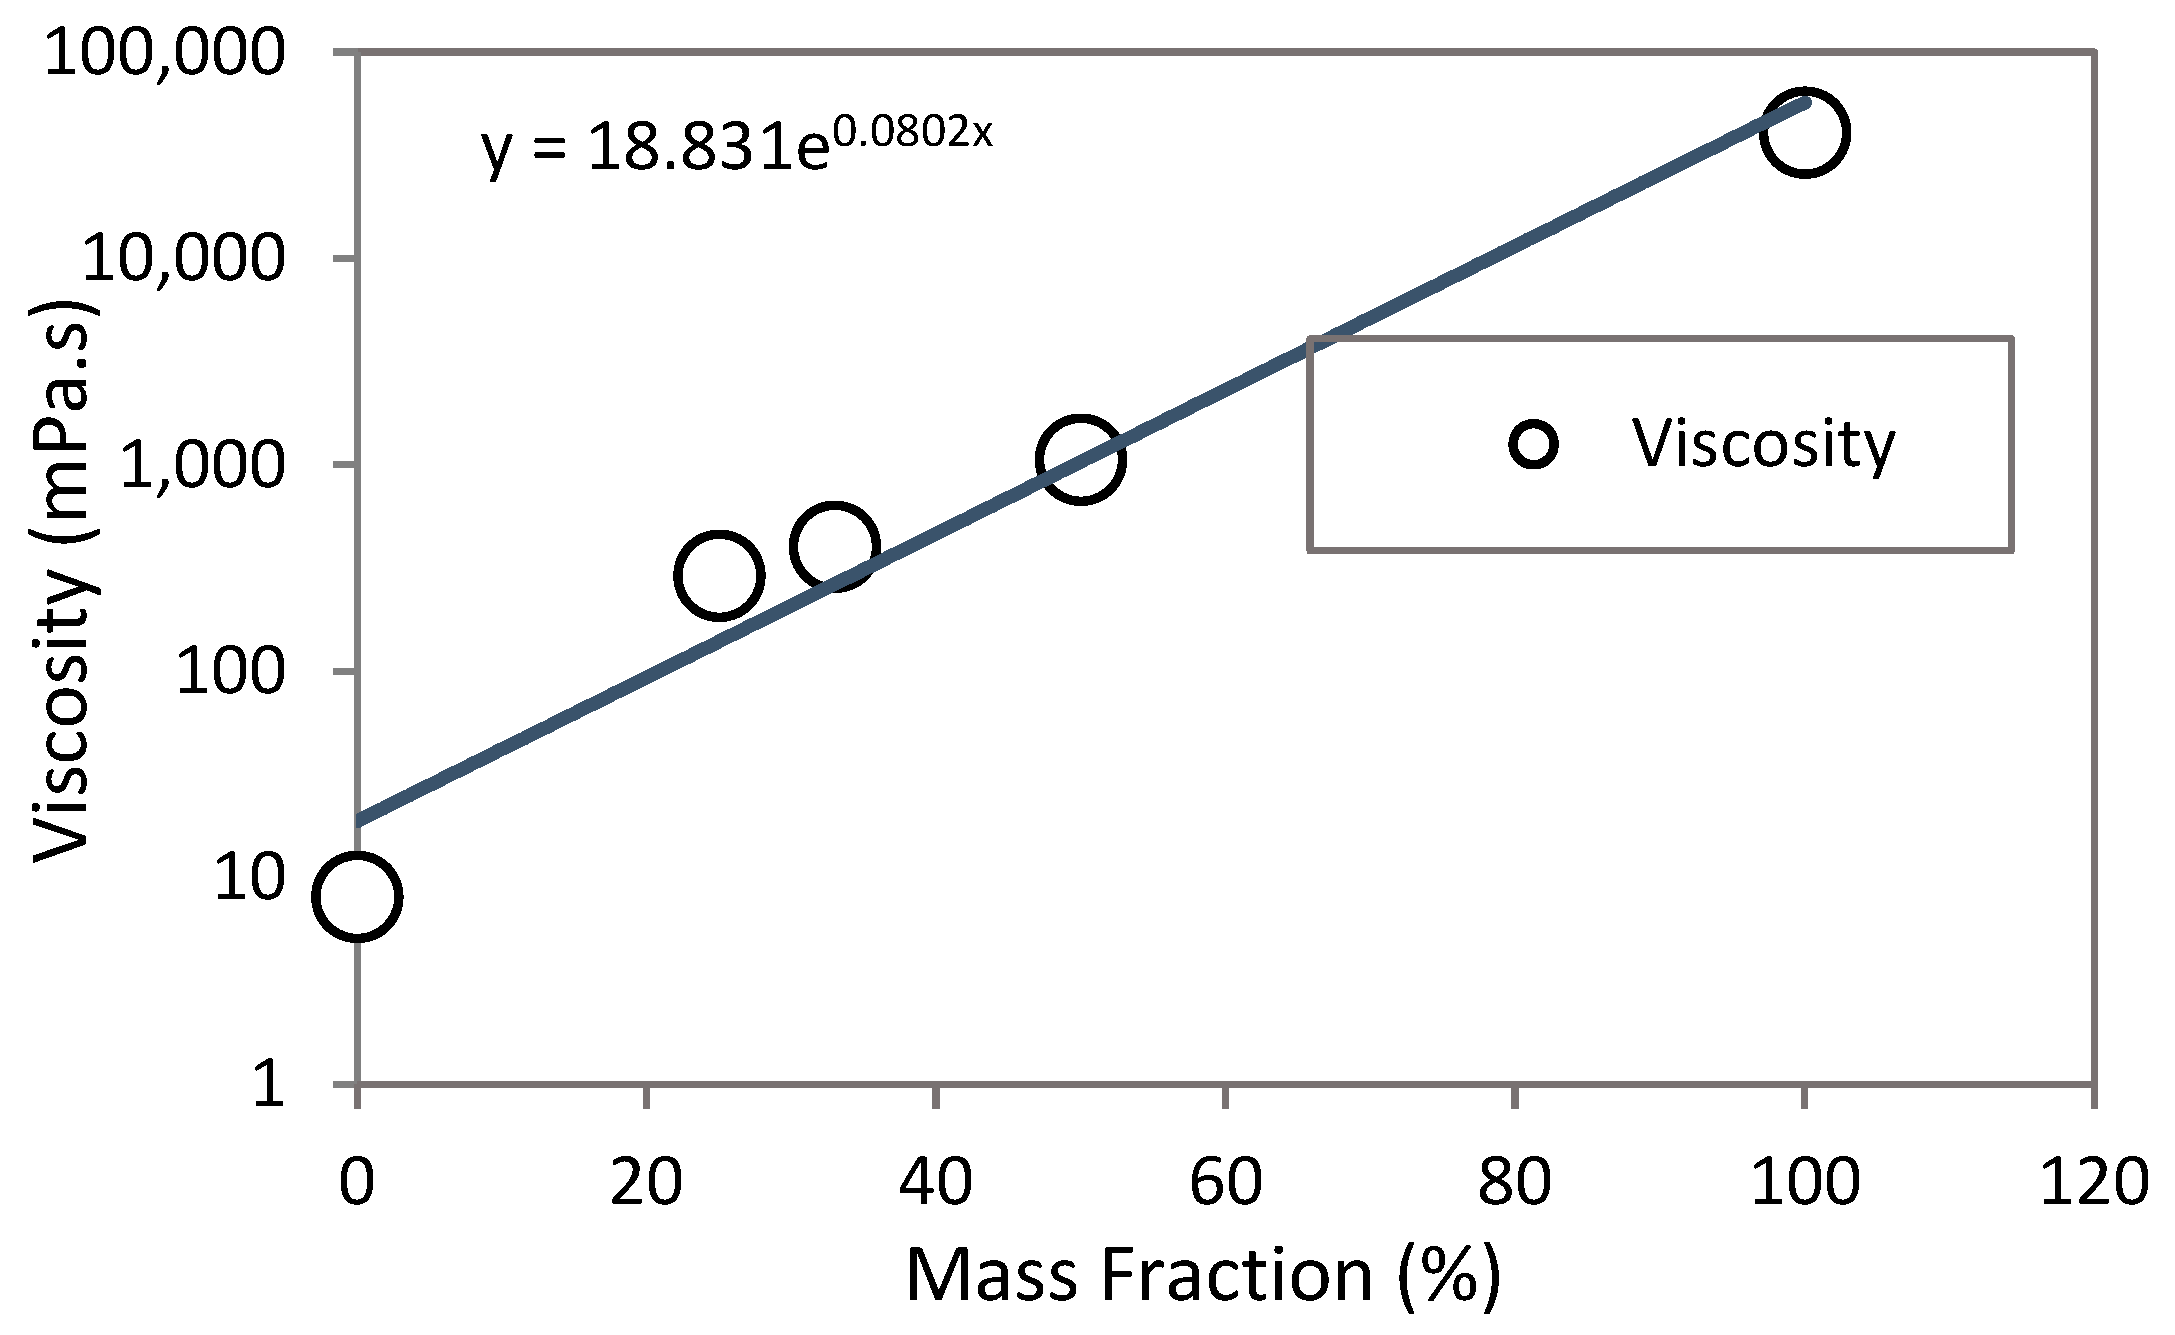
 Z = i = 1 n X i w i + b

An %AAD of 3.86% was obtained when using Equation (1), which is a very low error in the prediction accuracy of the bitumen. However, this pales in comparison to the 0.8272% of the ANN in predicting the same. In addition, when a plot is made to compare the two models’ accuracy, as shown in Figure 4 by plotting the predicted viscosity values against the actual experimental values, the ANN is clearly better. In this work, the values of the coefficients c1, c2, and c3 were obtained by regression analysis as 4.9362, 0.0078, and −0.6693, respectively.

4.2. Significance of the Different Parameters of the RVDM and MVDM Empirical Models

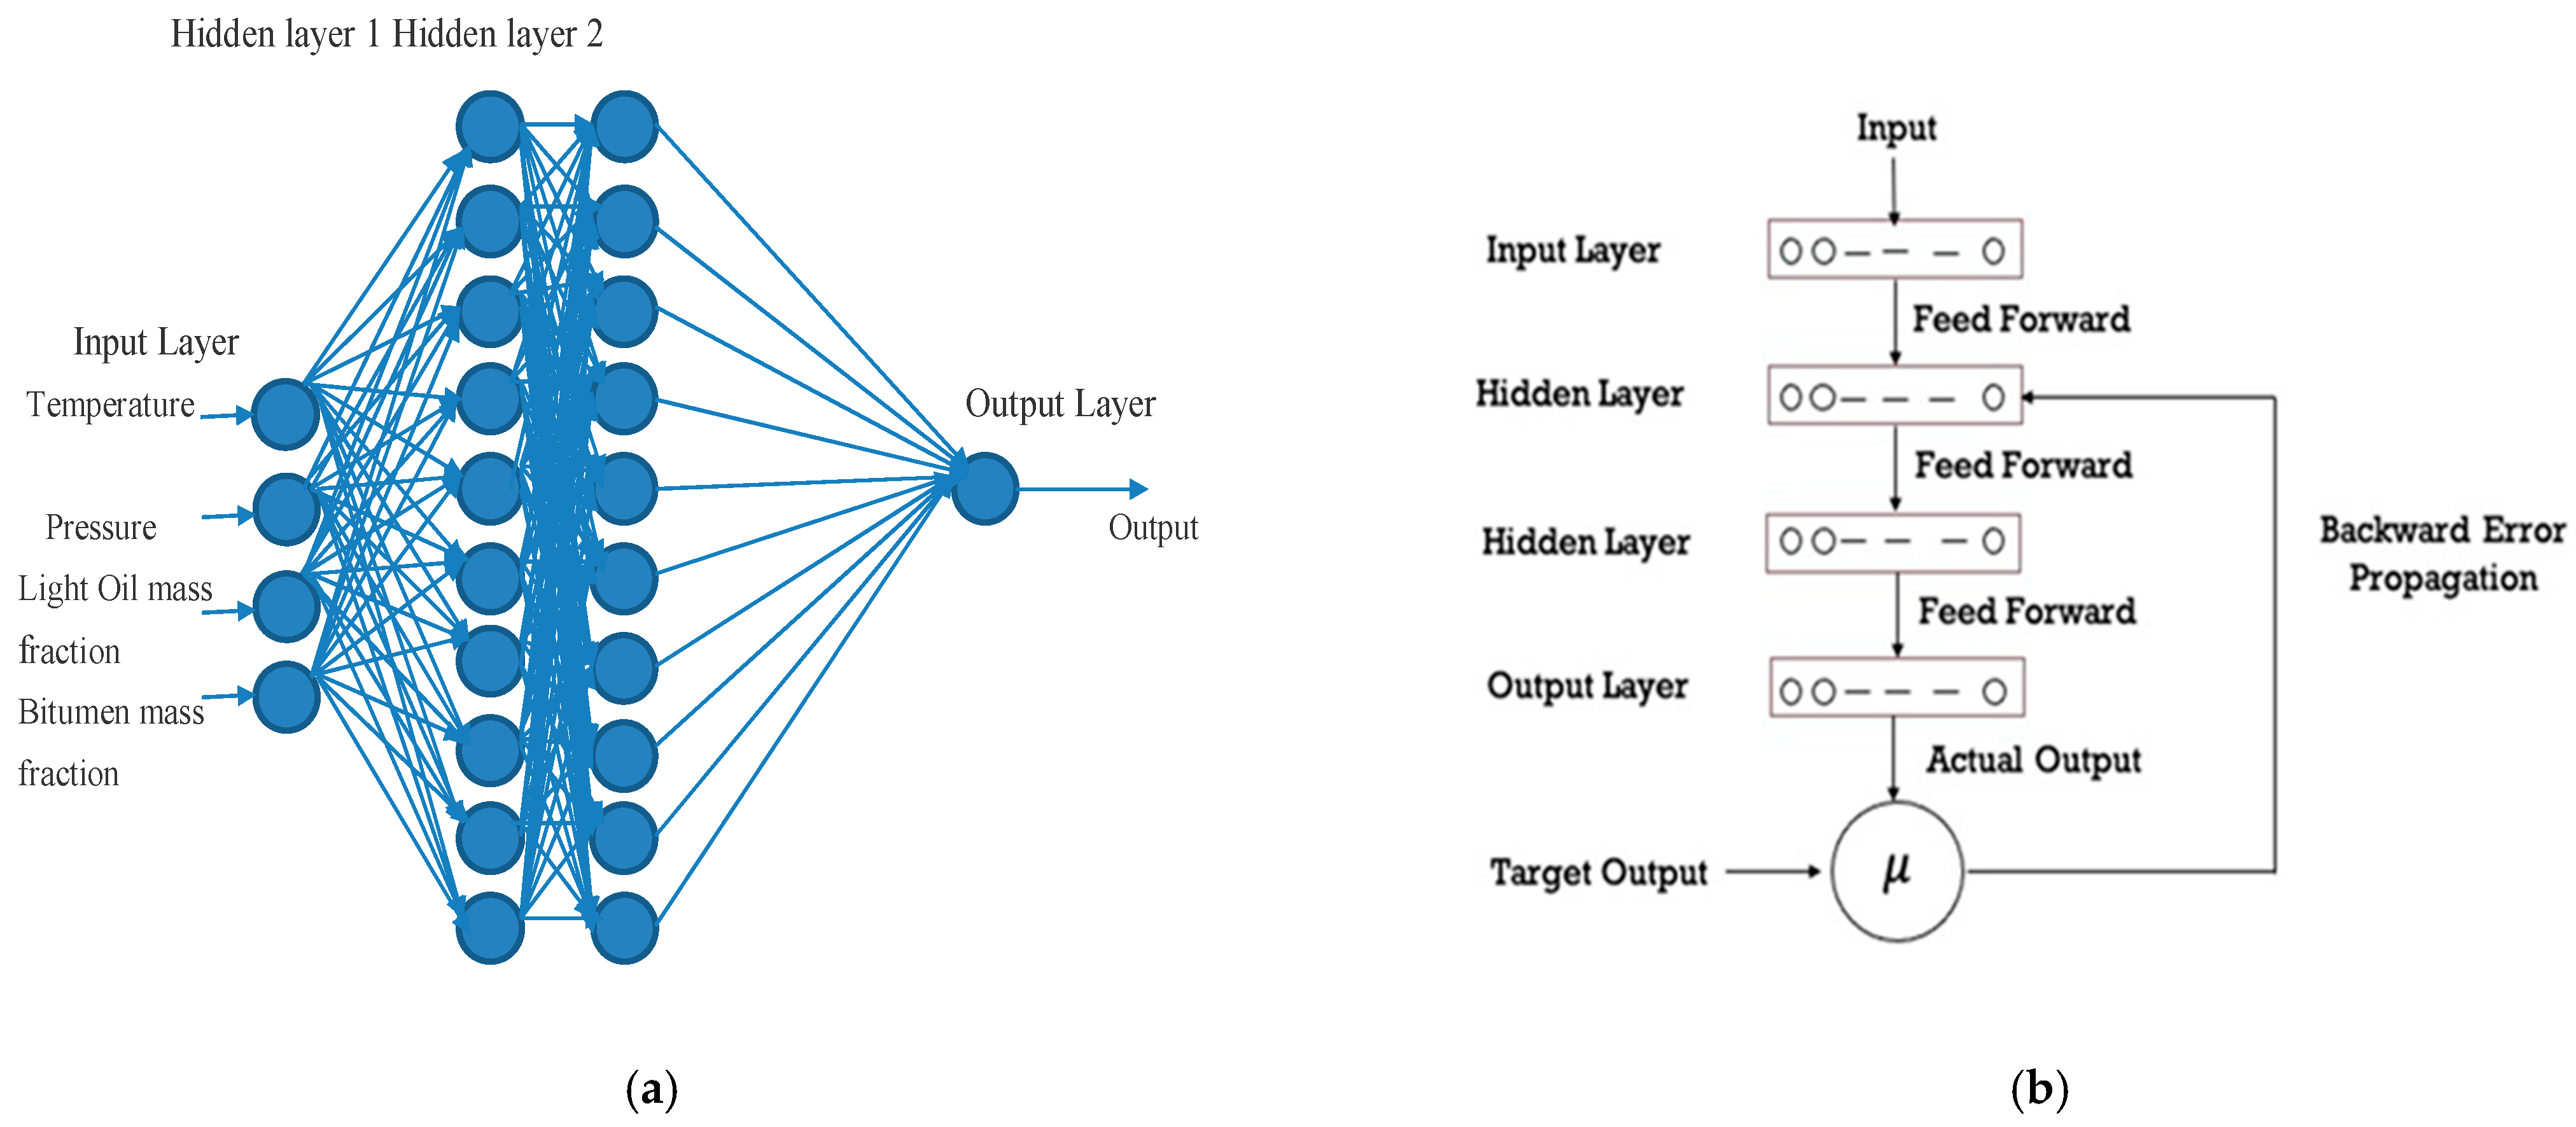
The MVDM and RVDM models shown in Equations (2) and (3), respectively, have four parameters upon which they depend: the temperature and pressure, as shown in Equation (4), and the bitumen and light oil mass fractions.

4.2.1. Temperature

In this study, it was shown that a positive change in temperature culminates in an exponential decrease in crude oil viscosity, as shown in Figure 5.
To clearly show how temperature affects the viscosity of the crude oils, we only considered the measurements at atmospheric pressure. At 45.5 °C, the bitumen viscosity decreased by as much as 99.082%, yet the light oil viscosity only decreased by ~67.902%, implying that the temperature effect is more profound in more viscous oils.

4.2.2. Pressure

By using the ratio µpref, where µref is the viscosity at atmospheric pressure and µp is the viscosity under pressure, we were able to show how significantly pressure (ranging from 0.1 to 6 MPa) affects the crude oil viscosity. As shown in Figure 6a,c–e, the negative effect on the viscosity is higher in the more viscous crude oils, while it is minimal in the lighter oils (Figure 6b). This is because of the significantly lower density of the light oils. In the heavier crude oil, the viscosity increases because of increased resistance to flow as the compression increases.
From keen observation, the viscosity of bitumen was found to rise by ~43% at 45 °C, and by a mere 10% at 110 °C, for a pressure change from 0.1 MPa to 6 MPa. A similar pattern was observed for mixture M1, as shown in Figure 6c; here the viscosity increased by 38.2% at 45 °C and 2.13% at 110 °C for the same pressure change as in the case of the bitumen. This implies that, at lower temperatures, the positive change in viscosity due to the influence of pressure is much more evident. This in itself shows that a rise in temperature lowers the viscosity, as can be seen more clearly in Figure 4.

4.2.3. Mass Fraction

The RVDM and MVDM models show that there is a direct proportionality between the components’ mass fractions and the mixture viscosity; it is therefore important to show the effect of the former on the latter—as in Figure 7 below, which shows that higher proportions of the more viscous component increase mixture viscosity, while those of light oil lower it.

4.3. ANN Model Sensitivity Analysis

A sensitivity analysis was carried out to show the effects of different input parameters of the ANN model on the final output. In the backward stepwise method used in this study, we simply changed the input dimensions in the code to three instead of the original four, after elimination of at least one input parameter. The omitted variable for which the resulting models gave the largest error was the most important one [43]. Table 3 presents the backward stepwise result in which several ANN models were generated by eliminating at least one of the four original input parameters. Table 4 summarizes the statistical results of the ANN using experimental data.
As shown, the RMSE is highest when we eliminate the temperature effect, and low for the effects of the light oil mass fraction and pressure. As shown during the empirical modeling, the light oil mass fraction indeed has a significant effect on the final mixture viscosity, yet the ANN model sensitivity analysis proves otherwise. This could be because the empirical correlation depends on the data relationship, while the ANN model does not require any knowledge of the data relationship in order to predict the crude oil viscosity [44]. However, similar to empirical modelling procedures, the temperature is the most influential factor when predicting the mixture viscosity.

4.4. Comparison of Model Metrics

The metrics of all of the models used in this study were compared based on the well-defined statistical terms shown in Table 5, Table 6, Table 7 and Table 8.
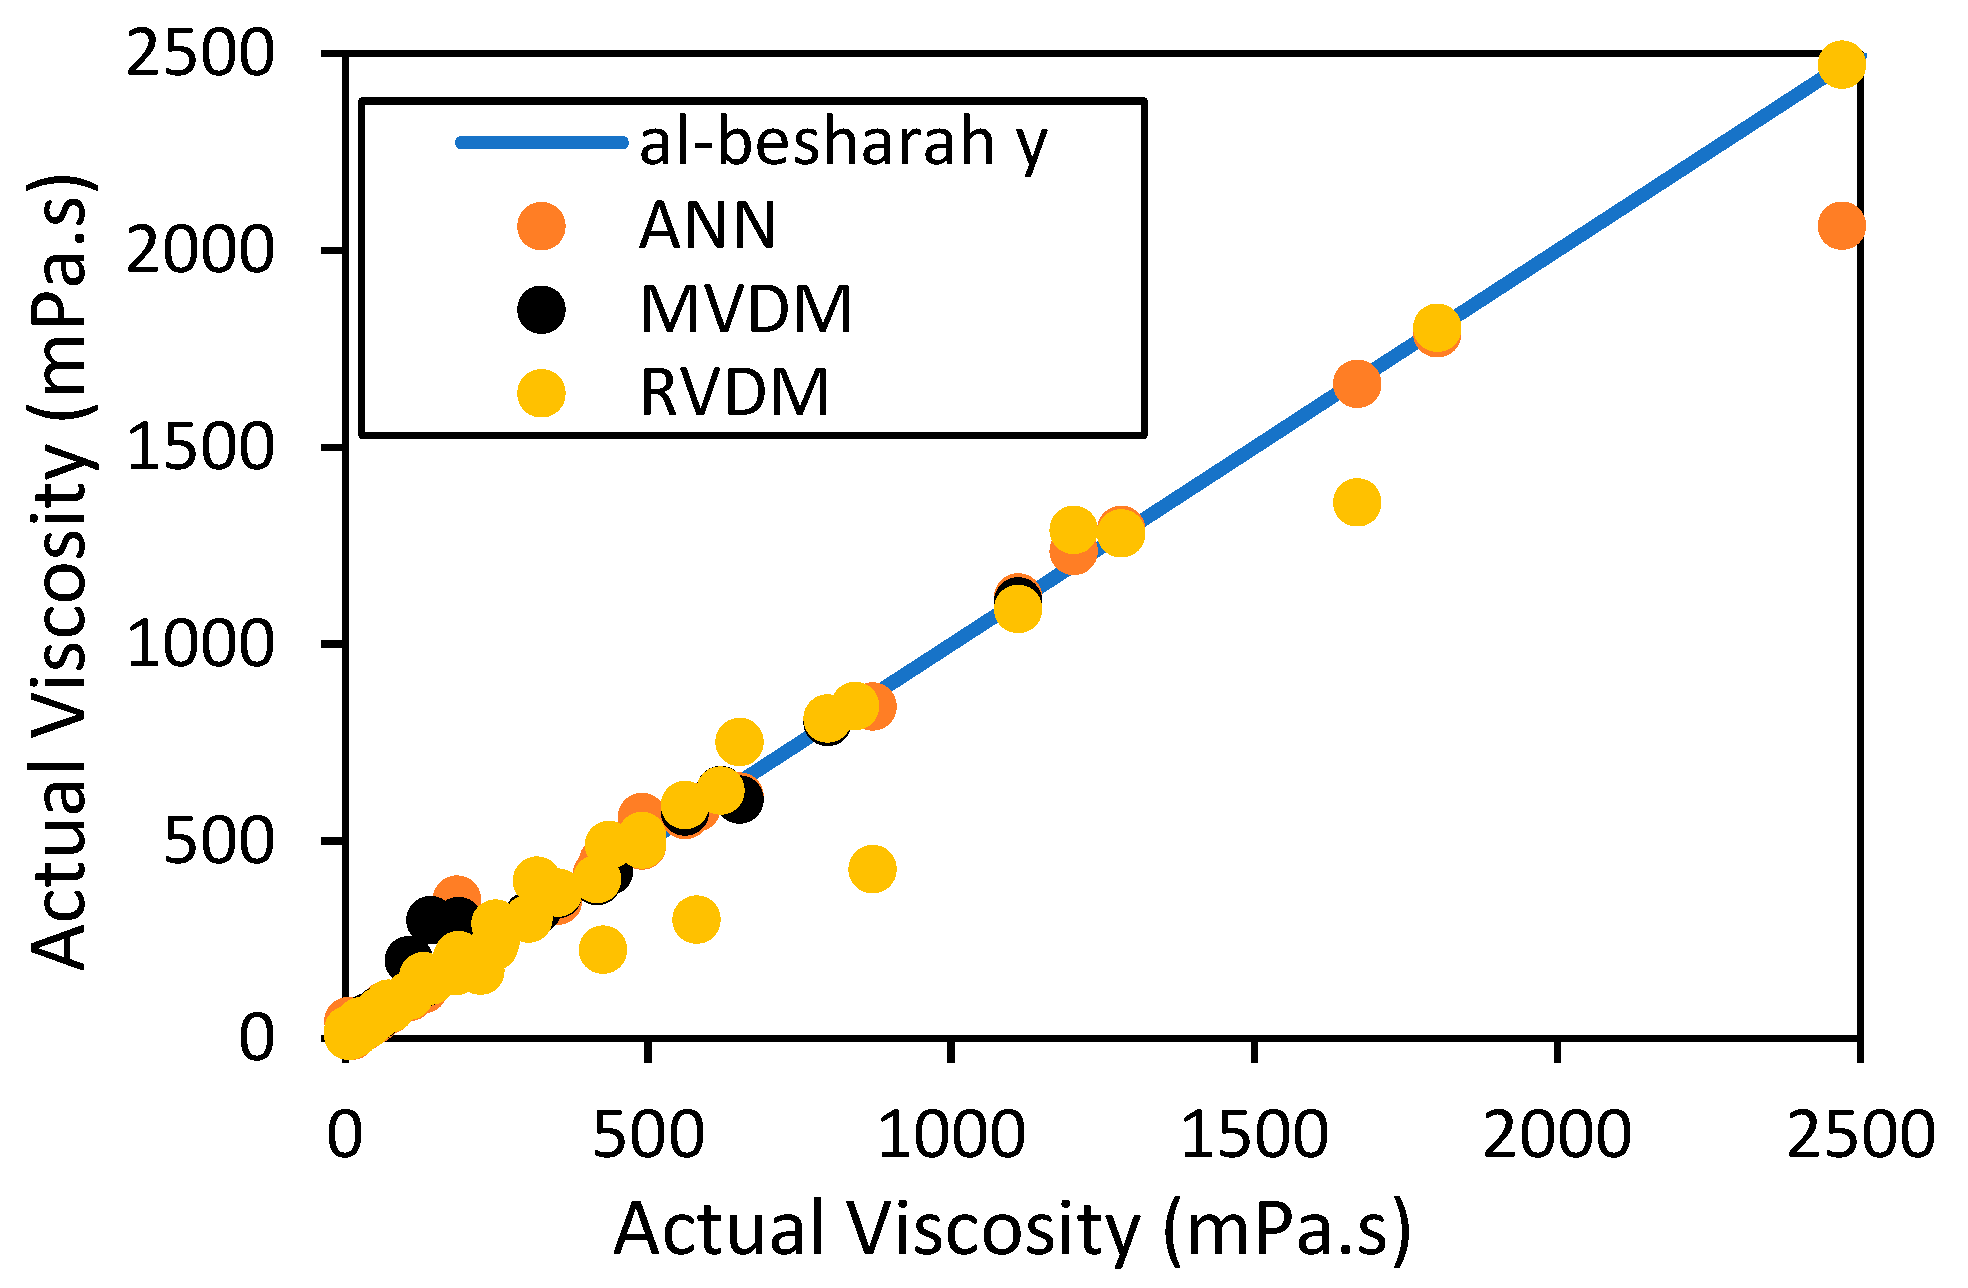
A comparison of the normalized statistical results from the ANN model to the empirical models, using both the experimental and literature data, is shown in Table 6 and Table 8, while Figure 8 and Figure 9 help to further emphasize this accuracy by comparing the predicted values from the ANN model to those obtained otherwise.
The ANN model used with the experimental data obtained was saved and loaded for use in predicting the viscosity using the literature data. The whole model was saved using the TensorFlow SavedModel format. The saved_model summary printed on loading was similar to the trained one, as shown in Table 7.
The saved and loaded model produced identical results to those in Table 4 when checked using the experimental data. The results obtained when the literature data were loaded to the saved model are as shown in Table 7. Meanwhile, the saved model predicted the viscosity results of the binary crude oil mixture made in house in 0.195208 s, compared to 13.431492 s for the training model.
For reference purposes, the ANN regression plots for the experimental and Al-Besharah data are presented in Figure 10 and Figure 11, respectively.
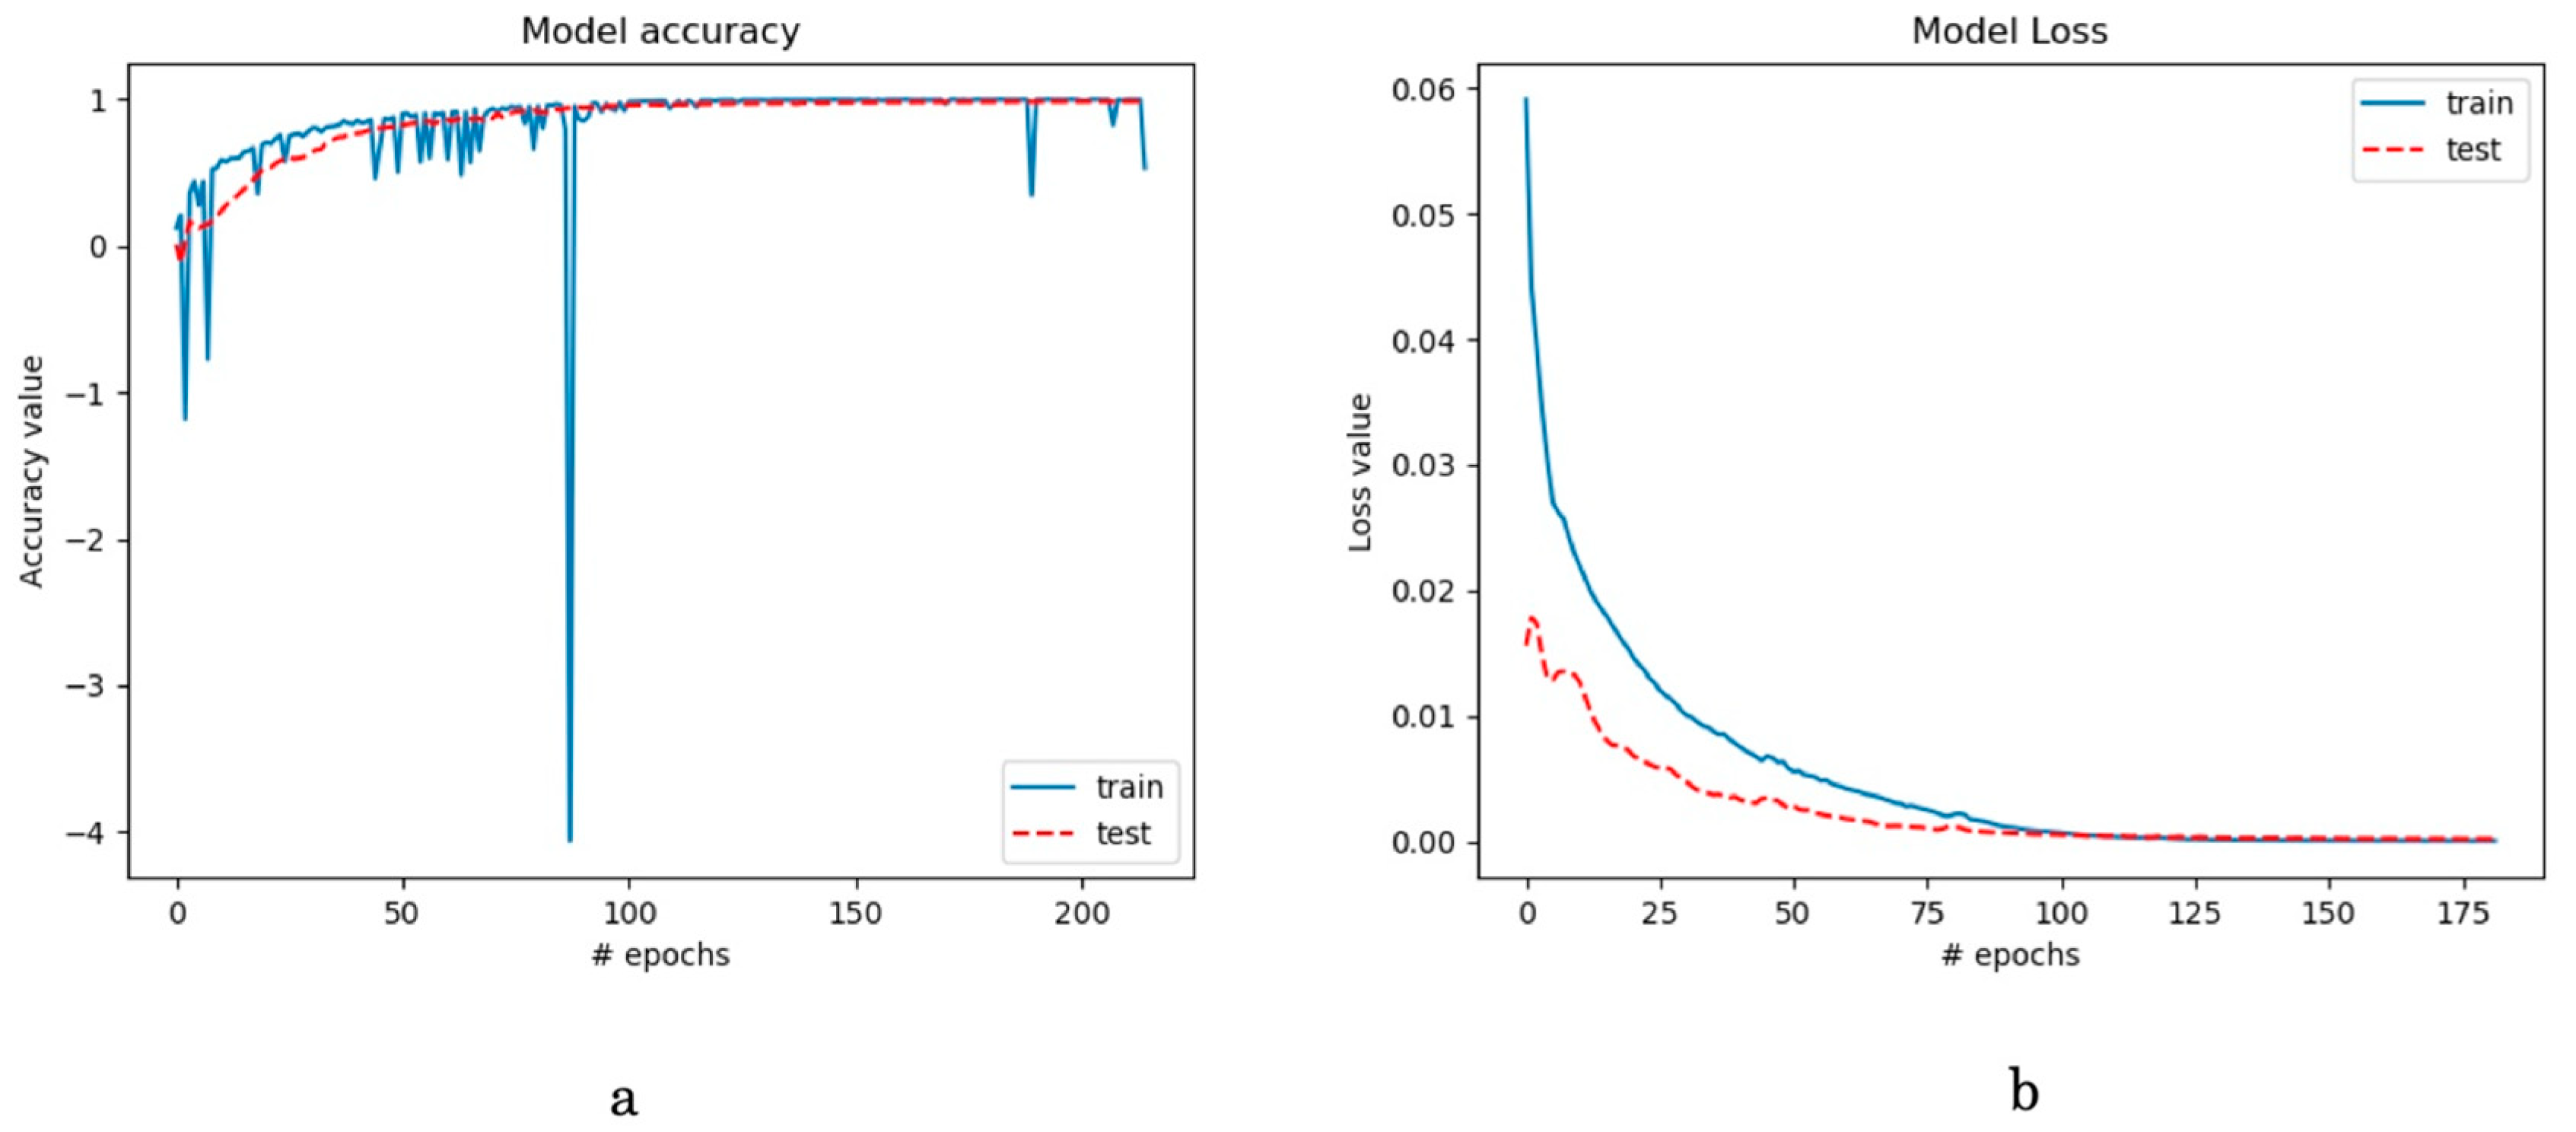
In Figure 10a, the plot shows the R2 value against the number of epochs for both the training and testing parts. It is clear that in both cases the maximum number of epochs required to achieve a high accuracy is around 50. Beyond this, the accuracy does not change much, and since there is a lot of similarity in the R2 for both the testing and training, this shows that there was neither overfitting nor underfitting.
In Figure 10b, the model loss is shown to decrease in both the testing and training sets until the error is at its lowest (~0.002 and 0.004 for the training and testing datasets, respectively) at ~100 epochs. This implies that for this dataset the maximum number of epochs required for high accuracy is ~100.
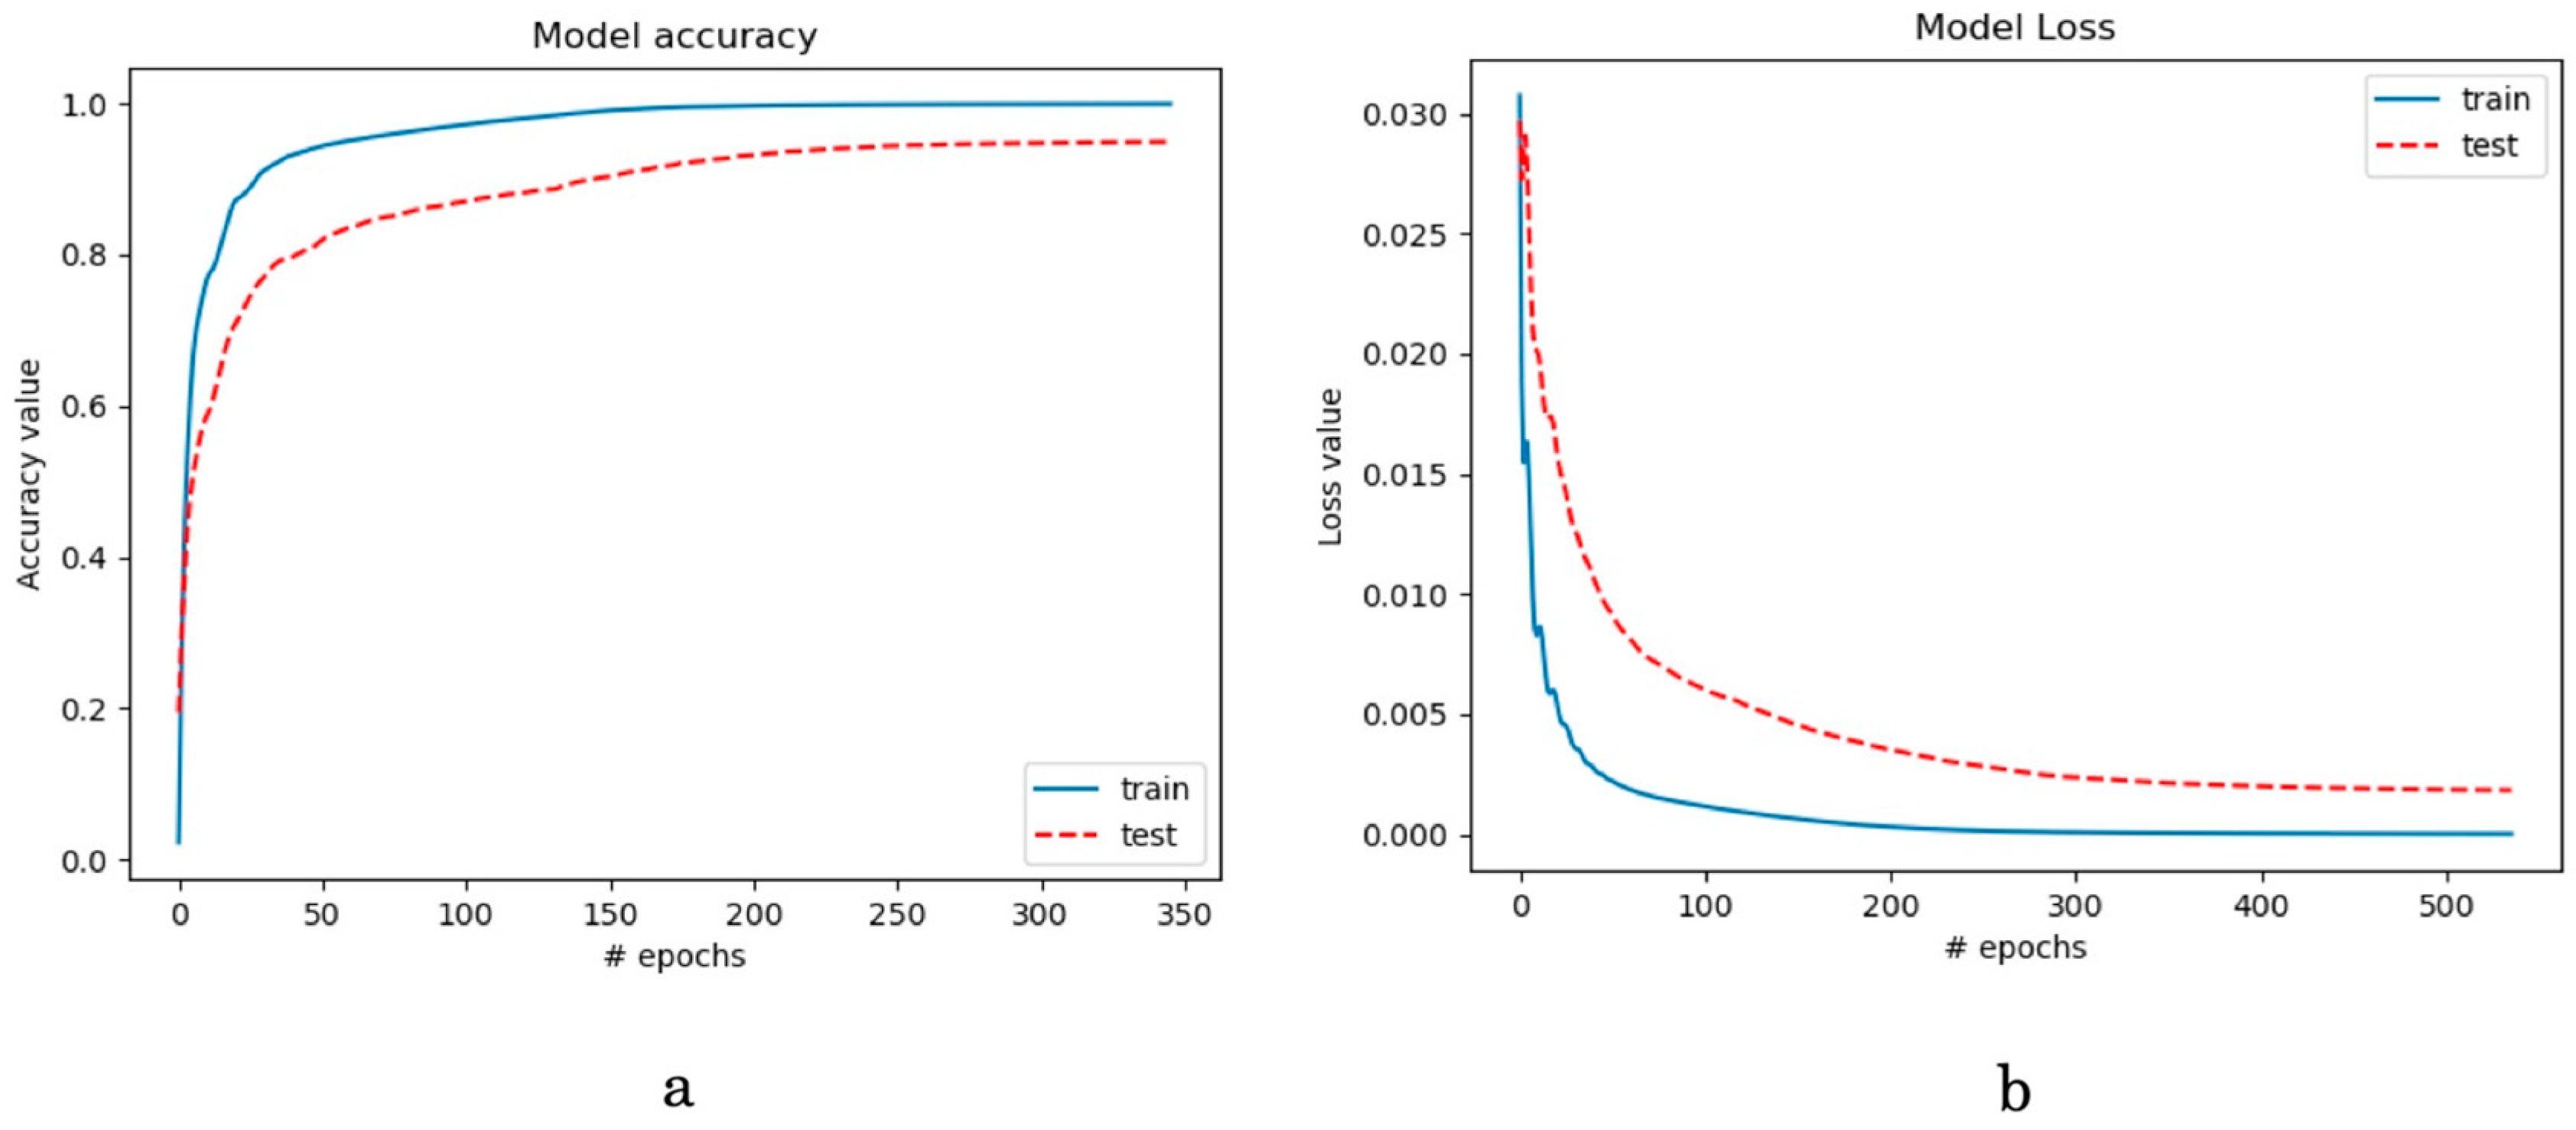
Similarly, for the literature data from Al-Besharah et al. [14], a plot for the R2 against the number of epochs in Figure 11a was made, and the best performance was obtained at 50 epochs. Figure 11b represents the best performance when the loss (mean squared error) was plotted against the number of epochs. This was also obtained at ~100 epochs for both the training and testing datasets.

5. Conclusions

The use of an ANN model in predicting the binary mixture viscosity proved less cumbersome in comparison to the unstable RVDM model, whose coefficients must be redetermined for each new sample. Furthermore, the ANN model showed that since its training with limited data requires a higher number of epochs and neurons in the hidden layers, saving the entire model and loading it for any new datasets is useful in saving time, since there is no need to retrain the loaded model. Other major findings from this study can be summarized as follows:
  • As expected, the viscosity of both the single-component crude oils and the mixtures decreased with increasing temperature. The pressure, as has been cited previously, led to an increase in the viscosity of the heavier oils—unlike for the light oils, where a 9% decrease was observed at 45 °C;
  • The number of nodes in the ANN hidden layer should be correlated with the amount of input data, since an increase in the number of nodes from (10, 10) to (100, 100) for the experimental dataset increased the R2 from 0.8793 to 0.9989;
  • The ANN model was used to successfully predict the viscosity of bitumen with an %AAD of 0.8272, in comparison to the prediction obtained using Equation (1), whose %AAD was 3.86%;
  • The sensitivity analysis shows that the temperature, as in empirical modelling, has a profound effect on the mixture viscosity due to an RMSE of 0.176884, which is higher than for the other input parameters. On the other hand, the ANN model downplays the effect of the light oil mass fraction on the final mixture viscosity, and ranks it lower than the pressure, with RMSE of 0.0118 compared to 0.0568, respectively;
  • The results showed that both the regression and ANN models could be used; however, based on the higher R2 values of 0.9989 and 0.9987 for the experimental and Al-Besharah data, respectively, and the comparatively lower %AAD and RMSE of 9.2087% and 0.7977%, respectively, for the experimental data and 0.1434 and 0.1579, respectively, for the Al-Besharah data, the ANN model is a superior alternative to the empirical models.

Author Contributions

Conceptualization, R.S.; data curation, N.N.H.L.; methodology, R.S.; resources, Y.S.; writing—original draft preparation, R.S.; writing—review and editing, R.N. and O.A. All authors have read and agreed to the published version of the manuscript.

Funding

This research received no external funding.

Data Availability Statement

Data is contained within the article. The data presented in this study are available in [11,14].

Acknowledgments

The authors extend their gratitude to Japan Petroleum Exploration for supplying the crude oils used in this study. The authors are very thankful for the financial support provided to them by the Japanese government through the Ministry of Education, Culture, Sports, Science, and Technology.

Conflicts of Interest

The authors declare no conflict of interest.

Appendix A

Equation (2): X, w, b, and a represent the value of the previous neuron, the weight, the bias, and the value of the recently generated neuron respectively.
Equation (3): w and b are the adjustable parameters of the neuron.
Equation (4): μ is the bitumen viscosity (in mPa.s), T is the temperature (in °C), and P is the pressure (in MPa). The constants c1, c2, and c3 are the system-specific empirical parameters.
Equations (5) and (6): μL, μB, and μ are the viscosity of the light oil, bitumen, and bitumen/light oil mixture, respectively (in mPa.s); XB, and XL are the bitumen and light oil mass fractions, respectively (dimensionless).
Equation (7): µexp and µcal represent the experimental and calculated viscosity values, respectively (mPa.s).

References

  1. Denney, D. Heavy-Oil Production in Venezuela. J. Pet. Technol. 1999, 51, 110–114. [Google Scholar] [CrossRef]
  2. Ivory, J.; Chang, J.; Coates, R.; Forshner, K. Investigation of Cyclic Solvent Injection Process for Heavy Oil Recovery. J. Can. Pet. Technol. 2010, 49, 22–33. [Google Scholar] [CrossRef]
  3. Zhong, H.Q.; Zhu, S.; Zeng, W.G.; Wang, X.L.; Zhang, F. Research on heavy oil gas lift assisted with light oil injected from the annulus. J. Pet. Explor. Prod. Technol. 2018, 8, 1465–1471. [Google Scholar] [CrossRef] [Green Version]
  4. Brito, F.J.; Garcia, L.; Brown, J.C. Use of Natural Gas as a Driving Force in a Diluent-Gas Artificial-Lift System Applied to Heavy Oils. All Days 2010, 2, 999–1011. [Google Scholar] [CrossRef]
  5. Hoffmann, A.; Astutik, W.; Rasmussen, F.; Whitson, C.H. Diluent Injection Optimization for a Heavy Oil Field. In Proceedings of the SPE Heavy Oil Conference and Exhibition, Kuwait City, Kuwait, 6–8 December 2016. [Google Scholar]
  6. Bakhshi, P.; Maroto-Valer, M.M.; Amani, M. A Bundle of Capillary Tubes (BOCT) Model for Carbonated Water Flooding (CWF); a Promising Technique for Simultaneous CO2 Storage and Enhanced Oil Recovery Purposes A Bundle of Capillary Tubes (BOCT) Model for Carbonated Water Flooding (CWF). In Proceedings of the InterPore2020-Online, Qingdao, China, 30 August–4 September 2020. [Google Scholar]
  7. Al-Murayri, M.T.; Maini, B.B.; Harding, T.G.; Oskouei, J. Multicomponent Solvent Co-injection with Steam in Heavy and Extra-Heavy Oil Reservoirs. Energy Fuels 2016, 30, 2604–2616. [Google Scholar] [CrossRef]
  8. Luo, S.; Barrufet, M.A. Reservoir Simulation Study of Water-in-Oil Solubility Effect on Oil Recovery in Steam Injection Process. SPE Reserv. Eval. Eng. 2005, 8, 528–533. [Google Scholar] [CrossRef]
  9. Mohammadzadeh, O.; Rezaei, N.; Chatzis, I. Production Characteristics of the Steam-Assisted Gravity Drainage (SAGD) and Solvent-Aided SAGD (SA-SAGD) Processes Using a 2-D Macroscale Physical Model. Energy Fuels 2012, 26, 4346–4365. [Google Scholar] [CrossRef]
  10. Mukhametshina, A.; Morrow, A.W.; Aleksandrov, D.; Hascakir, B. Evaluation of Four Thermal Recovery Methods for Bitumen Extraction. In Proceedings of the SPE Western North American and Rocky Mountain Joint Meeting, Denver, CO, USA, 16–18 April 2014. [Google Scholar]
  11. Ssebadduka, R.; Sasaki, K.; Nguele, R.; Dintwe, T.K.; Novaes, T.; Sugai, Y. New Method to Predict the Viscosity of Bitumen Diluted with Light Oil Using a Modified Van Der Wijk Model under Reservoir Temperature and Pressure. ACS Omega 2021, 6, 10085–10094. [Google Scholar] [CrossRef]
  12. Zheng, S.; Yang, D. (Tony) Pressure Maintenance and Improving Oil Recovery by Means of Immiscible Water-Alternating-CO2 Processes in Thin Heavy-Oil Reservoirs. SPE Reserv. Eval. Eng. 2013, 16, 60–71. [Google Scholar] [CrossRef]
  13. Chen, Z.; Zhao, X. Enhancing heavy-oil recovery by using middle carbon alcohol-enhanced hot polymer flooding. J. Pet. Sci. Eng. 2017, 149, 193–202. [Google Scholar] [CrossRef]
  14. Al-Besharah, J.M.; Akashah, S.A.; Mumford, C.J. The Effect of Temperature and Pressure on the/Water (1 mole% water)iscosity of Crude Oils and Their Mixtures. Ind. Eng. Chem. Res. 1989, 28, 213–221. [Google Scholar] [CrossRef]
  15. Pedersen, K.S.; Fredenslund, A.; Christensen, P.L.; Thomassen, P. Viscosity of crude oils. Chem. Eng. Sci. 1984, 39, 1011–1016. [Google Scholar] [CrossRef]
  16. Quiñones-Cisneros, S.; Zéberg-Mikkelsen, C.K.; Stenby, E.H. The friction theory (f-theory) for viscosity modeling. Fluid Phase Equilibria 2000, 169, 249–276. [Google Scholar] [CrossRef]
  17. Quin, S.E.; Andersen, S.I.; Lyngby, D.-K.; Creek, J. Density and viscosity modeling and characterization of heavy oils. Energy Fuels 2005, 19, 1314–1318. [Google Scholar]
  18. De La Porte, J.; Kossack, C. A liquid phase viscosity–temperature model for long-chain n-alkanes up to C64H130 based on the Free Volume Theory. Fuel 2014, 136, 156–164. [Google Scholar] [CrossRef]
  19. Barrufet, M.A.; Setiadarma, A. Reliable heavy oil–solvent viscosity mixing rules for viscosities up to 450K, oil–solvent viscosity ratios up to 4 × 10⁵, and any solvent proportion. Fluid Phase Equilibria 2003, 213, 65–79. [Google Scholar] [CrossRef]
  20. Nourozieh, H.; Kariznovi, M.; Abedi, J. Density and Viscosity of Athabasca Bitumen Samples at Temperatures Up to 200 °C and Pressures Up to 10 MPa. SPE Reserv. Eval. Eng. 2015, 18, 375–386. [Google Scholar] [CrossRef]
  21. Centeno, G.; Sánchez-Reyna, G.; Ancheyta, J.; Muñoz, J.A.; Cardona, N. Testing various mixing rules for calculation of viscosity of petroleum blends. Fuel 2011, 90, 3561–3570. [Google Scholar] [CrossRef]
  22. Ramos-Pallares, F.; Lin, H.; Yarranton, H.W.; Taylor, S.D. Prediction of the Liquid Viscosity of Characterized Crude Oils by Use of the Generalized Walther Model. SPE J. 2017, 22, 1487–1505. [Google Scholar] [CrossRef]
  23. Mehrotra, A.K.; Svrcek, W.Y. Viscosity of compressed athabasca bitumen. Can. J. Chem. Eng. 1986, 64, 844–847. [Google Scholar] [CrossRef]
  24. Chen, Z.; Yang, D. (Tony) Predicting Viscosities of Heavy Oils and Solvent–Heavy Oil Mixtures Using Artificial Neural Networks. J. Energy Resour. Technol. 2021, 143, 113001. [Google Scholar] [CrossRef]
  25. Zhang, J.; Feng, Q.; Zhang, X.; Zhang, X.; Yuan, N.; Wen, S.; Wang, S.; Zhang, A. The use of an artificial neural network to estimate natural gas/water interfacial tension. Fuel 2015, 157, 28–36. [Google Scholar] [CrossRef]
  26. Ma, Z.; Leung, J.Y.; Zanon, S. Practical Data Mining and Artificial Neural Network Modeling for Steam-Assisted Gravity Drainage Production Analysis. J. Energy Resour. Technol. 2017, 139, 032909. [Google Scholar] [CrossRef]
  27. Le Van, S.; Chon, B.H. Effective Prediction and Management of a CO2 Flooding Process for Enhancing Oil Recovery Using Artificial Neural Networks. J. Energy Resour. Technol. 2017, 140, 032906. [Google Scholar] [CrossRef]
  28. Agwu, O.E.; Akpabio, J.U.; Alabi, S.B.; Dosunmu, A. Artificial intelligence techniques and their applications in drilling fluid engineering: A review. J. Pet. Sci. Eng. 2018, 167, 300–315. [Google Scholar] [CrossRef]
  29. Network, N.; Alade, O.; Shehri, D.A.; Mahmoud, M.; Sasaki, K. Viscosity–Temperature–Pressure Relationship of Extra-Heavy Oil (Bitumen): Empirical Modelling. Energies 2019, 12, 2390. [Google Scholar]
  30. Thanh, H.V.; Sugai, Y.; Sasaki, K. Application of artificial neural network for predicting the performance of CO2 enhanced oil recovery and storage in residual oil zones. Sci. Rep. 2020, 10, 18204. [Google Scholar] [CrossRef]
  31. Al-Fattah, S.; Startzman, R. Predicting Natural Gas Production Using Artificial Neural Network. In Proceedings of the SPE Hydrocarbon Economics and Evaluation Symposium, Houston, TX, USA, 15–16 October 2018. [Google Scholar]
  32. Li, X.; Miskimins, J.; Hoffman, B.T. A Combined Bottom-hole Pressure Calculation Procedure Using Multiphase Correlations and Artificial Neural Network Models. In Proceedings of the SPE Annual Technical Conference and Exhibition, Amsterdam, The Netherlands, 27–29 October 2014; Volume 2, pp. 1358–1369. [Google Scholar]
  33. Ghaffarian, N.; Eslamloueyan, R.; Vaferi, B. Model identification for gas condensate reservoirs by using ANN method based on well test data. J. Pet. Sci. Eng. 2014, 123, 20–29. [Google Scholar] [CrossRef]
  34. Adeeyo, Y.A.; Saaid, I.M. Artificial Neural Network Modelling of Viscosity at Bubblepoint Pressure and Dead Oil Viscosity of Nigerian Crude Oil. In Proceedings of the SPE Nigeria Annual International Conference and Exhibition, Lagos, Nigeria, 31 July–2 August 2017; pp. 95–106. [Google Scholar] [CrossRef]
  35. Kiss, A.; Fruhwirth, R.K.; Pongratz, R.; Maier, R.; Hofstätter, H. Formation Breakdown Pressure Prediction with Artificial Neural Networks. In Proceedings of the SPE International Hydraulic Fracturing Technology Conference and Exhibition, Muscat, Oman, 16–18 October 2018. [Google Scholar]
  36. Elkatatny, S.; Tariq, Z.; Mahmoud, M. Real time prediction of drilling fluid rheological properties using Artificial Neural Networks visible mathematical model (white box). J. Pet. Sci. Eng. 2016, 146, 1202–1210. [Google Scholar] [CrossRef]
  37. Amar, M.N.; Ghahfarokhi, A.J.; Ng, C.S.W.; Zeraibi, N. Optimization of WAG in real geological field using rigorous soft computing techniques and nature-inspired algorithms. J. Pet. Sci. Eng. 2021, 206, 109038. [Google Scholar] [CrossRef]
  38. Amar, M.N.; Ghriga, M.A.; Ouaer, H. On the evaluation of solubility of hydrogen sulfide in ionic liquids using advanced committee machine intelligent systems. J. Taiwan Inst. Chem. Eng. 2021, 118, 159–168. [Google Scholar] [CrossRef]
  39. Hemmati-Sarapardeh, A.; Varamesh, A.; Amar, M.N.; Husein, M.M.; Dong, M. On the evaluation of thermal conductivity of nanofluids using advanced intelligent models. Int. Commun. Heat Mass Transf. 2020, 118, 104825. [Google Scholar] [CrossRef]
  40. Amar, M.N.; Zeraibi, N.; Redouane, K. Optimization of WAG Process Using Dynamic Proxy, Genetic Algorithm and Ant Colony Optimization. Arab. J. Sci. Eng. 2018, 43, 6399–6412. [Google Scholar] [CrossRef]
  41. Mahdaviara, M.; Amar, M.N.; Hemmati-Sarapardeh, A.; Dai, Z.; Zhang, C.; Xiao, T.; Zhang, X. Toward smart schemes for modeling CO2 solubility in crude oil: Application to carbon dioxide enhanced oil recovery. Fuel 2021, 285, 119147. [Google Scholar] [CrossRef]
  42. Hemmati-Sarapardeh, A.; Varamesh, A.; Husein, M.M.; Karan, K. On the evaluation of the viscosity of nanofluid systems: Modeling and data assessment. Renew. Sustain. Energy Rev. 2018, 81, 313–329. [Google Scholar] [CrossRef]
  43. Gevrey, M.; Dimopoulos, I.; Lek, S. Review and comparison of methods to study the contribution of variables in artificial neural network models. Ecol. Model. 2003, 160, 249–264. [Google Scholar] [CrossRef]
  44. Elsharkwy, A.; Gharbi, R. Comparing classical and neural regression techniques in modeling crude oil viscosity. Adv. Eng. Softw. 2001, 32, 215–224. [Google Scholar] [CrossRef]
Figure 1. Schematic of the experimental setup for measuring the viscosity of diluted bitumen.
Energies 14 08520 g001
Figure 2. Schematic showing a typical structure for a feedforward neural network (a), and a flow chart of its operational procedure (b).
Energies 14 08520 g002
Figure 3. Rheology of the crude oils [11].
Energies 14 08520 g003
Figure 4. A plot of the experimental against the predicted bitumen viscosity using both Equation (1) and the ANN.
Energies 14 08520 g004
Figure 5. Influence of temperature on the viscosity of the crude oils and their mixtures.
Energies 14 08520 g005
Figure 6. Effect of temperature on the viscosity of the crude oils and their mixtures. (a) BT; (b) LO; (c) M1; (d) M2; (e) (M3).
Energies 14 08520 g006
Figure 7. How bitumen mass fraction affects mixture viscosity.
Energies 14 08520 g007
Figure 8. Comparison of the ANN- and empirical-model-predicted values to the experimentally obtained results.
Energies 14 08520 g008
Figure 9. Comparison of the ANN- and empirical-model-predicted values to the literature data.
Energies 14 08520 g009
Figure 10. ANN regression plots for the experimental data. (a) Model Accuracy (b) Model Loss.
Energies 14 08520 g010
Figure 11. ANN regression plots for the Al-Besharah data. (a) Model Accuracy (b) Model Loss.
Energies 14 08520 g011
Table 1. The samples in this study based on weight fractions.
CodeBitumen (wt. %)Light Oil (wt. %)API Gravity (°) at 16 °CSpecific Gravity at 16 °CDensity (g/cc) at 16 °C
BT100-7.391.01881.0177
M1257510.940.99340.9923
M2336710.570.9960.9949
M3505010.100.99930.9982
LO-100320.8660.865
Table 2. Experimental viscosity measurements.
P (MPa)T (°C)Viscosity (mPa.s)
BTM1M2M3LO
0.114540,845.3291.2403.61060.18.1
1.5149,067.5334.5463.61191.47.8
3.1455,614.4369.5494.81313.97.6
4.5358,600.7399.2527.41402.47.4
6.0561,416.2402.5559.31485.17.4
0.125511,694.1126.7154.3493.26.9
1.5513,002.6135.4168.5544.16.7
3.1114,267.8143.7189.3589.46.6
4.5115,023.5150.7197.8653.66.5
6.0916,551.9156.9206.4680.66.5
0.13752035.228.930.4108.46.1
1.542306.432.133.9118.45.9
3.152401.635.536.7129.65.9
4.542498.837.637.9137.25.6
6.142570.539.139.5144.95.5
0.1590834.45.727.2334.44.9
1.55888.65.887.7735.84.7
3.12946.26.197.9637.24.6
4.56989.66.388.0638.64.5
6.051031.56.798.1639.94.5
0.12110374.12.812.928.042.6
1.53382.92.842.988.242.5
3.13387.62.863.018.472.4
4.55392.82.863.028.632.5
6.11411.52.873.028.762.3
Table 3. Backward stepwise sensitivity analysis of the input parameters.
ANN Model NumberBitumen Mass FractionLight Oil Mass FractionTemperaturePressureRMSE
1-YesYesYes0.164463
2Yes-YesYes0.011817
3YesYes-Yes0.176884
4YesYesYes-0.056811
(-) indicates the eliminated parameter.
Table 4. Summary of the statistical results of the ANN using experimental data.
TrainTestNorm
R20.999520.998620.99804
RMSE0.158790.099760.14344
%AAD0.041840.033440.03929
The norm represents the normalized data.
Table 5. Summary of the statistical results of the ANN model using literature data.
TrainTestNorm
R20.9987190.9652560.986021
RMSE0.0781120.2105050.157901
%AAD0.0026290.0202570.007977
Table 6. Using experimental data to compare the accuracy of the models.
R2%AADRMSE
ANN0.99893.92870.1434
MVDM0.98727.323334.4812
RVDM0.973210.573744.8867
Table 7. A summary of the saved model that was reloaded for use with new data.
Layer (Type)Output ShapeParameters
dense_30 (Dense)(None, 100)500
dense_31 (Dense)(None, 100)10,100
dense_32 (Dense)(None, 1)101
Total parameters: 10,701; trainable parameters: 10,701; non-trainable parameters: 0.
Table 8. Using Al-Besharah data to compare the accuracy of the models (limited data).
R2%AADRMSE
ANN0.99870.79770.1579
MVDM0.99623.74676.9133
RVDM0.99154.15126.8167
AL-BESHARAH0.98443.5016.7942
Publisher’s Note: MDPI stays neutral with regard to jurisdictional claims in published maps and institutional affiliations.

