1. Introduction
With increasing concerns about climate change, continued emissions of greenhouse gases, and the depletion of fossil fuels, the electric vehicle (EV) has attracted a lot of attention as competitive means of green transportation. In a recent survey, reduced pollution was the most common response concerning their environmental benefits, followed by their economic benefits, quieter driving, and reduced on-the-road costs (tax, fuel) [
1].
Recent research on the potential scale of EV penetration has revealed that EVs will have a large impact on the power grid with respect to peak power demand and localised power constraint issues. In the Global EV Outlook 2019 [
2], the EV stock (excluding two/three-wheelers) is expected to reach USD145 million in 2030 based on the Stated Policies Scenario, which is a model created by the IEA and reflecting the impact of existing policy frameworks and newly announced policy intentions; meanwhile in EV30@30, a collective aspirational goal has been set for EVs (excluding two/three-wheelers) to reach a 30% sales share by 2030 across all signatory countries. More EVs on the roads will require more EV charging points and lead to a significant increase in electricity demand. Estimated data show that globally, EV charging consumed 58 TWh of electricity in 2018 [
2]. According to [
3], in the UK, by 1 October 2019, there were 15,116 public EV charging devices available; among these, 2495 were rapid devices with the total number of public charging devices growing by 312% since 2015.
The growth in electricity demand from EVs poses significant challenges to local power distribution, such as transformer overloading, power quality problems, and electricity generation adequacy [
4,
5]. Smart EV charging (SEC) by coordinating EV charging with the local power grid can help solve these challenges. In brief, SEC can be one of two types of control method: decentralised and centralised methods. The decentralised control method distributes the computational load to individual EV charging points [
6] and is more convenient to manage and install for private usage; however, due to the lack of global coordination, decentralised charging cannot achieve system-wide optimality. In contrast, a centralised method builds the connections between electricity markets and vehicle owners, and then contracts the power demands of EVs via aggregators, enabling the management of charging power across a wide population of EVs [
7,
8].
Many papers have discussed EV charging management using decentralised and centralised methods: the decentralised methods achieve “valley-filling” in [
6,
9,
10], which flattens the load profile by filling the valleys of load curves, for example, scheduling EV charging from midnight to dawn to fill the overnight valley with increased power demand. References [
11,
12] provided a decentralised charging strategy that optimises charging profiles for the next day through a negotiation process between the grid and EVs based on the prediction of the inelastic base load profile (non-EV load) of the grid. The next day, the optimised charging profiles are used to schedule EV charging, aiming to flatten the total load curve (base load plus aggregate EV load). However, the optimisation requires very accurate load profile forecasts and all the EV charging demand must be known prior [
13]. In [
14,
15], decentralised charging control based on frequency regulation was introduced, where EVs act as the energy producers or consumers through bi-directional power transfer which can prevent the grid frequency deviating from its nominal when demand and supply are unbalanced. The technical limitation of this method is that the total combined EV power is unknown (decentralised scenario) and this complicates the electrical grid operator’s efforts to balance the system.
Conventional centralised EV charging research mainly focuses on the optimisation of power management methods to achieve “valley-filling”. A receding horizon control framework was proposed in [
7], which is a general-purpose control scheme which makes a decision on EV charging strategies for each time step (e.g., every 10 min). It uses the prediction of the non-PEV load profile and charging demands of EVs connected inside this system within the pre-set prediction time horizon (e.g., 24 h) along with real-time charging power demand. In this framework, a two-stage hierarchical optimisation is introduced to calculate the energy constraints by utilising the charging information to reduce the computation complexity; however, the error in the forecasted data might bring uncertainties. Time-of-use pricing has been widely adopted in the electricity market [
16], and the difference between the retail electricity price and market price is employed to seek a balance between the achievable profit of EV park owners and the satisfaction of customers. Customers specify their charging requirement when they arrive at the EV charging park, and an admission control mechanism is introduced to guarantee that all admitted EVs can be charged to their targeted state of charge (SOC) before departure. EVs are refused entry if the algorithm calculates that their charging requirement will unbalance the current charging strategy and/or reduce potential profit.
Other research has incorporated photovoltaic generators (PV) and a battery energy storage system (BESS) into centralised EV charging to reduce the loads in high-power demand periods of the electrical grid. In [
17], the authors introduced an EV charging park with renewable energy and non-renewable energy supply, a group of EVs with an EV leader (this is considered an EV platoon) coming into the charging park, a queuing system that uses first-come-first-serve and random selection to pick platoons to charge from the waiting EV platoon queue. In the model, renewable energy is the main energy source to supply to the EVs, and if the EVs’ energy demand exceeds the generated renewable energy, the difference will be provided by a non-renewable feeder. However, PV power highly depends on the weather and season, once the EV energy demand is far higher than the real-time PV energy generation—this method has seen limited success in reducing the load on the grid. For PV systems, the need to manage demand for energy is important in order to make full use of the PV power generation, as the research in [
18] proposed a pricing scheme for demand management where the excess power generated by PV could best be managed by selling power to EV owners at lower prices. The research in [
19] adds an additional BESS for storing energy with the power transferring modes presented to address the energy flow among the assets, which are PV to EV, BESS to EV, PV to BESS, grid to EV, and PV to grid. The BESS exports power to EVs when PV is insufficient for EV charging, and it is charged by PV when there is surplus PV power after supporting EVs. In order to improve the power generation from PV to EV, the research in [
20,
21] applies the particle swarm and grey wolf optimisation algorithms on a PV system to find the maximum PV power generation for EVs. In [
22], the authors stored the energy in the BESS from the grid based on the pricing of the electricity market in Singapore. When the real-time electricity price is lower than a defined price, and the surplus PV energy cannot fill the BESS, the energy will be imported from the grid to the BESS, and this energy will be further used to charge EVs. This method enables the BESS to directly supply more energy to EVs to reduce electricity demand from the grid during high-load periods.
EV charging parks containing many EV charging points provide an opportunity to manage the energy flow compared to unmanaged isolated charging points. The centralised control of all EV charging points can support control for power-limited electricity feeders and provide V2G services. This centralised charging coordination can provide SEC and ancillary services such as frequency response to the grid [
17].
Grid frequency is not stable: is it the result of the balance of demand and generation. When demand is higher than generation, the frequency falls and vice versa. The National Grid Electricity System Operator (NGESO), or the ESO for Great Britain (GB), has the responsibility of maintaining the frequency of the national electricity transmission system within
of 50 Hz (49.5–50.5 Hz). The dynamic fast frequency response (DFFR) service is one of the grid-balancing services sourced by NGESO which aims to balance the grid in real-time operation [
23]. The NGESO pays for the DFFR service based on the working period and the available power for frequency response: for example, in March 2021, an average price of £11.2/MW of DFFR/h was paid to service providers based on the post-tender report from [
24].
Most research about EV charging parks and grid frequency response has not considered the ancillary service specifications and restrictions enforced by the national ESO. In contrast to other works in this field, a PV–BESS-based smart electrical car park (SECP) is introduced in this paper to provide the SEC and the DFFR service. Three efficient but straightforward power management methods for SECP are provided for limited electricity feeders. Meanwhile, a novel bi-directional electricity transfer method between the EV, grid, PV, and BESS is presented to construct an SEC system. In the DFFR service, the grid frequency is categorised into high-frequency zone (HFZ), deadband, and low-frequency zone (LFZ) with the SECP having the corresponding power management strategies for each zone. The advantage of the SECP is that it not only minimises the impact on the grid for the increasing power demand required for EV chargers, but also provides additional revenue opportunities for the owners of the SECP by providing services such as DFFR.
2. SECP Modelling and Operating Principles
This paper investigates the capability of a future car park with 100% penetration of EV charging to provide import/export power for grid frequency response services. This type of car park will be referred to as an SECP and will be defined as including a BESS and PV generation. This research is introduced through three parts; the first part introduces the modelling of the SECP and its working principles: the basic information of EVs, the PV panel, the BESS, and GB grid services. The second part is an analysis of the energy flow among the SECP assets in different situations, such as high-power demand periods or balancing service delivery periods. The final section simulates the SECP model under real-world conditions to observe the results, and then a sensitive analysis on the impact of the capacity and SOC of the BESS on EV charging efficiency and DFFR service quality.
In the first part, the SECP model is simulated in MATLAB, which is divided into three sections:
Estimation of the real-time charging power demand of EVs parked in the SECP;
The energy management system for the control of power flow between system assets;
Analysing the availability of the SECP for grid services.
2.1. EV Data and State Estimation
The real-time total charging power requirement of the SECP depends on the number of connected EVs, the charging power profile of each EV, and its current SOC. Therefore, the simulation of the SECP traffic flow and the SOC of each EV are required. In [
25], the SOC vs. the maximum acceptable charging power of the EV battery (
) is formulated to find the constraints of the EV charging.
is the maximum charging power controlled by the battery management system (BMS) of the EVs based on the charging method, temperature, etc. To model the sum
of all EVs at any point in time, the following information is necessary: the SOC of the EV on arrival (
), its period of stay (
), and the charging profile for the type of EV.
2.1.1. The SOC of the EV on Arrival ()
In this model, the SECP is the only parking and charging place in a commercial area for commuters of an average distance; most EV owners arrive and connect their EVs every day. The daily energy consumption of an EV is transferred to the equation below:
In Equation (
1),
is the average daily energy consumption for an EV (kWh),
represents the daily driving distance (miles), and
is the average energy consumption of different models of EVs (kWh/mile).
The vehicle mileage and occupancy in 2017 in the UK (seen in the first two columns of
Table 1) are reported by the UK Department of Transport [
26]; the middle value of each range of annual mileage is chosen to the represent the average annual mileage of an EV. Based on
of 0.304 kWh/mi of EVs in 2019 [
27] and Equation (
1),
is then calculated and shown in the third column in
Table 1. Therefore, the daily SOC drop of an EV (
) can be represented by
where
is the capacity of the EV battery in kWh. Subsequently,
can be represented as:
where
represents the SOC of an EV on its last departure.
is a random value based on the percentage in the second column of
Table 1.
2.1.2. The Period of Stay for an EV ()
To formulate
, the actual car park data (Hainault Station in London) from Transport for London [
28] were used.
can be represented as
and
are the times when an EV arrives at the SECP and departs the SECP, respectively. A probability density function is employed to randomly generate
and
for each EV based on the vehicle park in [
28], for example, from the traffic flow of the car park in [
28], at approximately 450 min, the highest number of vehicles arrives into the real car park, so
has the highest probability of being equal to 450 min in the traffic flow simulation. The
for each EV is then calculated based on Equation (
4), the simulation results of
,
, and
for all EVs have been demonstrated to be a good approximation of the original traffic flow in Hainault Station in previous work by the authors [
28].
2.1.3. The Charging Profile for the Type of EV
The charging profile includes the proportion of different EV models, and the profile of SOC vs. for each of them where is the EV charging power controlled by the EV’s battery management system (BMS).
In the SECP model, four types of EV were considered, which were a Nissan Leaf 24 kWh, Nissan Leaf 30 kWh, BMWi3 33 kWh, and Volkswagen Golf 26 kWh; the proportion of them in the SECP was based on their registration for the first time in GB in 2019, with the ratio of the Nissan pair, BMWi3, and Golf being 53:41:38, respectively [
29].
The SOC vs.
profiles for the different EV types were obtained from sources that experimentally measured this relationship under DC rapid charging [
30]; this charging method is faster and will become more common outside of domestic use compared to level 1 and level 2 charging [
28].
in the model can be calculated by a lookup table using the current SOC (
) of the EV against the SOC vs.
profile; for instance, a BMWi3 at 75% SOC will demand a
of 49 kW at that instant.
The research in [
25] proposed that the maximum charging power (
) of a single charging point for the charging process is:
where
means choosing the minimum value from
,
, and
as the output.
is the maximum charging power set by the EV user and
is the maximum output power of a charger.
In the SECP model, EV users are not allowed to choose
as forecasting
requires large amounts of customer data. Therefore, the system-allocated maximum charging power (
) is used to replace the
and
.
is the power allocated to each EV by the aggregator of the SECP in a fair way for each customer based on a set of possible battery management methods—these methods will be introduced in section three. For an SECP, the combined total EV charging power requirement could be very high, taking an example of 50 EVs, with the maximum charging power individually being 50 kW, the total potential maximum power requirement of the SECP reaches 2.5 MW. For a given SECP location, there is likely to be a limit on the power capacity due to local electrical network constraints; upgrade through re-enforcement is often physically complicated with long lead times and incurs a high cost. Furthermore, on the GB grid, connections are subject to a fixed capacity charge based on GBP/MW/day at the maximum potential power requirement, regardless of actual usage. Controlling
can reduce the peak power demand and therefore reduce the overall power requirements from the local power feeder, thus reducing this cost. Equation (
5) is then transferred to:
is then given as
T is the current time, and
represents the charging efficiency [
28].
2.2. Energy Management System
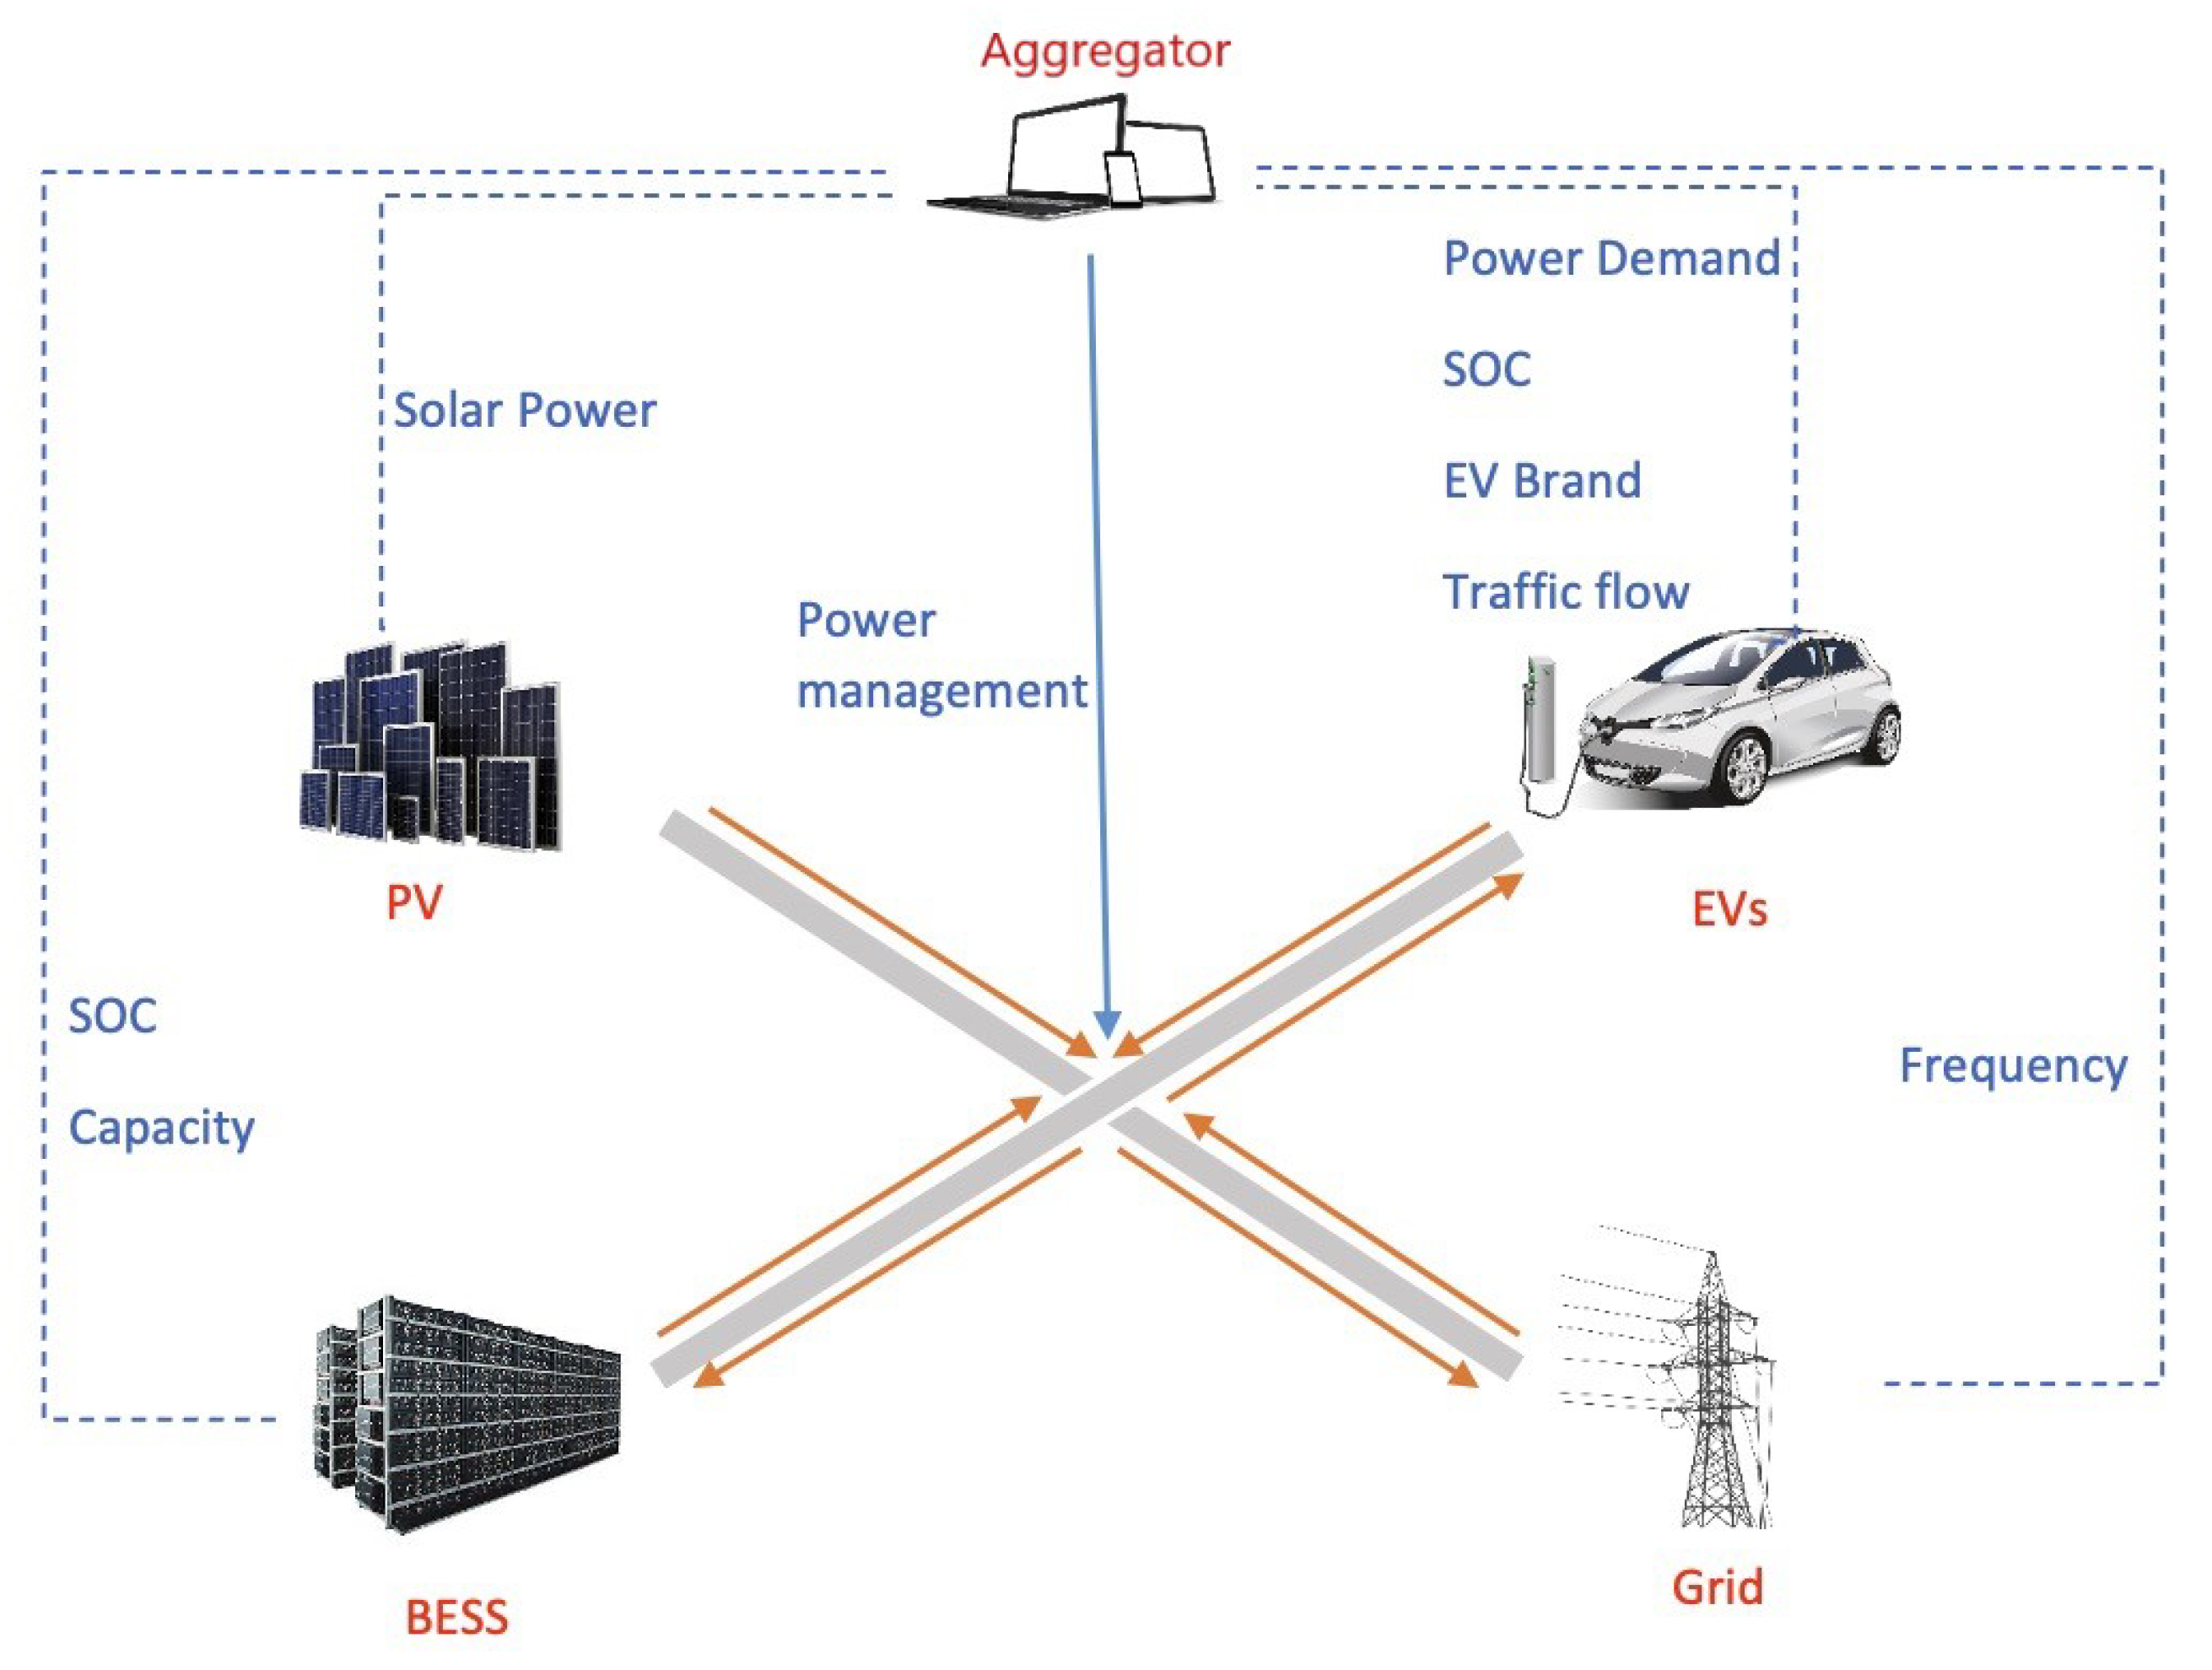
This SECP was constructed with an energy management system (EMS) that controls the power flow and collects operational data from the EVs, PV, BESS, and grid.
Figure 1 shows the proposed SECP system.
The PV system uses solar energy to generate power, and researcher in Australia [
31] and Iran [
32] have proven that the payback period for the initial investment of PV may be less than ten years for residential use, with the shortest possible payback period being 3 years for supporting grid functions. As a long-term investment, a PV system can support EV charging through renewable energy but it can also reduce the peak power demands of an SECP and hence reduce the capacity requirements of the grid.
In [
33], the capacity of a PV panel (
) is stated as approximately 150 Wp/m
–200 Wp/m
. In this work,
is set as the medium value 175 Wp/m
, PV power generation (
) varies with changes in solar irradiance, and normally cannot reach
. For example, the historical data of PV generation [
34] show that the recorded installed capacity of PV in the UK was 13.08 GWp by June 2021, and achieved a peak generation of 9.68 GW.
represents the relationship between the installed capacity of PV in the UK (
) and PV power generation which changes with time (
) by using the provided historical data set:
In the model, a PV canopy is over the car park spaces and the SECP only has a single floor. The area of the PV panel could be equal to the parking area which does not include the gap between the car park spaces. The UK standard single car park space size is 11.52 m
, and the
of the SECP changing with time (t) is then given as
where
N is the number of parking spaces,
represents the intensity of sunlight with a range from 0 to 1, calculated every minute based on the PV NEGSO supplied data for GB [
34].
2.3. The DFFR Specification
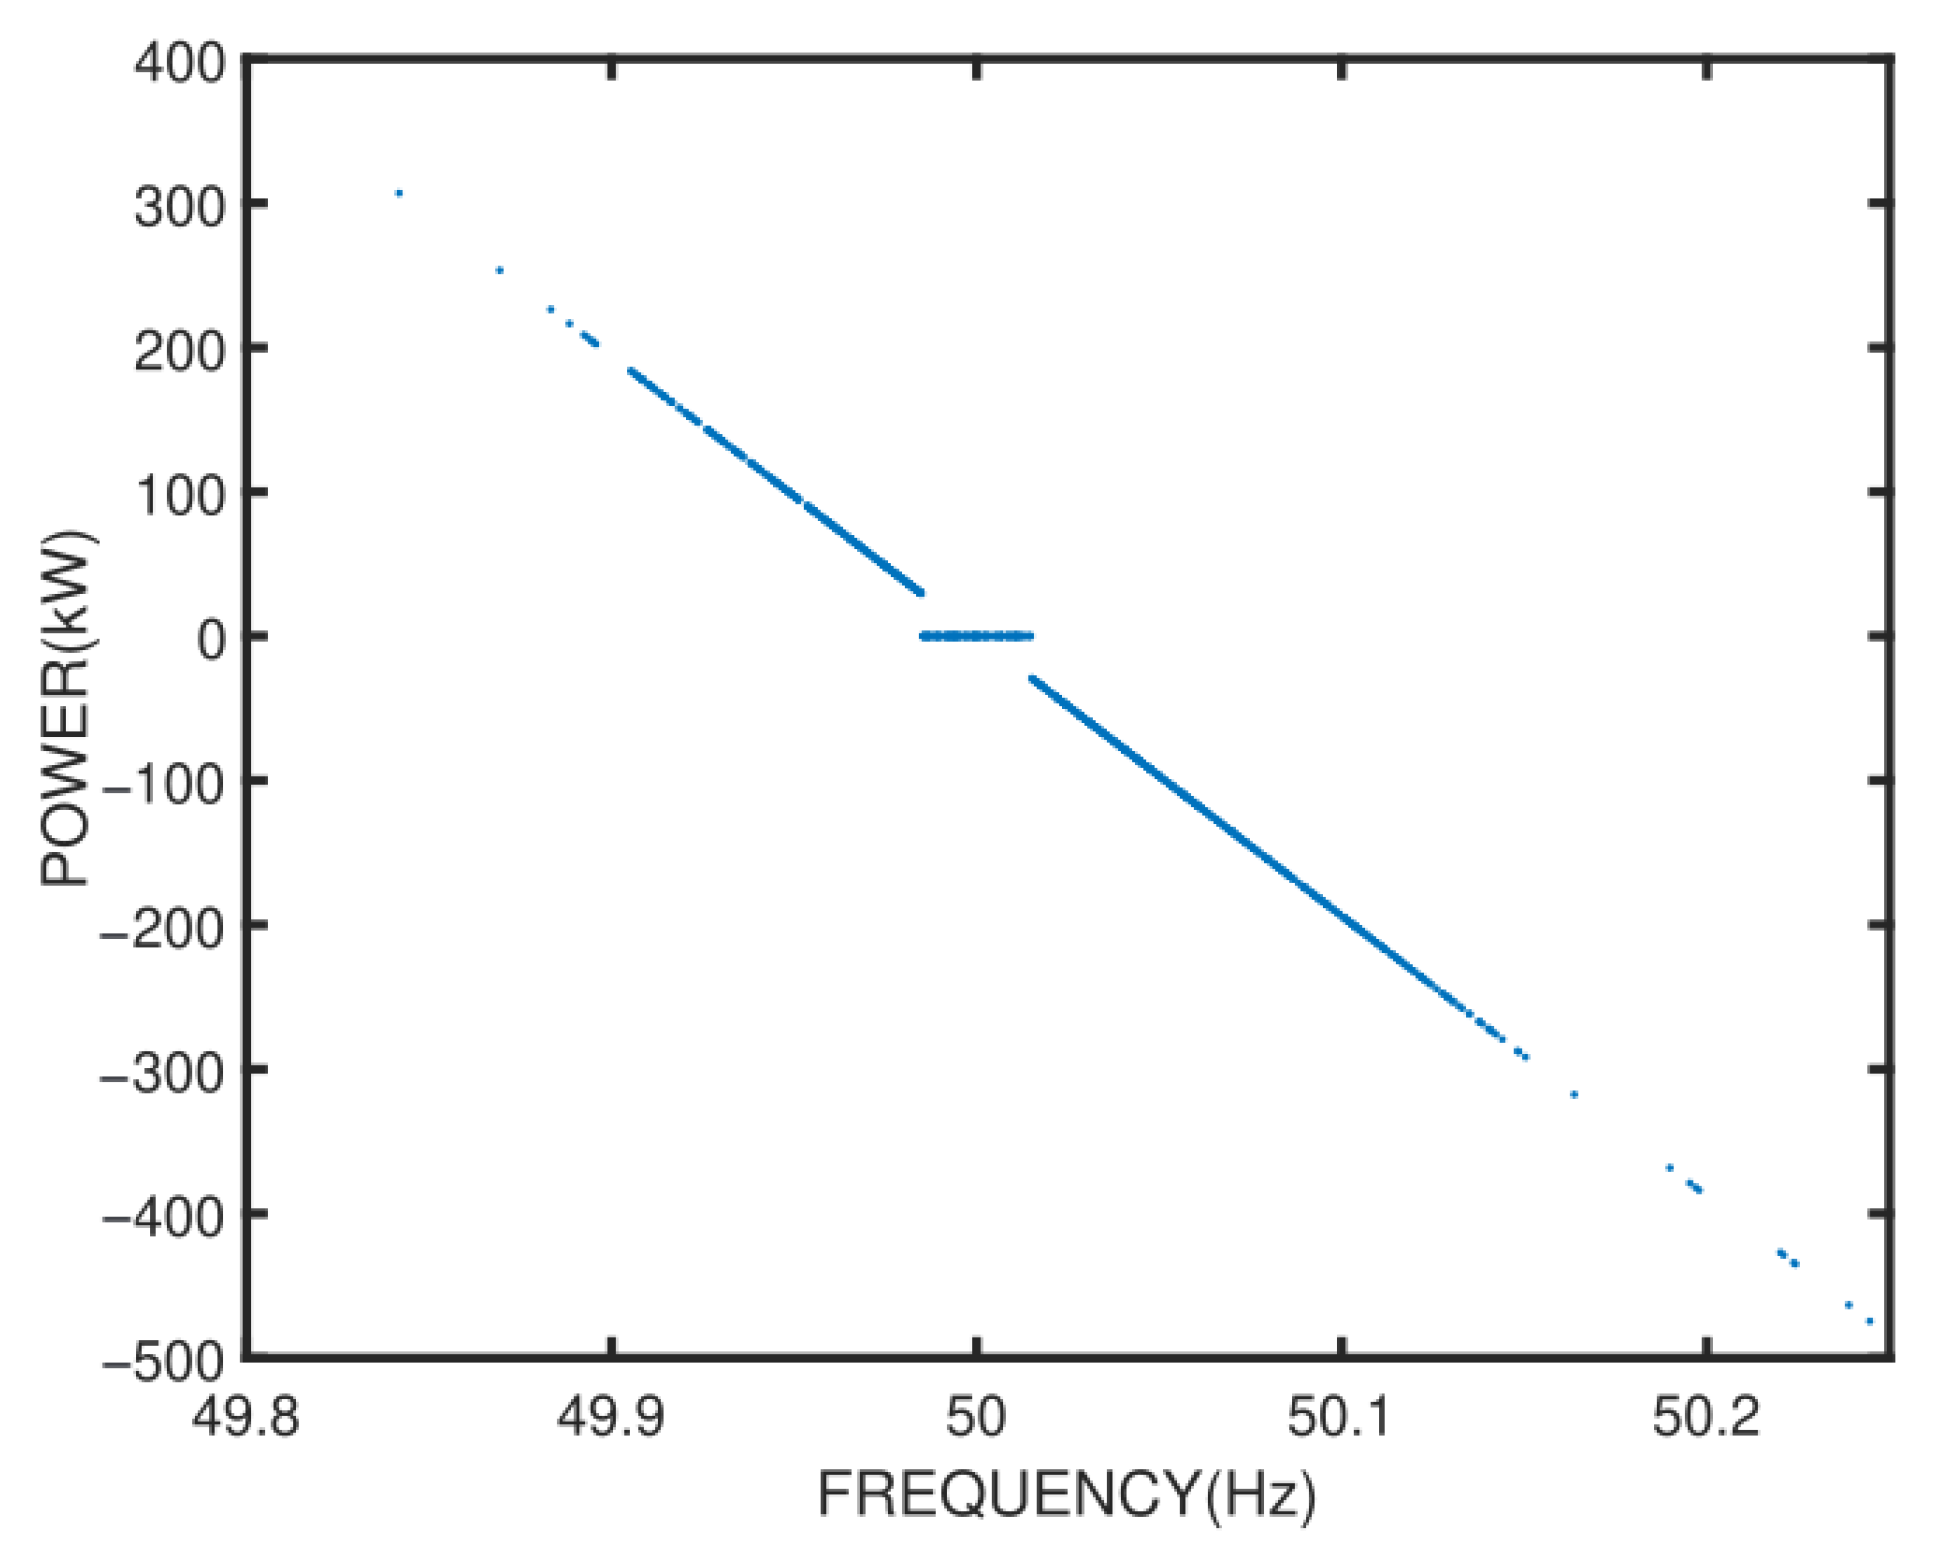
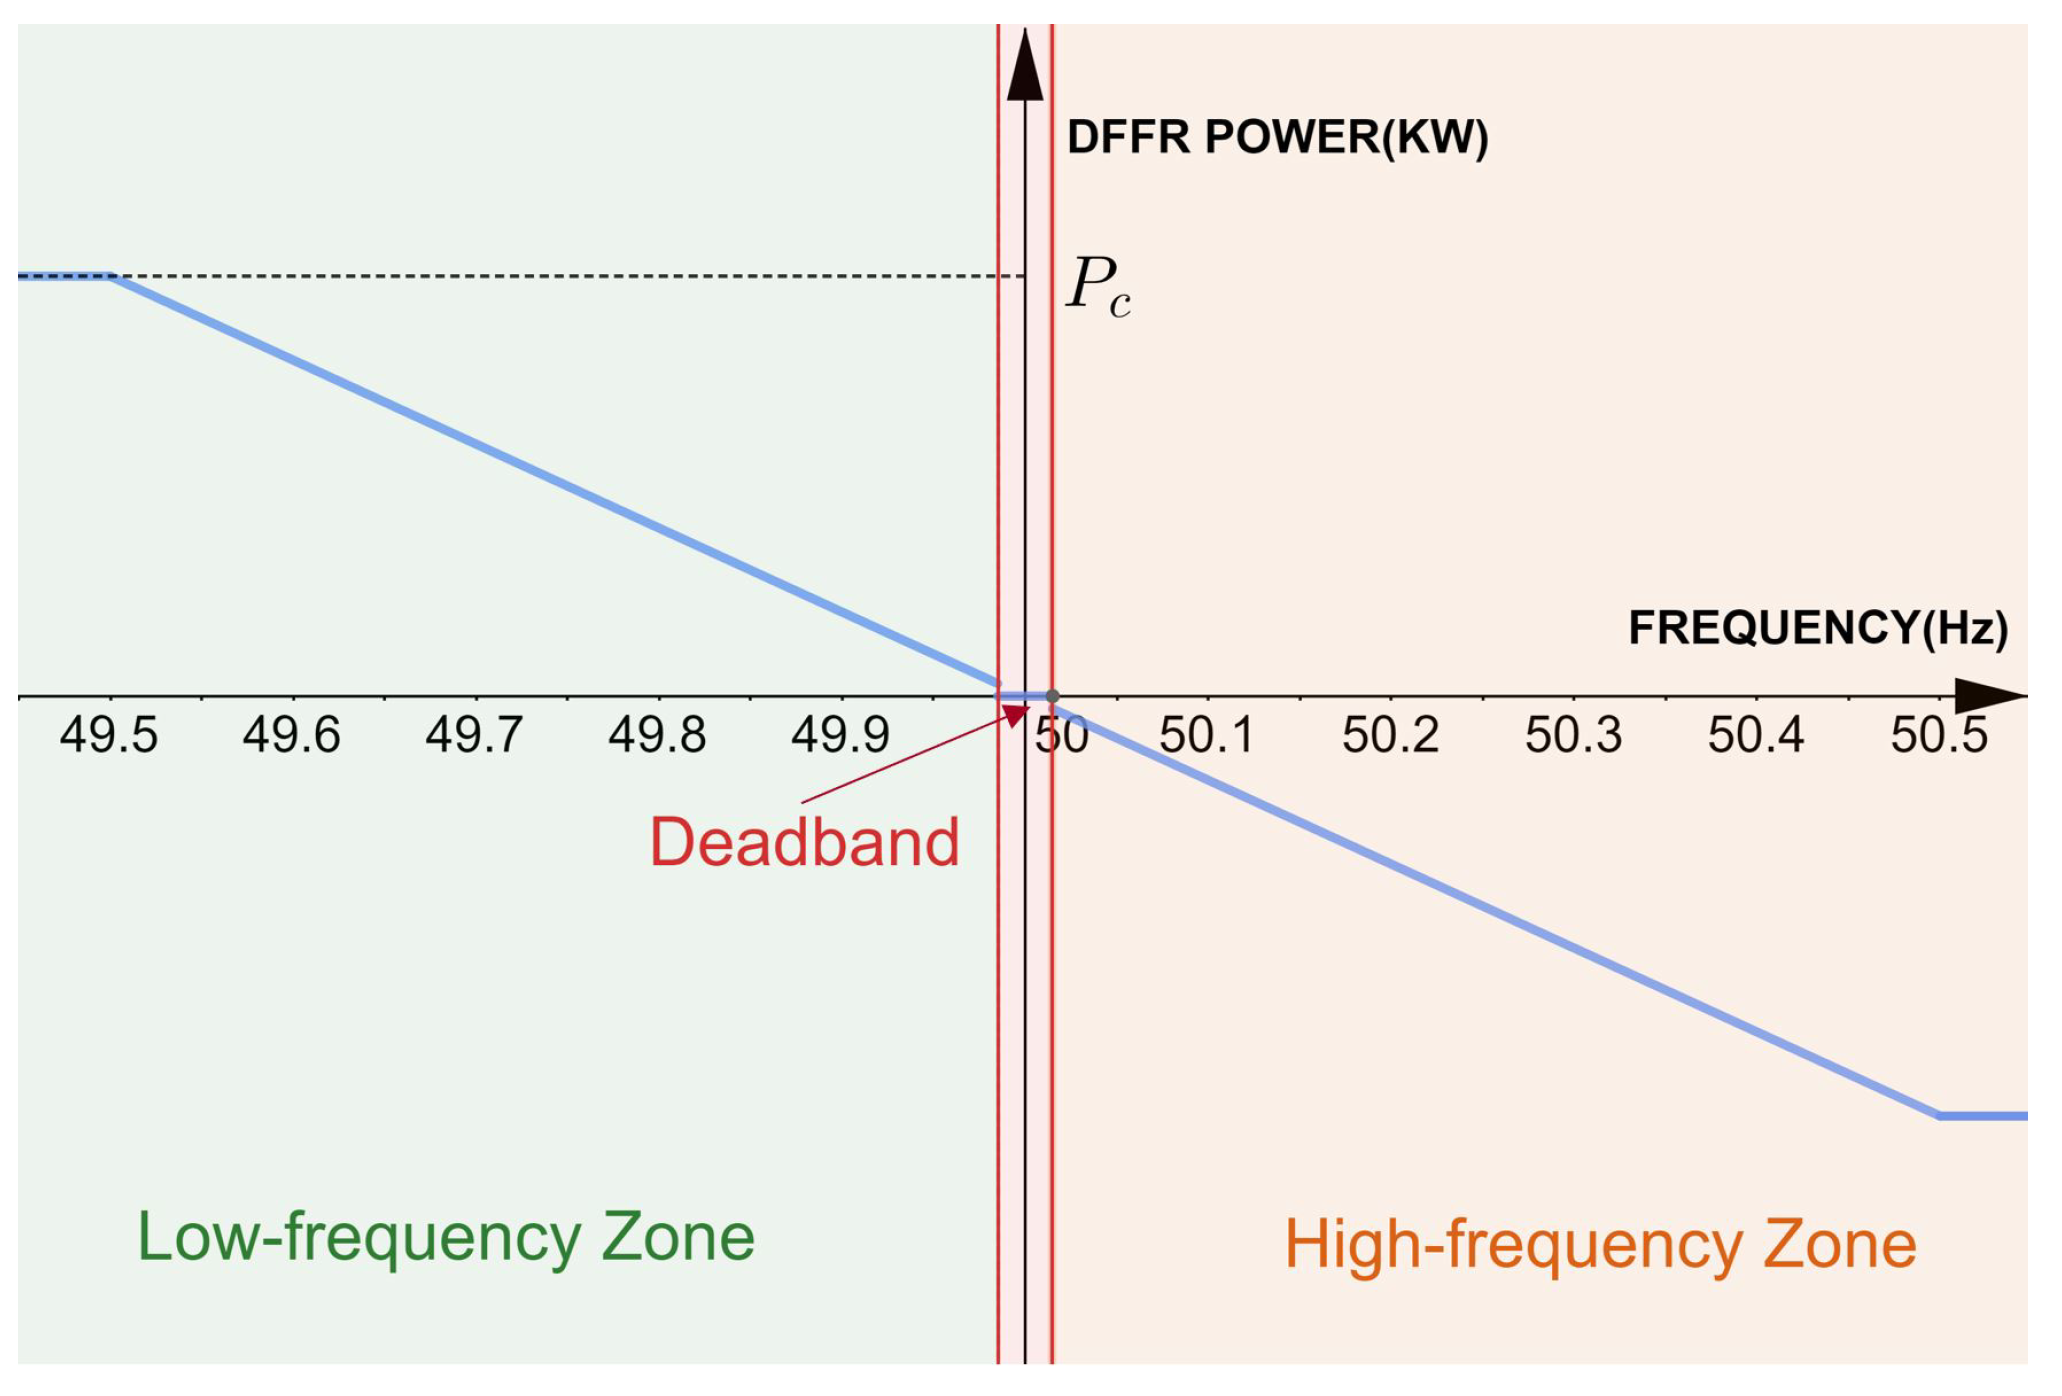
A generator or storage provider that delivers DFFR must provide a power response as frequency deviates from the deadband (49.985 Hz–50.015 Hz) offered by NGESO.
Figure 2 shows the envelope of this response: from the figure, 49.985 Hz and 50.015 Hz are two trigger points that divide the grid frequency into three zones. The HFZ represents the grid frequency and is higher than the 50.015 Hz where storage imports power from the grid, and DFFR power is negative. The LFZ occurs when grid frequency is lower than 49.985 Hz, storage exports power to the grid, and DFFR power is positive. The deadband is when the grid frequency is between the 49.985 Hz and 50.015 Hz, DFFR power remains at zero. NEGESO requires the provider to deliver a minimum of 1 MW response power and must sell in 1 MW increments for maintaining the grid frequency between 49.5 and 50.5 Hz, the response power that the provider has tendered is called the contracted power (
). The actual power required by DFFR based on the grid frequency (
) is given as
where
is the real-time grid frequency. Positive/negative
represents the provider exporting/importing power from the grid, respectively.
The SECP can be considered a complex energy storage system which contains many energy storage units represented by EV batteries and a BESS. These can be used to export/import electricity from the grid and provide the frequency response services. SECPs can generate additional revenue through the provision of frequency response services in addition to the parking and charging revenue.
In SECP, exporting electricity from EVs to provide grid services may lead to a lower SOC on departure than expected by the EV owner. The average daily energy consumption of the total annual mileage of EVs is calculated to be 6.72 kWh based on
Table 1. In order to ensure that EVs have enough electricity to support customers’ daily driving, the minimum SOC of an EV battery (
) can be calculated by
For the Nissan Leaf 24 kWh, Nissan Leaf 30 kWh, BMWi3 33 kWh, and Volkswagen Golf 26 kWh, the minimum SOCs are calculated to be 28%, 22.4%, 20.4%, 25.9%, respectively. This means that, in the SECP, if the SOC of an EV is lower than the minimum SOC, the EV will not be discharged for the grid service.
The SECP might not always meet
, failure happens when the PV generation, EVs, and the BESS cannot support enough power for DFFR. To measure this, DFFR availability (
) was used to evaluate the quality of the DFFR service:
where
F is the period during which failure happens and
Z is the period of DFFR. Taking an example of 100 min charging with three minutes’ failed service, then the availability is calculated to be 97%.
3. Energy Management and Power Flow
The SECP modelling has been described for the individual system components; now, the energy management and power flow between them is discussed.
3.1. Power Allocation to Parked EVs
Three basic energy management methods were implemented to allocate power to EVs referring to the previous work in [
28] by the authors. The first approach is proportional power control, in which power is shared among EVs based on their power requirements. The charging algorithm calculates each EV’s real-time power demand and sums them, if the total power requirements exceed the power allowance, then the surplus is considered as the total amount of power that must be recovered through all EVs. This amount will then be divided among the vehicles based on the proportion of each EV’s charging power to the overall charging power. For each EV, the final charging power is the power demand based on its SOC minus the share of the power surplus. The function of the method [
28] can be represented as
In this function, , , and represent the power which is given to the ith vehicle, the maximum power demand of the ith vehicle in this minute, and the total demand power of all EVs, respectively. L and S are the power limitation and the number of EVs in the SECP, respectively.
Compared with the first approach, the second approach [
28] is to divide and recover the surplus power of each EV according to their SOC proportion when the total power demand exceeds the power limit. The relationship can be represented as
In this function,
is the SOC of the
ith EV. The last approach [
28] was also focused on SOC proportion, but instead of spreading the surplus burden around the EVs when the demand power exceeds the limit, the total power limit is directly applied proportionally based on each EV’s SOC. The relationship is represented as follows:
The performance of these three methods can be found in [
28], so the details are not repeated here. In the SECP, the power limitation
L is the maximum total power which can be allocated to all EVs by the SECP. For example, at a certain time, the maximum power from the grid to all EVs is 30 kW, the maximum PV power which can be transferred to all EVs is 10 kW, and
L is their sum of 40 kW. The second method was chosen as the main method for use in this paper.
3.2. Power Management between the System Components
The power management in this section is considered for two grid-service scenarios—the DFFR period and non-DFFR period—with the SECP providing the DFFR service in the DFFR period and the non-delivery of the service in the non-DFFR period. It is possible in the GB electricity market to bid to deliver the DFFR service in timed windows.
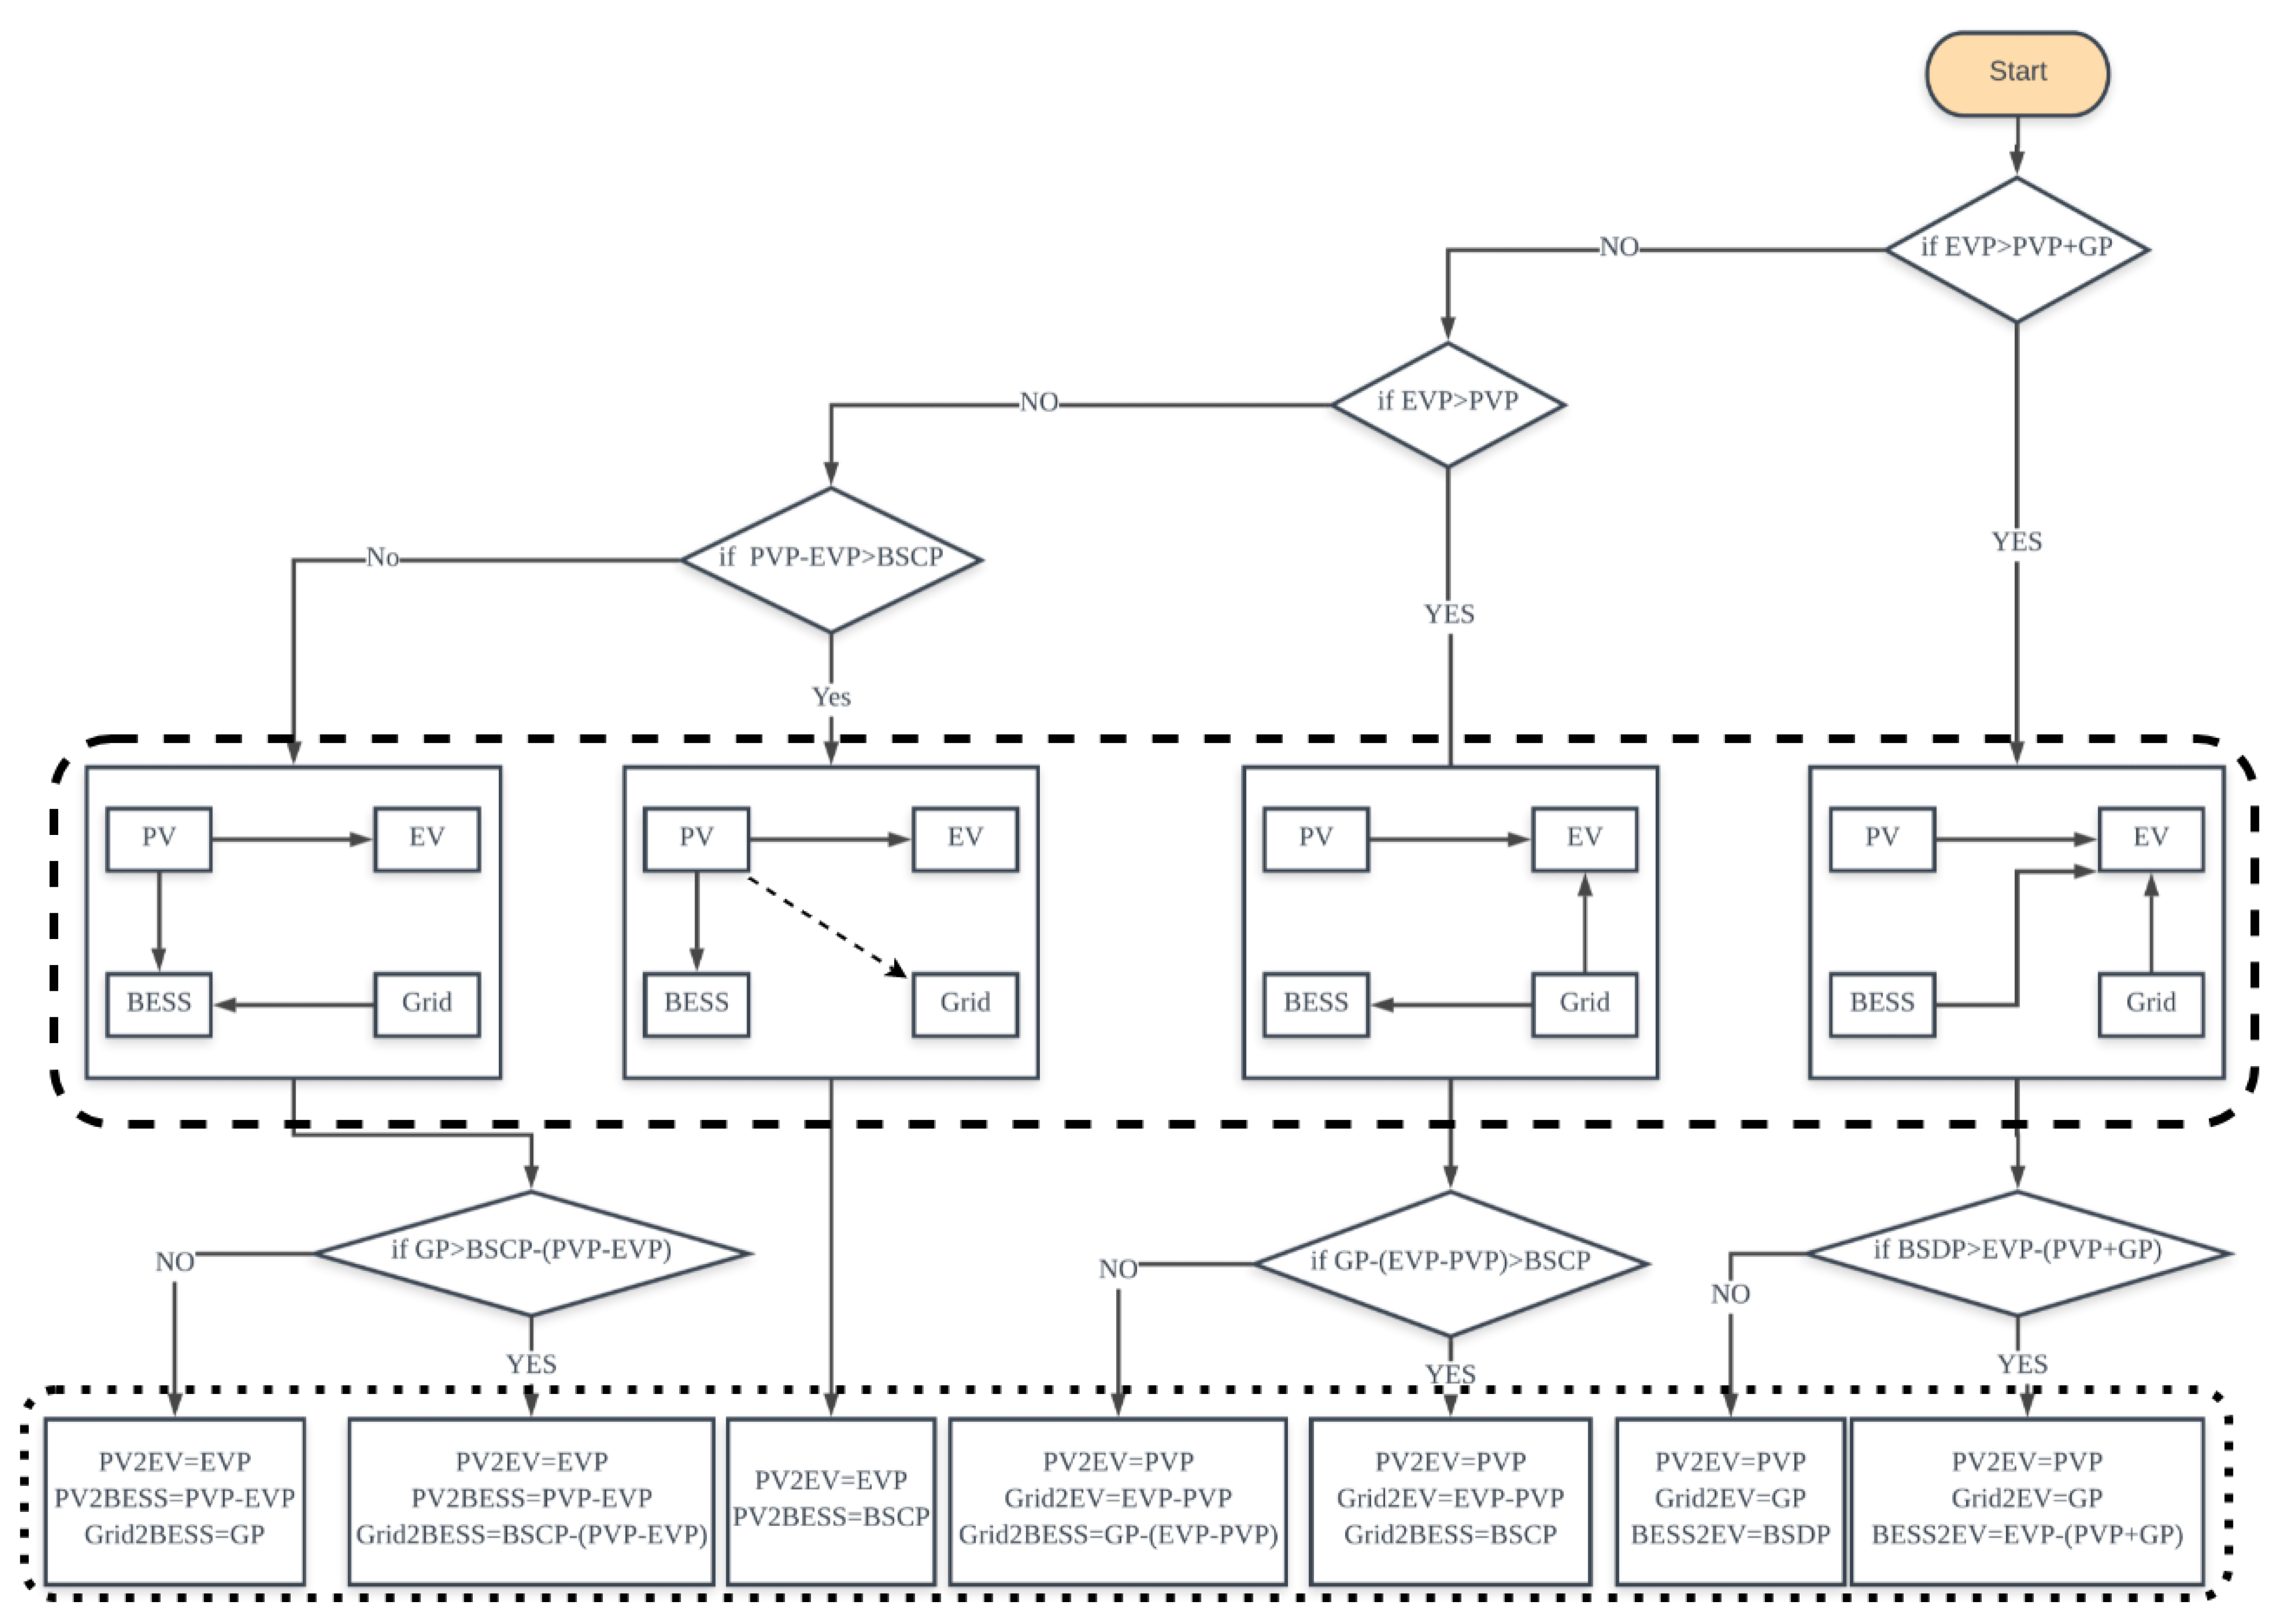
In the HFZ, the SECP must import contract power to support the grid, as
Figure 3 shows the energy flow with respect to power from the grid (GP), EVs (EVP), PV (PVP) and BESS. BSCP and BSDP represent the available power from the BESS for charging/discharging. ‘2’ in the middle of a word represents ‘to’, meaning power transfer (e.g., Grid2BESS means the power transferring from Grid to BESS). The contents inside the dashed box illustrate the energy flow between the PV, EV, BESS, and grid for each condition, whilst the bottom dotted box formulates the power.
In the HFZ case, the system first checks the constraints of EVP, PVP, and GP: if EVP is higher than the sum of the available power from both PVP and GP, the BESS will provide the power to the EVs, the BESS2EV depends on how much the BESS discharging power can support the EV charging. If EVP is lower than the sum of PVP and GP, but larger than PVP, some part of GP is provided then to the EVs, and the remaining GP will be used to charge the BESS. Grid2EV is EVP minus PVP, and if EVP plus BSDP is less than the GP, then DFFR cannot be delivered during this period and decreases. If EVP is less than the PVP, and the surplus PVP is also larger than the BSCP, SECP cannot deliver any response for DFFR, GP is zero, and decreases. The SECP can benefit from selling the surplus energy to the grid, but if the surplus power is less than BSCP, PV first charges the EVs, any surplus power and GP will charge the BESS, and the decreases when GP is higher than the BSCP minus the PVP.
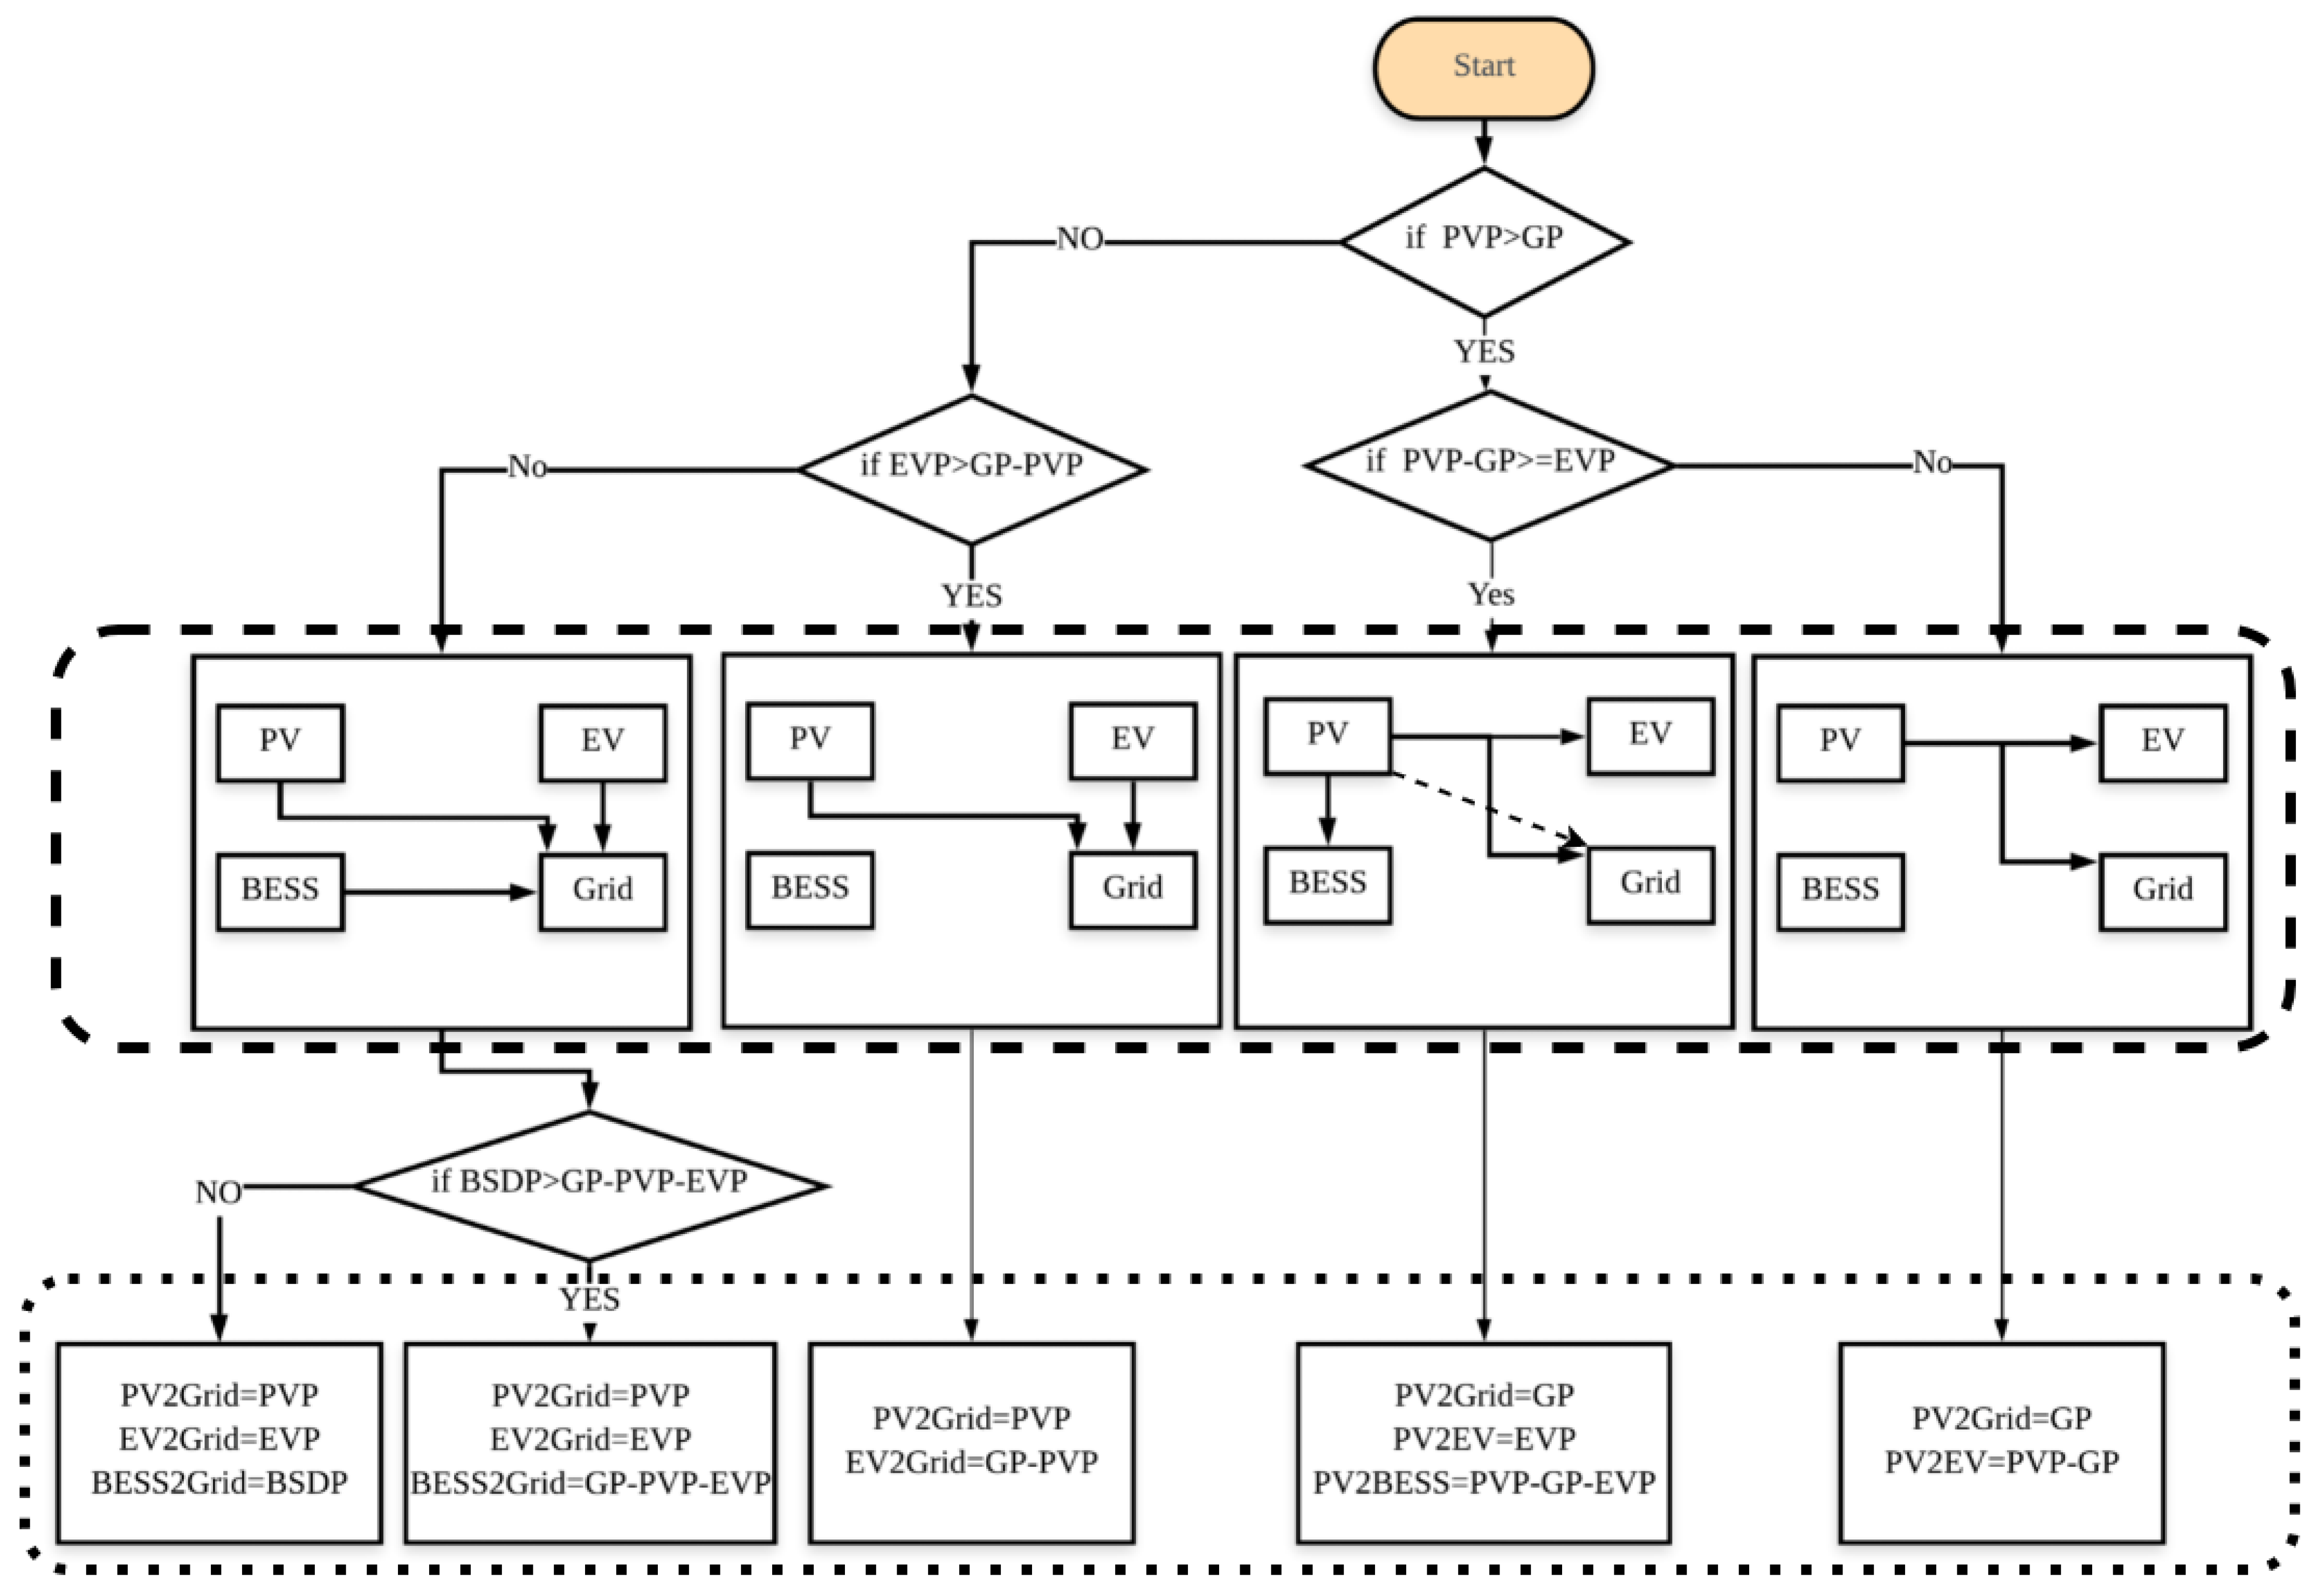
In the LFZ, SECP must export the contracted power: in this case, the PV is first considered to export power to the grid, what remains will power the EVs, and any further remaining power will charge the BESS and sell to the grid. EV is the second power source for exporting energy when the PVP is less than GP. If there is still not enough power, BESS is the last power source for the LFZ. The service is unavailable when the total exported power capability cannot meet the contracted power GP.
Figure 4 shows the details of how the system operates in the LFZ.
SECP operating in the deadband region results in BESS and PV being the only sources of power for EV charging, with PV being the priority power source. The excess PV power will be used to charge BESS. If both sources cannot charge all EVs to maximum power, then the EV charging power will be reduced through management as per Equation (
17).
Based on an analysis of past tenders, from 11 p.m. to 7 a.m. and from 7 a.m. to 11 p.m. are commonly tendered periods for DFFR delivery. As there are almost no EVs parking during the overnight period (based on the collected car park data) an SECP is not advantageous overnight (compared to a standalone battery) as EVs cannot support the DFFR service as energy storage units. Therefore, the DFFR delivery period is set to between 7 a.m. and 11 p.m.; at other times, the grid connection can be used without restriction as it does not deliver the DFFR service. This is therefore used to manage the SOC of the BESS in preparation for the next day.
In the non-DFFR service period, the PV first transfers energy to the EVs, then to the BESS. If PV cannot provide enough power to EVs, GP will support the rest; however, this period happens in the night from 11 p.m. to 7 a.m.; therefore, with PVP being close to zero and most EVs having exited or fully charged, the charge power profile is likely to remain flat, whilst the BESS will be charged or discharged to a defined SOC overnight.
4. Results
This paper first tested the SECP aggregated with the PV–BESS providing DFFR services to establish whether an SECP can provide DFFR whilst maintaining the charging of EVs. A real-time charging scenario is provided, the unit of time is a minute, and
Table 2 shows the main parameters of the test. Here, we simulate the model with the lowest contractable power unit of 1 MW as set by NGESO. According to
Figure 2 and Equation (
10),
is only 1 MW when the grid frequency is higher than 50.5 Hz or lower than 49.5 Hz, which occurs only rarely, and analysing historical frequency data shows that in reality,
will average at approximately 5% of the contracted power or 50 kW in this example. The battery’s capacity is set as 2 MWh and the simulation period is one day.
The results are shown in
Figure 5, the first of five figures showing the grid frequency (
) and the local feeder power (
), where a negative value corresponds to the SECP importing energy from the feeder, positive represents the SECP exporting energy from the feeder, and the third represents the generated PV power (
). The last two figures are the EVs’ total power demand (
) and BESS power demand (
), respectively, where a positive value represents the EVs or the BESS charging, and discharging is indicated by a negative value. The two red lines represent the trigger points (49.985 Hz and 50.015 Hz) in the grid frequency graph; four time points were chosen to refer to the four charging periods (grey lines) with the data shown in
Table 3. At the first charging point (5 h 33 min), the system was operating in the non-DFFR period,
is 142 kW, and 0 kW is from PV, the rest is from the grid, the BESS is not charging during this period. The second charging point (9 h 15 min) is in the HFZ, the grid at 50.13 Hz demands an import power of 253 kW to the SECP based on Equation (
10), and 3.398 kW is generated by PV; however, at this moment, the maximum charging power of all the EVs is 134.6 kW, so
and 131.2 kW of
are used to support the EV charging, and the rest of
is allocated to the BESS. The third charging point (11 h 53 min) is during the deadband zone, DFFR does not allow one to import or export power from the grid, and the demand power from the grid is therefore 0 kW, whilst
(28.39 kW) and
(−500 kW) is used for EV charging. At the last point (14 h 58 min), the system is operating in the LFZ using Equation (
10), where
is 203.7 kW, which is from the PV (8.701 kW) and EVs (−195 kW).
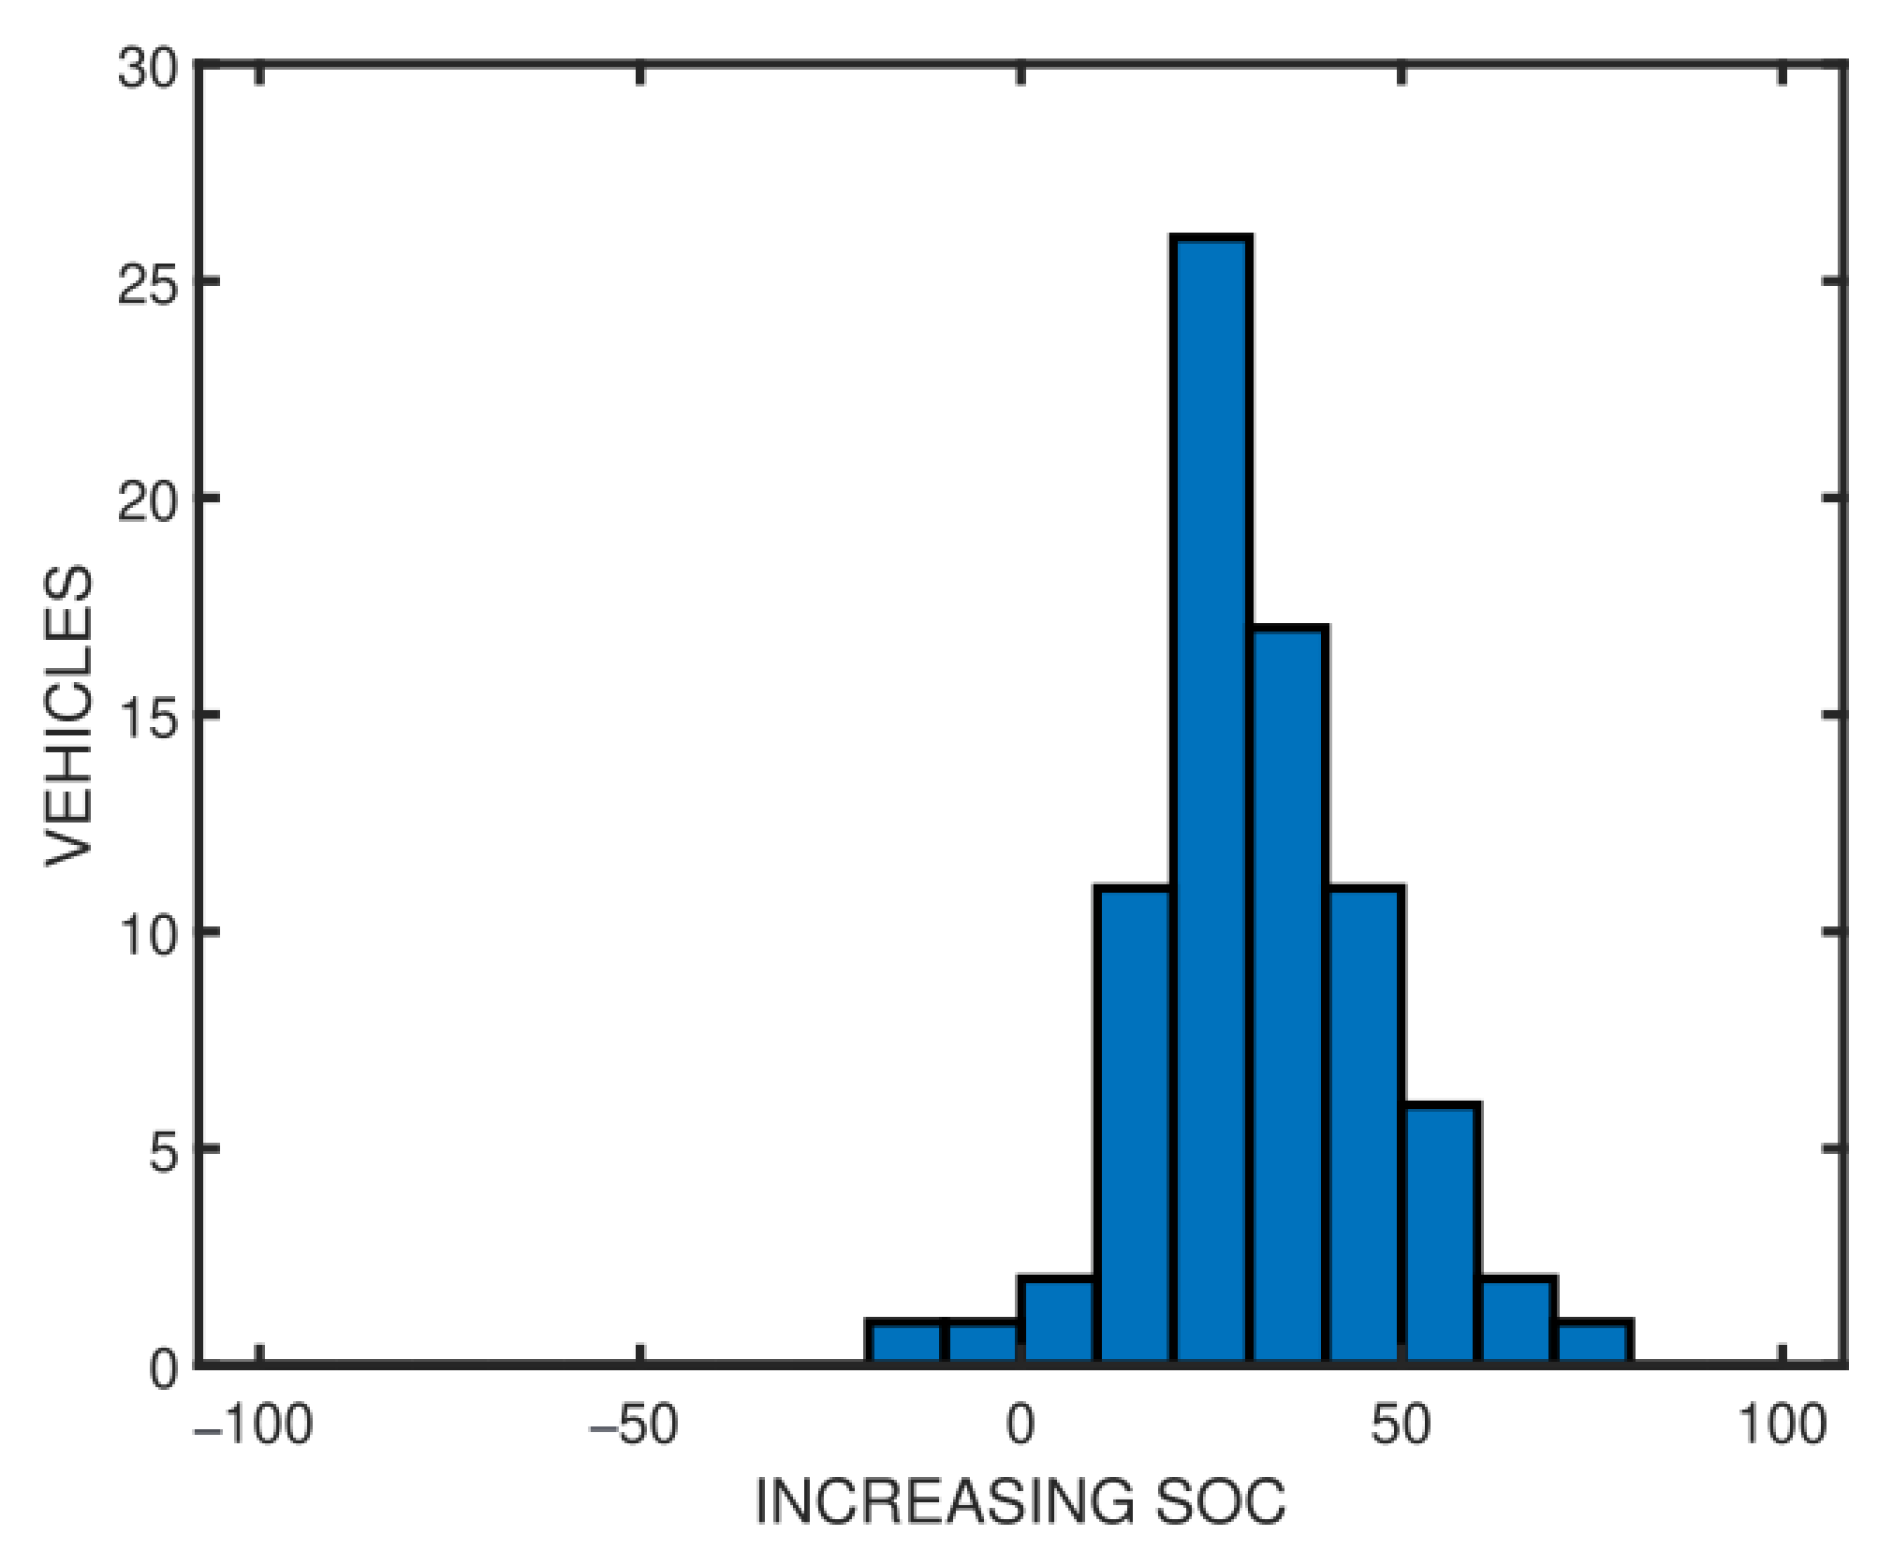
Figure 6 is the DFFR power response,
Figure 7 represents the value of the increasing SOC referring to the number of EVs, and
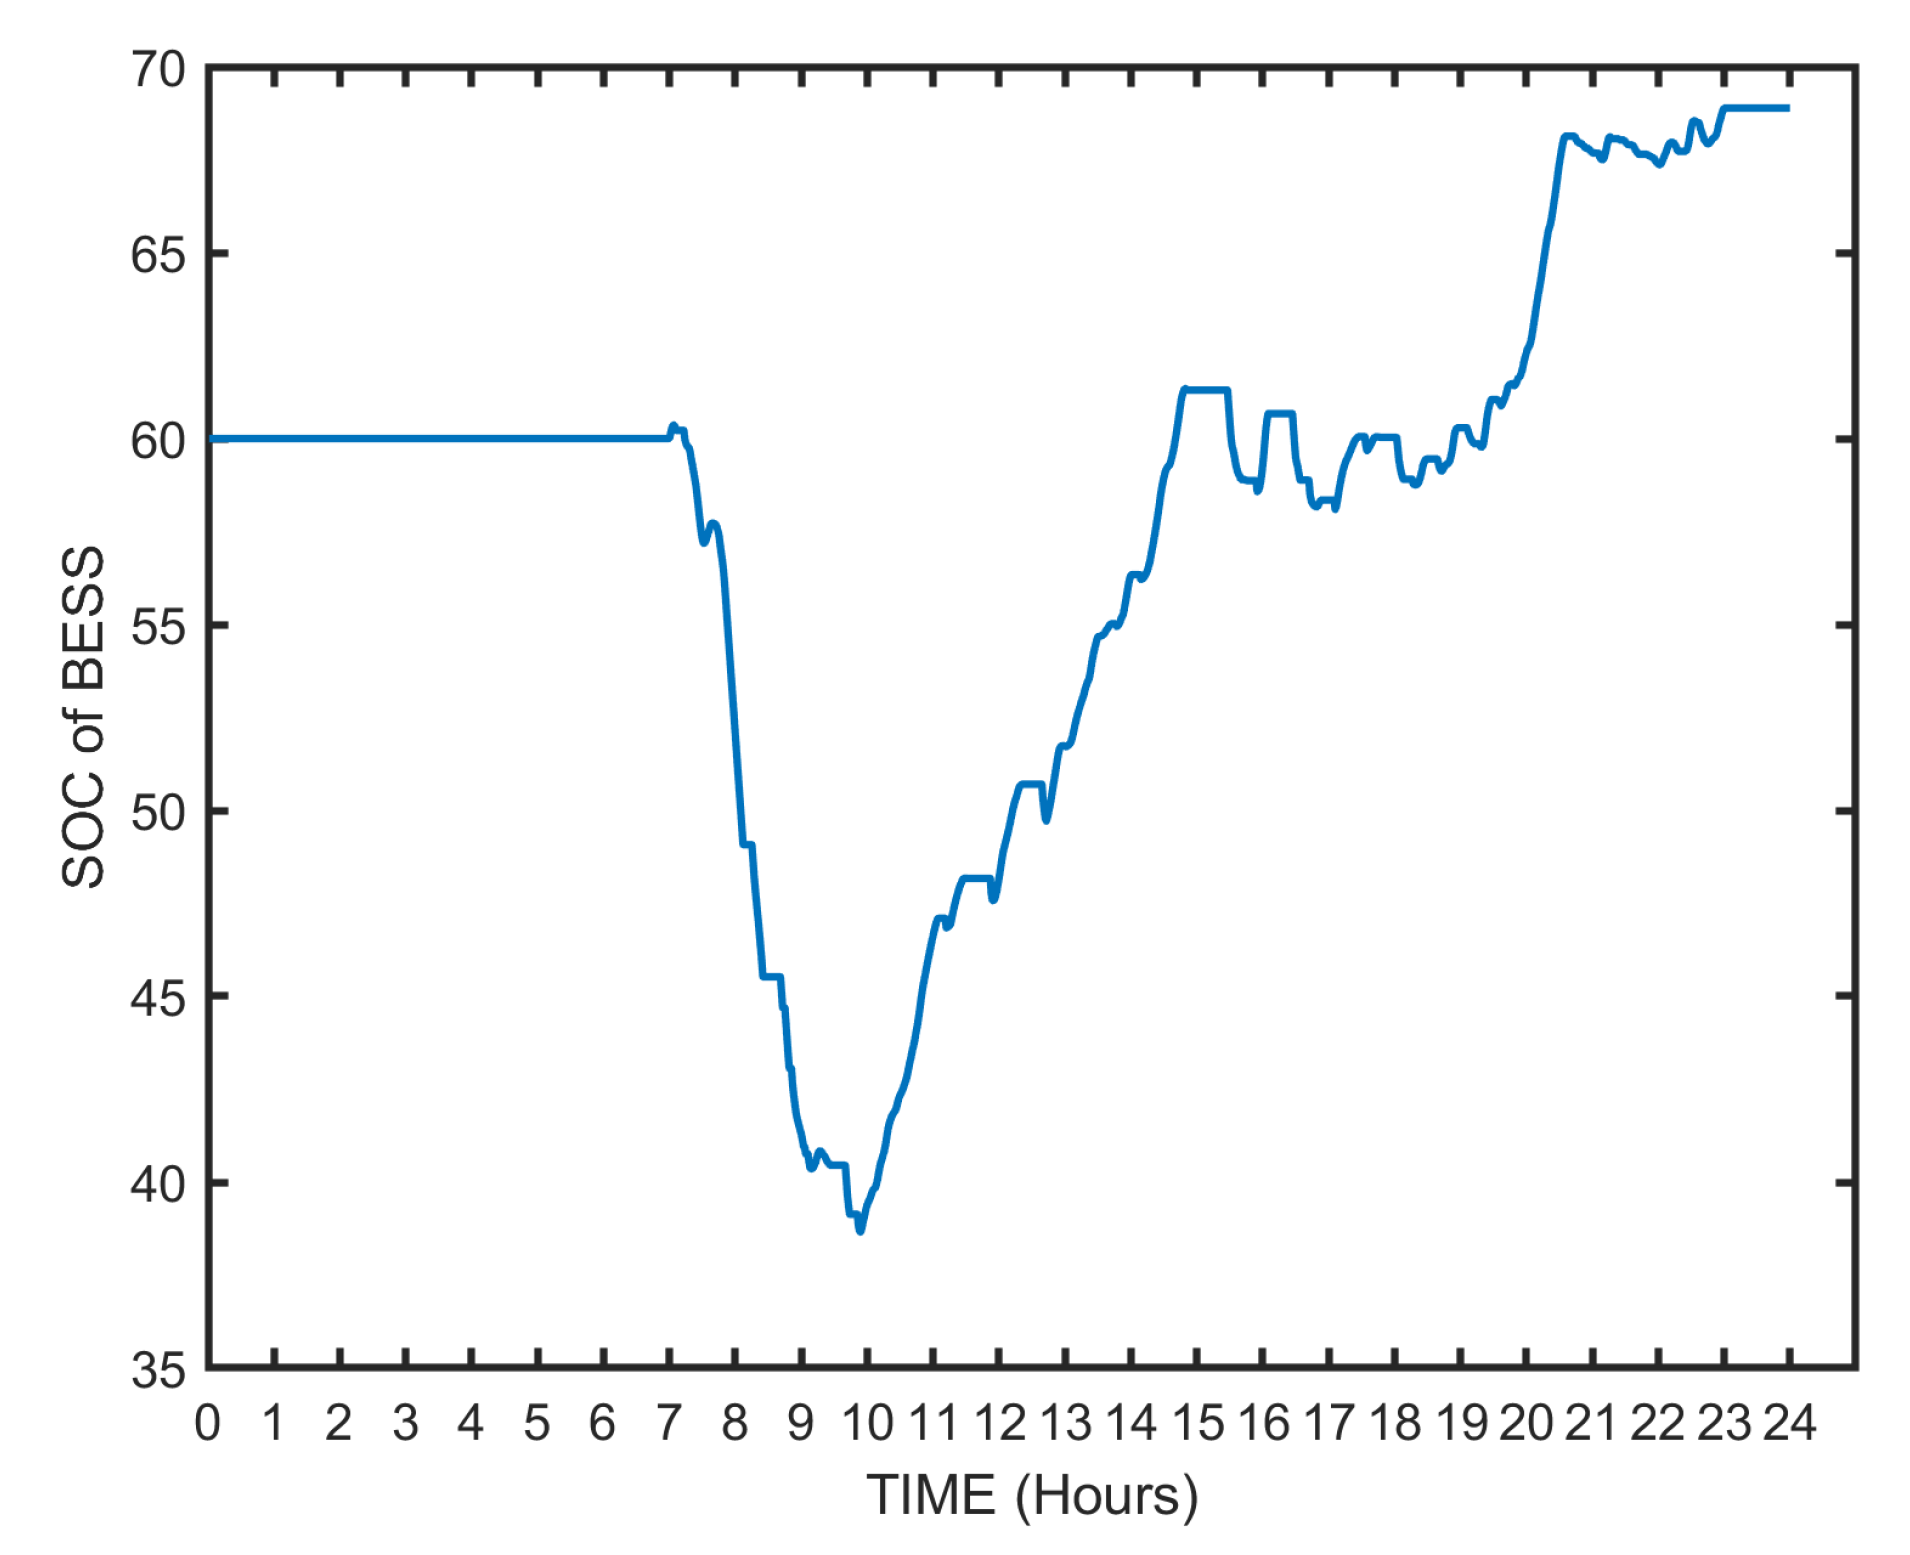
is 100%. The SOC of BESS is shown in
Figure 8. The above results show that the PV–BESS-integrated SECP can provide a good DFFR service with 100%
and an EV charging service.
The capacity of the BESS and overnight target SOC are variables in the model which can be subjected to a sensitivity analysis. The results based on the traffic flow at Hainault Station (London) are presented to understand the impact of different BESS capacities and the overnight SOC target, whilst
Table 4 shows the main parameters of the sensitivity analysis. The capacity of BESS is varied in steps of 300 kWh starting from 500 kWh to 2000 kWh.
Table 5,
Table 6 and
Table 7 are the results of 25%, 50%, and 75% initial SOC of the BESS, along with the increasing capacity of the BESS. The availability of DFFR and the average increasing SOC of the EVs increase with the BESS capacity as expected. Compared with the summer season, the average increasing SOC is always lower in winter regardless of how the capacity of BESS changes. According to
Table 5,
Table 6 and
Table 7, the higher initial SOC of the BESS leads to the lower availability in the summer. The availability is 100% when the capacity of the BESS is 2000 kWh with 25% initial SOC in summer, and 99.48% when the capacity of BESS is 2000 kWh with 50% initial SOC in winter, both of which achieve the acceptable average increasing SOC (29.54% and 28.65% in order).
Combined with the energy flow from
Figure 3 and
Figure 4, the lower average increasing SOC in winter can be explained:
In summer, the PVs can provide a higher percentage of the energy required to charge the EVs;
In the winter season, without too much PV energy, the total EV energy demand is mainly met by the grid and the BESS, and therefore the BESS suffers from a lower average SOC;
EVs have to provide more energy to the grid for the DFFR service to maintain a high availability.
Observed in winter, the BESS with a 75% initial SOC can provide more energy to EVs than 25%, hence the average increasing SOC of EVs with a 75% initial SOC of BESS is higher. The average increasing SOC in summer remains consistent regardless of the initial SOC values of the BESS since the EVs were fully charged with the available PV power.
The reason for which the higher initial SOC of the BESS causes lower availability in summer is that if the BESS has a higher initial SOC, then there is limited energy storage left for storing the energy from the PV and the grid when the frequency is in the HFZ. Meanwhile, the PV generates more energy for charging EVs and the BESS in summer than in the winter, and the energy storage left for storing energy from the grid is further compressed. Once cannot be met, the availability decreases.
The results reveal that for different seasons, adjusting the suitable initial SoC of a battery helps reduce the capacity of the BESS, hence reducing the initial cost associated with the capacity of the BESS. A 2 MWh BESS, with a 50% initial SOC in winter and 25% initial SOC in summer is a good choice for the parameters of this SECP providing DFFR service, a conclusion which was based on the condition that the SECP manages the SOC of BESS every day.
5. Conclusions
In this paper, a PV–BESS integrated SECP was introduced that can support the provision of DFFR as a service to the electricity grid whilst providing EV charging capability. Based on the SECP model, three efficient power management methods were proposed to control the power committed to charging multiple EVs. Simulations demonstrate how this can be effective for all types of multi-space EV charging car parks where in the first instance there is a requirement to minimise the capacity of the electrical feeder from the grid (reduces cost, workaround for local capacity constraints, opportunity for increased end-user tariffs). A methodology is the presented to establish the power flow priorities between the different assets in the SECP (EVs, grid, PV, and BESS) to maximise the availability of power to/from the grid to provide a frequency response service. A sensitive analysis on the capacity and SOC management of the BESS for the case of Hainault Station reveals a sizing methodology to maximise grid service availability and EV charging capability. The results show that a high availability is achievable without the need for the BESS to be sized close to the service requirements. In addition to parking and charging fees, SECPs can therefore generate additional revenue by providing frequency response services to the grid. The results in this paper can be interpreted to recognise that whilst there is much focus on achieving 100% charging of EVs at maximum power, it is advantageous to have capacity, with respect to power and SOC, to respond to power demands to assist with balancing the grid. It was assumed in this paper that the physical electrical system can meet the power quality and protection requirements, as independently, each component is already installed in real-world examples. However, varying electrical topologies could be applied, for example, to remove superfluous DC–AC/AC–DC conversion and replace it with a common DC bus between components, which is an avenue for further work.


