
In Situ Catalytic Methanation of Real Steelworks Gases

 ,
, 
Abstract
:1. Introduction
2. Methods and Methodology
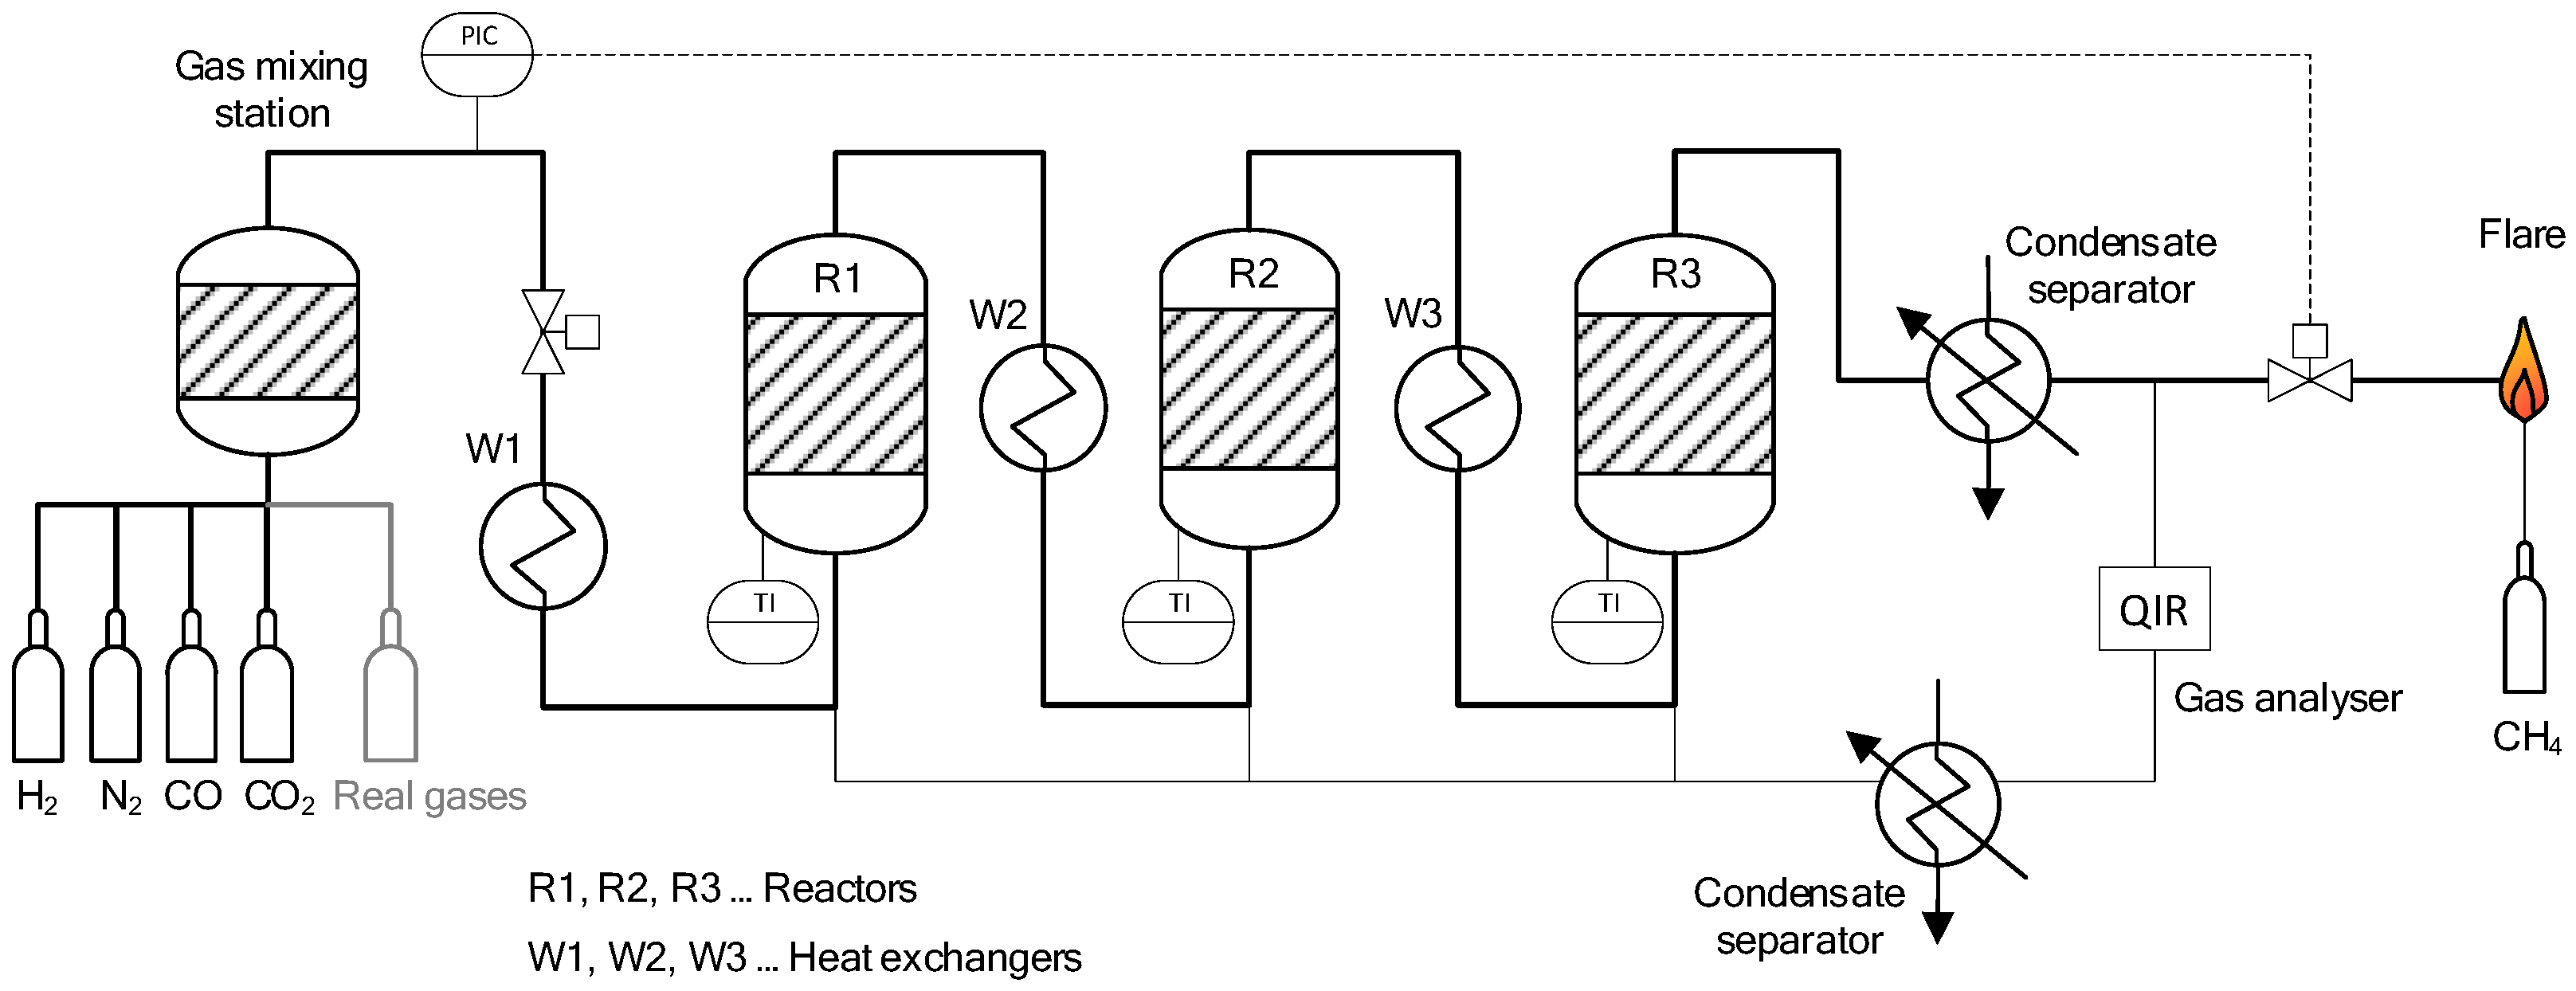
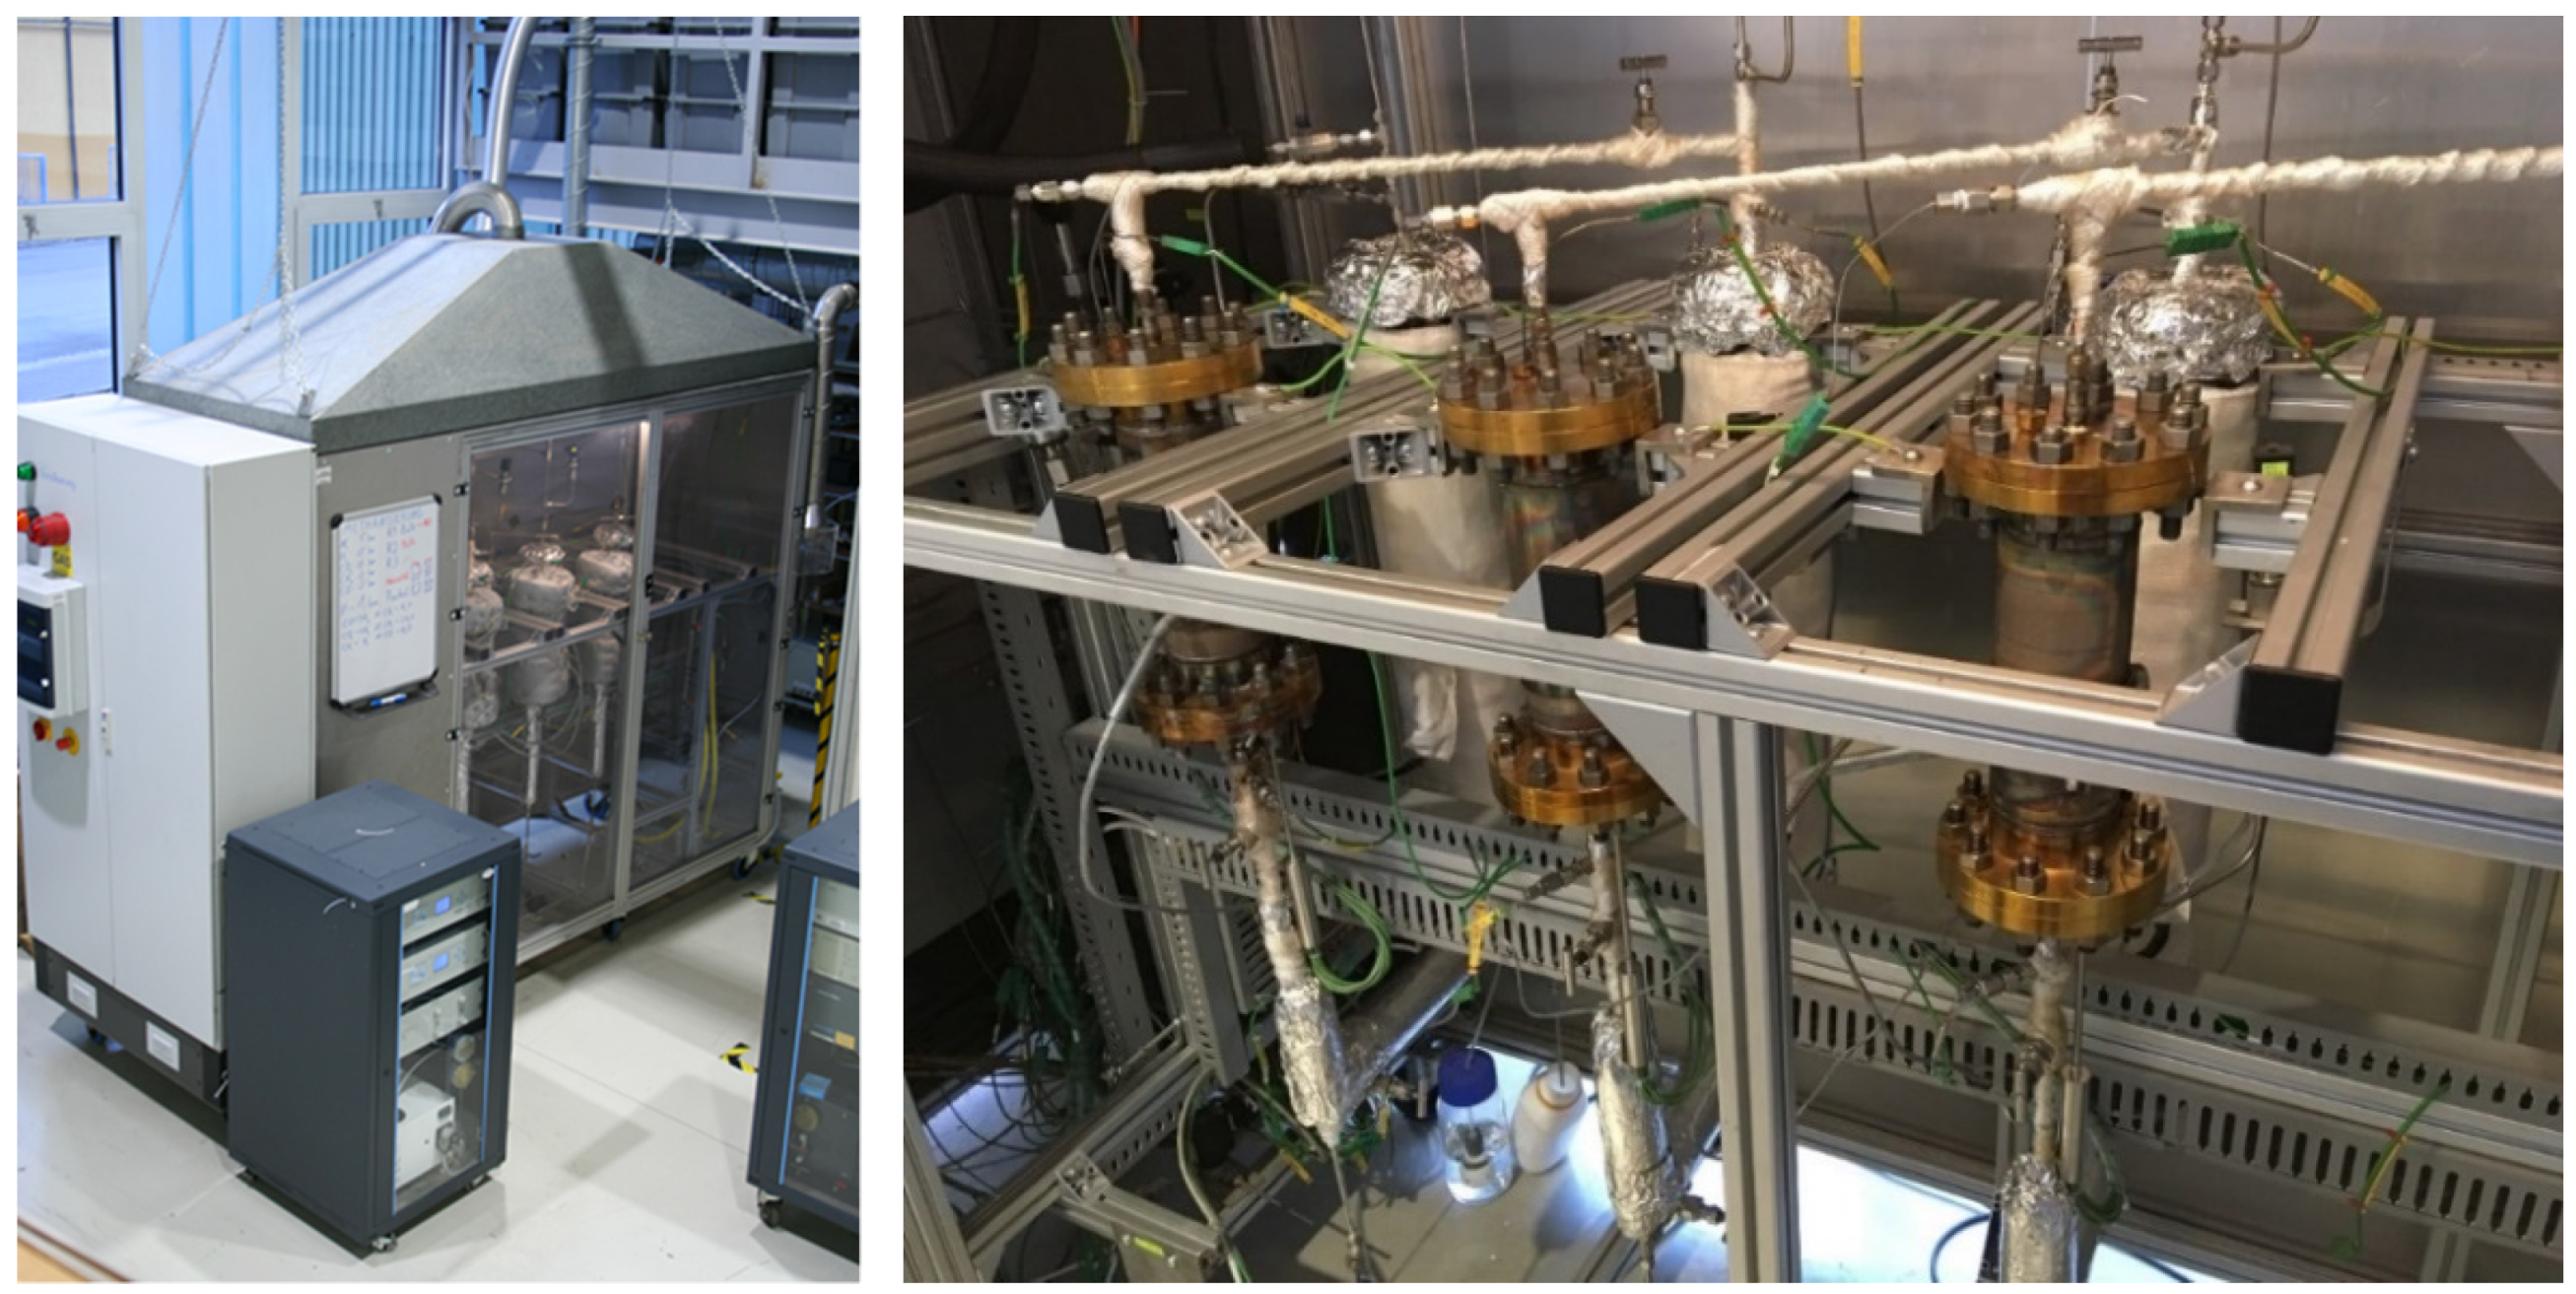
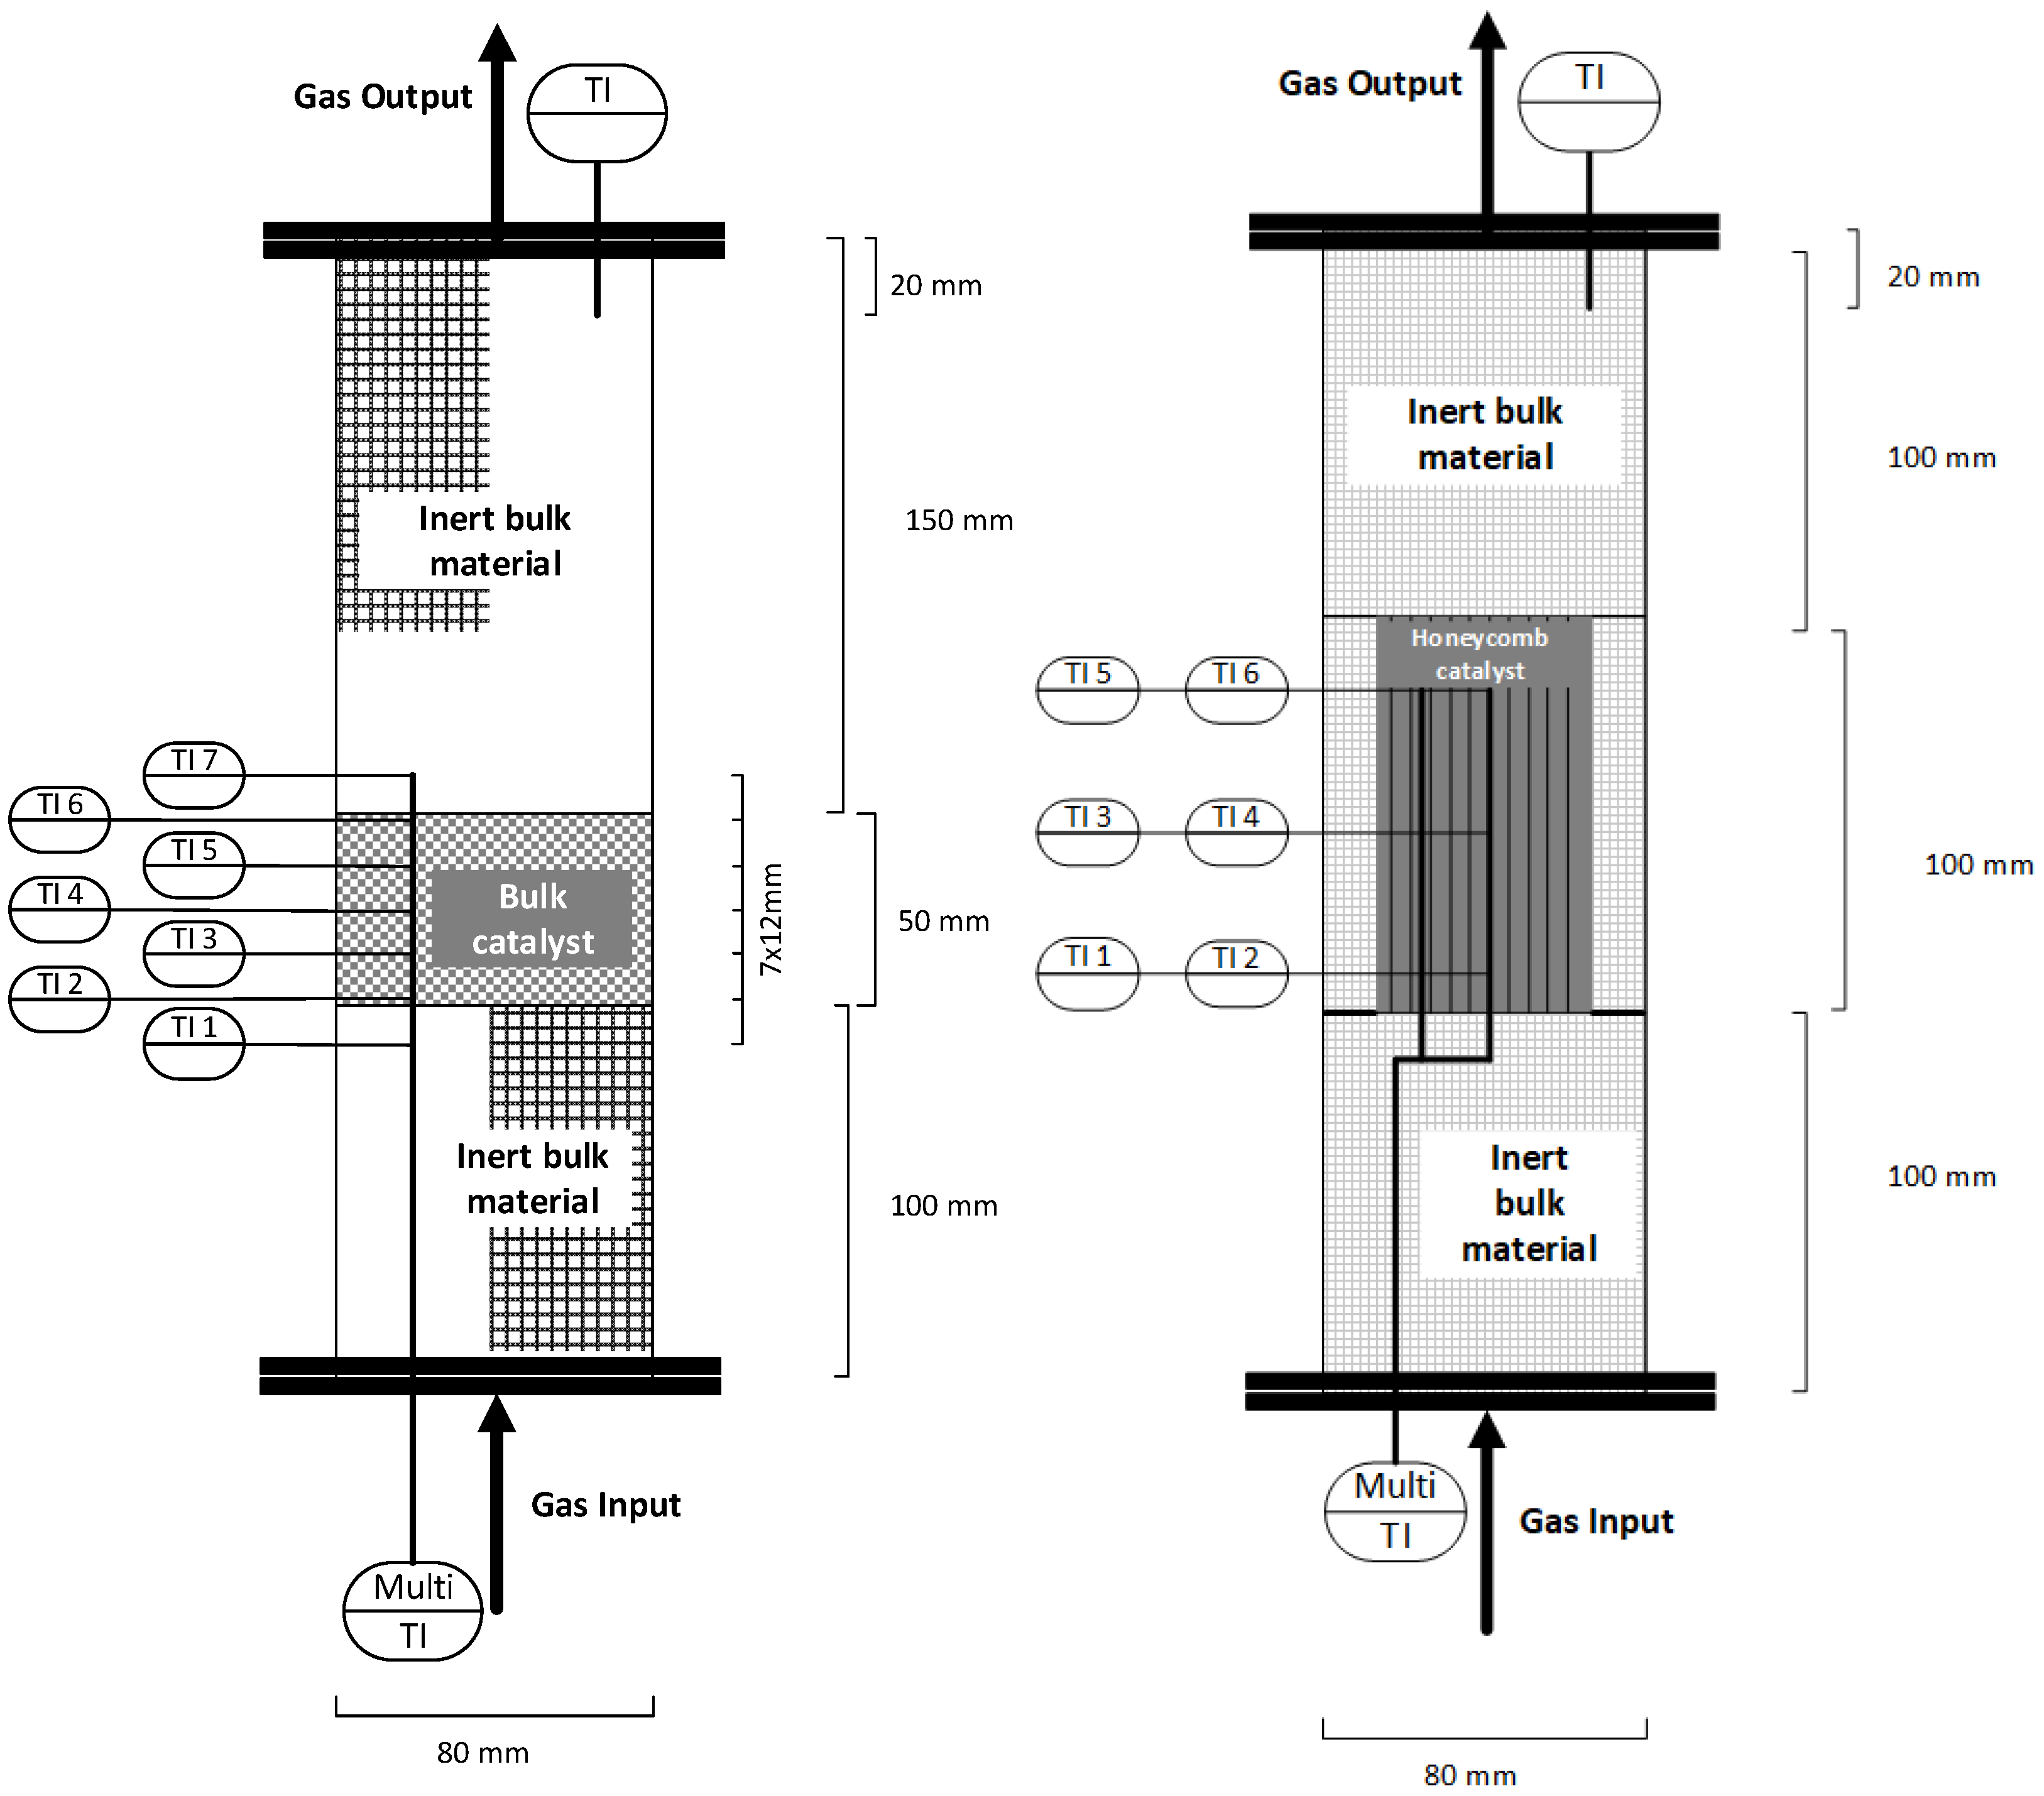
2.1. Experimental Setup
2.2. Analysis of Bottled Real Gases
3. Experiments and Results
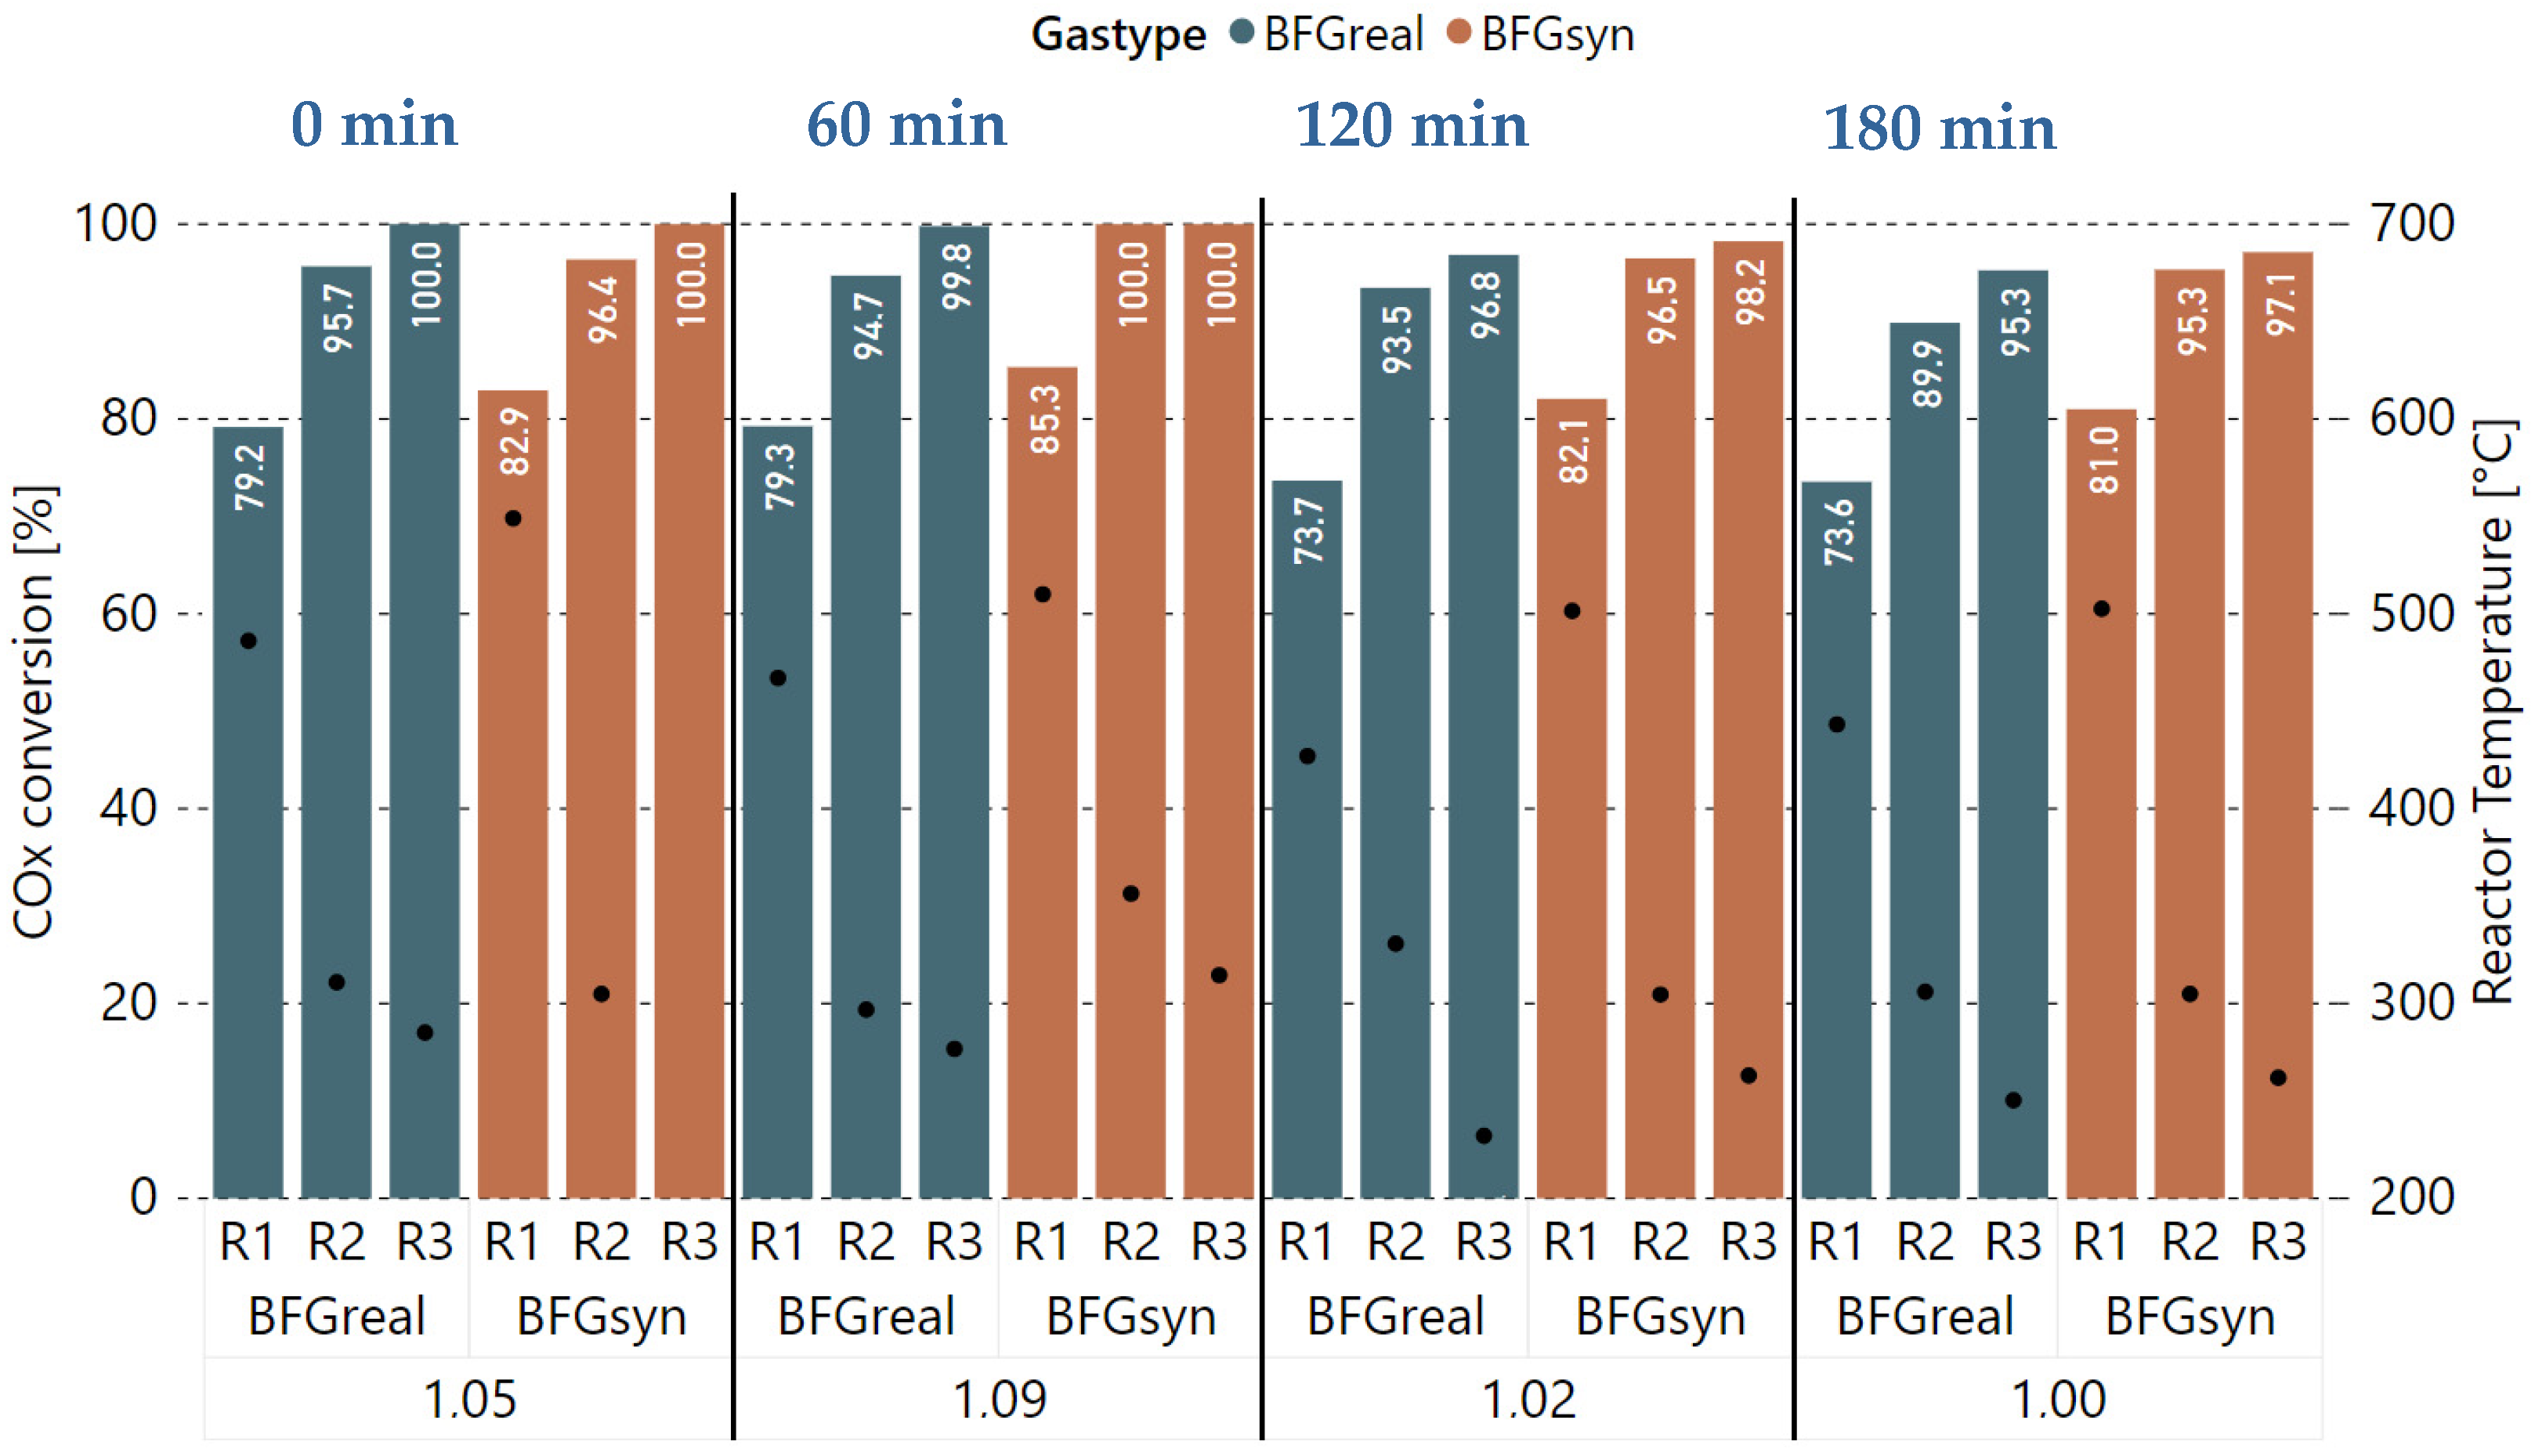
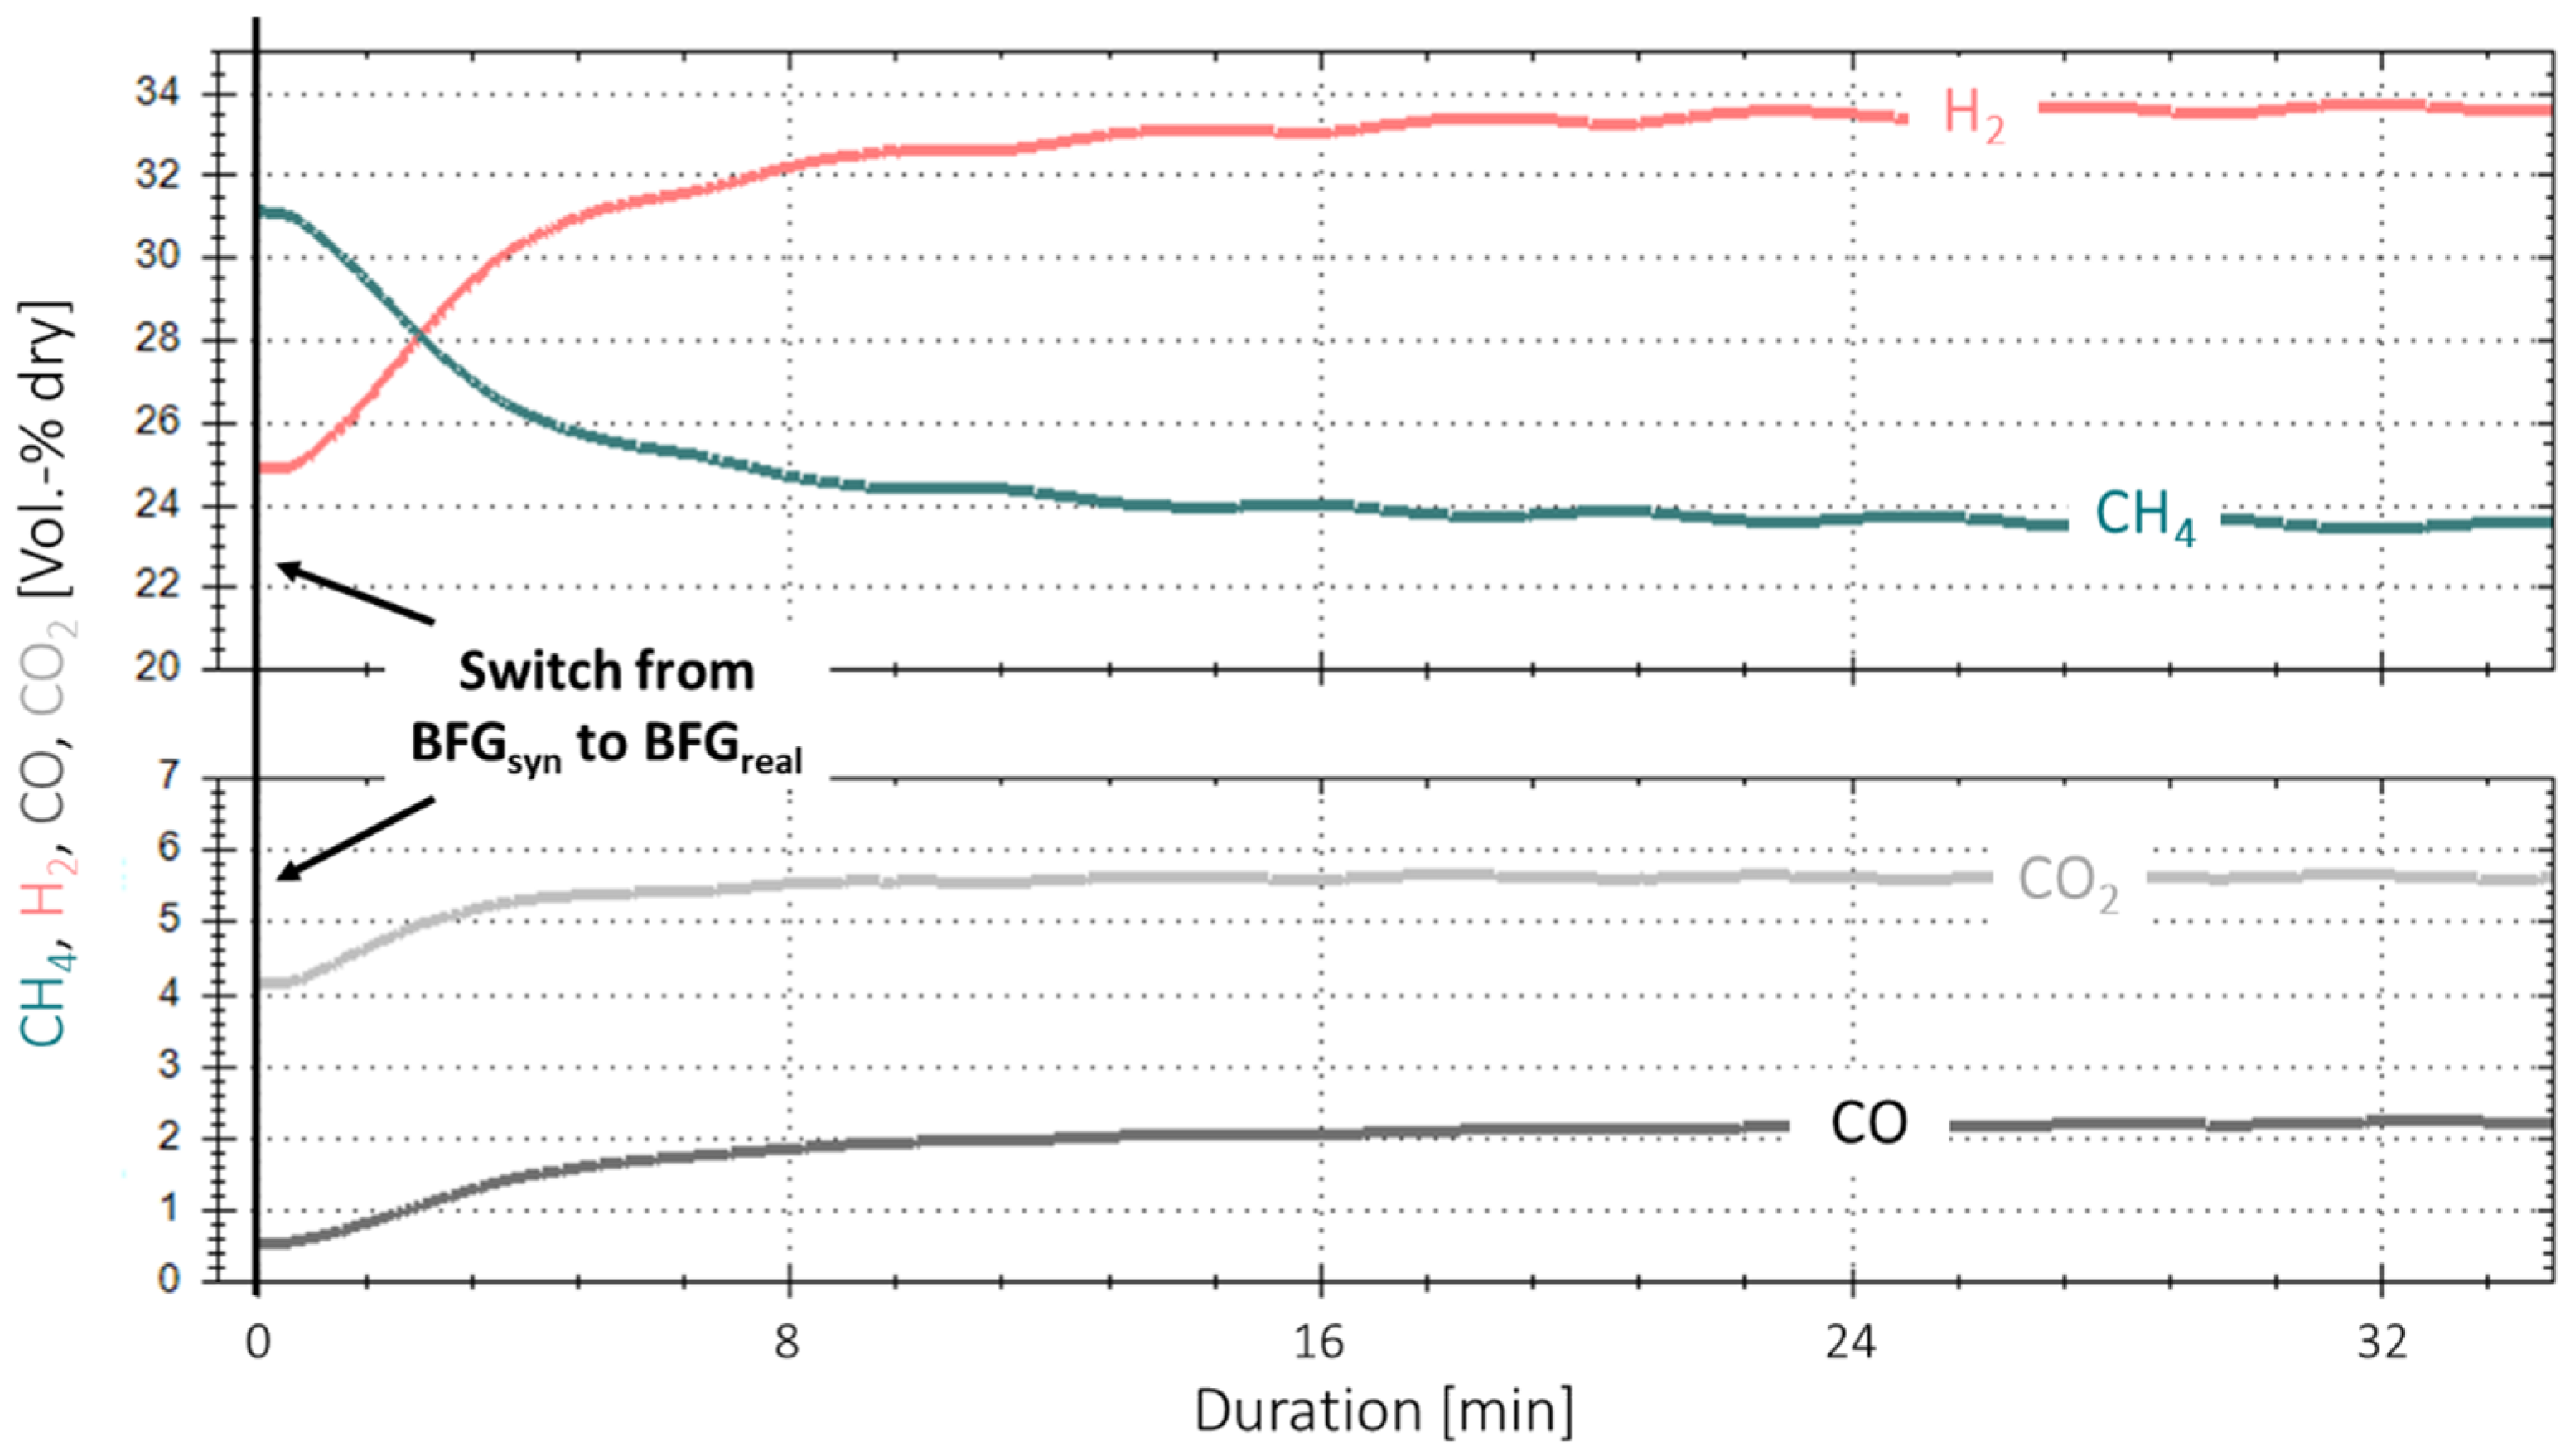
3.1. Initial Experiments with Bottled Real BFG
- H2-excess rate of 5% to reaction stoichiometry ( = 1.05, Equation (5));
- Gas hourly space velocity (GHSV, Equation (6)) of 4000 h−1 (~16.7 NL/min);
- Operating pressure of 4 bar.
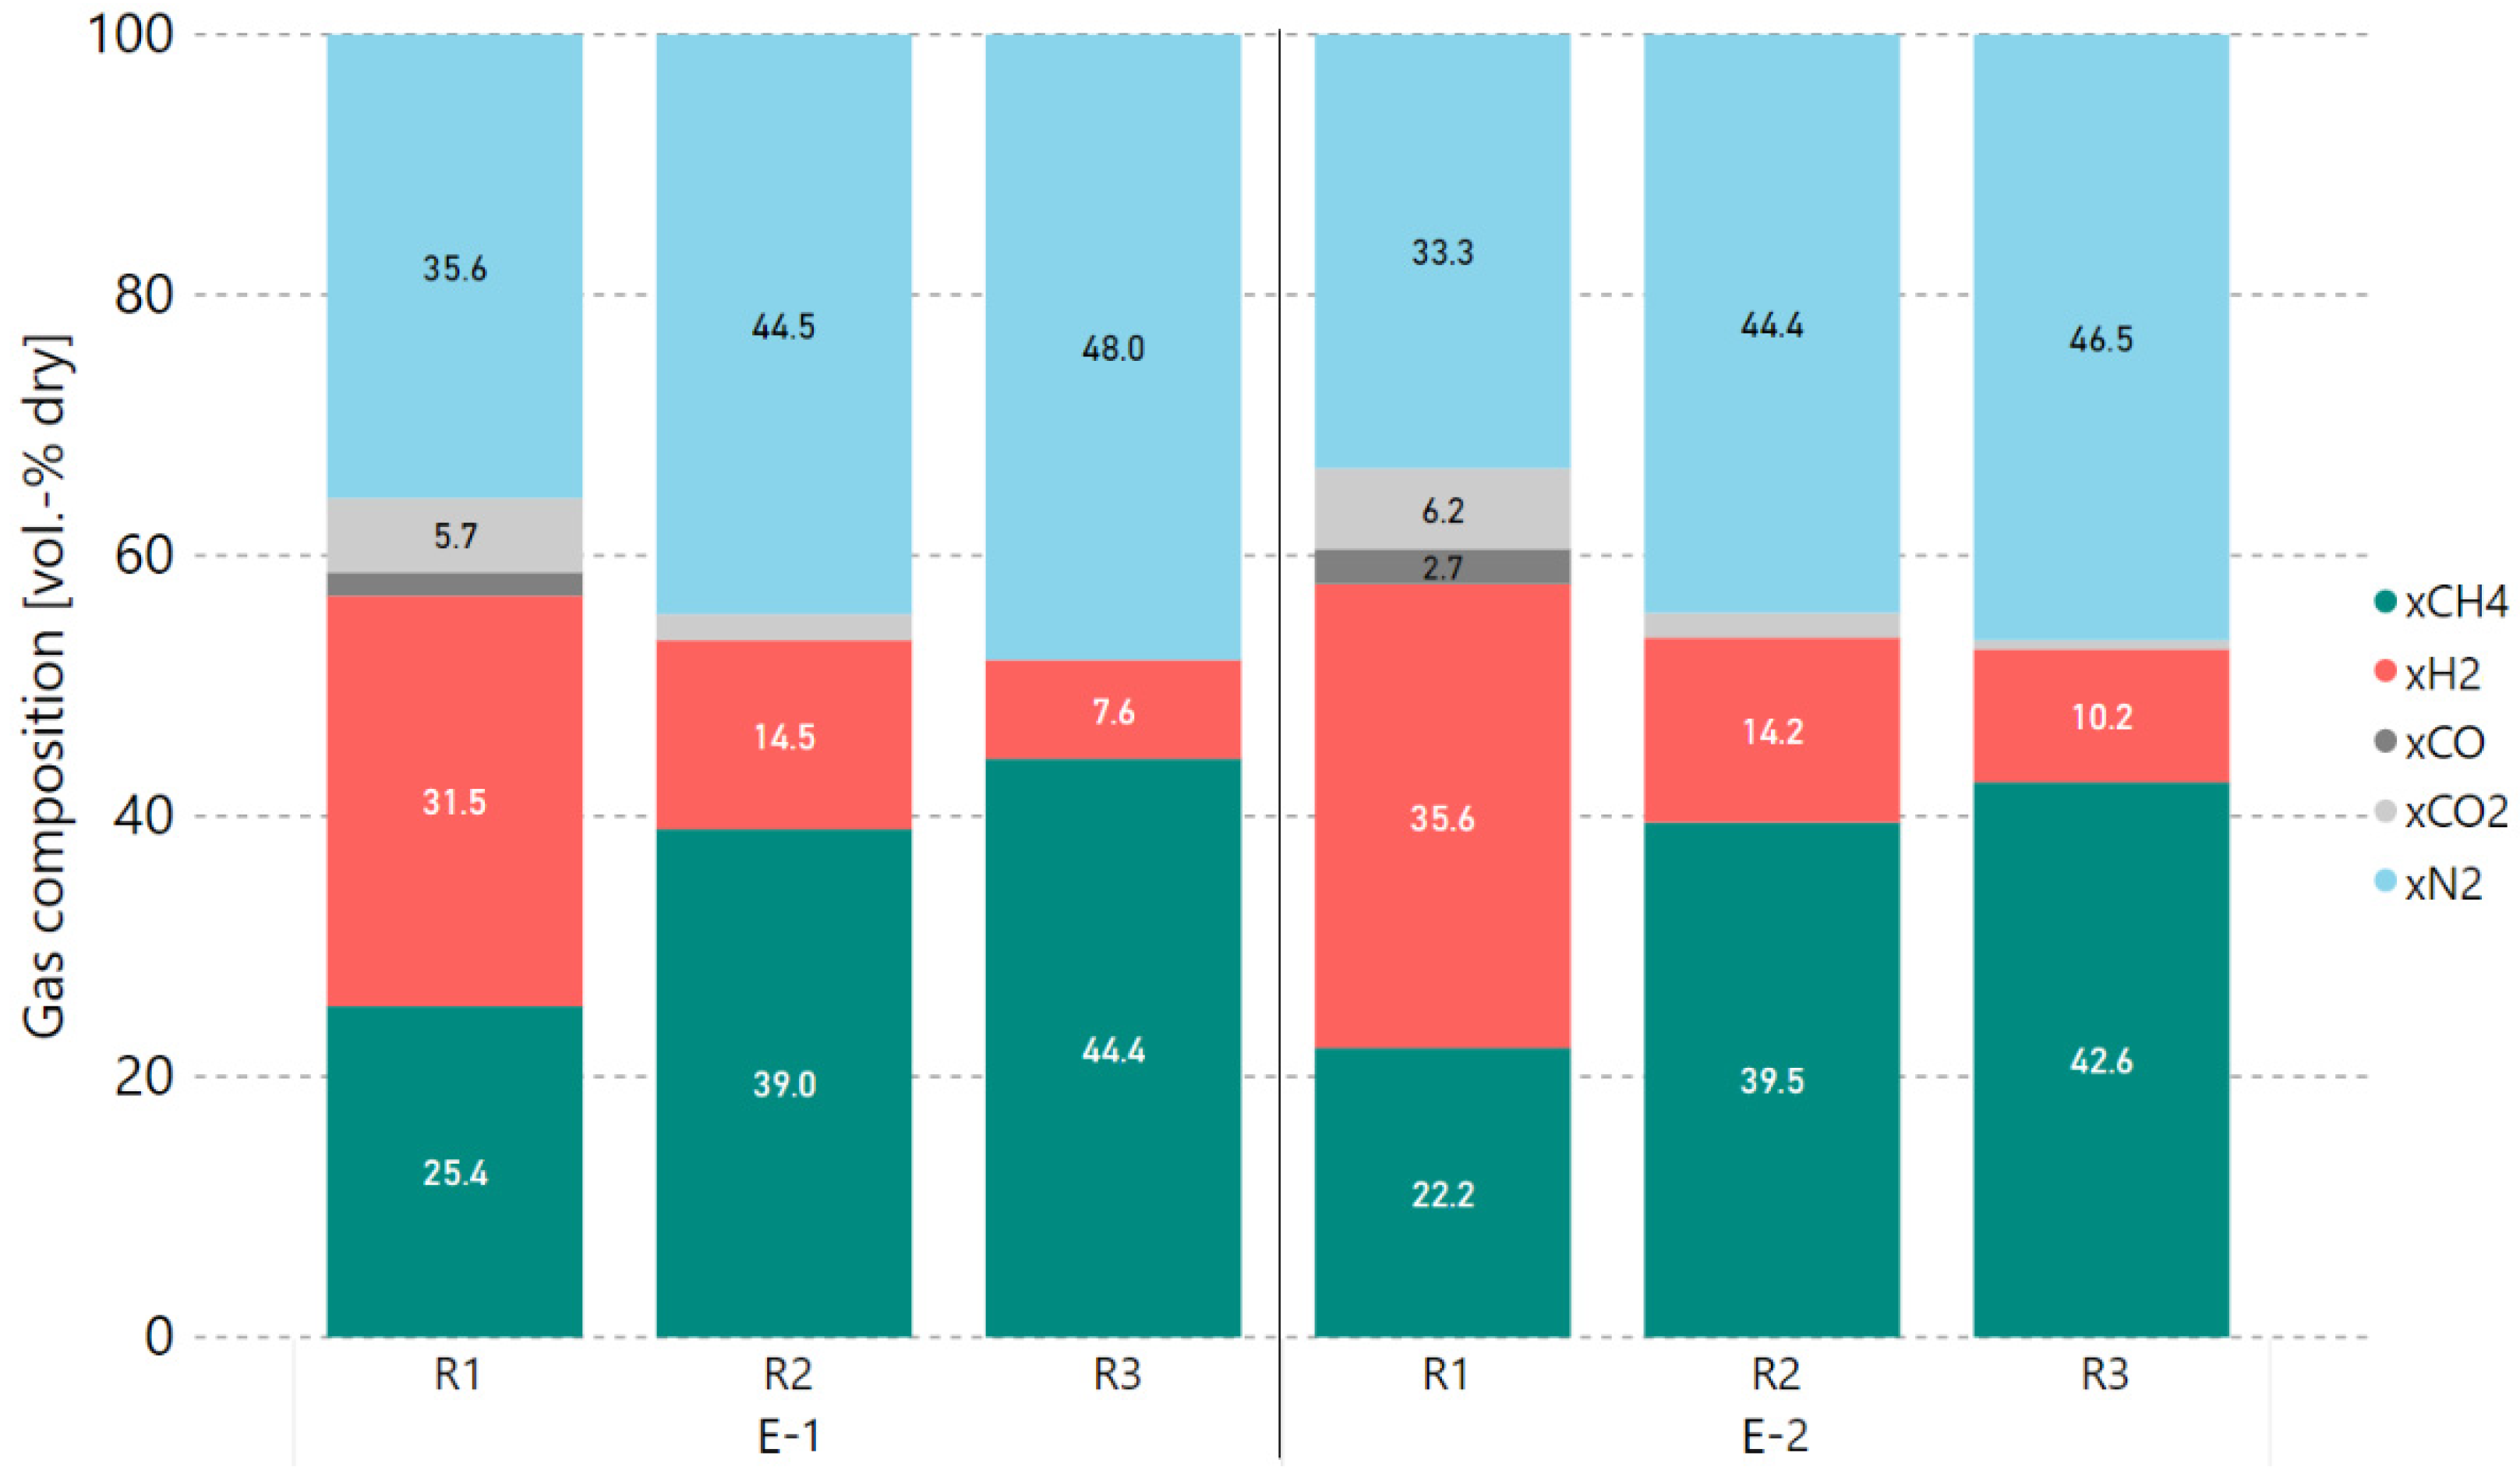
3.2. Variation of Hydrogen Excess Rate at Constant GHSV
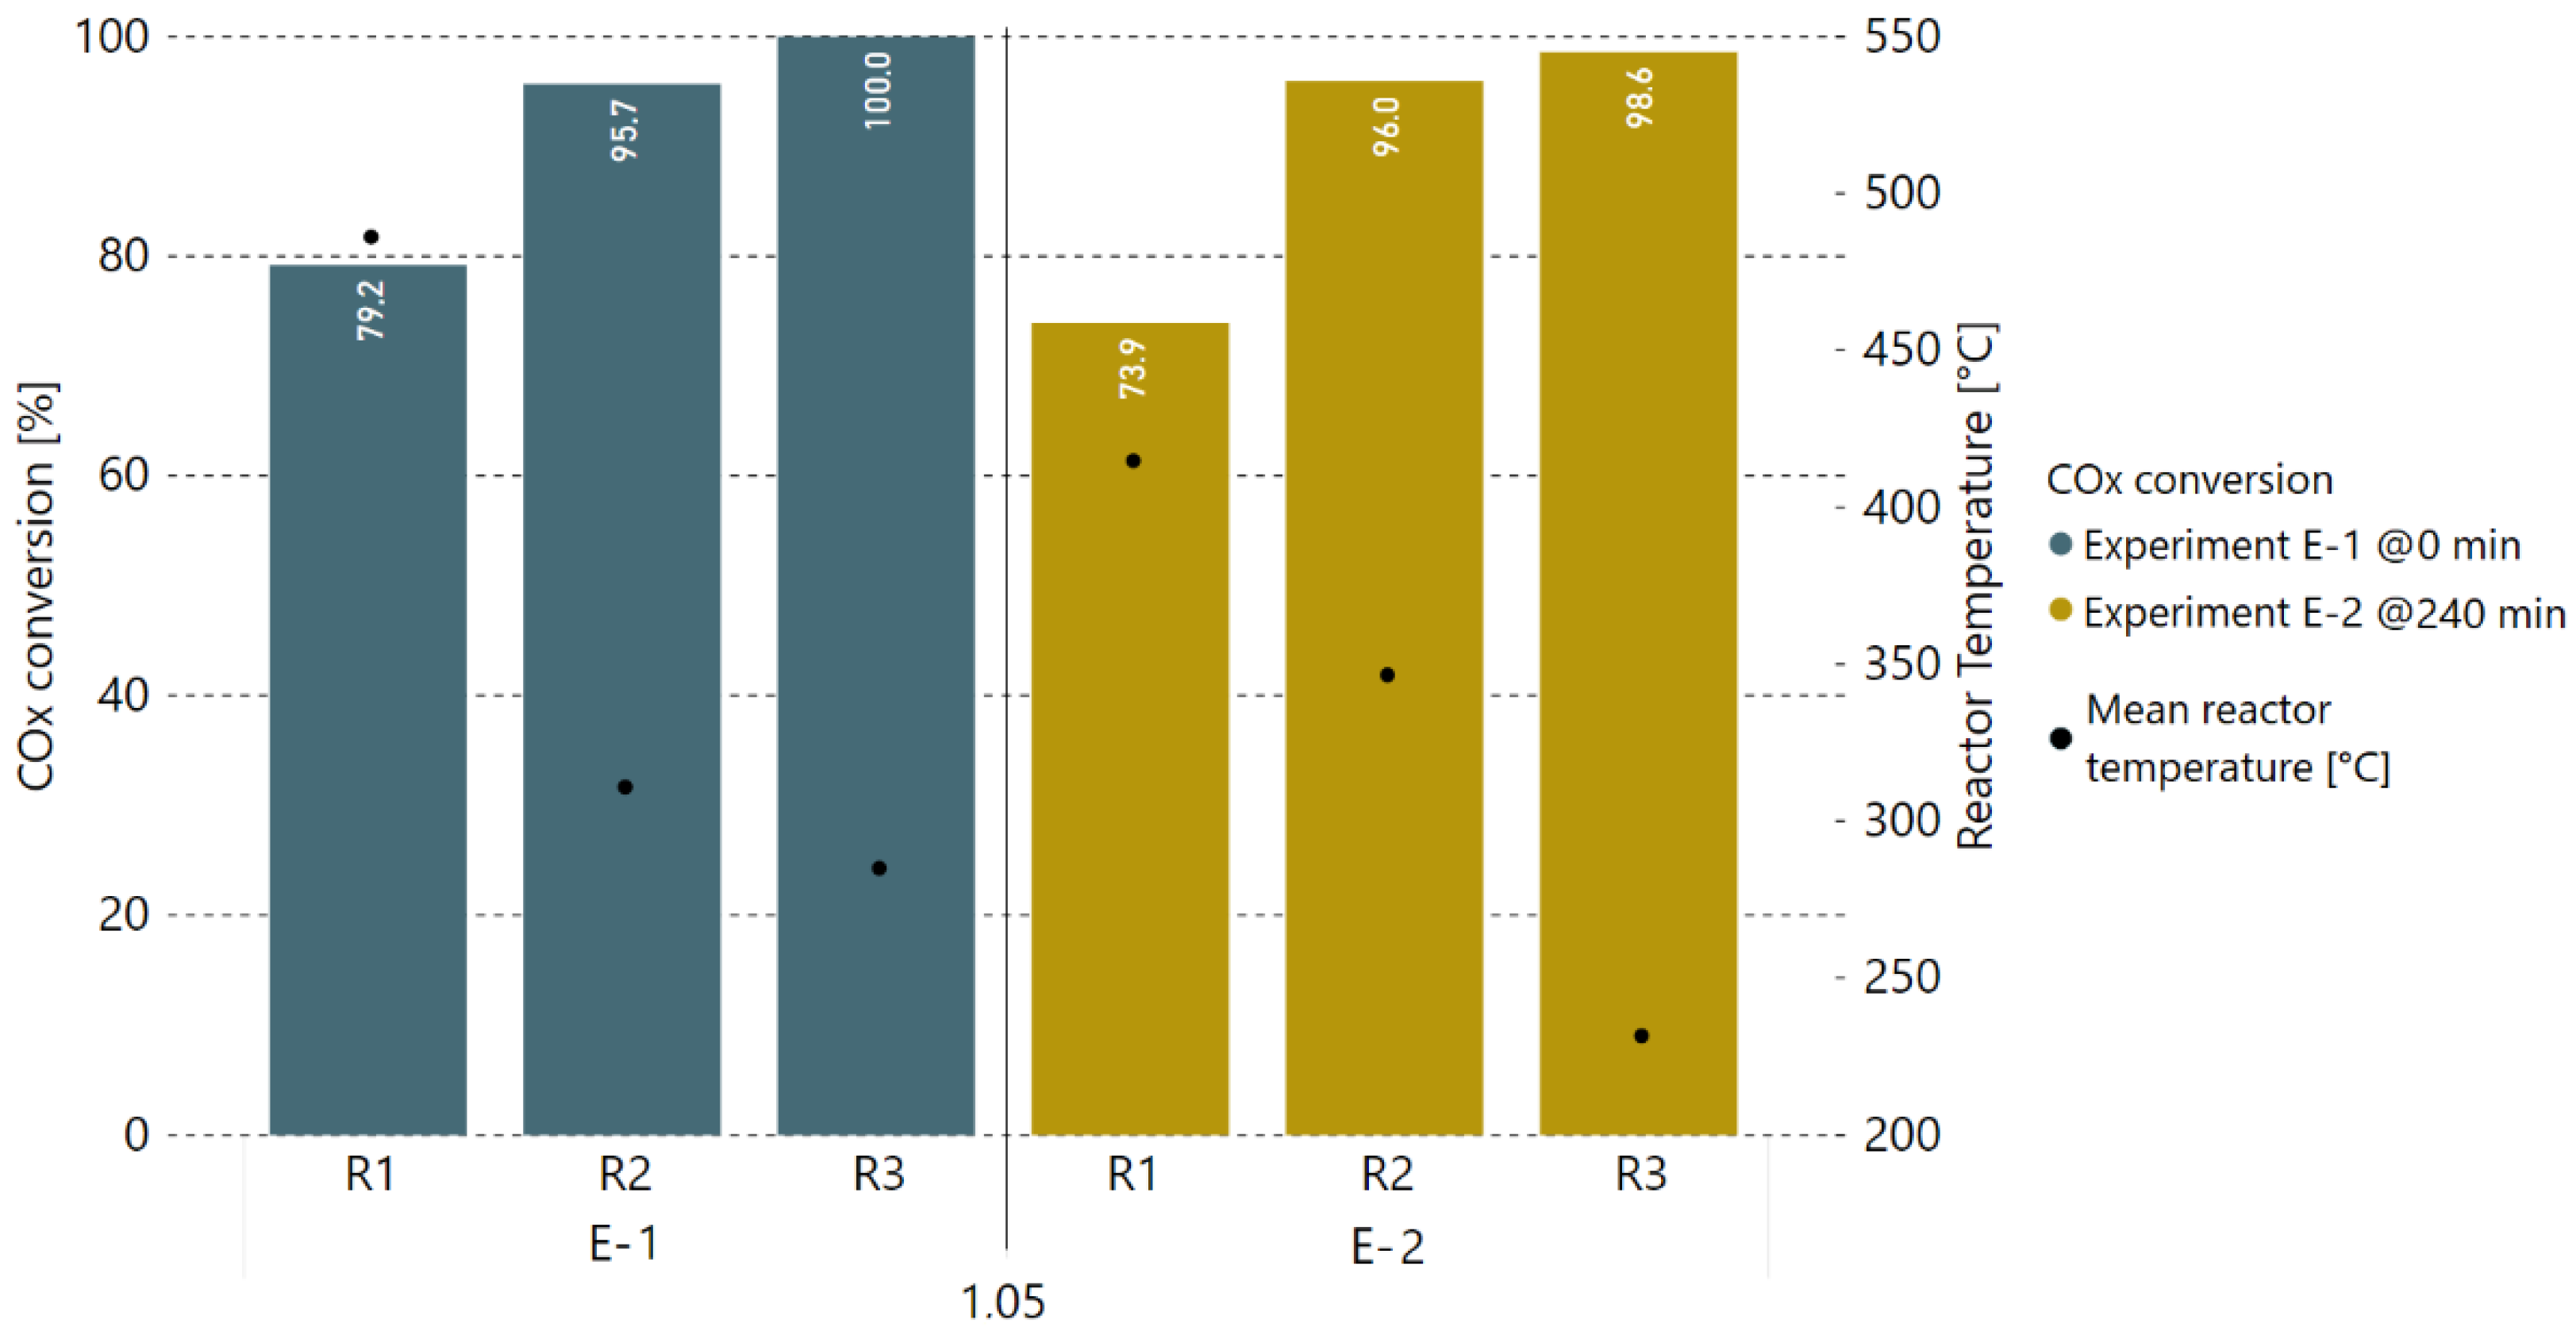
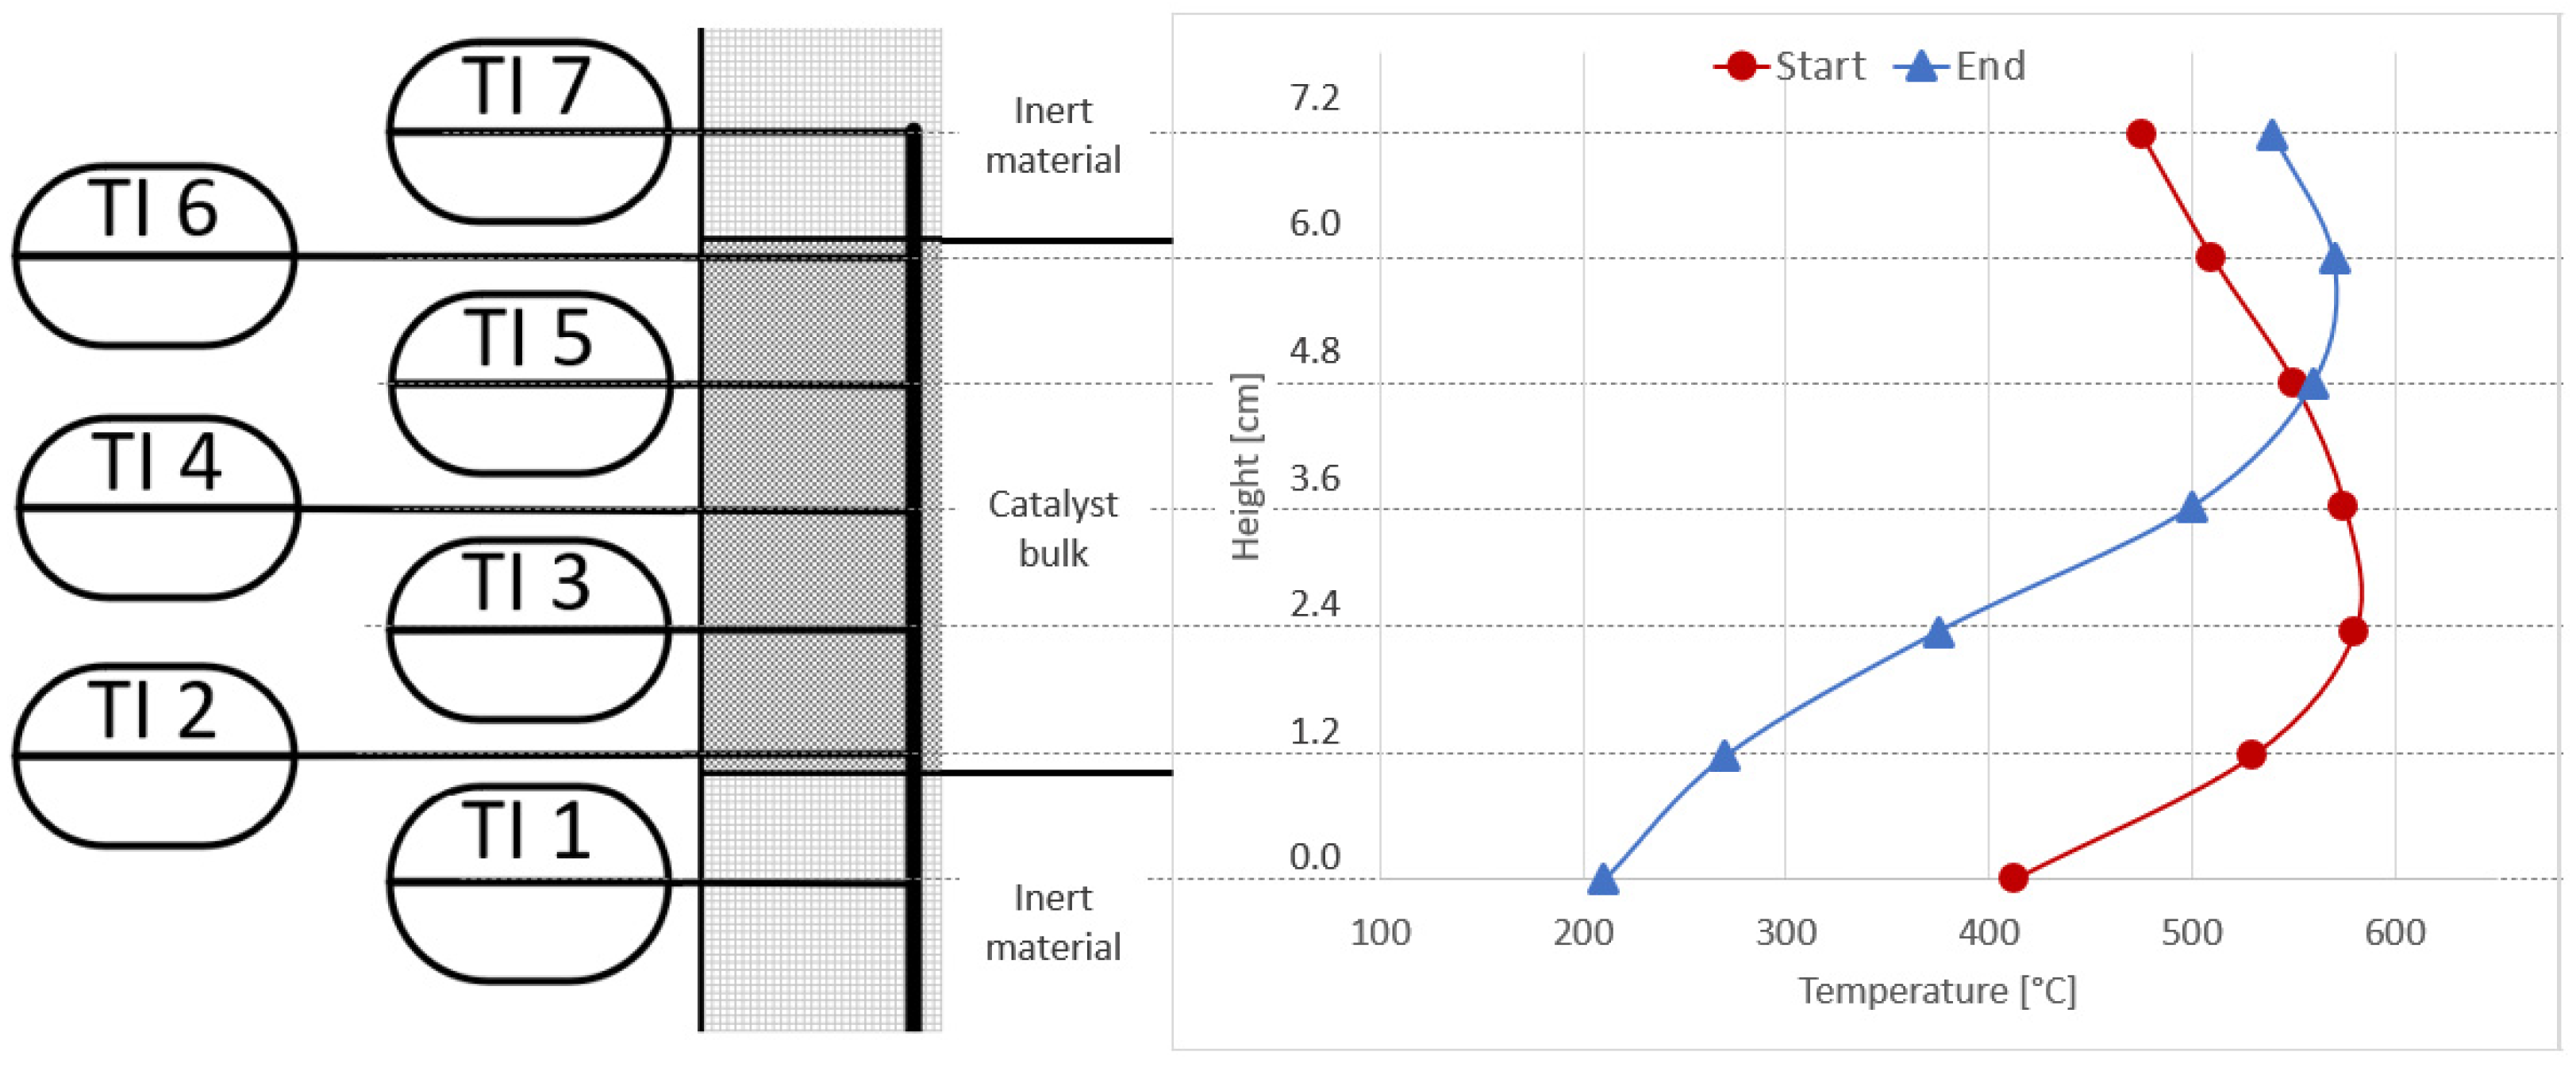
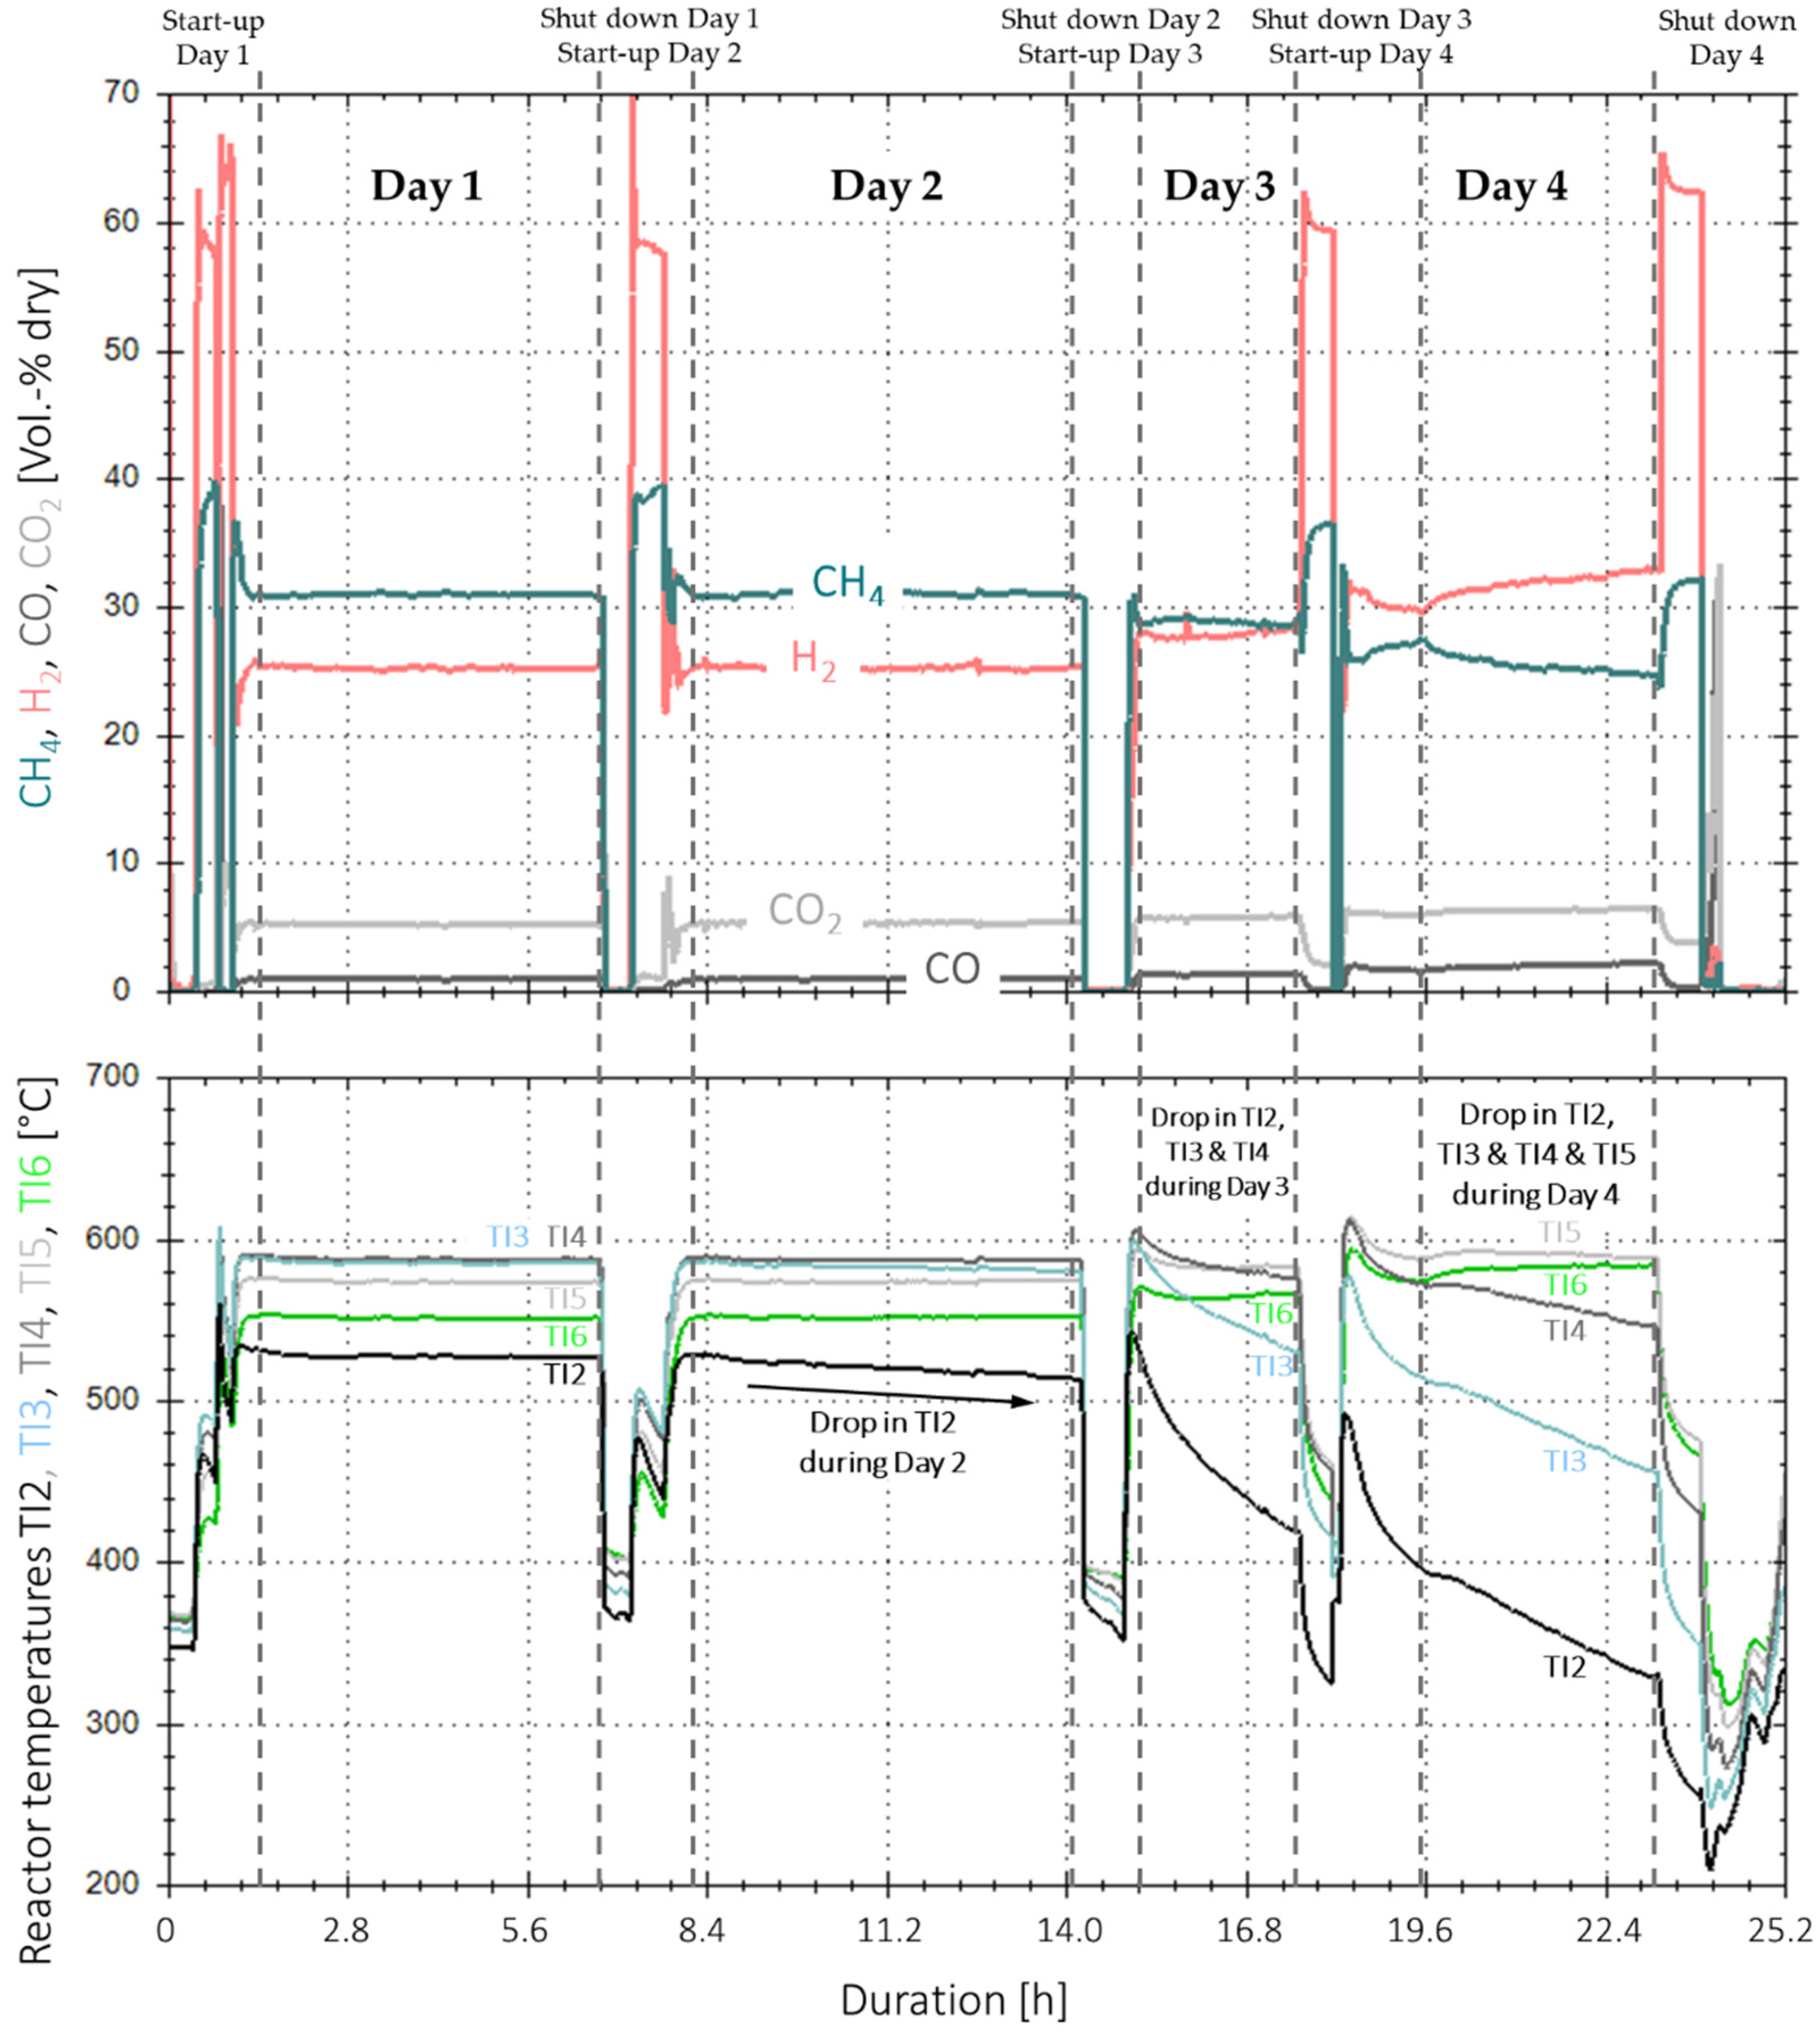
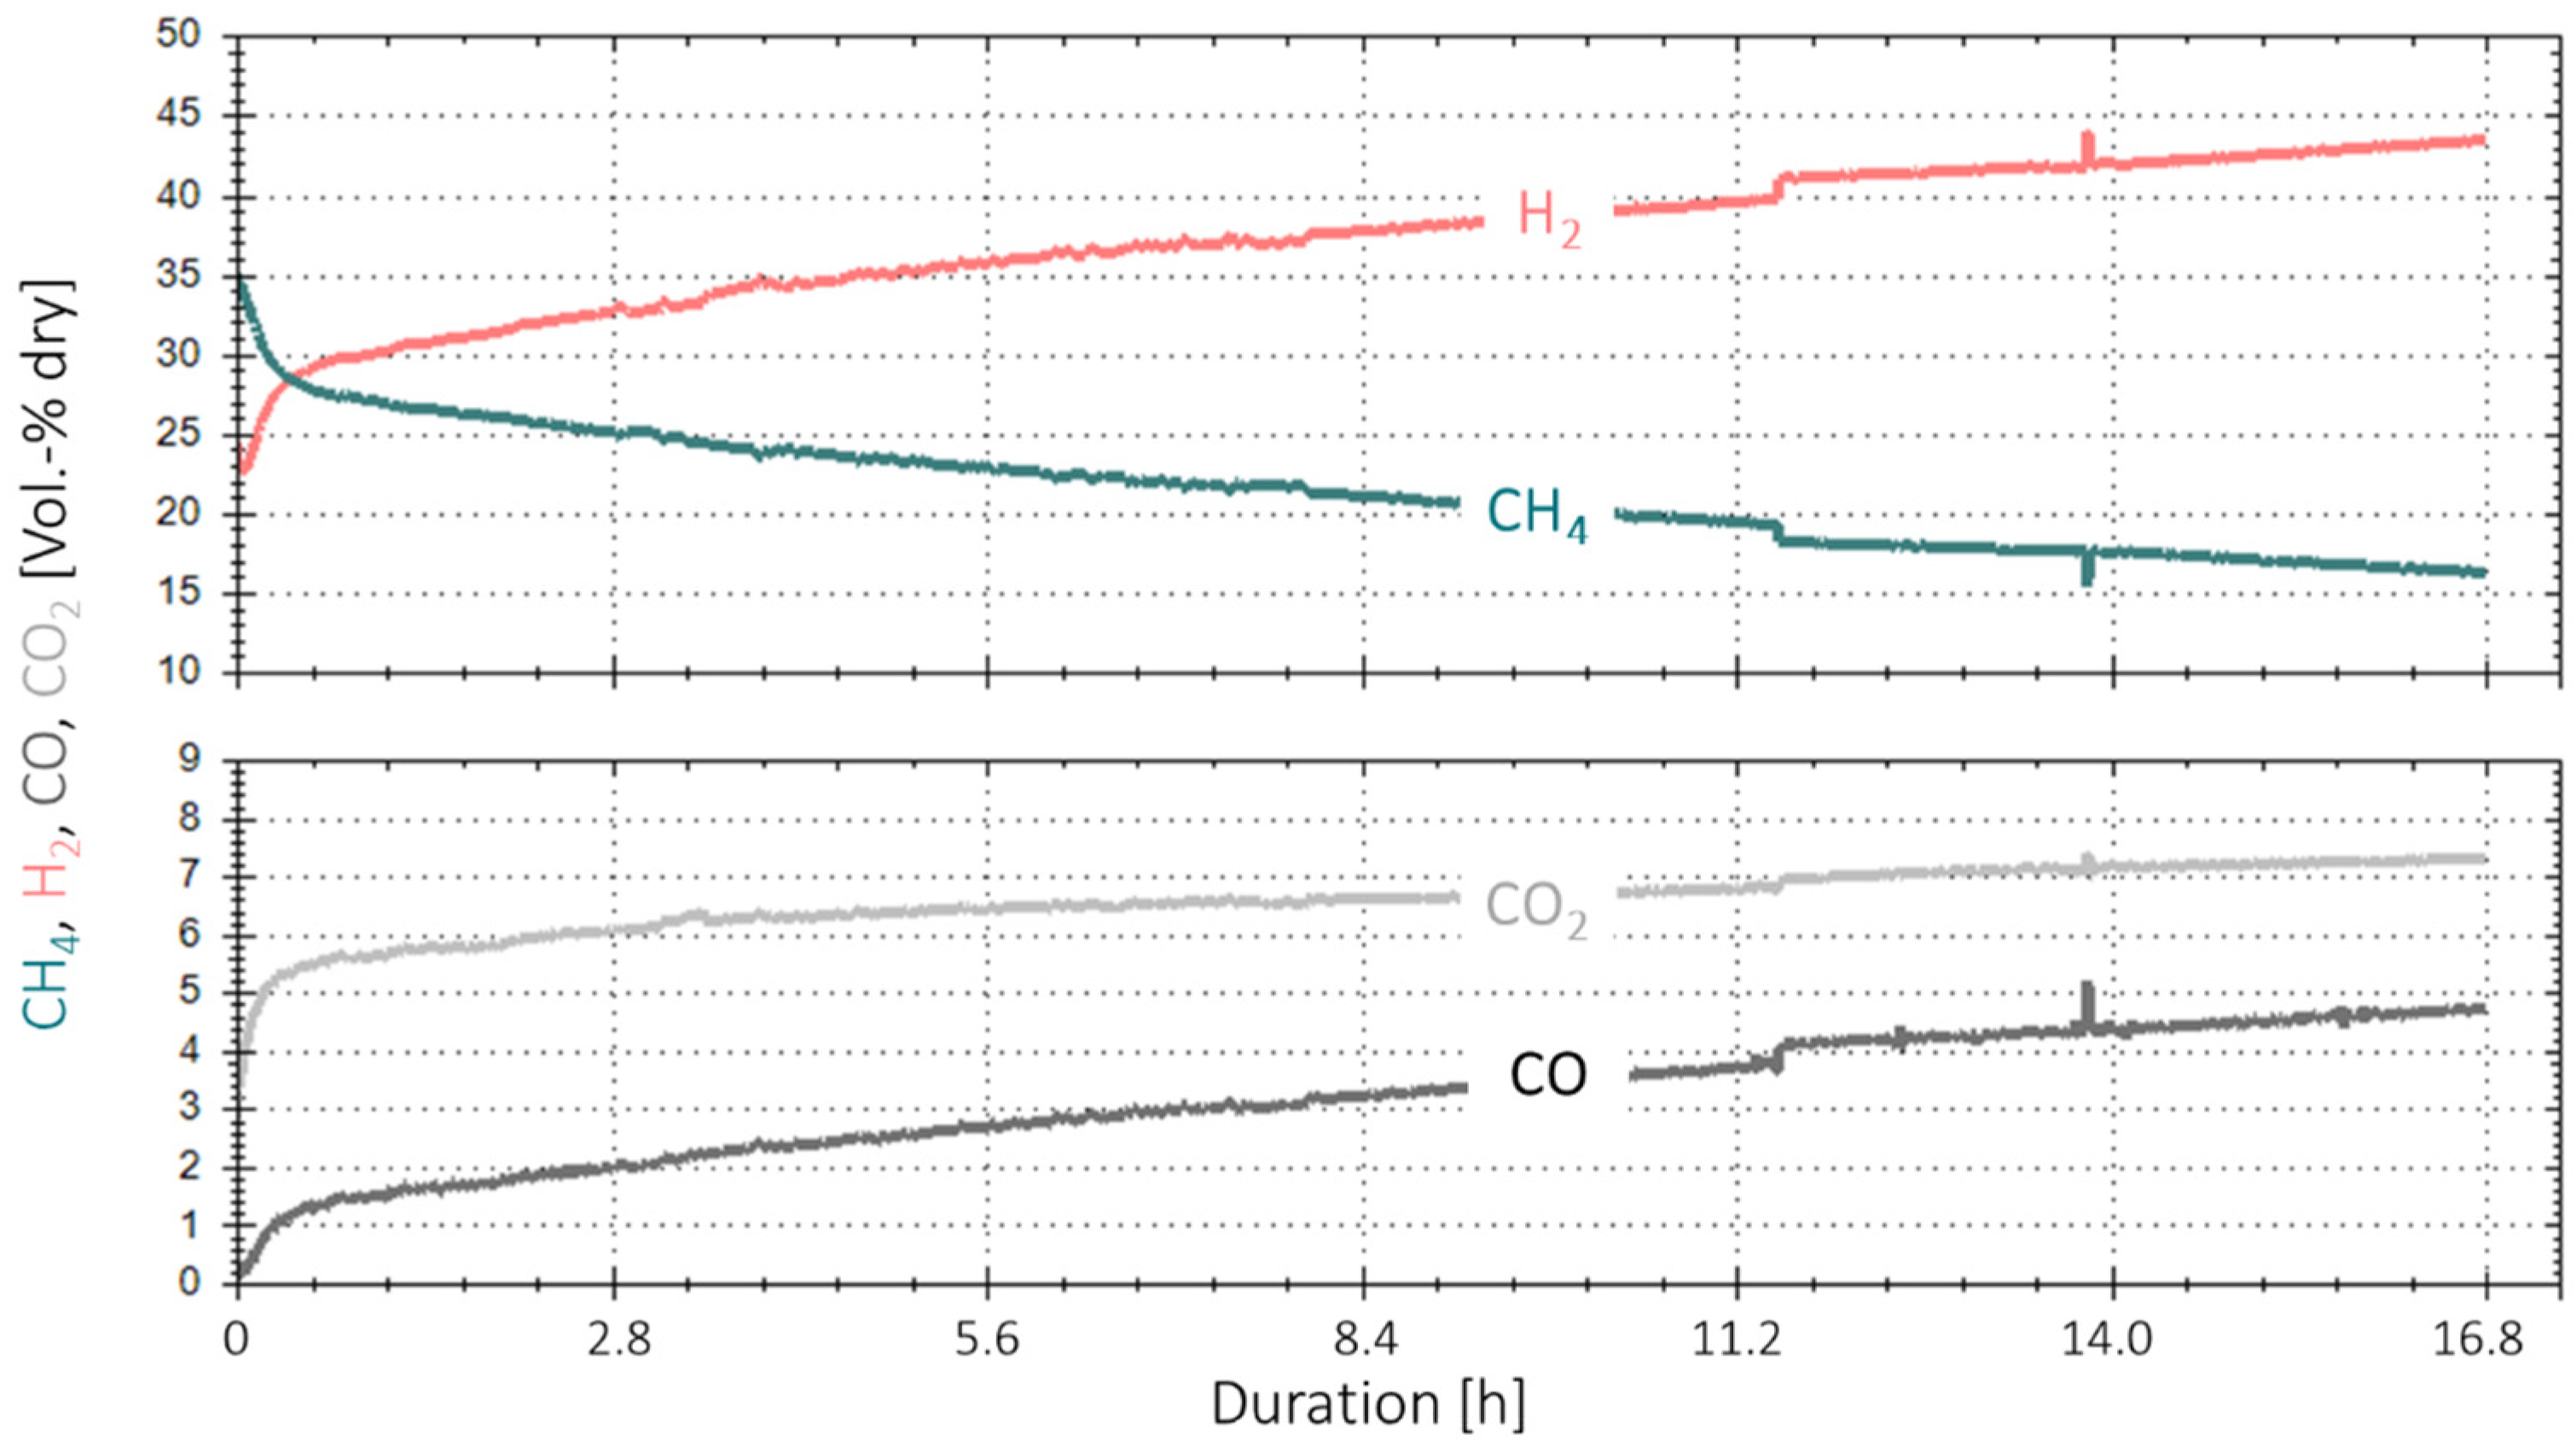
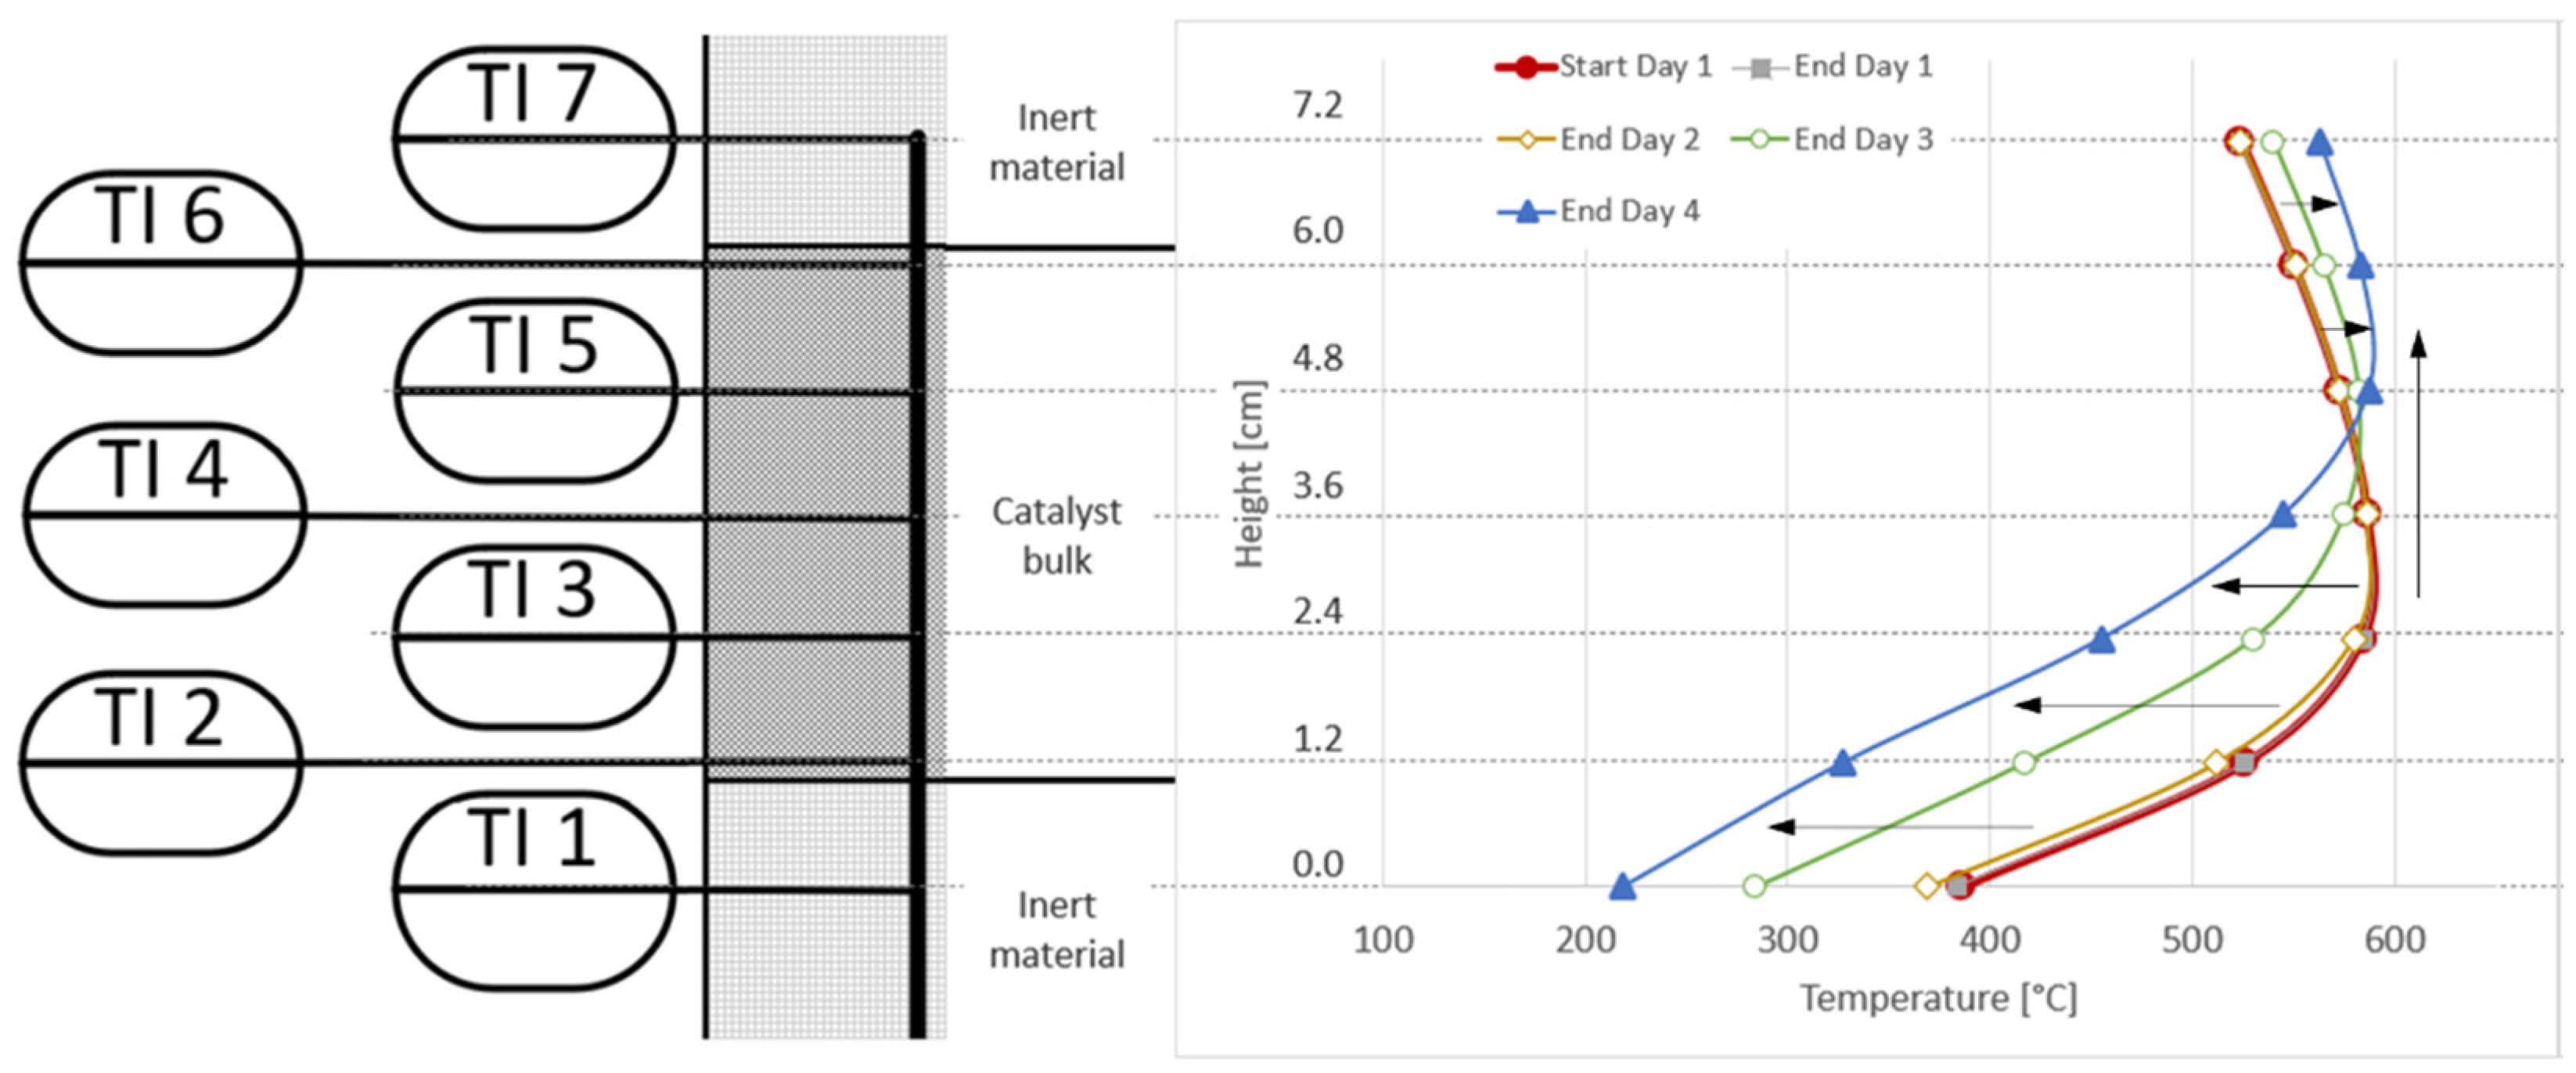
3.3. Extended Experiment Duration with Bottled Real BFG
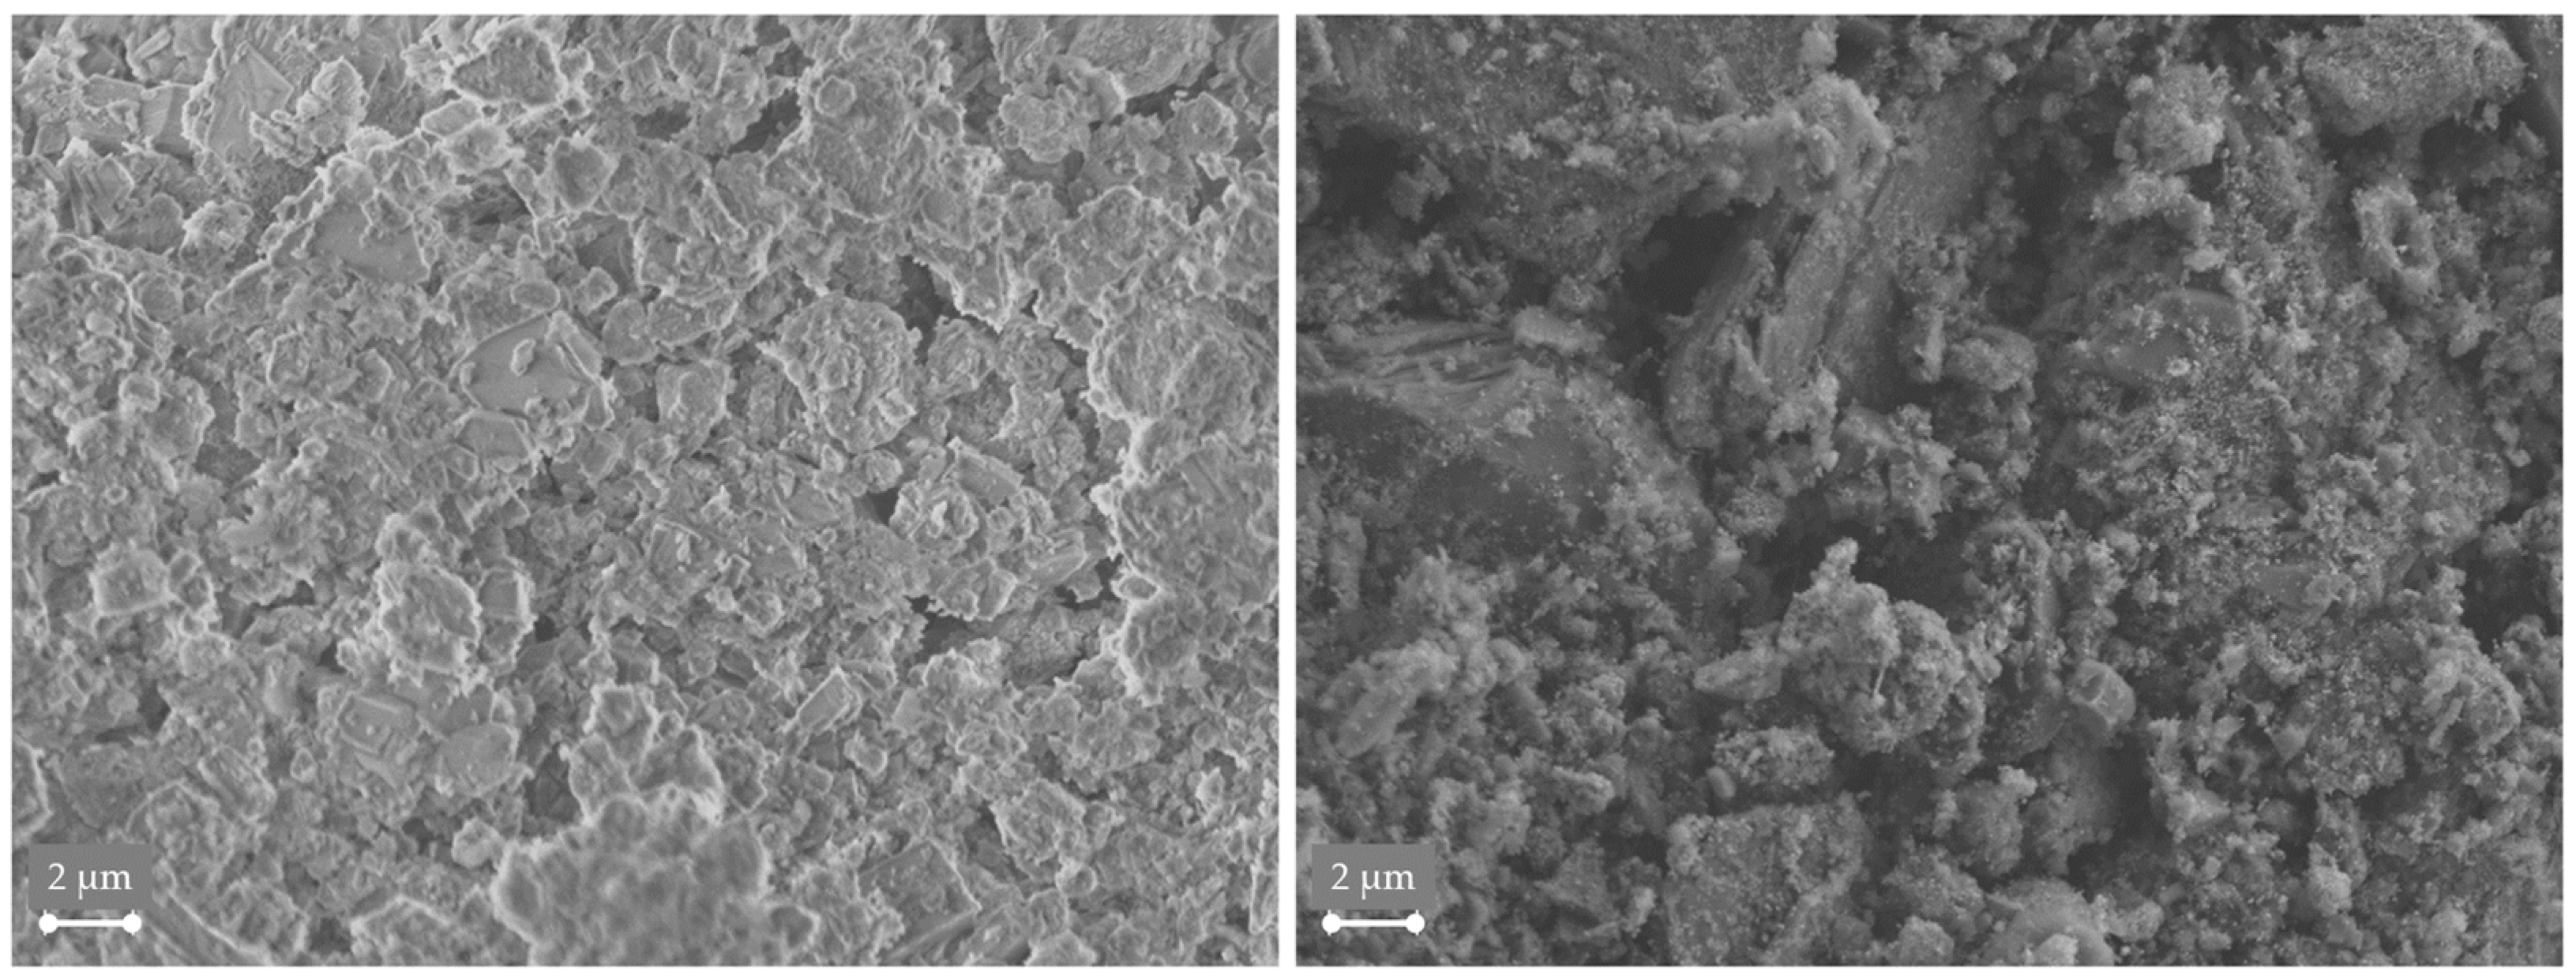
3.4. Analysis of Gas Condensate and Catalyst
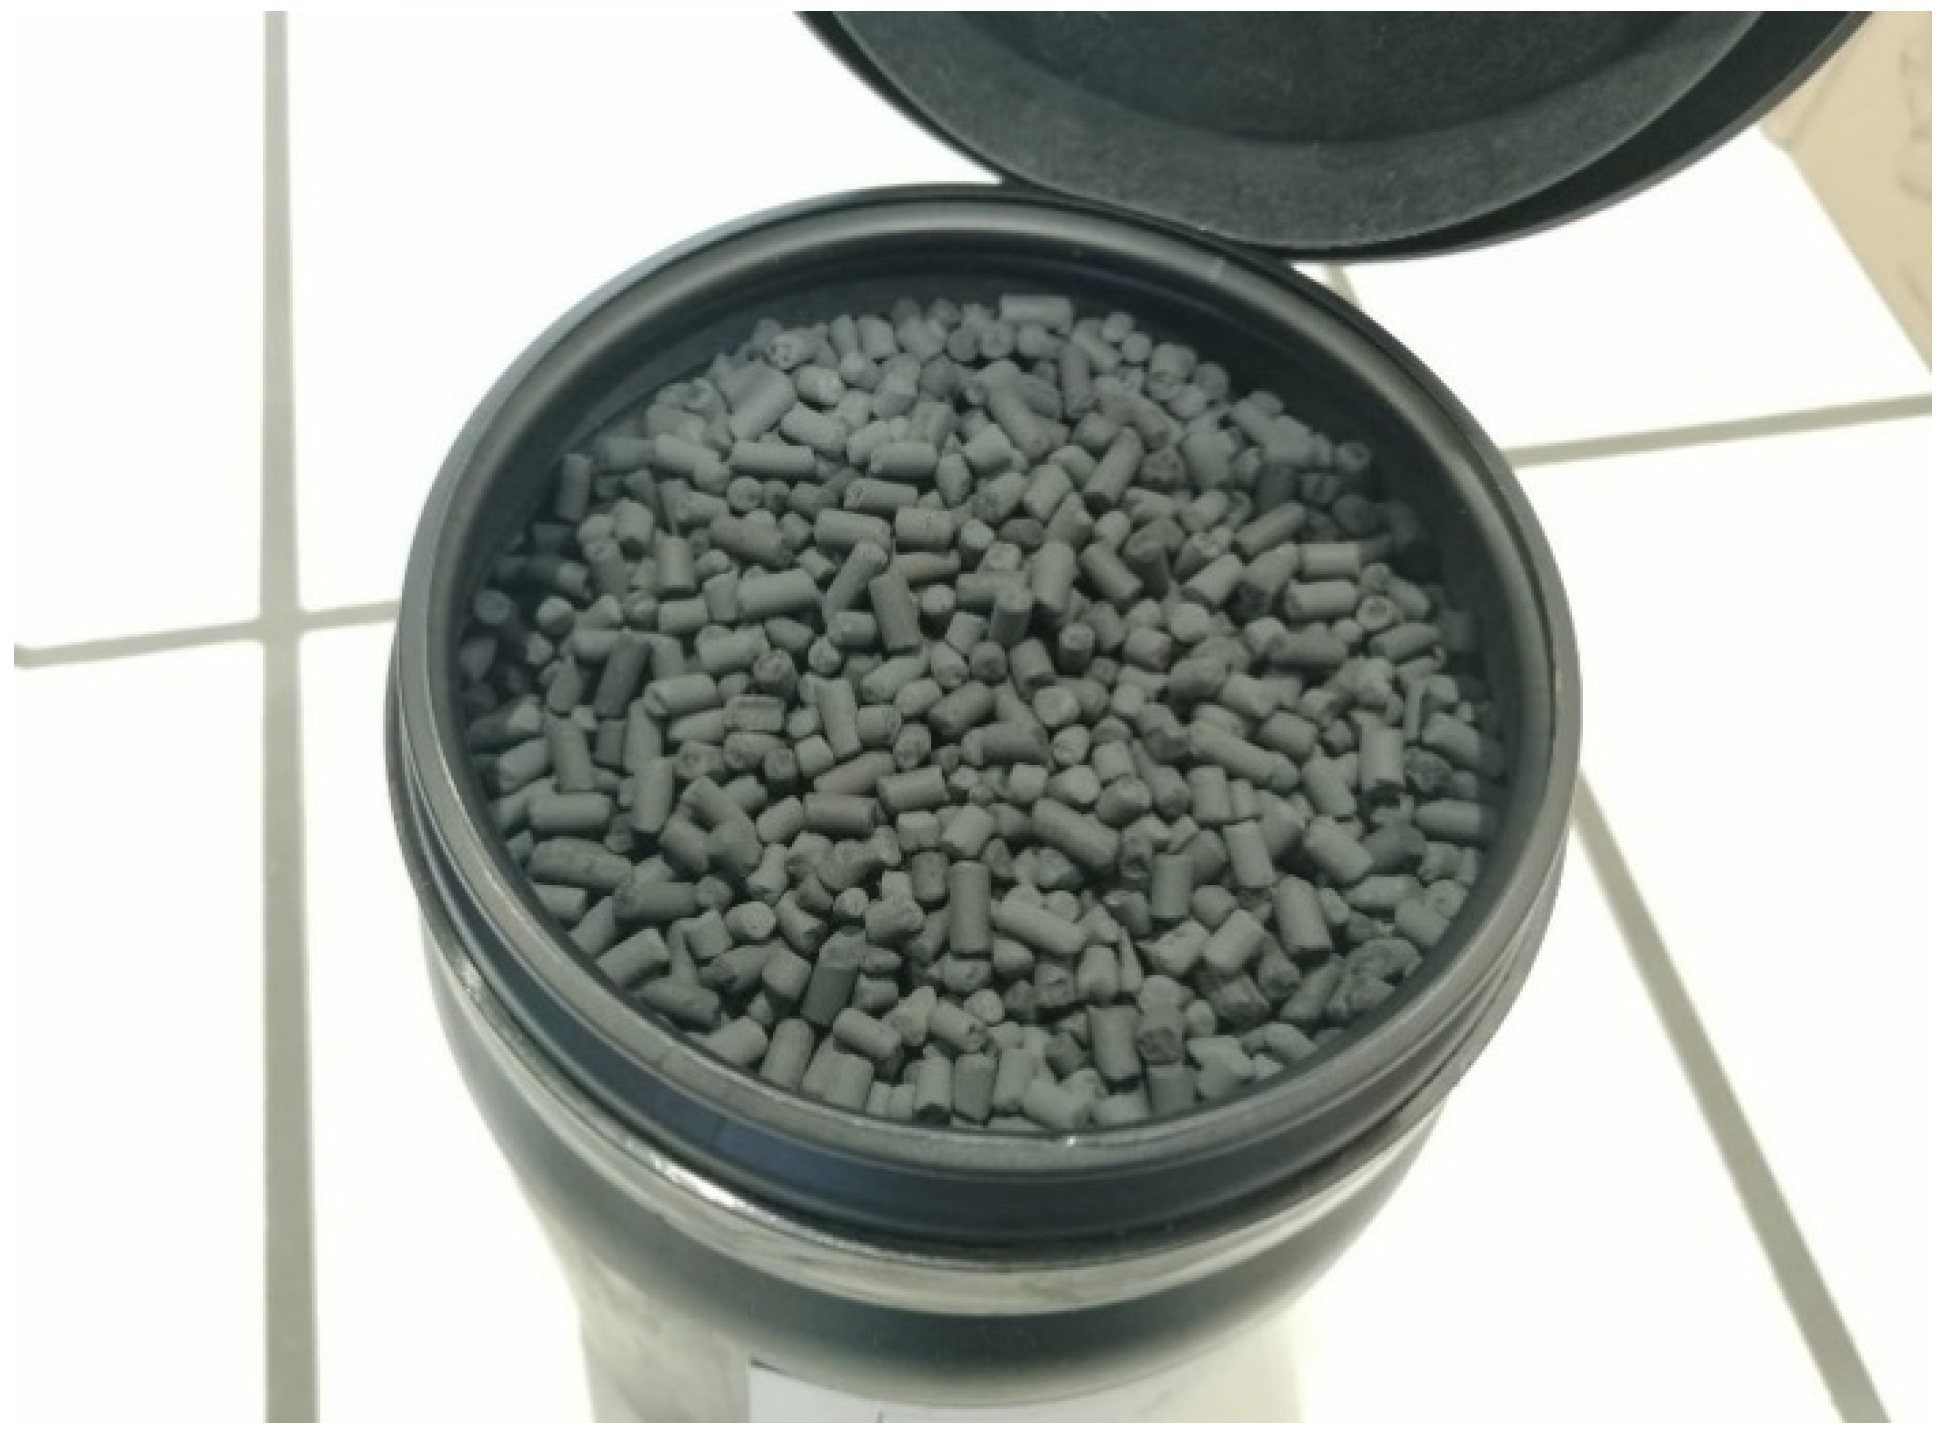
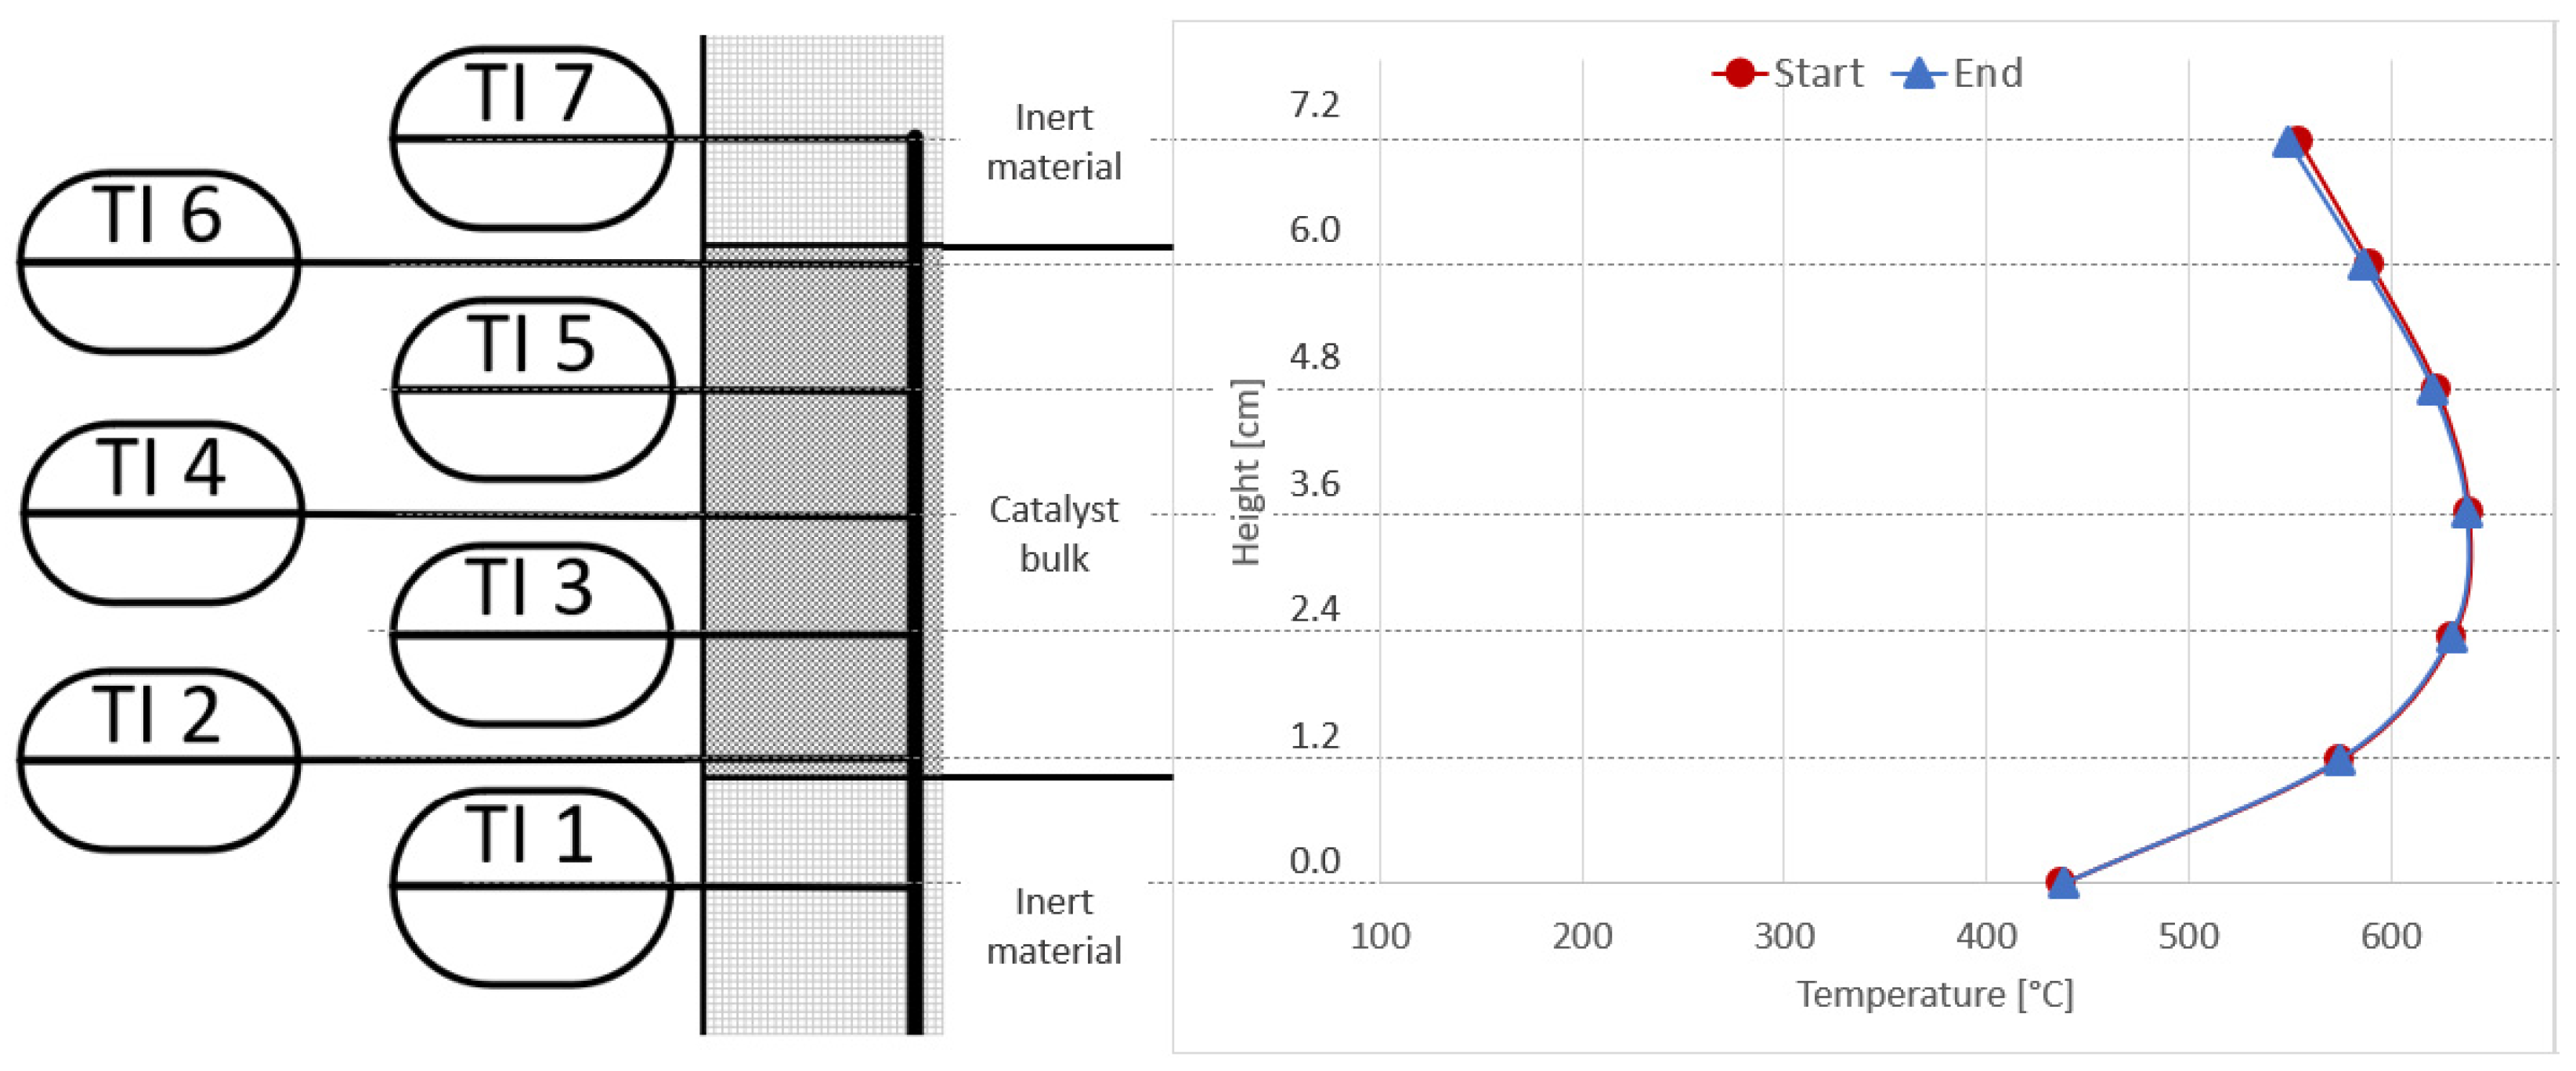
3.5. Implementation of Activated Carbon Filter
- Ccat_poison—avg. molar fraction of catalyst poison in the feed gas [mol/m3];
- Q—avg. flow rate of feed gas stream (real gas plus hydrogen) [m3/h];
- Mcat_poison—molar mass of catalyst poison [g/mol];
- t—operating hours [h];
- madsorbent—mass of activated carbon implemented [g].
4. Conclusions and Outlook
Author Contributions
Funding
Data Availability Statement
Acknowledgments
Conflicts of Interest
Abbreviations
| Reaction enthalpy | |
| Ratio of molar hydrogen flow compared to molar flows of CO and CO2 | |
| Qgas | Total feed gas volume flow |
| Vcatalyst | Catalyst volume |
| Molar flows | |
| Gas composition | |
| Ccat_poison | Avg. molar fraction of catalyst poison in the feed gas |
| Mcat_poison | Molar mass of catalyst poison |
| t | Operating hours |
| madsorbent | Mass of activated carbon |
| Δactivity | Relative activity loss |
| Δmcatalyst | Catalyst consumption |
| BFG | Blast furnace gas |
| BFGsyn | Synthetic blast furnace gas |
| BFGreal | Real blast furnace gas |
| BOFG | Basic oxygen furnace gas/converter gas |
| CH3SH | Methyl mercaptan |
| CH4 | Methane |
| Cl | Chloride |
| CnHm | Higher hydrocarbons (C2+) |
| CO | Carbon monoxide |
| CO2 | Carbon dioxide |
| COG | Coke oven gas |
| COS | Carbonyl sulphide |
| CS2 | Carbon disulphide |
| CuO | Copper oxide |
| E1,2 | Experiment 1 or 2 |
| GHG | Greenhouse gas |
| GHSV | Gas hourly space velocity |
| H2 | Hydrogen |
| H2O | Water or steam |
| H2S | Hydrogen sulphide |
| HCl | Hydrogen chloride |
| HCN | Hydrogen cyanide |
| Hg | Mercury |
| ID | Inner diameter |
| ISO | International Organization for Standardization |
| LHV | Lower heating value |
| N2 | Nitrogen |
| NH3 | Ammonia |
| Ni | Nickel |
| NO2 | Nitrogen dioxide |
| NOx | Nitrogen oxides |
| OD | Outer diameter |
| PEM | Proton-exchange membrane |
| ppm | Parts per million |
| R1, R2, R3 | Reactors 1, 2 or 3 |
| S | Sulphur |
| Sb | Antimony |
| SEM | Scanning electron microscope |
| SNG | Synthetic natural gas |
| SO2 | Sulphur dioxide |
| SO4 | Sulphate |
| STP | Standard temperature and pressure |
| TI1-7 | Temperature indicator 1 to 7 |
| TRL | Technology readiness level |
| vol.-% (dry) | Share in volume percent (dry basis) |
| W1, W2, W3 | Heat exchanger 1, 2 or 3 |
| wt.-% | Share in weight percent |
References
- Uribe-Soto, W.; Portha, J.-F.; Commenge, J.-M.; Falk, L. A review of thermochemical processes and technologies to use steelworks off-gases. Renew. Sustain. Energy Rev. 2017, 74, 809–823. [Google Scholar] [CrossRef]
- Hasanbeigi, A.; Arens, M.; Cardenas, J.C.R.; Price, L.; Triolo, R. Comparison of carbon dioxide emissions intensity of steel production in China, Germany, Mexico, and the United States. Resour. Conserv. Recycl. 2016, 113, 127–139. [Google Scholar] [CrossRef] [Green Version]
- World Steel Association. World Steel in Figures. 2020. Available online: www.worldsteel.org (accessed on 30 April 2020).
- Remus, R.; Aguado Monsonet, M.; Roudier, S.; Delgado Sancho, L. Best Available Techniques (BAT) Reference Document for Iron and Steel Production. Joint Research Centre Reference Report. In Industrial Emissions Directive 2010/75/EU Integrated Pollution Prevention and Control; European Commission JCR: Luxembourg, 2013. [Google Scholar]
- Sabatier, P.; Senderens, J.B. New methane synthesis. Compt. Rend. Acad. Sci. 1902, 134, 514–516. [Google Scholar]
- Rönsch, S.; Schneider, J.; Matthischke, S.; Schlüter, M.; Götz, M.; Lefebvre, J.; Prabhakaran, P.; Bajohr, S. Review on methanation–From fundamentals to current projects. Fuel 2016, 166, 276–296. [Google Scholar] [CrossRef]
- Müller, K.; Rachow, F.; Günther, V.; Schmeisser, D. Methanation of Coke Oven Gas with Nickel-based catalysts. Int. J. Env. Sci. 2019, 4, 73–79. [Google Scholar]
- Razzaq, R.; Zhu, H.; Jiang, L.; Muhammad, U.; Li, C.; Zhang, S. Catalytic Methanation of CO and CO2 in Coke Oven Gas over Ni–Co/ZrO2–CeO2. Ind. Eng. Chem. Res. 2013, 52, 2247–2256. [Google Scholar] [CrossRef]
- Medved, A.R.; Lehner, M.; Rosenfeld, D.C.; Lindorfer, J.; Rechberger, K. Enrichment of Integrated Steel Plant Process Gases with Implementation of Renewable Energy-Integration of power-to-gas and biomass gasification system in steel production. Johns. Matthey Technol. Rev. 2021, 65, 453–465. [Google Scholar] [CrossRef]
- Schöß, M.A.; Redenius, A.; Turek, T.; Güttel, R. Chemische Speicherung regenerativer elektrischer Energie durch Methanisierung von Prozessgasen aus der Stahlindustrie. Chem. Ing. Technik. 2014, 86, 734–739. [Google Scholar] [CrossRef]
- Lehner, M.; Biegger, P.; Medved, A.R. Power-to-Gas: Die Rolle der chemischen Speicherung in einem Energiesystem mit hohen Anteilen an erneuerbarer Energie. Elektrotechnik Und Inf. 2017, 134, 246–251. [Google Scholar] [CrossRef] [Green Version]
- Müller, K.; Rachow, F.; Israel, J.; Charlafti, E.; Schwiertz, C.; Scmeisser, D. Direct Methanation of Flue Gas at a Lignite Power Plant. Int. J. Env. Sci. 2017, 2, 425–437. [Google Scholar]
- Müller, K.; Fleige, M.; Rachow, F.; Schmeißer, D. Sabatier based CO2-methanation of Flue Gas Emitted by Conventional Power Plants. Energy Procedia 2013, 40, 240–248. [Google Scholar] [CrossRef] [Green Version]
- Rachow, F. Prozessoptimierung für Die Methanisierung von CO2-Vom Labor Zum Technikum. Ph.D. Thesis, Brandenburgische TU Cottbus-Senftenberg, Cottbus, Germany, 2017. [Google Scholar]
- Méndez-Mateos, D.; Barrio, V.L.; Requies, J.M.; Cambra, J.F. A study of deactivation by H2S and regeneration of a Ni catalyst supported on Al2O3, during methanation of CO2. Effect of the promoters Co, Cr, Fe and Mo. RSC Adv. 2020, 10, 16551–16564. [Google Scholar] [CrossRef]
- Calbry-Muzyka, A.S.; Schildhauer, T.J. Direct Methanation of Biogas—Technical Challenges and Recent Progress. Front. Energy Res. 2020, 8. [Google Scholar] [CrossRef]
- Witte, J.; Calbry-Muzyka, A.; Wieseler, T.; Hottinger, P.; Biollaz, S.M.; Schildhauer, T.J. Demonstrating direct methanation of real biogas in a fluidised bed reactor. Appl. Energy 2019, 240, 359–371. [Google Scholar] [CrossRef]
- Calbry-Muzyka, A.S.; Gantenbein, A.; Schneebeli, J.; Frei, A.; Knorpp, A.J.; Schildhauer, T.J.; Biollaz, S.M. Deep removal of sulfur and trace organic compounds from biogas to protect a catalytic methanation reactor. Chem. Eng. J. 2018, 360, 577–590. [Google Scholar] [CrossRef]
- Fitzharris, W.D. Sulfur deactivation of nickel methanation catalysts. J. Catal. 1982, 76, 369–384. [Google Scholar] [CrossRef]
- Bartholomew, C.H. Sulfur poisoning of nickel methanation catalysts: I. in situ deactivation by H2S of nickel and nickel bimetallics. J. Catal. 1979, 60, 257–269. [Google Scholar] [CrossRef]
- Biegger, P. Keramische Wabenkatalysatoren zur Chemischen Methanisierung von CO2. Ph.D. Thesis, Montanuniversität Leoben, Leoben, Austria, 2017. [Google Scholar]
- Biegger, P.; Kirchbacher, F.; Medved, A.R.; Miltner, M.; Lehner, M.; Harasek, M. Development of Honeycomb Methanation Catalyst and Its Application in Power to Gas Systems. Energies 2018, 11, 1679. [Google Scholar] [CrossRef] [Green Version]
- Medved, A.R. The Influence of Nitrogen on Catalytic Methanation. Ph.D. Thesis, Montanuniversität Leoben, Leoben, Austria, 2020. [Google Scholar]
- Lanzerstorfer, C.; Preitschopf, W.; Neuhold, R.; Feilmayr, C. Emissions and Removal of Gaseous Pollutants from the Top-gas of a Blast Furnace. ISIJ Int. 2019, 59, 590–595. [Google Scholar] [CrossRef] [Green Version]
- Voestalpine Stahl GmbH Prüftechnik & Analytik. Analysenergebnisse der Umwelt-Und Betriebsanalytik. Linz, Austria. 2019. Available online: https://www.voestalpine.com/technischerservice/Prueftechnik-und-Analytik/Umweltanalytik (accessed on 18 August 2021).
- Hauser, A.; Weitzer, M.; Gunsch, S.; Neubert, M.; Karl, J. Dynamic hydrogen-intensified methanation of synthetic by-product gases from steelworks. Fuel Process. Technol. 2021, 217, 106701. [Google Scholar] [CrossRef]
- Wolf-Zoellner, P.; Lehner, M.; Hauser, A.; Neubert, M.; Karl, J. i3upgrade–Deliverable D2.4-Demonstration of New Reactors with Real Gases from Steelworks; Deliverable Report to EU Commission; EU Commission: Brussels, Belgium, 2020. [Google Scholar]
- Argyle, M.D.; Bartholomew, C.H. Heterogeneous Catalyst Deactivation and Regeneration: A Review. Catalysts 2015, 5, 145–269. [Google Scholar] [CrossRef] [Green Version]
- Neubert, M. Catalytic Methanation for Small- and Mid-Scale SNG Production. Ph.D. Thesis, Friedrich-Alexander-Universität Erlangen-Nuremberg, Erlangen, Germany, 2019. [Google Scholar]


| Parameter/Gas Component | Unit | COG | BFG | BOFG | ||
|---|---|---|---|---|---|---|
| Min | Max | Min | Max | Mean | ||
| CO2 | vol.-% (dry) | 1 | 5.4 | 16 | 26 | 17.2 |
| CO | vol.-% (dry) | 3.4 | 5.8 | 19 | 27 | 60.9 |
| H2 | vol.-% (dry) | 36.1 | 61.7 | 1 | 8 | 4.3 |
| N2 | vol.-% (dry) | 1.5 | 6 | 44 | 58 | 15.5 |
| CH4 | vol.-% (dry) | 15.7 | 27 | - | - | 0.1 |
| CnHm | vol.-% (dry) | 1.4 | 2.4 | - | - | - |
| Lower heating value (LHV) | kJ/Nm3 | 9000 | 19,000 | 2600 | 4000 | 8184 |
| Gas Component (vol.-% Dry) | BFG | BOFG |
|---|---|---|
| N2 | 48.6 | 26.5 |
| O2 | 0.6 | 0.5 |
| CO2 | 23.33 | 17.6 |
| CO | 24.17 | 54.5 |
| CH4 | n.d. | <0.1 |
| H2 | 3.3 | 0.9 |
| Σ CnHm | n.d. | <0.1 |
| Catalyst Poison | BFG | BOFG |
|---|---|---|
| mg/Nm3 | mg/Nm3 | |
| H2S | 28 | <1 |
| CS2 | 0.26 | <1 |
| COS | 110 | <1 |
| SO2 | 2.2 | 0.99 |
| HCl | <1 | 0.05 |
| NH3 | 0.15 | 0.05 |
| CH3SH | <1 | <1 |
| C3H6O | n.d. | n.d. |
| HCN | 0.12 | n.d. |
| Sb | n.d. | <0.001 |
| Hg | n.d. | n.d. |
| Parameter | Value Measured for | Unit | Determination Limit | |
|---|---|---|---|---|
| Real Gas | Synthetic Gas | |||
| pH-value | 8.5 | 6.7 | - | - |
| Chloride Cl | <0.50 | <0.50 | mg/L | 0.50 |
| Sulphate SO4 | <0.50 | <0.50 | mg/L | 0.50 |
| Nickel Ni | 73 | 22 | µg/L | 1.0 |
| Sulphur S | <5.0 | <5.0 | mg/L | 5.0 |
| Gas Component | BFGreal | BFGsyn |
|---|---|---|
| CO2 | 5.26 | 6.0 |
| CO | 0.92 | 0.99 |
| CH4 | 30.98 | 32.45 |
| H2 | 25.19 | 24.5 |
| N2 | 37.65 | 36.06 |
| Gas Type | Ref. #1 | Ref. #2 | Ref. #3 |
|---|---|---|---|
| CO2 | 0.7 | 0.9 | 0.8 |
| CO | 0.0 | 0.0 | 0.0 |
| CH4 | 39.7 | 39.3 | 39.5 |
| H2 | 57.2 | 57.7 | 57.4 |
| Catalyst Poison | BFGreal | Loading |
|---|---|---|
| mg/Nm3 | wt.-% | |
| H2S | 28 | 0.2 |
| CS2 | 0.26 | 0.01 |
| COS | 110 | 0.73 |
| SO2 | 2.2 | 0.02 |
| HCl | <1 | <0.01 |
| NH3 | 0.15 | 0.001 |
| CH3SH | <1 | <0.02 |
| HCN | 0.12 | 0.001 |
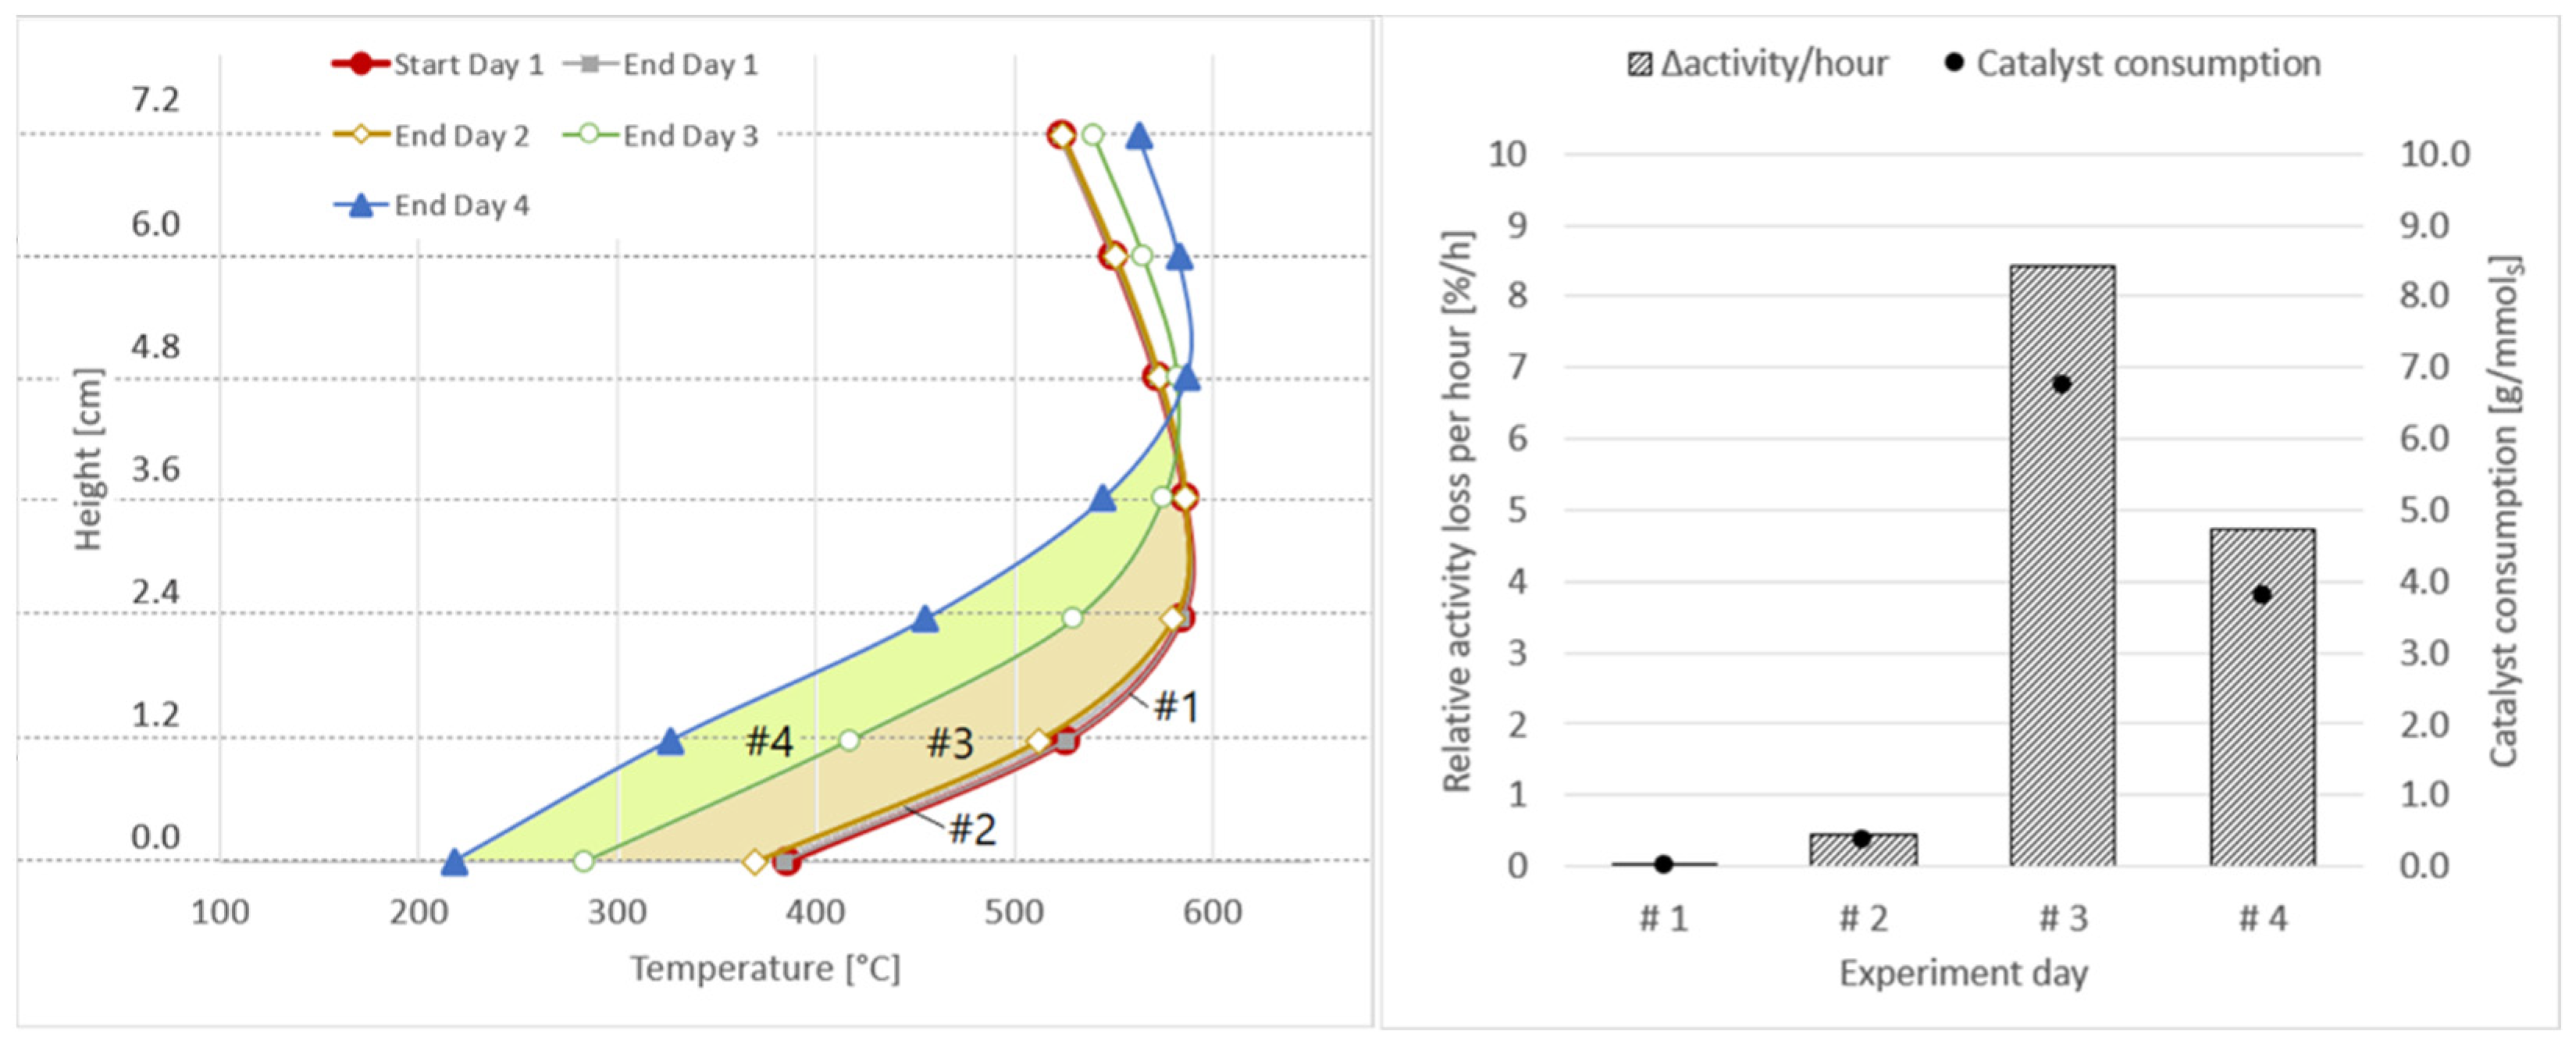
| Experiment Day | Area between Axial Temperature Profiles | Δactivity [%] | Δactivity/h [%/h] | Δmcatalyst [gcat/mmolsulphur] | Δmcatalyst [gcat/m3] |
|---|---|---|---|---|---|
| #1 | Start day 1–End day 1 – –  | 0.19 | 0.04 | 0.03 | 0.1 |
| #2 | End day 1–End day 2 – –  | 2.79 | 0.46 | 0.37 | 1.0 |
| #3 | End day 2–End day 3 – –  | 21.04 | 8.42 | 6.77 | 18.2 |
| #4 | End day 3–End day 4 – –  | 23.69 | 4.74 | 3.81 | 10.3 |
| Gas Component | BOFGreal | BOFGsyn |
|---|---|---|
| CO2 | 7.04 | 6.50 |
| CO | 2.28 | 2.43 |
| CH4 | 37.06 | 38.12 |
| H2 | 36.19 | 38.57 |
| N2 | 17.43 | 14.38 |
Publisher’s Note: MDPI stays neutral with regard to jurisdictional claims in published maps and institutional affiliations. |
© 2021 by the authors. Licensee MDPI, Basel, Switzerland. This article is an open access article distributed under the terms and conditions of the Creative Commons Attribution (CC BY) license (https://creativecommons.org/licenses/by/4.0/).
Share and Cite
Wolf-Zoellner, P.; Medved, A.R.; Lehner, M.; Kieberger, N.; Rechberger, K. In Situ Catalytic Methanation of Real Steelworks Gases. Energies 2021, 14, 8131. https://doi.org/10.3390/en14238131
Wolf-Zoellner P, Medved AR, Lehner M, Kieberger N, Rechberger K. In Situ Catalytic Methanation of Real Steelworks Gases. Energies. 2021; 14(23):8131. https://doi.org/10.3390/en14238131
Chicago/Turabian StyleWolf-Zoellner, Philipp, Ana Roza Medved, Markus Lehner, Nina Kieberger, and Katharina Rechberger. 2021. "In Situ Catalytic Methanation of Real Steelworks Gases" Energies 14, no. 23: 8131. https://doi.org/10.3390/en14238131
APA StyleWolf-Zoellner, P., Medved, A. R., Lehner, M., Kieberger, N., & Rechberger, K. (2021). In Situ Catalytic Methanation of Real Steelworks Gases. Energies, 14(23), 8131. https://doi.org/10.3390/en14238131