Article

In Situ Catalytic Methanation of Real Steelworks Gases

by
Philipp Wolf-Zoellner
1,
Ana Roza Medved
1,
Markus Lehner
1,*,
Nina Kieberger
2 and
Katharina Rechberger
3
1
Chair of Process Technology and Industrial Environmental Protection, Montanuniversität Leoben, Franz-Josef-Strasse 18, 8700 Leoben, Austria
2
Voestalpine Stahl GmbH, Research and Development Ironmaking, Voestalpine Straße 3, 4020 Linz, Austria
3
K1-MET GmbH, Stahlstraße 14, 4020 Linz, Austria
*
Author to whom correspondence should be addressed.
Energies 2021, 14(23), 8131; https://doi.org/10.3390/en14238131
Submission received: 9 November 2021 / Revised: 29 November 2021 / Accepted: 29 November 2021 / Published: 3 December 2021
(This article belongs to the Special Issue Catalytic Processes for CO2 Utilization)

Abstract

:
The by-product gases from the blast furnace and converter of an integrated steelworks highly contribute to today’s global CO2 emissions. Therefore, the steel industry is working on solutions to utilise these gases as a carbon source for product synthesis in order to reduce the amount of CO2 that is released into the environment. One possibility is the conversion of CO2 and CO to synthetic natural gas through methanation. This process is currently extensively researched, as the synthetic natural gas can be directly utilised in the integrated steelworks again, substituting for natural gas. This work addresses the in situ methanation of real steelworks gases in a lab-scaled, three-stage reactor setup, whereby the by-product gases are directly bottled at an integrated steel plant during normal operation, and are not further treated, i.e., by a CO2 separation step. Therefore, high shares of nitrogen are present in the feed gas for the methanation. Furthermore, due to the catalyst poisons present in the only pre-cleaned steelworks gases, an additional gas-cleaning step based on CuO-coated activated carbon is implemented to prevent an instant catalyst deactivation. Results show that, with the filter included, the steady state methanation of real blast furnace and converter gases can be performed without any noticeable deactivation in the catalyst performance.

1. Introduction

Integrated steelworks are major contributors to today’s global CO2-emissions. Review publications screening the steelmaking process around the globe revealed that approximately 27 to 30% of any industrial CO2 emissions are directly linked to this sector [1,2]. With a world-wide crude steel production of 1869 million tonnes in 2019 and a 3.6% per annum average growth rate, the steel demand of our society is increasing strongly. These large amounts of steel are mainly required for building and infrastructure (~52%), mechanical equipment (~16%) and the automotive sector (~12%) [3]. Figure 1 shows the most common route of steelmaking globally, which includes a blast furnace for the reduction of iron ore to hot metal and a converter or basic oxygen furnace for the batch-wise production of molten steel. The accumulating by-product gases, such as the blast furnace gas (BFG), basic oxygen furnace gas (BOFG) and coke oven gas (COG), have a very rich content of CO2 and carbon monoxide (CO), among other gases (Table 1). At the current stage, these by-product gases are buffered within the steelwork and utilised as an energy carrier internally. Nevertheless, additional fossil energy sources, such as natural gas, are needed to cover the whole energy demand for the power plant and auxiliary energy conversion. Prior to any further use, the product gases are cleaned in a two-stage process, including, for example, a dust collector for the separation of coarse dust, and a venturi scrubber for fine dust and water-soluble components.
With the challenging targets of the climate agreements being set, the steel industry sector logically seeks for possibilities to reduce their greenhouse gas (GHG) emissions, as well as to incorporate green energy sources in the steelmaking process itself. One way of reducing the GHG emissions, and simultaneously substituting the need for fossil fuels, is the implementation of synthesis processes, such as methanation. In this process, CO2 and CO react with hydrogen (H2), gained from green energy sources—for instance, renewable power driving water electrolysis—to create methane (CH4) and steam (Equations (1) and (2)) [5].
CO + 3   H 2 =   CH 4 + H 2 O ( g )                                               Δ H r 0 = 206   kJ / mol
CO 2 + 4   H 2 =   CH 4 + 2   H 2 O ( g )                                               Δ H r 0 = 165   kJ / mol
These two reactions are highly exothermic and are linked via the reverse water–gas shift reaction (Equation (3)).
CO 2 + H 2 =   CO + H 2 O ( g )                                               Δ H r 0 = 41   kJ / mol
Although these reactions are well-known, the behaviour with real, untreated steelworks gases, as the COx source, are yet to be investigated. The detailed fundamentals behind the methanation concept, possible reactor designs and available catalysts are documented by Rönsch et al., combining them with an up-to date overview on methanation projects and the state-of-the-art in the research [6].
Current work on the methanation of steelworks gases primarily focuses on the usage of COG due to its favourable composition. The high amount of hydrogen (up to ~60%) makes it an attractive feedstock to produce synthetic natural gas (SNG), as it also works as an alternative hydrogen source compared to a solution involving an electrolysing unit (e.g., PEM). Müller et al. [7] investigated the direct conversion of CO and CO2 from synthetic COG into methane using nickel (Ni)-based catalysts in a fixed-bed reactor. It was shown that additional CO2 from other sources (e.g., air, flue gas) is required to compensate for the high surplus of hydrogen in the COG to achieve a desirable methane yield. Razzaq et al. [8] tested various Ni-based catalyst support materials (SiO2, Al2O3, ZrO2 and CeO2) for the methanation of synthetic COG. The COx conversion rates and CH4 selectivity in a fixed-bed reactor were evaluated. Results showed that ZrO2-CeO2-coated catalysts have the highest activity and selectivity for CO and CO2 for synthetic gases with COG composition.
Medved et al. [9] showed in their work that, although the gas from the coke oven seems to be the favourable by-product gas for methanation, it is already fully energetically integrated into the process chain of integrated steelworks. Due to its high calorific value of up to 19.000 kJ/Nm3, it is used plant-internally at the blast furnace for firing processes, as well as for the power plant. Consequently, it is not readily available as an input for a methanation unit without significantly affecting the steelmaking process and disturbing the energy balance of the plant. The utilization of COG necessitates its substitution by external energy sources, such as electric power and natural gas, respectively. Therefore, the other two by-product gases, BFG and BOFG, with their very high amount of CO2, CO and N2, have been evaluated for their applicability as a feed gas for a methanation plant. Furthermore, the authors concluded that the enrichment of BFG and BOFG via methanation, without the necessity of nitrogen removal, as a lean product gas shows a utilisation potential in the integrated steel plant as a substitute for natural gas. Schöß et al. [10] concluded that, although both gases (BFG and BOFG) are suitable carbon sources for the SNG process with the addition of hydrogen for reaction stoichiometry, the necessary specifications of the natural gas grid cannot be met, due to the high content of nitrogen and the resulting low calorific value. In addition, the significant amount of catalyst poisons present in the already cleaned by-product gases needs to be addressed. Lehner et al. [11] added that, for converting steelworks gases to methane, a load flexible reactor setup is favourable to meet the fluctuations in the process gas and hydrogen availability.
Studies on methanation are mainly based on synthetic gas mixtures simulating real gas compositions. Nevertheless, Müller et al. [12], for example, evaluated the direct CO2 methanation of flue gases at a lignite power plant, showing that the same commercial Ni-based catalyst used in this work did not degrade during the time frame of the experiments. The real gases included the following catalyst poisons: 63 ppm SO2, 36 ppm NO2. The same authors further investigated the CO2 methanation of flue gases emitted by conventional power plants [13]. They used synthetic gases simulating the real gas composition, including contaminations of up to 100 ppm NO2 and 80 ppm SO2. The experiments showed a decrease in the conversion, yield and selectivity by 17% in 12.5 h, or 1.36% per hour. The authors also concluded that the deactivation caused by SO2 is low in relation to a possible degradation caused by traces of H2S. Rachow [14] studied the influence of catalyst deactivation by sulphur compounds and NOx components. The author confirmed through experiments with bottled flue gases from coal-fired power plants, as well as with real gases from the cement industry, that Ni-based catalysts strongly degrade in the range of hours when exposed to SO2 and sulphur compounds in general. The degree of deactivation depends on the catalyst, its active surface area, the SO2 concentration and the total volume flow rate. No deactivation was observed during experiments with NOx contaminations. Méndez-Mateos et al. [15] studied the CO2 methanation over modified Ni catalysts, integrating promoters (transition metals, such as Mo, Fe, Co or Cr), which were added to the catalyst formulation in different portions. The target was to improve the catalyst’s resistance over sulphur, and H2S in particular. The authors showed that the catalyst activity between 573 and 773 K at 10 bar increased when transition metals were added, except for Mo. In addition, it was possible to regenerate the Co-modified catalyst with oxygen, recovering to a 13% methane yield compared to the fresh catalyst. Calbry-Muzyka et al. [16] reported on the technical challenges and recent progress made when using biogas as an input for direct methanation. Due to the varying composition of the biogas feedstock, no standard gas cleaning solution has been developed so far. Nevertheless, thorough H2S and non-H2S sulphur removal to the sub-ppm level is necessary in order to prevent catalyst deactivation. Witte et al. [17] demonstrated the stable operation of a catalytic direct methanation with biogas in a fluidised bed reactor for over 1100 h. Only a slow deactivation by organic sulphur compounds was identified, which broke through the gas cleaning unit with concentrations between 0.5 and 3 ppmv. The installed unit contained a two-stage adsorption-based biogas cleaning system for deep desulphurization [18]. Fitzharris et al. [19] concluded in their work that Ni-based catalysts are highly sensitive to poisoning by sulphur due to geometric, and not electronic, effects. Concentrations of H2S as low as 13 ppb in H2 reduced the steady state methanation activity by more than two orders of magnitude. Bartholomew et al. [20] showed that, under typical low-pressure reaction conditions for methanation (525 K, 1 atm) in a reaction mixture containing 10 ppm H2S, Ni-based catalysts lost most of their activity within a period of 2 to 3 days. The rate of deactivation due to H2S poisoning increased with an increasing H2/CO ratio, as well as with an increasing reaction temperature.
Although the applicability of steelworks gases as feed for the synthesis of methane was addressed and confirmed by multiple authors [7,8,9,10,11], experiments with real gases, including contaminations poisonous to catalysts, have not yet been performed. Consequently, the main aim of this work is to show the degree of degradation when using real BFG and BOFG (including nitrogen) as an input for a methanation unit in a composition, as given in Table 1, as well as to present a working solution to overcome the problem of catalyst deactivation.

2. Methods and Methodology

2.1. Experimental Setup

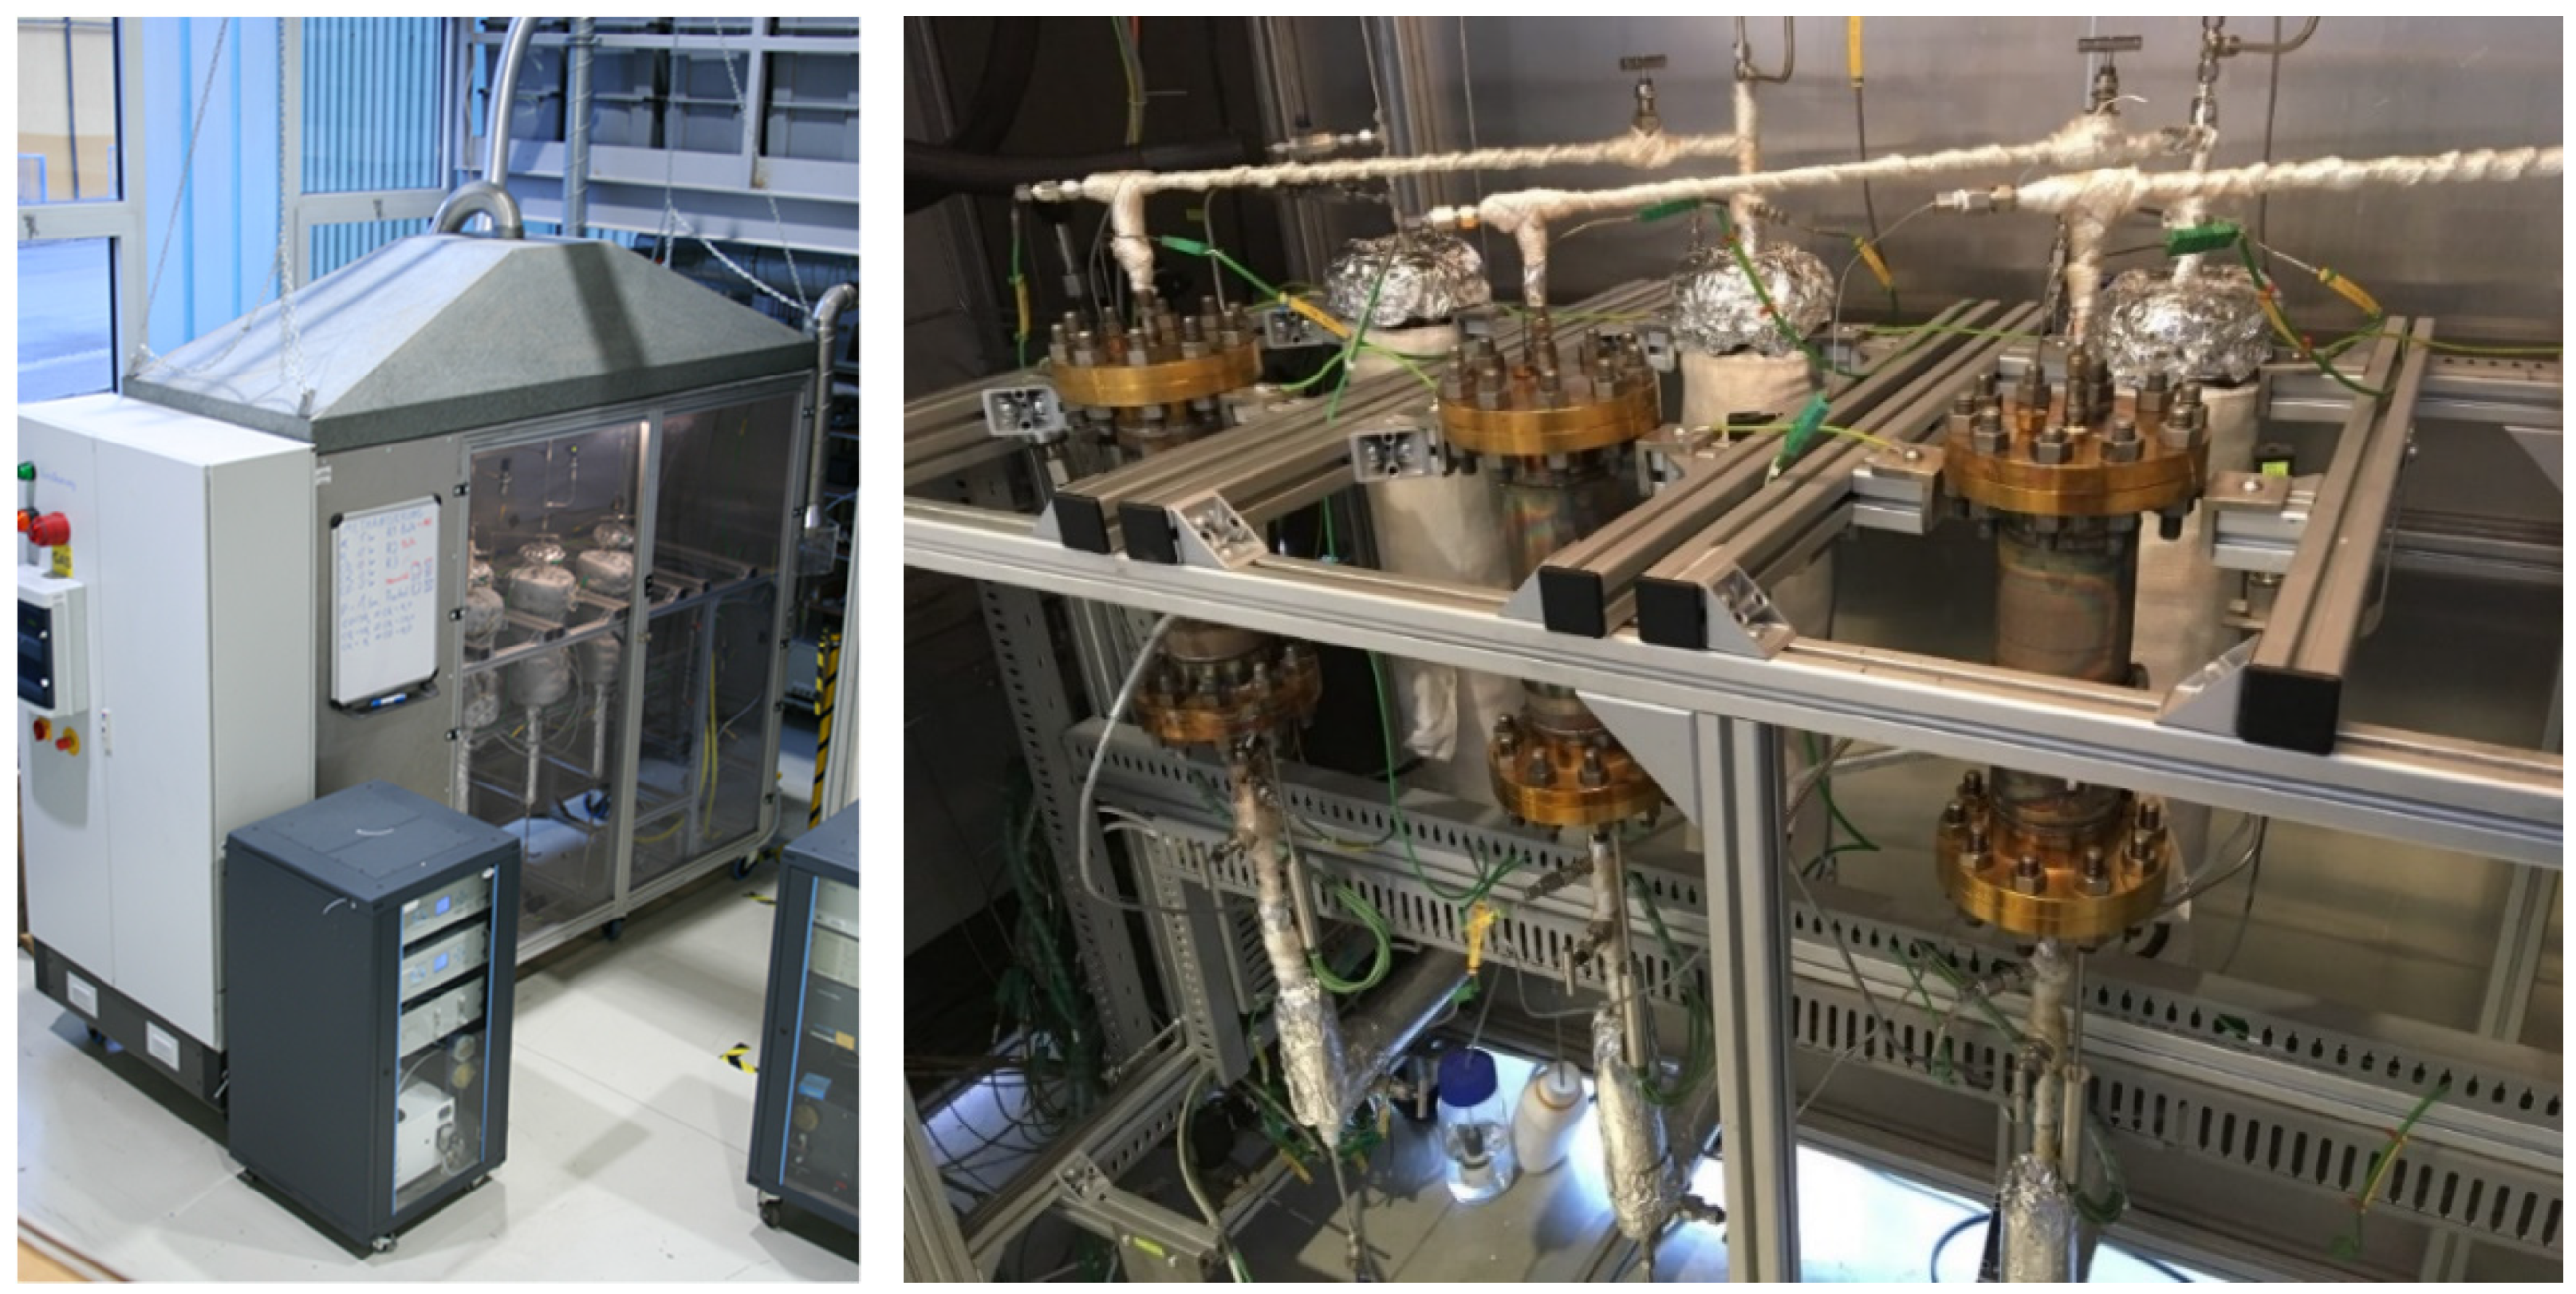
The experiments presented throughout this paper were carried out with the lab-scaled methanation test rig shown in Figure 2 on the left [21]. The technology was validated in relevant environments, consequently representing a Technology Readiness Level of 5 (TRL 5). The unit consists of three cylindric reactors, each made from austenitic stainless steel (304H chromium-nickel (1.4948)), with a height of 300 mm and an inner diameter of 80 mm. The reactors are connected in series but can also be operated individually (Figure 2, right). At the bottom, each reactor is filled with 3/8” stoneware balls over a height of 100 mm in order to ensure an evenly distributed gas stream through the catalyst section located on top of the inert material. The catalysts used are either a commercial Ni-based bulk catalyst (Meth 134®, 3–6 mm spheres with a Ni-loading of 20 wt.-%), or Ni/boehmite wash-coated ceramic honeycombs [22]. For the experimental results shown throughout this work, only the bulk catalyst was used. The remaining volume towards the top of the reactors is again filled with the same inert balls.
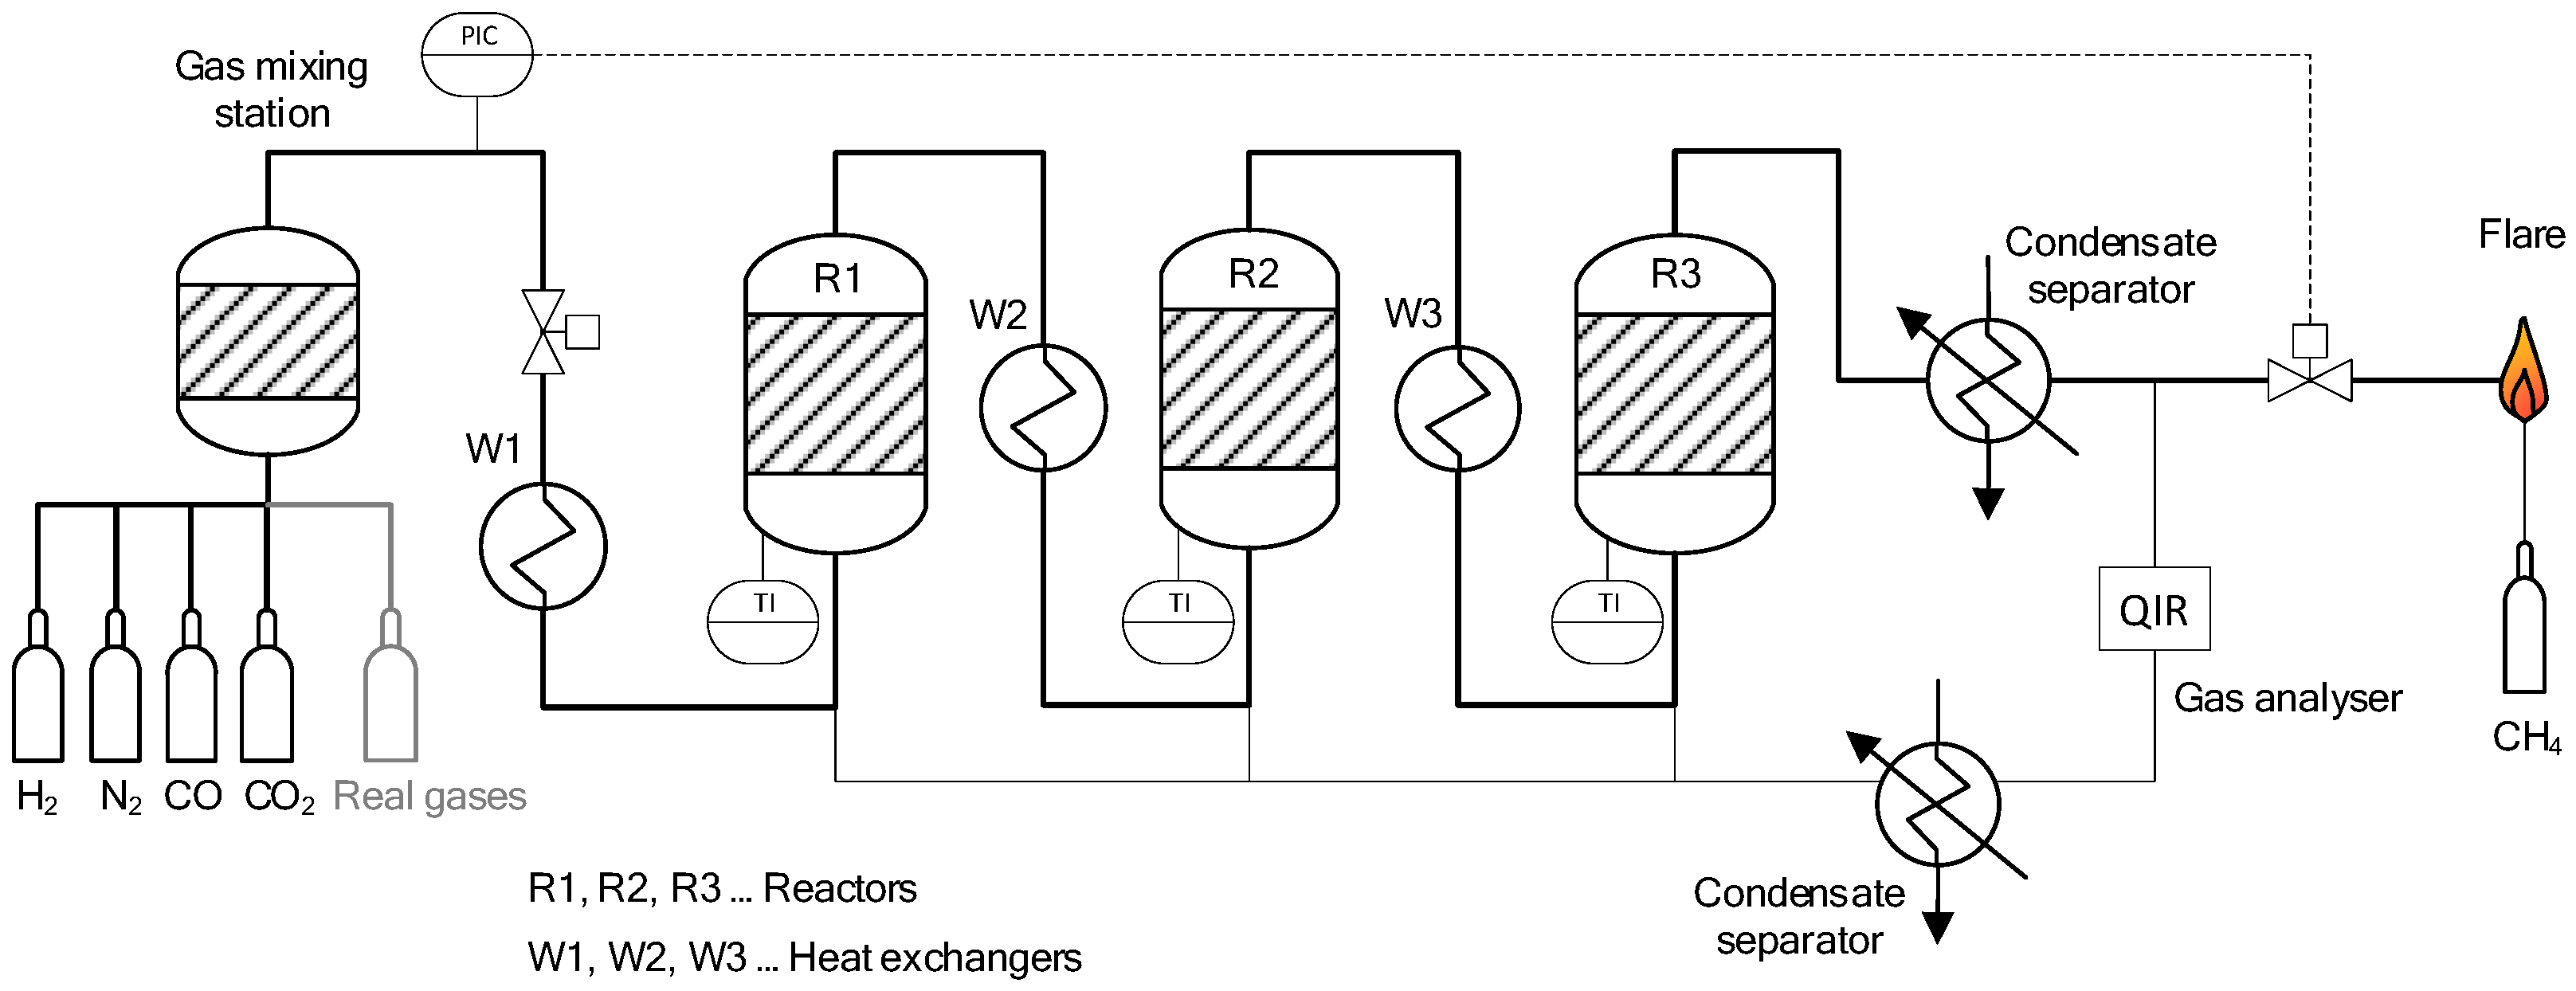
Figure 3 shows a basic flow chart of the described reactor setup. A maximum flow rate of 3 m3/h (STP, ~50 NL/min) is possible for the input gas stream. Operating pressures of up to 20 bar(abs) can be maintained and the maximum temperature for the reactors is limited to 700 °C. The methanation plant is fed with H2 (hydrogen 5.0 purity), N2 (nitrogen 5.0 purity), CO (carbon monoxide 2.0 purity) and CO2 (BIOGON® C, E290, 99.7% purity) from gas bottles, allowing for the preparation of synthetic gas mixtures to meet the specifications of the by-product gases of interest. In addition, bottled real gases from an integrated steel plant in Austria can be connected to the input stream (additional information provided in Section 2.2). Through thermal mass flow controllers (Bronkhorst), the individual gases enter the gas-mixing station. Before entering the first reactor (R1), the gas stream is pre-heated in a heat exchanger (W1) to temperatures above 200 °C. Additionally, to reach and keep the required temperature of the catalyst at 260 °C prior to the methanation synthesis, the reactors are equipped with infrared panels (RS Pro, 4 panels per reactor, 500 Watt each) on the outside. Between the reactors, two further heat exchangers (W2, W3) are installed. The final product gas stream is cooled and guided through a condensate trap to extract the H2O formed during the synthesis. The product gases are combusted in a flare, which is connected to the aspiration system. Four gas sampling stations (at the input, as well as downstream of each reactor) allow for analysis of gas composition with the use of an infrared photometer URAS 26 for CO, CO2 and CH4, as well as a thermal conductivity analyser CALDOS 27 for H2 (both from ABB GmbH) with a deviation of ≤1% per component. The gas analysers are calibrated once every week.
The methanation test rig is equipped with a series of type K thermocouples, as well as pressure and flow rate measurement devices. In addition, a multi-thermoelement is added to each reactor measuring the axial temperature profile 22 mm eccentric from the reactor middle axis. In total, five temperatures are measured inside the catalyst section, as well as two further ones directly below and above the catalyst bed (Figure 4 left) [23]. When using a reactor setup with structured honeycomb catalysts, the locations of the temperature readings are modified to measure the actual temperature inside the channels at the bottom, middle and top of the honeycomb in the centre and at 50% of the reactor’s radius (Figure 4 right).
The conversion rate of CO and CO2 as COx is calculated based on the feed and product gas composition. The input gas volume flow and the input gas concentrations are known from the mass flow controller setpoints of each species. Whereas CO, CO2, CH4 and H2 can be measured by the gas analysis system at each reactor outlet, the missing species H2O, as well as the outgoing total gas volume flow, is determined by component and atom balances. The COx conversion is then calculated from the ingoing and outcoming component mole flows of CO, CO2 and CH4, as shown in Equation (4).
CO x   conversion   [ % ] = n in × ( x CO 2 in + x COin ) n out × ( x CO 2 out + x COout ) n in × ( x CO 2 in + x COin )

2.2. Analysis of Bottled Real Gases

Prior to any methanation experiments with real steelworks gases, the content of the provided gas bottles is analysed for gas composition and any catalyst poisons potentially present. These gas bottles are filled within a mobile gas-filling station located in the steel works plant. Compressed BFG or BOFG can be filled into such gas bottles, with a volume of 20 L up to pressures of ~150 bar. For the analysis, a ThermoFisher Trace GC-ultra equipped with three gas channels is used. Hydrocarbons are resolved on a 30 m Rtx-alumina capillary column (ID 0.53 mm; filling Na2SO4, 10 μm film thickness) and detected by FID. Permanent gases are resolved on two packed columns, HayeSep Q (2 m × 1/8” OD) and MolSieve 5A (2 m × 1/8” OD) and detected by TCD. Sulphur and phosphorus compounds are determined using an Rtx-Sulphur packed column (2 m × 1/8” OD) and an FPD detector. Helium is used as carrier gas for all three channels.
The analysis of the bottled real gases showed that the samples taken after the gas cleaning station and the gasometers are composed like typical average values in the steel industry [4] (Table 2).
In addition, the following catalyst poisons were detected in the blast furnace gas [24,25]: carbon disulphide (CS2) with a very small amount of 0.26 mg/Nm3. COS stabilised at 110 mg/Nm3, and the SO2 content was evaluated with 2.2 mg/Nm3. HCl was below the detectable value of the used equipment (<1.0 ppm), but hydrogen sulphide (H2S) was detected with values around 28 mg/Nm3, ammonia (NH3) with 0.15 and HCN with 0.12 mg/Nm3. The values for antimony (Sb), mercury (Hg) and other heavy metals that are poisonous to Ni-based catalysts could not be analysed with the selected method. For the converter gas, only small amounts of COS, H2S and SO2 were detected; the other catalyst poisons were all below the detectable value of the analysis method. Table 3 summarises the catalyst poisons present in the bottled real gases.

3. Experiments and Results

3.1. Initial Experiments with Bottled Real BFG

For the experiments performed in this work, a reference base case was defined, which serves as a performance comparison between the methanation of synthetic and real gases under steady state and dynamic operating conditions. The experiments have been carried out first with synthetic mixed gas from gas bottles, and additionally with unconditioned and with pre-cleaned real gases from the steel industry.
The parameters of this reference case are:
  • H2-excess rate of 5% to reaction stoichiometry ( σ H 2 = 1.05, Equation (5));
  • Gas hourly space velocity (GHSV, Equation (6)) of 4000 h−1 (~16.7 NL/min);
  • Operating pressure of 4 bar.
These parameters are based on Medved et al. [9], who analysed the influence of nitrogen on the methanation of synthetic steelworks gases. The authors concluded that a 4–5% H2 surplus is required within the tested GHSV to achieve a full methane yield for a three-stage methanation setup outlined above. Hauser et al. [26] reported the same value for a heat pipe cooled structured fixed-bed reactor. For the expression of the reaction stoichiometry, the parameter σ H 2 is introduced, which describes the ratio of the molar hydrogen flow to the molar flows of CO and CO2 present in the feed gas (Equation (5)). σ H 2 is equal to 1.0 for stoichiometric mixtures, and is <1.0 for under- and >1.0 for over-stoichiometric mixtures, respectively.
σ H 2 [ ] = n H 2 4 × n CO 2 + 3 × n CO
The definition of the gas hourly space velocity (GHSV), which is the ratio of the total feed gas volume flow ( Q gas ) and catalyst volume V catalyst , is given in Equation (6).
GHSV   [ h 1 ] = Q gas V catalyst
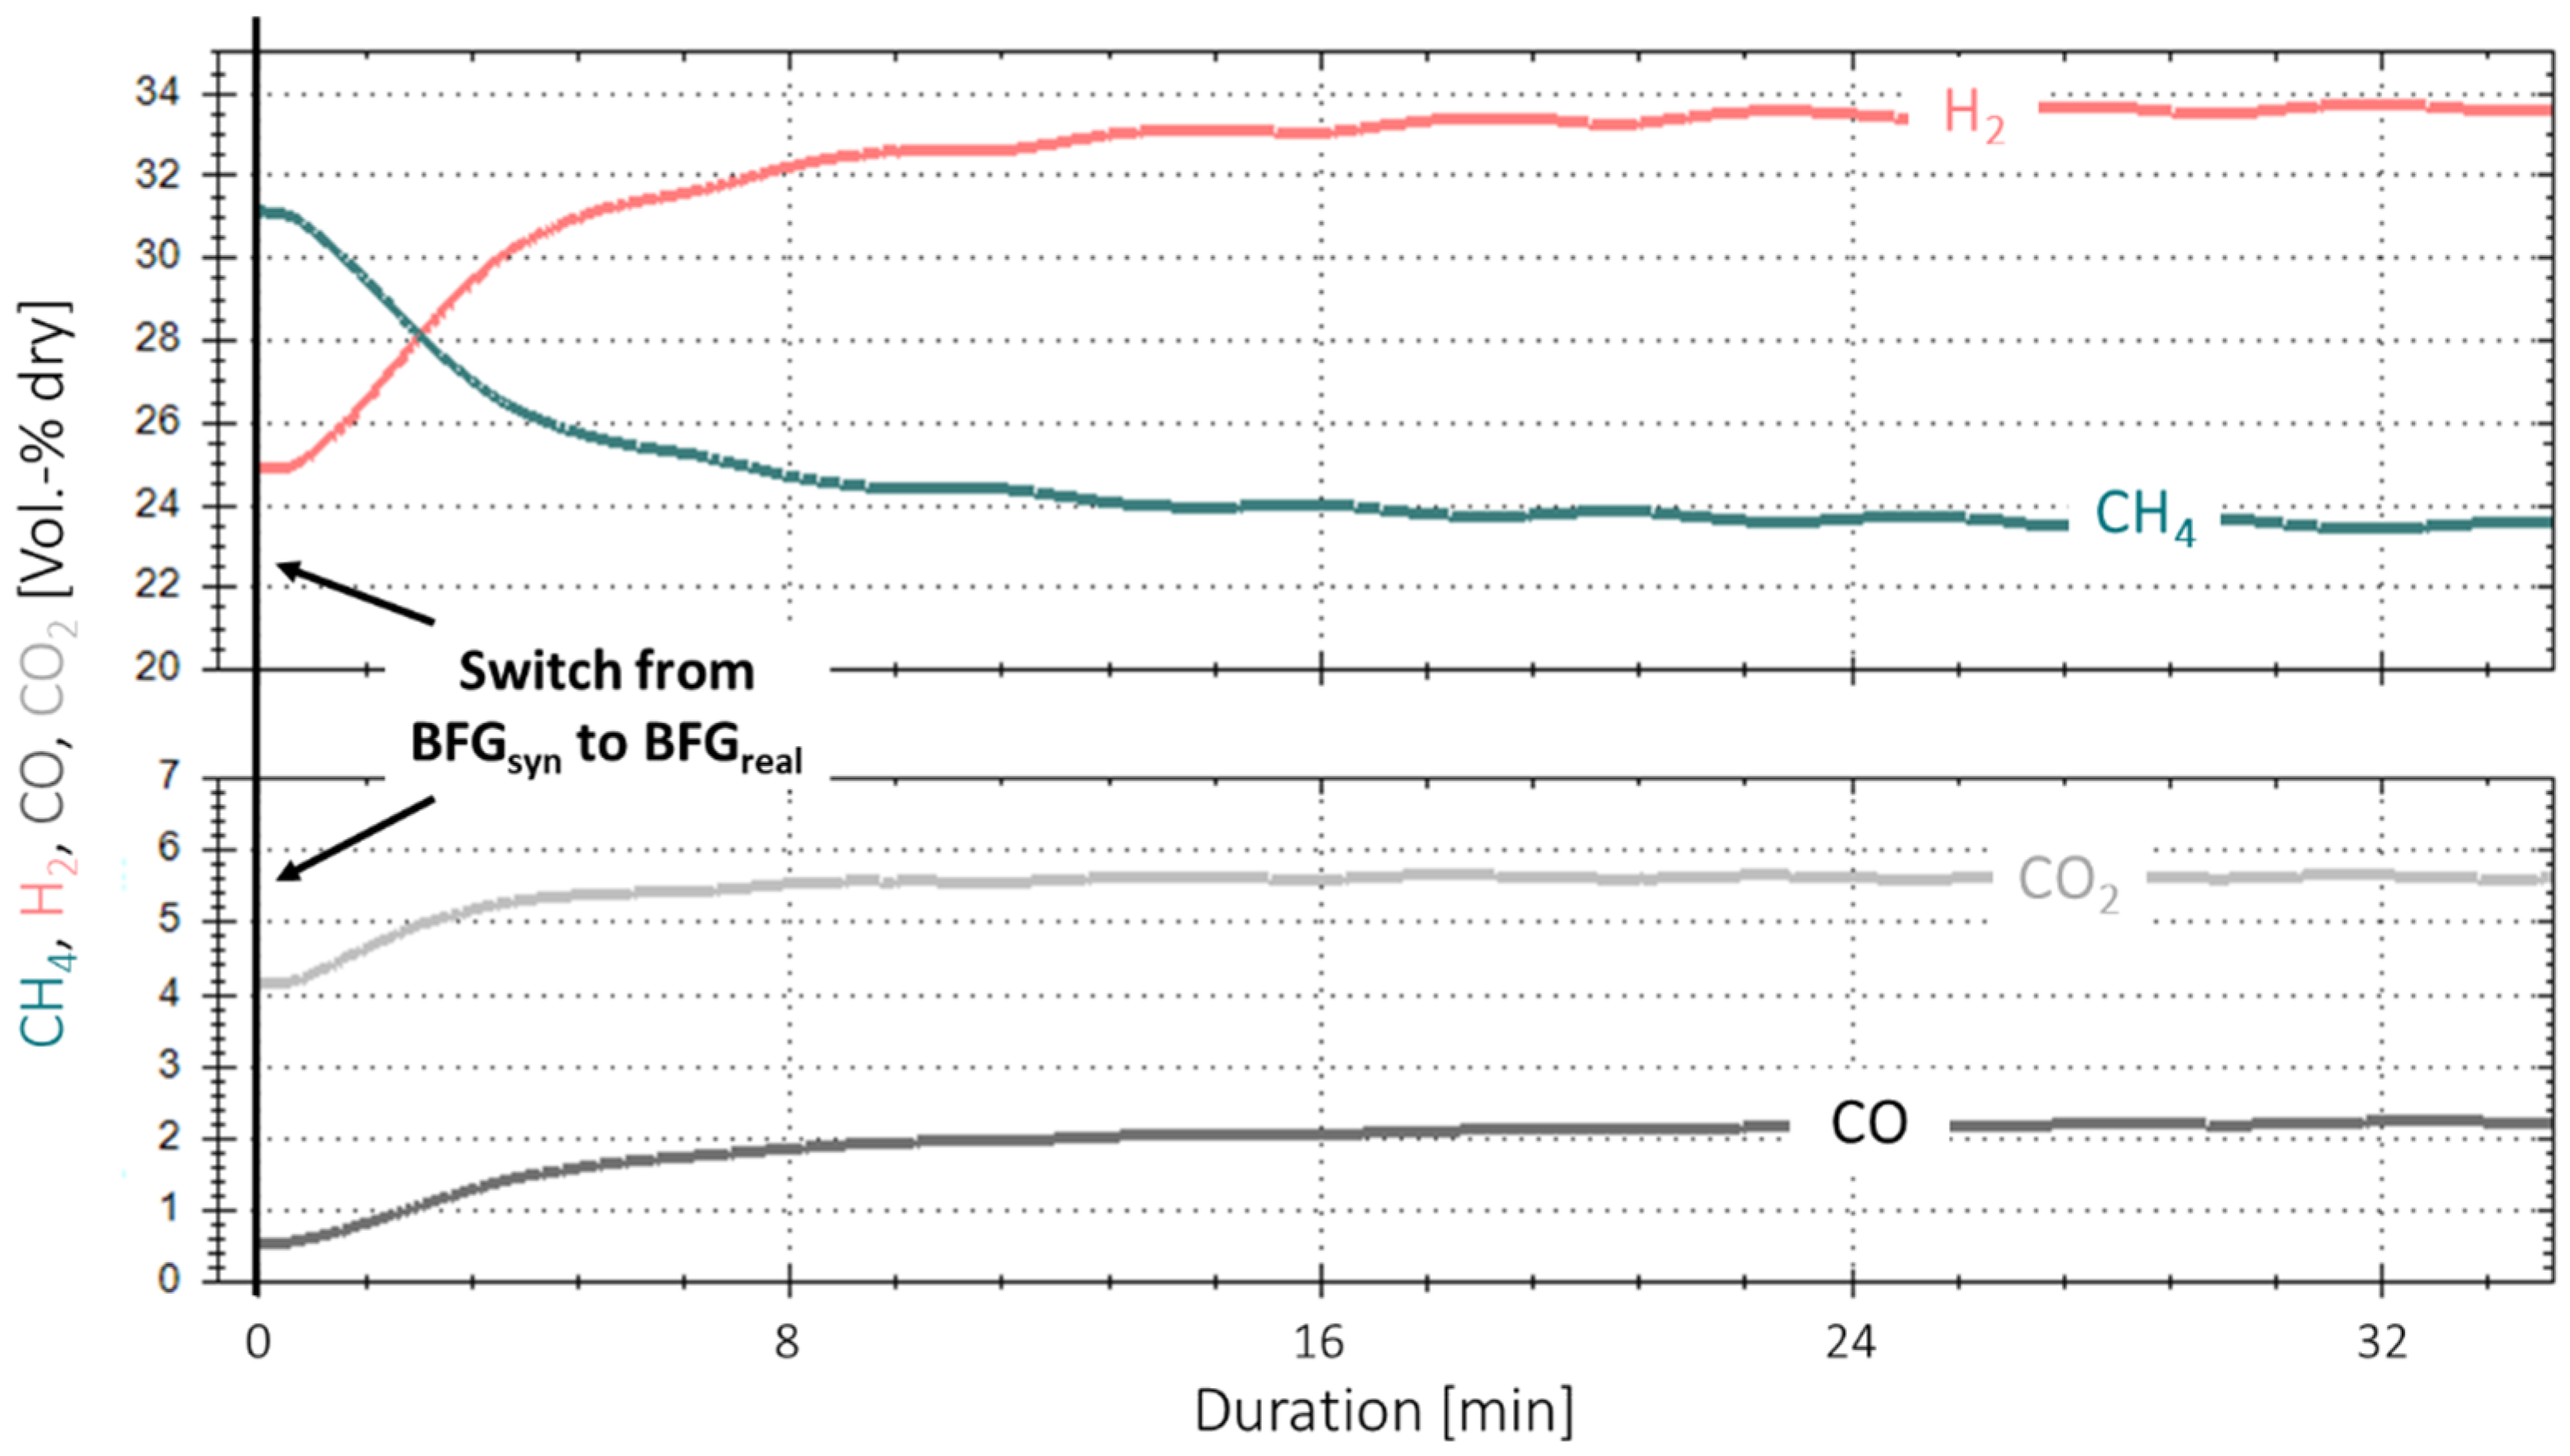
Figure 5 shows the time-based measurement data for the first experiment with real gases and base case parameters. No gas cleaning system was installed yet. At the starting point, one reactor (R2) was used, and steady-state conditions with a synthetic BFG gas mixture, simulating the real gas composition according to Table 2, were established over a period of two hours prior to the experiment start. The feed gas contained CO, CO2 and the inert gas N2, and hydrogen was added to the input stream to reach a surplus of 5% to the reaction stoichiometry ( σ H 2 = 1.05). At time “0”, the bottled real BFG substituted for the synthetic gas mixture, whereby the required hydrogen was kept at σ H 2 = 1.05. During the following eight minutes, an immediate and consistent drop in synthesis performance was observed, as the CH4 content in the product gas stream dropped significantly from ~31 to 24 vol.-%, and, consequently, the CO, CO2 and H2 content increased. After a duration of approximately 16 min, the curves started to flatten, but the performance drop remained at a lower rate. This shows that the conversion for the real BFG is less compared to the one with the synthetic gas mixture at the same H2 surplus, indicating an instant catalyst degradation. As no parameter was varied other than the catalyst poisons, the performance drop can be linked to their presence. This is supported by experimental campaigns performed with synthetic steelworks gases, each with times on stream of 80 h and more (max. 158 h) [9,23,27]. In no case was a catalyst degradation that quick or in this magnitude observed. Although GHSV, σ H 2 and the operating pressure were varied for synthetic gas mixtures, the overall performance stayed nearly constant during the whole experiment duration.

3.2. Variation of Hydrogen Excess Rate at Constant GHSV

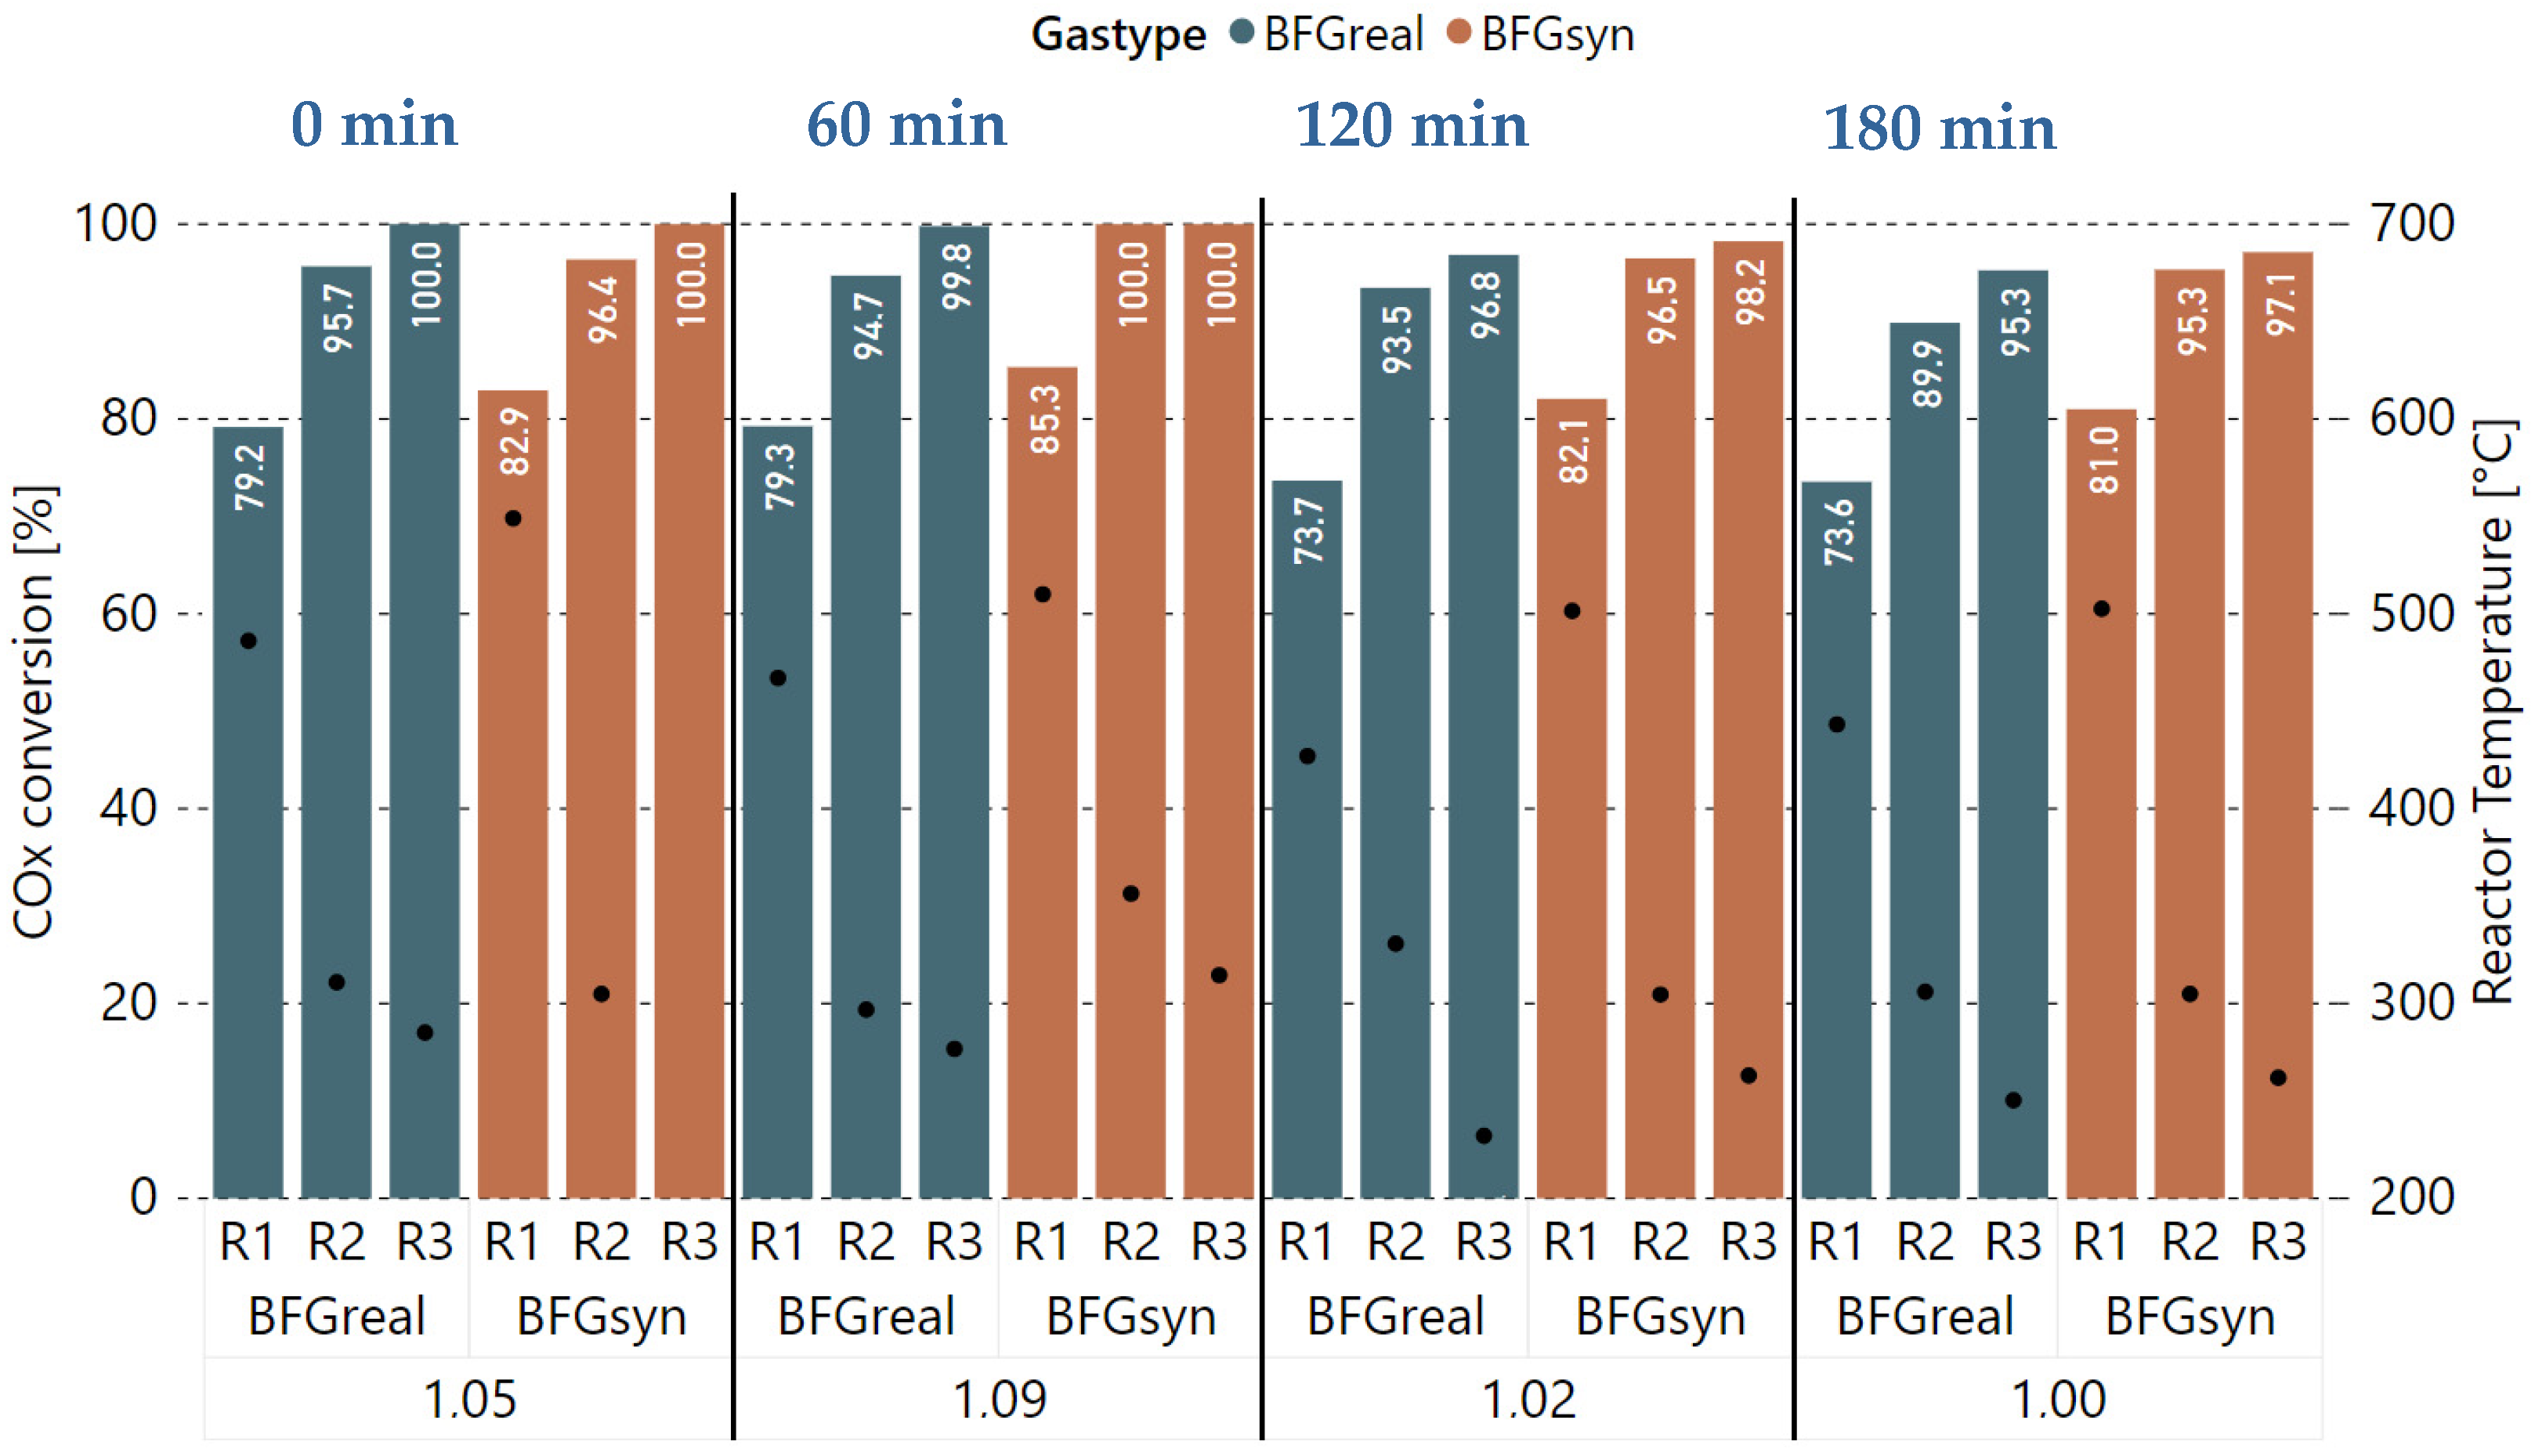
With the base case parameters established, experiments with a dynamic H2 excess rate compared to reaction stoichiometry were performed in order to evaluate the performance of the catalyst and its possible degradation over time. The GHSV, as well as the pressure, were kept constant during these experiments (4000 h−1, 4 bar), and all three available reactors were used. Figure 6 shows the COx conversion rates (Equation (4)), as well as the average reactor temperature, for each H2 excess rate per gas type (real vs. synthetic BFG) and reactor (R1 to R3). The measurements were taken in intervals of 20 min, after which, a steady state of the system, as well as a stable gas sampling, was achieved. Furthermore, the experiment start time for the real gases is plotted at the top. Starting with a σ H 2 of 1.05 at 0 min, a slightly lower COx conversion rate was measured for R1 after 20 min and for R2 after 40 min, compared to the measurements taken with synthetic BFG (BFGsyn). Downstream of R3, still full COx conversion was achieved with the measurement after 60 min. Afterwards, the H2 excess rate was increased to 9% ( σ H 2 = 1.09), which should result in an improved methane yield according to the literature. However, the performance dropped below the one of the 1.05 experiment that started at 0 min. Compared to synthetic gas, no full COx conversion could be achieved with all three reactors. The additional experiments with values for σ H 2 of 1.02 and 1.0 starting after 120 and 180 min continued the trend towards a significant performance decrease when comparing the real gases with the synthetic gas mixture. This is especially noticeable for the first reactor R1, with a difference of 7.6%-points in COx conversion for the σ H 2   = 1.0 experiment after approximately three hours. The decrease in catalyst activity is clearly attributable to the catalyst poisons in the methanation feed gases.
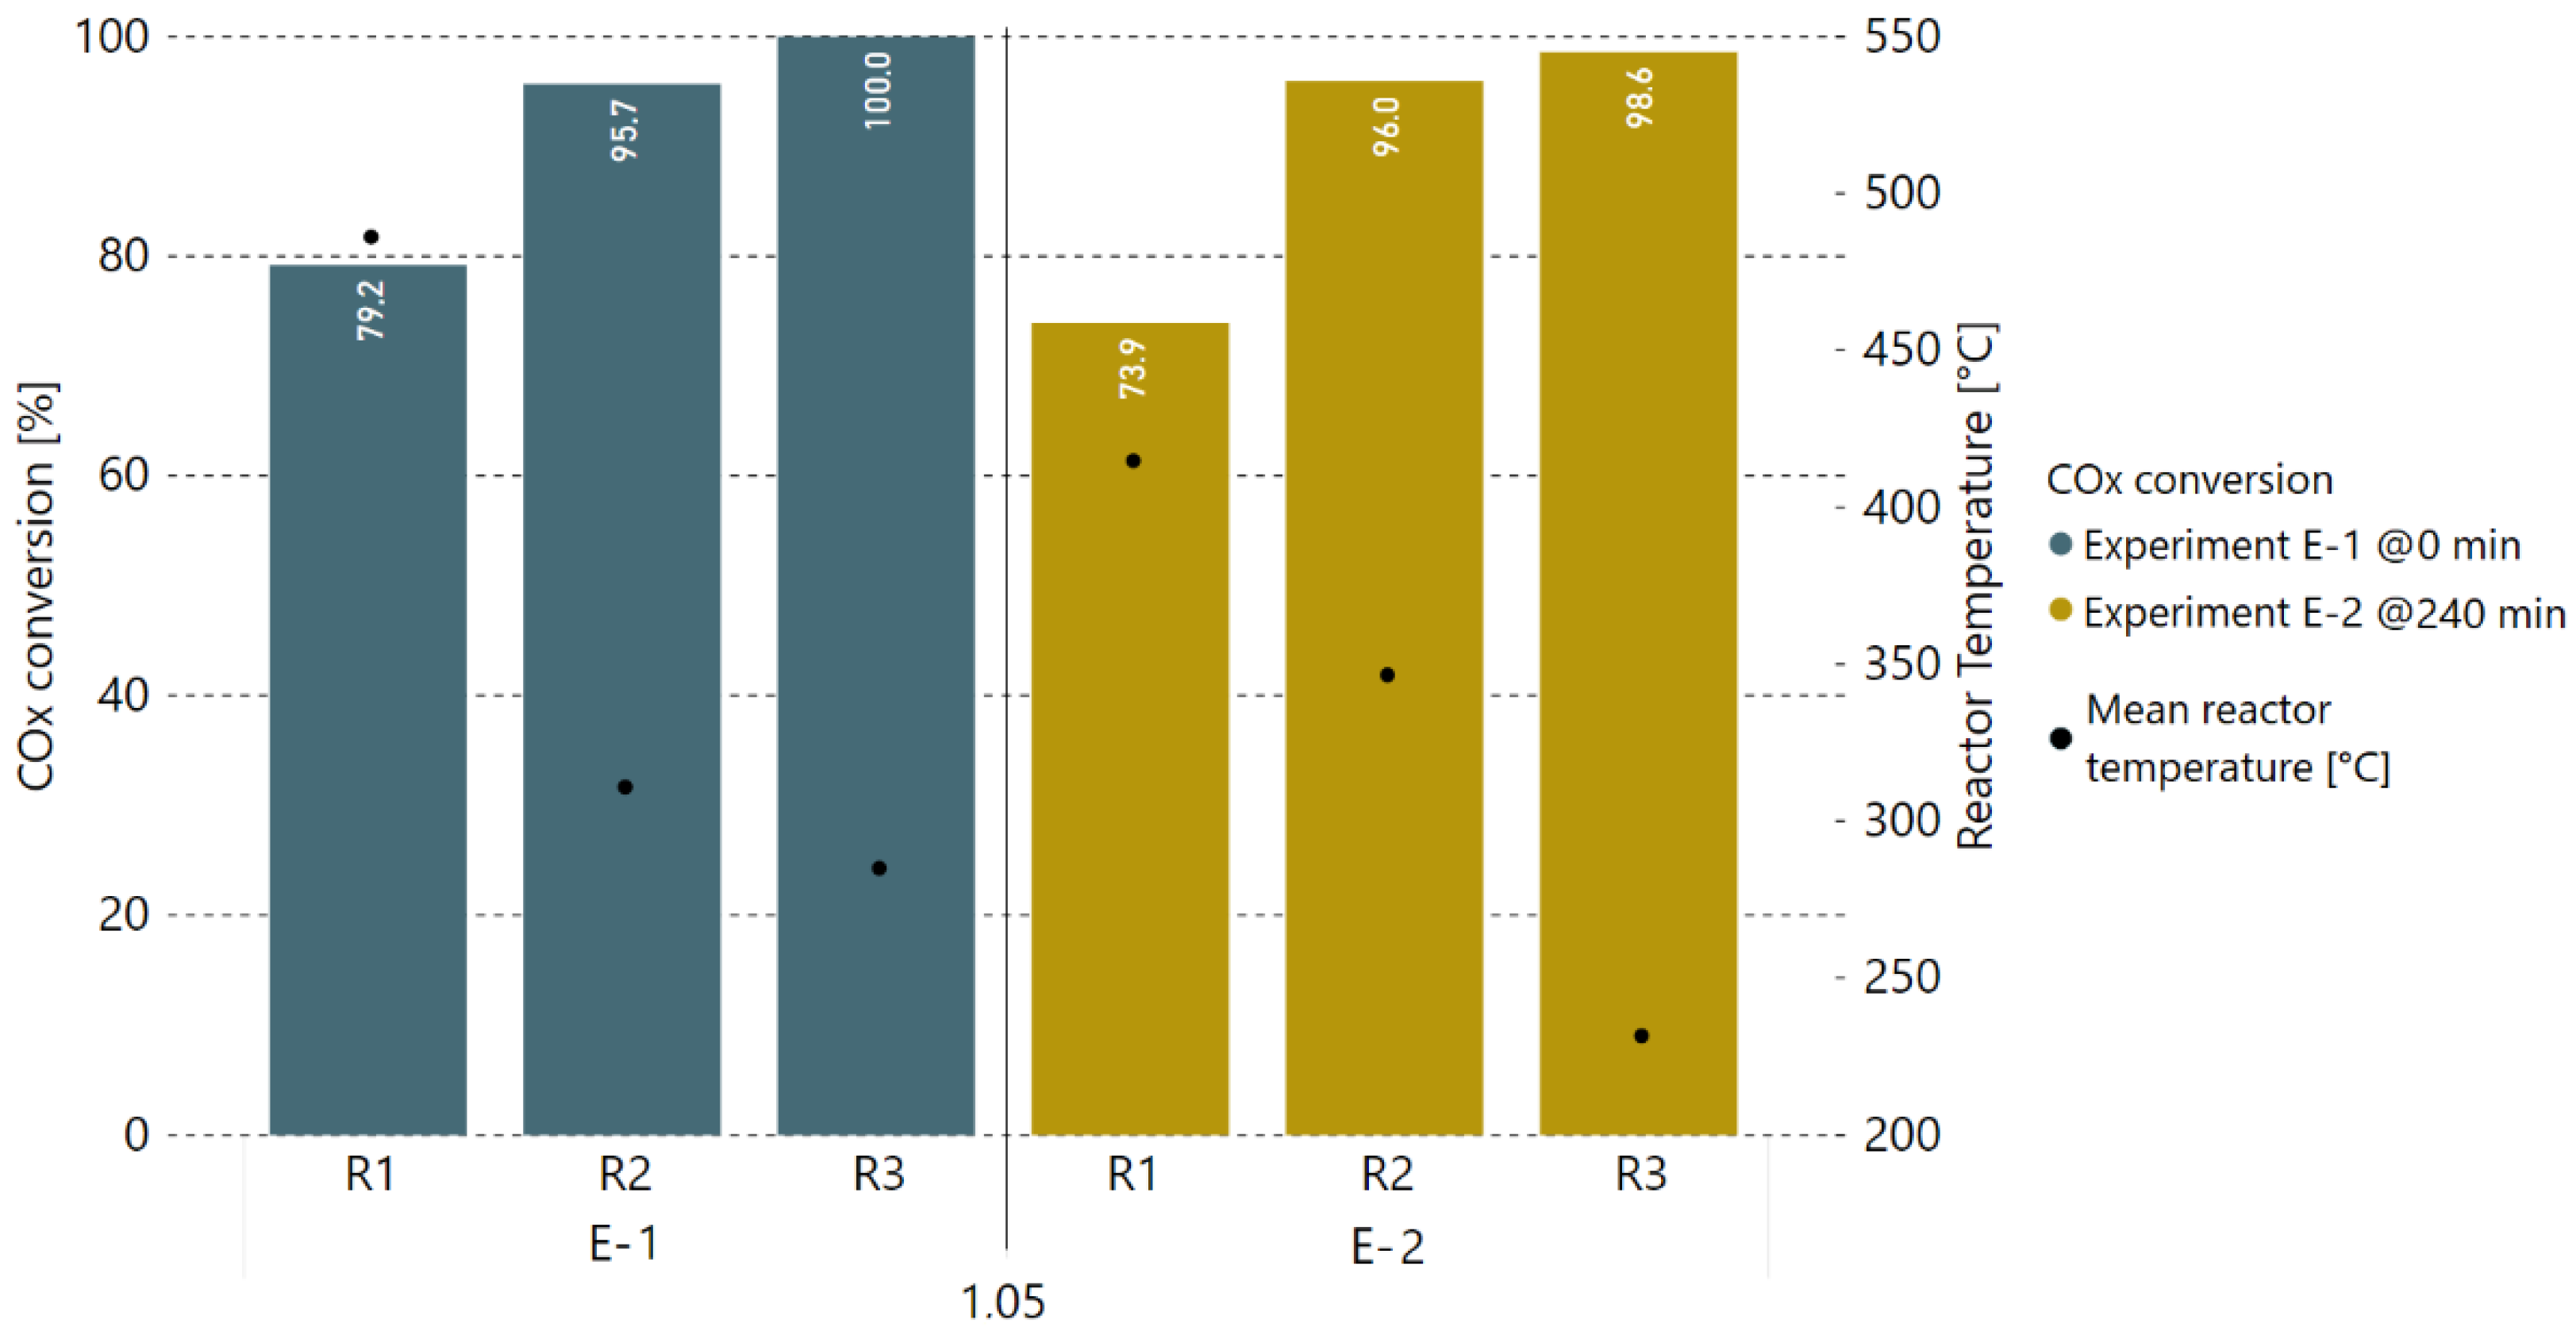
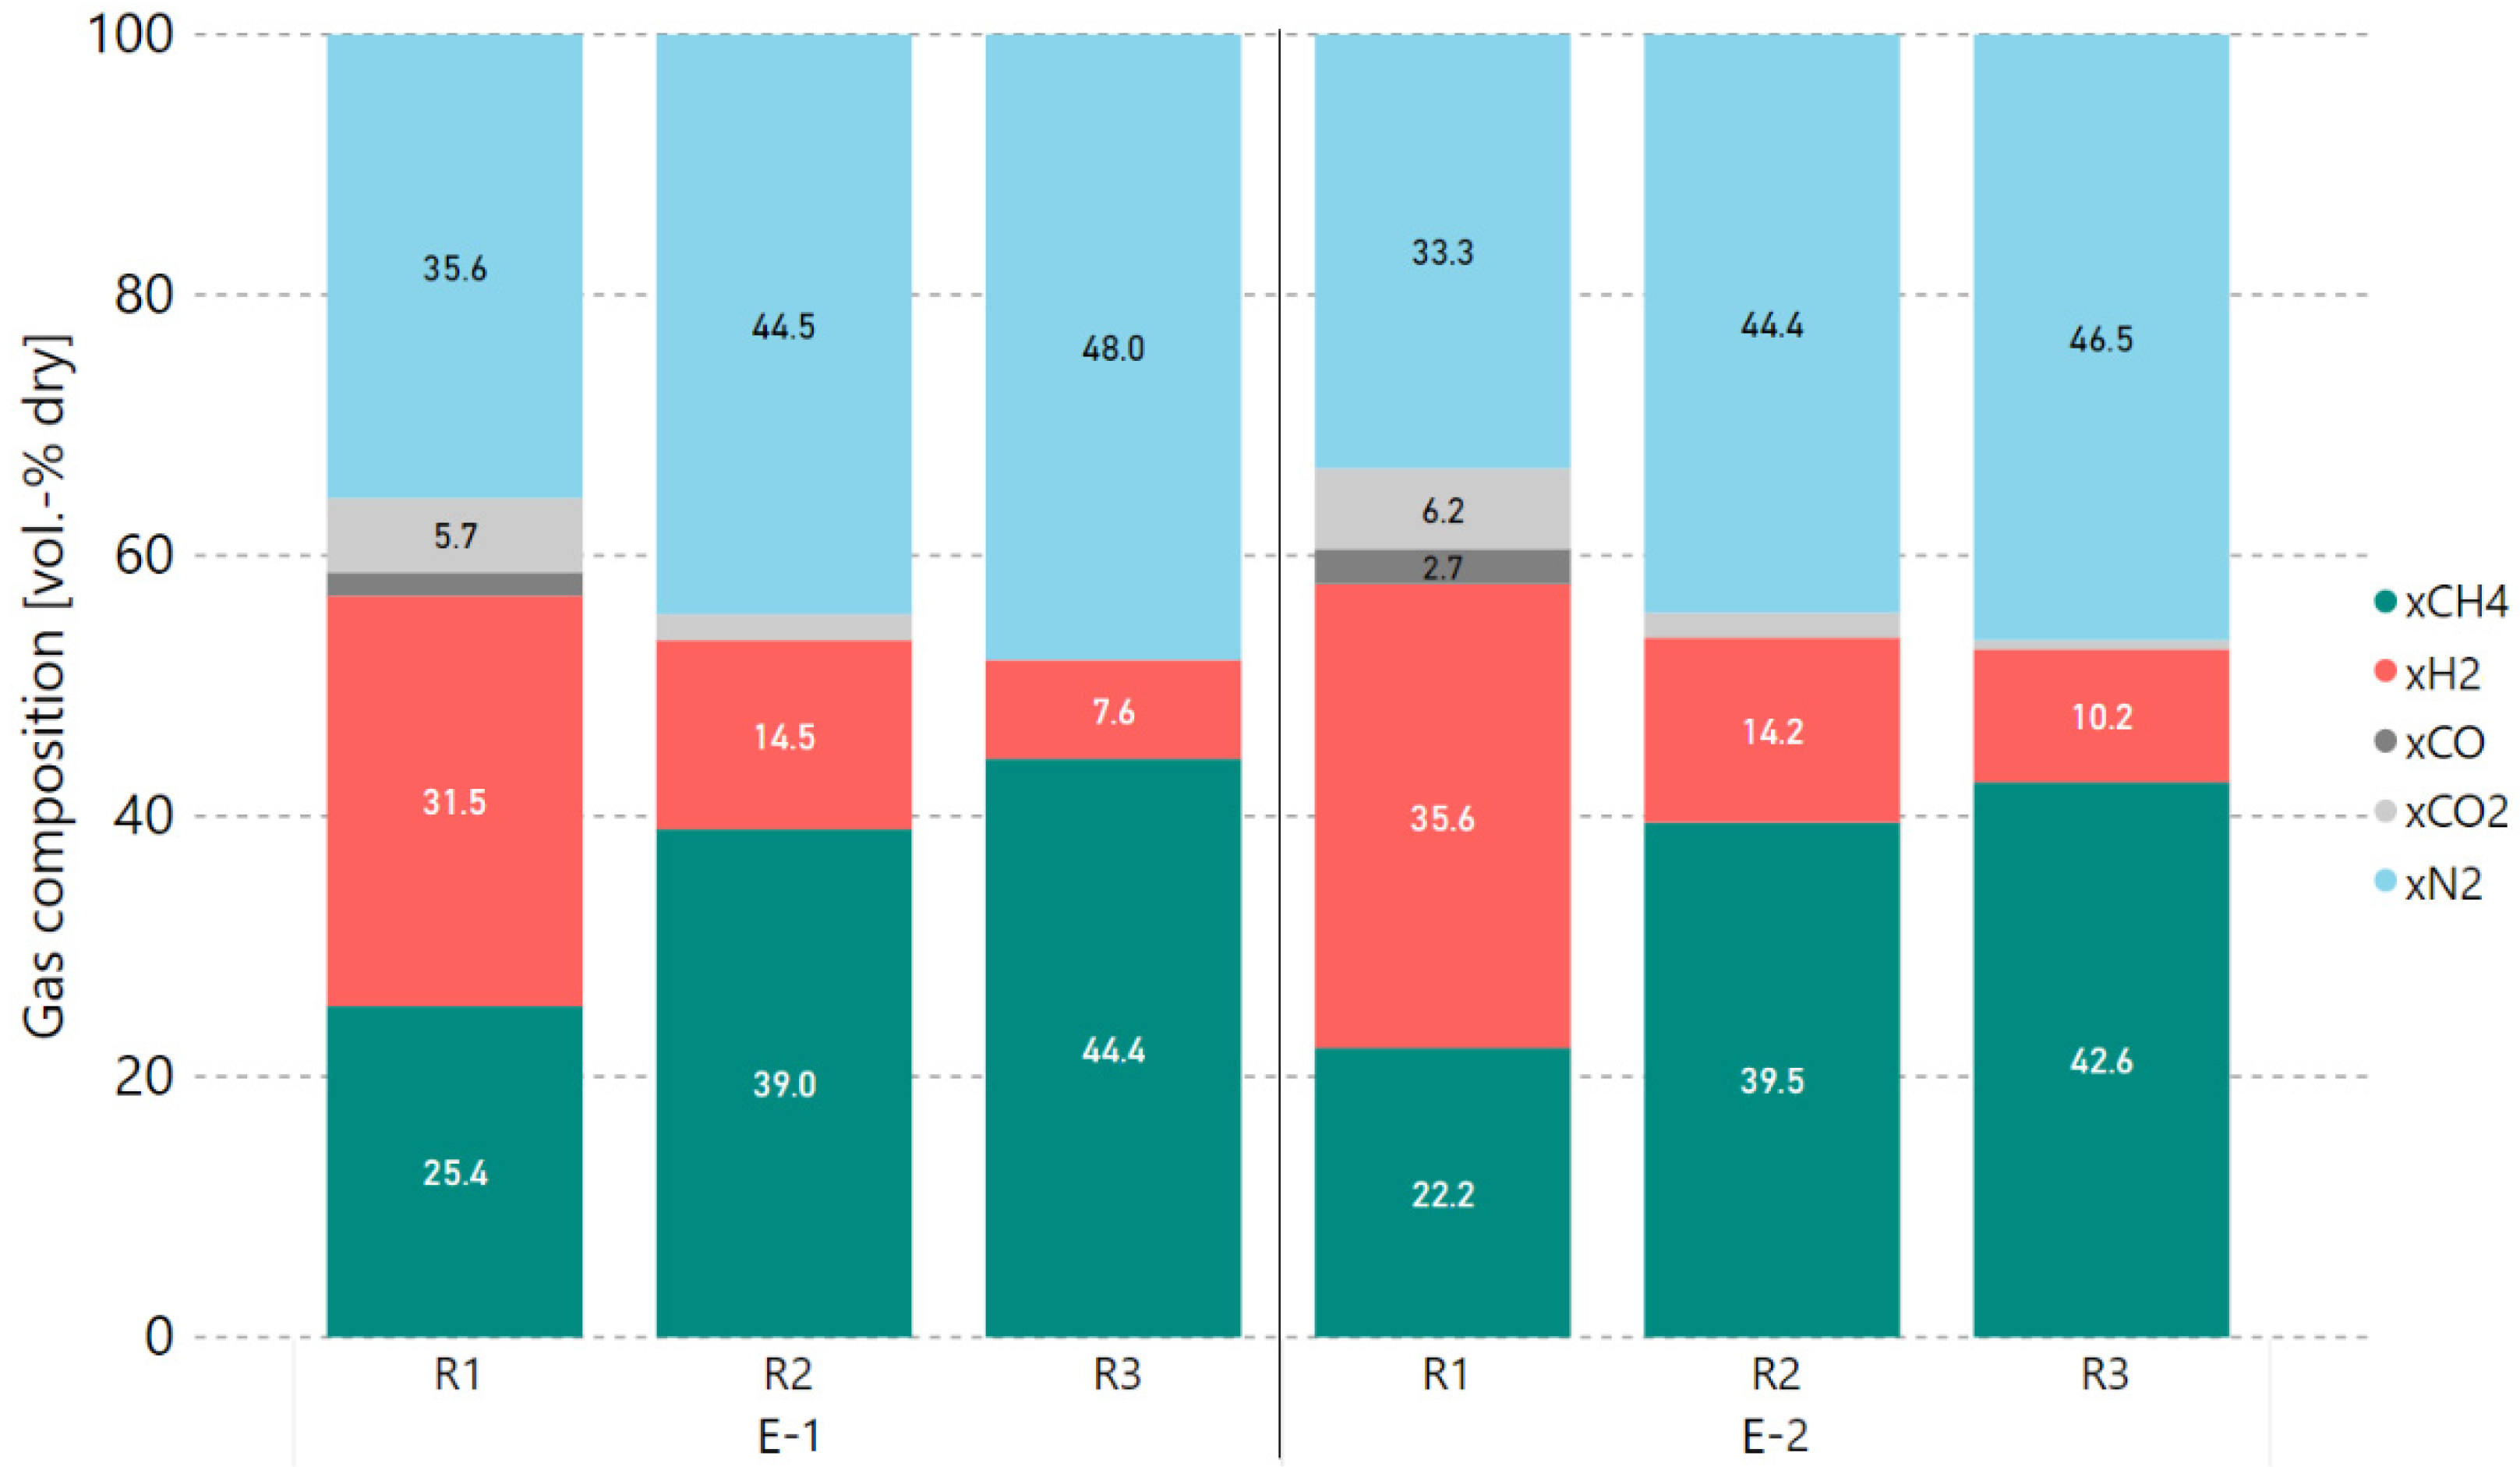
Consequently, additional experiments with a 5% H2 excess rate were performed after this alteration of hydrogen addition to determine the degree of catalyst deactivation. Therefore, the COx conversion rates prior to and after 4 h of methanation with real gases (0–240 min) were compared against each other. Figure 7 and Figure 8 show the COx conversion and product gas composition per reactor, respectively, for the experiment at 0 min (E-1) and another measurement taken under the same operating conditions after 240 min (E-2). Within a period of 4 h, the performance of the first reactor (R1) dropped by 5.3%-points in COx conversion. The second reactor (R2) took over the load as the first reactor’s performance dropped, keeping the overall performance of the first two reactors stable. This is confirmed by the temperatures measured inside the reactors, as they decreased for R1 (median of −71.3 °C) and increased for R2 (median of +35.7 °C). The small drop in COx conversion for reactor three (R3) is a result of a too-low average reactor temperature adjusted during experiment E-2.

3.3. Extended Experiment Duration with Bottled Real BFG

After the initial tests, a first long-term experiment was performed with bottled real BFG and a hydrogen excess of σ H 2 = 1.05 to further assess the degree of catalyst deactivation. Therefore, base case conditions and parameters were used. It needs to be mentioned that, due to the catalyst deactivation discovered in the previous experiments, only one reactor (R1) was used this time, in order to spare the catalyst in the remaining two reactors (R2 and R3).
Figure 9 shows the results of this extended experiment duration. The product gas composition for the four gases H2, CH4, CO2 and CO is shown in vol.-% dry on the y-axis, and the x-axis shows the duration in hours. Again, a decrease in the overall performance of the catalyst is observed, starting at a higher rate at the beginning that stabilises after 16 min. Over 16.5 h, the CH4 concentration in the product gas dropped from a starting value of ~29 to ~16 vol.%, indicating the already-mentioned deactivation of the catalyst over time. This is equivalent to a drop in COx conversion of ~30% (1.8% per hour).
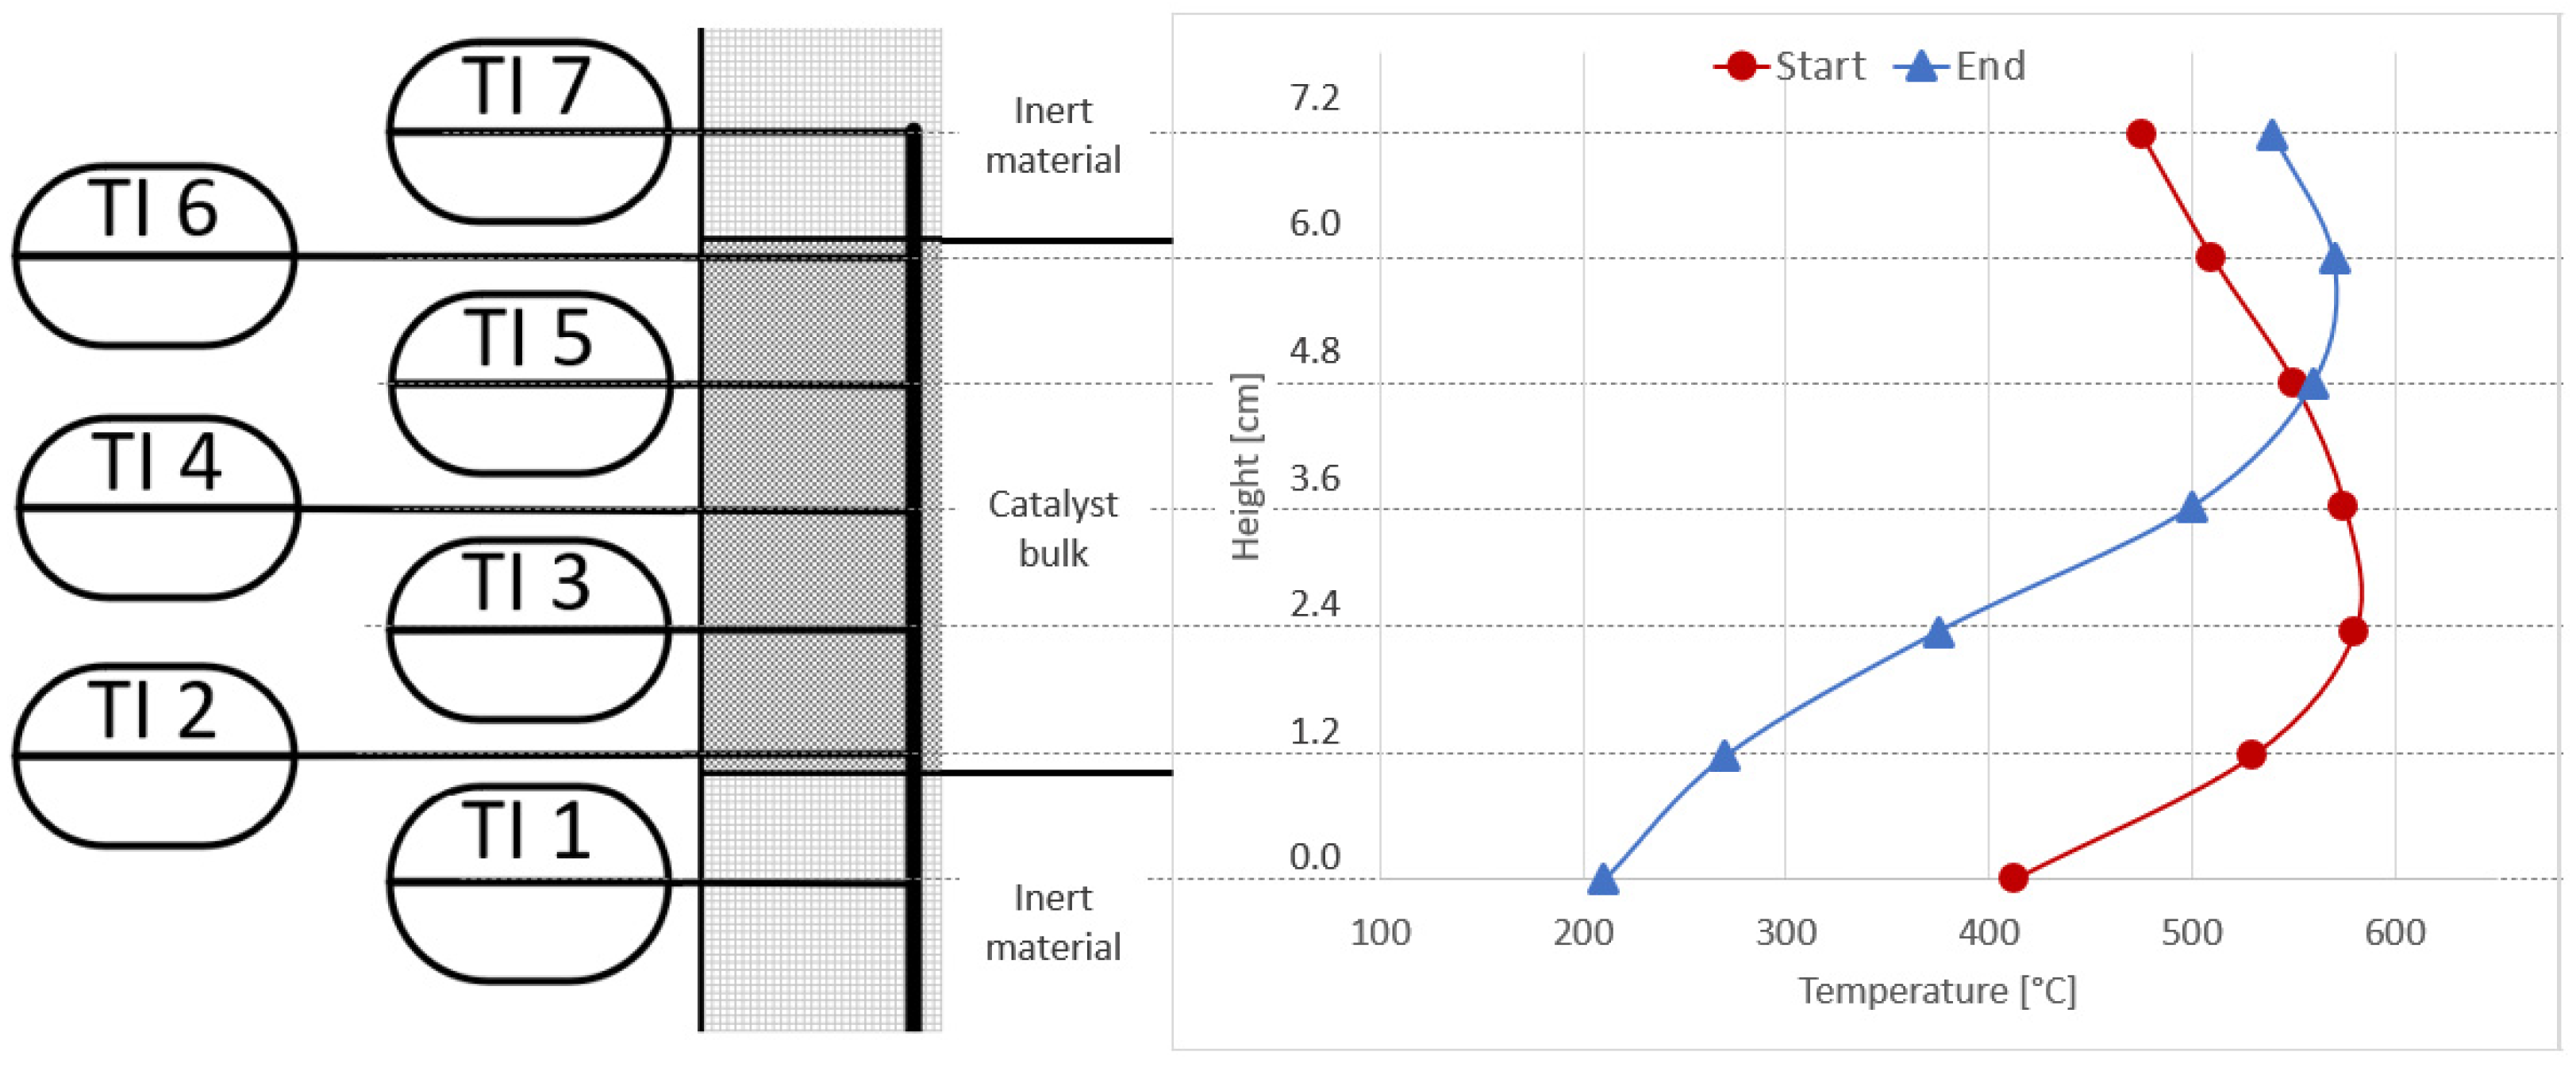
Figure 10 shows the temperature measurements taken inside the catalyst bed of the first reactor (R1) at the beginning of the experiments under synthetic gas conditions (reference base case), and at the end of the last experiment with real gases. The operating conditions are the same (4000 h−1, 4 bar, 5% H2-excess). A clear shift of the typical bell-shaped temperature curve towards the top of the catalyst bed can be seen. This confirms that the catalyst at the bottom of the first reactor was deactivated by the poisons present in the bottled real gases. This behaviour was not seen for any experiments with synthetic gas mixtures under steady state or dynamic conditions [9,27].

3.4. Analysis of Gas Condensate and Catalyst

Table 4 compares the analysis results of the gas condensate taken after the experiments with real gases with the ones for the synthetic gas mixture. The parameters have been measured according to the norms ISO 10304-1, 17294-2 and 10523.
The Ni content in the real gases’ condensate is more than three times higher compared to the one for the synthetic gas mixture from the reference base case. This confirms the theory that more Ni atoms are taken off the catalyst with real gases and blown out of the reactor setup with the product gas, resp., leaving it through the condensate, indicating a mechanical deactivation through attrition [28]. The decrease in available Ni atoms on the surface of the catalyst can be another reason for the performance drop observed, resulting in a further deactivation of the catalyst. The other parameters relevant for catalyst deactivation (Cl, SO4, S) were all below the determination limit of the selected analysis methods.
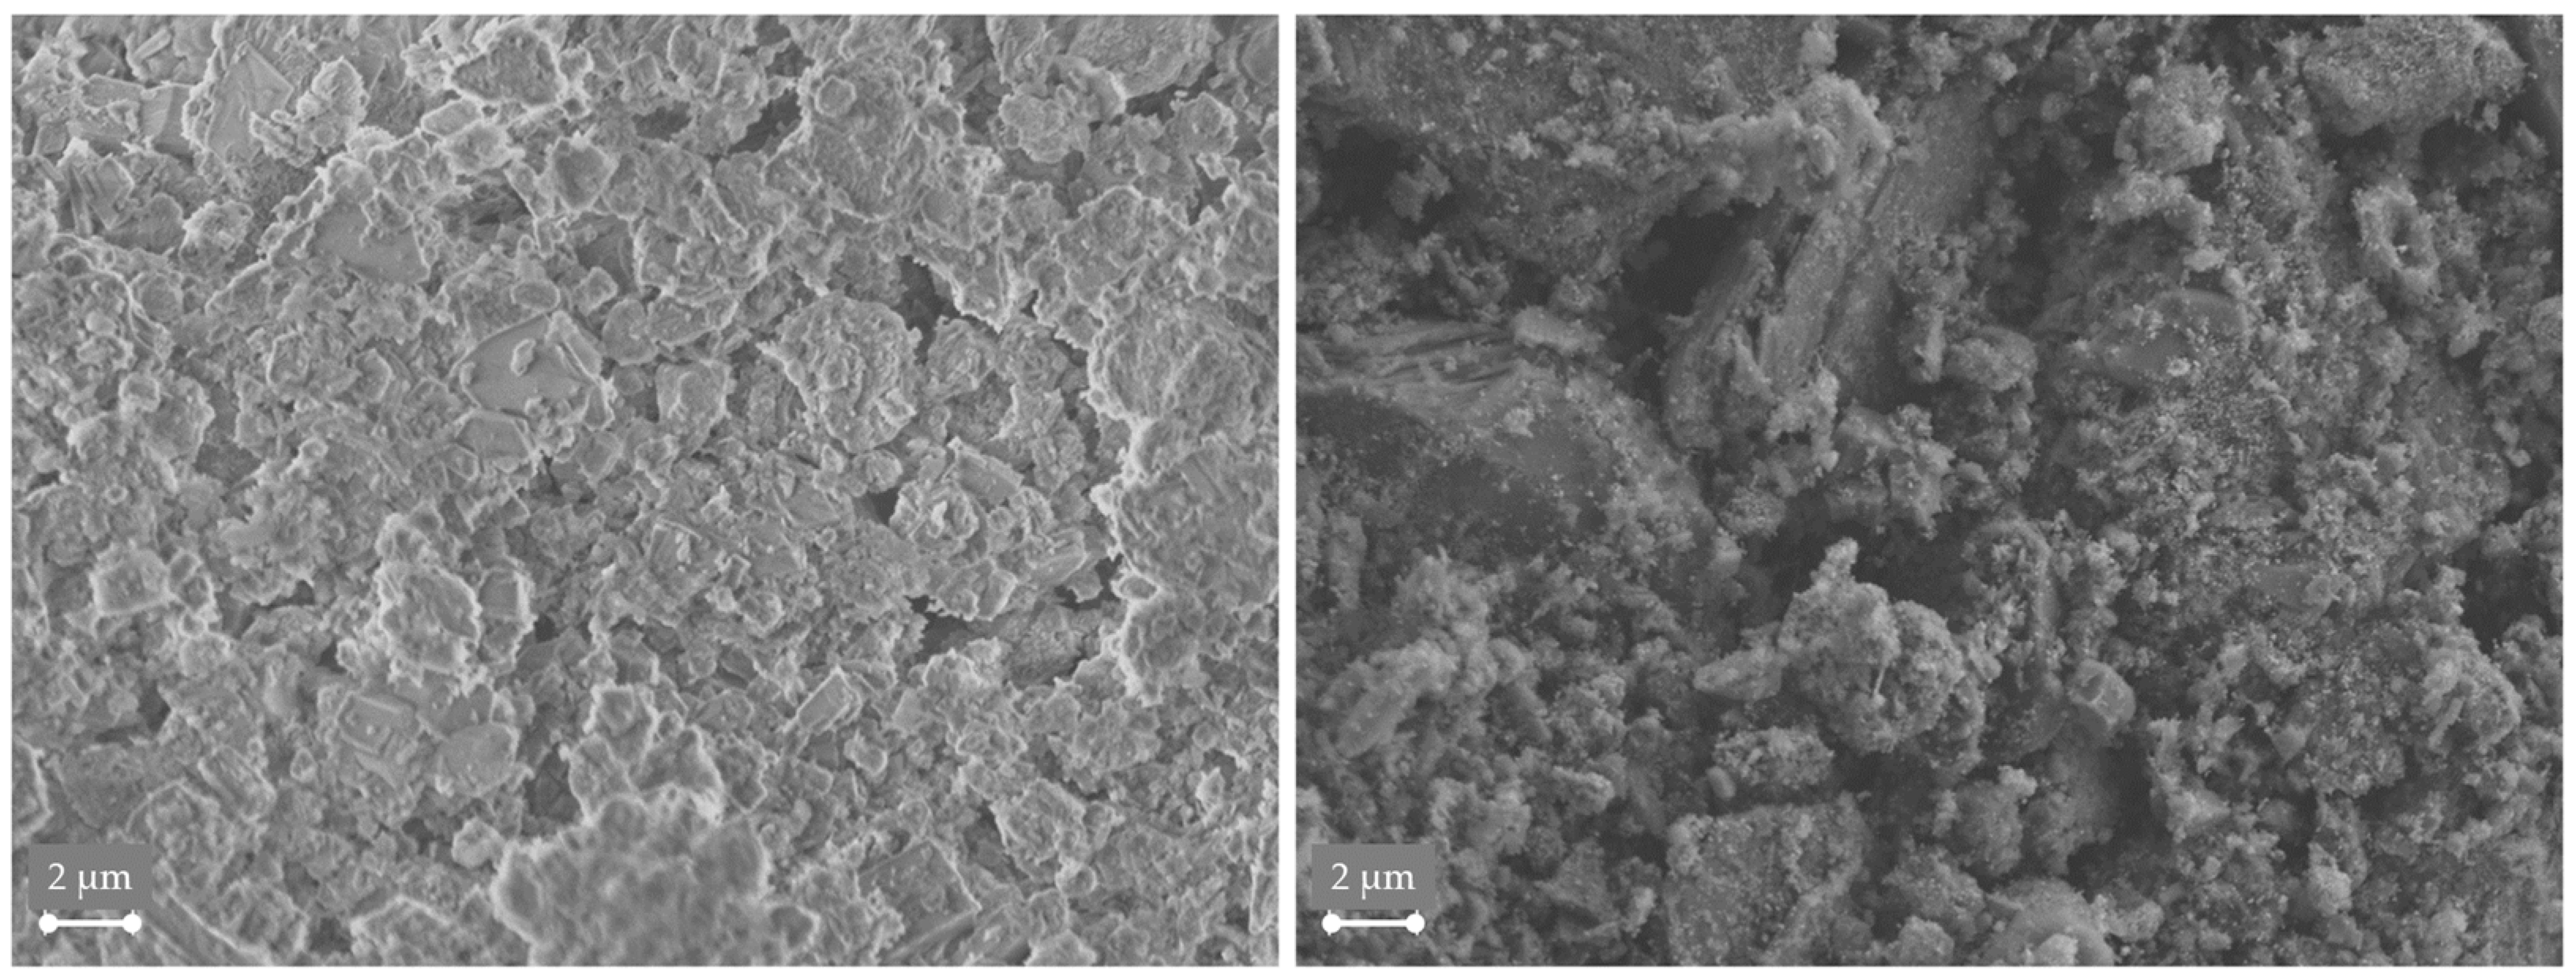
Once the experiments were performed, the possibility to reactivate the catalyst inside the first reactor was evaluated. Therefore, the reactor was purged with pure hydrogen for a duration of 4 h with a GHSV of 2000 h−1, keeping a constant reactor pressure of 4 bar and temperatures above 260 °C. Confirmation experiments afterwards showed no significant improvement of the catalyst’s performance for the methanation synthesis. Consequently, the whole methanation test rig was flooded with N2 to clean the piping and reactors. Afterwards, the catalyst was deactivated with compressed air and withdrawn from the reactors. A sample of the catalyst spheres inside the first reactor was analysed in a scanning electron microscope (SEM) and compared with a new catalyst sample (Figure 11). Just by comparing the two samples visually, a clear change in the surface structure and morphology can be noted. The surface of the used catalyst (right) does not show the crystalline structure of the fresh catalyst anymore (left). SEM reference analyses of used catalyst spheres after 96 h of methanation with synthetic steelworks gases revealed that the surface structure matches the one of the fresh catalyst rather than the one of the real gas experiments, which goes hand in hand with the observation that there was no significant degradation in the overall performance detected during these experiments [9,27]. Due to the high methanation temperatures (up to 600 °C) in the first reactor, thermal sintering is certainly a method of catalyst deactivation that needs to be adressed. Again, the experiments with synthetic steelworks gases and without poisons did not show any signs of a decreased catalyst performance during the experimental campaigns, although maximum reactor temperatures at a similar level were measured. Compared to the real gas experiments, no other parameter than the presence of catalyst poisons was changed. Consequently, this degradation can be clearly attributed to their presence in the real gases.

3.5. Implementation of Activated Carbon Filter

Based on the results achieved with the direct use of the bottled real gases, including the listed catalyst poisons, which resulted in a quick catalyst degradation, an activated carbon filter was implemented upstream of the first reactor (R1). For this purpose, metal oxide impregnated activated carbon pellets were added to the gas-mixing station. These pellets are specifically developed to remove hydrogen sulphide, organic mercaptans, sulphur dioxide, carbonyl sulphide and nitrogen oxides from oxygen-deficient gas streams, such as CO2, N2, CO and H2. They have a copper content of 7% (as CuO), a diameter of 3 mm, a length of 7 mm, a specific surface area of 936 m2/g, a pore volume of 0.53 cm3/g and a bed density of 0.48 g/cm3 (Figure 12). A total of ~300 mL (187 g) of these pellets was added to the gas mixing station (ID 36 mm, height 300 mm).
In addition to the implemented filter based on activated carbon, a fresh Ni-based catalyst was added to the reactors. Furthermore, the piping and fittings were exchanged to assure no catalyst poisons remained inside the plant. To test the functionality of the implemented gas cleaning stage with activated carbon, only one reactor was used in the beginning under base case operating parameters. This decision was made to limit the exposure of the plant’s components to the real BFG as much as possible, in case of failure of the activated carbon solution.
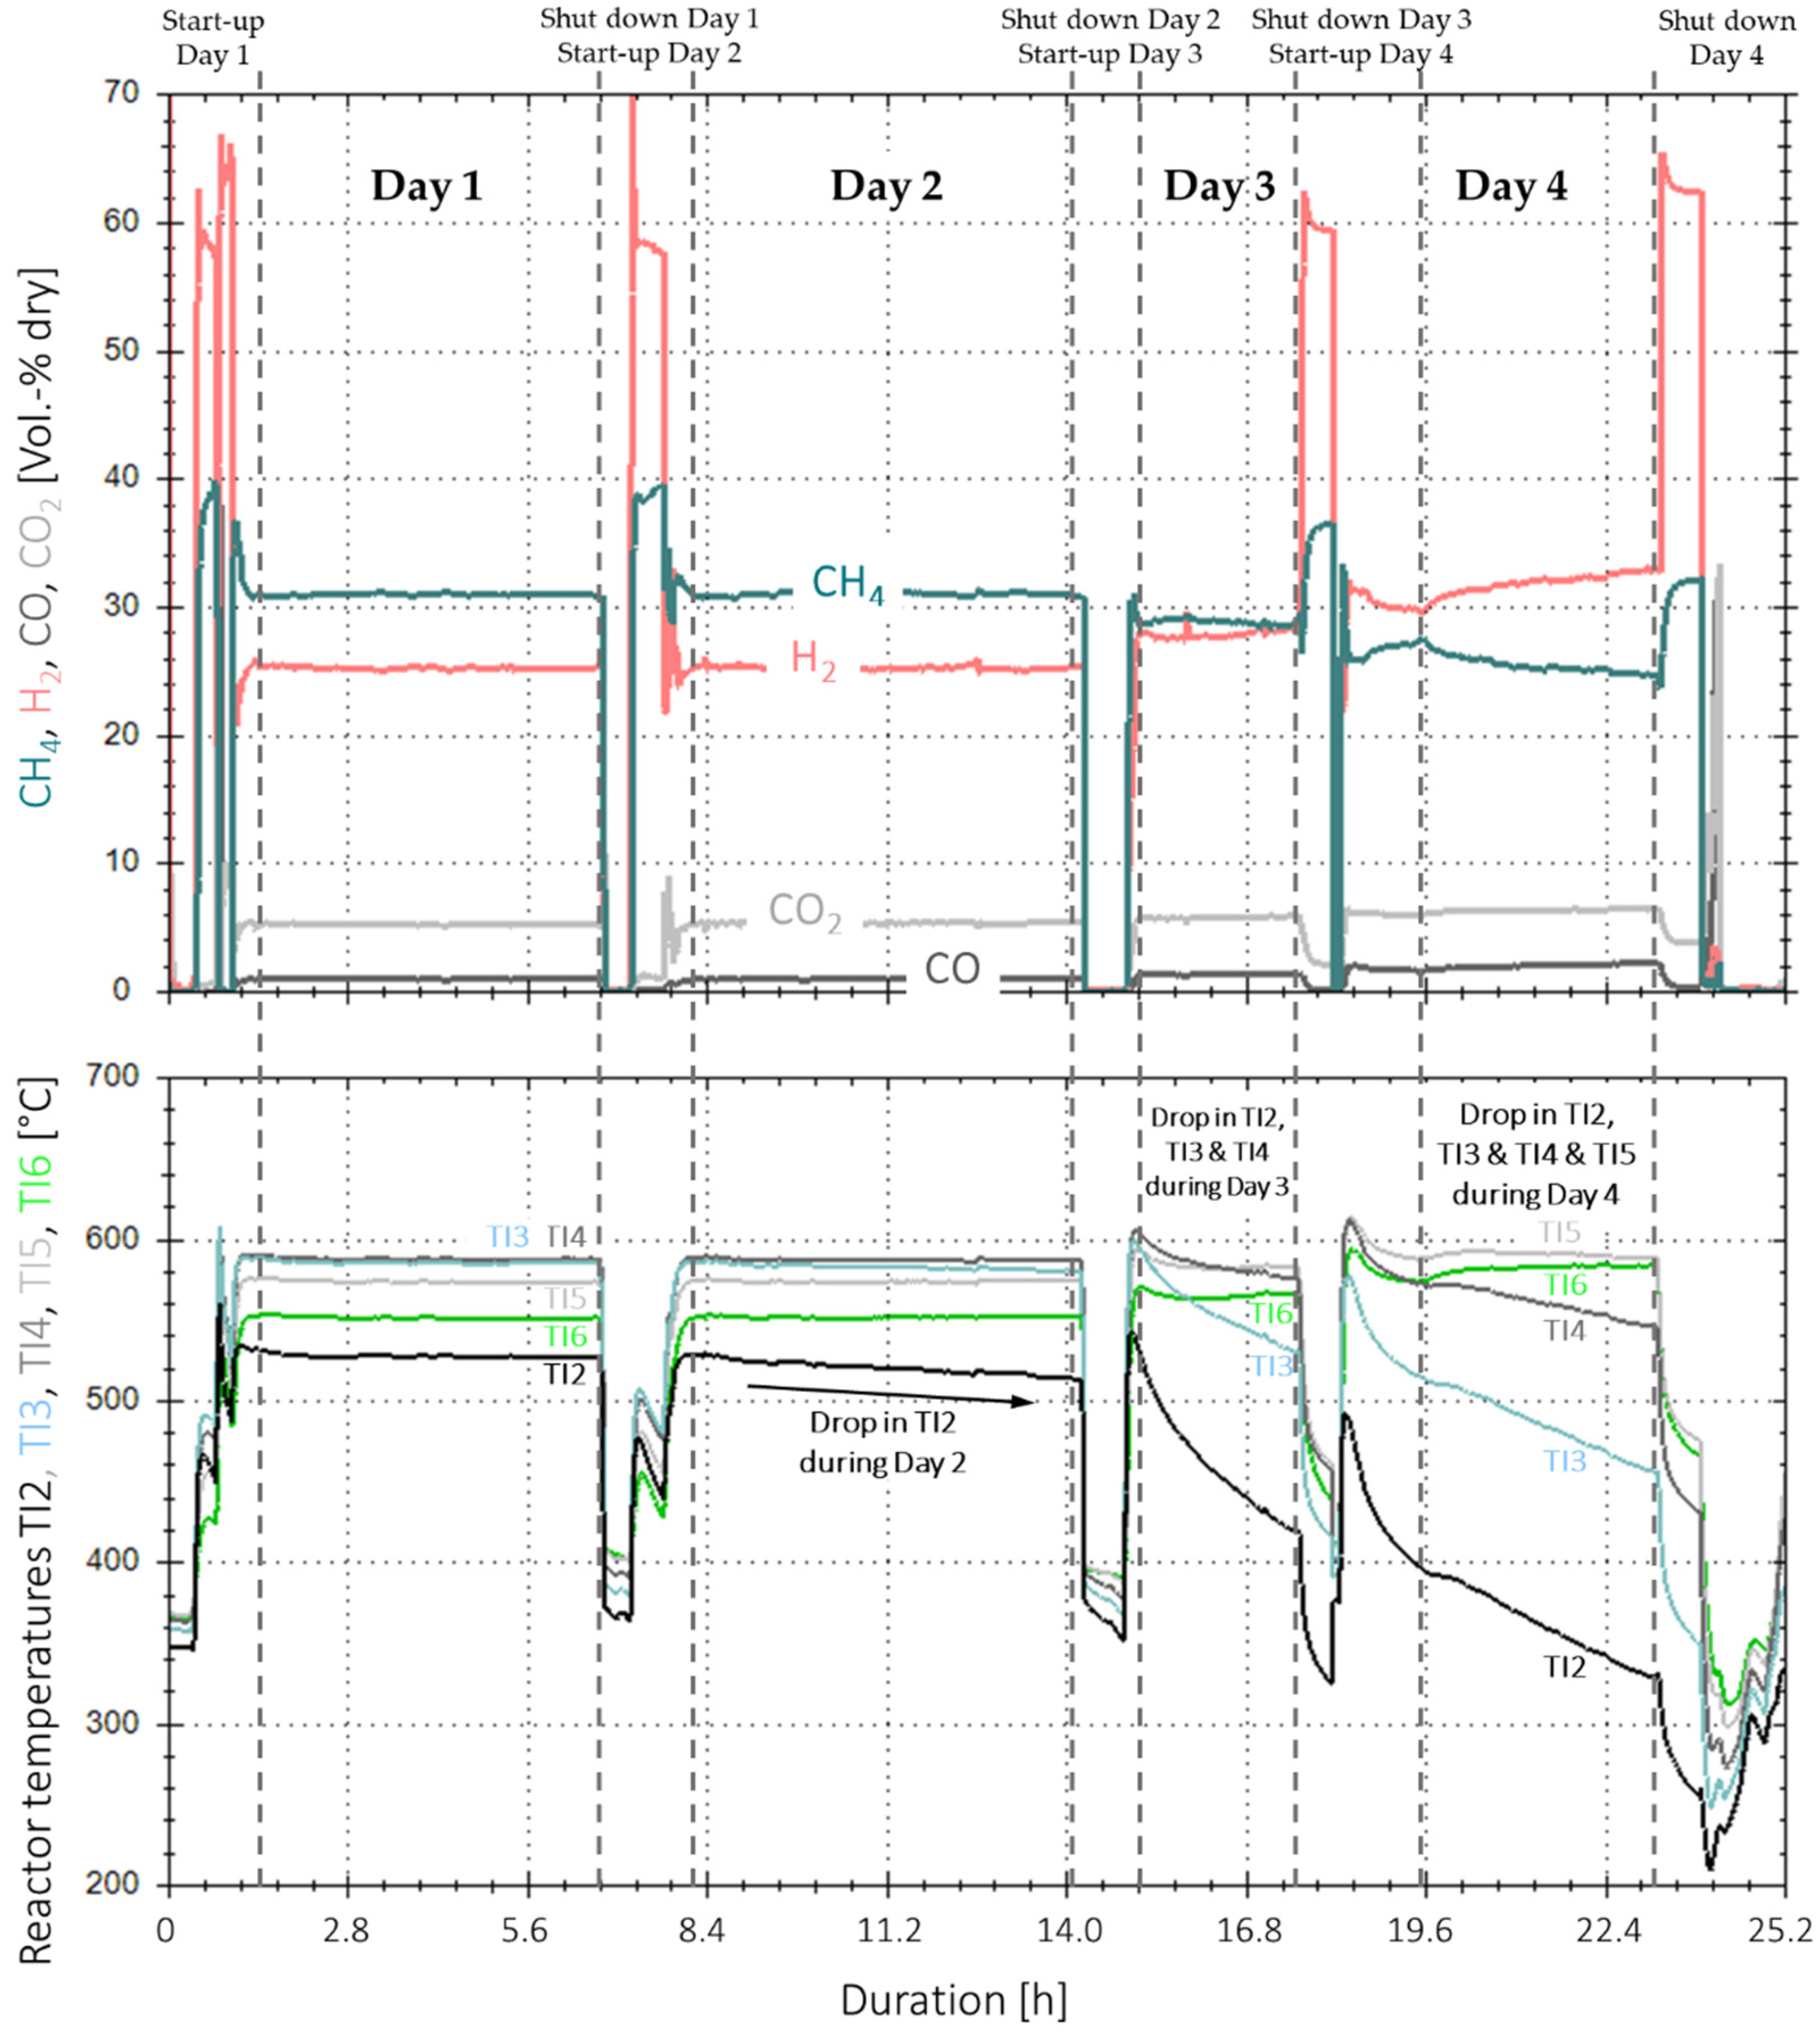
Figure 13 shows the time-based measurement data for the real gas experiments with one reactor and base case operating conditions. The data include four days of methanation, as well as their individual start-up and shut down phases. Methanation during the first two days (~6 h each) showed very constant measurement values for all gas components on the product side. The actual values vary in a range of ±2%-points around their averages (Table 5) and are within a 1.5%-point range per gas component compared to reference experiments with synthetic BFG, with the same composition and operating conditions. The small fluctuations and peaks, respectively, for H2 and CO2, are only process-related due to the measurement technique of the infrared gas analytic station. In addition, the temperature profile is within a ±1 °C range for all temperatures during day one and in a ±2 °C range for all temperatures except TI2 during day two. The temperature at the bottom of the catalyst bulk (TI2) started to decrease after approximately two hours in day two and dropped by 11.1 °C during the remaining four hours of the experiment time. This drop in temperature did not have any influence on the overall catalyst performance, as the COx conversion and product gas composition remained stable.
On day three, the temperature at measurement point TI2 continued its downwards trend with a rate of 38 °C/h. Furthermore, TI3 and TI4 started to decrease by 21.6 °C/h and 8.8 °C/h. respectively, whereas TI5 and TI6 remained stable. Even though the temperatures at the bottom and middle section of the catalyst bulk decreased by 95 and 22 °C in total, the product gas composition remained almost constant. On day four, all temperatures decreased further, except the one for T6, which started to increase as the upper part of the catalyst took over the synthesis load from the catalyst in the lower section. After a net duration of 25.2 h of methanation with real gases, the experiment was stopped, as the temperature at TI2 came close to the lower boundary of 200 °C, below which, poisonous nickel carbonyl is formed [21].
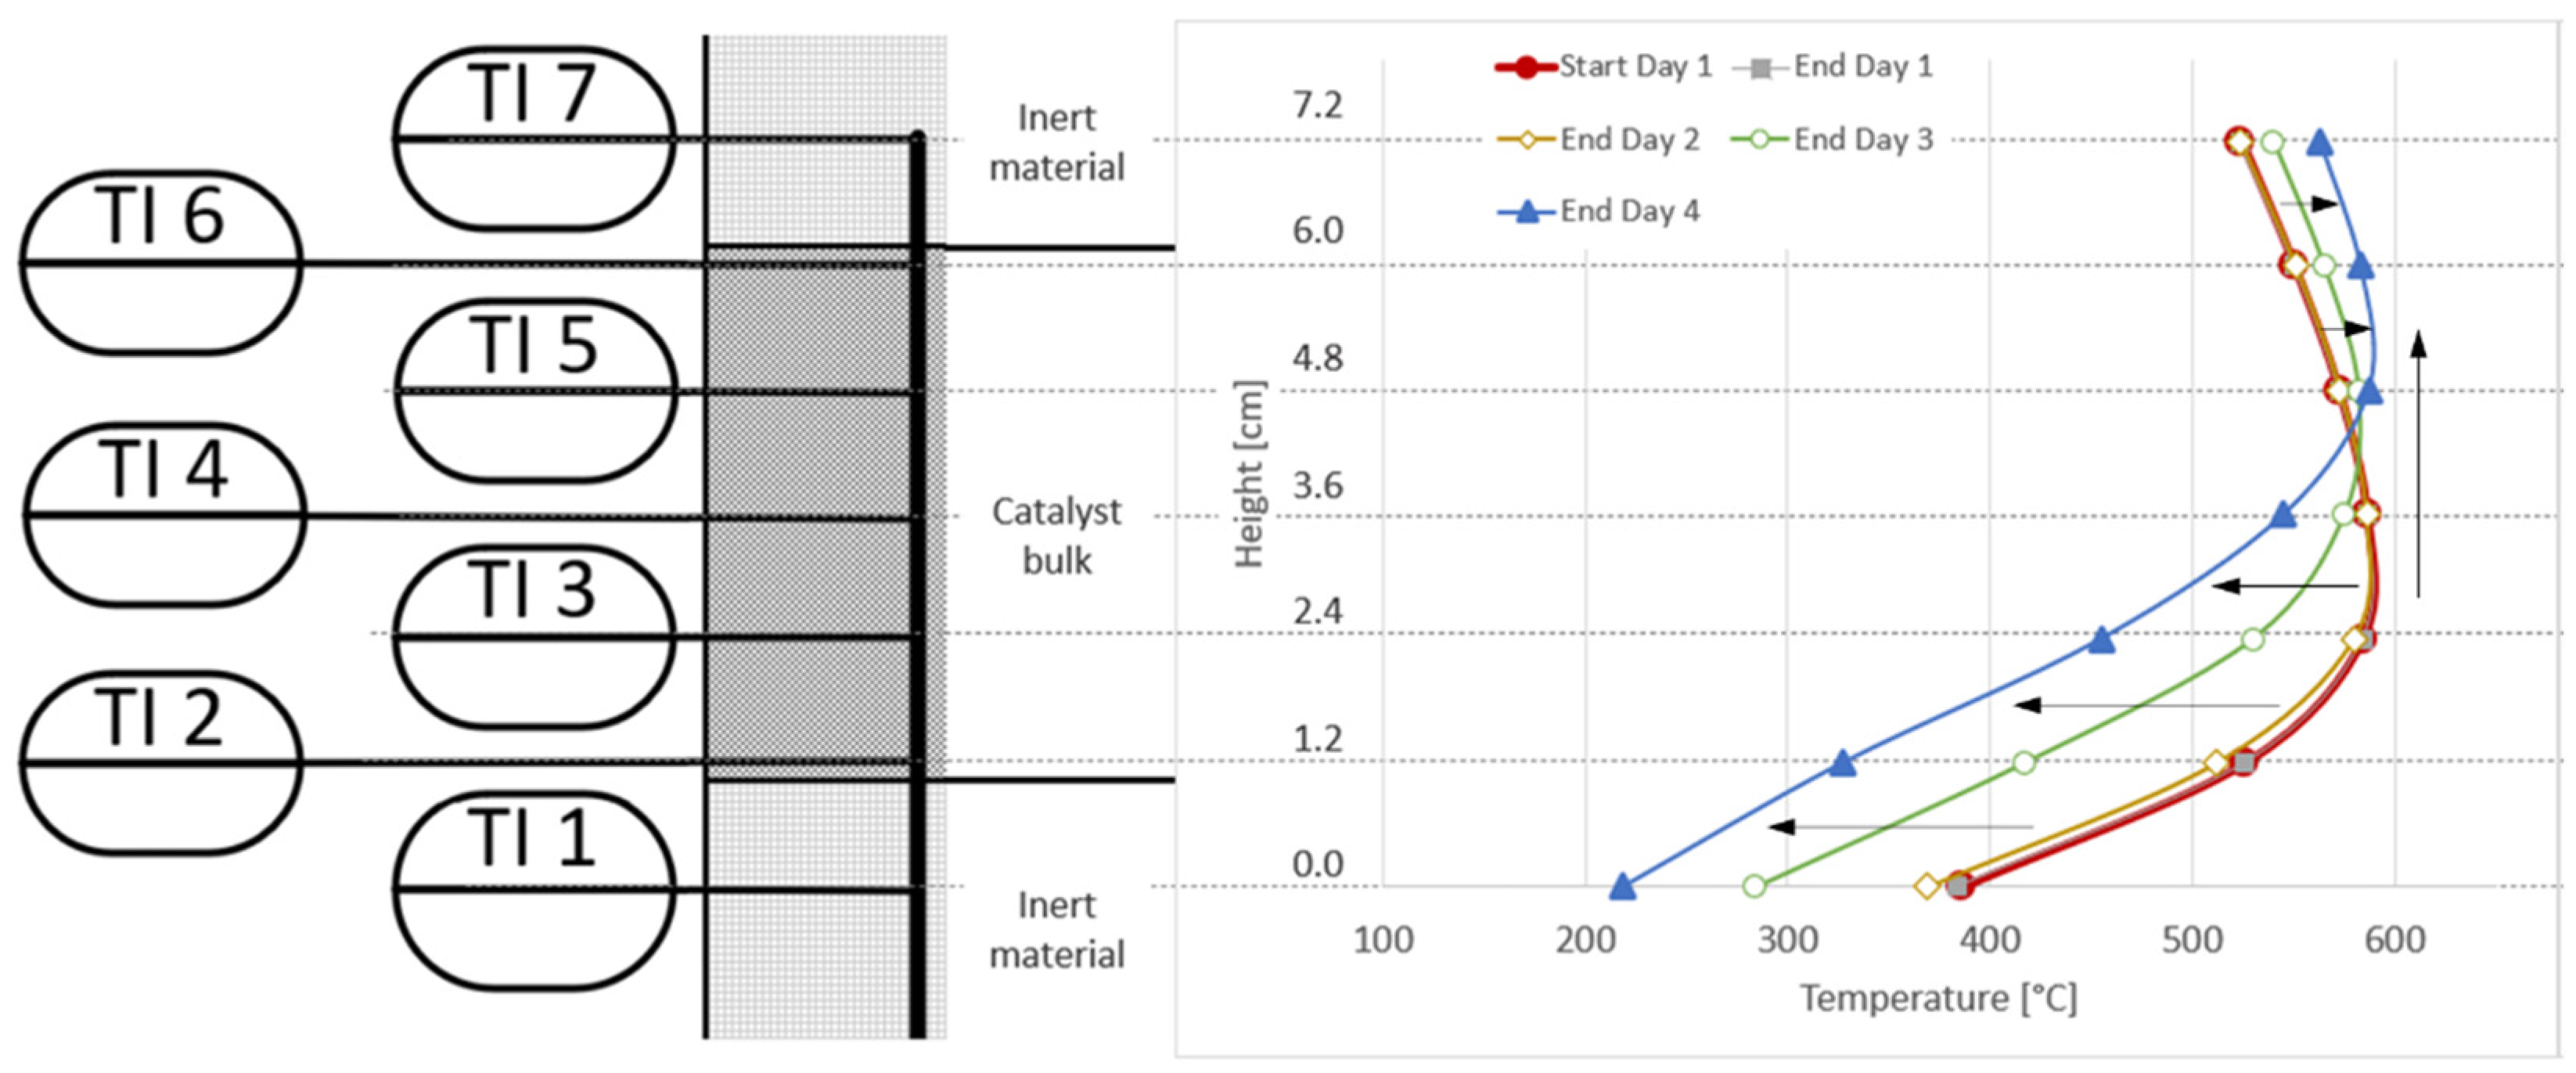
An analysis of the temperature profile along the reactor proves that there is no drop in catalyst performance noticeable on day one, as the red and grey lines in Figure 14 are almost identical. Day two shows the reported minor shift at the bottom of the reactor towards cooler temperatures (yellow line). With day three and four (green and blue lines), the shift towards the left for the lower half of the catalyst bulk is clearly noticeable. At TI5, the temperature remained almost constant during all four days. At the top, the reported temperature increase during the days three and four can be seen, as well as a shift in the hotspot temperature from TI3 to TI5/TI6 over time, clearly indicating the loading of the installed adsorbent bed, as well as a breakthrough of catalyst poisons downstream towards reactor R1.
Further to the comparison of the temperature profile, reference measurements were also performed prior to and after the real gas experiments on day one and day two. For these, a synthetic gas mixture consisting of hydrogen and CO2 (H2:CO2 = 8:1.5) was used to evaluate if any drop in performance can be recognised. Table 6 lists the product gas composition for these reference measurements. Ref. #1 was taken prior to the real gas experiments, Ref. #2 after day one and Ref. #3 at the end of day two. When exclusively addressing the product gas composition, there is no sign for catalyst deactivation observed until the end of day two.
Nevertheless, as the temperature profile in Figure 13 and Figure 14 indicates, the first sign of a breakthrough of catalyst poisons occurred on day two after approximately two hours of experiments. This results in a service life of 7.2 h for the implemented adsorbent and is exclusively based on analysing the temperature profile measured inside the reactors. During this time, a total of 7.3 m3 of real gases flowed through the adsorbent bed, with a volume of 300 mL. Considering the product gas composition, the first catalyst deactivation can be observed after 12.4 h (~12.4 m3 of real gases). This results in a required amount of absorbent material of 15.1 g per hour of operation with base case parameters, or 15.0 g/m3 of feed gas, respectively.
All of the information obtained from the experiments in lab-scale can be used to estimate and design a pilot plant for the methanation of real gases, including an additional gas cleaning step based on activated carbon. Medved et al. [9] described several application scenarios for the direct methanation of steel gases. One scenario is the substitution of the plant internal natural gas demand with SNG through the methanation of blast furnace gas (BFG). Such a scenario includes approximately 57,000 Nm3/h of BFG and 100,000 Nm3/h of hydrogen. With the consumption numbers for activated carbon obtained in this work, this would result in the need of ~2.4 t of adsorbent per operating hour. Furthermore, Calbry-Muzyka et al. [18] estimated the capacity of the required adsorbent by calculating the integrated loading of H2S in the adsorbent bed during operation with biogas. With Equation (7), the loading can also be calculated for other catalyst poisons, such as the ones present in the real blast furnace gas. The following parameters are required as an input:
  • Ccat_poison—avg. molar fraction of catalyst poison in the feed gas [mol/m3];
  • Q—avg. flow rate of feed gas stream (real gas plus hydrogen) [m3/h];
  • Mcat_poison—molar mass of catalyst poison [g/mol];
  • t—operating hours [h];
  • madsorbent—mass of activated carbon implemented [g].
Loading   [ wt . % ] = C cat _ poison × Q × M cat _ poison × t m adsorbent
Table 7 shows the results for a total flow rate of 1.01 m3/h (representing base case parameters), 187 g of adsorbent bed and 12.4 operating hours. This experiment duration was selected as it flags the first sign of catalyst deactivation based on monitoring the product gas composition. Consequently, it also shows a breakthrough of catalyst poisons through the adsorbent bed, which is sufficient for an effect on the catalyst’s activity. The loading is below 1.0 wt.-% for each type of catalyst poison measured, with the highest values for COS, followed by H2S.
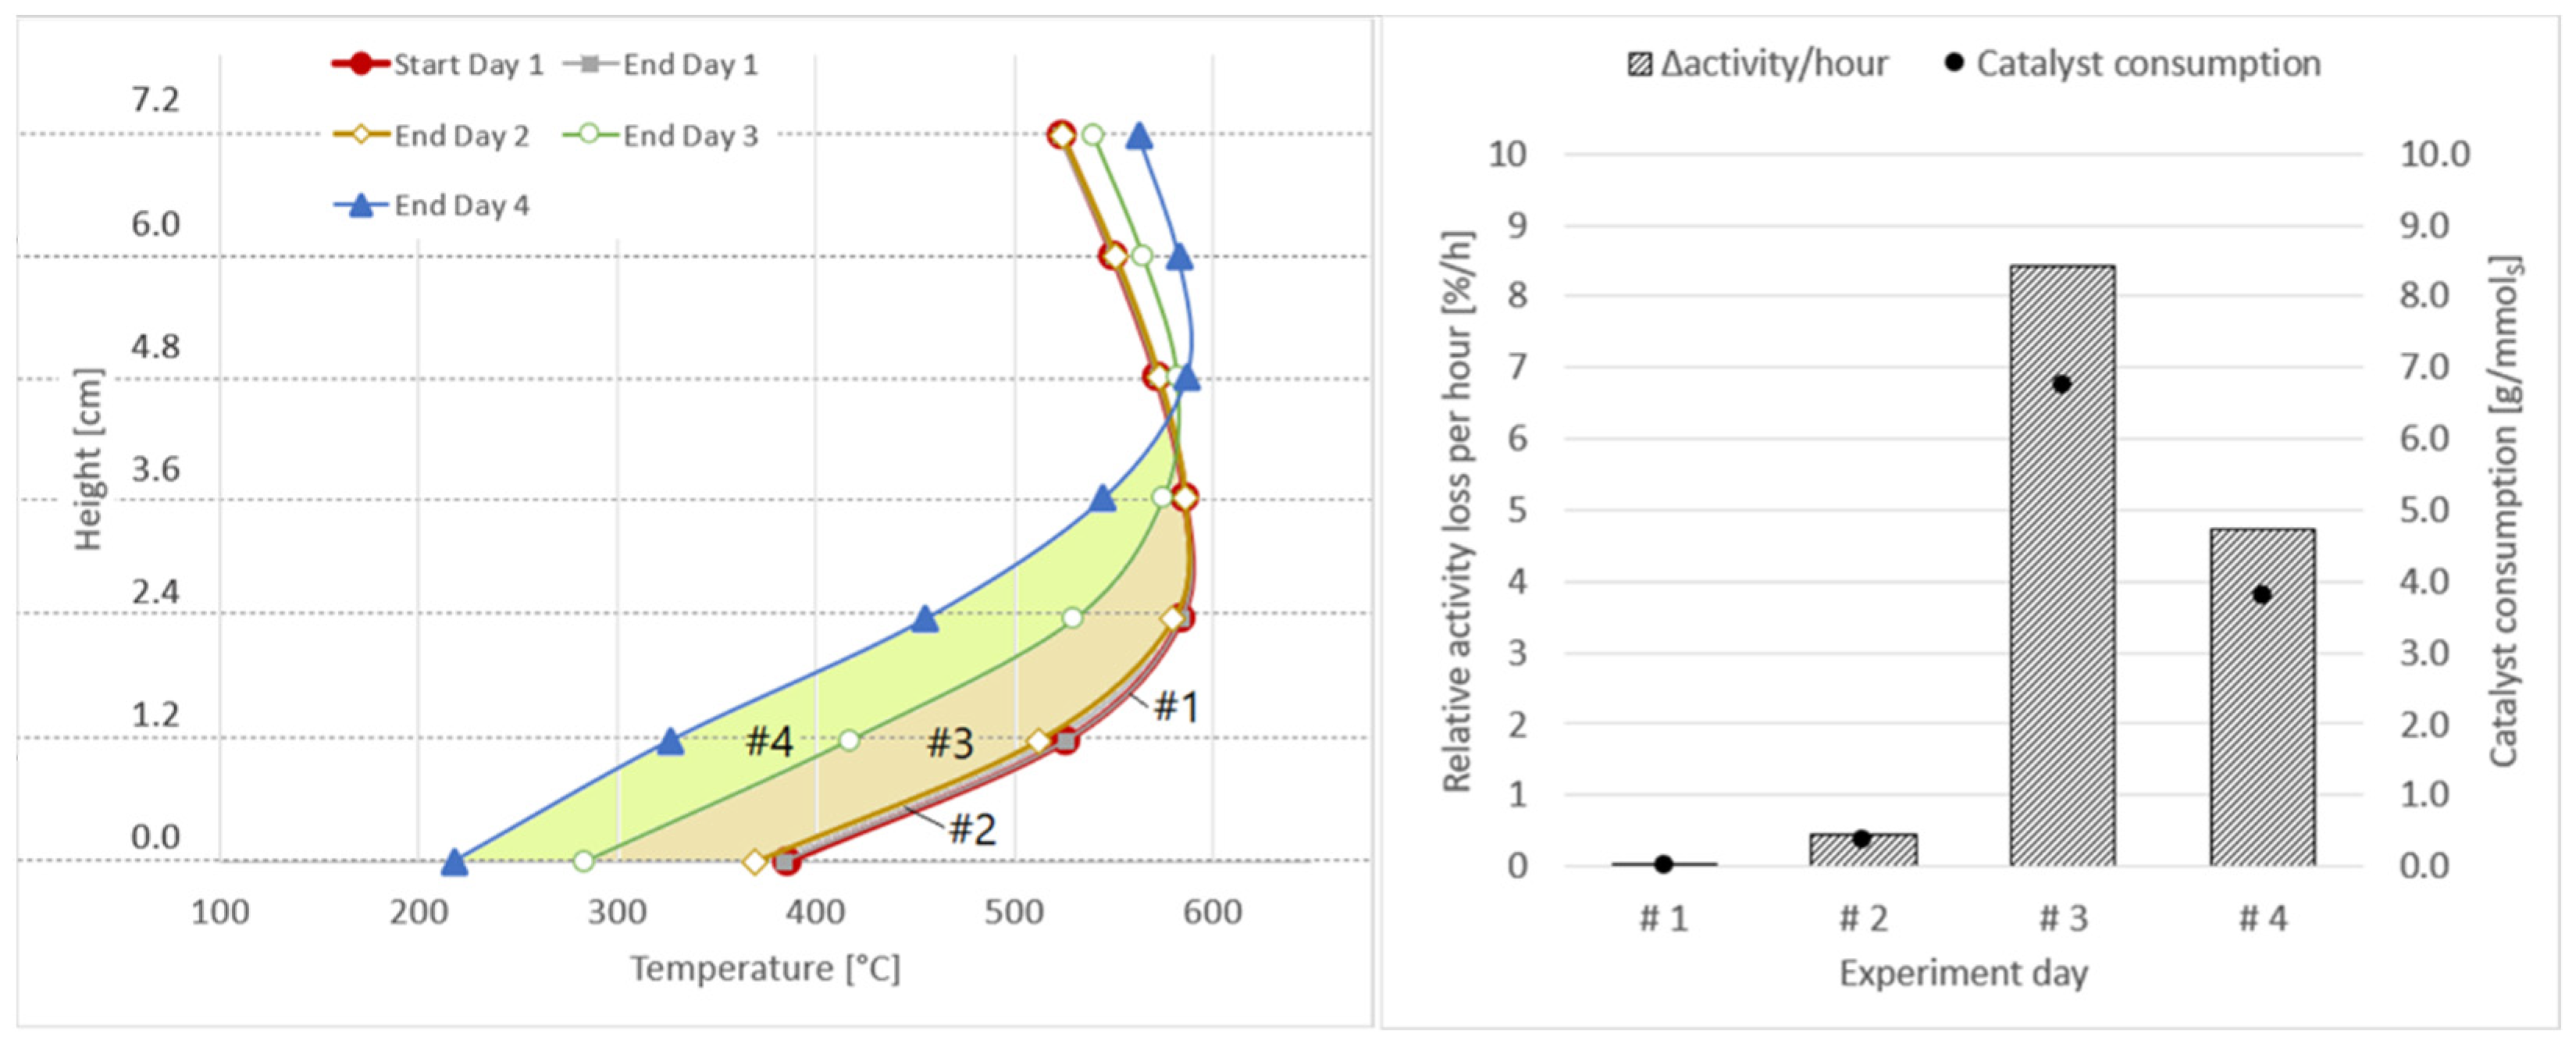
Neubert [29] used a different approach for describing the adsorption of catalyst poisons by comparing the integral change in the axial temperature profiles between two experiments with the one obtained with a fresh catalyst. The author used Equation (8) to calculate the relative activity loss (Δactivity in %) per experiment, which can be further related to the runtime of an experiment (Equation (9)). As a parameter for upscaling, the catalyst consumption (Δmcatalyst) due to sulphur-based catalyst poisons (ni) can be calculated. This term is multiplied by the amount of fresh catalyst mass (mcatalyst,0) used in the methanation reactor (Equation (10)).
Δ activity = 0 z T m ( z ) T n ( z ) dz 0 7.2 ( T 1 ( z ) T 1 ) dz
Δ activity / h = Δ activity Δ t
Δ m catalyst = Δ activity n i × m catalyst , 0
The results for the four days of experiments with real BFG are shown in Figure 15, as well as in Table 8. During the first two days, the catalyst activity decreased only by less than 3.0%, with a very small catalyst consumption due to sulphur-based catalyst poisons. On day three and four, the catalyst consumption increased to 6.8 and 3.8 gcatalyst/mmolsulphur, with a combined activity loss of close to 45%. This again shows that, without gas cleaning, respectively, with a fully loaded adsorbent bed, catalyst degradation takes place at an enormous rate. Furthermore, the higher values for Δactivity and Δmcatalyst on day three compared to day four show that an instant, high drop in performance takes place as soon as poisons break through the adsorbent bed, after which, the decrease stabilises at a lower rate. This behaviour was also observed during the initial tests with real blast furnace gas.
When upscaling the figures obtained for day one and day two for the real application scenario in the steelworks, this would result in the deactivation of 88.1 kg of catalyst per hour of operation. Considering the catalyst consumption of the evaluated 12.4 operating hours with a rate of 1.75 gcat/m3 and upscaling them for the real case, 275 kgcat would be deactivated per hour.
In addition to the experiments with BFG, the upgraded methanation setup, including the activated carbon filter, was also exposed to real gases from a converter (BOFG), with a composition according to Table 2. Again, the required hydrogen to achieve a σ H 2 of 1.05 was added through gas bottles. During the experiments with base case parameters and one reactor, no catalyst deactivation was detected over a period of 16 h. As the contaminants of the BOFG are far fewer compared to the ones of BFG (compare Table 3), this is a logical result and shows that the implemented solution works for both gas types. Table 9 compares the product gas composition of methanation with real BOFG and synthetic BOFG. As with blast furnace gas, they are again very similar, varying within 0.5 to 3%-points depending on the gas component.
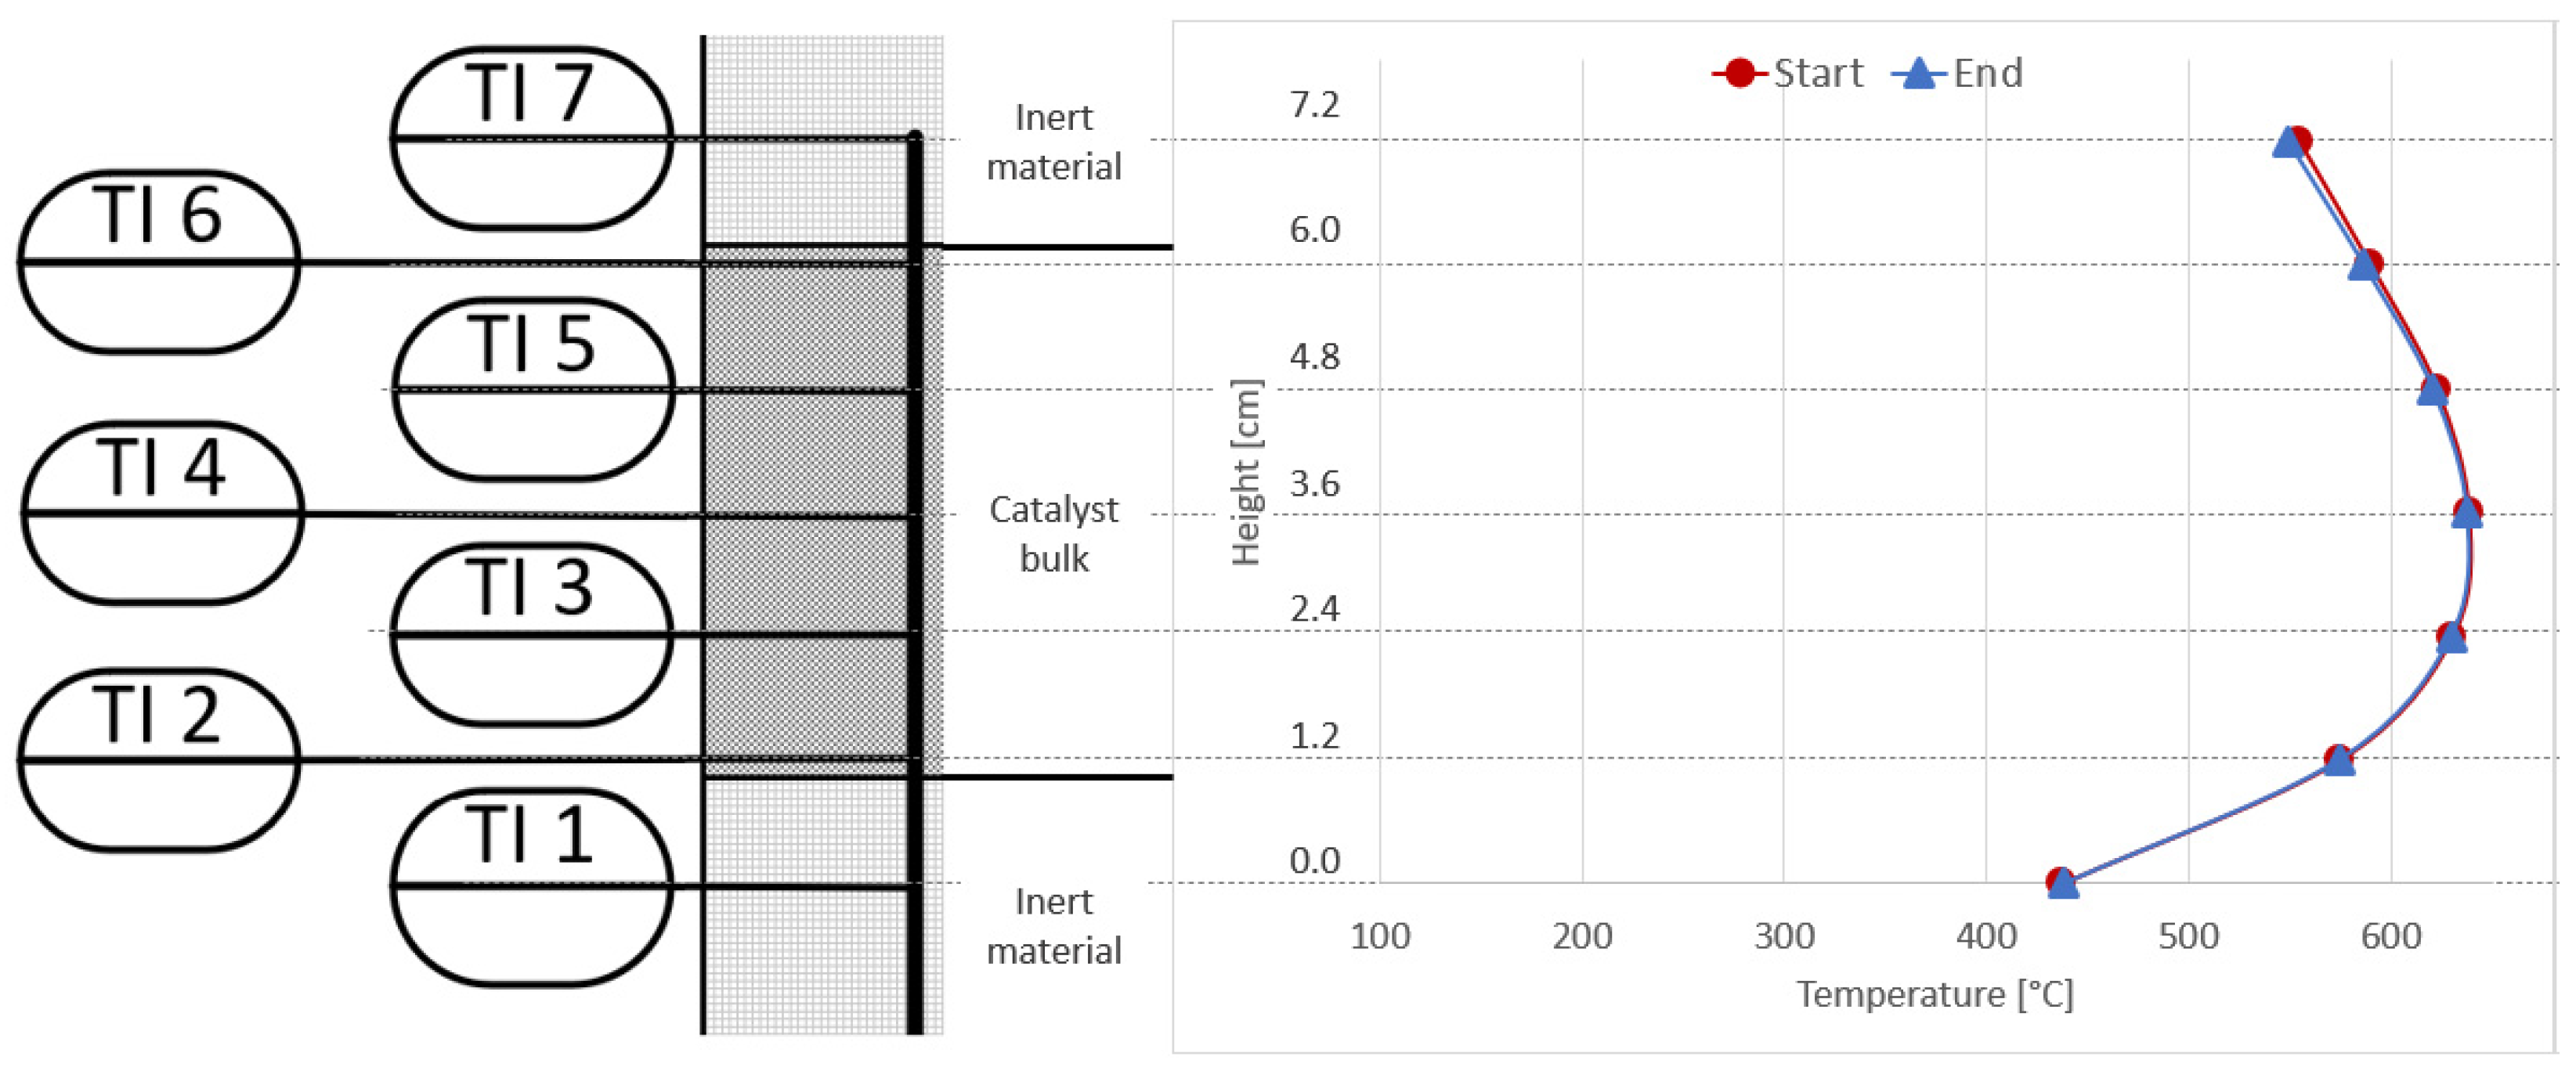
The temperature profile shown in Figure 16, as well as the analysis of the gas condensate, proves that there is no catalyst deactivation noticeable. The temperatures measured inside the reactor at the start and end of the real gas experiments are almost identical and follow the same bell-shaped profile, with a hot spot at measurement point TI4 (middle of the catalyst bulk). In addition, the amount of Ni atoms measured in the gas condensate sample is the same for synthetic and real gases (22 µg/L).

4. Conclusions and Outlook

In this work, methanation experiments with real gases from the steelworks industry have been performed. These experiments included real by-product gases from the blast furnace, as well as from the basic oxygen furnace (converter), that were directly bottled at an integrated steel plant during normal operation. No further treatment, such as a CO2 or N2 separation step, was performed prior to the filling procedure. Methanation without additional gas cleaning resulted in an instant, as well as steady, catalyst degradation due to the poisons present in the real gases. Over the evaluated periods, a drop in the COx conversion of ~30%, or 1.8% per hour, was detected for blast furnace gas. The usage of unfiltered real gases resulted in a 3.2 times higher amount of Ni transported out of the reactor setup with the condensate, compared to experiments with synthetic gases meeting the same composition and operating conditions.
As a working solution, an activated carbon filter coated with copper oxide was implemented, showing that a further pre-treatment of the already cleaned steelworks gases is essential prior to feeding them to a catalytic methanation plant. With the activated carbon filter in place, methanation experiments could be performed without any noticeable degradation until the 187 g of activated carbon adsorbent were fully loaded with catalyst poisons. The first signs of deactivation appeared after 7.2 h of operation with real BFG, by means of a drop in the reactor temperature measured at the bottom of the catalyst bulk. Over another period of 5.2 h, the product gas composition and overall conversion rate remained constant, after which, the methane yield started to drop. During this period of 12.4 h, on average, 15.1 g of adsorbent was consumed per hour of operation. The loading of catalyst poisons within the adsorbent bed stayed within a range of 0.01 to 0.73 wt.-% depending on the type of poison. While continuing methanation over another 6.7 h, the catalyst consumption increased from 0.4 to 4.8 gcat/mmolsulphur on average, and the relative activity of the catalyst decreased by ~45% compared to its starting performance. In the case of real BOFG, no signs of catalyst deactivation could be observed during the course of the experiments, which is a result of the far lower catalyst poisons present in this type of gas.
For a real application-based scenario in an integrated steelworks, with the target to substitute the demand of any externally sourced natural gas with a plant-internally produced SNG through methanation, the figures obtained through the experiments at lab-scale would result in the need of ~2.4 t of adsorbent and a deactivation of 88.1 kg of catalyst per hour of operation.
Future work will show the usability of the methanation setup for dynamic experiments as they occur in a steelworks plant, including frequent load changes of up to 25% of gas input power in the range of 5 to 45 min simulating a dynamically operated PEM electrolysing unit. The values obtained through the lab-scaled experiments will also assist in the technical design of a pilot plant for the steelworks industry, including a gas cleaning step based on activated carbon prior to feeding the real gases to the methanation units. Furthermore, the catalyst degradation due to poisons present in the real gases will be investigated in detail through Raman spectroscopy, as well as BET analysis.

Author Contributions

Conceptualization, P.W.-Z. and A.R.M.; Formal analysis, P.W.-Z.; Methodology, P.W.-Z. and A.R.M.; Validation, P.W.-Z., A.R.M., M.L. and N.K.; Visualization, P.W.-Z.; Writing–original draft, P.W.-Z.; Writing–review & editing, P.W.-Z., A.R.M., M.L., N.K. and K.R. All authors have read and agreed to the published version of the manuscript.

Funding

This research was funded by the Research Fund for Coal and Steel RFCS by the EU Commission, grant number 800659 i3upgrade https://www.i3upgrade.eu/ (accessed on 18 August 2021).

Data Availability Statement

Not applicable.

Acknowledgments

The experiments of this work were conducted as part of the research project “i3upgrade—intelligent, integrated, industries”, funded by the European Commission. Besides Montanuniversität Leoben, the following research institutes were involved: Chair of Energy Process Engineering (EVT) and Institute of Chemical Reaction Engineering (CRT) at Friedrich-Alexander University Erlangen-Nürnberg, Germany; Central Mining Institute (GIG) in Katowice, Poland; Institute of Communication Information and Perception Technologies (TeCIP) of Scuola Superiore Sant’Anna (SSSA) in Pisa, Italy; and the Centre for Research and Technology Hellas (CERTH), Thessaloniki, Greece; with the industrial partners AIR LIQUIDE Forschung und Entwicklung GmbH (ALFE), voestalpine Stahl GmbH (VAS) and K1-MET GmbH. The authors would also like to acknowledge the work of Hanna Weiss during her bachelor’s studies.

Conflicts of Interest

The authors declare no conflict of interest. This paper reflects only the author’s view, and the founding sponsors had no role in the design of the study, in the collection, analyses, or interpretation of data, in the writing of the manuscript and in the decision to publish the results. The European Commission is not responsible for any use that may be made of the information contained therein.

Abbreviations

Δ H r 0 Reaction enthalpy
σ H 2 Ratio of molar hydrogen flow compared to molar flows of CO and CO2
QgasTotal feed gas volume flow
VcatalystCatalyst volume
n i Molar flows
x i Gas composition
Ccat_poisonAvg. molar fraction of catalyst poison in the feed gas
Mcat_poisonMolar mass of catalyst poison
tOperating hours
madsorbentMass of activated carbon
ΔactivityRelative activity loss
ΔmcatalystCatalyst consumption
BFGBlast furnace gas
BFGsynSynthetic blast furnace gas
BFGrealReal blast furnace gas
BOFGBasic oxygen furnace gas/converter gas
CH3SHMethyl mercaptan
CH4Methane
ClChloride
CnHmHigher hydrocarbons (C2+)
COCarbon monoxide
CO2Carbon dioxide
COGCoke oven gas
COSCarbonyl sulphide
CS2Carbon disulphide
CuOCopper oxide
E1,2Experiment 1 or 2
GHGGreenhouse gas
GHSVGas hourly space velocity
H2Hydrogen
H2OWater or steam
H2SHydrogen sulphide
HClHydrogen chloride
HCNHydrogen cyanide
HgMercury
IDInner diameter
ISOInternational Organization for Standardization
LHVLower heating value
N2Nitrogen
NH3Ammonia
NiNickel
NO2Nitrogen dioxide
NOxNitrogen oxides
ODOuter diameter
PEMProton-exchange membrane
ppmParts per million
R1, R2, R3Reactors 1, 2 or 3
SSulphur
SbAntimony
SEMScanning electron microscope
SNGSynthetic natural gas
SO2Sulphur dioxide
SO4Sulphate
STPStandard temperature and pressure
TI1-7Temperature indicator 1 to 7
TRLTechnology readiness level
vol.-% (dry)Share in volume percent (dry basis)
W1, W2, W3Heat exchanger 1, 2 or 3
wt.-%Share in weight percent

References

  1. Uribe-Soto, W.; Portha, J.-F.; Commenge, J.-M.; Falk, L. A review of thermochemical processes and technologies to use steelworks off-gases. Renew. Sustain. Energy Rev. 2017, 74, 809–823. [Google Scholar] [CrossRef]
  2. Hasanbeigi, A.; Arens, M.; Cardenas, J.C.R.; Price, L.; Triolo, R. Comparison of carbon dioxide emissions intensity of steel production in China, Germany, Mexico, and the United States. Resour. Conserv. Recycl. 2016, 113, 127–139. [Google Scholar] [CrossRef] [Green Version]
  3. World Steel Association. World Steel in Figures. 2020. Available online: www.worldsteel.org (accessed on 30 April 2020).
  4. Remus, R.; Aguado Monsonet, M.; Roudier, S.; Delgado Sancho, L. Best Available Techniques (BAT) Reference Document for Iron and Steel Production. Joint Research Centre Reference Report. In Industrial Emissions Directive 2010/75/EU Integrated Pollution Prevention and Control; European Commission JCR: Luxembourg, 2013. [Google Scholar]
  5. Sabatier, P.; Senderens, J.B. New methane synthesis. Compt. Rend. Acad. Sci. 1902, 134, 514–516. [Google Scholar]
  6. Rönsch, S.; Schneider, J.; Matthischke, S.; Schlüter, M.; Götz, M.; Lefebvre, J.; Prabhakaran, P.; Bajohr, S. Review on methanation–From fundamentals to current projects. Fuel 2016, 166, 276–296. [Google Scholar] [CrossRef]
  7. Müller, K.; Rachow, F.; Günther, V.; Schmeisser, D. Methanation of Coke Oven Gas with Nickel-based catalysts. Int. J. Env. Sci. 2019, 4, 73–79. [Google Scholar]
  8. Razzaq, R.; Zhu, H.; Jiang, L.; Muhammad, U.; Li, C.; Zhang, S. Catalytic Methanation of CO and CO2 in Coke Oven Gas over Ni–Co/ZrO2–CeO2. Ind. Eng. Chem. Res. 2013, 52, 2247–2256. [Google Scholar] [CrossRef]
  9. Medved, A.R.; Lehner, M.; Rosenfeld, D.C.; Lindorfer, J.; Rechberger, K. Enrichment of Integrated Steel Plant Process Gases with Implementation of Renewable Energy-Integration of power-to-gas and biomass gasification system in steel production. Johns. Matthey Technol. Rev. 2021, 65, 453–465. [Google Scholar] [CrossRef]
  10. Schöß, M.A.; Redenius, A.; Turek, T.; Güttel, R. Chemische Speicherung regenerativer elektrischer Energie durch Methanisierung von Prozessgasen aus der Stahlindustrie. Chem. Ing. Technik. 2014, 86, 734–739. [Google Scholar] [CrossRef]
  11. Lehner, M.; Biegger, P.; Medved, A.R. Power-to-Gas: Die Rolle der chemischen Speicherung in einem Energiesystem mit hohen Anteilen an erneuerbarer Energie. Elektrotechnik Und Inf. 2017, 134, 246–251. [Google Scholar] [CrossRef] [Green Version]
  12. Müller, K.; Rachow, F.; Israel, J.; Charlafti, E.; Schwiertz, C.; Scmeisser, D. Direct Methanation of Flue Gas at a Lignite Power Plant. Int. J. Env. Sci. 2017, 2, 425–437. [Google Scholar]
  13. Müller, K.; Fleige, M.; Rachow, F.; Schmeißer, D. Sabatier based CO2-methanation of Flue Gas Emitted by Conventional Power Plants. Energy Procedia 2013, 40, 240–248. [Google Scholar] [CrossRef] [Green Version]
  14. Rachow, F. Prozessoptimierung für Die Methanisierung von CO2-Vom Labor Zum Technikum. Ph.D. Thesis, Brandenburgische TU Cottbus-Senftenberg, Cottbus, Germany, 2017. [Google Scholar]
  15. Méndez-Mateos, D.; Barrio, V.L.; Requies, J.M.; Cambra, J.F. A study of deactivation by H2S and regeneration of a Ni catalyst supported on Al2O3, during methanation of CO2. Effect of the promoters Co, Cr, Fe and Mo. RSC Adv. 2020, 10, 16551–16564. [Google Scholar] [CrossRef]
  16. Calbry-Muzyka, A.S.; Schildhauer, T.J. Direct Methanation of Biogas—Technical Challenges and Recent Progress. Front. Energy Res. 2020, 8. [Google Scholar] [CrossRef]
  17. Witte, J.; Calbry-Muzyka, A.; Wieseler, T.; Hottinger, P.; Biollaz, S.M.; Schildhauer, T.J. Demonstrating direct methanation of real biogas in a fluidised bed reactor. Appl. Energy 2019, 240, 359–371. [Google Scholar] [CrossRef]
  18. Calbry-Muzyka, A.S.; Gantenbein, A.; Schneebeli, J.; Frei, A.; Knorpp, A.J.; Schildhauer, T.J.; Biollaz, S.M. Deep removal of sulfur and trace organic compounds from biogas to protect a catalytic methanation reactor. Chem. Eng. J. 2018, 360, 577–590. [Google Scholar] [CrossRef]
  19. Fitzharris, W.D. Sulfur deactivation of nickel methanation catalysts. J. Catal. 1982, 76, 369–384. [Google Scholar] [CrossRef]
  20. Bartholomew, C.H. Sulfur poisoning of nickel methanation catalysts: I. in situ deactivation by H2S of nickel and nickel bimetallics. J. Catal. 1979, 60, 257–269. [Google Scholar] [CrossRef]
  21. Biegger, P. Keramische Wabenkatalysatoren zur Chemischen Methanisierung von CO2. Ph.D. Thesis, Montanuniversität Leoben, Leoben, Austria, 2017. [Google Scholar]
  22. Biegger, P.; Kirchbacher, F.; Medved, A.R.; Miltner, M.; Lehner, M.; Harasek, M. Development of Honeycomb Methanation Catalyst and Its Application in Power to Gas Systems. Energies 2018, 11, 1679. [Google Scholar] [CrossRef] [Green Version]
  23. Medved, A.R. The Influence of Nitrogen on Catalytic Methanation. Ph.D. Thesis, Montanuniversität Leoben, Leoben, Austria, 2020. [Google Scholar]
  24. Lanzerstorfer, C.; Preitschopf, W.; Neuhold, R.; Feilmayr, C. Emissions and Removal of Gaseous Pollutants from the Top-gas of a Blast Furnace. ISIJ Int. 2019, 59, 590–595. [Google Scholar] [CrossRef] [Green Version]
  25. Voestalpine Stahl GmbH Prüftechnik & Analytik. Analysenergebnisse der Umwelt-Und Betriebsanalytik. Linz, Austria. 2019. Available online: https://www.voestalpine.com/technischerservice/Prueftechnik-und-Analytik/Umweltanalytik (accessed on 18 August 2021).
  26. Hauser, A.; Weitzer, M.; Gunsch, S.; Neubert, M.; Karl, J. Dynamic hydrogen-intensified methanation of synthetic by-product gases from steelworks. Fuel Process. Technol. 2021, 217, 106701. [Google Scholar] [CrossRef]
  27. Wolf-Zoellner, P.; Lehner, M.; Hauser, A.; Neubert, M.; Karl, J. i3upgrade–Deliverable D2.4-Demonstration of New Reactors with Real Gases from Steelworks; Deliverable Report to EU Commission; EU Commission: Brussels, Belgium, 2020. [Google Scholar]
  28. Argyle, M.D.; Bartholomew, C.H. Heterogeneous Catalyst Deactivation and Regeneration: A Review. Catalysts 2015, 5, 145–269. [Google Scholar] [CrossRef] [Green Version]
  29. Neubert, M. Catalytic Methanation for Small- and Mid-Scale SNG Production. Ph.D. Thesis, Friedrich-Alexander-Universität Erlangen-Nuremberg, Erlangen, Germany, 2019. [Google Scholar]
Figure 1. Schematic of steelmaking process—blast furnace/basic oxygen furnace route.
Energies 14 08131 g001
Figure 2. Lab-scale methanation test rig (left); reactors and heat exchangers (right).
Energies 14 08131 g002
Figure 3. Basic flow sheet of lab-scale methanation plant at Montanuniversität Leoben.
Energies 14 08131 g003
Figure 4. Schematic of one reactor with multi-thermoelement—bulk (left), honeycomb (right).
Energies 14 08131 g004
Figure 5. First methanation experiment with real BFG (BFGreal, 4000 h−1, 4 bar, 5% H2 excess).
Energies 14 08131 g005
Figure 6. Comparison of experiments with real and synthetic BFG with varying H2 excess rate ( σ H 2 = 1.05, 1.09, 1.02, 1.00) at 4000 h−1 and 4 bar, COx conversion in %, reactor temperature in °C.
Energies 14 08131 g006
Figure 7. Comparison of COx conversion rates in % of two experiments with real BFG, first one (E-1) taken at 0 min, and second one (E-2) taken after 4 h of real gas experiments with varying H2 excess rate.
Energies 14 08131 g007
Figure 8. Comparison of real gas experiments E-1 and E-2 with 5% H2 excess rate (4000 h−1, 4 bar), product gas composition in vol.-% dry.
Energies 14 08131 g008
Figure 9. Time-based data for extended experiment duration with real BFG (4000 h−1, 4 bar, 5% H2-excess) over 16.8 h.
Energies 14 08131 g009
Figure 10. Comparison of reactor R1 temperature profiles at start (red) and end (blue) of long-term experiments with real BFG.
Energies 14 08131 g010
Figure 11. SEM pictures of new (left) and used (right) bulk catalyst sphere.
Energies 14 08131 g011
Figure 12. Activated carbon pellets with copper oxide coating.
Energies 14 08131 g012
Figure 13. Time-based data for extended experiment duration with real BFG and activated carbon filter (4000 h−1, 4 bar, 5% H2-excess) over 4 days (25.2 h net).
Energies 14 08131 g013
Figure 14. Comparison of reactor R1 temperature profiles at the start of day one, and at the end of each experiment day; activated carbon filter used for real BFG.
Energies 14 08131 g014
Figure 15. Axial shift of temperature profiles for Δactivity calculation per experiment day (left); relative activity loss per hour and catalyst consumption per mmol of sulphur (right).
Energies 14 08131 g015
Figure 16. Comparison of reactor R1 temperature profiles at start (red) and end (blue) of experiments; activated carbon filter used for real BOFG.
Energies 14 08131 g016
Table 1. Gas composition of by-product gases from a typical steelworks plant [4].
Parameter/Gas ComponentUnitCOGBFGBOFG
MinMaxMinMaxMean
CO2vol.-% (dry)15.4162617.2
COvol.-% (dry)3.45.8192760.9
H2vol.-% (dry)36.161.7184.3
N2vol.-% (dry)1.56445815.5
CH4vol.-% (dry)15.727--0.1
CnHmvol.-% (dry)1.42.4---
Lower heating value (LHV)kJ/Nm3900019,000260040008184
Table 2. Gas composition of bottled real gases from steelworks per gas type.
Gas Component
(vol.-% Dry)
BFGBOFG
N248.626.5
O20.60.5
CO223.3317.6
CO24.1754.5
CH4n.d.<0.1
H23.30.9
Σ CnHmn.d.<0.1
n.d.—not detectable.
Table 3. Catalyst poisons in bottled real gases for BFG and BOFG [24,25].
Catalyst PoisonBFGBOFG
mg/Nm3mg/Nm3
H2S28<1
CS20.26<1
COS110<1
SO22.20.99
HCl<10.05
NH30.150.05
CH3SH<1<1
C3H6On.d.n.d.
HCN0.12n.d.
Sbn.d.<0.001
Hgn.d.n.d.
n.d.—not detectable.
Table 4. Gas condensate analysis for BFG (real gases vs. synthetic gas mixture).
ParameterValue Measured forUnitDetermination Limit
Real GasSynthetic Gas
pH-value8.56.7--
Chloride Cl<0.50<0.50mg/L0.50
Sulphate SO4<0.50<0.50mg/L0.50
Nickel Ni7322µg/L1.0
Sulphur S<5.0<5.0mg/L5.0
Table 5. Comparison of average product gas composition of methanation with real BFG on day one and synthetic BFG (BFGsyn); values in vol.-%, activated carbon filter used for real gases.
Gas ComponentBFGrealBFGsyn
CO25.266.0
CO0.920.99
CH430.9832.45
H225.1924.5
N237.6536.06
Table 6. Product gas composition of reference measurements taken with synthetic H2/CO2 gas mixture (values in vol.-% dry).
Gas TypeRef. #1Ref. #2Ref. #3
CO20.70.90.8
CO0.00.00.0
CH439.739.339.5
H257.257.757.4
Table 7. Loading of adsorbent bed in wt.-% per catalyst poison during methanation with base case parameters over 12.4 h of operation.
Catalyst PoisonBFGrealLoading
mg/Nm3wt.-%
H2S280.2
CS20.260.01
COS1100.73
SO22.20.02
HCl<1<0.01
NH30.150.001
CH3SH<1<0.02
HCN0.120.001
Table 8. Relative activity loss (Δactivity) in % and in %/h, as well as catalyst consumption (Δmcatalyst) in gcat/mmolsulphur and gcat/m3 for experiments with real BFG (4 days); activated carbon in place.
Experiment DayArea between Axial
Temperature Profiles
Δactivity
[%]
Δactivity/h
[%/h]
Δmcatalyst [gcat/mmolsulphur]Δmcatalyst [gcat/m3]
#1Start day 1–End day 1
Energies 14 08131 i001 Energies 14 08131 i002
0.190.040.030.1
#2End day 1–End day 2
Energies 14 08131 i003 Energies 14 08131 i004
2.790.460.371.0
#3End day 2–End day 3
Energies 14 08131 i005 Energies 14 08131 i006
21.048.426.7718.2
#4End day 3–End day 4
Energies 14 08131 i007 Energies 14 08131 i008
23.694.743.8110.3
Table 9. Comparison of average product gas composition of methanation with real and synthetic BOFG (values in vol.-%).
Gas ComponentBOFGrealBOFGsyn
CO27.046.50
CO2.282.43
CH437.0638.12
H236.1938.57
N217.4314.38
Publisher’s Note: MDPI stays neutral with regard to jurisdictional claims in published maps and institutional affiliations.