1. Introduction
On 8 August, 2019, the Intergovernmental Panel on Climate Change (IPCC) published a report on climate and land changes. Its content clearly indicates the consequences that would ensue if the average annual temperature rose by 1.5 °C; humanity will face with problems including access to drinking water, soil desertification, violent weather phenomena, including prolonged droughts and floods, and food safety. In addition, this document indicated that changes have already been taking place, e.g., shifts in climatic zones, yield reductions in some regions of the world, and variations in the abundance or seasonal activity of some plant or animal species. The excessive emission of greenhouse gases is invariably indicated as one of the reasons for the progressive degradation of our planet. This document caused a great stir not only because it clearly indicates the consequences and risks of a further increase in the average temperature, but it clearly states a need to fulfill new regulations for reducing greenhouse gas emissions [
1].
Numerous states and the international organizations, including the European Union, have introduced new solutions aimed at preventing further destructive human activity. In addition to the previously used mechanisms which include, among others, the Emissions Trading System (EU ETS) or financial support for technologies based on renewable energy sources (RES), the better solutions are being increasingly looked for so as to achieve an ambitious goal that is the neutral impact of human activity on climatic changes. According to the assumptions of the climate and energy framework, by 2030, at least a 40% reduction in greenhouse gas emissions is assumed in comparison to the value from 1990, as well as at least a 32% share of renewable energy and at least a 32.5% improvement in energy efficiency [
2]. Moreover, according to the assumptions of the European Green Deal, Europe should become the first continent with a neutral impact on the climate by 2050, with the implementation of a closed loop economy. The plan also aims to restore biodiversity and reduce the amount of the contaminants emitted to the environment, which is aimed to be achieved through international cooperation focused on supporting green technologies, decarbonizing the energy sector or improving the energy efficiency of new and existing facilities [
3]. These plans are also written as a part of the promotional and preparatory activities until 2050 [
4].
The carbon dioxide generation factor for the production of electricity in Poland (0.8460 kgCO
2/kWh) is one of the highest values in the world; higher values are found in South Africa (0.9606 kgCO
2/kWh) and Estonia (0.8750 kgCO
2/kWh). Other heavily industrialized countries maintain lower emission levels, e.g., China (PR) (0.6236 kgCO
2/kWh), Hong Kong (China) (0.8000 kgCO
2/kWh), Australia (0.8000 kgCO
2/kWh), Canada (0.1300 kgCO
2/kWh), the United States (0.47590 kgCO
2/kWh), the United Kingdom (0.2773 kgCO
2/kWh), France (0.0470 kgCO
2/kWh), Germany (0.4690 kgCO
2/kWh) and the Russian Federation (0.3302 kgCO
2/kWh) [
5].
For this reason, Poland has conducted multidirectional activities aimed at reducing greenhouse gas emissions, thus contributing to the inhibition of the greenhouse effect. One such measure is planned changes in the energy sector; these changes are aimed at increasing the share of nonemission electricity production and improving energy efficiency. This goal is to be achieved through the development of RES, e.g., by increasing the share of photovoltaic micro-installations and constructing nuclear power plants [
6].
In addition to the central solutions focusing on large investments, parallel activities are being carried out to promote and support the improvement of the energy efficiency of facilities, paying particular attention to individual households. One of the solutions in the field of space heating is to promote installations in which heat is generated by heat pumps. These devices absorb ambient energy from the air, water or ground and deliver higher-temperature heat to a building using a vapor compression cycle. Depending on the type of device, the air, water or ground can be a heat reservoir [
7,
8,
9]. The ratio between the amount of heat produced by the device and the amount of work supplied to the driving device is known as the coefficient of energy performance (COP) [
10], whose value depends, inter alia, on the heat source temperature and its variability. Since ground temperatures vary slightly from ambient air temperatures, ground heat exchangers are coupled to heat pumps to achieve higher COP values [
11]. Other important factors that affect COP values are the type and temperature of medium used in central heating systems, the number and type of compressors, or the additional functions performed by the device (e.g., domestic hot water heating or cooling) [
9].
The impact of hydrogeological, geological, and climatic conditions on designing and operating a brine-to-water heat pump (GSHP) was investigated in Baden-Württemberg state [
12]. No effect of subsurface characteristics on the applied technical solutions or economic factors was found. Thus, these characteristics may not have been investigated thoroughly before ordering GSHPs.
The amount of carbon dioxide emissions avoided because of GSHP operations are 80 gCO
2/kWh or 164 gCO
2/kWh. These savings depend on the assumed energy mix; the lower value is for the average German mix, while the bigger savings are for Baden-Württemberg state, where 55% of energy is produced in a nuclear power station [
13].
The energy consumption of GSHPs coupled with Borehole Thermal Energy Storage (BTES) in Aalto University, located in Otaniemi (Espoo) in Finland, was recorded from October 2019 to September 2020 [
14]. The yearly averaged coefficient of performance (COP) was 3.7; after adding energy consumption for driving the circulating pumps of BTES, the COP dropped to 3.5.
Exergy analysis for a detached house in Ljubljana [
15] indicated the highest exergetic efficiency of 0.47 was achieved by a GSHP, followed by are a water-to-water heat pump (WSHP), air-to-water heat pump (ASHP) and gas boiler (GB), with the efficiencies of 0.45, 0.41 and 0.09, respectively.
A creative approach to exergy analysis was developed in [
16], where two methods of exergy analysis were compared: local (direct exergy analysis) and global (system exergy analysis). While the former indicated that a higher RES percentage decreases the exergy efficiency, which leads to erroneous conclusions, the latter gave the opposite and logical outcome that this higher percentage increases the exergy efficiency.
A life cycle assessment (LCA) was made for a residential building in New Jersey [
17]. The environmental impact of a 10.55 kW GSHP was calculated over 25 years. This study examined impact of drilling, producing and installing two borehole loops, operating and maintaining a heat pump system and treating wastes. Similarly, as in the above studies, over 50% of the emissions were caused by space heating. The heat pump had a lower impact on the environment than a natural gas boiler in 8 out of 18 categories, e.g., the smaller factors are GWP, ODP and PM formation. Another LCA [
18] was undertaken for a semi-detached house in the UK constructed in 1930s; the analysis was performed for two variants of heat generator: a 24 kW condensing gas boiler (CGB) and a hybrid system (HHP) consisting of a 10 kW ASHP and 10 kW condensing gas boiler. The HHP caused lower GWP and PM formation than the CGB, whilst the ODP was slightly higher. However, none of these studies included the efficiency of the electricity transmission, which favors heat pumps over boilers.
Similar investigations of a greenhouse located in Chungcheongnam-do Province in South Korea [
19] revealed the energy consumption share was 41–96% of the total emissions caused by its construction and exploitation. The biggest global warming impact (GWP) was exerted by a kerosene-powered boiler, followed by an electric-powered heat pump (above two times lower GWP) and heat-powered absorption heat pump (4 times lower GWP).
Another LCA of a detached house was carried out in terms of the social costs of CO
2 emissions [
20]. This building was located in the third climatic zone in Poland. Four methods of energy provision were investigated: burning coal plus supplying electricity from the grid, burning coal plus generating heat in solar collectors plus supplying electricity from the grid, burning coal plus generating electricity in photovoltaic panels and generating heat in an ASHP plus supplying electricity from the grid. The lowest CO
2 emissions were measured in the last variant with an ASHP; they were six times lower than in the first variant. The energy consumption represented 58–90% of the total CO
2 emissions from constructing and using the building.
A GSHP that used a one-stage system with an internal heat exchanger and sub-cooler filled with CO
2 as a refrigerator was the subject of a theoretical analysis in Mediterranean climatic conditions [
21]. Because the flow water temperature in a heating system is higher than the critical temperature of CO
2, the heat pump works in transcritical mode. The COP value increased from 3.371 to 4.620 as the ground temperature rose from 10 °C to 22 °C. Four parameters had the biggest impact on the COP value: the refrigerant temperature after heating a hydronic system, the number of boreholes, the ground temperature and the pressure in the evaporator.
Another method for lessening the total equivalent warming impact (TEWI) of the heat pumps are alternative refrigerants with low GWP values; such analyses were performed in Brazil, Canada, Poland and Sweden [
22]. The highest TEWI was found to be in Poland because of the large share of coal and lignite in electricity production. Possible very good replacements for R134a and R245fa are R1234ze(Z) and R1336mzz(Z), respectively; these replacements provide the biggest TEWI reduction and the highest COP value in the discharge temperature range of 50–70 °C.
The inlet and outlet temperatures of brine, external temperatures, the operation time of GSHP, and energy consumed were measured between October 2011 and September 2013 in the third climatic zone in Poland [
23]. This energy consumption in location was applied in computations of the primary energy demand in four variants. Variant A assumed electricity generation in a coal-fired power plant with an efficiency of 38%; electricity in variant B was produced by a gas–steam plant with the efficiency of 48%; the transformation and transmission efficiency in both variants was 90%. Variant C assumed heat production in a coal-fired boiler station with efficiency of 88% and heat supply with efficiency 95%. Finally, in variant D, heat was generated in a local gas boiler with efficiency 92%. The primary energy consumed was lowest in variant B, followed by A and D, and its highest consumption was in variant C.
A multivalent installation was monitored in a residential and retail building with the designed heat load of 56 kWh. This building is located in Kraków (Poland) in the third climatic zone in Poland. The installed heat pump, Vaillant geoTHERM plus VWS 104/2, had a heating capacity of 10.4 kW with COP = 4.4 for B0/W35 °C. The experimentally obtained seasonal performance factor of GSHP was between 3.49 and 3.83 in the years 2012–2017 [
24].
Drops in temperature in the ground because of GSHP operation was investigated in Świdnica (third climatic zone in Poland) for a heat pump with nominal thermal power of 17 kW and COP of 4.4 for B0/W35 °C; the ground heat exchanger consisted of five U-pipes (PE 40 × 4 mm) 78 m deep. The average temperature drop was between 0.3 and 1.1 K [
25]. Further research suggested the ground temperature was reduced by 0.76 K per year [
26]. Similar investigations were carried out in Białystok (fourth climatic zone in Poland) for a GSHP with nominal thermal power at 7.8 kW and COP of 4.7 for B5/W35 °C and a similar heat exchanger with a depth of 100 m. The average temperature drop was 1.89 °C [
27].
The impact of heat pumps on the environment is illustrated by the value of a seasonal performance factor which takes into account the amount of work transferred from an electrical grid [
8,
9]. Another environmental parameter is carbon dioxide emissions [
7,
8,
28], which was investigated in European countries using different methods, e.g., life cycle assessment [
7,
8] or TEWI [
28]; despite the different scientific approaches used, these studies yielded similar conclusions that heat pumps in Poland are not ecologically viable in terms of the Polish energy market in the 2010s [
29]. Undoubtedly, condensing natural gas boilers emit less CO
2 directly in a certain location than heat pumps emit indirectly in power stations [
7,
28].
Although the work needed to drive heat pumps decreases when a performance factor increases, it is never null due to the second law of thermodynamics. Thus, electrical energy should be produced in a non-emissive way. One such method is electricity production via photovoltaic micro-installations which cover the needs of a building instead of electricity production by burning high-emission fossil fuels. However, the solar irradiance is highest outside of the heating season, while at the peak demand for heat, solar irradiance is at its lowest.
Currently, the Polish Organization for the Development of Heat Pump Technology (PORT PC) estimates that by 2030, the share of heat pumps in single-family buildings will amount to 10% in the probable scenario and 22.8% in the optimistic scenario [
30]. These forecasts, combined with the planned changes in the power industry, will significantly reduce the emission of greenhouse gases, such as carbon dioxide, sulfur oxides and nitrogen oxides, to the atmosphere as a result of heating buildings. This activity also affects the long-term improvement of air quality in large cities during winter periods, which contributes to improvements in the health of the people living in them. In addition, such solutions are economically viable, as they are cheaper to operate than a condensing gas boiler, and at the investment stage, it is possible to obtain financial support through various types of local or central programs [
9].
The aim of this research is to determine the emissions levels of selected greenhouse gases (carbon dioxide, sulfur dioxide, nitrogen oxides and particulate matter (PM)) during winter operation, as well as the computation of the seasonal coefficient of performance (SCOP
net). This analysis is performed with much more reliable climatic conditions and generation factors regarding pollutants emission than those that have been previously used [
31]; moreover, there is more RES in the Polish energy mix; hence, differences are expected in comparison to previous estimations.
Another aim of this research is to evaluate the changes recently made to the Polish energy mix and planned in the “Energy policy of Poland until 2040” [
32].
2. Materials and Methods
The analysis covered the heat supply to a building whose total designed heat load was 46 kW, and a heating system was extended with two buffer tanks, each with a 500 L capacity, to maintain the proper performance of a heat pump. Heat from the heat pump transferred in the condenser to the hydronic heating system at a designed supply water temperature of 45 °C; the designed return water temperature was 35 °C.
The operation period was assumed to be a heating season, which was determined by the climatic zone for which the analysis was performed. One location was used from each of these 5 zones in Poland: Szczecin, Poznań, Łódź, Białystok and Zakopane; the hourly climatic temperatures were taken from a typical meteorological year (TMY) published on the EnergyPlus portal [
33]; they were the input data in computing the average annual air temperature,
ta; the last column shows the results in each location. The four most commonly applied heat pumps were analyzed: ASHP, GSHP and WSHP; the last one was equipped with a separating heat exchanger (WSHP + SHE) that is an additional unit to protecting the system against the negative effects of water groundwater;
Table 1 enumerates the selected types of heat pumps and supplemental devices;
Table 2,
Table 3 and
Table 4 present technical data of the selected heat pumps, whilst
Table 5 shows the list of the climatic zones in Poland with the analyzed locations and the values of the designed external temperature.
Below the bivalent point (cf.
Table 5), ASHPs must be switched off, so another heat generator is necessary to supply heat at lower ambient temperatures. An oil boiler was assumed as the auxiliary heat generator whose heat generation and emissions are included in the analysis. The oil boiler was selected because a customer only pays for fuel consumption, and no contracted power costs are associated; it stems from a detailed cost analysis given in [
35].
This analysis was performed on two variants related to temperature control in buffer tanks; the first variant assumed the temperature of water stored in the buffer tank was equal to the designed supply water temperature, while in the second variant, the temperature value in the buffer tanks resulted from a weather compensation. Three scenarios were analyzed: the first one was based on the current Polish energy mix presented by the national electrical energy provider PGE [
36]; the second scenario presumed an increase in RES share up to 32% in electrical energy production, which is an aim outlined in the Energy policy of Poland until 2040 [
32]; the last scenario was based on the electrical energetic mix that ensures GSHPs emit a lower amount of greenhouse gases than a condensing gas boiler.
2.1. The Low-Temperature Heat Reservoir
The analysis firstly determined the temperatures of the lower temperature source in each type of the heat pumps analyzed regardless of the climatic zones. Since outside air is a heat source for an ASHP, the temperature continuously fluctuates depending on the weather conditions, while temperature variability in other heat sources, i.e., ground or groundwater, is significantly lower.
WSHPs take heat from a groundwater basin with a constant temperature whose value, in the Polish climatic conditions, determines the Kowalski equation [
37]:
where
ta is the average annual air temperature in each climatic zone (°C),
A is a correction factor due to true altitude,
gg is a geothermal gradient (deg/m),
H is a depth of a groundwater basin level (m),
h is the depth of the shallow zone (m);
Table 6 shows the data set and the interim results for further modeling.
In case of aggressive groundwater, a separating heat exchanger, as a method of protection against the negative effects of the groundwater, is necessary; this exchanger is installed in the front of the heat pump, which results in a brine temperature drop by about 2 °C.
Ground temperature profile affects GSHP operation far greater. Further important parameters are: the type of an applied heat exchanger and its location depth, the depth of soil freezing and the geological structure, which is particularly important when a vertical exchanger is supposed to be installed. In the conduction of analysis, vertical closed loops with depths of 100 m were applied as heat exchangers. To determine the temperature profile in each climatic zone, the Baggs formula, adapted to the conditions of the northern hemisphere by Olesiewicz-Popiel et al. [
41], was applied:
where
τ is a day number in the year,
z is the depth (m), Δ
tm is a difference between ground temperature below the shallow zone and average annual air temperature (deg),
kv is a vegetation coefficient,
As is the amplitude of annual air temperature in every climatic zone (deg),
a is the soil thermal diffusivity (m
2/s),
τo is the phase of the air temperature wave (d) and
ta is the average annual air temperature in each climatic zone (°C);
Table 7 shows the values substituted into Equation (3).
Formula (2) is integrated with respect to the depth,
z, and divided by the heat exchanger length
zmax = 100 m to obtain the mean temperature in the ground for each hour of the heating season:
The brine temperature is lower by 5 °C than the temperature obtained from Equation (3); this difference results from a use experience in the location.
2.2. The Heating Curve and Bivalent Point
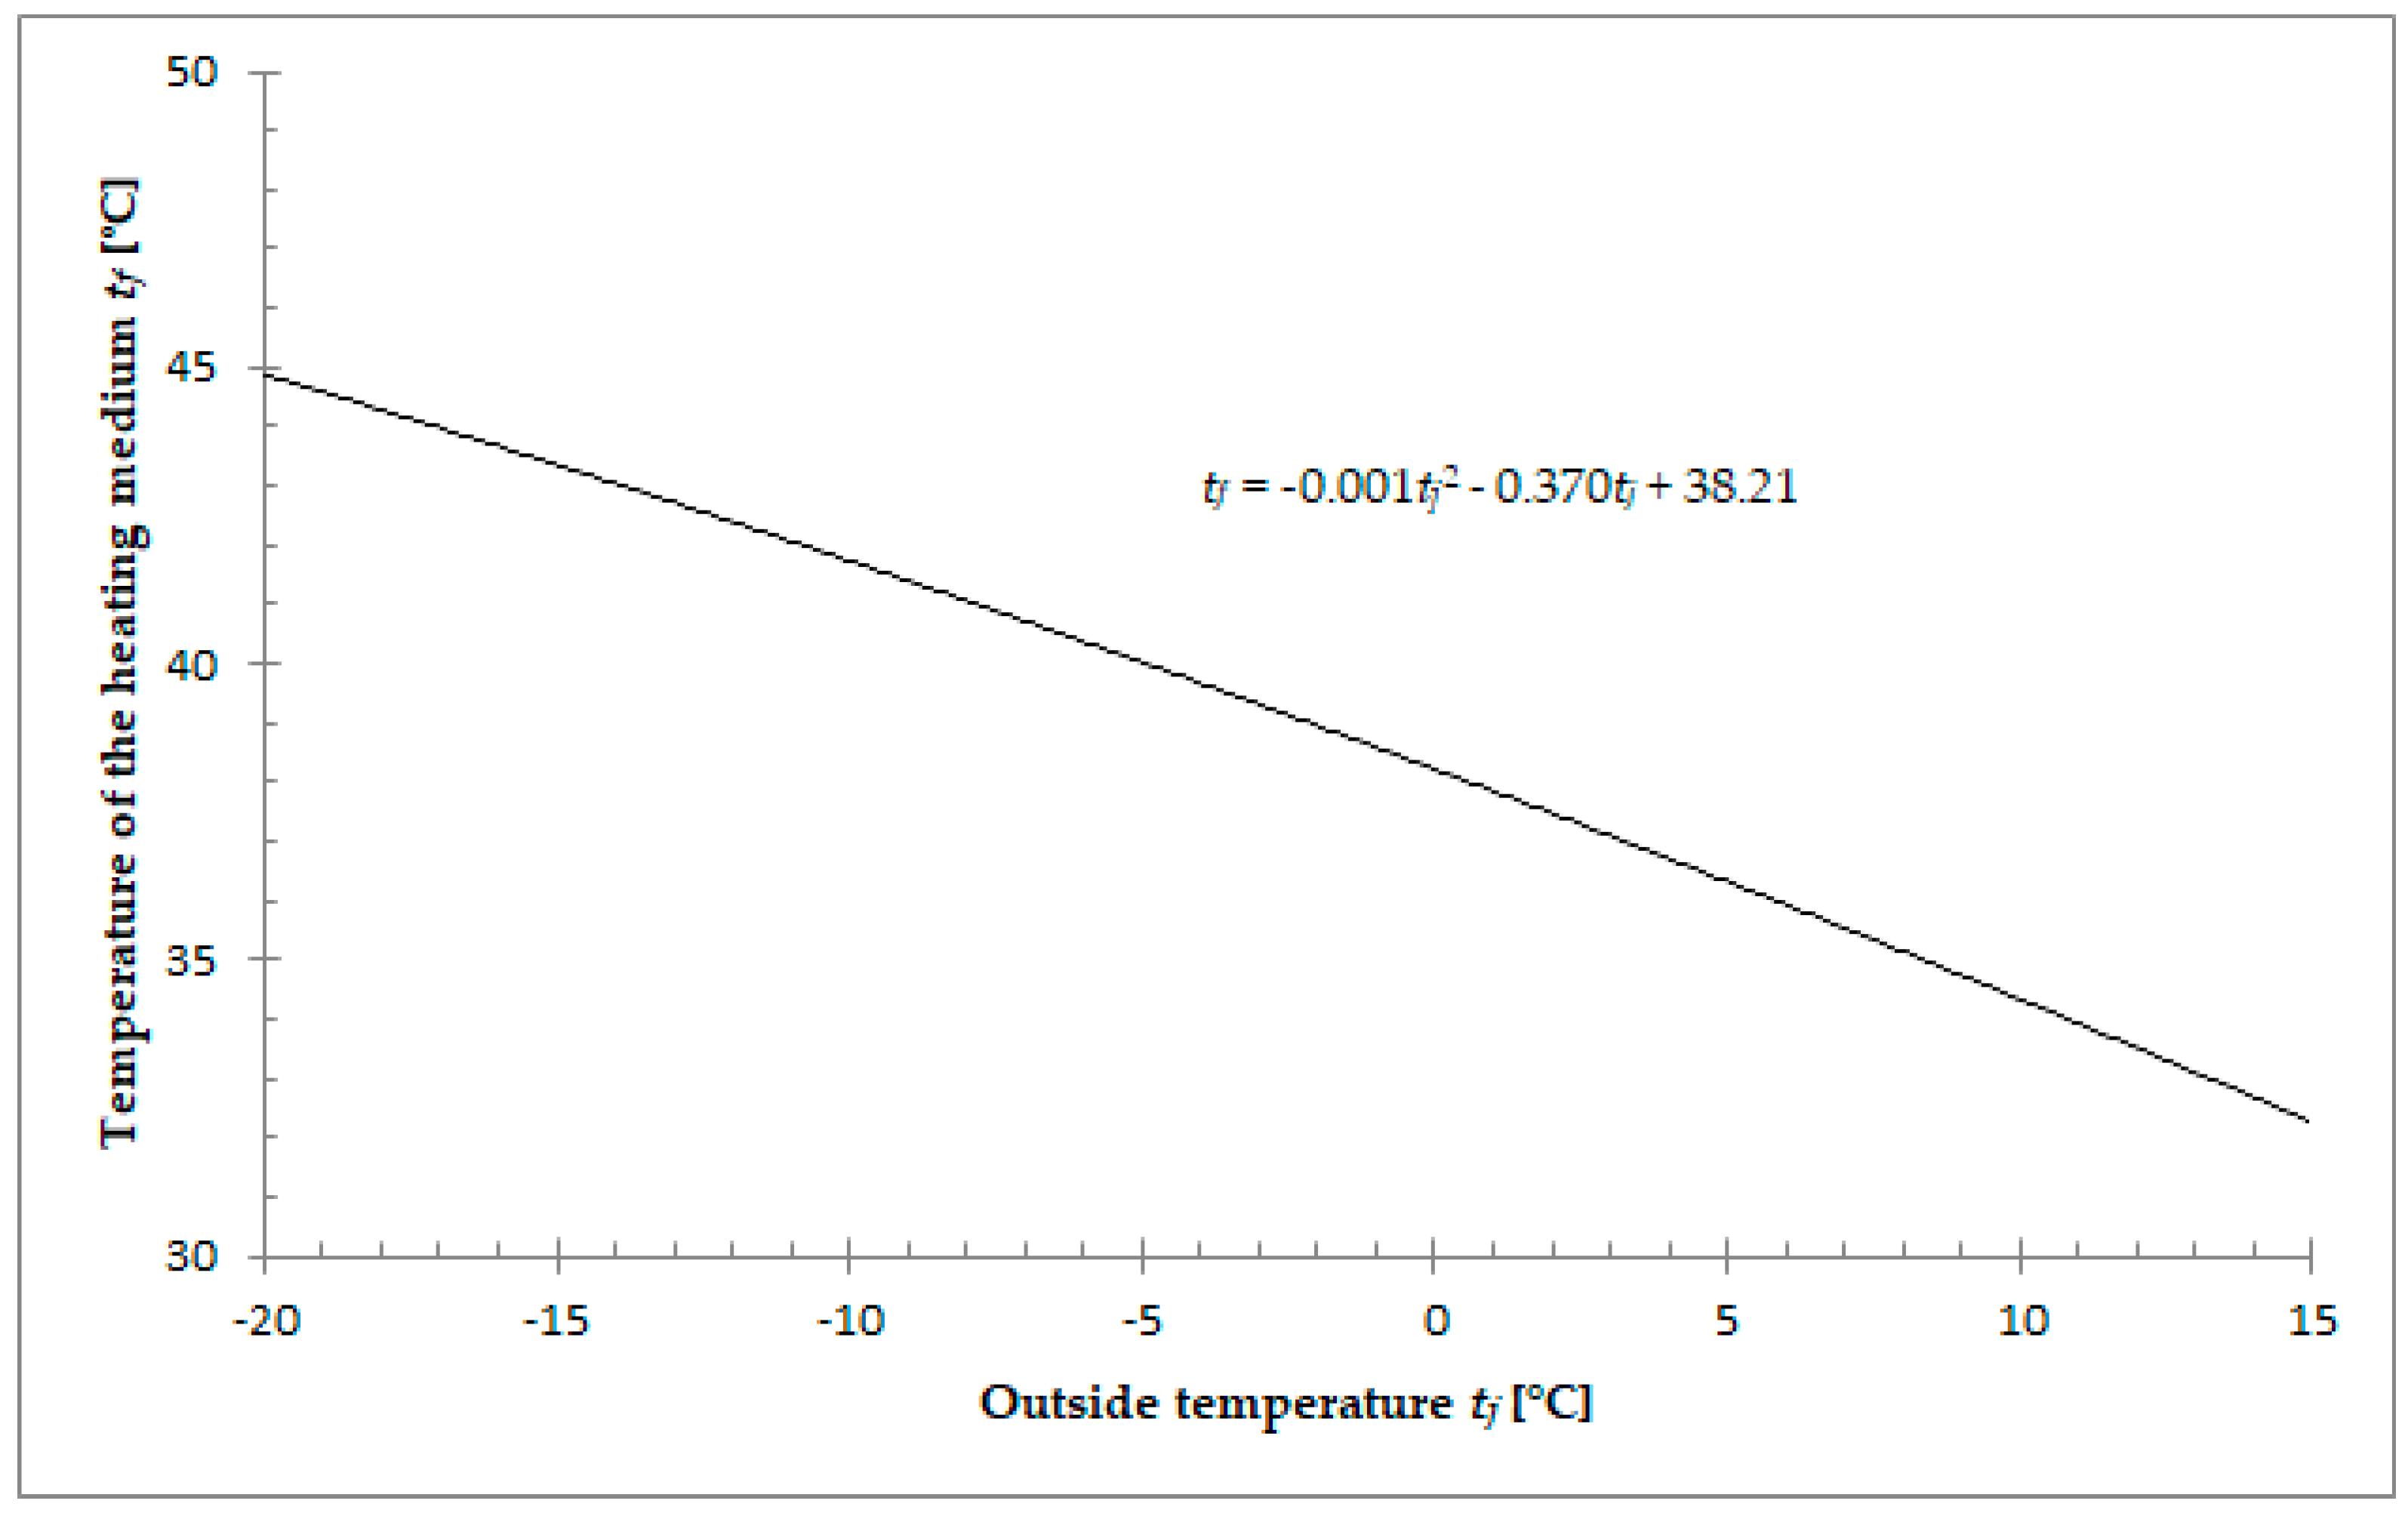
Since weather conditions, particularly temperature, change the heat losses from a building, heating systems can supply heat at varying temperatures to meet the comfort requirements. This temperature is derived from a heating curve whose other inputs are the individual characteristics of a building, internal designed temperature, heat generator and its switch-off temperature. The last parameter is of particular importance for hybrid systems due to necessity of proper communication between two different heat sources; the temperature at which one heat generator switches off, simultaneously switching on an alternative heat generator, is called the bivalent point.
The heating curve was taken from the manufacturer guideline book [
42] for the designed range of temperature and an assumption that heat losses at 15 °C are covered by internal heat gains; it is plotted in
Figure 1.
Since ASHPs take heat from outside air, opposing consequences ensue. As the outside temperature drops, less heat may be taken and in contrast, the heat losses go up. As heat sources supply less heat and heat demands simultaneously rise, more work must be done, which causes the COP value to decrease. An ASHP may work down to the temperature at which the energy conversion in it is viable; then, the oil boiler should come on. The bivalent point was determined in each climatic zone based on the manufacturer guidelines [
42]; heating power distribution between two built-in compressors, the maximum heating system supply temperature, the heating system switch-off temperature and designed heat demand for space heating purposes were all taken into account.
2.3. Seasonal Coefficient of Performance
In order to determine the SCOP
net value, the value of the partial heat demand must be previously determined. For this purpose, the formula presented in the PN-EN 14825:2019-03 standard was used [
43]:
where
Φi is the total designed heat load obtained using an algorithm from the standard PN-EN 12831-1:2017-08 [
10],
ti is the internal designed temperature that equals 20 °C,
tj is the external air temperature and
te is the external designed temperature.
Since every heat pump must be provided with a buffer tank with a capacity
V = 1000 dm
3, the heat losses of the tank are included into the analysis. The efficiency of thermal energy storage
ηt = 98%. The designed temperature in the heat pump room is 20 °C. A heat pump switches on if the buffer tank temperature lowers by 4 °C below the heating curve temperature. The buffer tank heat losses are calculated from the formula:
where:
hj−1—specific enthalpy of water in the buffer tank in the previous hour (kJ/kg),
h (20 °C)—specific enthalpy of water in the buffer tank at the room temperature (kJ/kg),
ρj−1—water density at the temperature in the previous hour (kg/m3).
Next, the temperature in the buffer tank was determined in the given hour:
where:
tt j−1—water temperature in the buffer tank in the previous hour (°C),
cp—water specific heat (kJ/(kg·deg)).
The standard [
43] also specifies the formula for SCOP
net computation:
where
hj is number of bin hours occurring at external temperature
tj in the heating season,
COPbin (tj) is the COP value of the unit at external temperature
tj and
j is a number of a temperature value (the temperature values are sorted in ascending order). Because 29th February occurs once per four years, the
hj on this day was divided by four.
To evaluate the energetic viability of a heat pump in a heating season, a minimal value of SCOP was obtained from formula
where
Si is the share of fuel in domestic energy production,
ηi is the efficiency of the production and
ηt is the efficiency of the low voltage electricity supply;
= 106% is an energy performance factor of a condensing natural gas boiler;
ηt = 79.2% is taken from [
44]; other data are presented in
Table 8.
2.4. Greenhouse Gases and Particulate Matter Emissions
If a non-emission heat generator is driven by electricity, the emissions occur indirectly as a result of fossil fuel combustion during the production of this electricity. An amount of these emissions is inversely related to the share of non-emission power stations (e.g., solar, wind, or nuclear power plants). In the case of a bivalent system, apart from the indirect emissions due to ASHP work, the direct emissions, β
oil, caused by the operation of the oil boiler must also be computed; the algorithm checked whether the heat pump works at or beyond bivalent temperature, if yes
ε = 1, if not
ε = 0; for other heat pumps
ε = 1 in all the heating season; the emissions were computed from the formula [
28]:
where β
ag is an aggregate greenhouse gas generation factor which accounts for direct and indirect emissions amid electrical energy production and shares of the fuels in it (presented in
Table 5);
= 86.9% is the efficiency of the bivalent heat generator.
Since
COPbin is not the same function of the temperature for each heat pump, to compare the generation factors between the heat pumps and a condensing gas boiler, a comparative generation factor, β
c, was computed as follows:
Since some levels of indirect emissions, even in the second scenario, were higher than emissions from the condensing gas boiler, further modification in the Polish energy sector is necessary, yet the larger contribution of RES in Polish energy mix is not assumed in the policy [
32]. Thus, this sector should be modified in an alternative way, so the authors propose the replacement of coal-based steam generators with natural gas-fired gas turbines, which is the third scenario; the proposed shares of the fuels are presented in
Table 9.
3. Results
SCOP
net outcomes achieved from Equation (7) for every calculation variant are presented in
Table 10. SCOP
min values calculated from Equation (8) are equal to 3.36, 2.46, and 2.32 for the first, second, and third scenario, respectively. The ground temperature dropped by 1.89 °C because of the thermal energy use (cf. [
27]), which caused lower SCOP
net values, which are shown in the column entitled “GSHP (dropped temp.)”; this lowering was by about 5%.
Table 10 shows that the least efficient ASHPs did not reach the required SCOP
min value in the first scenario under control to a constant temperature in the buffer tank; in other cases, the heat pumps were energetically viable. Though Łódź is located in the third climatic zone, the SCOP
net of ASHP and GSHP were higher than in Poznań, which is in the warmer second zone; this was caused by the higher temperatures of TMY in Łódź than in Poznań, which resulted from long-term measurements, as shown in in
Table 5. Taking weather data from TMY means that other results may not be presented in either ascending or descending order with regard to the climatic zones.
WSHPs are highly efficient heat pumps with the highest SCOPnet values in each zone; they maintains their superiority even with additional SHE in some cases, which is directly related to the heat source temperature. In the case of GSHPs, wherein vertical heat exchangers are used which transfer heat from the ground, the temperature changes caused by the weather conditions were delayed and depended on the time of year. Meanwhile, WSHPs are supplied with heat from deep groundwater basins where the temperature is almost constant and slightly higher than the mean ground temperature because of the lack of a shallow zone impact on the resultant temperature.
SCOP
net fell in relation to average outside temperature for ASHPs and GSHPs, while the SCOP
net of WSHPs and WSHP + SHE changed little, but in the coldest V zone, it even considerably increased. The outside temperature affected heat pump performance in two ways: heat source and heat sink temperature values; although its effect on the heat sink temperature was cushioned by the heating curve, it yielded different supply temperature variations in every town. The impact of weather conditions on heat source operation was much more diversified; they affected ASHPs directly, as the outside air is a heat reservoir in this case; their impact on ground temperature was deadened by the thermal resistance of the ground, but below the shallow zone, the temperature was constant and only depended on the mean yearly outside temperature and a cover of the ground; the influence on the groundwater basin temperature was assumed to be constant throughout year. The growing depth of the ground heat exchanger and the groundwater basin increased the temperature and SCOP
net; hence,
Table 10 Shows a considerable increase in SCOP
net value for WSHPs in the coldest V zone, where the groundwater basin is very deep (cf.
Table 3).
Regardless of the considered heat source, the SCOPnet value was lower for the installations that operated at a constant temperature value in the buffer in comparison to those controlled along the heating curve, which is due to the temperature in the condenser. In the first case, this temperature was maintained at the designed value throughout the entire period of operation in the heating season, i.e., the maximum operating value, so pressure on the discharge side was also maximal and the compressor consumed the most work. In the second case, the compressor power modulated depending on the current heat demand resulting from the weather conditions. Since the outside temperatures were usually higher than the designed outside temperature, the weather compensator adjusted lower supply temperature, so the compressor worked up to the lower pressure, which translated into lower power consumption.
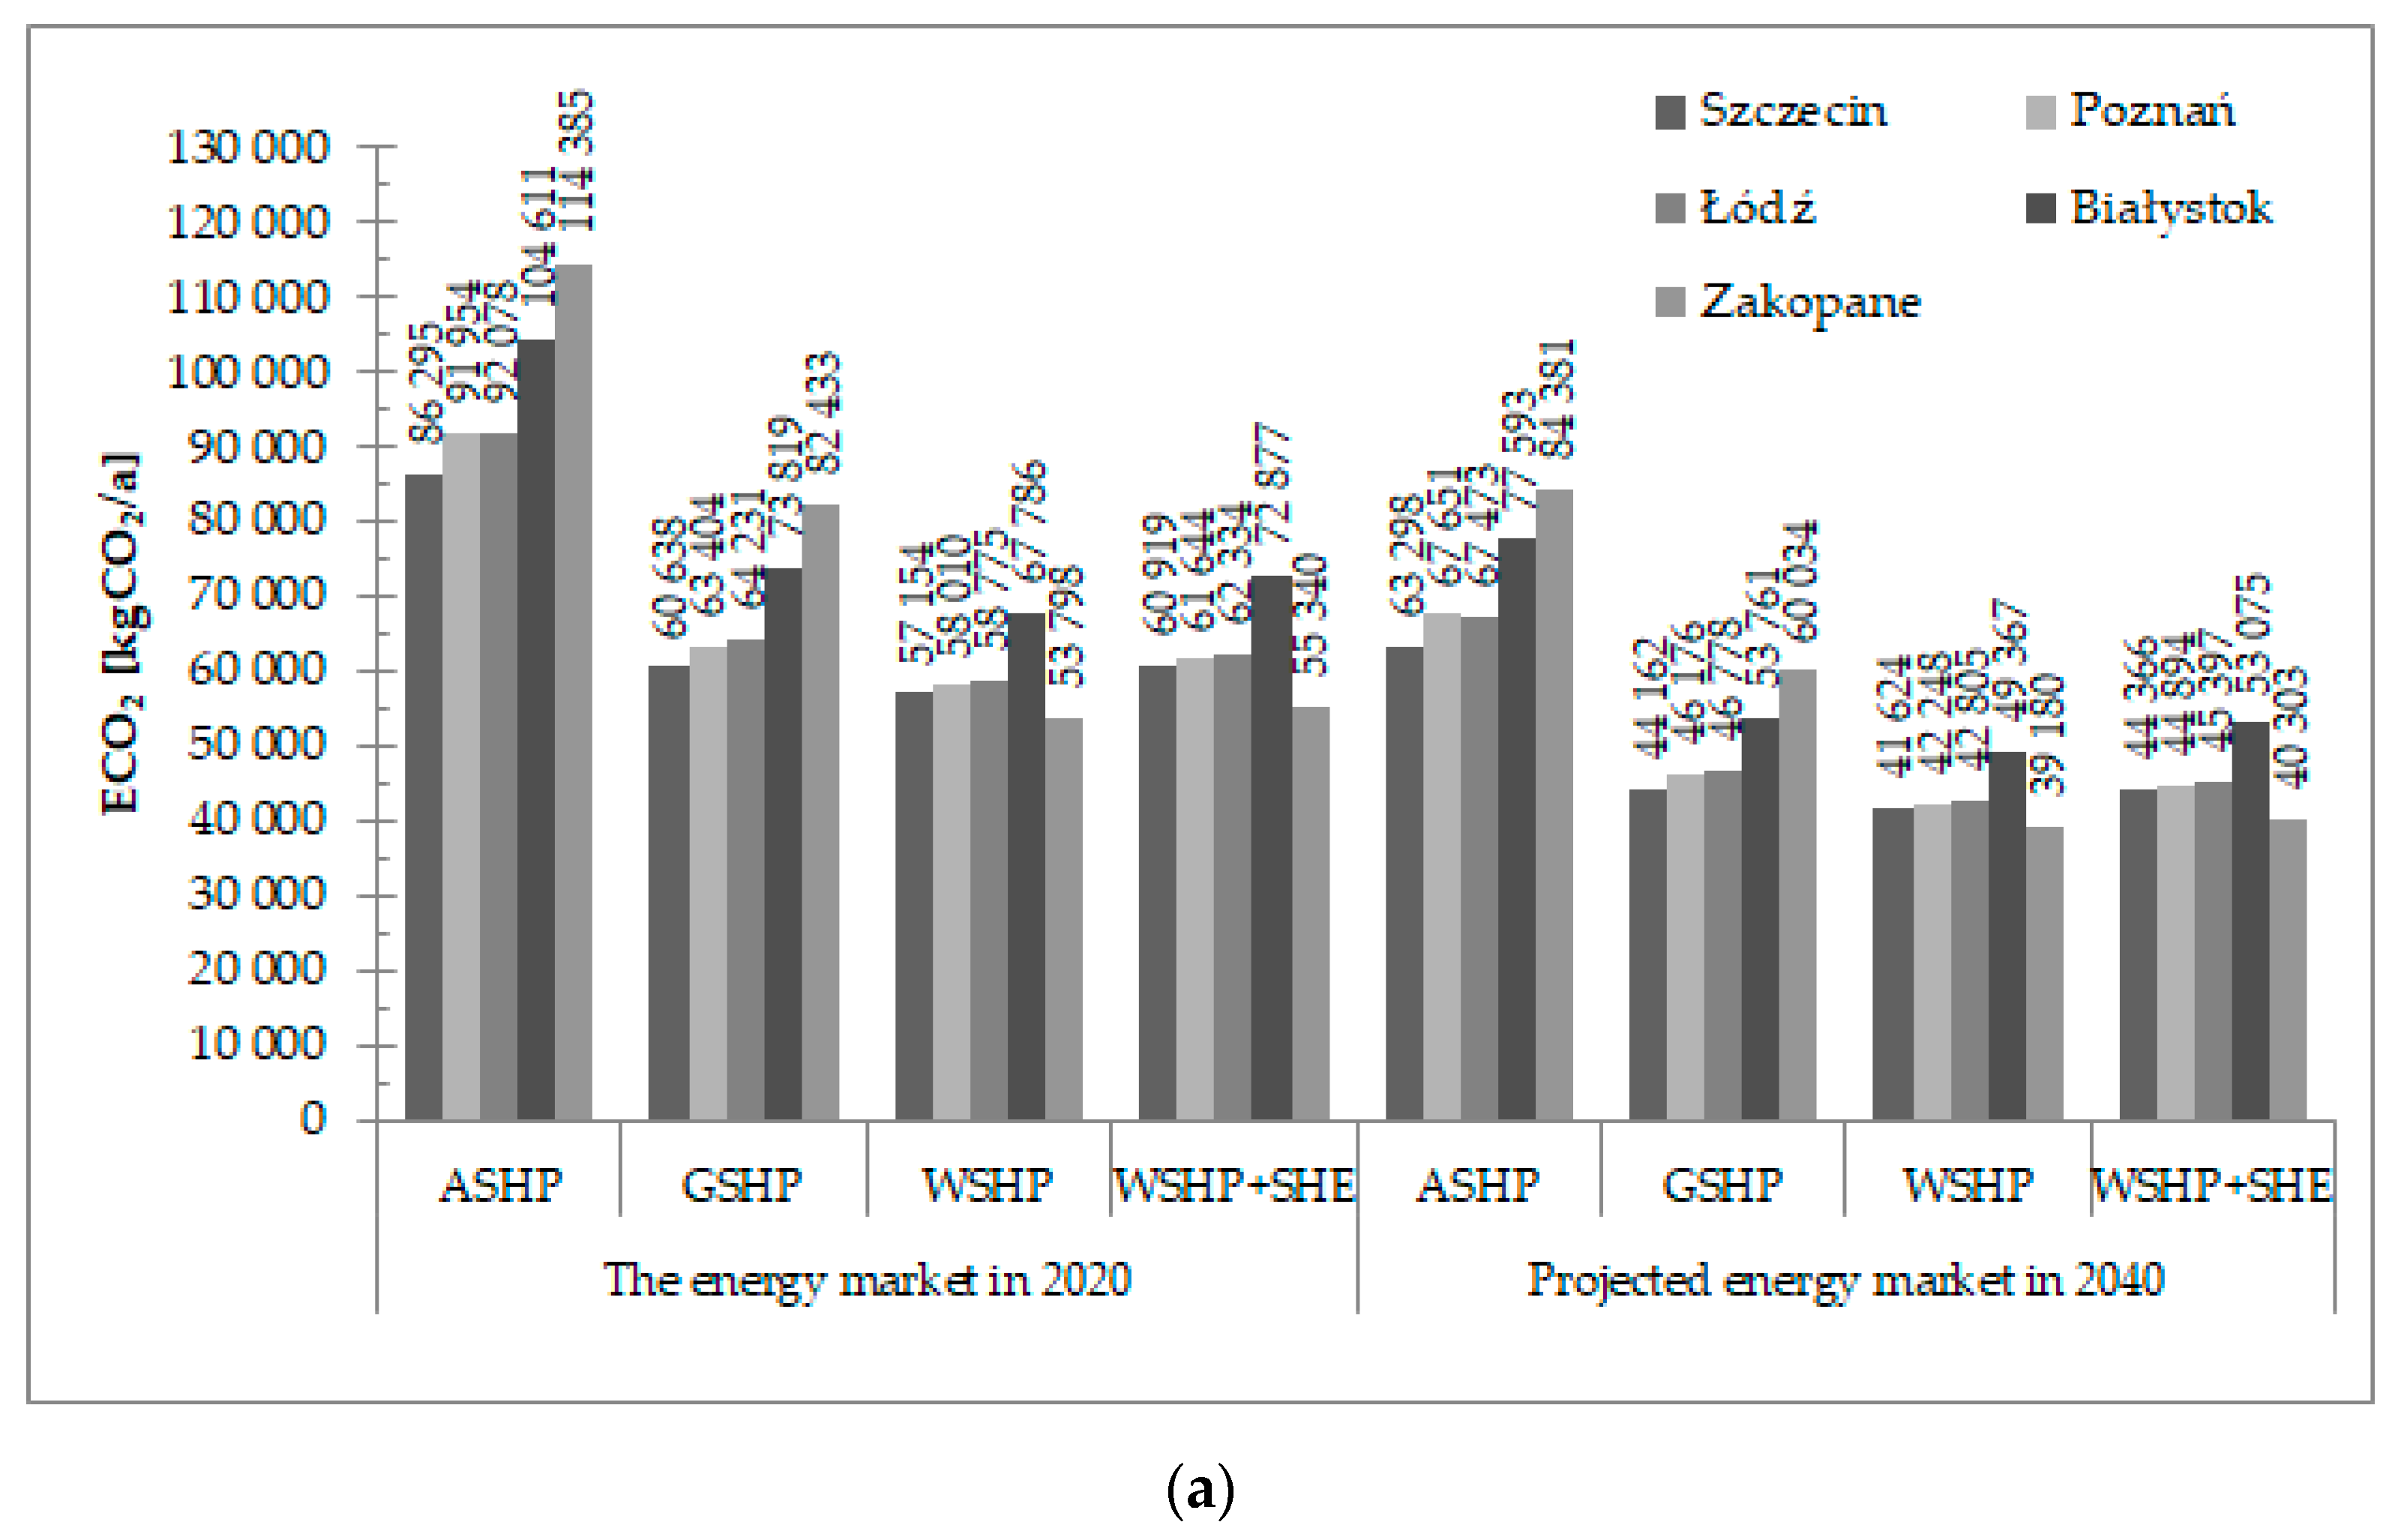
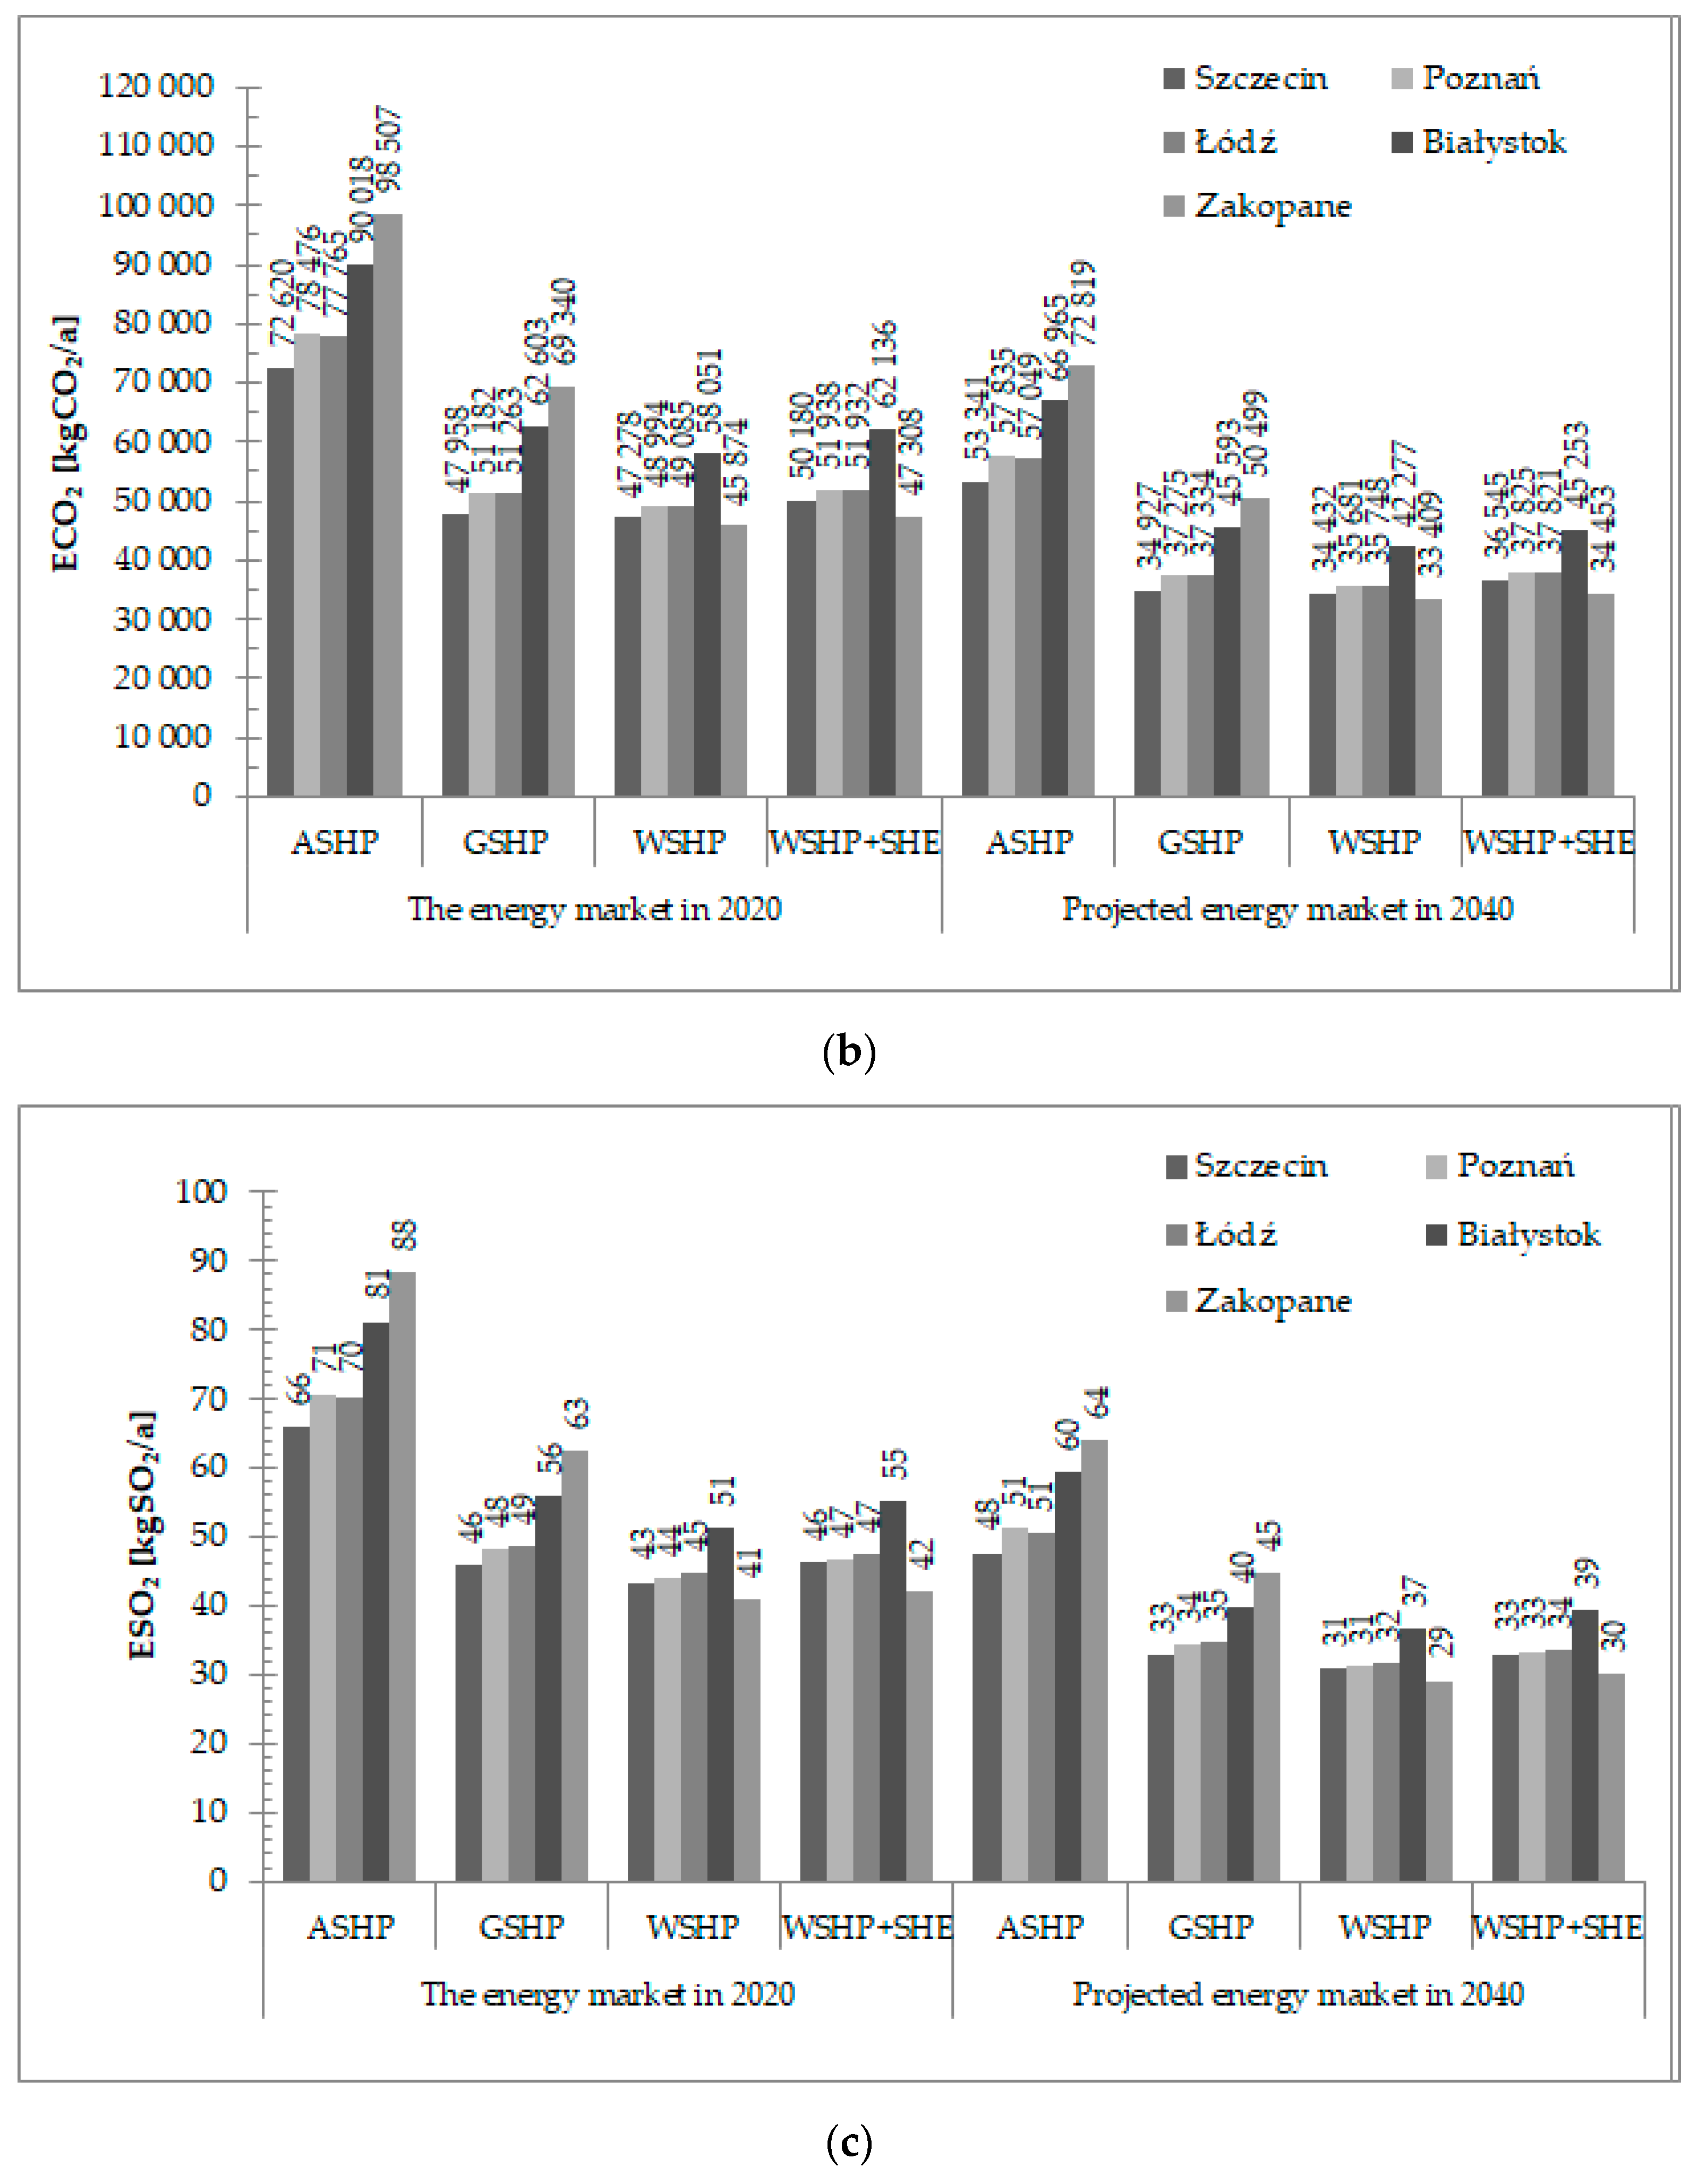
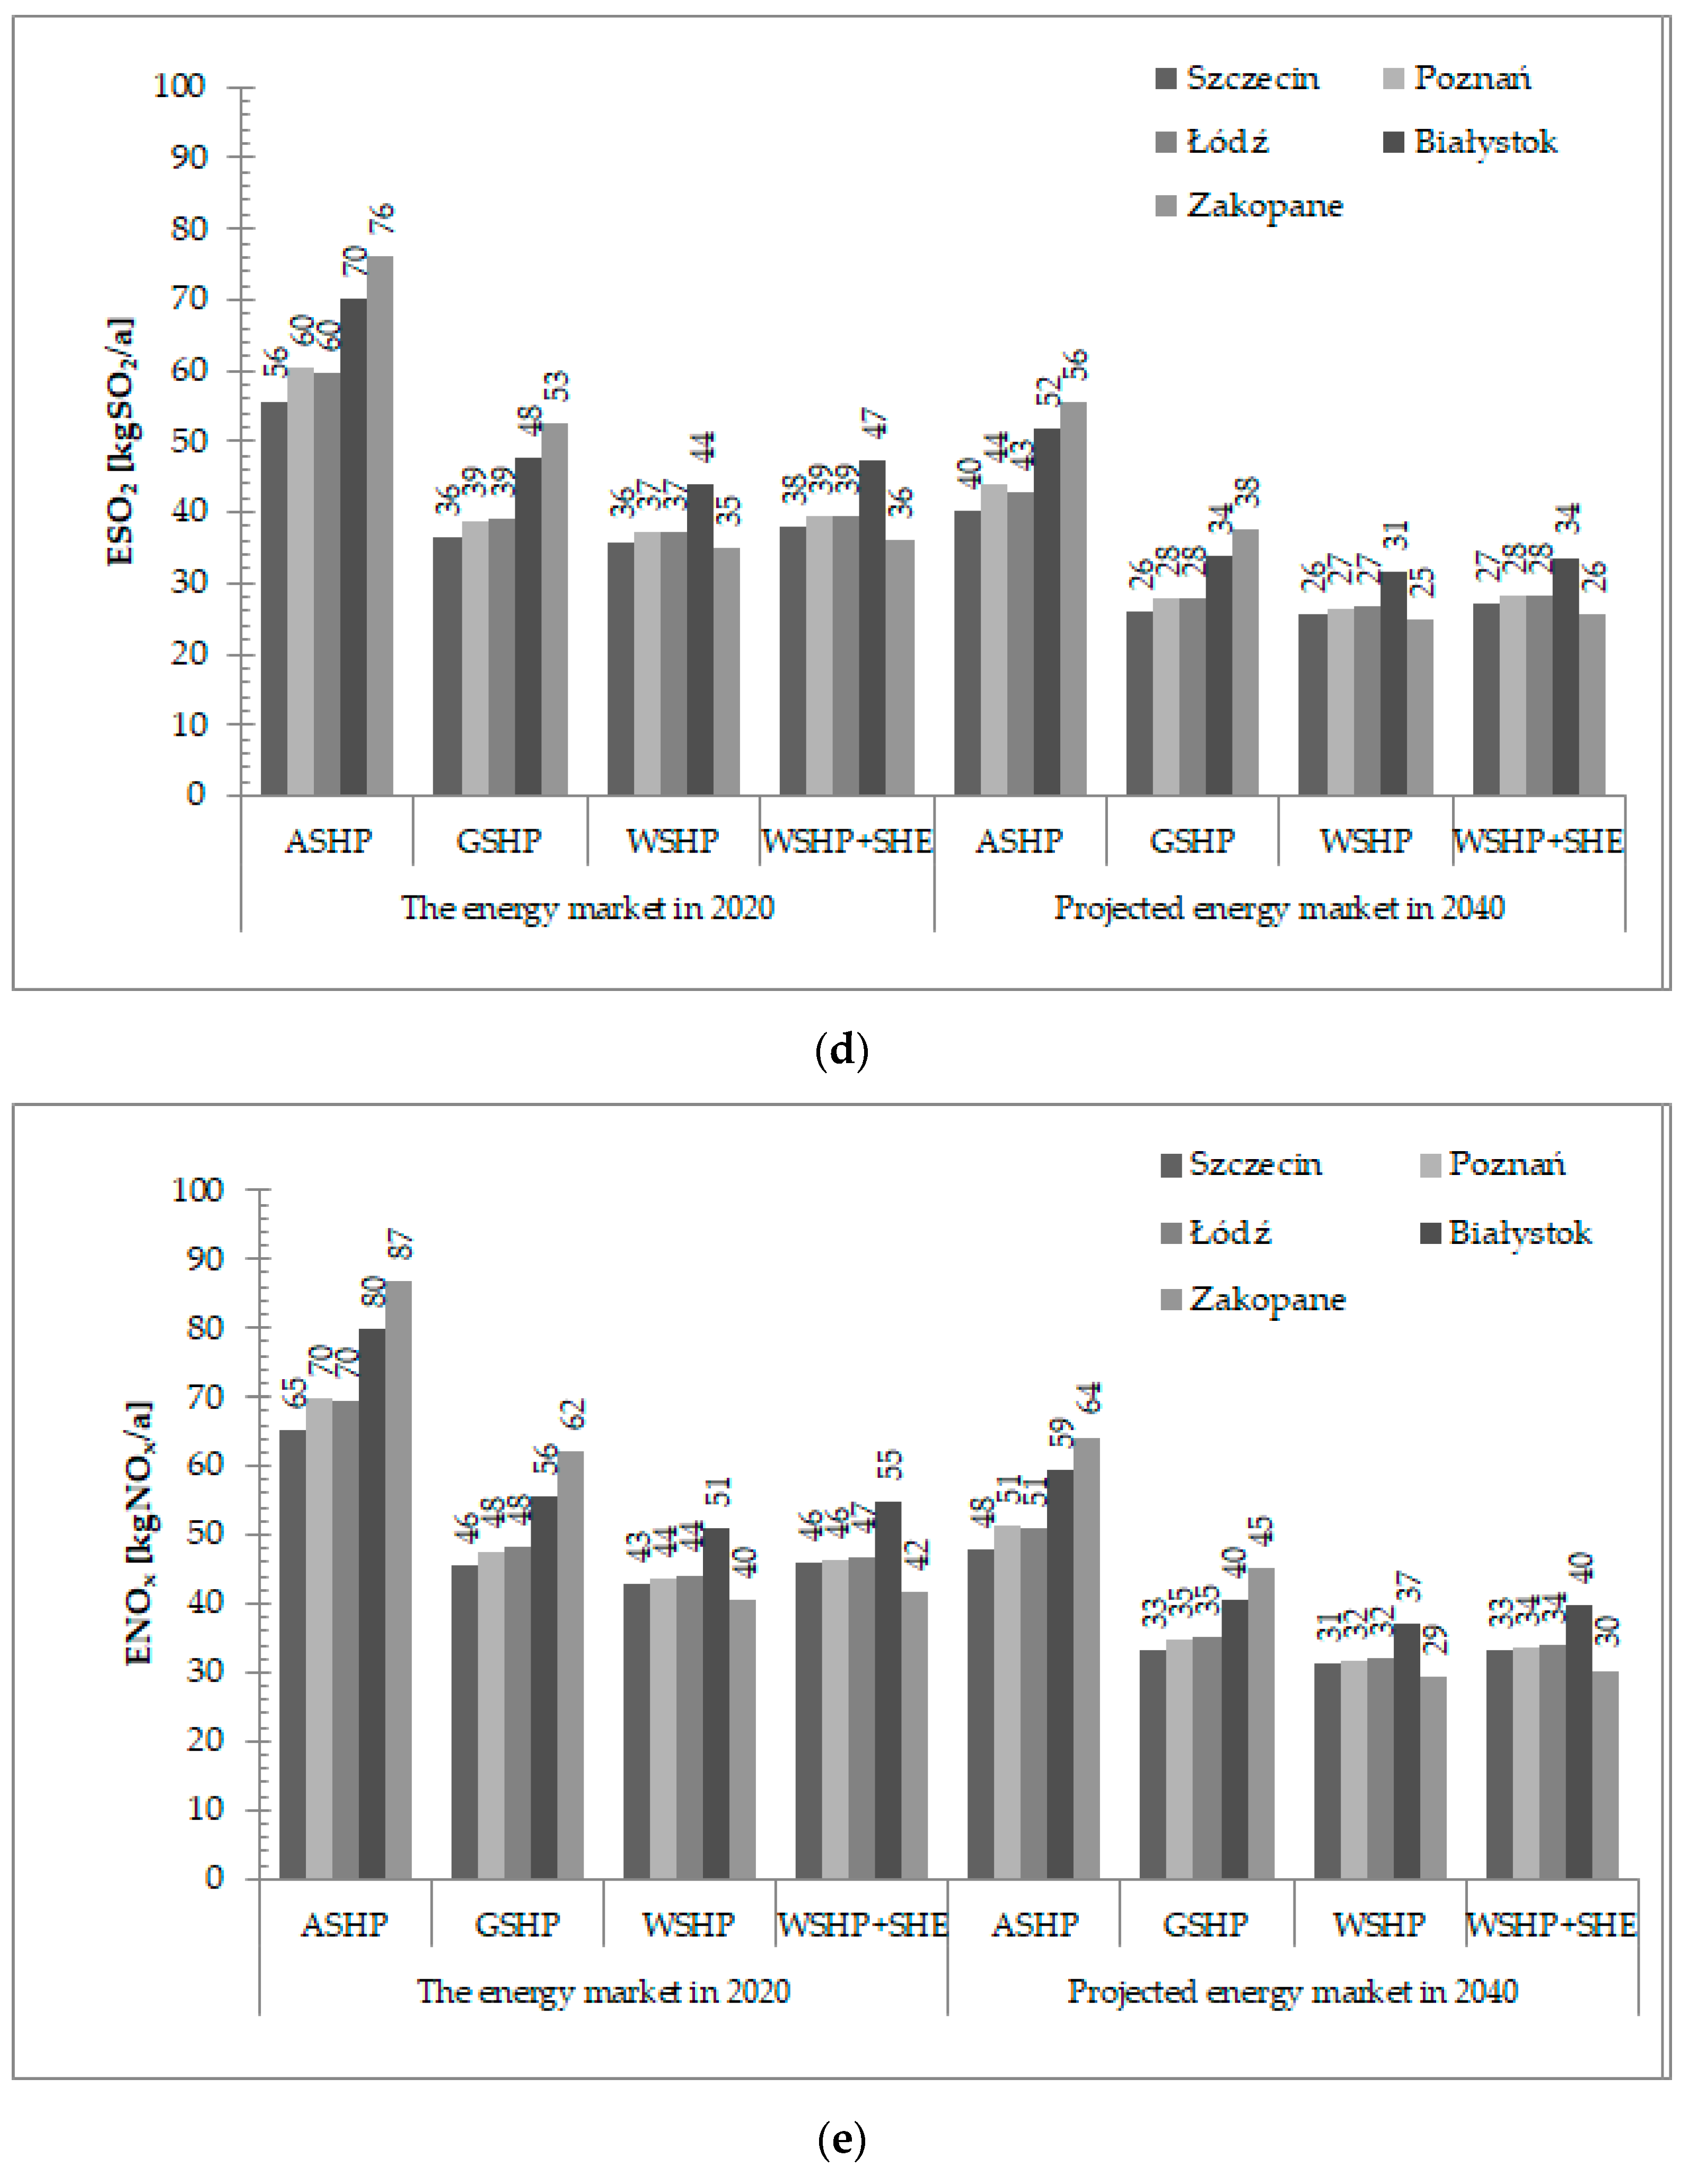
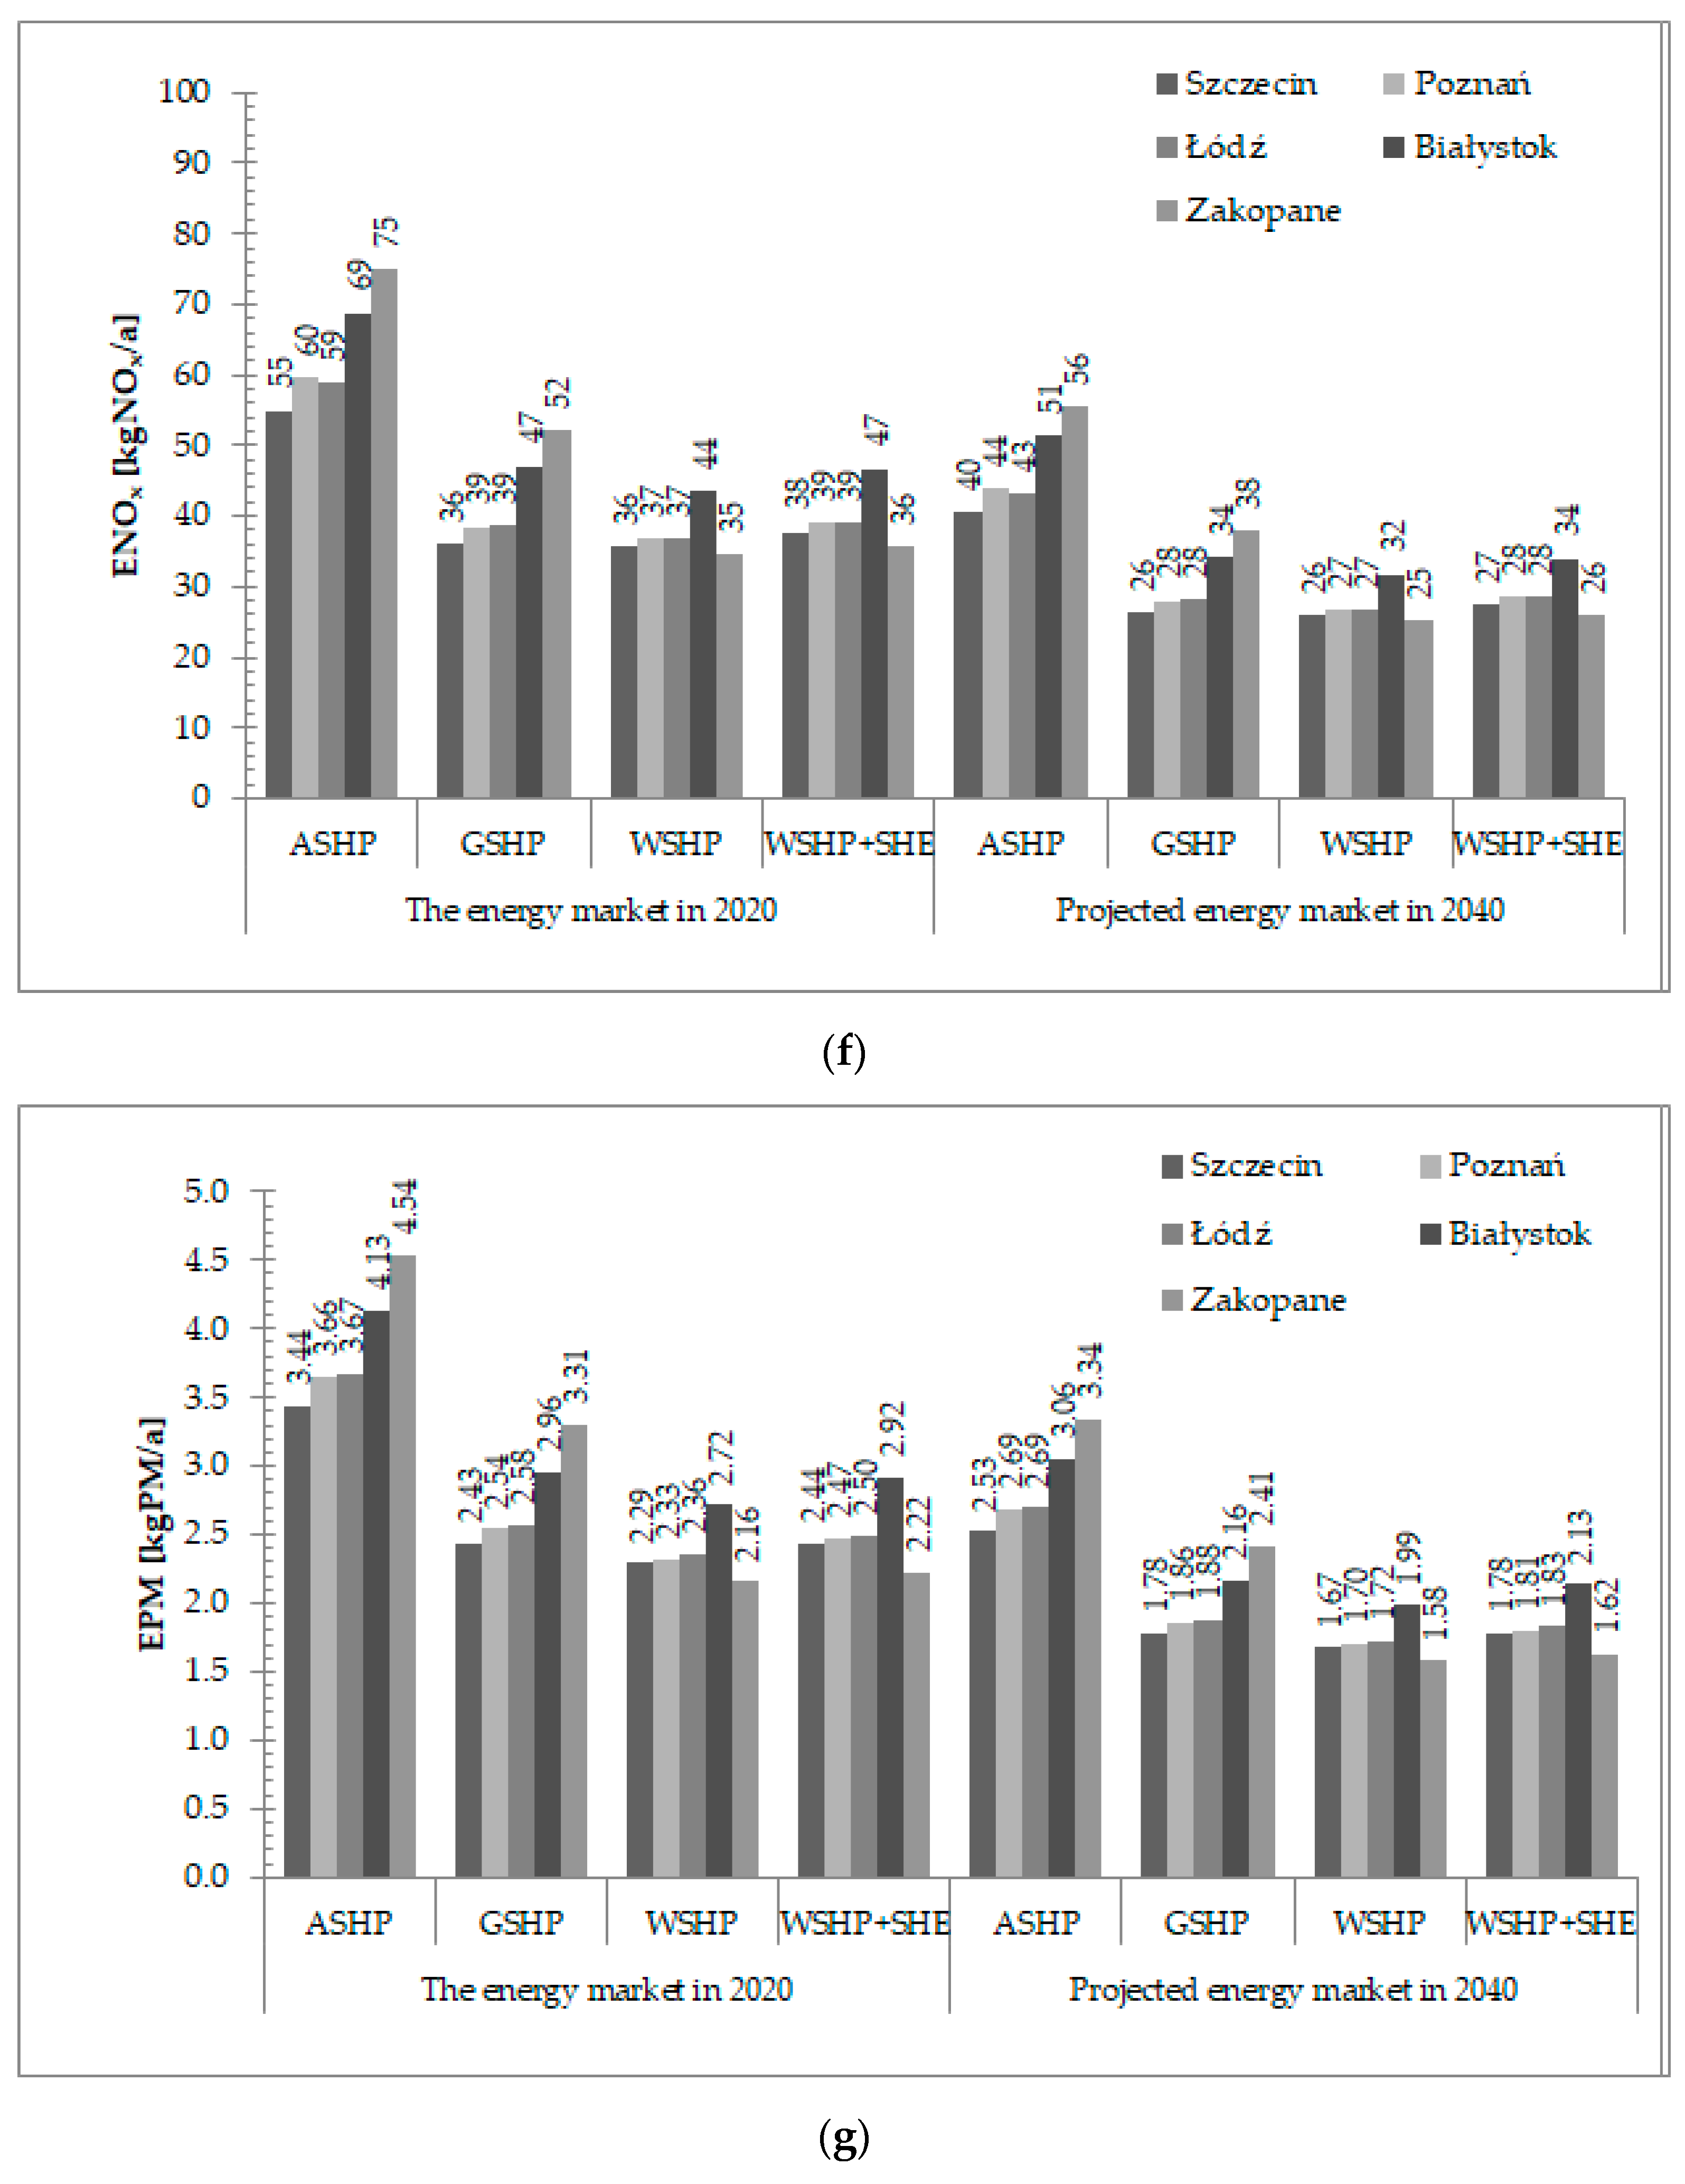
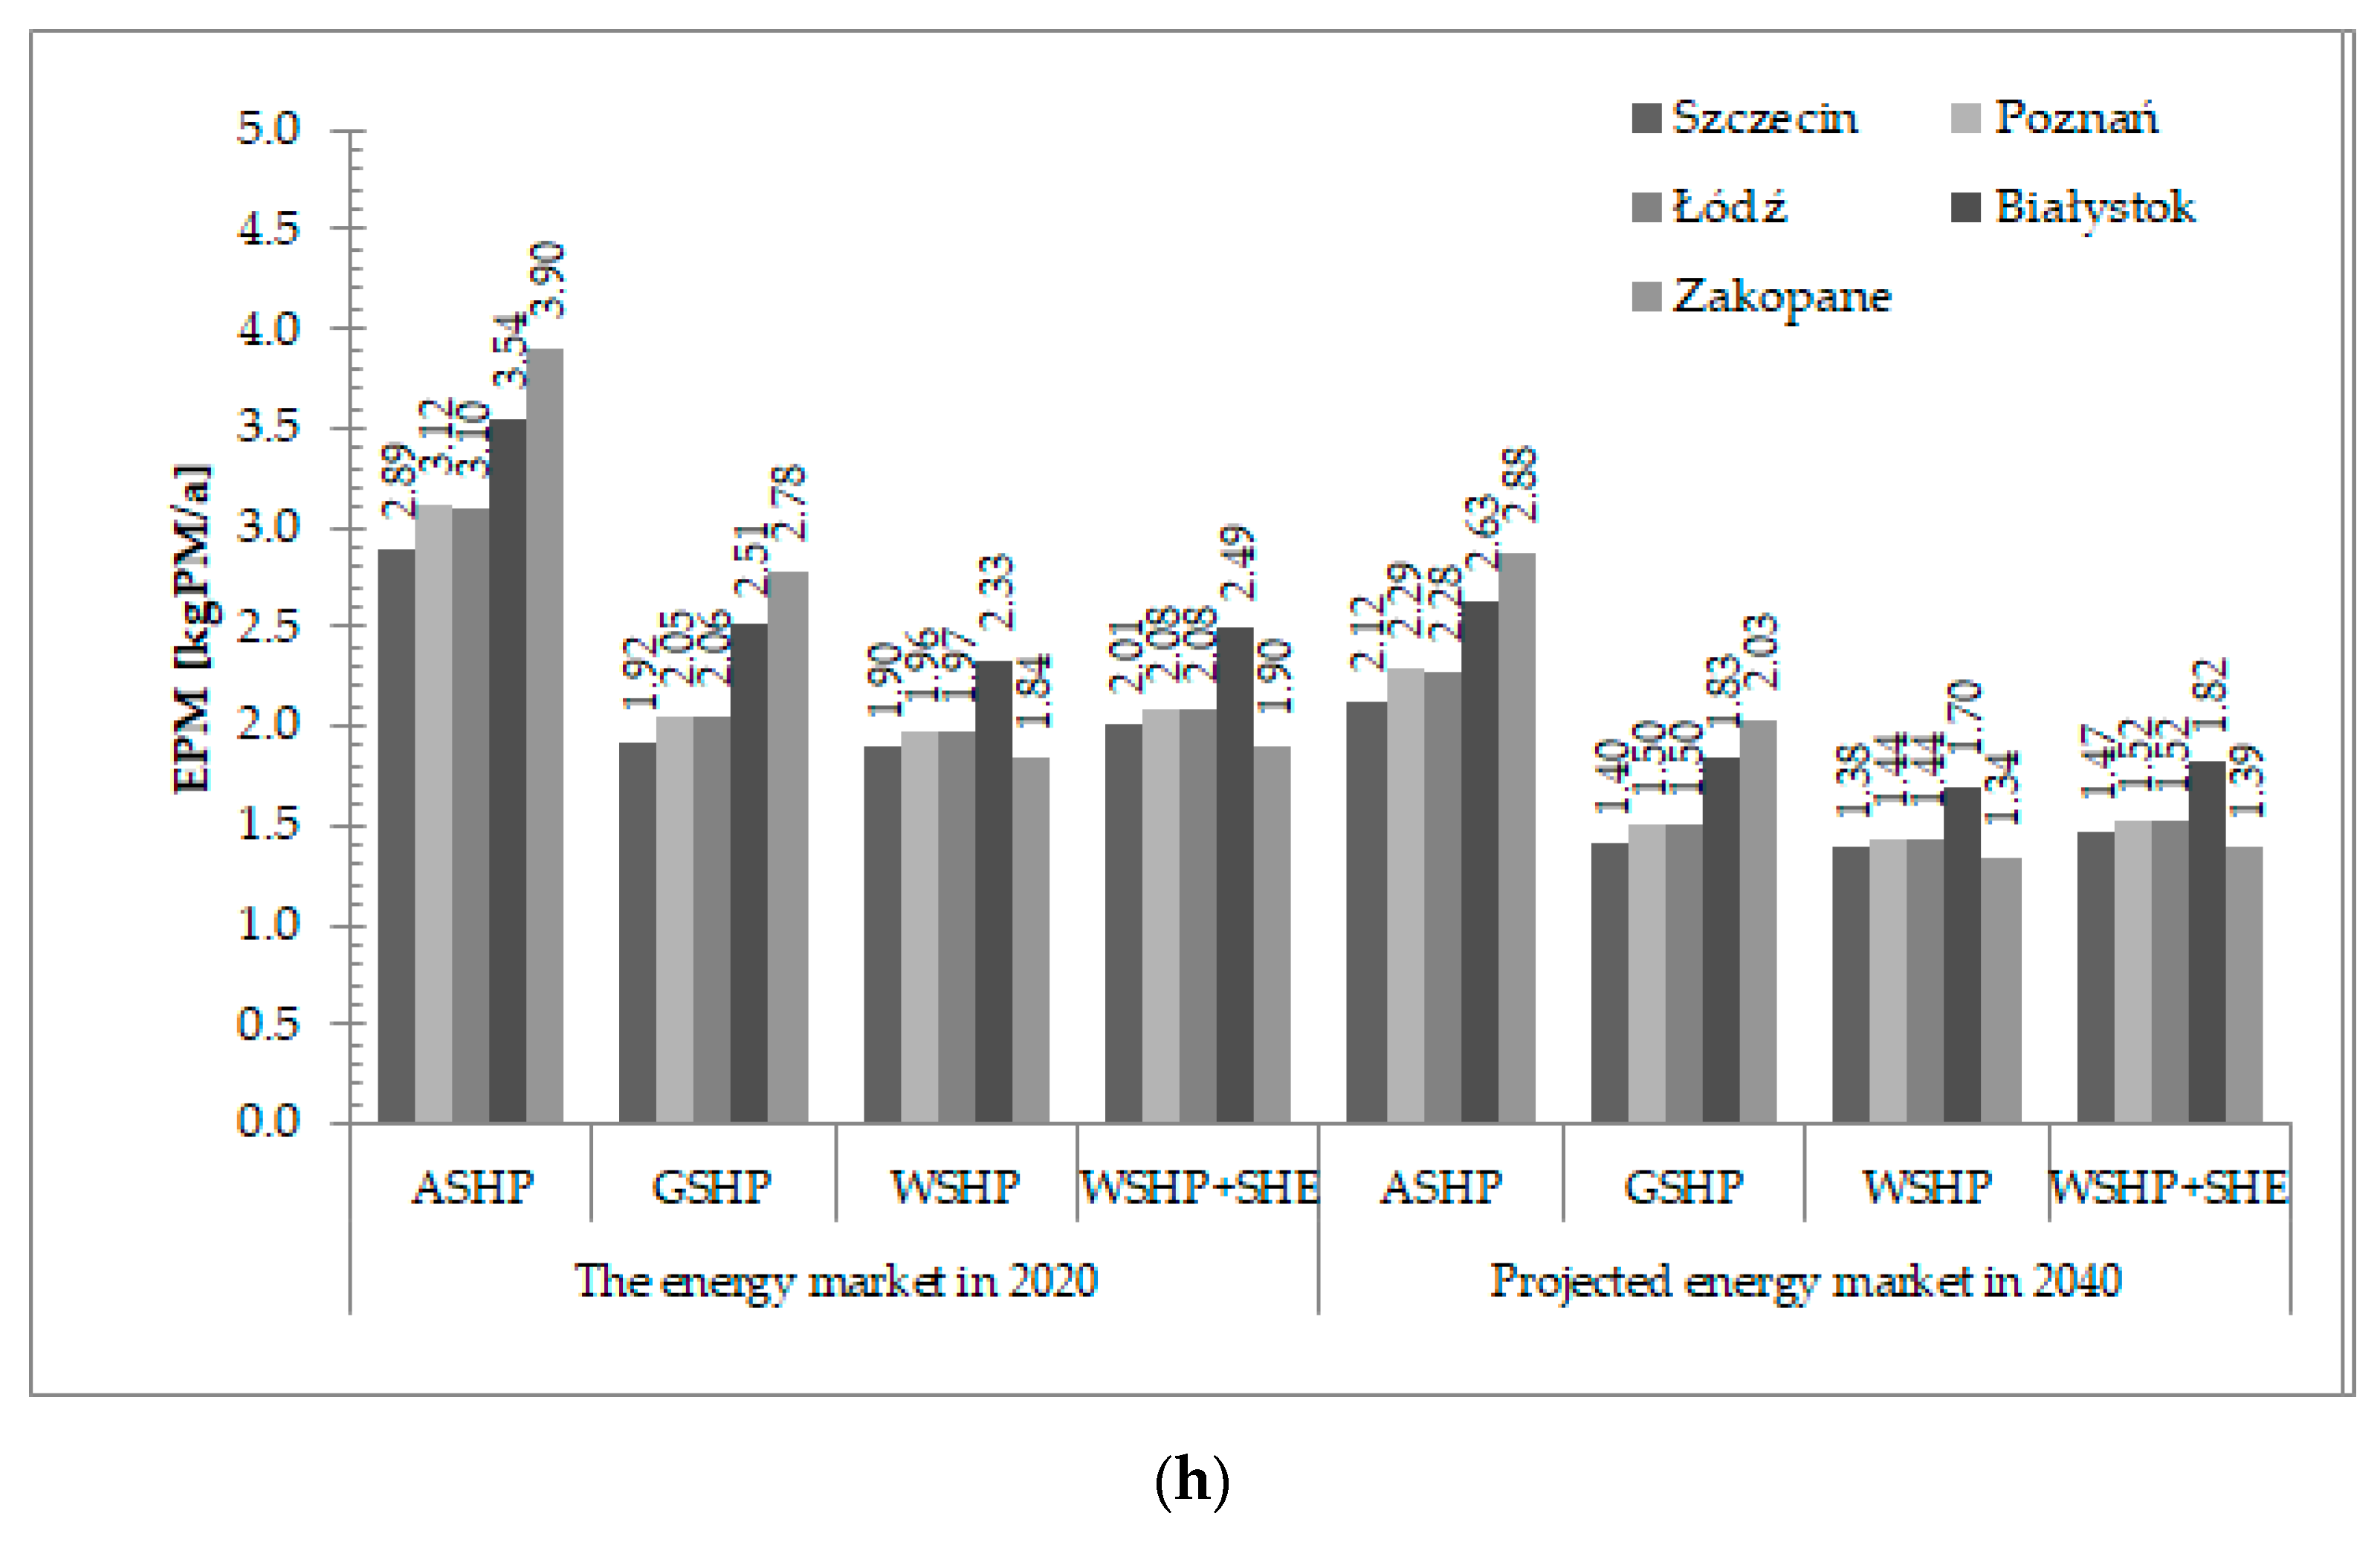
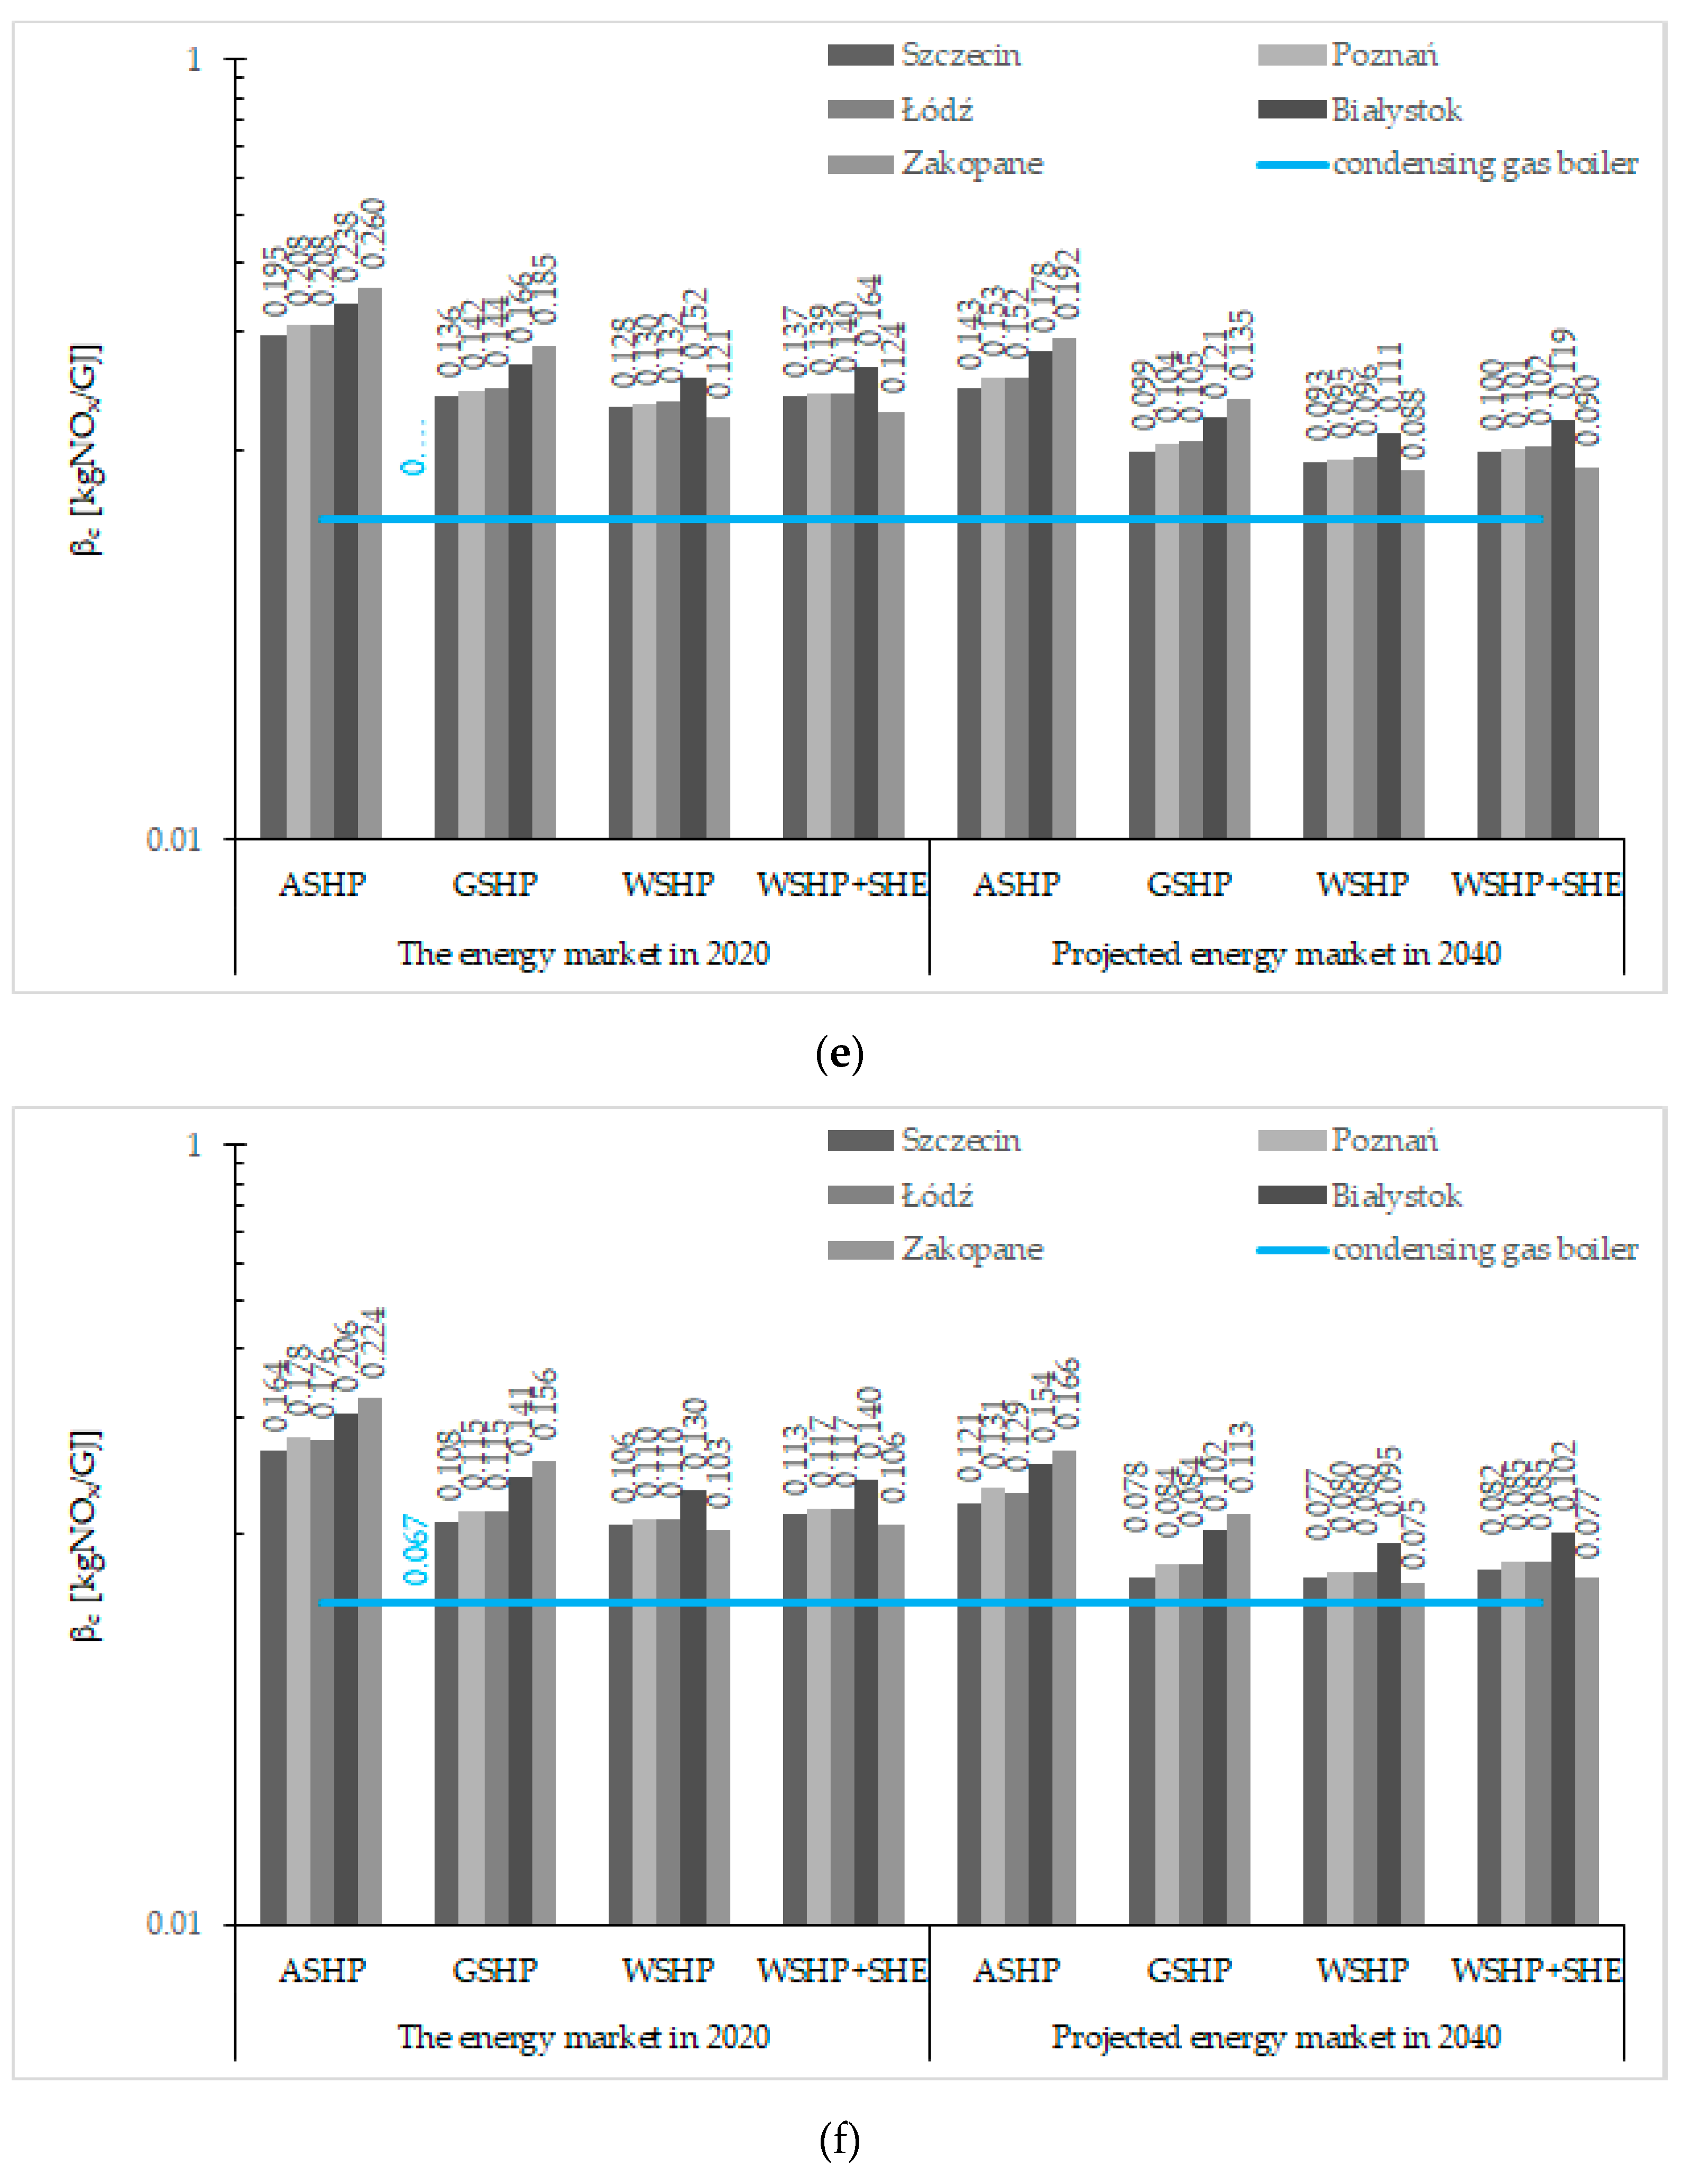
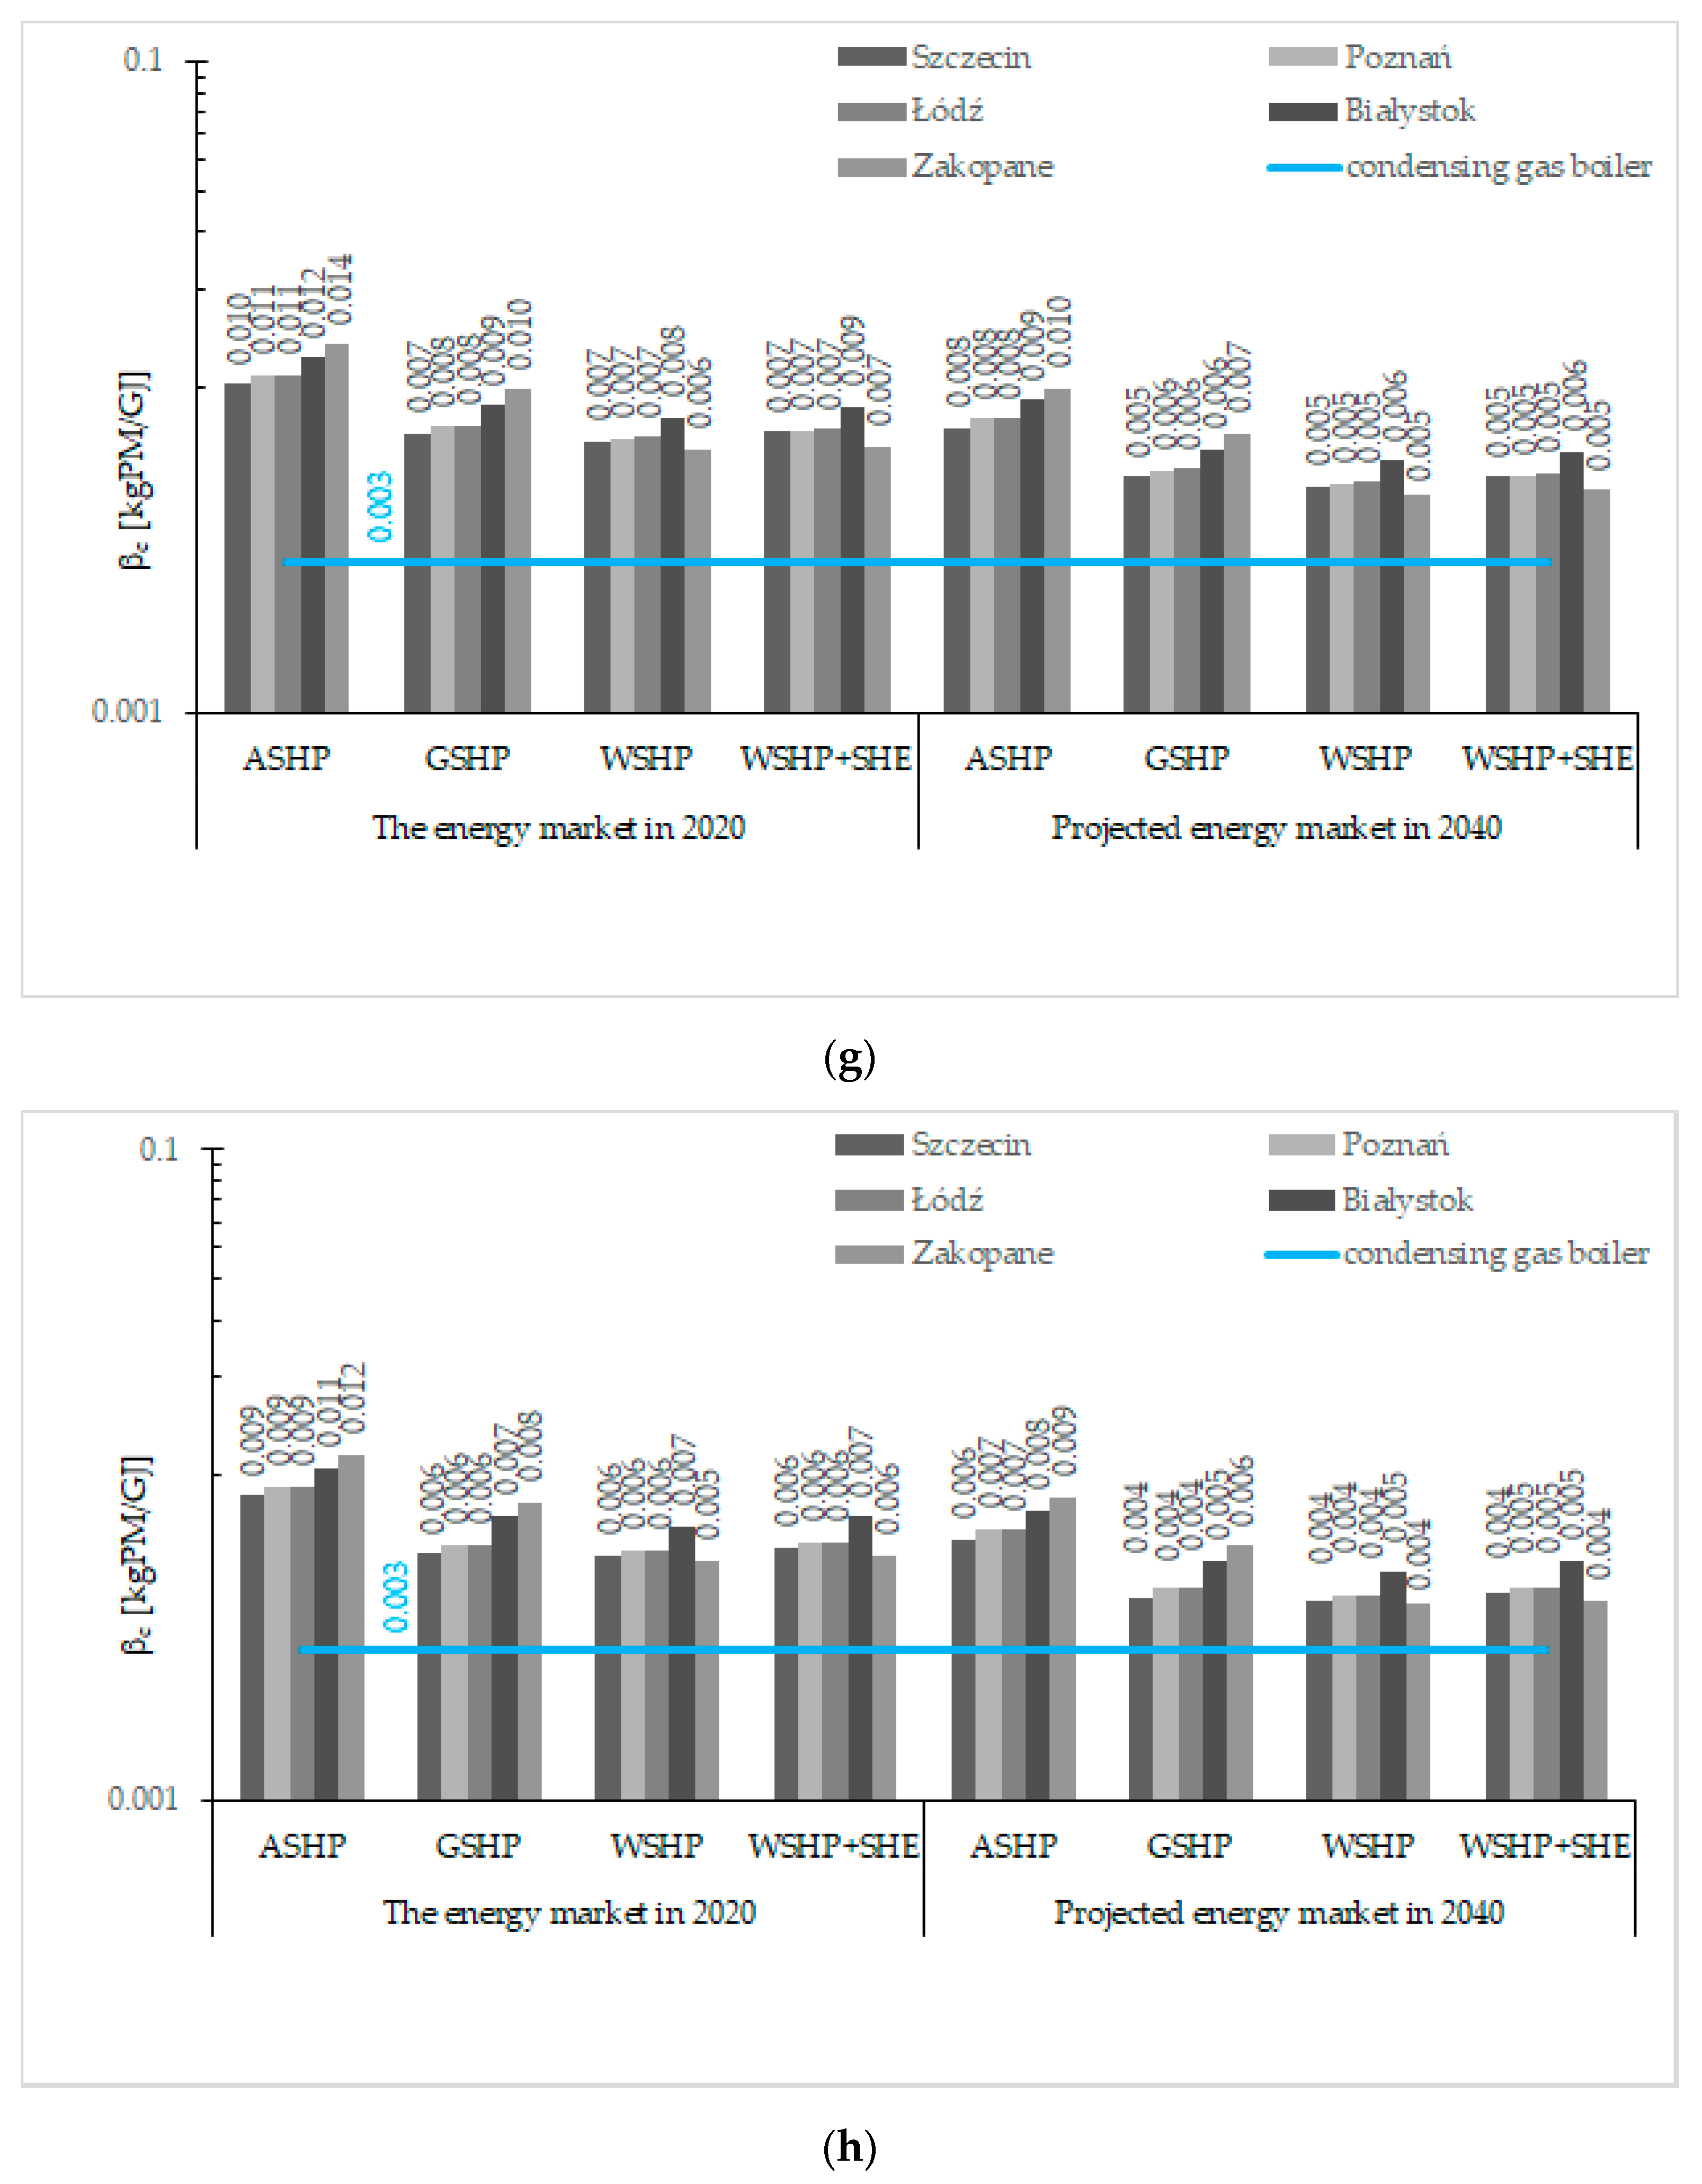
Figure 2 summarizes the results of greenhouse gas emissions obtained from Equation (9) in each climatic zone during the heating season for the first and second scenarios.
If the second scenario was put into practice, the emissions would be reduced by circa one fourth. GSHPs, WSHPs and WSHP + SHE would emit less carbon dioxide by 27.2%. Slightly lower reductions would be seen for ASHPs: 26.6%, 26.4%, 26.7%, 25.8%, and 26.2% for the towns. Sulfur dioxide emissions would be less by 28.7% for GSHPs, WSHPs and WSHP + SHE, and they would be reduced by: 27.9%, 27.6%, 28.0%, 26.7% and 27.3% for ASHPs. Nitrogen oxide emissions would be cut by 27.2% for GSHPs, WSHPs, and WSHP + SHE, and for ASHPs, they would be cut by 26.6%, 26.3%, 26.7%, 25.5% and 26.0%. PM emissions would be limited by 26.9% for GSHPs, WSHPs, and WSHP + SHE; their limitations would be: 26.6%, 26.4%, 26.6%, 26% and 26.3% for ASHPs.
In comparison with the first variant, the variant with changed temperature in the buffer reduced emissions by 13.3–20.9%. The smallest reductions were for ASHPs, followed by WSHPs, while the biggest reductions were for GSHP.
Inasmuch as ASHPs have to be switched off below the bivalent point, the alternative heat generator emits directly greenhouse gases as part of the indirect emissions, so the effect of decreased emissions amid domestic energy production is counteracted by a fossil fuel combustion in the location; to put it more simply, emissions reduction is lower by ca. 5% in comparison to other heat pumps.
The results of the emissions of distinct types of greenhouse gases indicate that its amount inversely corresponds to the SCOPnet value, which results from the fact that the amount of electricity consumed decreases as COP increases. The ground temperature drop due to the consumption of thermal energy increases the emissions by ca. 5%.
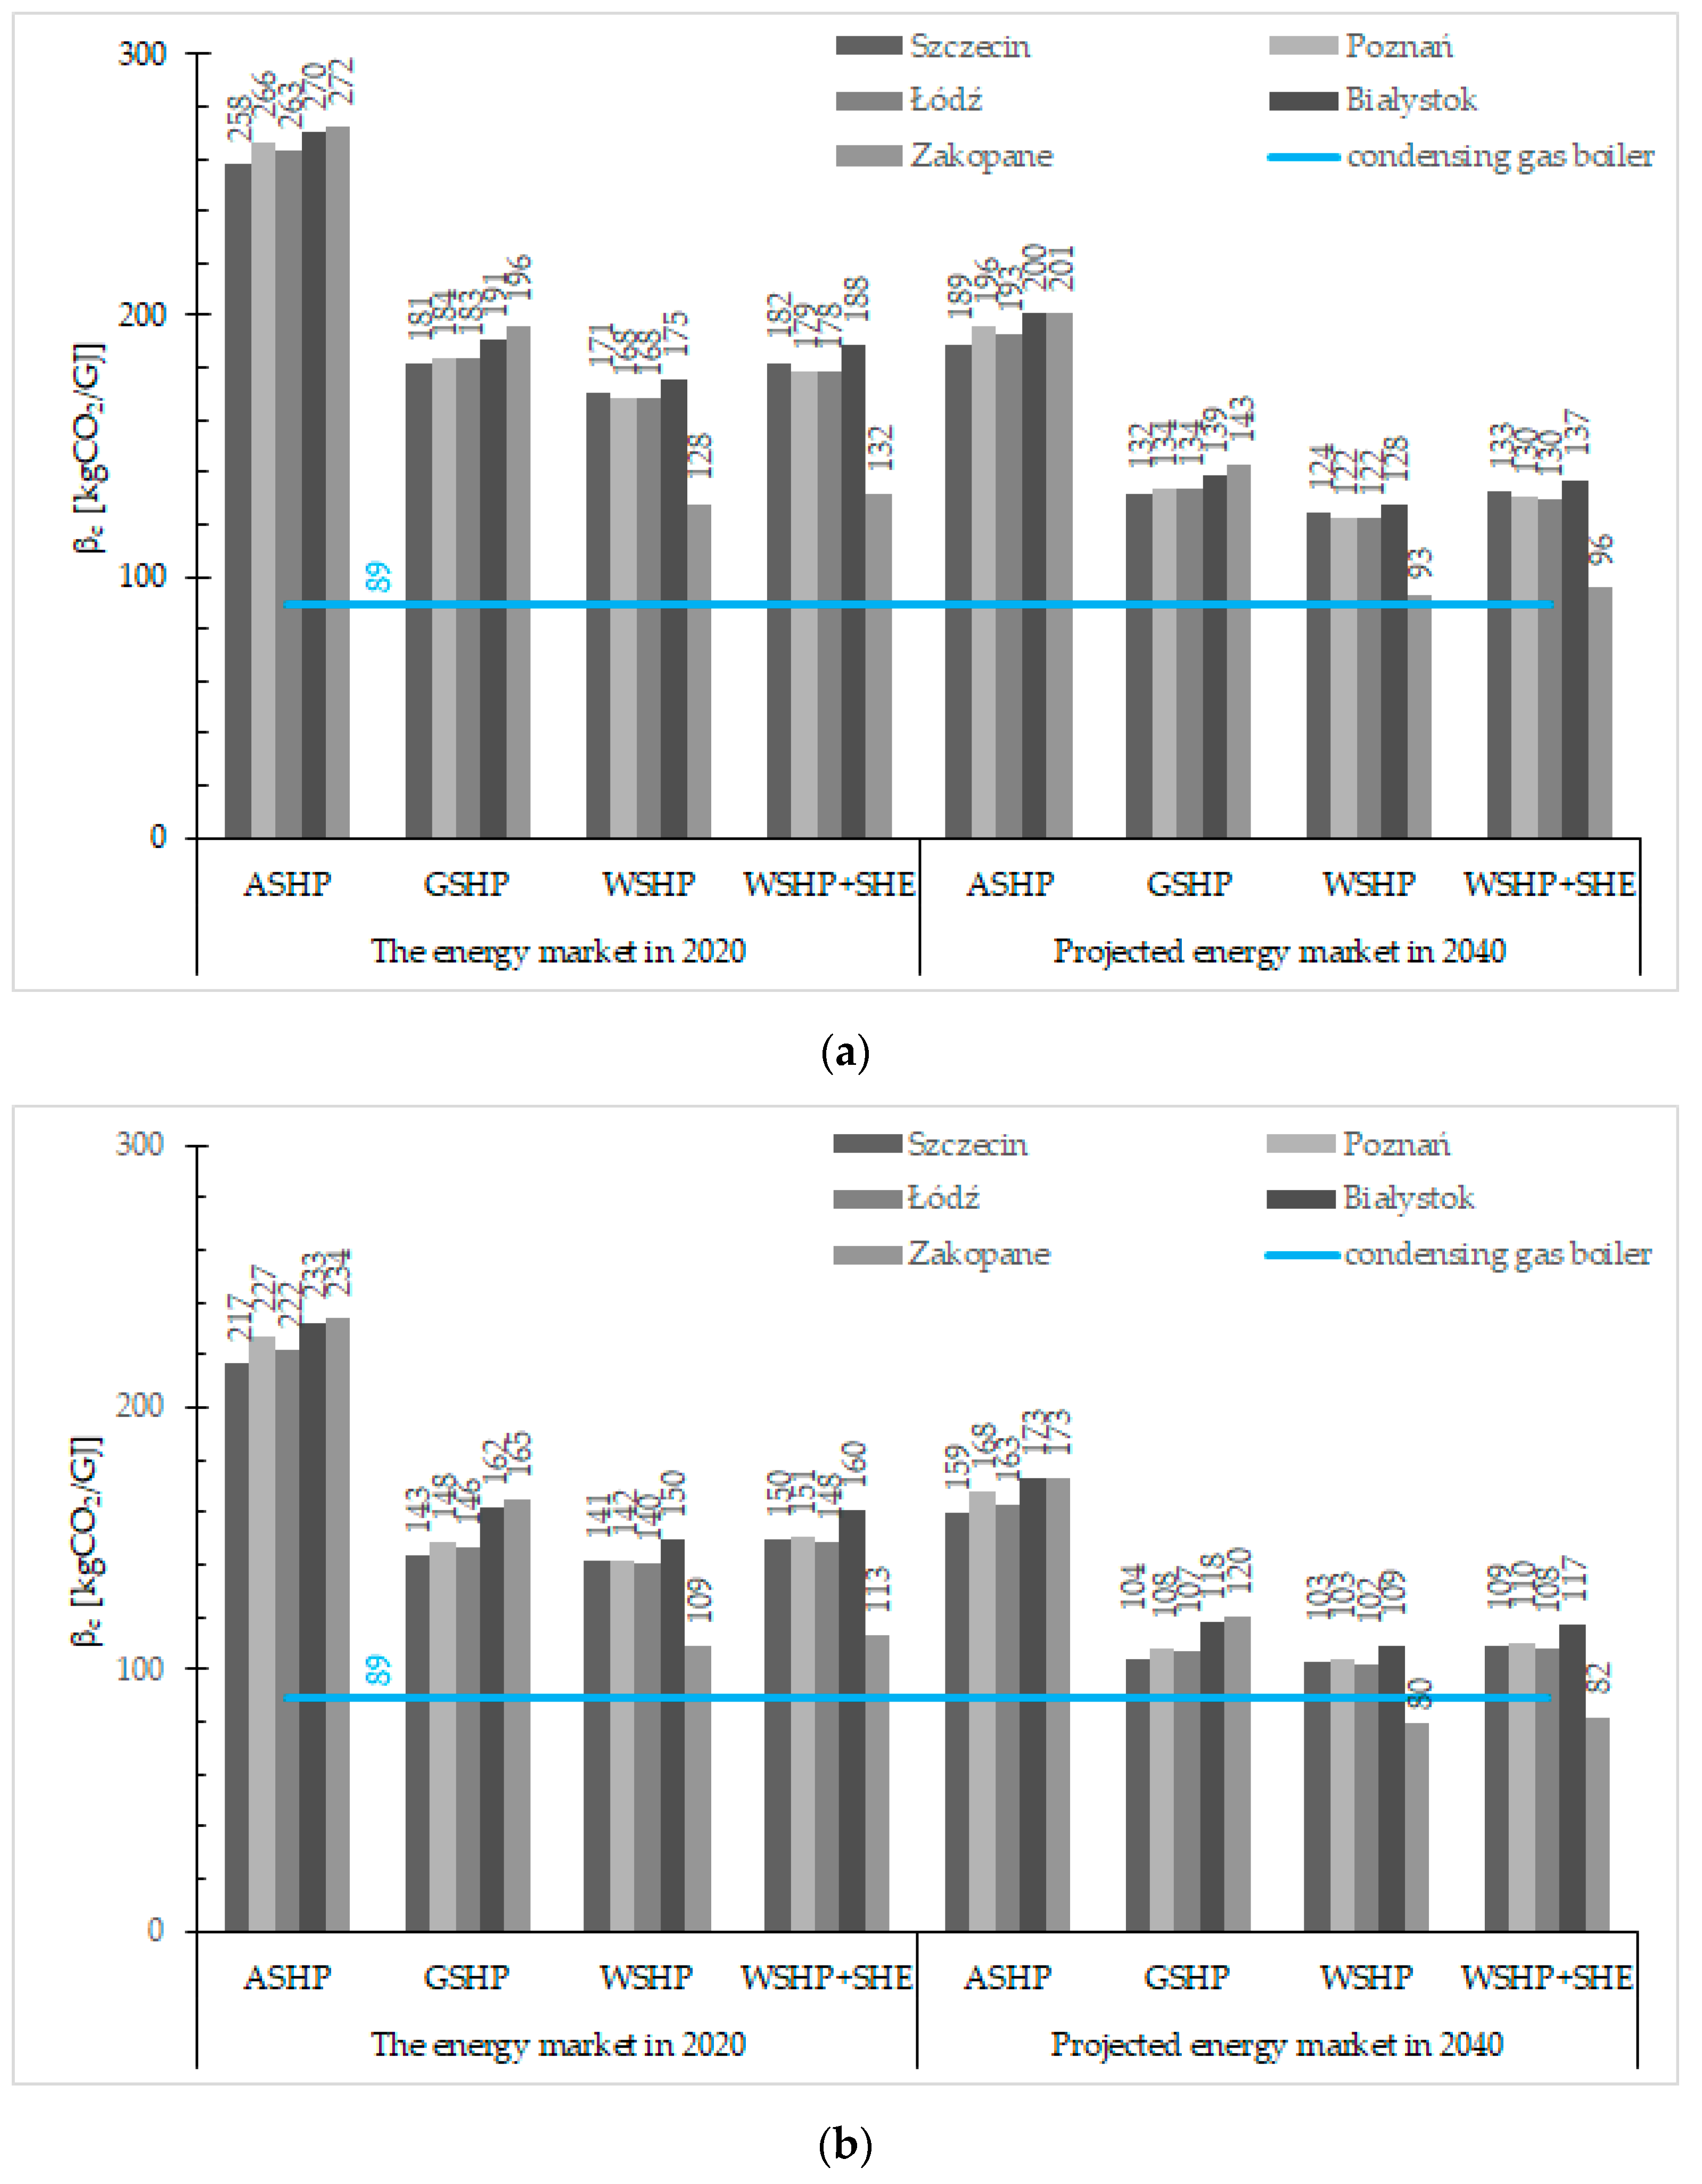
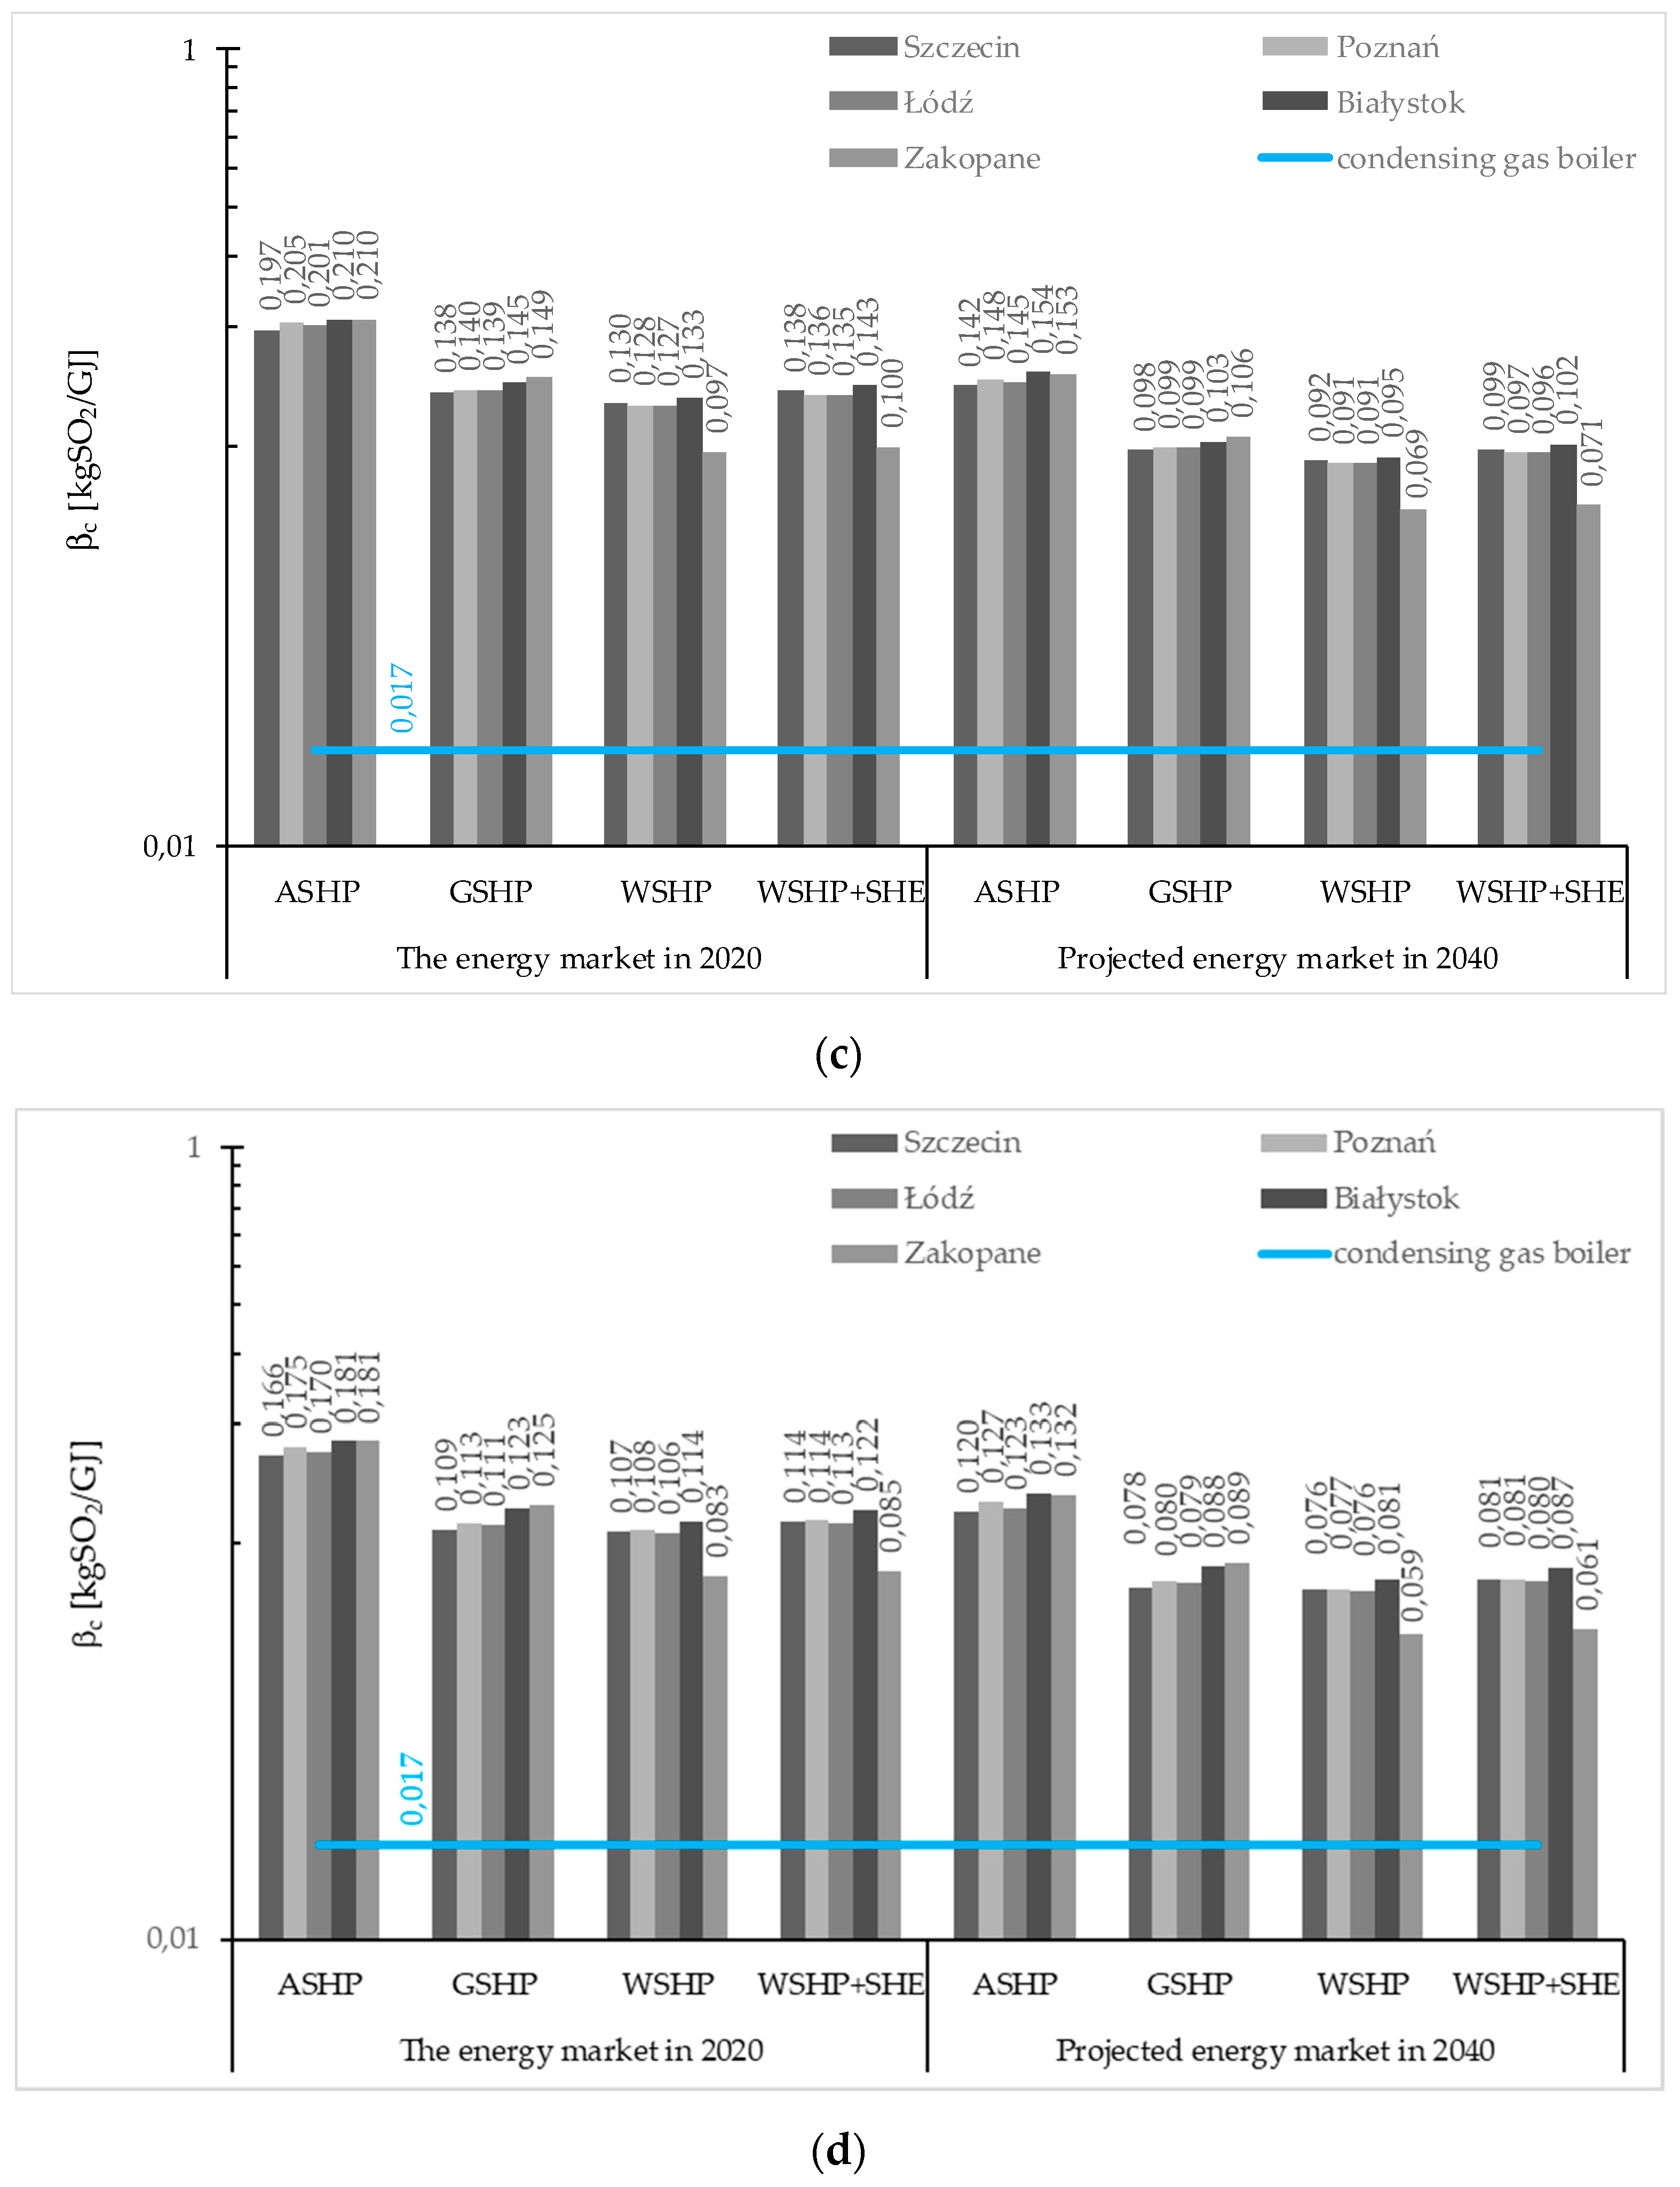
Figure 3 shows the results of Equation (10), where the outcomes for the heat pumps are plotted in the form of bars, but the reference value for a condensing gas boiler is plotted as a horizontal line.
Figure 3 shows that CO
2 emissions from the WSHP in the second variant in Zakopane would be less than from the condensing gas boiler if the second scenario was realized, which also includes an effect of 20.8% electrical power transfer losses. In other words, the indirect emissions levels are 1.26 times higher because of the transfer losses.
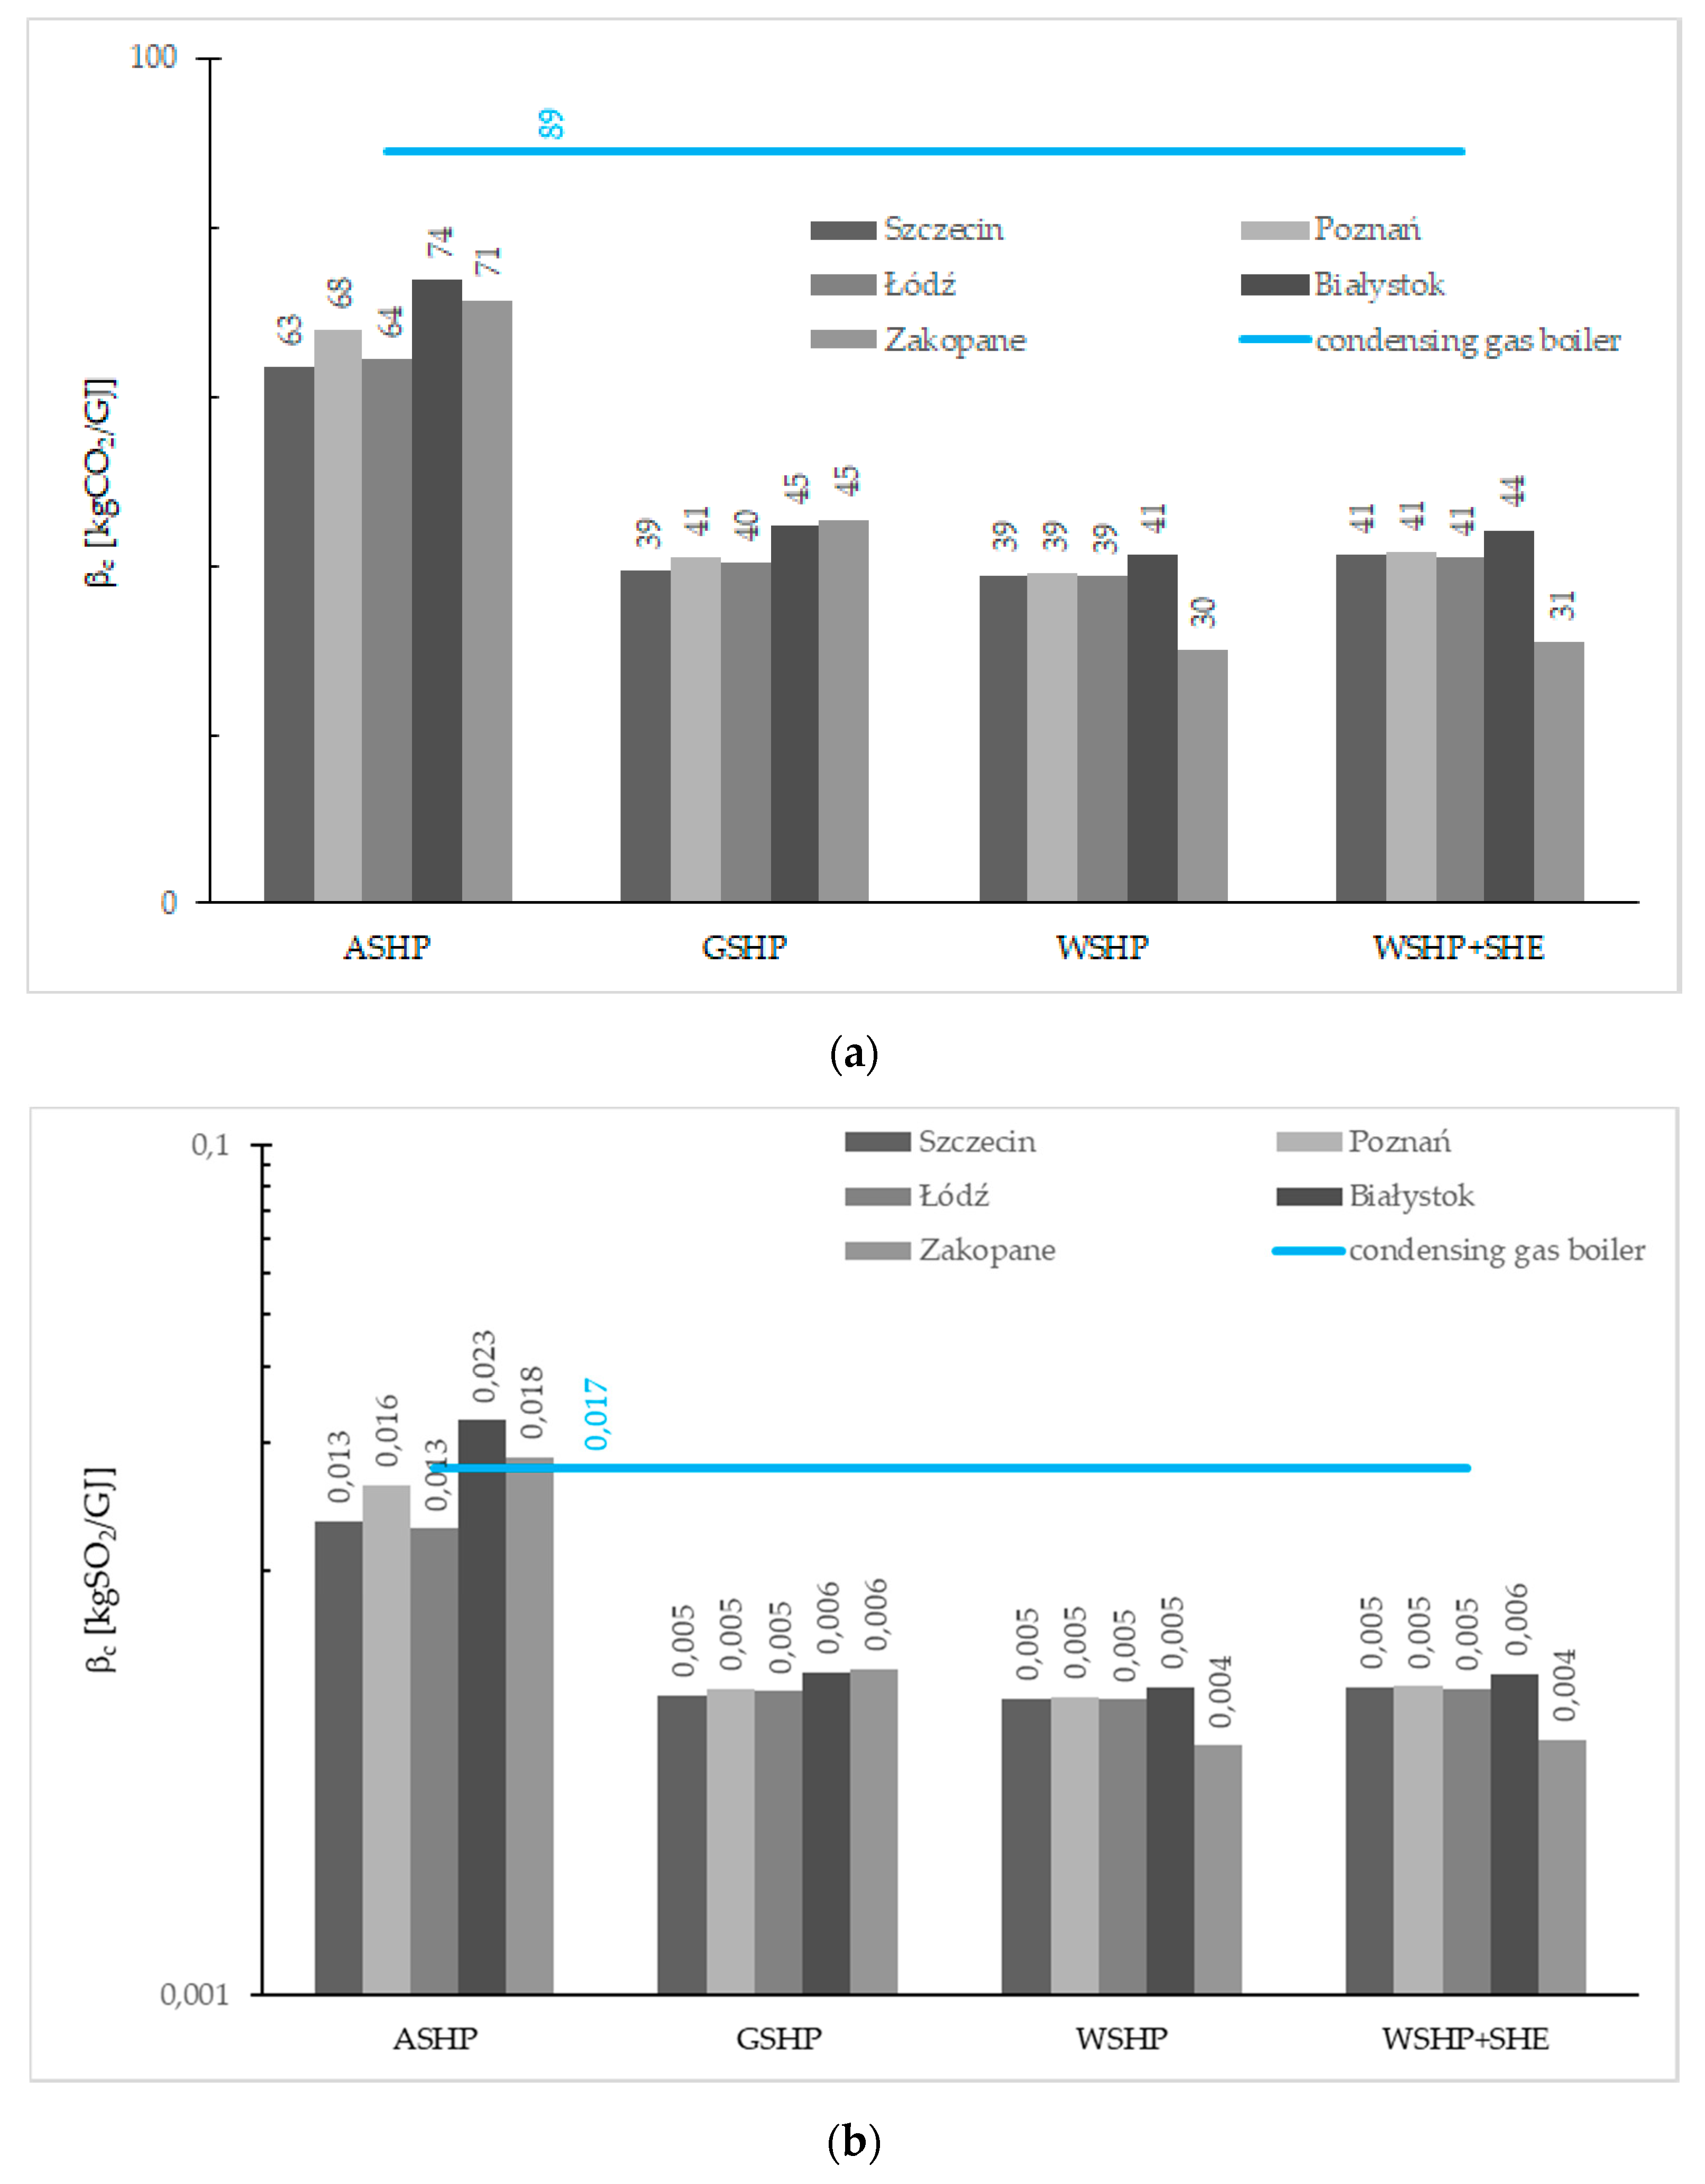
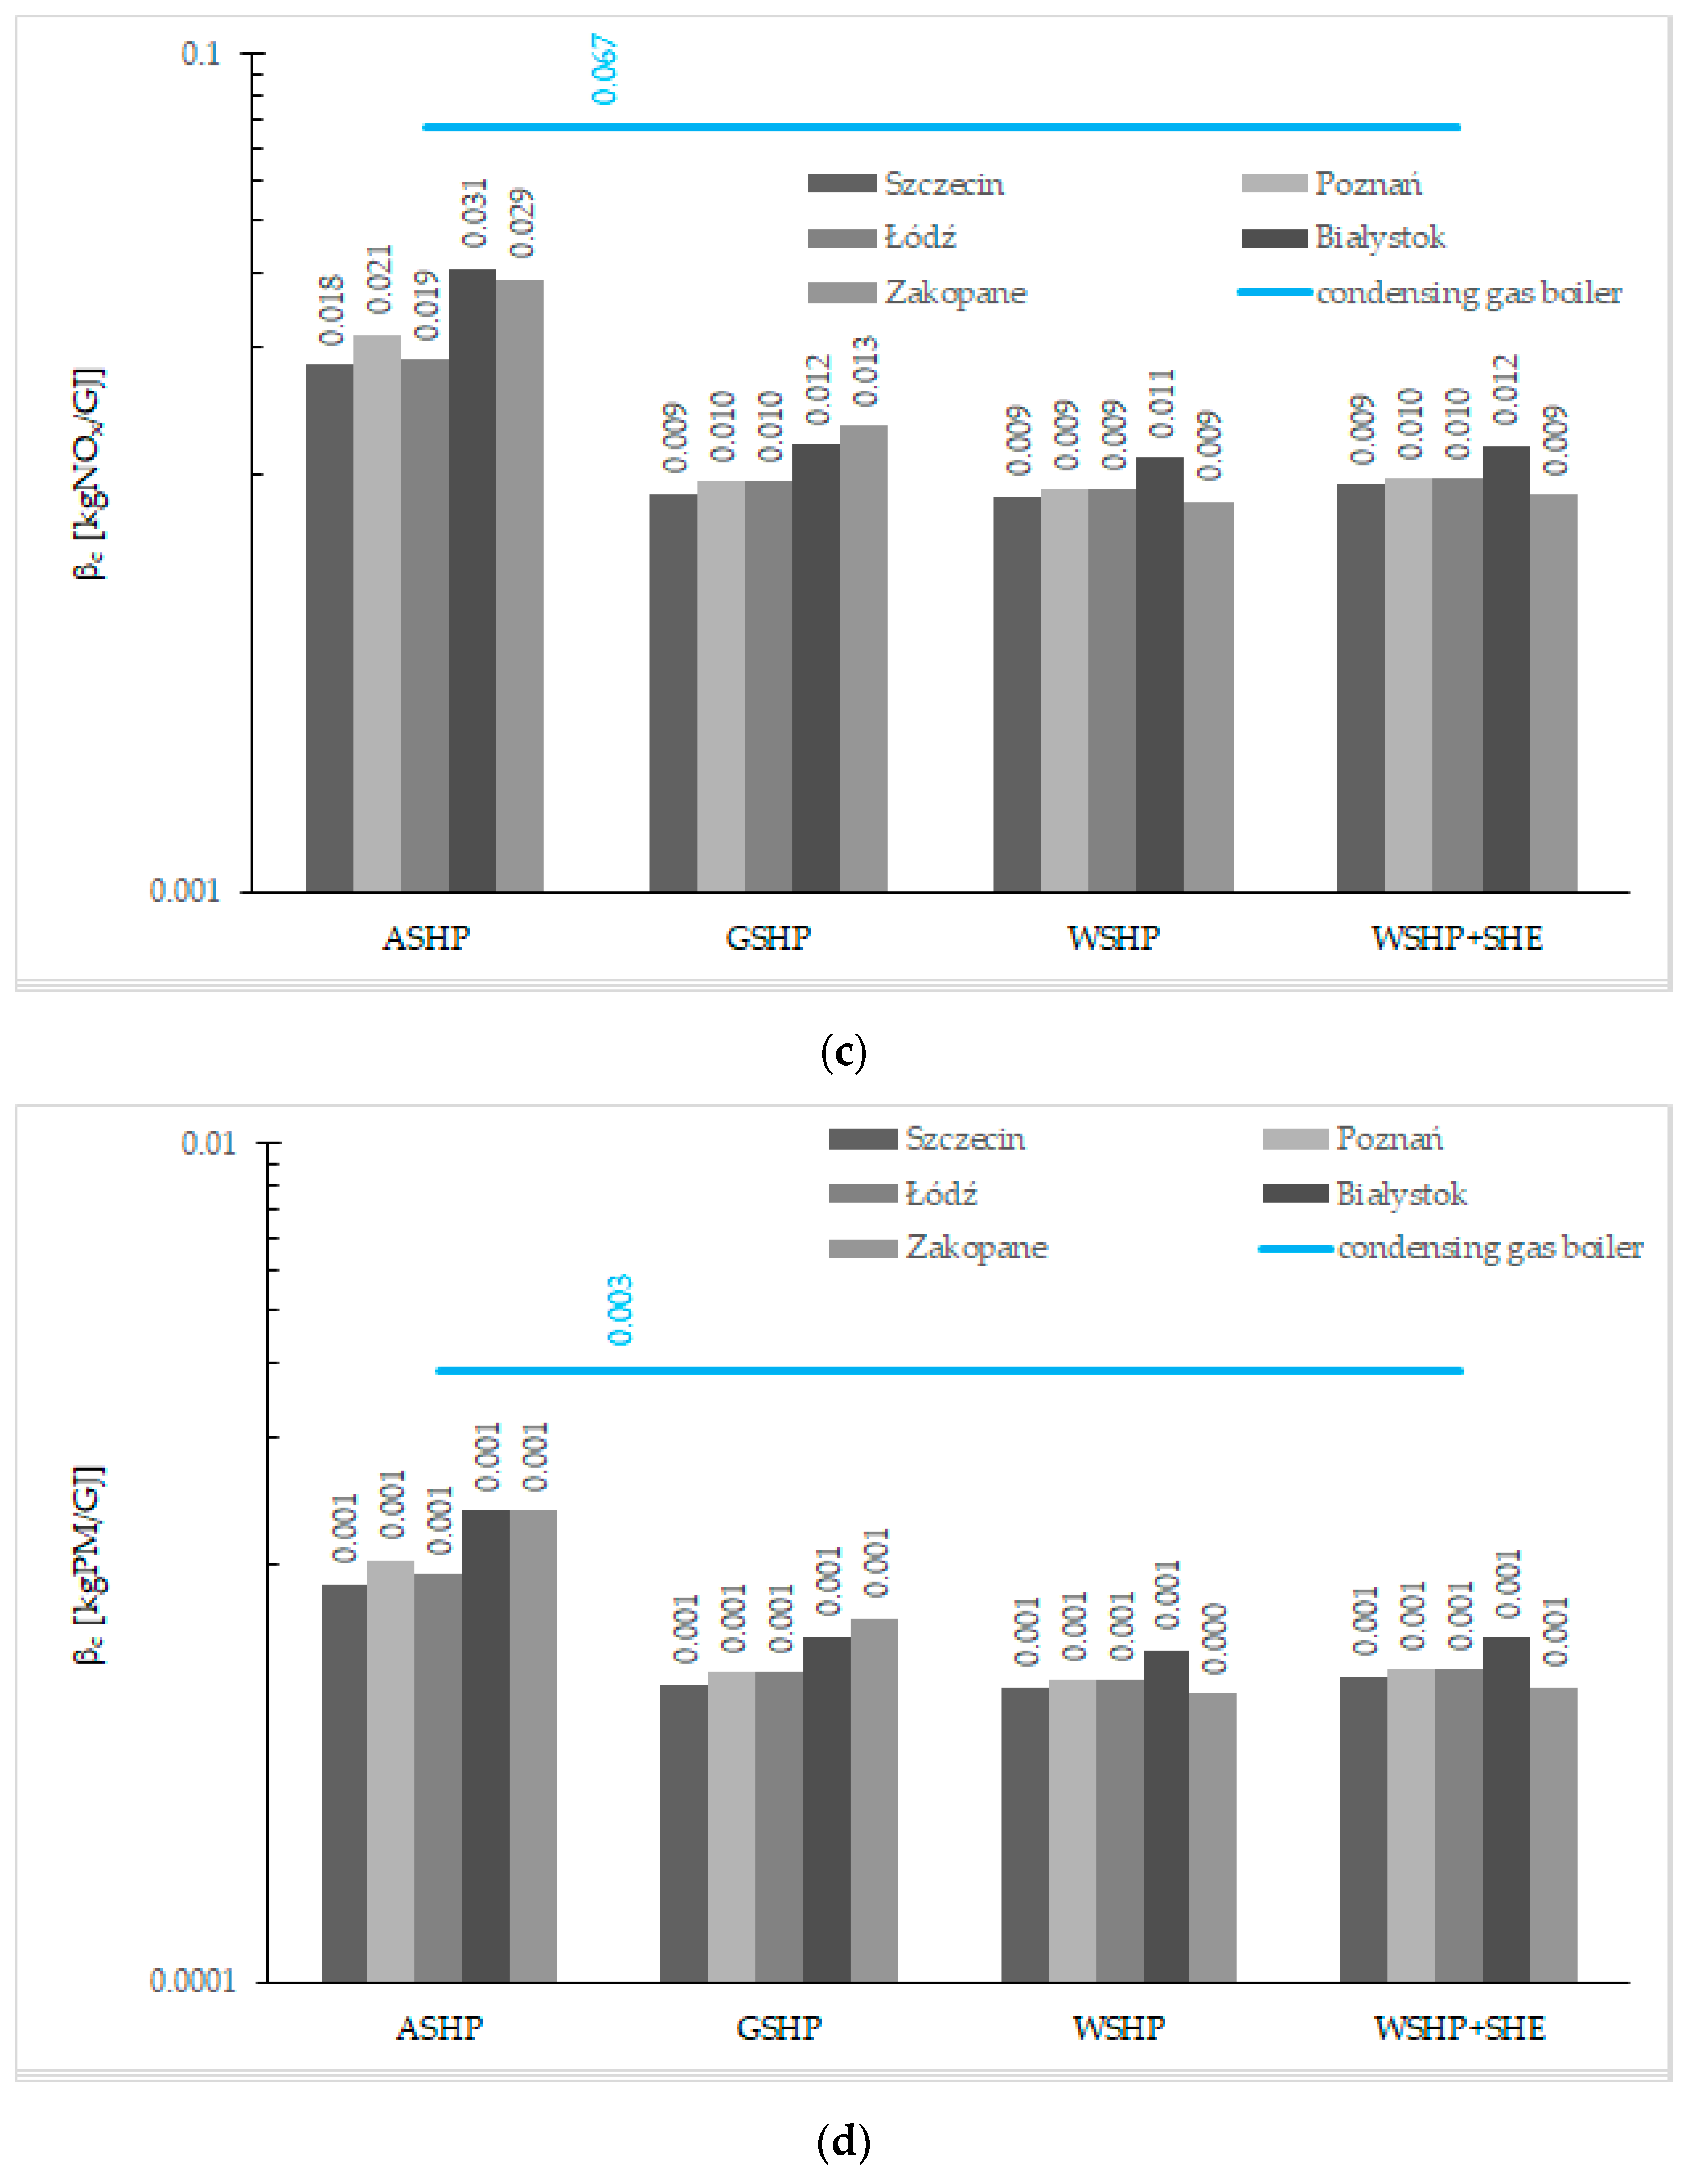
To reduce all emissions from the heat pumps below the condensing gas boiler level in the whole of Poland, the Polish energy mix must vary very substantially. The results of the variation suggested in
Table 9 are shown in
Figure 4.
Figure 4 shows that enormous changes to the Polish energy mix result in desirable outcomes; only the emission levels of nitrogen oxide caused by ASHP operation in the fourth climatic zone would be slightly higher than those of condensing gas boilers. The highest emissions levels in the third scenario relate to the ASHP in Białystok; if we divide the emissions levels in Białystok by the reference level, we obtain ratios that indicate the amount of emissions in relation to condensing gas boilers: 0.83, 1.09, 0.463 and 0.462 for CO
2, SO
2, NO
X and PM, respectively. Thus, reductions in SO
2 emissions needs the biggest effort, followed by CO
2, whilst reductions in NO
X and PM emissions seems to be relatively easy to achieve.
Both absolute and unit emissions caused by GSHPs, WSHPs, and WSHP + SHE in the third scenario are correlated with the weather conditions and temperature of the low-temperature heat reservoir. Meanwhile, the unit emissions caused by ASHPs are also affected by a share of the bivalent heat generator in the heat production; these shares are 2.06%, 3.02%, 1.80%, 5.55%, and 3.92% in the climatic zones, respectively. This bigger share raises an emission level, but greater SCOPnet reduces this level. That is, these two factors exert contrasting effects, which causes the emission level from the ASHP in Łódź to be lower than in Poznań and slightly higher than in Szczecin, but the emissions in Zakopane are lower than in Białystok, and each of these three former levels are lower than any of the two latter.


