Article

Seven Different Lighting Conditions in Photogrammetric Studies of a 3D Urban Mock-Up

by
Katarzyna Bobkowska
1,*,
Pawel Burdziakowski
1,
Jakub Szulwic
1 and
Karolina M. Zielinska-Dabkowska
2
1
Faculty of Civil and Environmental Engineering, Gdansk University of Technology, Narutowicza 11-12, 80-233 Gdansk, Poland
2
GUT LightLab, Faculty of Architecture, Gdansk University of Technology, Narutowicza 11-12, 80-233 Gdansk, Poland
*
Author to whom correspondence should be addressed.
Energies 2021, 14(23), 8002; https://doi.org/10.3390/en14238002
Submission received: 25 October 2021 / Revised: 16 November 2021 / Accepted: 24 November 2021 / Published: 30 November 2021

Abstract

:
One of the most important elements during photogrammetric studies is the appropriate lighting of the object or area under investigation. Nevertheless, the concept of “adequate lighting” is relative. Therefore, we have attempted, based on experimental proof of concept (technology readiness level—TRL3), to verify the impact of various types of lighting emitted by LED light sources for scene illumination and their direct influence on the quality of the photogrammetric study of a 3D urban mock-up. An important issue in this study was the measurement and evaluation of the artificial light sources used, based on illuminance (E), correlated colour temperature (CCT), colour rendering index (CRI) and Spectral power distribution (SPD) and the evaluation of the obtained point clouds (seven photogrammetric products of the same object, developed for seven different lighting conditions). The general values of the quality of the photogrammetric studies were compared. Additionally, we determined seventeen features concerning the group of tie-points in the vicinity of each F-point and the type of study. The acquired traits were related to the number of tie-points in the vicinity, their luminosities and spectral characteristics for each of the colours (red, green, blue). The dependencies between the identified features and the obtained XYZ total error were verified, and the possibility of detecting F-points depending on their luminosity was also analysed. The obtained results can be important in the process of developing a photogrammetric method of urban lighting monitoring or in selecting additional lighting for objects that are the subject of a short-range photogrammetric study.

1. Introduction

Difficult lighting conditions constitute a challenge for photogrammetry. The principles of taking photogrammetric images often includes the fact that the developed object(s) (regardless of its position, either inside or outside the building) should be illuminated evenly, which may turn out to be a difficult task. Depending on the type and objective of the photogrammetric study, an experienced specialist adapts the measurement time to the lighting conditions [1] or provides artificial lighting to the scene, thereby minimising the negative impact of the existing light on the reconstruction.
The concept of lighting in photogrammetry is complex and can be considered in terms of many aspects. The first lighting group, which encompasses the vast majority of cases, includes full complete illumination of the selected object using “white” light, with the wavelength range between 380 and 720 nanometres. In this case, the scene is illuminated with standard “white” light [2,3,4,5,6] with the aim of producing the object’s complete geometry. The second group includes those in which an additional illumination type is aimed at producing or highlighting the object’s special features. This often involves the use of a selected and precise range of electromagnetic waves [7,8,9]. The third group includes studies in which the object or full scenes are recorded using the existing lighting. These include, for example, night-time photogrammetric studies [10,11,12]. Night-time aerial photogrammetry (at low and high level) is an important tool that enables artificial lighting monitoring [13,14]. This way, the obtained typical photogrammetric products, such as 3D models, point clouds and orthophoto maps, provide information not only on the object’s geometry, but also on the relative luminosity, which is very important in the protection against artificial light pollution [15,16] which has a negative influence on human health, and on fauna and flora [17,18,19,20,21].
In photogrammetry, a well-illuminated scene is the primary condition that affects the entire process of the end product’s generation. It affects the detectability of F-points (a point identified in the image with known x, y, z coordinates), matching, aero-triangulation (is the process of assigning ground control values of points on a block of photographs by determining the relationship between the photographs and known ground control points) or image mosaicking [22]. For this reason, conducting night-time studies for artificial lighting monitoring purposes is difficult for some objects and lowers the quality of the study, but mainly of the accuracy of geometric representation [11]. Due to the above, we posed the question that was then deemed as the research question. What is the impact of the scene’s lighting colour and intensity on the accuracy of a photogrammetric study? Consequently, the main objective of this paper is to analyse the accuracy of photogrammetric studies in various lighting conditions. When specifying the main objective, this paper verifies the following:
  • the general quality of study depending on the scene lighting type. The studied scene was illuminated with white (warm, cold, neutral), red, green, blue light and without additional lighting,
  • the dependency between the detectability of F-points and the features that determine the luminosity of F-point discs,
  • the dependency between the F-point’s XYZ total error and the features that determine the luminosity of F-point discs,
  • the dependency between the number of tie-points (point of the analysed object, presented in two or more images) in the F-point’s vicinity and the features that determine the luminosity of F-point discs.
The results of this work can be the basis for planning the distribution of F-points when it is impossible to manipulate additional lighting (as in the case of studies conducted with the purpose of monitoring external artificial light at night—ALAN) or to select or change the artificial lighting of objects constituting the subject of the study. It must be noted that the quality of a photogrammetric study is affected by many factors, the specific division of which can be found in paper [23]. The most important factors include: object shape and colour [24,25], image quality [26], used software, methods [22,27], used sensors [28], accuracy of support systems [29,30,31,32] and data fusion methods [33,34,35], sensor orientation [1] or even the sensor’s temperature [36]. In this study, we focus only on the illumination of 3D urban mock-up lighting scene(s).

2. Materials and Methods

2.1. Research Procedure and Metrics

A uniform research procedure was developed to analyse the accuracy of photogrammetric studies in various lighting conditions. The following constants were assumed: test object (mock-up), F-points’ location, measurement equipment (camera, total station), exposure settings and external orientation elements for each scene. Only the scene’s lighting conditions varied during the tests. This procedure will allow for the determination of the impact of artificial lighting on the object’s reconstruction.
For the purpose of these tests, the analysis of the accuracy of photogrammetric studies conducted at variable lightings featured the extraction of tie-points from the F-points’ vicinity, so that the selected tie-point lies in a square with its centre in the F-point and sides orientated parallel to the X and Y axes, which can be recorded using the following condition:
X F p n 0.01 m < x t p k < X F p n + 0.01 m
Y F p n 0.01 m < y t p k < Y F p n + 0.01 m
where: F p n is the n-th F-point with coordinates expressed using the local coordinate system X F p n , Y F p n , Z F p n and t p k is the k-th tie-point with coordinates x t p k , y t p k ( z t p k —this coordinate was omitted in this case).
The entire procedure is presented in Figure 1.
A separate file was saved for all F-points and each type of study, featuring data on the points in the vicinity, including the coordinates and values determining its colour: R (red), G (green) and B (blue). The data will be used in the further analytical process. The following features were determined for each extracted set:
  • NT-p—number of tie-points, it is the number of the tie-points extracted from the vicinity of the studied F-point.
  • MeanL1—mean luminosity type 1, designated for all extracted tie-points; the luminosity for a single tie-point was designated with the following formula (3):
L 1 t p k = R + G + B 3
where R, G and B are the values of the spectral responses recorded by the digital camera for the given point.
  • MeanL2—mean luminosity type 2, designated for all extracted tie-points; the luminosity for a single tie-point was designated with Formula (4) [37,38]:
L 2 t p k = 0.21 R + 0.72 G + 0.07 B
where R, G and B are the values of the spectral responses recorded by the digital camera for the given point.
For the purpose of the study’s statistical assessment, typical statistical parameters were determined, such as the following maximum values:
  • MaxL1—maximum luminosity type 1,
  • MaxR—maximum spectral response R recorded by the digital camera for the given points,
  • MaxG—maximum spectral response G recorded by the digital camera for the given points,
  • MaxB—maximum spectral response B recorded by the digital camera for the given points,
Minimum values:
  • MinL1 is the minimum luminosity type 1;
  • MinR is the minimum spectral response R recorded by the digital camera for the given points;
  • MinG is the minimum spectral response G recorded by the digital camera for the given points;
  • MinB is the minimum spectral response B recorded by the digital camera for the given points;
Mean values:
  • MeanR is the mean spectral response R recorded by the digital camera for the given points;
  • MeanG is the mean spectral response G recorded by the digital camera for the given points; and
  • MeanB is the mean spectral response B recorded by the digital camera for the given points.
Standard deviation, median and mode:
  • StdL1 is the standard deviation of luminosity type 1;
  • MedianL1 is the median of luminosity type 1; and
  • ModeL1 is the mode of luminosity type 1.

2.2. Impact Coefficients and Correlation Assessment

The assessment of the impact of the tested parameters of the study’s accuracy featured the use of the Pearson correlation coefficient [39,40], which is widely used for the purpose of data classification [41], comparison [42,43] and in seeking their dependencies [44]. The use of the Pearson’s linear correlation coefficient was motivated by several reasons:
  • the possibility of its use (minimum requirement: two compared variables were determined at least on the interval scale, and, in our case, on the ratio scale);
  • the prevalence of this coefficient in photogrammetric analyses (it enables a larger group of recipients to understand the results of the relationships here presented); and
  • a visual assessment of the figures (e.g., graphs representing the data) showing (in many cases—where it was noticed) a linear relationship.
Consequently, the following criteria and values were adopted:
  • Perfect (coefficient value is near ±1);
  • High (coefficient value lies between ±0.50 and ±1);
  • Medium(coefficient value lies between ±0.30 and ±0.49);
  • Low (coefficient value lies between 0 and ±0.29); and
  • No correlation (coefficient value is near 0).
The Pearson correlation coefficients were designated between the XYZ total error elements’ matrices ( M X Y Z T E ) and the matrix of the number of tie-points in the vicinity of the F-point ( M N T p ), and other matrices of the tested indices, such as: M N T p , M M e a n L 2 , M M a x L 1 , M M i n L 1 , M M e a n R , M M a x R , M M i n R , M M e a n G , M M a x G , M M i n G , M M e a n B , M M a x B and M M i n B . The calculations did not feature the data on the undetected F-points. The matrices of the tested coefficients were developed according to the following formula:
M c o e f   =   [ e 1.1 e 1.2 e 1 , 7 e 2.1 e 2.2 e 2 , 7 e 19 , 1 e 19 , 2 e m , n ]  
where: M c o e f is the matrix of the tested index (coef), e m , n index for the m-th F-point and n-th lighting case (n = 1 for dark case, n = 2 for warm case, n = 3 for cold case, n = 4 for neutral case, n = 5 for red case, n = 6 for green case and n = 7 for blue).
The above listing of indices in the form of a matrix enables further analyses through the division into vectors. The division of the matrix into vectors through the isolation of lines (m) allows for obtaining a set of data for particular points, whereas the division of the matrix into vectors through dimension n allows for obtaining a set of data for analysing each type of lighting.
The procedure described in this section allows for the determination of the dependencies between the detected F-points and the quality and colour values of the adjacent tie-points, thereby leading to the achievement of the paper’s objective.

2.3. Object of Analyses

A mock-up, with the dimensions of 1.0 × 1.5 m and presenting a 3D urban fragment in the NTS scale, including elements, such as roads, buildings, greenery, water, was developed for the purpose of these tests. The materials used for the mock-up were as follows: styrofoam, wooden sticks, paper cups, coloured paper, brick fragments, gravel, small stones, small cardboard boxes, adhesive tapes, spray paints and glue. The mock-up was fitted with F-points in the form of dedicated discs, used for the purposes of the Agisoft Metashape software (Figure 2). The distribution of the discs on the mock-up is presented in Figure 3. The mock-up was stabilised and placed in a room of the Gdansk University of Technology’s Faculty of Civil and Environment Engineering building.

2.4. Hardware and Software

The tests were conducted using photographic equipment, surveying equipment, measurement devices, additional lighting sources, the mock-up as well as photogrammetric and analytical software. This section presents the basic information about the research tools used. Table 1 presents abbreviated information about the tools used.
The F-points’ coordinates were measured using a specialized Total Station Leica TCRP 1201 (Leica Geosystems, Heerbrugg, Canton St. Gallen, Switzerland) [45,46,47,48,49]. Leica TCRP 1201 is a device that allows the determining of the position of points in a local coordinate system.
The Nikon D5300 camera (Nikon Corporation, Chiyoda, Tokyo, Japan) with thae Nikkor AF-S 50-mm lens was used to capture the images. The camera offers a CMOS matrix with the dimensions of 23.5 × 15.6 mm and 24.78 million pixels.
The parameters of the scene’s additional lighting sources were measured using a UPRtek MK350D spectrometer (United Power Research Technology Corporation, Zhunan Township, Taiwan) along with dedicated uSpectrum MK350D software. The device is commonly used in commercial and scientific work [50]. The spectrometer is a small and handy device, weighing 70 g. It features a built-in CMOS Linear Image Sensor. It can measure electromagnetic waves in the visible spectrum of 380 to 780 nm with a wavelength data increment of 1 nm, spectral bandwidthof approx. 12 nm (half bandwidth) and a wavelength reproducibility of ±1 nm. The lx measurement range for this Spectrometer is 70 to 70,000. Thanks to this device, it was possible to determine the following lighting parameters: illuminance (LUX), correlated colour temperature (CCT), colour rendering index (CRI, Ra)/R9, spectral power distribution (SPD) mW/m2, peak wavelength (λp) [51]. The measurement accuracies in terms of %error were: illuminance accuracy—illuminant A @ 2856 K at 20,000 lx ± 5%, CCT accuracy—alluminant A @ 2856 K at 20,000 lx ± 2%, CRI accuracy @ Ra—illuminant A @ 2856 K at 20,000 lx ± 1.5%.
The tested scene was illuminated using low-budget diffused light sources: LED SPECTRUM SMART 13W E27 LED RGBW [52] with an effective luminous flux of 1500 lm and wide-beam angle of 210 degrees. The devices enable remote colour manipulation using a mobile application installed on a smartphone. Each light source consisted of 4 red LEDs, 4 green LEDs, 4 blue LEDs, 30 warm white LEDs and 30 cool white LEDs (Figure 4).
The Agisoft Metashape Profesional software (Agisoft LLC, St. Petersburg, Russia) was used to develop the collected data (images along with the F-points’ coordinates). The software is one of the most popular programs used in photogrammetry (mainly in short-range photogrammetry) [53]. Aside from standard functionalities (photogrammetric triangulation [27], digital surface/digital terrain model generation [54,55], georeferenced orthomosaic generation [56,57], 3D model generation and texturing [58]), it enables the use of Python and Java APIs, which allow for adapting the software to the user’s needs, often dictated by its use for specialist analyses by scientists in the photogrammetry and teledetection fields [23,59,60].
Matlab (The MathWorks, Inc., Natick, MA, USA) was used in the analysis of the output data obtained from the Agisoft Metashape Profesional (accuracy data, generated point clouds). The program allows for conducting complex mathematical analyses and the plotting of results in various types of plots. The program is widely used by scientists from various fields [61,62,63], including photogrammetry [64,65].

2.5. Data Acquisition

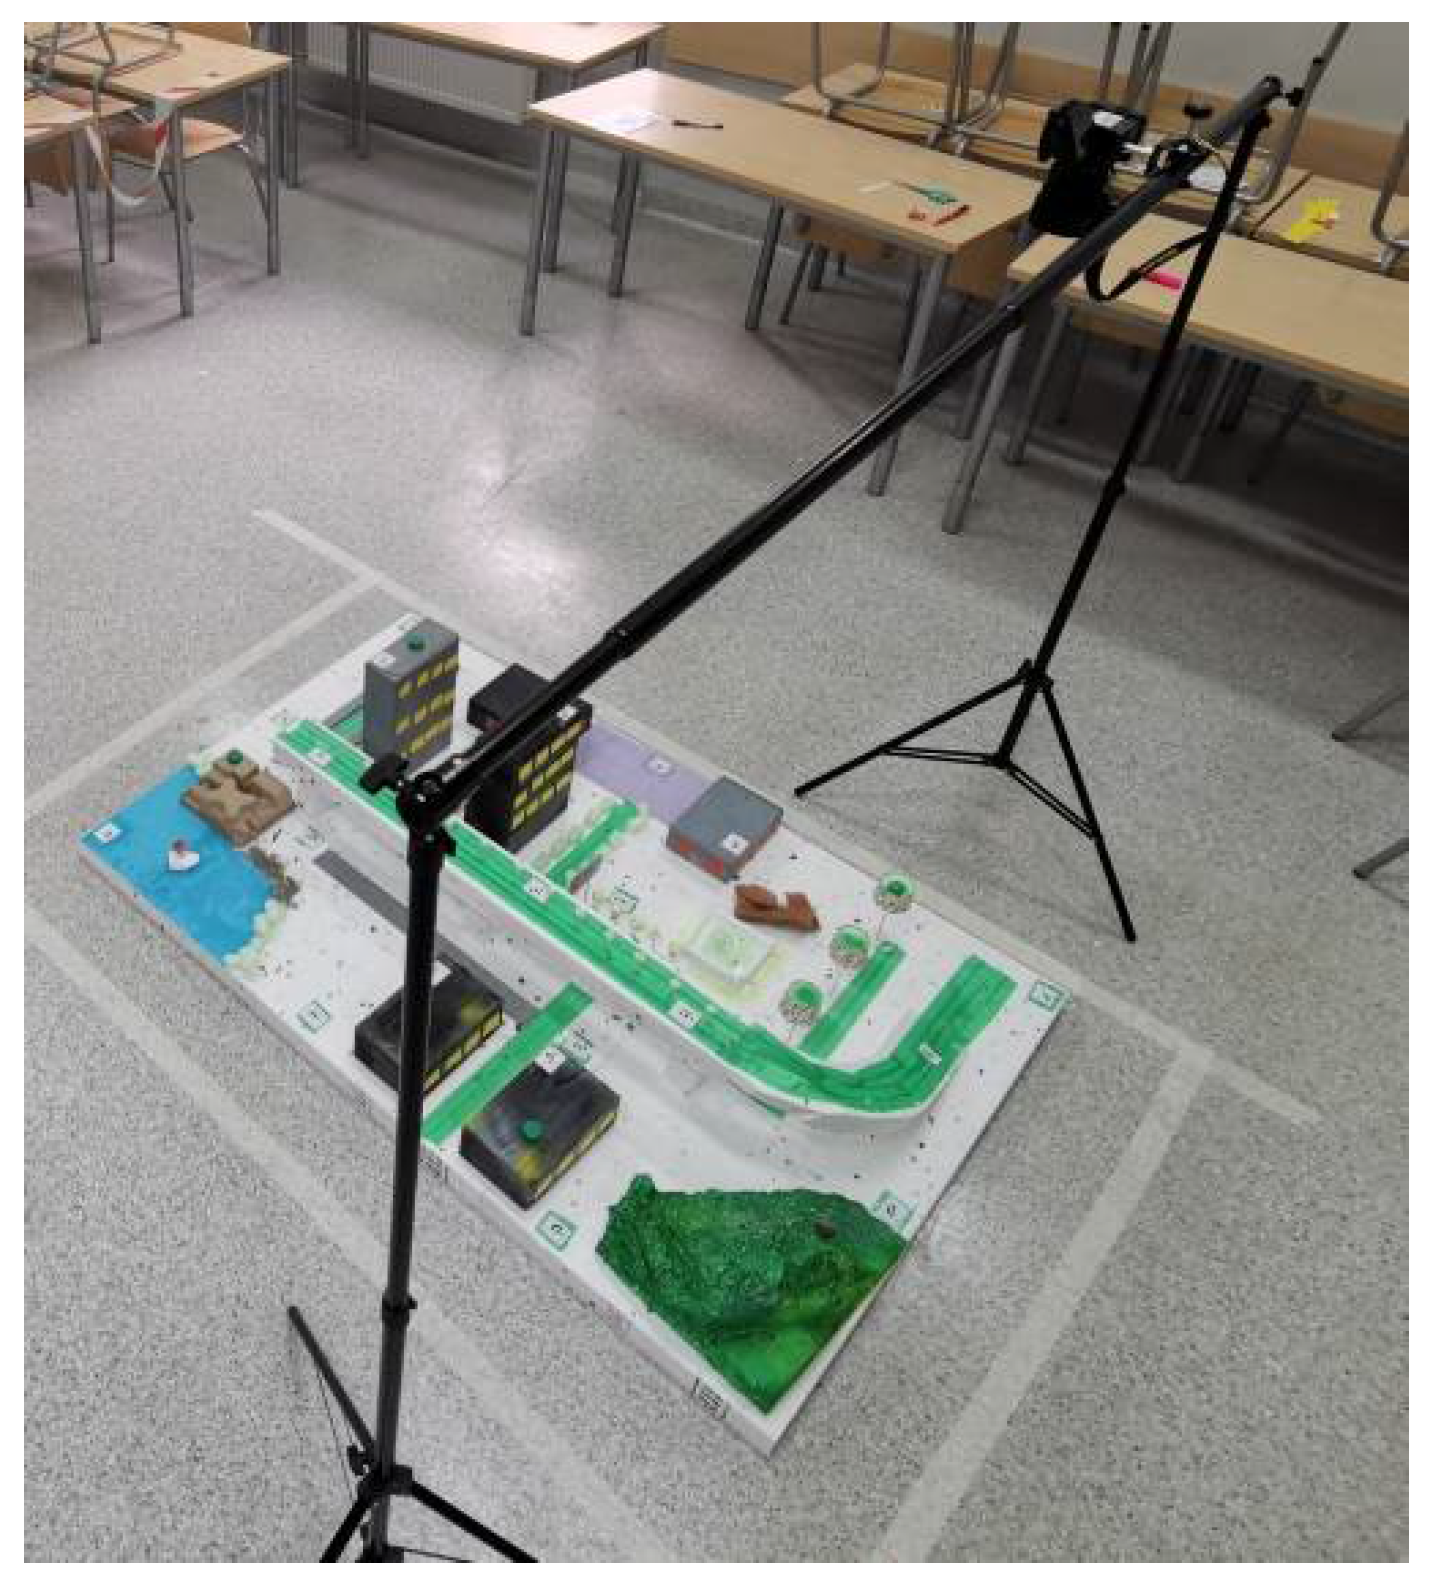
The measurement station was placed in the prepared laboratory. Figure 5 presents the layout of the station’s basic elements.
Image acquisition was performed using a stationary photographic station consisting of two tripods and a bar to which the camera was fitted. The station allowed for precise control of the camera’s position. Figure 6 presents the measurement station and the mock-up. The images were taken in the forenoon, on a cloudy day, in a room to which natural light access was restricted by covering the windows using textile roller blinds.
The camera station was positioned manually every time while maintaining 50% longitudinal coverage and 50% transverse coverage. A series of images were taken at 100% of the LED light output after the position selection, camera placement and stabilisation at the target position. Each image taken in a series featured a lighting change in the sequence specified in Table 2.
After the last image in the series was taken, the camera position was changed and the process was repeated. Capturing entire test area involved taking 43 images with maintenance of the dedicated coverage. Each image was taken at fixed exposure parameters: diaphragm f/4, exposure time 1/20 s, ISO-400.
Seven complete data sets were obtained for the photogrammetric study as result of the procedure specified above. All images were saved in .jpg format. Based on the scientists’ experience [66], it was concluded that the use of compressed images would not significantly lower the study’s quality.
The station intended for the tachometric measurement of the F-points located on the mock-up was positioned close to the object. The tripod was placed on the laboratory’s stable floor. The measurements covered each F-point and coordinates x,y,z in the local system.
The detailed specification of the used LED light sources was provided based on the measurements. The spectrometer measurements were conducted in the laboratory, in a completely darkened room, at a distance of 15 cm. The spectrometer was aimed directly at the light source with 100% light output. The spectrometer sensor was positioned in the LED light source’s axis. The measurements featured the designation of the most specific lighting parameters used while designing external illuminations [67,68,69], such as:
  • illuminance (E)—entire luminous flux falling on a surface unit;
  • correlated colour temperature (CCT), used in the specification of white light sources to describe the dominant colour tone from warm (orange), through neutral, to cold (blue);
  • colour rendering index (CRI), ability of a light source to provide the most faithful representation of the surface’s colours when compared to the reference light source (usually incandescent source). The CRI range is 0 to 100. The higher the CRI, the better the representation of the illuminated objects’ colours;
  • spectral power distribution (SPD) describes the power per surface unit per the lighting’s wavelength unit (radiation efficiency); and
  • peak wavelength (λp), the wavelength for which the highest peak in the light’s spectral specification is obtained.
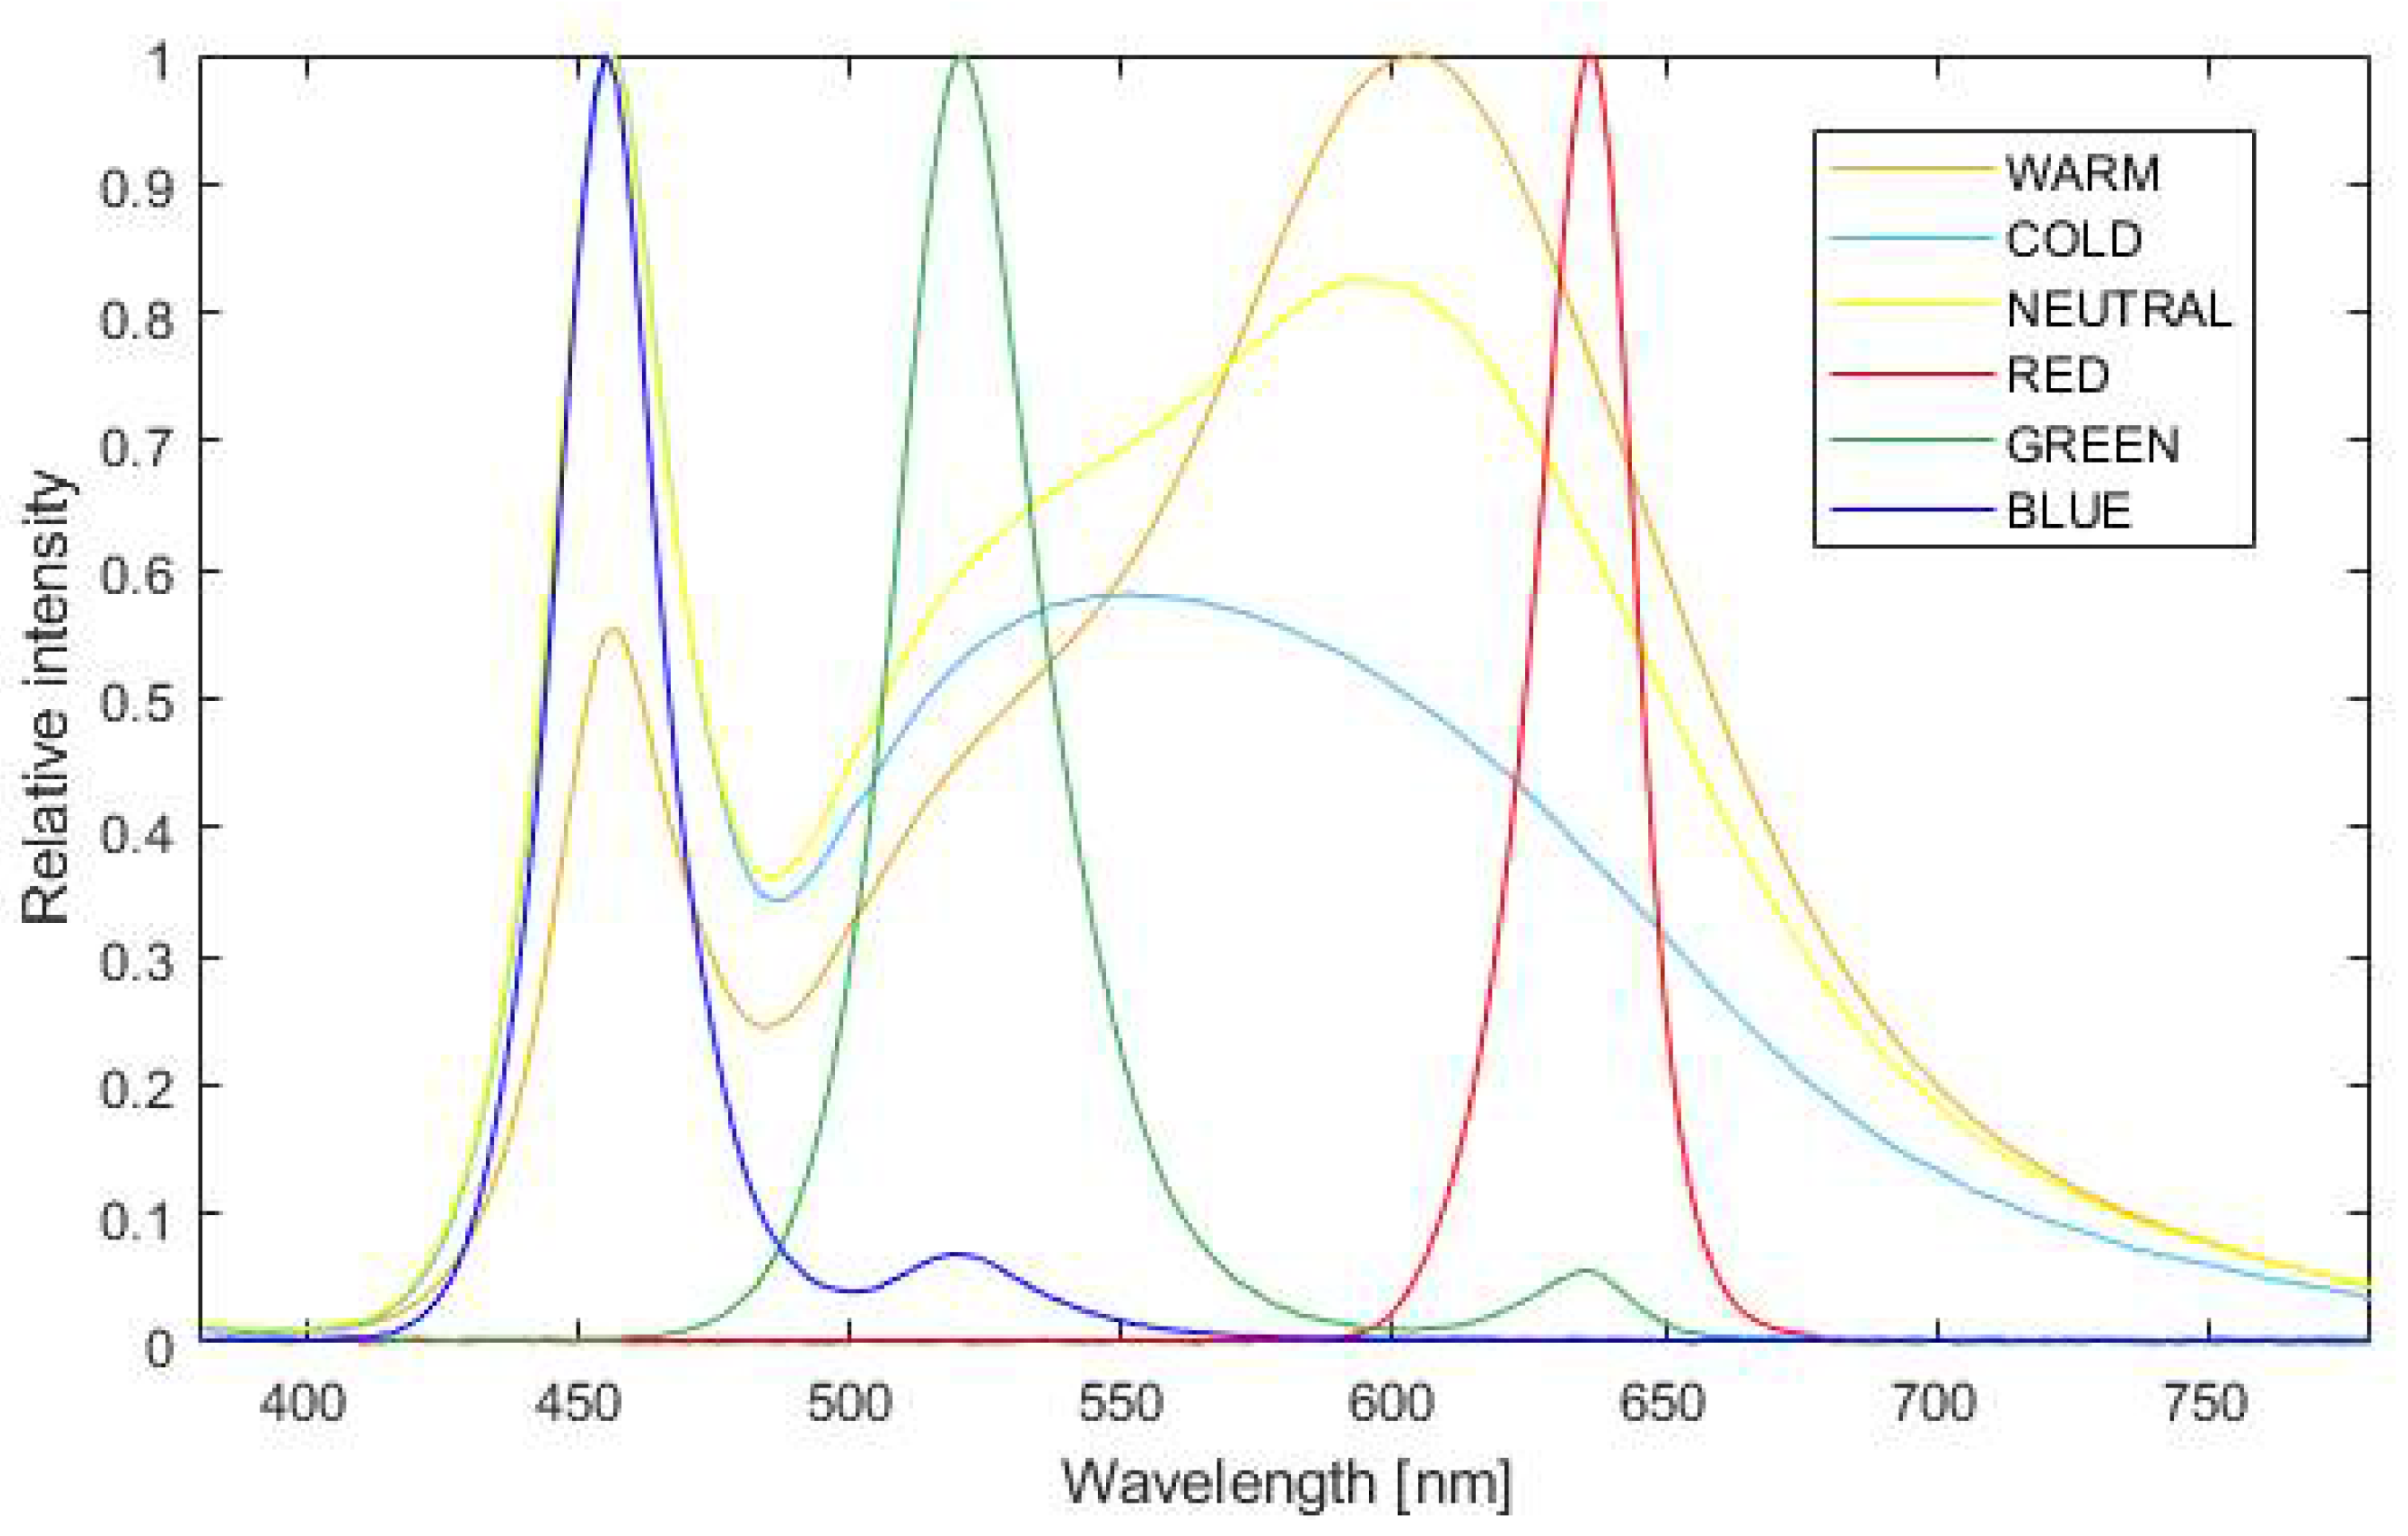
The measurement results are presented in Figure 7 and Table 3. The same source settings were used to illuminate particular scenes.

3. Results

The data collected during the laboratory studies served for the development of 7 sets of typical photogrammetric products. The results were developed using the commercial software Agisoft Metashape ver. 1.5.1. The mock-up’s visualisation for each set is presented in Figure 8.

3.1. Photometric Values of the Illuminated Scenes

Based on the conducted measurements, it must be stated that the greatest vertical illumination was obtained in scenes with a continuous spectrum NEUTRAL (29,160.8 lx). By contrast, the lowest illumination was obtained in the scene illuminated with RED (306.4 lx).
The highest CCT for white light with a continuous spectrum was recorded for the COLD scene (5961 K), while the lowest was obtained fromthe WARM scene (3066 K). In the case of monochromatic light, i.e., BLUE and RED, the CCT was 0 Kelvin. As can be concluded from the measurements that the GREEN scene was not characterised by a clear monochromatic green light. For this scene, the CCT was not 0, but 7841 K.
The greatest ability to provide the most faithful representation of the surface colours (CRI) was recorded for the NEUTRAL scene, for which the CRI was 88.35. The RED, GREEN and BLUE scenes demonstrated no ability to provide a faithful representation of colours. For these scenes, the CRI was 0.
An analysis of the tested lighting spectrum (Figure 7) demonstrated that the WARM, COLD and NEUTRAL scenes featured a continuous spectrum, in the visible light range of 380–780 nm. In the used LED light-source technology, white light was obtained by mixing adequate ratios of light from particular red, green and blue LED diodes and adding warm white LEDs or cool white LEDs. In order to obtain warmer light, the radiation intensity of the blue LED diode (blue spectrum range) was reduced, which can be easily observed in the plot (Figure 7) for the WARM scene (wavelength 450 nm).
For the RED scene, the light was monochromatic and featured a discontinuous spectrum. On the other hand, in the GREEN scene, the source included not only the value from the green range, but also a small portion of the red range (wavelength 620–650 nm). This may evidence the not entirely monochromatic specification of the green LED diode in the source or imprecise GREEN settings for the source, where the LED source’s internal software provided a low current intensity to the red LED diode. The same phenomenon was observed for the BLUE scene. In these settings, the green LED diode interfered with the purely monochromatic lighting specification. This interference is negligibly small, i.e., below 0.05 of relative intensity. Due to the negligibly low relative intensity, it is possible to state that the used coloured lighting was monochromatic.
The peak light wavelength for the WARM scene was 603 nm, while for the COLD scene, 455 nm, and for the NEUTRAL scene, 454 nm. In the case of coloured light, these values were 635 nm, 520 nm, 545 nm for the RED, GREEN and BLUE scenes, respectively.

3.2. Overall Study Results

The overall results presented in this section are derived from the part of activities performed using the photogrammetric software and the generated reports. The study’s basic data is presented in Table 4. As demonstrated by the analysis of the results, in the case of the “Dark” study, one image was not taken into consideration in the calculations, which narrowed the study area. This data loss did not occur in cases where the scene was additionally illuminated. Moreover, in the case of the study conducted without additional illumination, the recording height designated by the program differed substantially (~5 cm), while in subsequent scenes the values were similar. The case is similar for the reprojection error, XY error and XYZ total error values. There were substantial differences in the quantities of Tie points and projections. In the case of the white light illumination, the quantities were several times higher than in cases illuminated with coloured (monochromatic) lighting. There are also differences in the number of detected F-points, depending on the study type.
Table 5 presents the XYZ total error values for the F-points in all cases. The data was used for further analyses. If a given F-point was not detected by the software’s algorithm, the error value in the table was marked as NaN. The greatest errors are noticeable in the DARK study, where the XYZ total error exceeded the limit of 1.00 cm three times. In one case, it even amounted to 1.70 cm (F-point 32). For other studies, the limit of 1.00 cm was only exceeded once (COLD—F-point 30). The XYZ total error usually did not exceed 0.50 cm.
Another list (Table 6) presents the lighting intensity (E), correlated colour temperature (CCT) and colour rendering index (CRI) used for the scene’s illumination along with the data on the number of tie points, projections, luminosity of the entire tie-point cloud (MeanL2 CP), as well as internal camera orientation and distortion parameter designation errors.
An analysis of the above list showed that the differences in the focal point F values are substantial. As demonstrated earlier by Zhou et al. [70], the focal point F designation error translates into the study’s geometry. In the discussed cases, the focal point F designation error is even approximately seven times greater for a dark, unilluminated scene than in studies where various types of white light were used. If the scene was illuminated with coloured LED light with a continuous light spectrum of lower intensity, the error was only two to three times higher. It is important to note that the higher the white light intensity, the lower the internal orientation and distortion parameters designation errors. Regardless of the number of tie points and projections, MeanL2 CP maintains an inverse dependency.
The CRI index demonstrated the highest values for the continuous white light. As can be noted in the case of the COLD and NEUTRAL studies, where the CRI was 87.20 Ra and 88.35 Ra, respectively, the internal orientation parameters designation errors were lower than in the case of the WARM study, where the CRI was 83.65 Ra. The number of tie points and projections demonstrates the desired higher values for the COLD and NEUTRAL studies. It is possible to make a preliminary conclusion that the light sources used for the scene’s illumination should have their CRIs approach 100 Ra, thereby enabling the maximum extent of representation of the natural colours of the recorded objects and minimisation of the study’s geometric errors. In consequence, the E and CRI values constitute important parameters that must be taken into account during the selection of a scene’s artificial lighting. It must be noted that, at a high light intensity, many non-monochromatic light sources provide good colour representation, therefore, the E and CRI values are not as impactful on a study’s geometry. However, at low light intensity, light sources usually do not provide a good representation of colours, therefore it is useful to minimise these values.
In terms of CCT, no dependency between this parameter and the parameters characterising the study’s geometry was observed.

3.3. Analysis of the F-Points’ Detection Ability

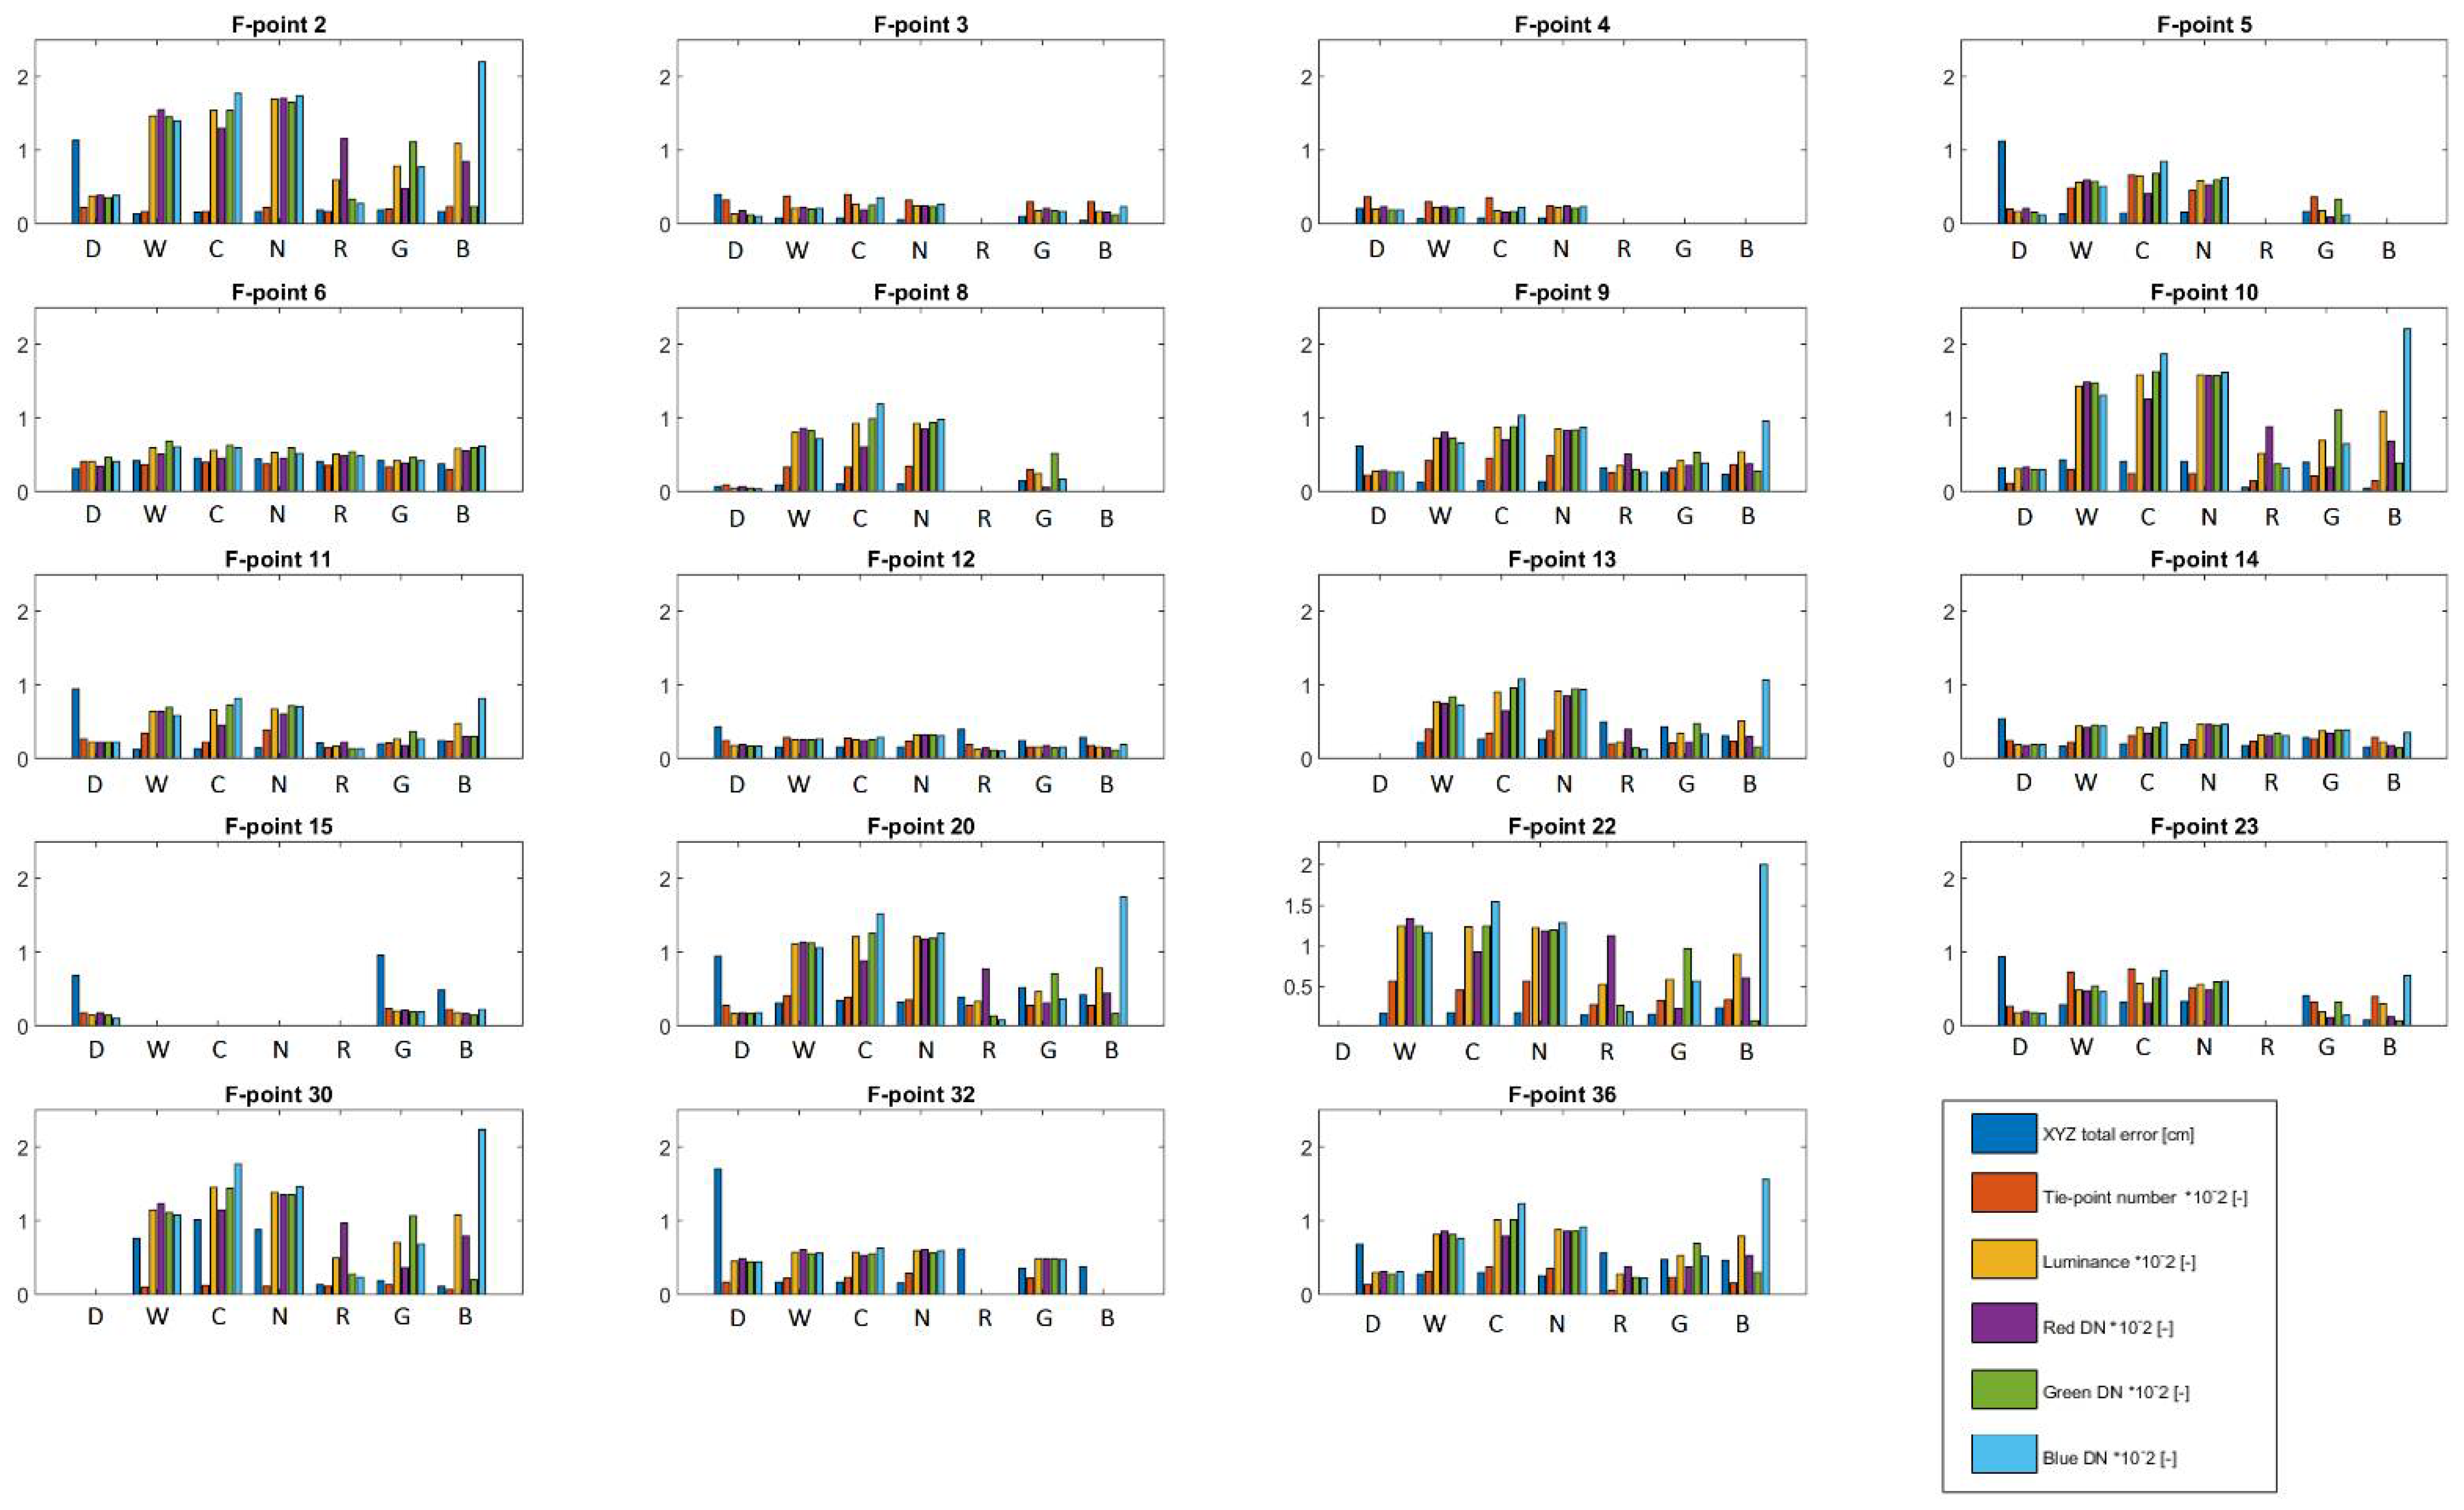
In the preliminary stage of the detailed analysis, after obtaining the tested features for all F-points, their values were compared in the form of plots presented in Figure 9.
As can be noted, the points can be divided into two groups. The first group includes points that, regardless of the case, have comparable results in terms of the obtained features (F-points no. 3, 4, 12, 14). The other group includes points with substantial differences in their features (F-points no. 2, 5, 9, 10), depending on the case. When analysing the position of the selected points, it is possible to state that the first group includes fewer illuminated points, while the second group includes points with better exposure to the used additional artificial light (Figure 9 presents the complex specification and relation of the values presented in the plot). This fact confirms that the analyses of the ability to detect F-points and dependencies between the XYZ total error, number of tie-points, features specifying the luminosity and colour of the F-point’s vicinity are absolutely reasonable.
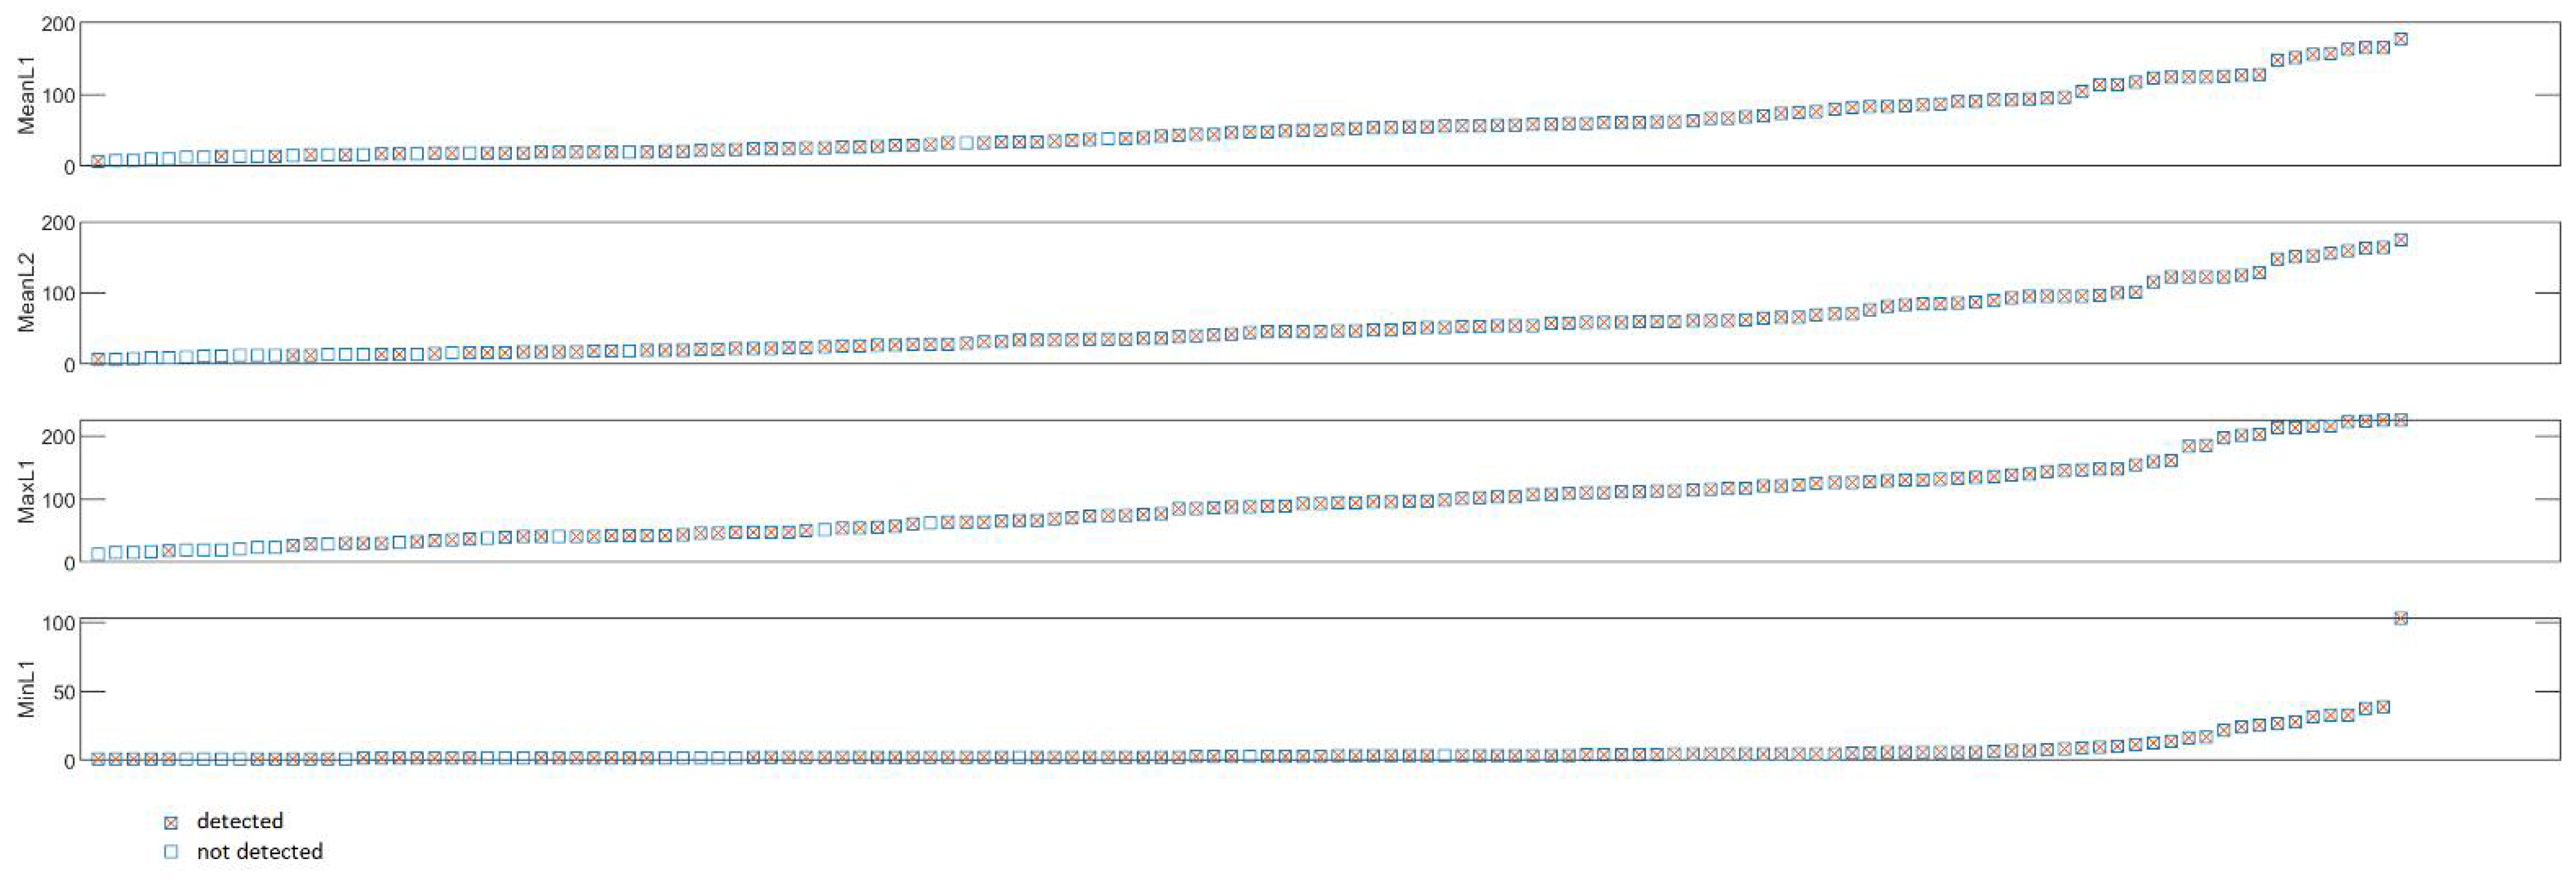
In order to further verify the ability to detect F-points depending on the defined features, suitable plots representing the F-points’ feature values along with information on whether the point was detected (blue square with a red cross) or not detected (empty blue square) were developed. The plots are presented in Figure 10. The sequence of the F-points in the presented plots depends on the size of the tested feature.
The plots presented above (Figure 10) demonstrate that the distribution of F-point detection results was least random for the MeanL2 feature. This points to the fact that F-point detection depends mostly on this feature. Other features did not demonstrate such a strong dependency.
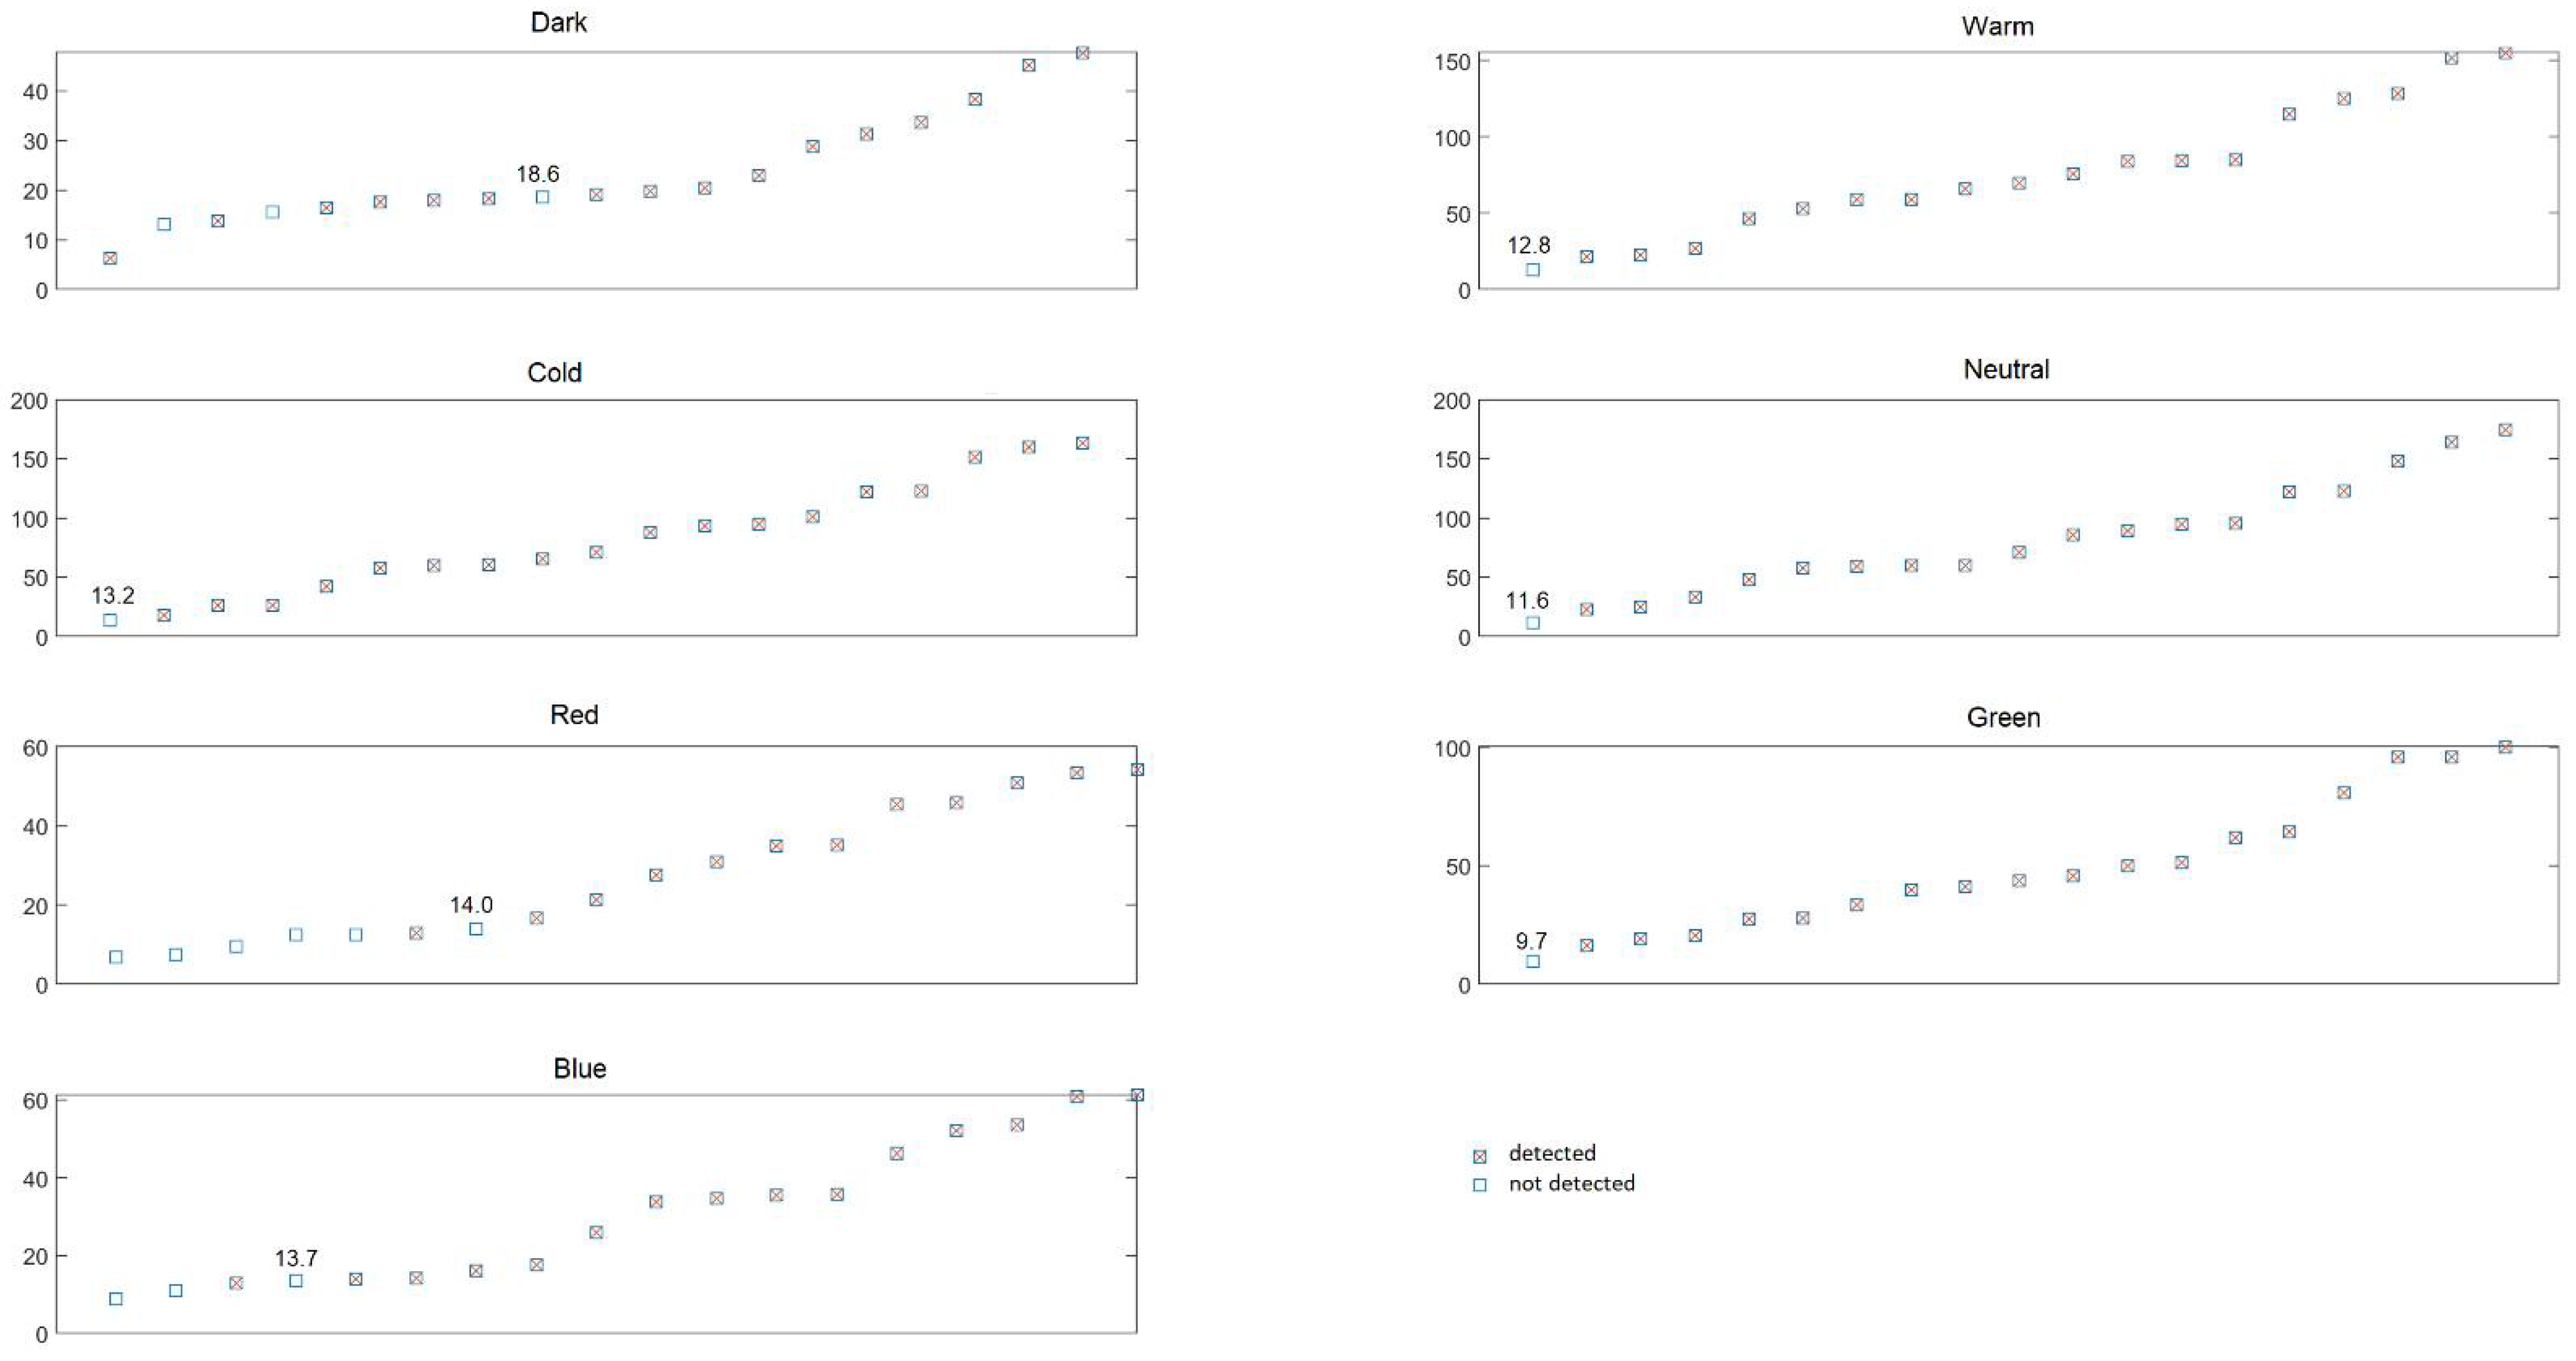
Analogous comparisons for features related to the values recorded by the camera’s matrix, i.e., the spectral response for the red, green and blue colours, are presented below (Figure 11, Figure 12 and Figure 13).
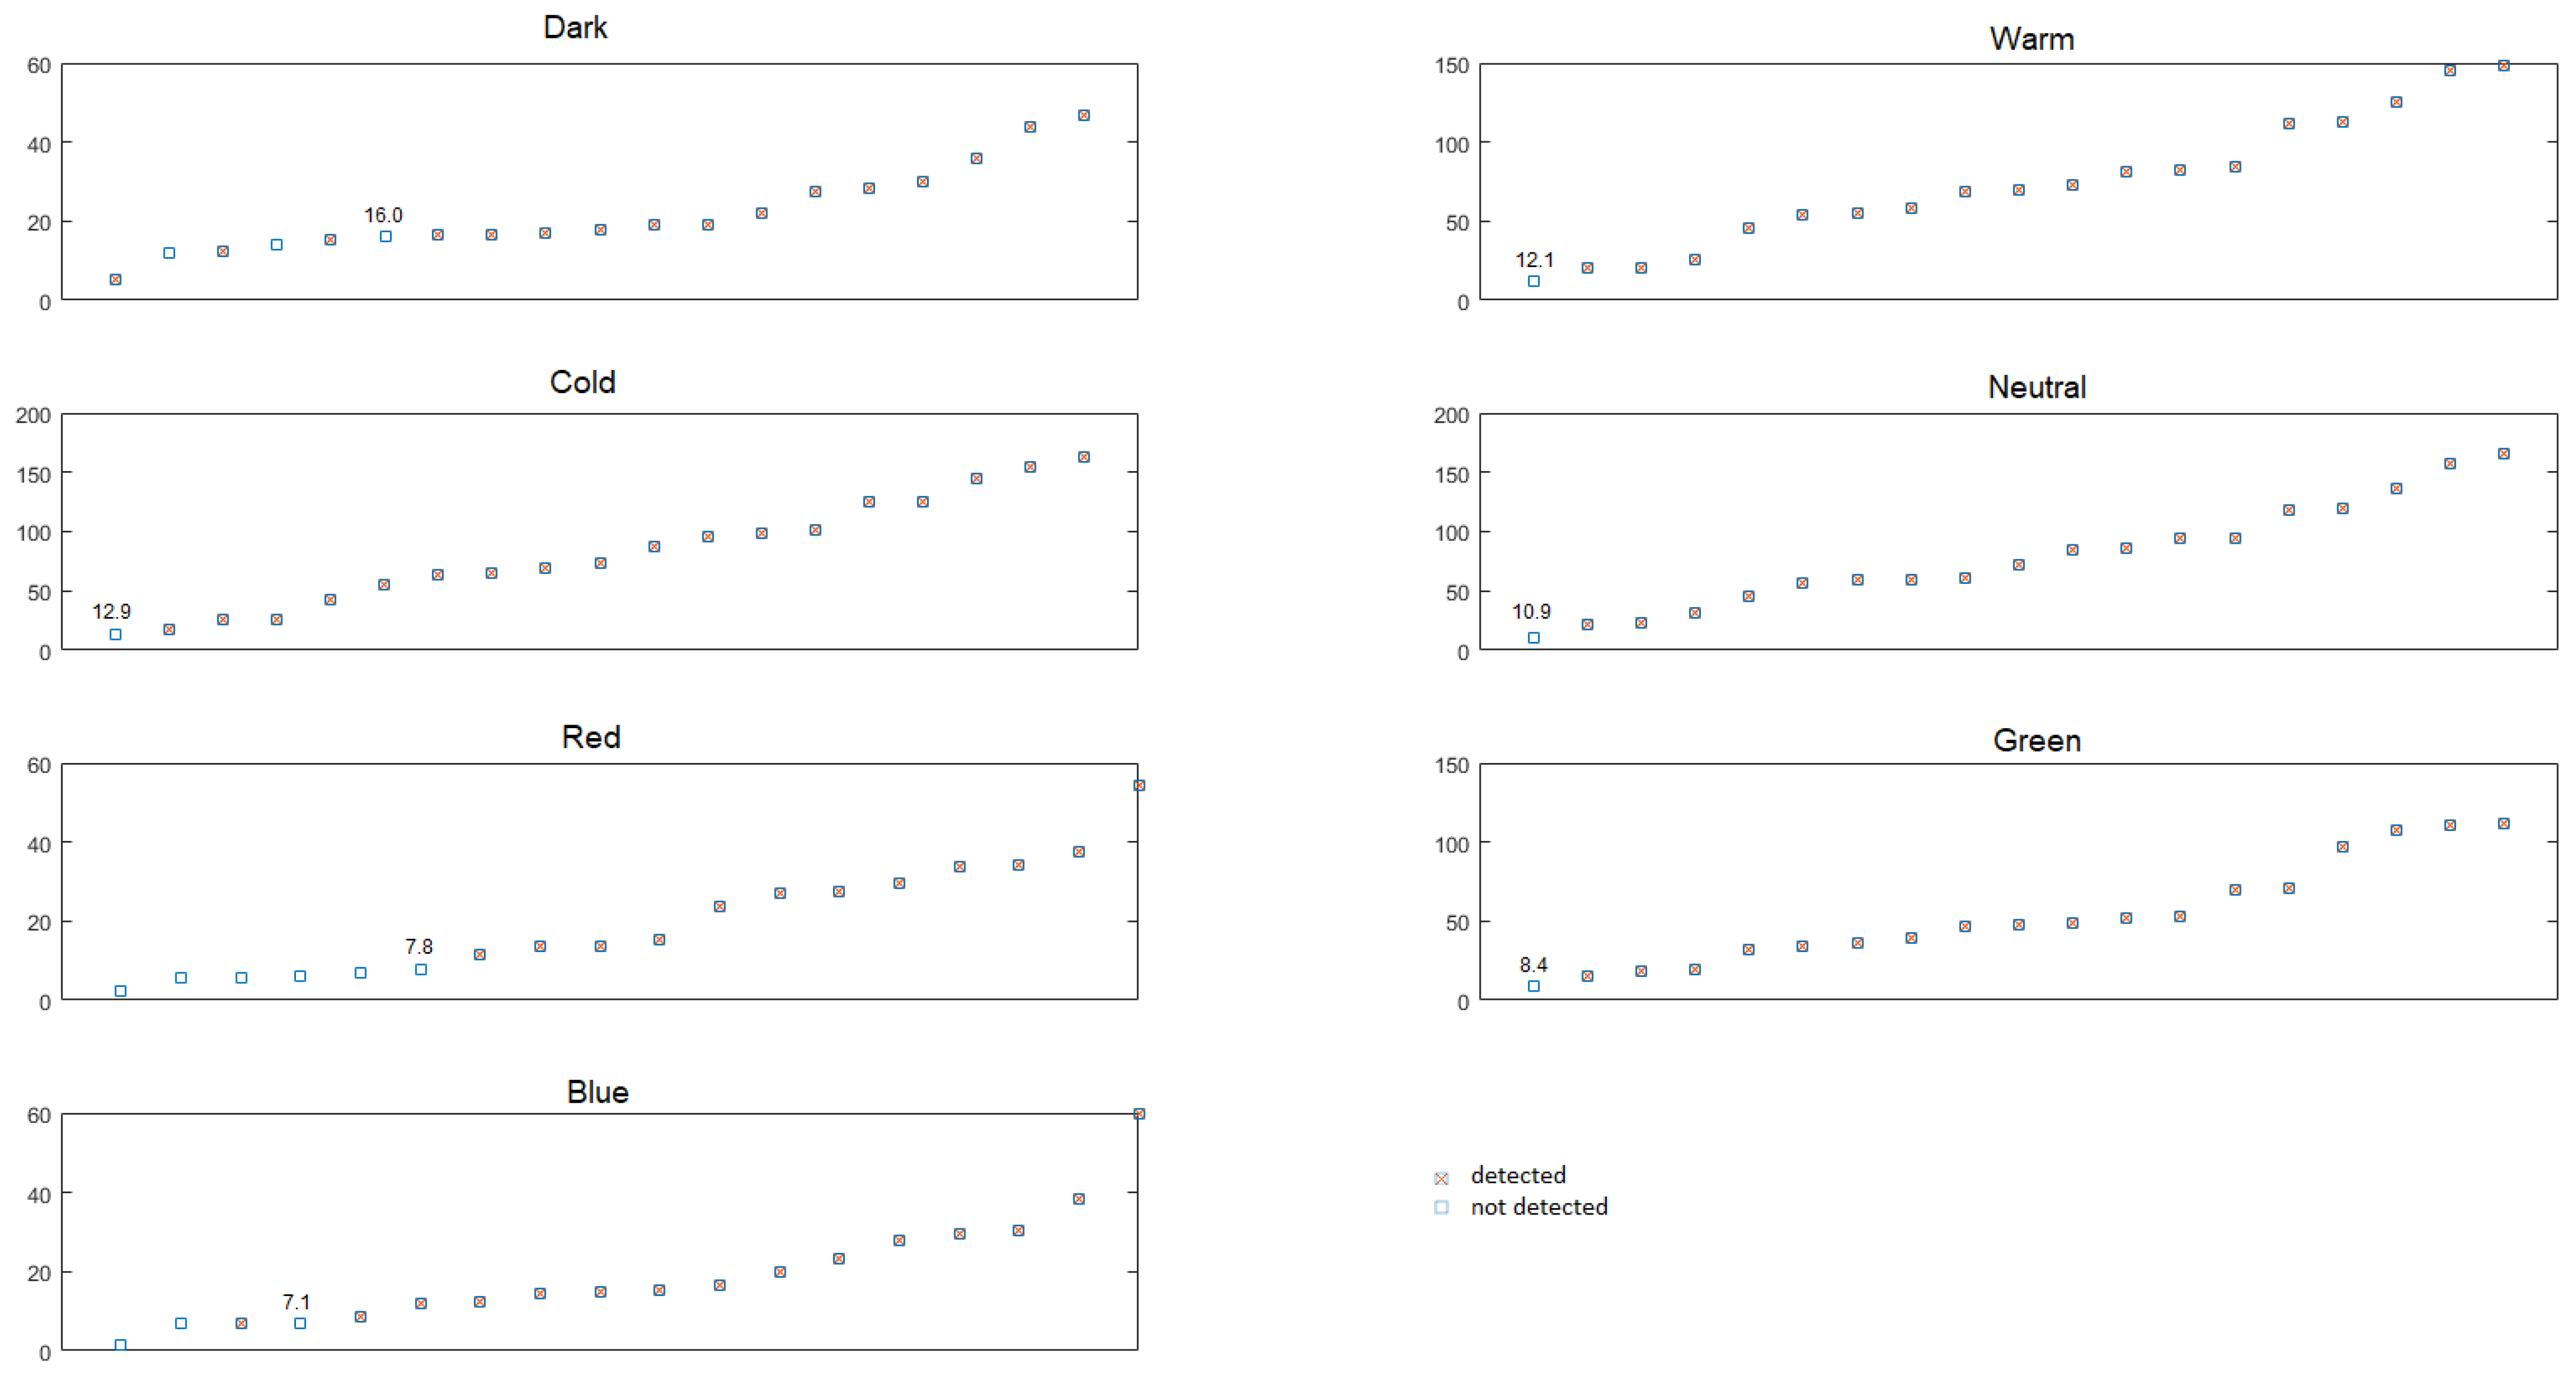
It is possible to note, in the above plots, that the highest number of undetected F-points (empty squares) occurred when the objects were recorded in the blue colour range (Figure 13). It is impossible to state which of the parameters (MeanB, MaxB, MinB) was more or less dependent. When recording objects in the red colour range (Figure 11), it is possible to pinpoint several points with high MeanR, MaxR and MinR values for the F-points that were not detected. Nevertheless, most undetected F-points are rather characterised by very low values of the features. The most clustered undetected F-points can be found in Figure 12, in the case of recording the objects’ spectral response in the green colour range. Here, it is possible to pinpoint the greatest dependency between the detected F-point and the green colour recording by the matrix. In this case, the undetected points are clearly grouped in the plot’s bottom section, which means that the features related to the green colour can also be taken into account in the specification of the minimum F-points’ detection parameters. This dependency will be discussed later in this paper.
The latter part of the study features a division of the results by study type, which is presented in Figure 14 and Figure 15.
According to earlier findings, the undetected points for the MeanL2 feature (Figure 10) and green colour spectral response analysis features (Figure 12) were the most focused. The MeanL2 feature was selected for the purpose of this comparison. Figure 14 shows that F-points could be detected when their MeanL2 feature is higher than 18.6 in all studies, while the value is lower—MeanL2 should be higher than 14.0—when using artificial lighting.
The division into dark and illuminated studies is also visible when analysing the MeanG feature (Figure 15). In the case of the dark study, it is possible to state that the F-points’ detection required the MeanG feature to be higher than 16.0, while in the case of illumination, the value needed to be higher than 12.9. In terms of the main objective of this research, it is already possible to specify the F-point features that must be met to detect a given point.

3.4. Analysis of the Tie-Points’ Density in the F-Points’ Vicinity and Accuracy Analysis

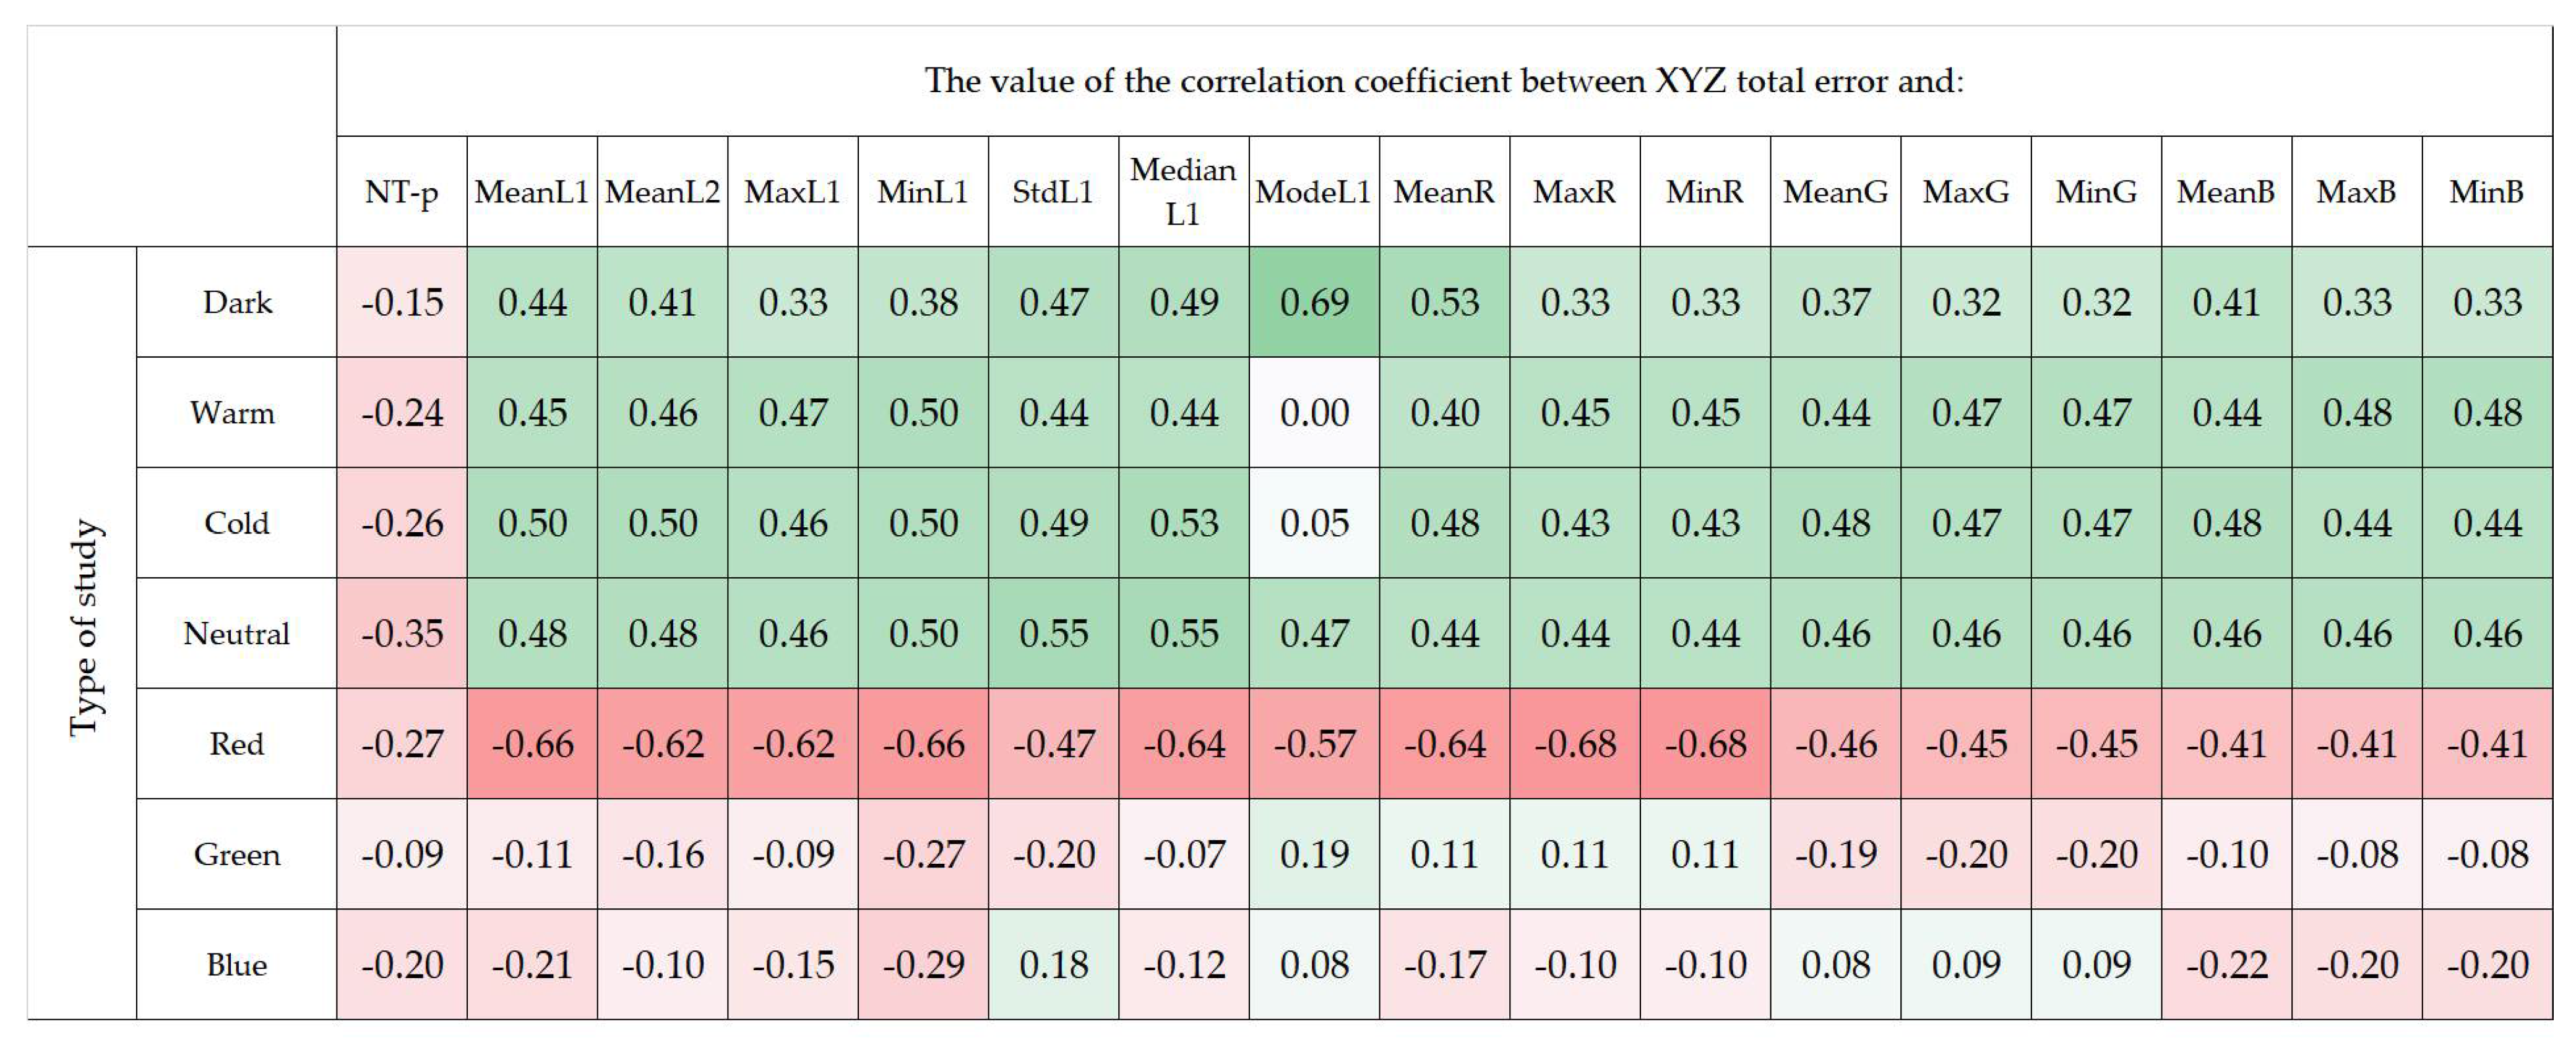
Figure 16 and Figure 17 present the list of correlation coefficients for all studies, depending on the XYZ total error and number of tie-point.
An analysis of the above data for all cases shows that there is a very low correlation for all features. The only deviating value is the inverse low correlation (−0.273), between the XYZ total error and the number of tie-points (NT-p), which means that a lower number of tie-points in the F-points’ vicinity increases the XYZ total error.
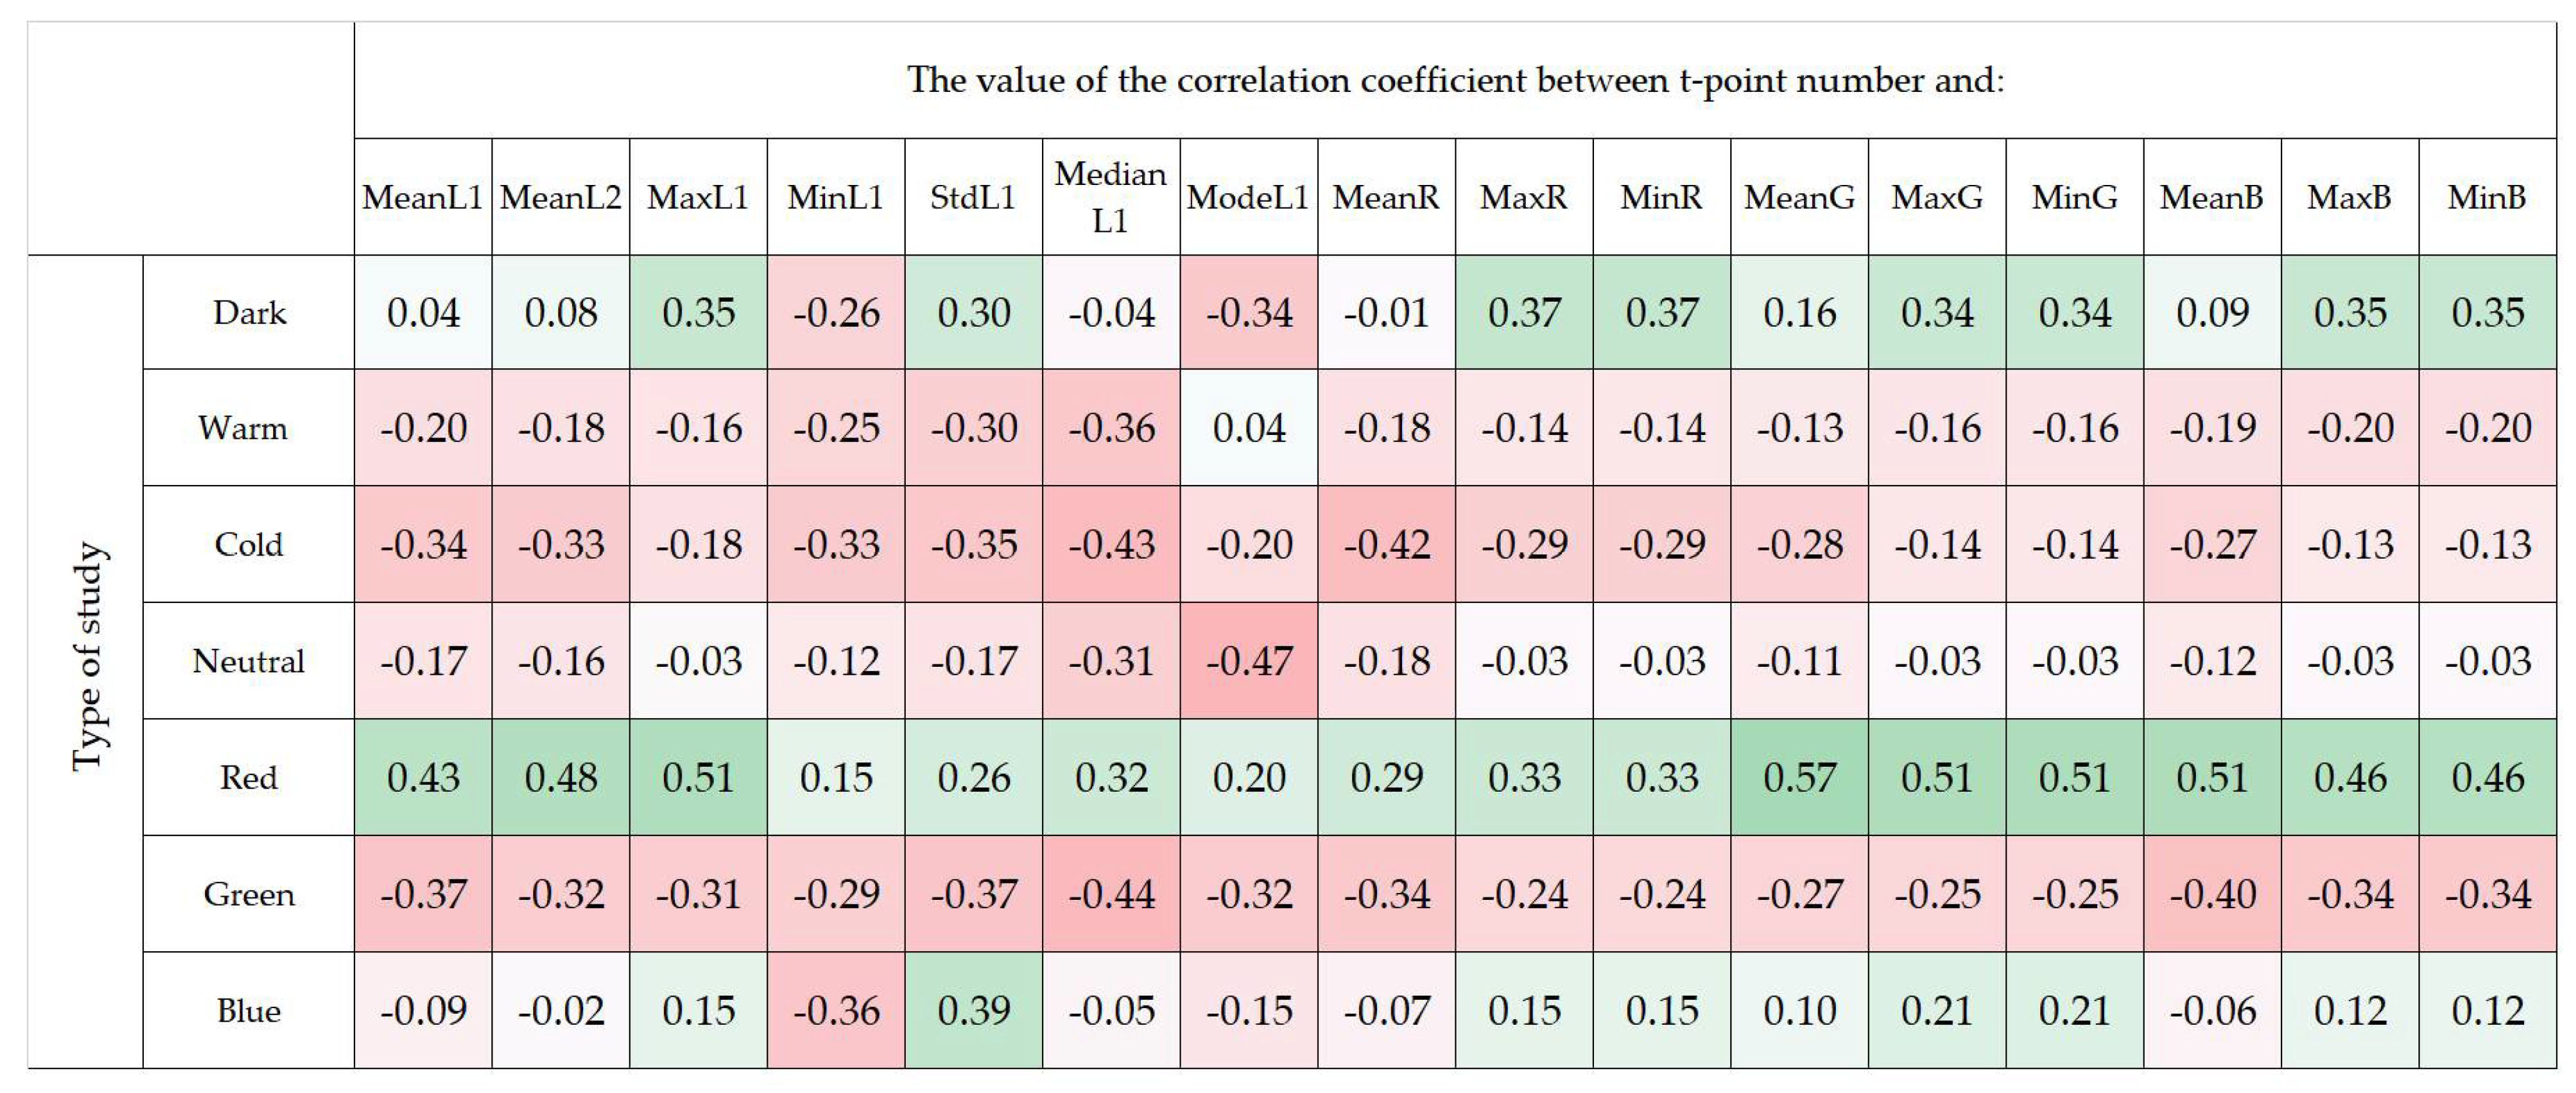
Further verification of the correlations for all cases between the number of tie-points and the F-points’ features (Figure 17) demonstrated a rather low Pearson correlation coefficient, of no more than +/−0.30. The low dependency demonstrates a certain trend that, together with the earlier analysis of the NT-p and XYZ total error dependency, allows for the statement that an increase in the number of tie-points mostly depends on the MeanG feature, which was earlier confirmed. This allows for the statement that a higher MeanG value will minimise the XYZ total error, thereby having a positive impact on the geometry and quality of the photogrammetric study. Following this conclusion, the correlation values were divided and assigned to the given study type, as presented in Figure 18.
Figure 18 confirms the fact of a low inverse correlation between the XYZ total error and the number of tie-points regardless of the study type. In the case of the Dark, Warm, Cold and Neutral studies, it is possible to state that there was the mean correlation between the XYZ total error and the luminosity and spectral response values for R, G and B. An interesting fact is that the correlation is clearly inverted if the scene is illuminated with a monochromatic light source (Red, Green, Blue studies). The strongest inverse correlation is demonstrated by the comparisons made for the Red study.
The next figure (Figure 19) presents the comparison of the number of tie-points with other F-point features by study.
When assessing the above correlations for all values (regardless of the point type), the dependencies are rather weak. It is possible to notice that there was a mean inverse correlation for the dependency between the number of tie-points and some features concerning the luminosity and spectral response for R, G and B in the case of the Warm, Cold, Neutral and Green studies, i.e., in studies where the intensity of the additional light sources was high and amounted to 28,750 lx, 28,580 lx, 29,160 lx, 911 lx, respectively. The Red study demonstrates an inverse correlation for all values.
The next step of the analysis was comparison of the same dependencies with division along particular F-points. The results are presented in Figure 20 and Figure 21, below.
The above analysis, divided along particular F-points, demonstrates that the earlier correlation analyses for the XYZ total error, in which the result pointed to a low inverse dependency, were not identical for all F-points. This typically points to the F-points’ local features that occur in a certain vicinity with less or more illumination. The obtained correlation coefficients between the XYZ total error and most features concerning the luminosity and the recorded spectral response for most F-points point to inverse correlations of various strength. Some points strongly deviate from the norm (F-points: 6, 10, 15, 30) and demonstrate a substantially higher XYZ total error.
Taking into account the analyses of the dependencies between the number of tie-points and other features as divided along particular F-points, it is possible to notice that most of these points and features maintained a high positive correlation, thereby indicating that the higher the values recorded by the sensor (which translates into the features concerning the points’ luminosities), the more tie-points were detected by the program. The results for F-points 2, 4, 6, 14, 30 did not confirm this rule, as they show that fewer tie-points were detected in the vicinity of these points, thereby substantially increasing their XYZ total error.

4. Limitations of the Study

This section presents the limitations of the presented research in terms of the tested scenes, equipment and its technical parameters and settings.
The conducted tests were not performed in natural and typical conditions for photogrammetric tasks, such as urban areas, engineering structures or museum exhibits and with many various objects. This is a limitation, to a certain degree, as it can slightly narrow the view of the features under the used artificial lighting. Nevertheless, the conducted analysis has potential, especially in terms of using various types of lighting, to obtain high-quality photogrammetric products and products dedicated to artificial lighting monitoring. In the future, it seems to be reasonable and important to conduct studies on the use of various light sources in a real, urbanised environment. Therefore, we will continue the initiated study process.
We used only one ensemble of settings for the camera exposure parameters for all seven lighting conditions. The study was conducted with the use of a single photogrammetric program, i.e., the Agisoft Metashape, which limits the results’ sole dependency on the algorithms proposed by the software’s manufacturer. The camera sensor type was also unchanged and no analyses were conducted in this regard.
The calibration of spectrometer was performed using incandescent-based standards, and there is no single spectral power distribution that would be representative of all white LED sources [71].
The mock-up measurements did not feature the use of black matt fabric to avoid any reflectance around the mock-up, as in the example from [72]. The mock-up was not perfectly isolated against reflections occurring between its surrounding elements. The measurements conducted in such a set-up can, therefore, be affected by light reflections from the floor surface or other laboratory elements. In addition, due to the lateral location of the light sources (only on one side), the mock-up was not illuminated evenly across its entire area, which can impact measurement quality due to the high lighting contrast ratio for some F-points, which was demonstrated in the Results section.
It must also be noted that the selection of colours (red, green, blue) in the applied commercial and popular lighting sources was made using a mobile application. This fact makes it impossible to provide a purely monochromatic light colour in this source. The used LED light source featured a milky polycarbonate diffuser that may have affected the results of all five measured values presented in Table 3 and Figure 7, due to the used material’s transmission factor.

5. Conclusions

We analysed a series of cases with different lighting scenes of a 3D urban lighting mock-up, as presented. It was demonstrated that a scene’s lighting colour and intensity affects the accuracy of a photogrammetric study, thereby answering the research question posed in the introduction. The paper featured a detailed specification of the dependencies between various study types: using various scene-lighting types and without artificial lighting, and the study’s overall quality, ability to detect F-points and the number of tie-points in their vicinity. The most important conclusions include the fact that the higher the additional lighting intensity, the higher the mean luminosity of the scene and the higher the number of tie-points, which directly translates into accuracy. In this context, the conclusions are confirmed by the work of the authors of [11], which also demonstrates that a higher luminosity (brightness of the studied object or area) enables the program to detect more tie-points. This is strictly related to the lack of resistance of the matching process in the software, which utilises the SIFT algorithm, against low luminosity and contrast images [73,74,75]. We have demonstrated that the greater the illuminated scene’s intensity (E), the greater the mean point cloud luminosity.
Another conclusion drawn in these studies is the determination of the F-points’ features that had to be met to enable the F-points’ detection. The defined features considered were MeanL2 and MeanG, wherein MeanL2 had to be higher than 14.0 or MeanG higher than 12.9 for illuminated scenes.
The proposed approach for assessing the aforementioned indices was determined for the purpose of these studies and, according to the authors’ best knowledge, the available scientific elaborations feature no adequate equivalents. These features can be useful in planning the F-points’ locations and methods of their illumination, if necessary, and more importantly, in their validation in terms of usefulness in the photogrammetric aero-triangulation process. The paper’s conclusions also demonstrate the importance of planning the F-points’ distribution in terms of a scene’s lighting. In difficult lighting conditions, where the environment’s relative luminosity is lower than 12.9, the F-points cannot be distributed randomly and must take into account their local illumination or placement in already-illuminated spots.
The Pearson correlation coefficients calculated for all cases confirmed the low inverse correlation between the XYZ total error and the number of tie-points in their vicinity, as well as the low correlation between the XYZ total error and the number of tie-points in the F-point’s vicinity and other F-point features. A relatively strong correlation occurred between the XYZ total error and the number of tie-points (NT-p), which means that a lower number of tie-points in the F-point’s vicinity increases the XYZ total error. Additional analyses for single F-points, depending on the study type, reached similar conclusions and also showed the local nature and impact of the F-points’ surroundings on the study’s accuracy and quality.
The scene’s illumination type and specific parameters for LED light sources, such as CRI and SPD, are important elements in a photogrammetric study, especially for objects placed in low lighting conditions. The rather popular CCT parameter, which is often specified for commercial light sources indoors and outdoors, does not accurately represent the light spectrum; instead, it only represents the sensory perception of its colour [2]. The parameter’s values can be misleading because the same CCT can be accompanied by completely different SPD and also CRI. Therefore, in photogrammetry with additional lighting, it is strictly necessary to take into account the lighting’s CRI and SPD parameters, which is also deemed as an important result of these studies.
Vertical light intensity (E) is equally important as the light-source colour representation properties (CRI). At high light intensity, many non-monochromatic light sources are usually good at representing colours, while no light source represents colours well in weak lighting conditions.

Future Research

The studies conducted by the authors allowed for drawing many interesting conclusions as well as formualting plans and ideas for further research to improve the knowledge on the dependencies between the lighting of a 3D urban mock-up and the quality of the photogrammetric study thereof. In future research, we plan to conduct detailed measurements with the use of unmanned aerial vehicle (UAV) in real-life conditions. Ultimately, such analyses can be used to develop a method of monitoring artificial lighting at night, with a strong emphasis on protection against light pollution [76,77].
The so-called scene overexposure can be a problem, though not observed here, would require analysing the top range, around the maximum luminosity for F-points, that still enables their detection. In addition, it is also necessary to analyse the impact of the scene’s overexposure on its geometry.

Author Contributions

Conceptualization, K.B., P.B. and K.M.Z.-D.; methodology, K.B., P.B., J.S. and K.M.Z.-D.; software, K.B.; validation, K.B., P.B. and K.M.Z.-D.; formal analysis, K.B., P.B. and K.M.Z.-D.; investigation, K.B., P.B., J.S. and K.M.Z.-D.; resources, K.B. and P.B.; data curation, K.B. and P.B.; writing—original draft preparation, K.B., P.B., J.S. and K.M.Z.-D.; writing—review and editing, K.B., P.B. and K.M.Z.-D.; visualization, K.B.; supervision, K.B.; project administration, K.B.; funding acquisition, K.B. All authors have read and agreed to the published version of the manuscript.

Funding

Financial support of these studies from Gdańsk University of Technology by the DEC-42/2020/IDUB/I.3.3 grant under the ARGENTUM—‘Excellence Initiative-Research University’ program is gratefully acknowledged.

Institutional Review Board Statement

Not applicable.

Informed Consent Statement

Not applicable.

Acknowledgments

We would like to acknowledge eng. Karol Rudziński for technical support.

Conflicts of Interest

The authors declare no conflict of interest.

References

  1. Sekrecka, A.; Wierzbicki, D.; Kedzierski, M. Influence of the Sun Position and Platform Orientation on the Quality of Imagery Obtained from Unmanned Aerial Vehicles. Remote Sens. 2020, 12, 1040. [Google Scholar] [CrossRef] [Green Version]
  2. Zielinska-Dabkowska, K.M. Make lighting healthier. Nature 2018, 553, 274–276. [Google Scholar] [CrossRef] [PubMed]
  3. Zielinska-Dabkowska, K.M.; Xavia, K. Protect our right to light. Nature 2019, 568, 451–453. [Google Scholar] [CrossRef] [PubMed]
  4. Kenarsari, A.E.; Vitton, S.J.; Beard, J.E. Creating 3D models of tractor tire footprints using close-range digital photogrammetry. J. Terramechanics 2017, 74, 1–11. [Google Scholar] [CrossRef]
  5. Paixão, A.; Resende, R.; Fortunato, E. Photogrammetry for digital reconstruction of railway ballast particles—A cost-efficient method. Constr. Build. Mater. 2018, 191, 963–976. [Google Scholar] [CrossRef]
  6. Caroti, G.; Piemonte, A.; Martínez-Espejo Zaragoza, I.; Brambilla, G. Indoor photogrammetry using UAVs with protective structures: Issues and precision tests. ISPRS—Int. Arch. Photogramm. Remote Sens. Spat. Inf. Sci. 2018, XLII-3/W4, 137–142. [Google Scholar] [CrossRef] [Green Version]
  7. Lato, M.J.; Bevan, G.; Fergusson, M. Gigapixel Imaging and Photogrammetry: Development of a New Long Range Remote Imaging Technique. Remote Sens. 2012, 4, 3006–3021. [Google Scholar] [CrossRef] [Green Version]
  8. Mathys, A.; Semal, P.; Brecko, J.; Van den Spiegel, D. Improving 3D photogrammetry models through spectral imaging: Tooth enamel as a case study. PLoS ONE 2019, 14, e0220949. [Google Scholar] [CrossRef] [Green Version]
  9. Abdelaziz, M.; Elsayed, M. Underwater photogrammetry digital surface model (DSM) of the submerged site of the ancient lighthouse near qaitbay fort in Alexandria, Egypt. Int. Arch. Photogramm. Remote Sens. Spat. Inf. Sci. 2019, XLII-2/W10, 1–8. [Google Scholar] [CrossRef] [Green Version]
  10. Bouroussis, C.A.; Topalis, F.V. Assessment of outdoor lighting installations and their impact on light pollution using unmanned aircraft systems—The concept of the drone-gonio-photometer. J. Quant. Spectrosc. Radiat. Transf. 2020, 253, 107155. [Google Scholar] [CrossRef]
  11. Burdziakowski, P.; Bobkowska, K. UAV Photogrammetry under Poor Lighting Conditions—Accuracy Considerations. Sensors 2021, 21, 3531. [Google Scholar] [CrossRef] [PubMed]
  12. Li, X.; Levin, N.; Xie, J.; Li, D. Monitoring hourly night-time light by an unmanned aerial vehicle and its implications to satellite remote sensing. Remote Sens. Environ. 2020, 247, 111942. [Google Scholar] [CrossRef]
  13. Rabaza, O.; Molero-Mesa, E.; Aznar-Dols, F.; Gómez-Lorente, D. Experimental Study of the Levels of Street Lighting Using Aerial Imagery and Energy Efficiency Calculation. Sustainability 2018, 10, 4365. [Google Scholar] [CrossRef] [Green Version]
  14. Alamús, R.; Pérez, F.; Pipia, L.; Corbera, J. Urban sustainable ecosystems assessment through airborne earth observation: Lessons learned. Int. Arch. Photogramm. Remote Sens. Spat. Inf. Sci. 2018, XLII-1, 5–10. [Google Scholar] [CrossRef] [Green Version]
  15. Zielinska-Dabkowska, K.M.; Xavia, K. Global Approaches to Reduce Light Pollution from Media Architecture and Non-Static, Self-Luminous LED Displays for Mixed-Use Urban Developments. Sustainability 2019, 11, 3446. [Google Scholar] [CrossRef] [Green Version]
  16. Zielińska-Dabkowska, K.M.; Xavia, K.; Bobkowska, K. Assessment of Citizens’ Actions against Light Pollution with Guidelines for Future Initiatives. Sustainability 2020, 12, 4997. [Google Scholar] [CrossRef]
  17. Hölker, F.; Wolter, C.; Perkin, E.K.; Tockner, K. Light pollution as a biodiversity threat. Trends Ecol. Evol. 2010, 25, 681–682. [Google Scholar] [CrossRef] [PubMed]
  18. Gaston, K.J.; Bennie, J.; Davies, T.W.; Hopkins, J. The ecological impacts of nighttime light pollution: A mechanistic appraisal. Biol. Rev. 2013, 88, 912–927. [Google Scholar] [CrossRef] [PubMed]
  19. Schroer, S.; Hölker, F. Impact of Lighting on Flora and Fauna. In Handbook of Advanced Lighting Technology; Springer International Publishing: Cham, Switzerland, 2017; Volume 88, pp. 957–989. [Google Scholar] [CrossRef]
  20. Owens, A.C.S.; Cochard, P.; Durrant, J.; Farnworth, B.; Perkin, E.K.; Seymoure, B. Light pollution is a driver of insect declines. Biol. Conserv. 2020, 241, 108259. [Google Scholar] [CrossRef]
  21. Zielinska-Dabkowska, K.M.; Bobkowska, K.; Szlachetko, K. An Impact Analysis of Artificial Light at Night (ALAN) on Bats. A Case Study of the Historic Monument and Natura 2000 Wisłoujście Fortress in Gdansk, Poland. Int. J. Environ. Res. Public Health 2021, 18, 11327. [Google Scholar] [CrossRef] [PubMed]
  22. Lalak, M.; Wierzbicki, D.; Kędzierski, M. Methodology of Processing Single-Strip Blocks of Imagery with Reduction and Optimization Number of Ground Control Points in UAV Photogrammetry. Remote Sens. 2020, 12, 3336. [Google Scholar] [CrossRef]
  23. Burdziakowski, P. Polymodal Method of Improving the Quality of Photogrammetric Images and Models. Energies 2021, 14, 3457. [Google Scholar] [CrossRef]
  24. Burdziakowski, P.; Tysiac, P. Combined Close Range Photogrammetry and Terrestrial Laser Scanning for Ship Hull Modelling. Geosciences 2019, 9, 242. [Google Scholar] [CrossRef] [Green Version]
  25. Janowski, A.; Szulwic, J.; Ziolkowski, P. Combined Method of Surface Flow Measurement Using Terrestrial Laser Scanning and Synchronous Photogrammetry. In Proceedings of the 2017 Baltic Geodetic Congress (BGC Geomatics), Gdansk, Poland, 22–25 June 2017; pp. 110–115. [Google Scholar] [CrossRef]
  26. Burdziakowski, P. Increasing the Geometrical and Interpretation Quality of Unmanned Aerial Vehicle Photogrammetry Products using Super-Resolution Algorithms. Remote Sens. 2020, 12, 810. [Google Scholar] [CrossRef] [Green Version]
  27. Wiącek, P.; Pyka, K. The test field for UAV accuracy assessments. ISPRS—Int. Arch. Photogramm. Remote Sens. Spat. Inf. Sci. 2019, XLII-1/W2, 67–73. [Google Scholar] [CrossRef] [Green Version]
  28. Jiménez-Jiménez, S.I.; Ojeda-Bustamante, W.; Marcial-Pablo, M.; Enciso, J. Digital Terrain Models Generated with Low-Cost UAV Photogrammetry: Methodology and Accuracy. ISPRS Int. J. Geo-Inf. 2021, 10, 285. [Google Scholar] [CrossRef]
  29. Burdziakowski, P.; Bobkowska, K. Accuracy of a low-cost autonomous hexacopter platforms navigation module for a photogrammetric and environmental measurements. In Proceedings of the Environmental Engineering 10th International Conference, Vilnius, Lithuania, 27–28 April 2017. [Google Scholar]
  30. Krasuski, K.; Wierzbicki, D. Application the SBAS/EGNOS Corrections in UAV Positioning. Energies 2021, 14, 739. [Google Scholar] [CrossRef]
  31. Damian Wierzbicki; Kamil Krasuski Determining the Elements of Exterior Orientation in Aerial Triangulation Processing Using UAV Technology. Commun.—Sci. Lett. Univ. Zilina 2020, 22, 15–24. [CrossRef]
  32. Specht, M. Consistency analysis of global positioning system position errors with typical statistical distributions. J. Navig. 2021, 1–18. [Google Scholar] [CrossRef]
  33. Specht, M.; Stateczny, A.; Specht, C.; Widźgowski, S.; Lewicka, O.; Wiśniewska, M. Concept of an Innovative Autonomous Unmanned System for Bathymetric Monitoring of Shallow Waterbodies (INNOBAT System). Energies 2021, 14, 5370. [Google Scholar] [CrossRef]
  34. Castilla, F.J.; Ramón, A.; Adán, A.; Trenado, A.; Fuentes, D. 3D Sensor-Fusion for the Documentation of Rural Heritage Buildings. Remote Sens. 2021, 13, 1337. [Google Scholar] [CrossRef]
  35. Abdelazeem, M.; Elamin, A.; Afifi, A.; El-Rabbany, A. Multi-sensor point cloud data fusion for precise 3D mapping. Egypt. J. Remote Sens. Sp. Sci. 2021. [Google Scholar] [CrossRef]
  36. Daakir, M.; Zhou, Y.; Pierrot Deseilligny, M.; Thom, C.; Martin, O.; Rupnik, E. Improvement of photogrammetric accuracy by modeling and correcting the thermal effect on camera calibration. ISPRS J. Photogramm. Remote Sens. 2019, 148, 142–155. [Google Scholar] [CrossRef] [Green Version]
  37. International Telecommunication Union Recommendation ITU-R BT.709-6(06/2015) Parameter Values for the HDTV Standards for Production and International Programme Exchange. Recommendation ITU-R BT.709-6. 2002. Available online: https://www.itu.int/rec/R-REC-BT.709 (accessed on 21 October 2021).
  38. Vaaja, M.T.; Maksimainen, M.; Kurkela, M.; Rantanen, T.; Hyyppä, H. Approaches for Mapping Night-Time Road Environment Lighting Conditions. ISPRS Ann. Photogramm. Remote Sens. Spat. Inf. Sci. 2020, 5, 199–205. [Google Scholar] [CrossRef]
  39. Cohen, J. Statistical Power Analysis for the Behavioral Sciences; Academic Press: Cambridge, MA, USA, 2013. [Google Scholar]
  40. Benesty, J.; Chen, J.; Huang, Y.; Cohen, I. Pearson Correlation Coefficient. In Noise Reduction in Speech Processing. Springer Topics in Signal Processing; Springer: Berlin/Heidelberg, Germany, 2009; Volume 2. [Google Scholar] [CrossRef]
  41. Mu, Y.; Liu, X.; Wang, L. A Pearson’s correlation coefficient based decision tree and its parallel implementation. Inf. Sci. 2018, 435, 40–58. [Google Scholar] [CrossRef]
  42. Bobkowska, K.; Janowski, A.; Przyborski, M.; Szulwic, J. The impact of emotions on changes in the correlation coefficient between digital images of the human face. In International Multidisciplinary Scientific GeoConference Surveying Geology and Mining Ecology Management; SGEM: Sofia, Bulgaria, 2017; Volume 17. [Google Scholar] [CrossRef]
  43. Bobkowska, K.; Janowski, A.; Przyborski, M. Image correlation as a toll for tracking facial changes causing by external stimuli. In Proceedings of the SGEM2015 Conference Proceedings, Albena, Bulgaria, 18–24 June 2015; Volume 1, pp. 1089–1096. [Google Scholar] [CrossRef]
  44. Näsi, R.; Viljanen, N.; Kaivosoja, J.; Alhonoja, K.; Hakala, T.; Markelin, L.; Honkavaara, E. Estimating biomass and nitrogen amount of barley and grass using UAV and aircraft based spectral and photogrammetric 3D features. Remote Sens. 2018, 10, 1082. [Google Scholar] [CrossRef] [Green Version]
  45. Janowski, A.; Kaminski, W.; Makowska, K.; Szulwic, J.; Wilde, K. The method of measuring the membrane cover geometry using laser scanning and synchronous photogrammetry. In Proceedings of the 15th International Multidisciplinary Scientific GeoConference-SGEM 2015, Albena, Bulgaria, 18–24 June 2015. [Google Scholar]
  46. Šarlah, N.; Podobnikar, T.; Ambrožič, T.; Mušič, B. Application of Kinematic GPR-TPS Model with High 3D Georeference Accuracy for Underground Utility Infrastructure Mapping: A Case Study from Urban Sites in Celje, Slovenia. Remote Sens. 2020, 12, 1228. [Google Scholar] [CrossRef] [Green Version]
  47. Sun, M.; Xu, A.; Liu, J. Line shape monitoring of longspan concrete-filled steel tube arches based on three-dimensional laser scanning. Int. J. Robot. Autom. 2021, 36. [Google Scholar] [CrossRef]
  48. Yaagoubi, R.; Miky, Y. Developing a combined Light Detecting And Ranging (LiDAR) and Building Information Modeling (BIM) approach for documentation and deformation assessment of Historical Buildings. MATEC Web Conf. 2018, 149, 02011. [Google Scholar] [CrossRef]
  49. Mihu-Pintilie, A. Genesis of the Cuejdel Lake and the Evolution of the Morphometric and Morpho-Bathymetric Parameters. In Natural Dam Lake Cuejdel in the Stânişoarei Mountains, Eastern Carpathians; Springer International Publishing: Cham, Switzerland, 2018; pp. 131–157. [Google Scholar] [CrossRef]
  50. Huseynov, I.T. The characteristic analysis of continuous light diodes. Mod. Phys. Lett. B 2021, 35, 2150247. [Google Scholar] [CrossRef]
  51. MK350D Compact Spectrometer. Available online: https://www.uprtek.eu.com/product/uprtek-portable-spectrometer-compact-mk350d/?gclid=CjwKCAjwn6GGBhADEiwAruUcKsFvHVwt3va3Wc5DXs8--FdD_tGSeltNnL5C2Qk4V_kwVzzsg25b6hoCBcYQAvD_BwE (accessed on 21 October 2021).
  52. Spectrum SMART LED Bulb 13W E-27 Wi-Fi/Bluetooth Biorhytm RGBW CCT DIMM. Available online: https://spectrumsmart.pl/en_GB/p/Spectrum-SMART-LED-bulb-13W-E-27-Wi-FiBluetooth-Biorhytm-RGBW-CCT-DIMM/30 (accessed on 21 October 2021).
  53. Pepe, M.; Costantino, D. Techniques, Tools, Platforms and Algorithms in Close Range Photogrammetry in Building 3D Model and 2D Representation of Objects and Complex Architectures. Comput. Aided. Des. Appl. 2020, 18, 42–65. [Google Scholar] [CrossRef]
  54. Kurkov, V.M.; Kiseleva, A.S. Dem accuracy research based on unmanned aerial survey data. ISPRS—Int. Arch. Photogramm. Remote Sens. Spat. Inf. Sci. 2020, XLIII-B3-2, 1347–1352. [Google Scholar] [CrossRef]
  55. Bakuła, K.; Pilarska, M.; Salach, A.; Kurczyński, Z. Detection of Levee Damage Based on UAS Data—Optical Imagery and LiDAR Point Clouds. ISPRS Int. J. Geo-Inf. 2020, 9, 248. [Google Scholar] [CrossRef] [Green Version]
  56. Han, S.; Hong, C.K. Assessment of parallel computing performance of Agisoft metashape for orthomosaic generation. J. Korean Soc. Surv. Geod. Photogramm. Cartogr. 2019, 37, 427–434. [Google Scholar] [CrossRef]
  57. Burdziakowski, P.; Zima, P.; Wielgat, P.; Kalinowska, D. Tracking Fluorescent Dye Dispersion from an Unmanned Aerial Vehicle. Sensors 2021, 21, 3905. [Google Scholar] [CrossRef] [PubMed]
  58. Almevik, G.; Westin, J. Crafting research communication in building history. Form Akad. Forsk. Des. Des. 2021, 14, 1–9. [Google Scholar] [CrossRef]
  59. Gonçalves, D.F.R. Impact of Image Acquisition Geometry and SfM-MVS Processing Parameters on the 3D Reconstruction of Coastal Cliffs. Universidade de Coimbra: Coimbra, Portuguese, 2020. [Google Scholar]
  60. Ben Ellefi, M.; Drap, P. Semantic Export Module for Close Range Photogrammetry. In European Semantic Web Conference; Springer: Cham, Switzerland, 2019; pp. 3–7. [Google Scholar] [CrossRef]
  61. Janowski, A.; Bobkowska, K.; Szulwic, J. 3D modelling of cylindrical-shaped objects from LIDAR data-an assessment based on theoretical modelling and experimental data. Metrol. Meas. Syst. 2018, 25, 47–56. [Google Scholar] [CrossRef]
  62. Bobkowska, K.; Bodus-Olkowska, I. Potential and Use of the Googlenet Ann for the Purposes of Inland Water Ships Classification. Polish Marit. Res. 2020, 27, 170–178. [Google Scholar] [CrossRef]
  63. Bobkowska, K.; Nagaty, K.; Przyborski, M. Incorporating iris, fingerprint and face biometric for fraud prevention in e-passports using fuzzy vault. IET Image Process. 2019, 13, 2516–2528. [Google Scholar] [CrossRef]
  64. Skarlatos, D.; Menna, F.; Nocerino, E.; Agrafiotis, P. Precision potential of underwater networks for archaeological excavation through trilateration and photogrammetry. ISPRS—Int. Arch. Photogramm. Remote Sens. Spat. Inf. Sci. 2019, XLII-2/W10, 175–180. [Google Scholar] [CrossRef] [Green Version]
  65. Honório, L.M.; Pinto, M.F.; Hillesheim, M.J.; de Araújo, F.C.; Santos, A.B.; Soares, D. Photogrammetric Process to Monitor Stress Fields Inside Structural Systems. Sensors 2021, 21, 4023. [Google Scholar] [CrossRef]
  66. Alfio, V.S.; Costantino, D.; Pepe, M. Influence of Image TIFF Format and JPEG Compression Level in the Accuracy of the 3D Model and Quality of the Orthophoto in UAV Photogrammetry. J. Imaging 2020, 6, 30. [Google Scholar] [CrossRef] [PubMed]
  67. Tabaka, P. Pilot Measurement of Illuminance in the Context of Light Pollution Performed with an Unmanned Aerial Vehicle. Remote Sens. 2020, 12, 2124. [Google Scholar] [CrossRef]
  68. Tabaka, P.; Rozga, P. Influence of a Light Source Installed in a Luminaire of Opal Sphere Type on the Effect of Light Pollution. Energies 2020, 13, 306. [Google Scholar] [CrossRef] [Green Version]
  69. Tabaka, P. Influence of Replacement of Sodium Lamps in Park Luminaires with LED Sources of Different Closest Color Temperature on the Effect of Light Pollution and Energy Efficiency. Energies 2021, 14, 6383. [Google Scholar] [CrossRef]
  70. Zhou, Y.; Rupnik, E.; Meynard, C.; Thom, C.; Pierrot-Deseilligny, M. Simulation and Analysis of Photogrammetric UAV Image Blocks—Influence of Camera Calibration Error. Remote Sens. 2019, 12, 22. [Google Scholar] [CrossRef] [Green Version]
  71. CIE Research Strategy on Defining New Calibration Sources and Illuminants. Available online: https://www.led-professional.com/resources-1/articles/cie-research-strategy-on-defining-new-calibration-sources-and-illuminants (accessed on 21 October 2021).
  72. Zielinska-Dabkowska, K.M.; Hartmann, J.; Sigillo, C. LED Light Sources and Their Complex Set-Up for Visually and Biologically Effective Illumination for Ornamental Indoor Plants. Sustainability 2019, 11, 2642. [Google Scholar] [CrossRef] [Green Version]
  73. Wang, H.; Jin, S.; Wei, X.; Zhang, C.; Hu, R. Performance evaluation of SIFT under low light contrast. In Proceedings of the MIPPR 2019: Pattern Recognition and Computer Vision, Wuhan, China, 2–3 November 2019; Liu, Z., Udupa, J.K., Sang, N., Wang, Y., Eds.; SPIE: Bellingham, WA, USA, 2020; p. 7. [Google Scholar] [CrossRef]
  74. Karami, E.; Prasad, S.; Shehata, M. Image Matching Using SIFT, SURF, BRIEF and ORB: Performance Comparison for Distorted Images. arXiv 2017, arXiv:1710.0272. [Google Scholar]
  75. Jia, Y.; Wang, K.; Hao, C. An Adaptive Contrast Threshold SIFT Algorithm Based on Local Extreme Point and Image Texture. In Proceedings of the 2019 IEEE International Conference on Mechatronics and Automation (ICMA), Tianjin, China, 4–7 August 2019; pp. 219–223. [Google Scholar] [CrossRef]
  76. Zielinska-Dabkowska, K.M.; Xavia, K. Looking up to the stars. A call for action to save New Zealand’s dark skies for future generations to come. Sustainability 2021. under review. [Google Scholar]
  77. Jägerbrand, A.K.; Bouroussis, C.A. Ecological Impact of Artificial Light at Night: Effective Strategies and Measures to Deal with Protected Species and Habitats. Sustainability 2021, 13, 5991. [Google Scholar] [CrossRef]
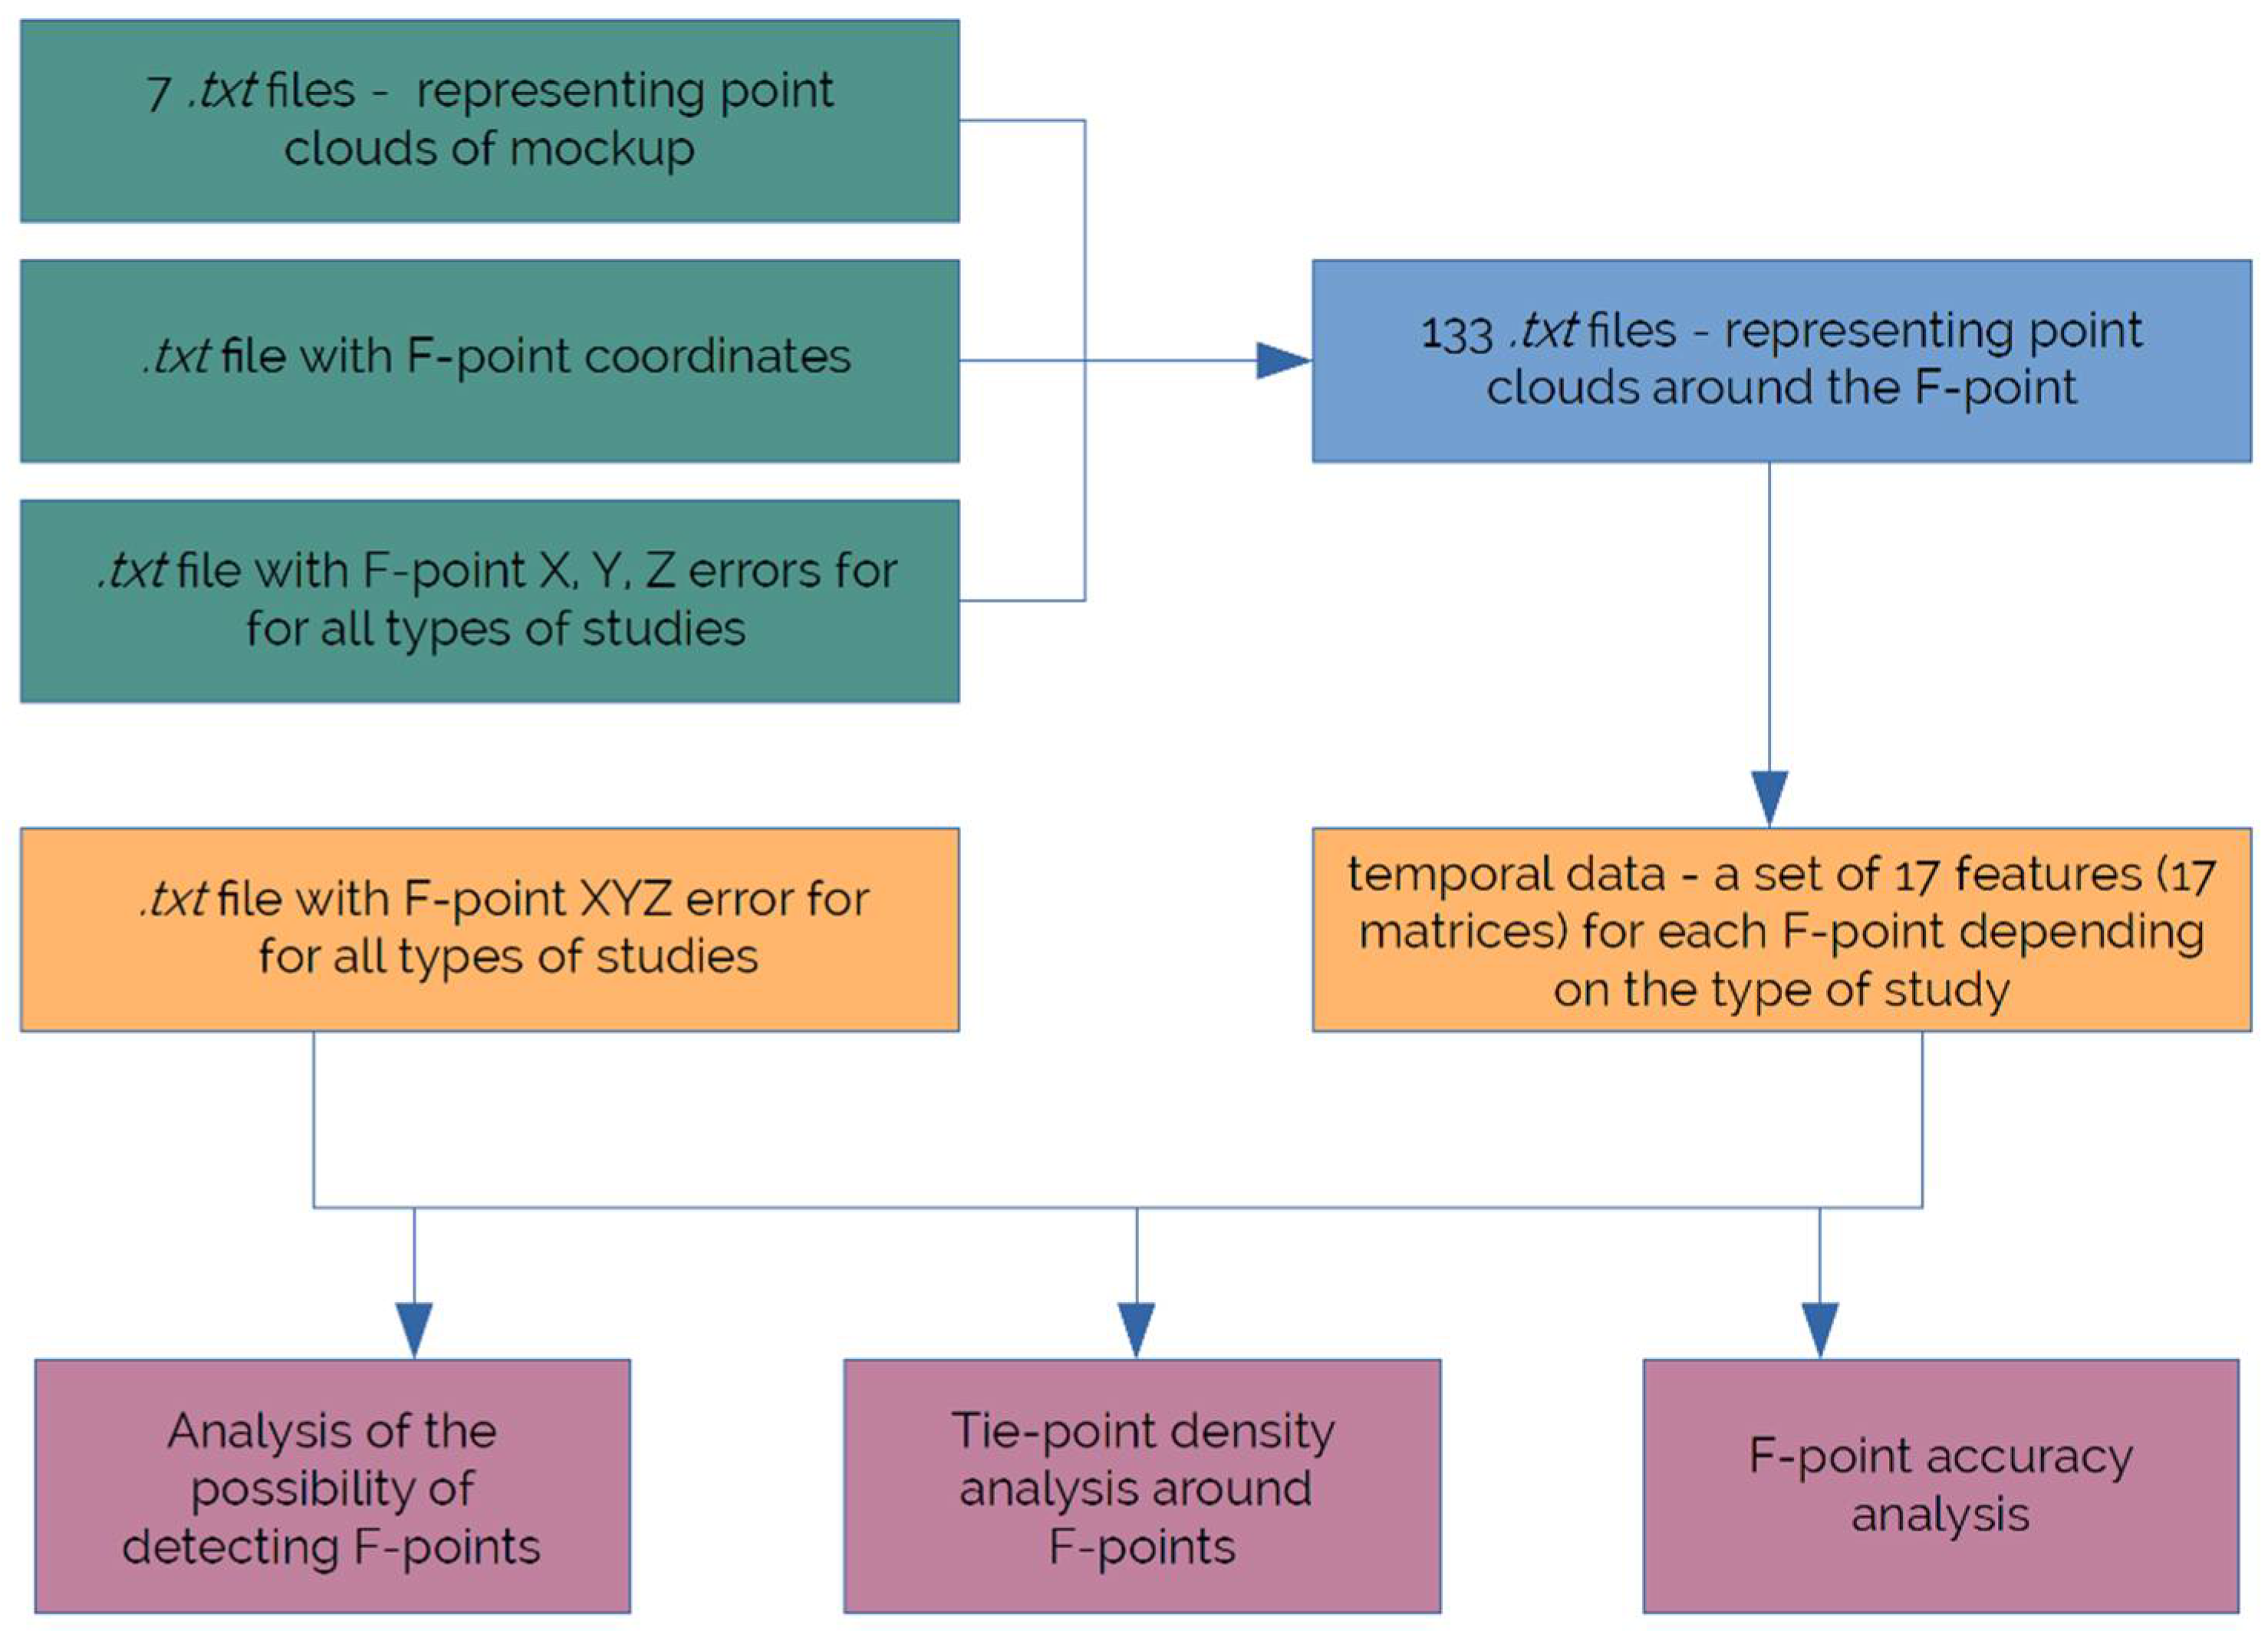
Figure 1. Principles of procedure during the point clouds’ analysis.
Energies 14 08002 g001
Figure 2. Examples of discs used during the tests.
Energies 14 08002 g002
Figure 3. Positions of F-points (marked with blue flags with the target and number inscription).
Energies 14 08002 g003
Figure 4. Distribution of diodes in the used light source [source: image provided by the lamp manufacturer].
Energies 14 08002 g004
Figure 5. Measurement station.
Energies 14 08002 g005
Figure 6. Mock-up and tripod with camera.
Energies 14 08002 g006
Figure 7. Spectral specification of the LED light sources.
Energies 14 08002 g007
Figure 8. Views of concentrated point clouds for each of the studies.
Energies 14 08002 g008aEnergies 14 08002 g008b
Figure 9. Graphic list of F-point features by study (horizontal axis—study type designations: D—dark, W—warm, C—cold, N—neutral, R—red, G—green, B—blue).
Energies 14 08002 g009
Figure 10. Analysis of the F-points’ detection ability, depending on the luminosity.
Energies 14 08002 g010
Figure 11. Analysis of the F-points’ detection ability, depending on the spectral response for red.
Energies 14 08002 g011
Figure 12. Analysis of the F-points’ detection ability, depending on the spectral response for green.
Energies 14 08002 g012
Figure 13. Analysis of the F-points’ detection ability, depending on the spectral response for blue.
Energies 14 08002 g013
Figure 14. Analysis of the F-points’ detection ability, depending on the MeanL2 feature, divided by study type.
Energies 14 08002 g014
Figure 15. Analysis of the F-points’ detection ability, depending on the MeanG feature, divided bystudy type.
Energies 14 08002 g015
Figure 16. The value of the correlation coefficient between XYZ total error and the F-point features.
Energies 14 08002 g016
Figure 17. The value of the correlation coefficient between tie-point number and the other F-point features.
Energies 14 08002 g017
Figure 18. The value of the correlation coefficient between XYZ total error and the F-point features.
Energies 14 08002 g018
Figure 19. The value of the correlation coefficient between t-point number and the other F-point features.
Energies 14 08002 g019
Figure 20. The value of the correlation coefficient between XYZ total error and the F-point features.
Energies 14 08002 g020
Figure 21. The value of the correlation coefficient between t-point number and the other F-point features.
Energies 14 08002 g021
Table 1. List of tools (hardware and software) used during testing.
TypeModelPurpose of Use
Total StationLeica TCRP 1201measurement of the F-points’ x, y, z coordinates
CameraNikon D5300 with the Nikkor AF-S 50 mm lensimage acquisition
SpectrometerUPRtek MK350Dmeasurement of the additional light sources’ photometric values
Additional Light SourcesLED SPECTRUM SMART 13W E27 LEDR GBWmock-up illumination
SoftwareAgisoft Metashape Profesionalphotogrammetric elaboration
Matlab R2020banalytical elaboration
Table 2. Sequences of used lighting.
Sequence Number (n)Sequence NameLighting Parameters:
E, CCT, CRI, λp
Description
1DARKsee Table 3no artificial lighting
2WARMsee Table 3illumination using “white” light commonly known as warm
3COLDsee Table 3illumination using “white” light commonly known as natural
4NEUTRALsee Table 3illumination using “white” light commonly known as natural
5REDsee Table 3illumination using red light
6GREENsee Table 3illumination using green light
7BLUEsee Table 3illumination using blue light
Table 3. Photometric values of the LED light sources.
WarmColdNeutralRedGreenBlue
E [lx]28,75028,58029,160306911334
CCT [K]306659614383078410
CRI [Ra]83.6587.2088.350.000.000.00
λp [nm]603455454635520454
Table 4. Summary of conducted studies.
Parameter NameDarkWarmColdNeutralRedGreenBlue
Number of images:43434343434343
Recording altitude [m]:1.301.351.341.351.331.331.34
Ground resolution [mm/pix]:0.10000.09940.09920.09930.10000.09960.0997
Coverage area [m2]:2.002.432.442.432.222.322.36
Camera stations:42434343434343
Tie points:24,582128,221132,876129,25343,20460,71640,351
Projections:58,154317,335331,564330,15198,604142,29296,208
Reprojection error [pix]:0.9260.6110.6010.5860.6490.6630.654
Number of detected F-points:16181818131816
XY error [cm]:0.280.100.110.110.140.140.17
XYZ total error [cm]:0.800.280.330.310.360.380.29
Table 5. XYZ total error values depending on the F-point and study type.
XYZ Total Error (cm)Number of Cases with F-Point
F-PointType of Case
DarkWarmColdNeutralRedGreenBlue
21.140.140.160.170.200.200.177
30.400.080.080.06NaN0.110.056
40.210.070.080.08NaNNaNNaN4
51.130.130.150.16NaN0.18NaN6
60.310.430.450.450.410.420.387
80.070.090.100.11NaN0.15NaN5
90.610.130.140.140.320.270.247
100.320.430.410.410.060.400.057
110.950.130.140.150.210.210.247
120.430.160.160.150.400.250.297
13NaN0.230.260.270.500.430.316
140.540.170.200.190.180.300.167
150.68NaNNaNNaNNaN0.950.483
200.940.310.340.330.390.520.437
22NaN0.170.180.180.150.160.246
230.940.300.320.33NaN0.410.086
30NaN0.761.010.890.130.200.116
321.700.160.170.160.620.350.387
360.680.280.300.260.570.480.477
Table 6. Overall data characterising the LED light source, including the study’s geometric specification data.
DarkWarmColdNeutralRedGreenBlue
E [lx]-28,75028,58029,160306911334
CCT [K]-306659614383078410
CRI [Ra]-83.6587.2088.350.000.000.00
Tie points [-]24,582128,221132,876129,25343,20460,71640,351
Projections [-]58,154317,335331,564330,15198,604142,29296,208
MeanL2 CP [-]21.3113.0120.2118.828.462.531.7
F error [pix]578.37.67.6221519
Cx error [pix]63119.39.4352127
Cy error [pix]62119.910322226
B1 error5.61.51.31.33.82.73.3
B2 error5.31.41.31.33.22.43
K1 error0.003300.000700.000640.000650.001600.001200.00140
K2 error0.073000.020000.018000.019000.043000.033000.03700
K3 error0.660000.190000.170000.170000.390000.300000.34000
P1 error0.000740.000080.000070.000070.000260.000150.00020
P2 error0.000690.000070.000060.000070.000230.000140.00018
Publisher’s Note: MDPI stays neutral with regard to jurisdictional claims in published maps and institutional affiliations.