
Effect of Mainstream Velocity on the Heat Transfer Coefficient of Gas Turbine Blade Tips


Abstract
:1. Introduction
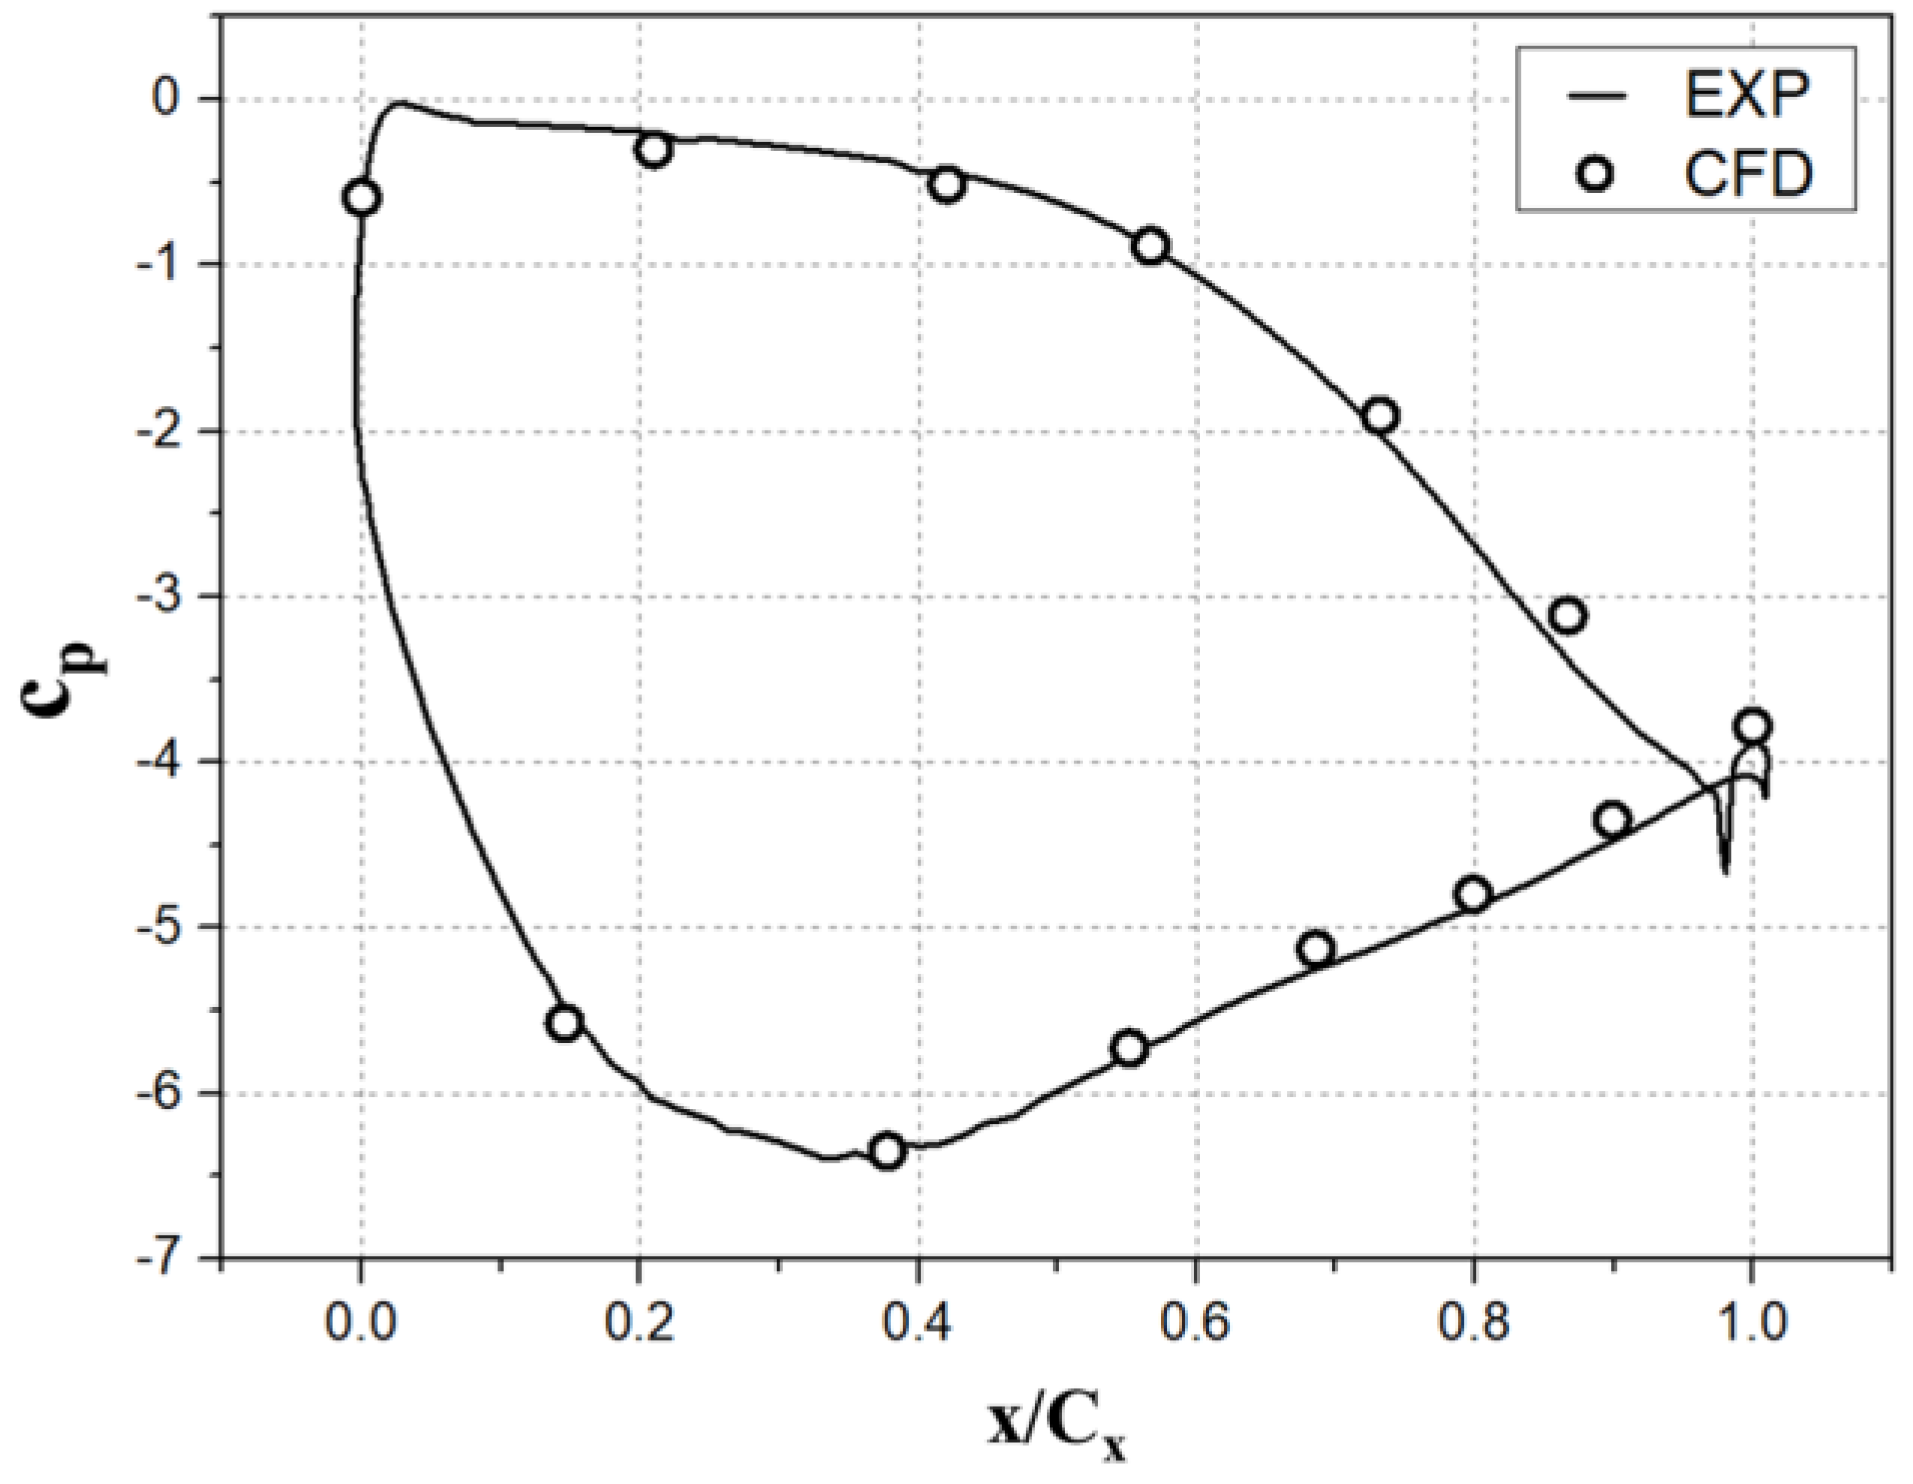
2. Experimental Setup and Heat Transfer Measurement Technique
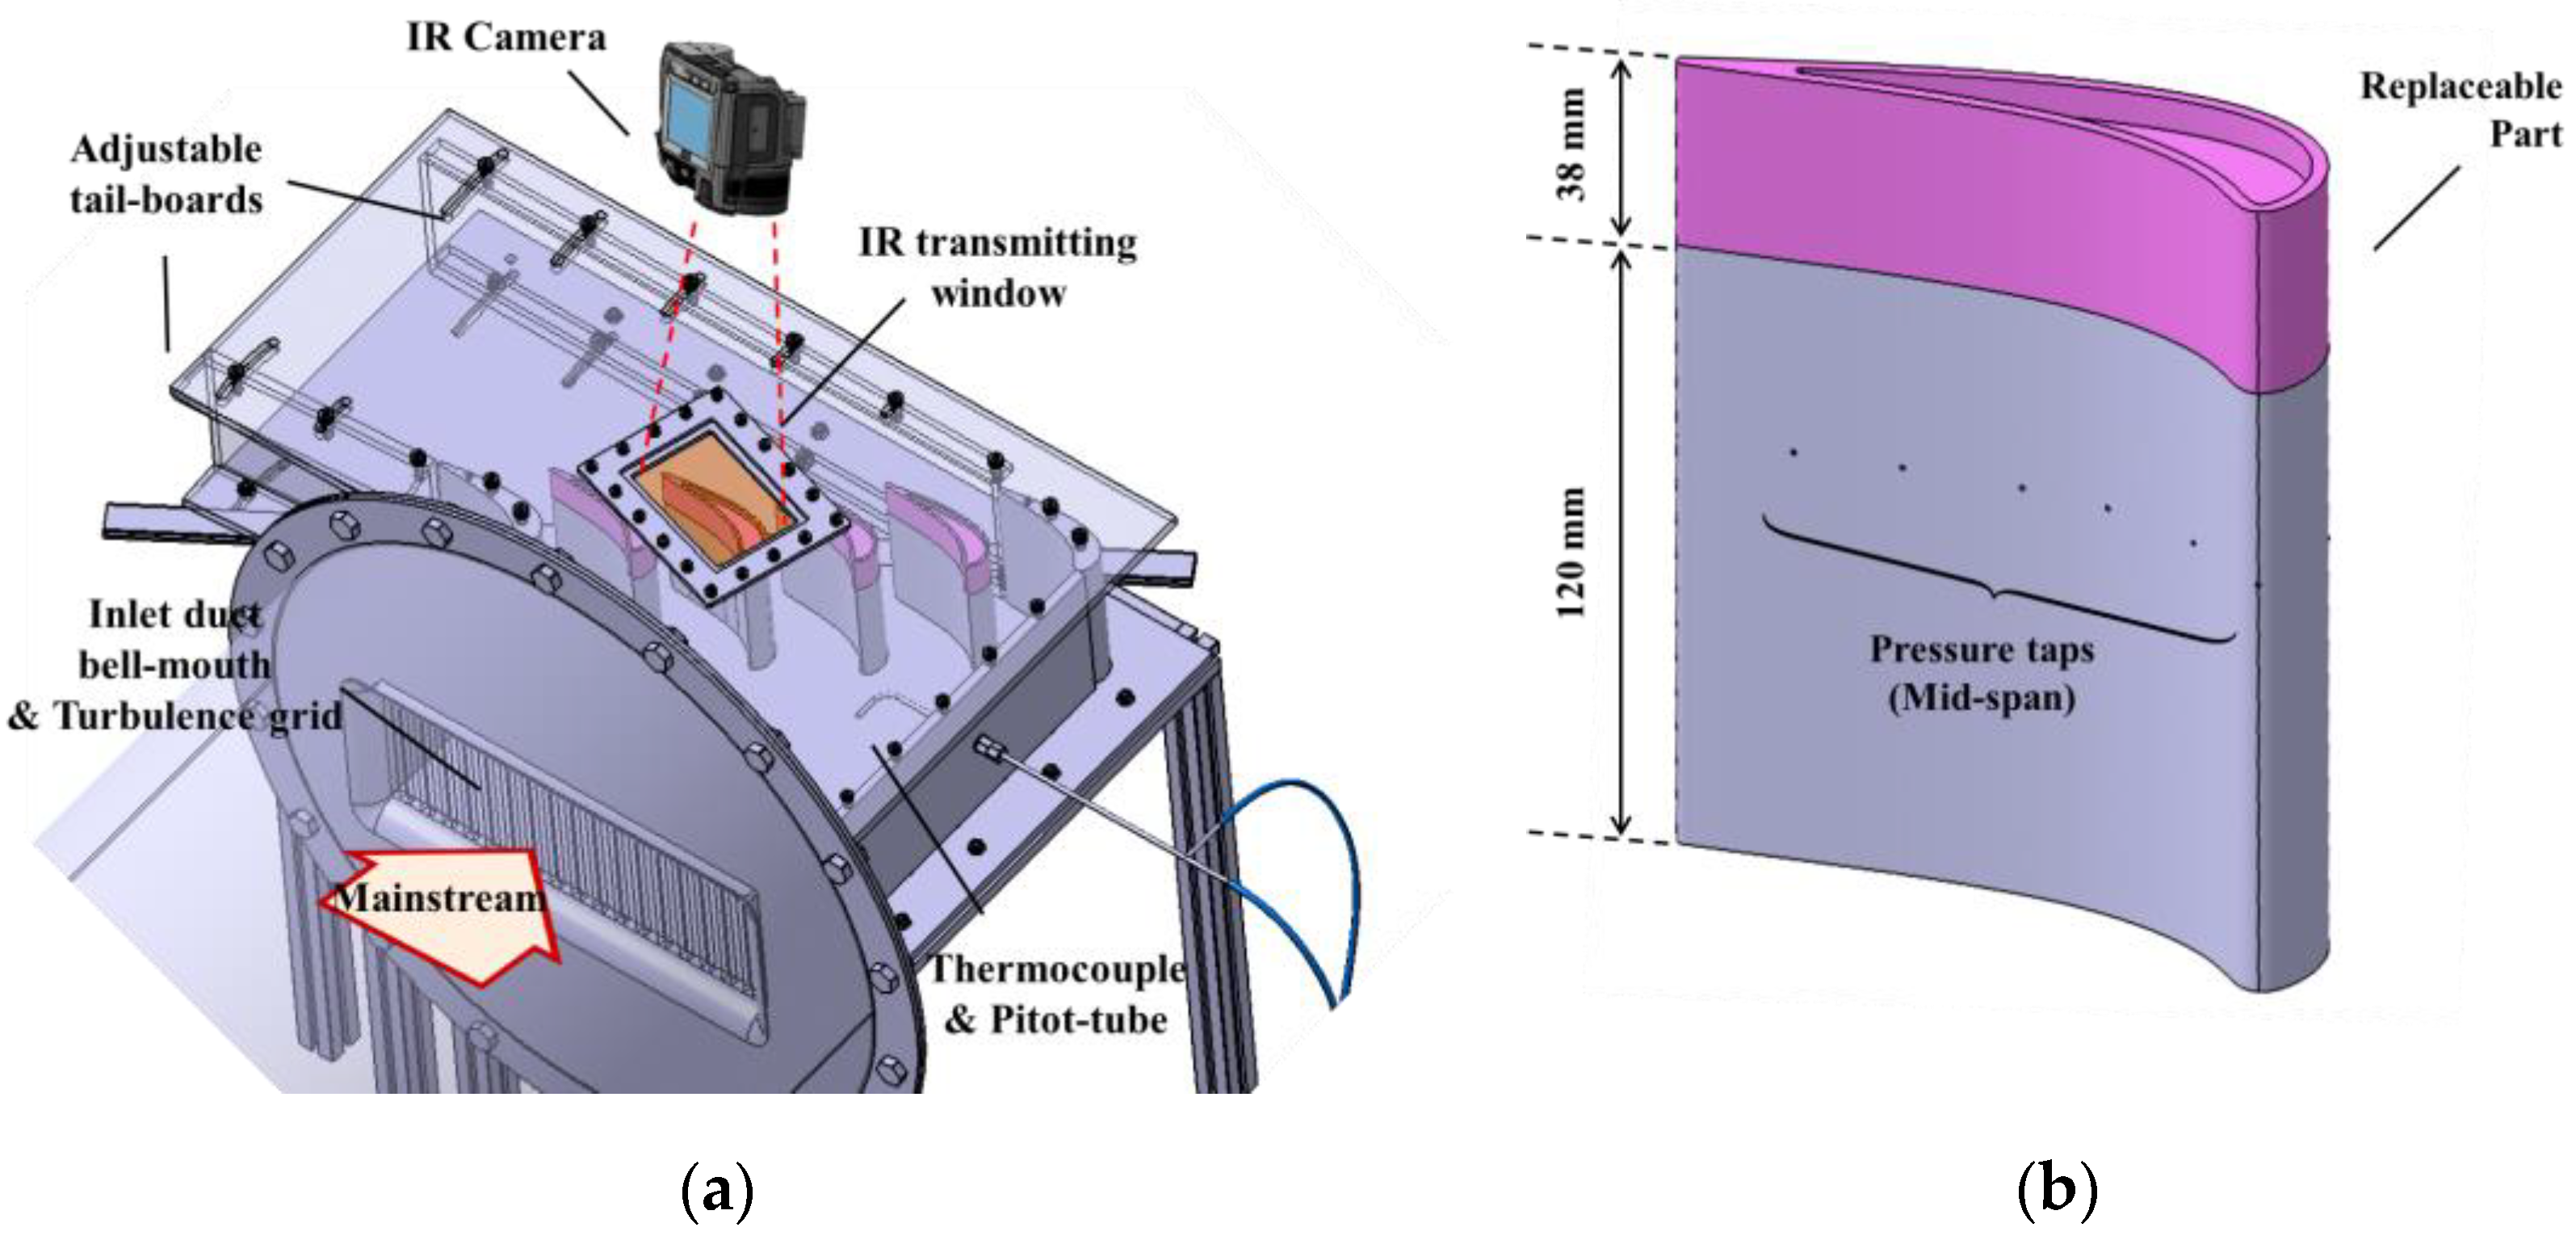
2.1. High Speed Blow-Down Cascade Facility
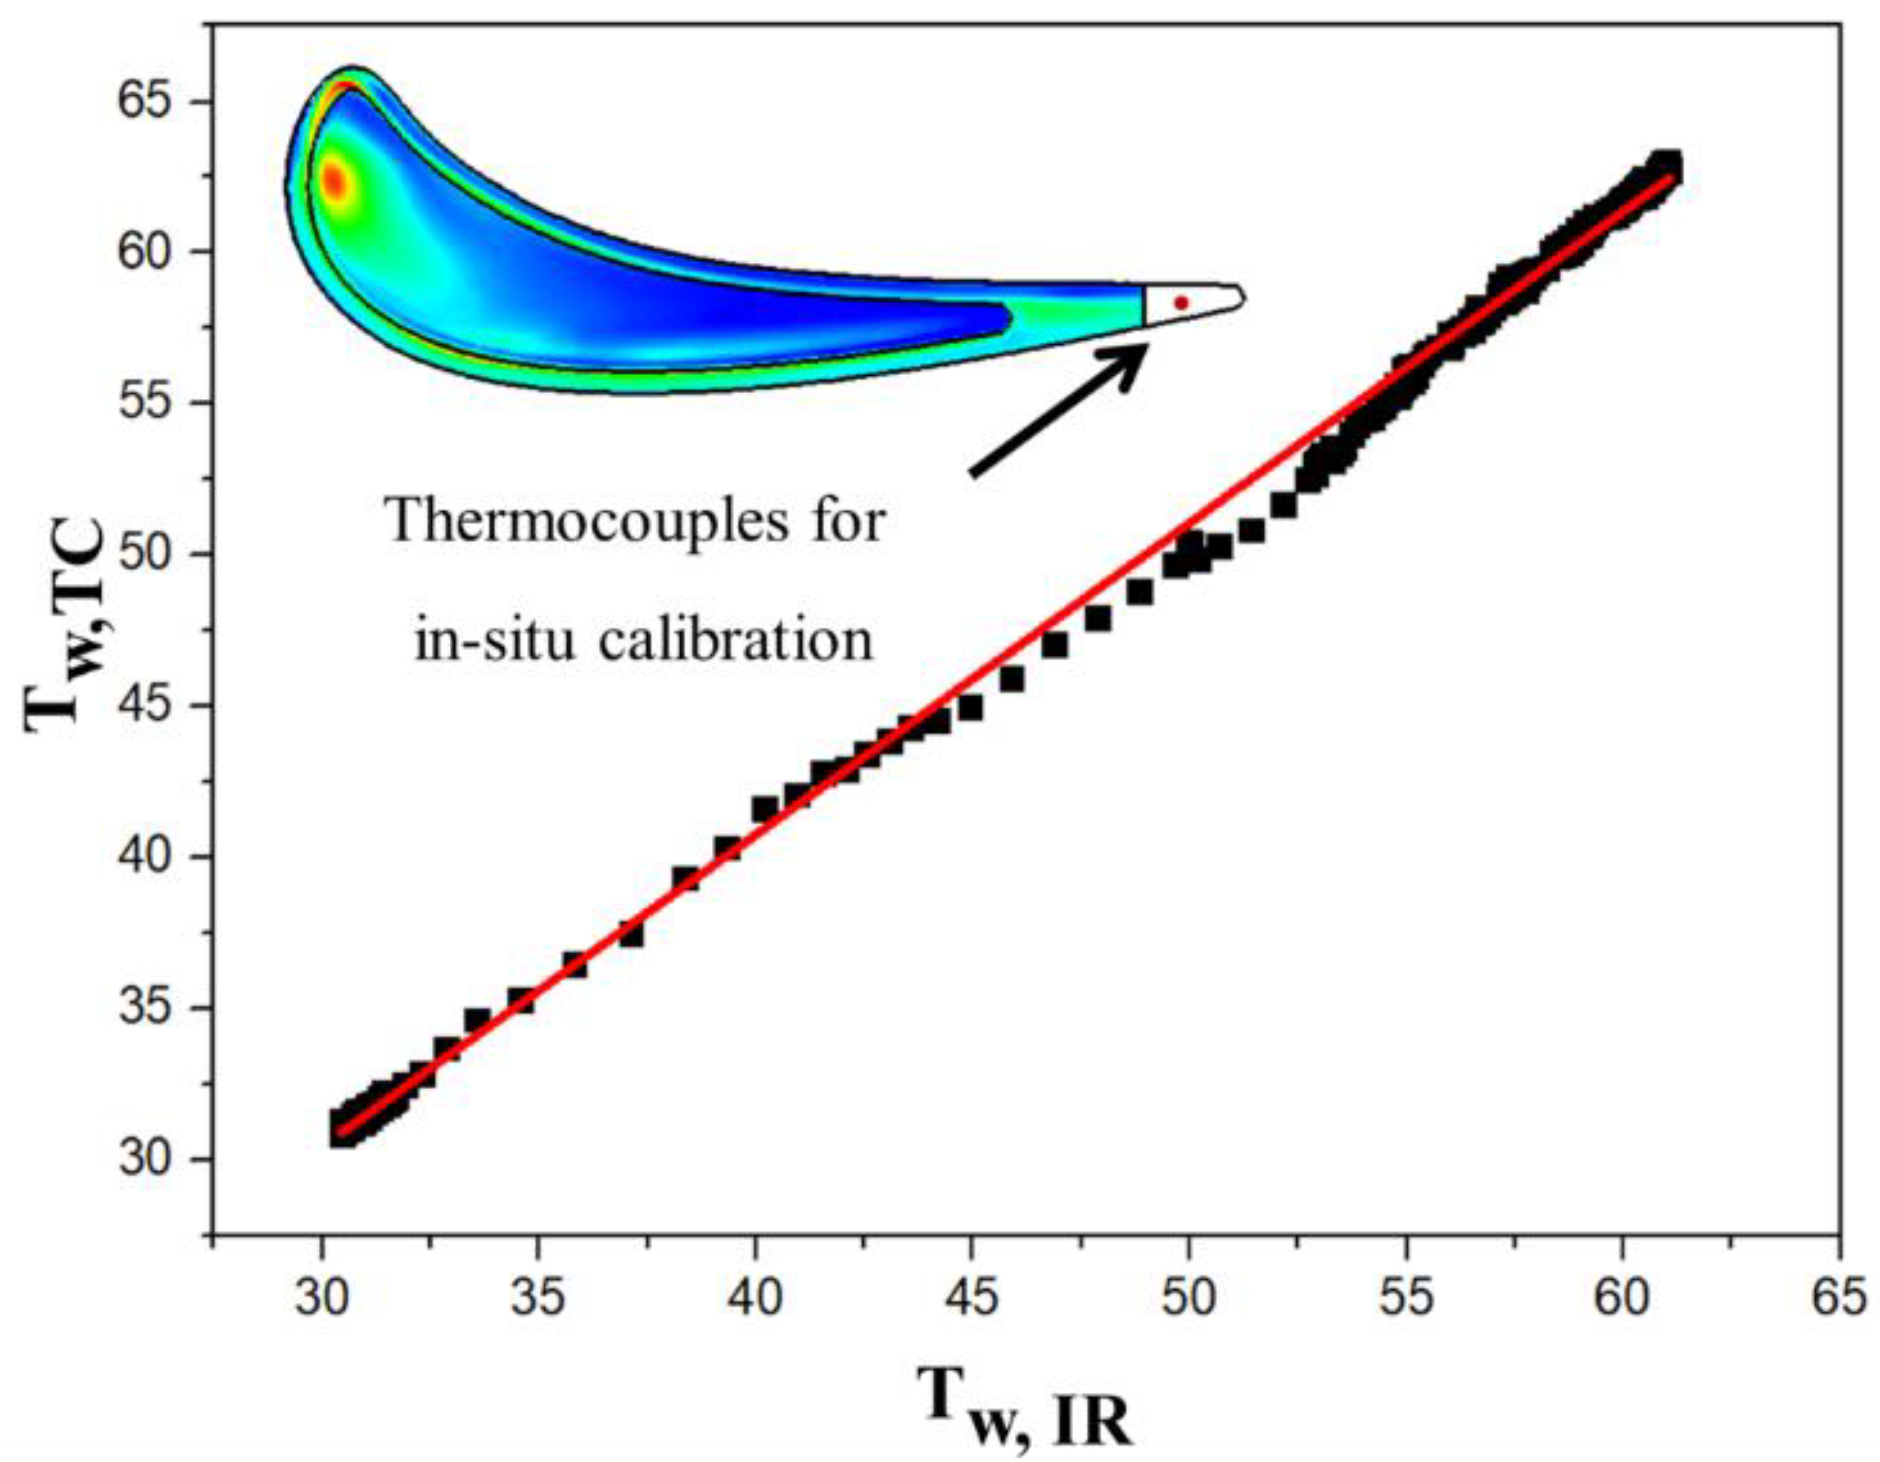
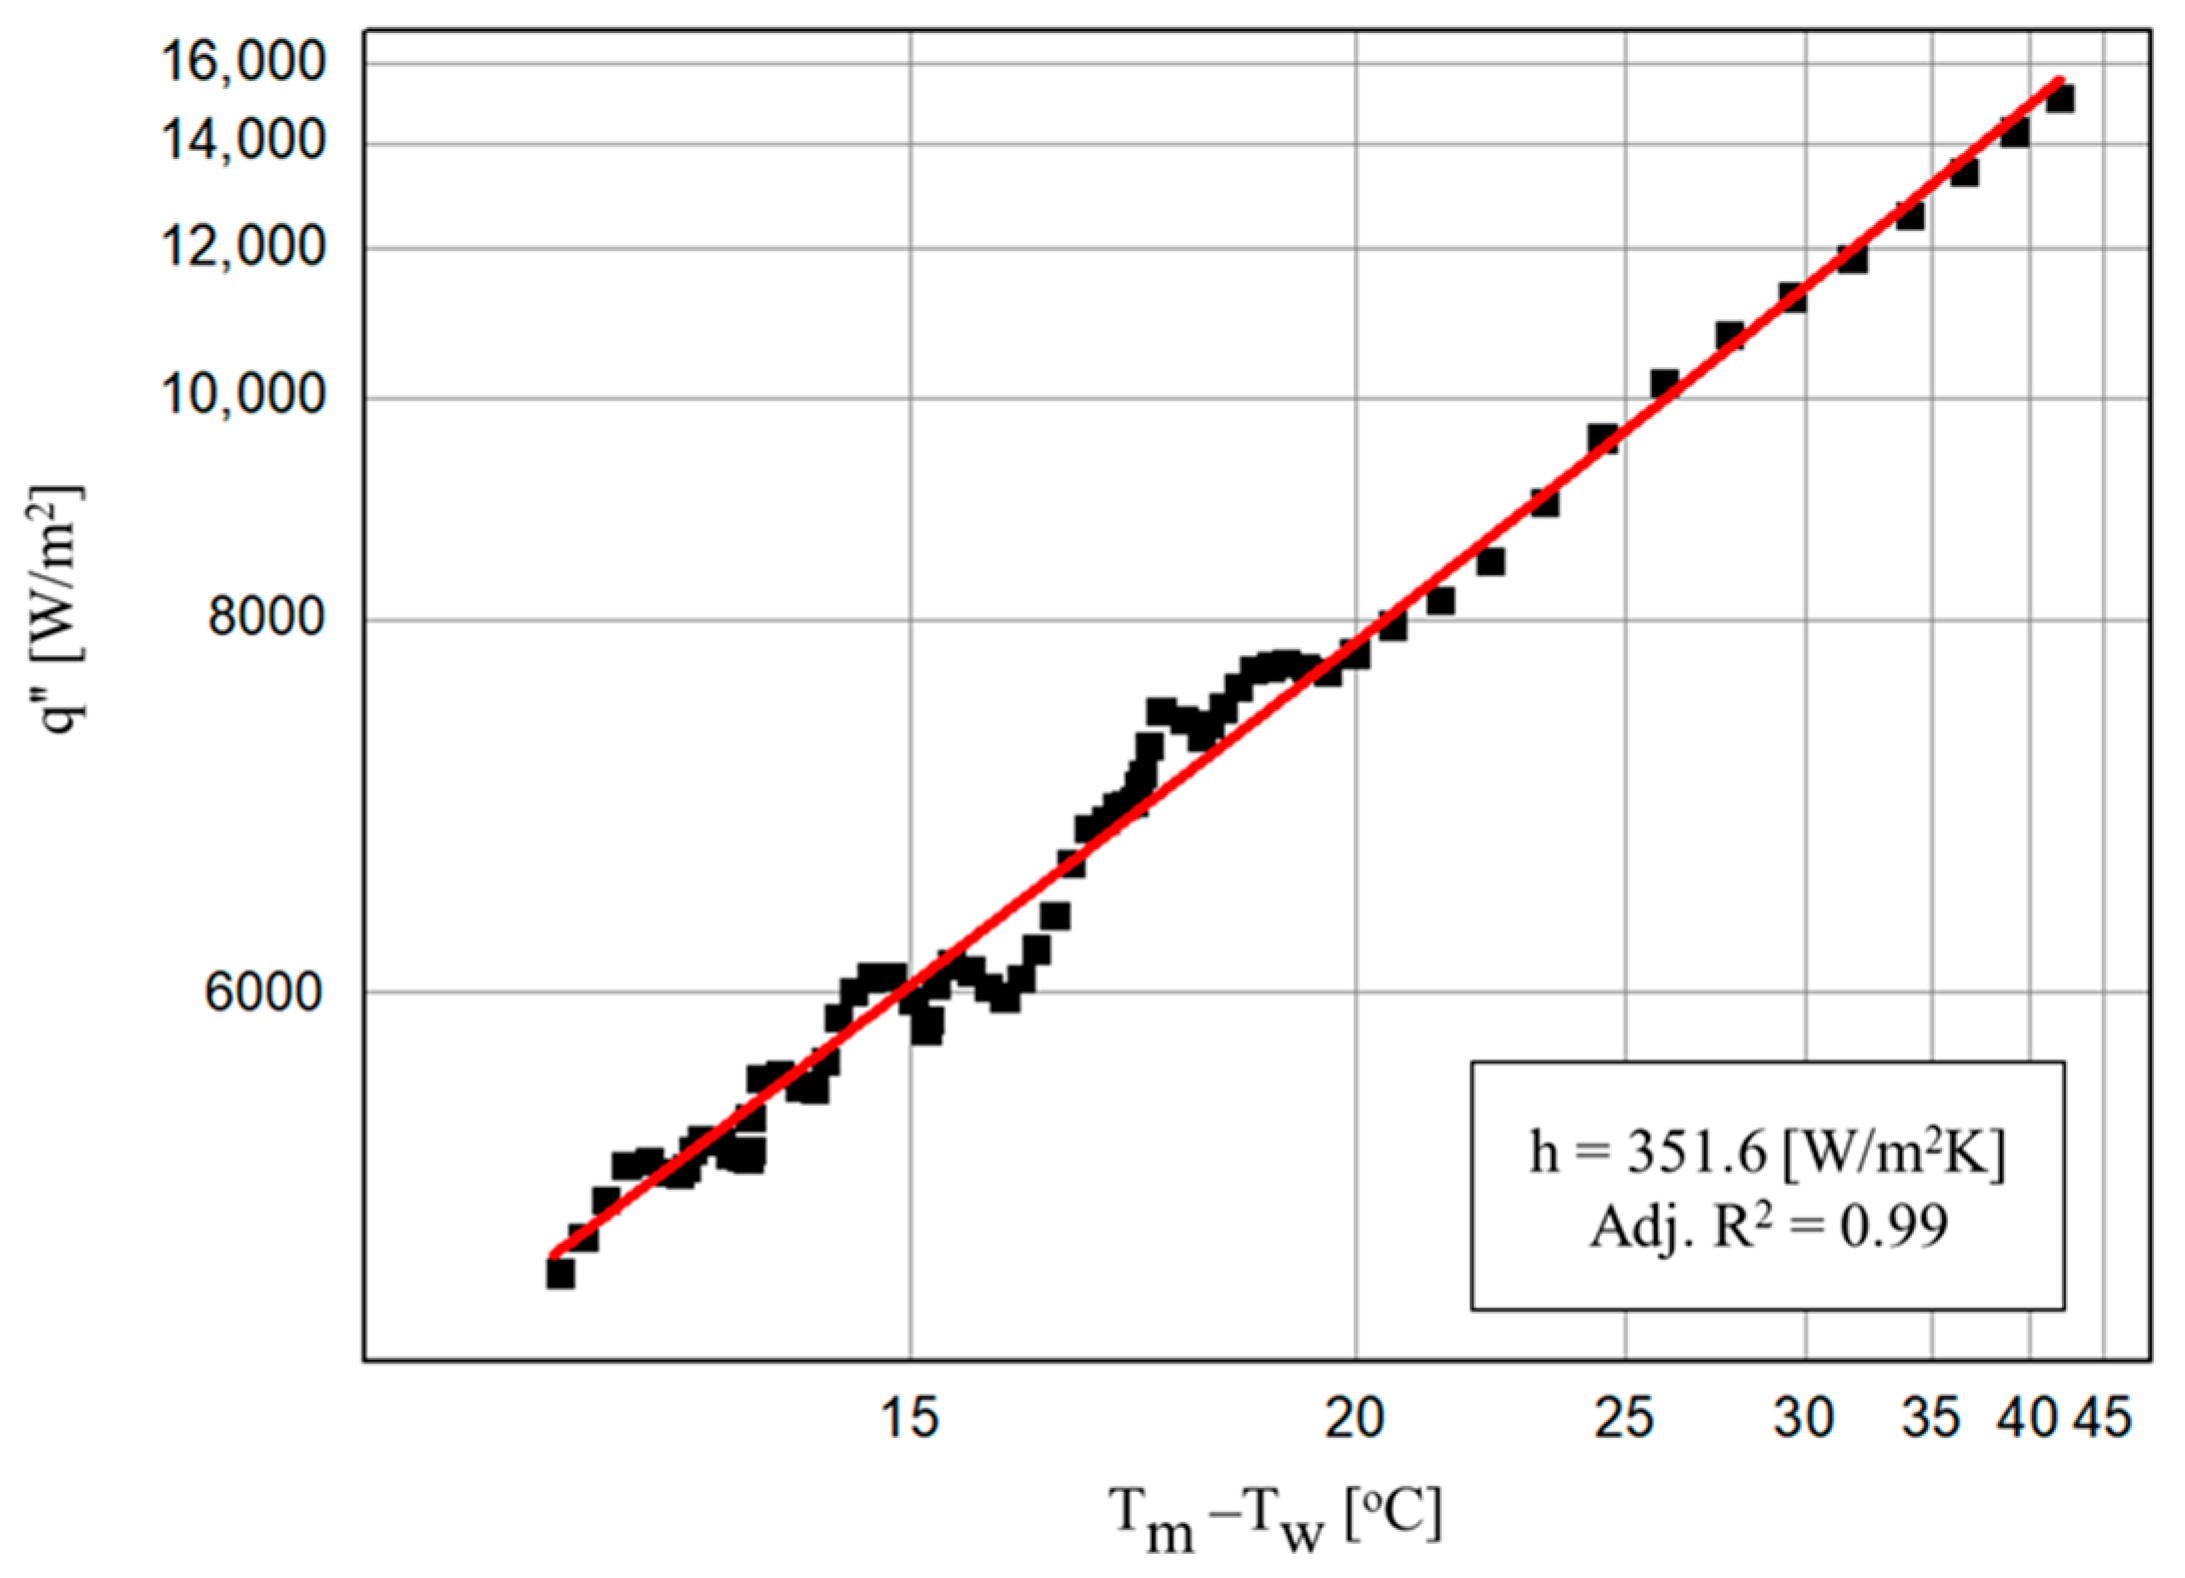
2.2. HTC Measurement
3. Results and Discussion
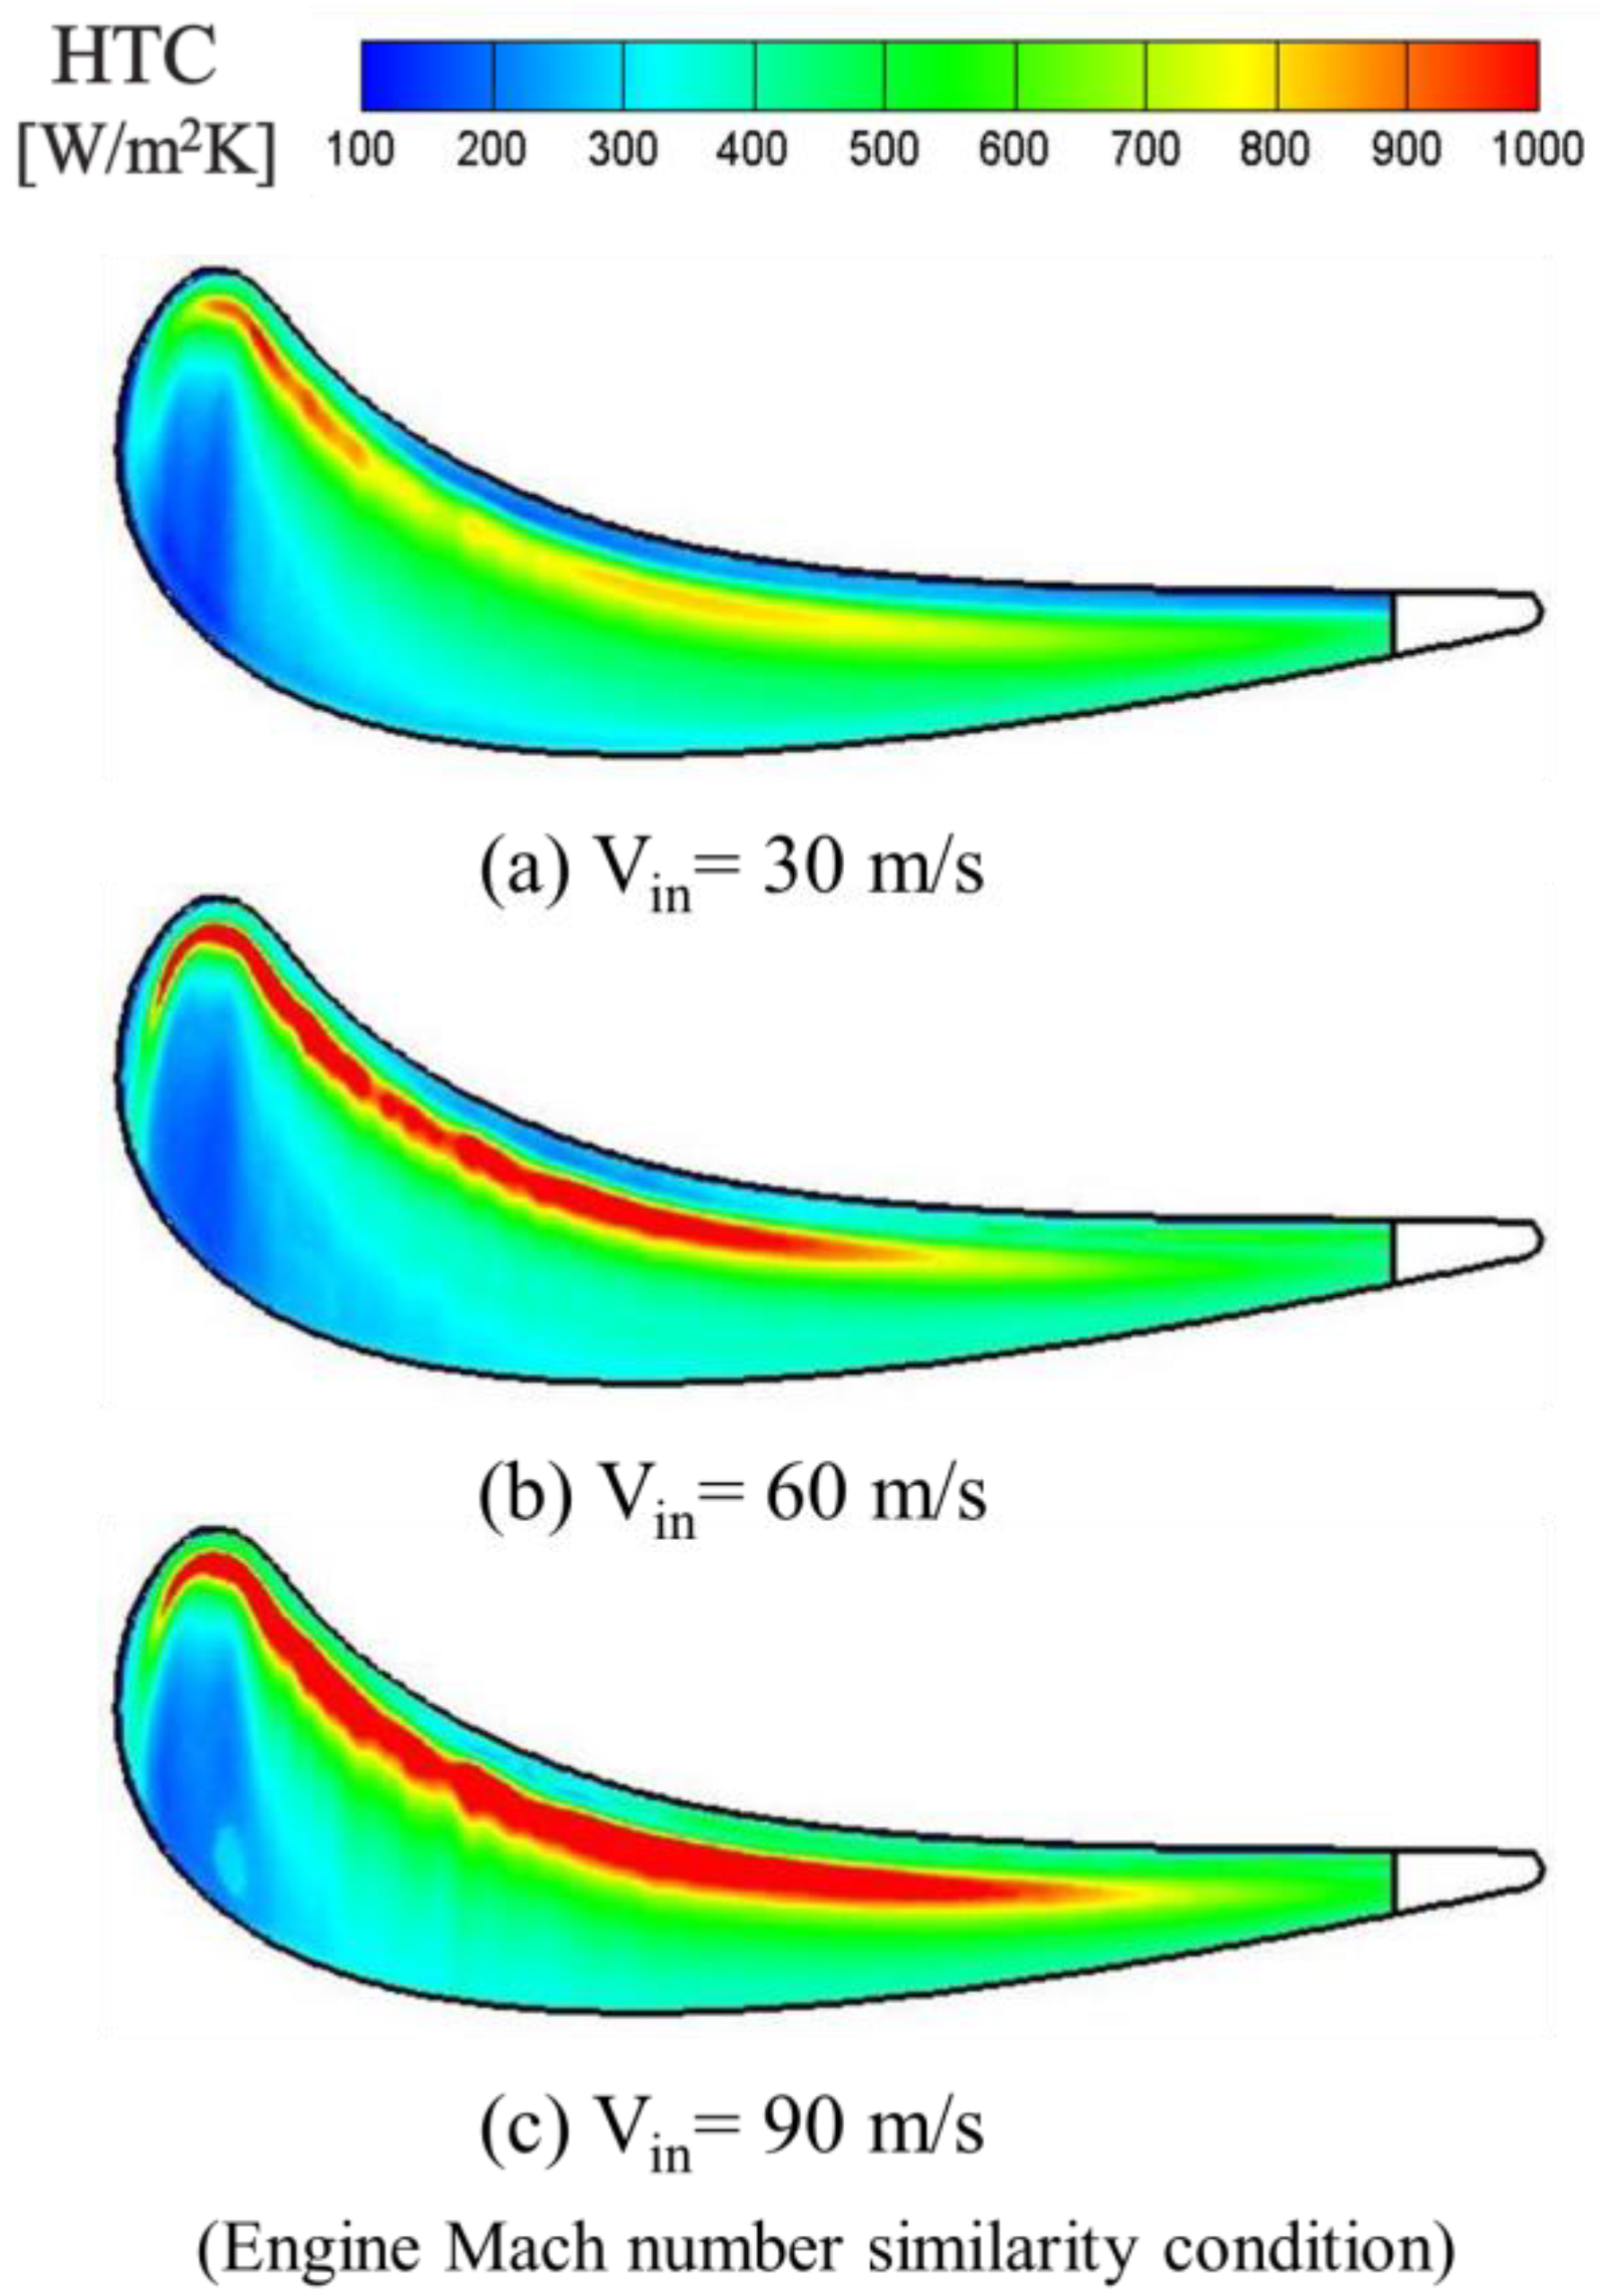
3.1. Plane Tip
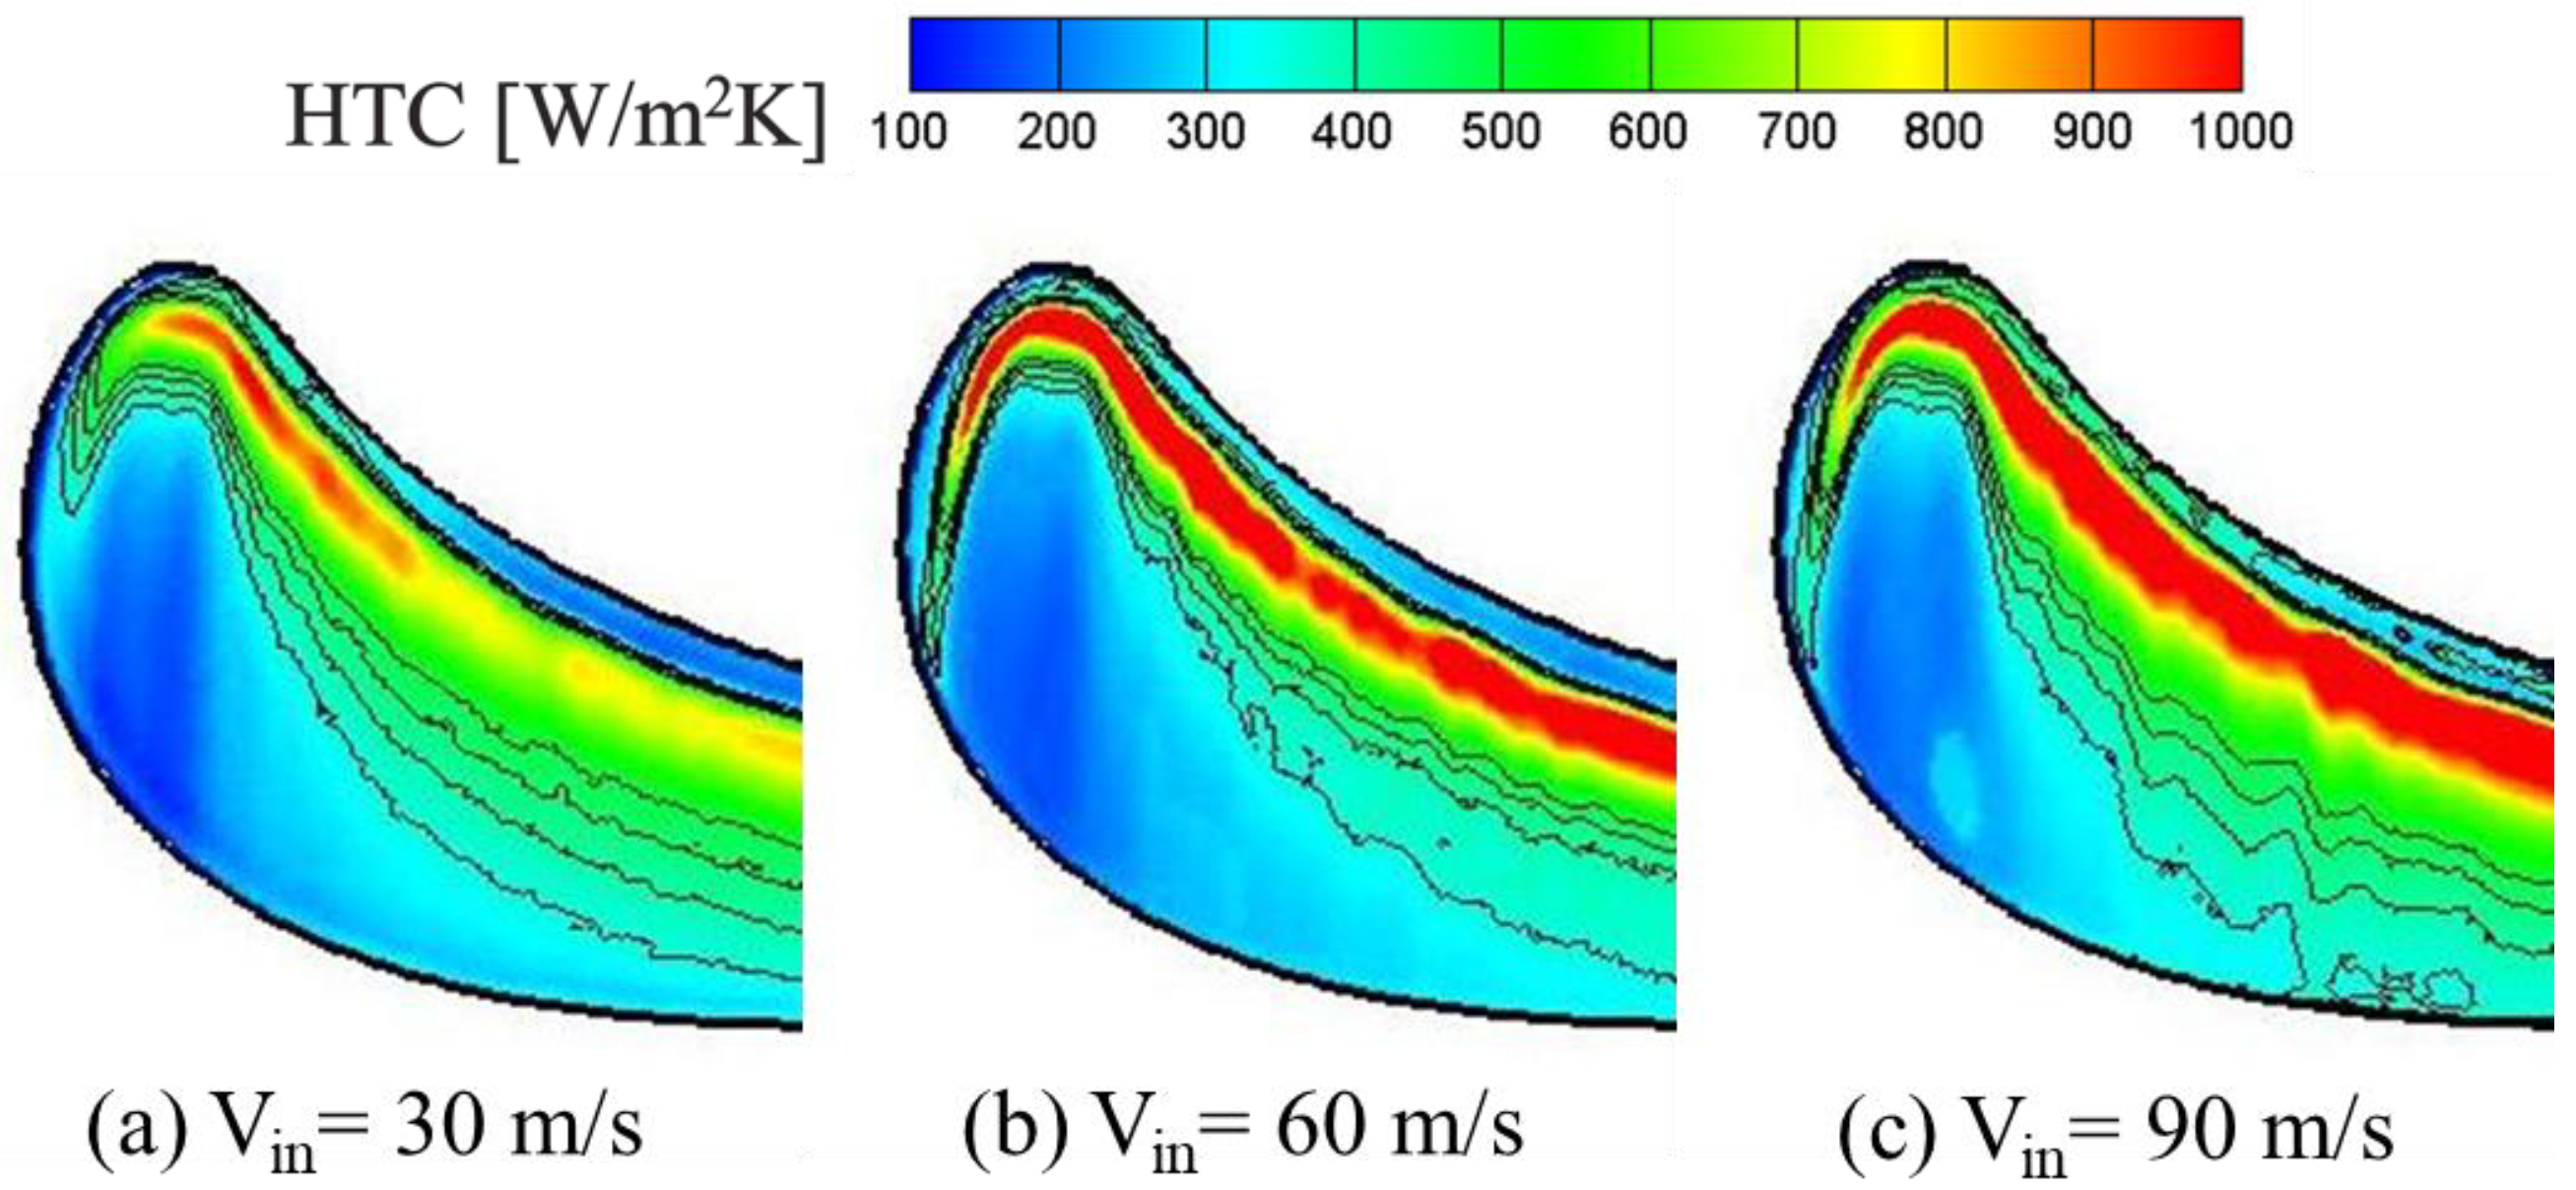
3.2. Squealer Tip
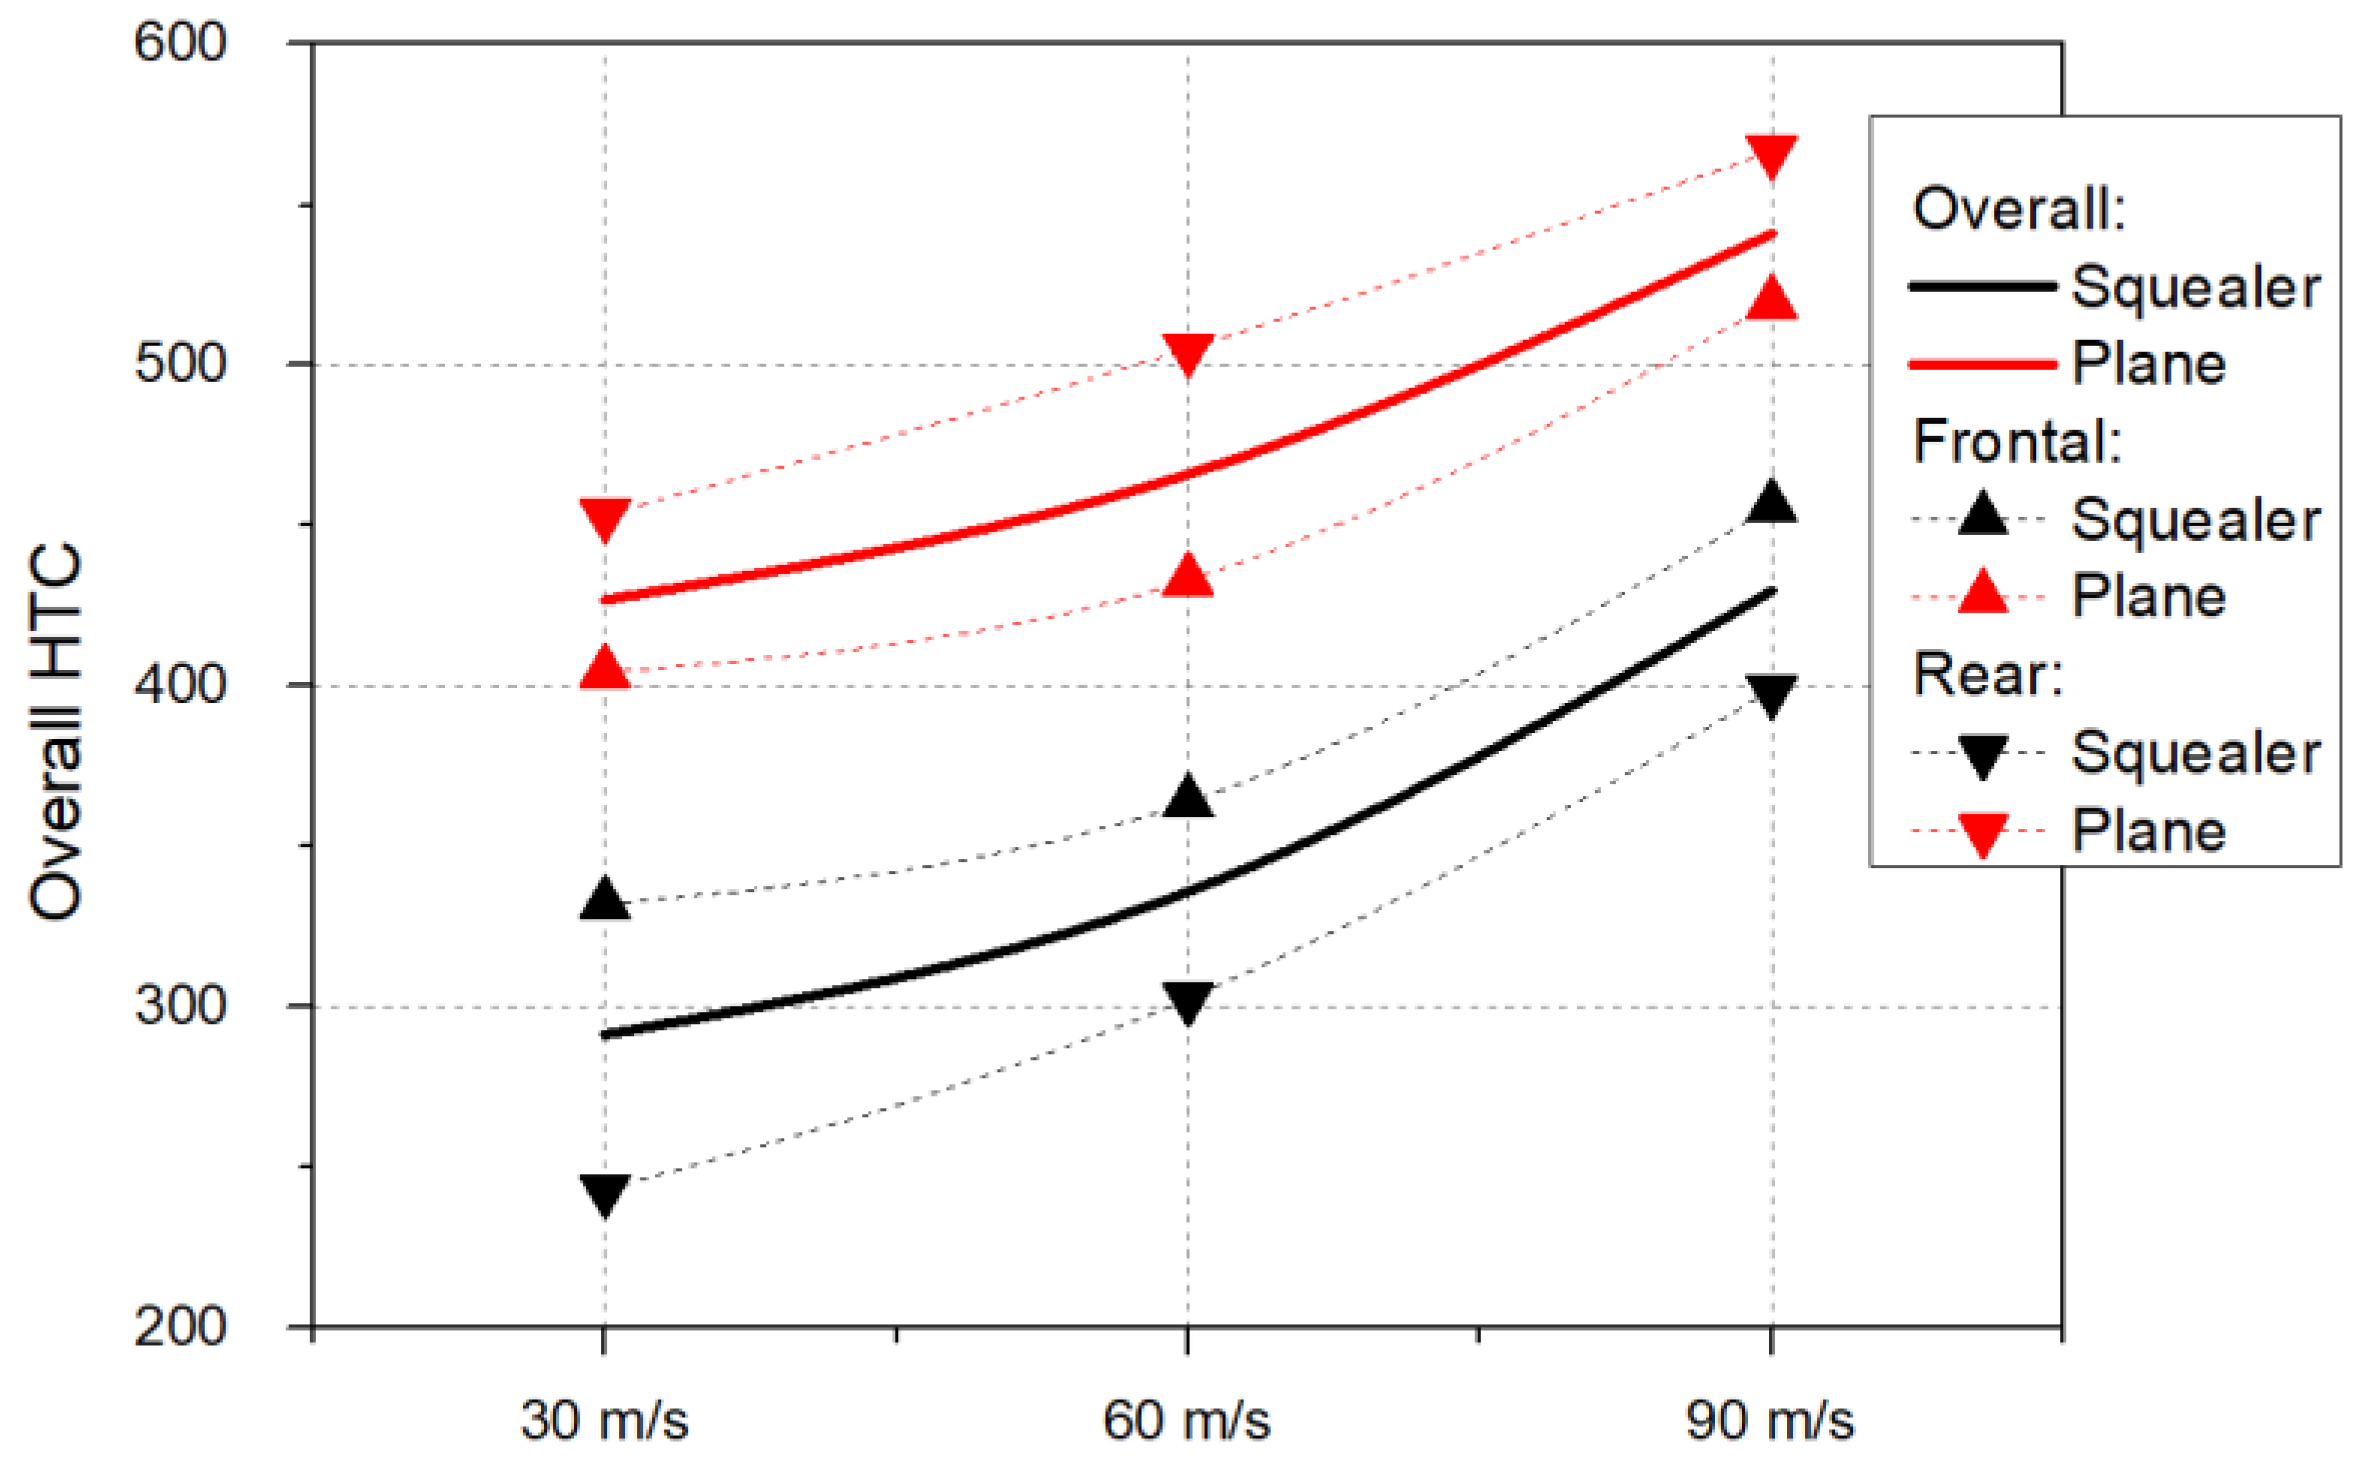
3.3. Overall Averaged HTC
4. Summary
- For the squealer tip, the vortex structure in the frontal region of the tip was significantly affected by the inlet mainstream velocity, and, as a result, the heat transfer coefficient in the region was also greatly altered by the cascade inlet condition.
- For the plane tip, the size of the vortex near the blade mid-chord increased as the inlet mainstream velocity increased, resulting in a significant increase in heat transfer.
- The overall averaged HTC tended to be proportional to the inlet mainstream velocity, but the local HTC, particularly in the frontal region, was greatly affected by the inlet mainstream velocity. Therefore, experimental studies should be conducted under engine simulating conditions.
Author Contributions
Funding
Institutional Review Board Statement
Informed Consent Statement
Data Availability Statement
Conflicts of Interest
Nomenclature
| CSV | Cavity scraping vortex |
| CV | Cavity vortex |
| HTC | Heat transfer coefficient |
| LEV | Leading edge vortex |
| PS | Pressure side |
| SS | Suction side |
| TLF | Tip leakage flow |
| Symbols | |
| C | Blade chord |
| Specific heat of test plate, J/g∙K | |
| Heat transfer coefficient, W/m2K | |
| Thermal conductivity of test plate, W/m∙K | |
| Thermal properties of solid, | |
| Pressure, Pa | |
| Heat flux, W/m2 | |
| Gas constant, J/g∙K | |
| Test time, sec | |
| Temperature, °C | |
| Velocity, m/s | |
| Location in axial direction, mm | |
| Location in pitch direction, mm | |
| Location in span direction, mm | |
| Greeks | |
| Thermal diffusivity of test plate, m2/s | |
| Subscripts | |
| adw | Adiabatic wall |
| i | Initial condition |
| in | Inlet |
| m | Mainstream |
| s | Static properties |
| t | Total properties |
| w | Wall |
References
- Bunker, R.S. Axial Turbine Blade Tips: Function, Design, and Durability. J. Propuls. Power 2006, 22, 271–285. [Google Scholar] [CrossRef]
- Bunker, R.S.; Bailey, J.C. Effect of Squealer Cavity Depth and Oxidation on Turbine Blade Tip Heat Transfer. In Volume 3: Heat Transfer; Electric Power; Industrial and Cogeneration, Proceedings of the ASME Turbo Expo 2001: Power for Land, Sea, and Air, New Orleans, LA, USA, 4–7 June 2021; American Society of Mechanical Engineers: New York, NY, USA, 2001; p. V003T01A038. [Google Scholar]
- Bunker, R.S.; Bailey, J.C.; Ameri, A.A. Heat Transfer and Flow on the First-Stage Blade Tip of a Power Generation Gas Turbine: Part 1—Experimental Results. J. Turbomach. 2000, 122, 263–271. [Google Scholar] [CrossRef]
- Kwak, J.S.; Ahn, J.; Han, J.-C. Effects of Rim Location, Rim Height, and Tip Clearance on the Tip and near Tip Region Heat Transfer of a Gas Turbine Blade. Int. J. Heat Mass Transf. 2004, 47, 5651–5663. [Google Scholar] [CrossRef]
- Kwak, J.S.; Ahn, J.; Han, J.-C.; Lee, C.P.; Bunker, R.S.; Boyle, R.; Gaugler, R. Heat Transfer Coefficients on the Squealer Tip and Near-Tip Regions of a Gas Turbine Blade With Single or Double Squealer. J. Turbomach. 2003, 125, 778–787. [Google Scholar] [CrossRef]
- Ameri, A.A.; Steinthorsson, E.; Rigby, D.L. Effects of Tip Clearance and Casing Recess on Heat Transfer and Stage Efficiency in Axial Turbines. In Volume 4: Heat Transfer; Electric Power; Industrial and Cogeneration, Proceedings of the ASME 1998 International Gas Turbine and Aeroengine Congress and Exhibition, GT 1998, Stockholm, Sweden, 2–5 June 1998; American Society of Mechanical Engineers: New York, NY, USA, 1998; p. V004T09A066. [Google Scholar]
- Key, N.L.; Arts, T. Comparison of Turbine Tip Leakage Flow for Flat Tip and Squealer Tip Geometries at High-Speed Conditions. J. Turbomach. 2006, 128, 213–220. [Google Scholar] [CrossRef]
- Park, J.S.; Lee, S.H.; Kwak, J.S.; Lee, W.S.; Chung, J.T. Measurement of Blade Tip Heat Transfer and Leakage Flow in a Turbine Cascade With a Multi-Cavity Squealer Tip. In Proceedings of the ASME 2013 Turbine Blade Tip Symposium, Hamburg, Germany, 30 September–3 October 2013; p. V001T02A006. [Google Scholar]
- Saha, A.K.; Acharya, S.; Bunker, R.; Prakash, C. Blade Tip Leakage Flow and Heat Transfer with Pressure-Side Winglet. Int. J. Rotating Mach. 2006, 2006, 017079. [Google Scholar] [CrossRef] [Green Version]
- Yan, X.; Huang, Y.; He, K. Effect of Ejection Angle and Blowing Ratio on Heat Transfer and Film Cooling Effect on a Winglet Tip. Int. J. Heat Mass Transf. 2018, 125, 357–374. [Google Scholar] [CrossRef]
- Prakash, C.; Lee, C.-P.; Cherry, D.; Wadia, A.; Doughty, R. Analysis of Some Improved Blade Tip Concepts. In Volume 6: Turbo Expo 2005, Parts A and B, Proceedings of the ASME Turbo Expo 2005: Power for Land, Sea, and Air, Reno, NV, USA, 6–9 June 2005; ASMEDC: Chevy Chase, MD, USA, 2005; pp. 529–533. [Google Scholar]
- Jeong, J.Y.; Kim, W.; Kwak, J.S.; Park, J.S. Heat Transfer Coefficient and Film Cooling Effectiveness on the Partial Cavity Tip of a Gas Turbine Blade. J. Turbomach. 2019, 141, 071007. [Google Scholar] [CrossRef]
- Zhang, Q.; O’Dowd, D.O.; He, L.; Wheeler, A.P.S.; Ligrani, P.M.; Cheong, B.C.Y. Overtip Shock Wave Structure and Its Impact on Turbine Blade Tip Heat Transfer. J. Turbomach. 2011, 133, 041001. [Google Scholar] [CrossRef]
- Zeng, F.; Du, J.; Huang, L.; Xuan, L.; Zhao, Q.; Zou, Z. An Experimental Method for Squealer Tip Flow Field Considering Relative Casing Motion. Chin. J. Aeronaut. 2020, 33, 1942–1952. [Google Scholar] [CrossRef]
- Rhee, D.-H.; Cho, H.H. Local Heat/Mass Transfer Characteristics on a Rotating Blade With Flat Tip in a Low-Speed Annular Cascade—Part II: Tip and Shroud. J. Turbomach. 2006, 128, 110–119. [Google Scholar] [CrossRef]
- Mansouri, Z. Unsteady Simulation of Flow and Heat Transfer in a Transonic Turbine Stage under Non-Uniform Inlet Conditions. Int. Commun. Heat Mass Transf. 2021, 129, 105660. [Google Scholar] [CrossRef]
- Zhang, S.; Ding, S.; Liu, C.; Zhao, G.; Wang, J. A Discussion: Issue Improving the Accuracy of Turbine Blade Heat Transfer Simulation. In Volume 5B: Heat Transfer—General Interest; Internal Air Systems; Internal Cooling, Proceedings of the ASME Turbo Expo 2021: Turbomachinery Technical Conference and Exposition, Virtual, Online, 7–11 June 2021; American Society of Mechanical Engineers: New York, NY, USA, 2021; p. V05BT13A003. [Google Scholar]
- Timko, L.P. Energy Efficinet Engine High Pressure Turbine Component Test Performance Report; NASA Technical Reports, No. NASA CR-168289; National Aeronautics and Space Administration, NASA Lewis Research Center: Cleveland, OH, USA, 1984. [Google Scholar]
- O’Dowd, D.O.; Zhang, Q.; He, L.; Ligrani, P.M.; Friedrichs, S. Comparison of Heat Transfer Measurement Techniques on a Transonic Turbine Blade Tip. J. Turbomach. 2011, 133, 021028. [Google Scholar] [CrossRef]
- Xue, S.; Roy, A.; Ng, W.F.; Ekkad, S.V. A Novel Transient Technique to Determine Recovery Temperature, Heat Transfer Coefficient, and Film Cooling Effectiveness Simultaneously in a Transonic Turbine Cascade. J. Therm. Sci. Eng. Appl. 2015, 7, 011016. [Google Scholar] [CrossRef]
- Arisi, A.N. Heat Transfer and Flow Characteristics on the Rotor Tip and Endwall Platform Regions in a Transonic Turbine Cascade. Ph.D. Thesis, Virginia Polytechnic Institute and State University, Blacksburg, VA, USA, 4 December 2015. [Google Scholar]
- Kline, S.J. The Purposes of Uncertainty Analysis. J. Fluids Eng. 1985, 107, 153–160. [Google Scholar] [CrossRef]
- Moffat, R.J. Describing the Uncertainties in Experimental Results. Exp. Therm. Fluid Sci. 1988, 1, 3–17. [Google Scholar] [CrossRef] [Green Version]
- Zhong, F.; Zhou, C. Tip Gap Size Effects on Thermal Performance of Cavity-Winglet Tips in Transonic Turbine Cascade with Endwall Motion. J. Glob. Power Propuls. Soc. 2017, 1, CR5JBC. [Google Scholar] [CrossRef]


| Blade chord | 126 (mm) |
| Blade span | 160 (mm) |
| Blade pitch | 102.7 (mm) |
| Number of blades | 6 |
| Cascade inlet angle | 32° |
| Cascade exit angle | 97.7° |
| Tip clearance | 1.25 (% of span) |
| Inlet velocity (Vin) | 30/60/90 (m/s) |
| Inlet Reynolds number (Rec) | 1.82/3.80/5.93 (×105) |
| Inlet Mach number (Ma) | 0.08/0.16/0.25 |
Publisher’s Note: MDPI stays neutral with regard to jurisdictional claims in published maps and institutional affiliations. |
© 2021 by the authors. Licensee MDPI, Basel, Switzerland. This article is an open access article distributed under the terms and conditions of the Creative Commons Attribution (CC BY) license (https://creativecommons.org/licenses/by/4.0/).
Share and Cite
Jeong, J.Y.; Kim, W.; Kwak, J.S.; Lee, B.J.; Chung, J.T. Effect of Mainstream Velocity on the Heat Transfer Coefficient of Gas Turbine Blade Tips. Energies 2021, 14, 7968. https://doi.org/10.3390/en14237968
Jeong JY, Kim W, Kwak JS, Lee BJ, Chung JT. Effect of Mainstream Velocity on the Heat Transfer Coefficient of Gas Turbine Blade Tips. Energies. 2021; 14(23):7968. https://doi.org/10.3390/en14237968
Chicago/Turabian StyleJeong, Jin Young, Woojun Kim, Jae Su Kwak, Byung Ju Lee, and Jin Taek Chung. 2021. "Effect of Mainstream Velocity on the Heat Transfer Coefficient of Gas Turbine Blade Tips" Energies 14, no. 23: 7968. https://doi.org/10.3390/en14237968
APA StyleJeong, J. Y., Kim, W., Kwak, J. S., Lee, B. J., & Chung, J. T. (2021). Effect of Mainstream Velocity on the Heat Transfer Coefficient of Gas Turbine Blade Tips. Energies, 14(23), 7968. https://doi.org/10.3390/en14237968