1. Introduction
State estimation (SE) will be a key element function in smart distribution automation to provide inputs to various functions, such as optimal feeder reconfiguration, capacitor switching, and demand-side management. This function has already become popular to transmission-level power systems for their control and supervision, enabling a large variety of measurements and adopting techniques to detect and identify faulted measurements.
A variety of state estimation algorithms that have been custom-tailored for radial distribution networks are proposed in the literature. A novel approach for estimating the status of electric power distribution system conditions that is focused on using the minimum number of possible remote measurements is proposed in [
1]. In [
2], the usage of real-time measurements with forecasted loads or pseudo-measurements to increase the accuracy of estimated states is suggested, and how power flow and current measurements affect bad-data detection and identification is demonstrated. Reference [
3] proposes an admittance matrix-based (AMB) state estimator for distribution systems, taking into account the real and imaginary components of complex voltages as state variables and converting actual measurements to equivalent measuring data. A methodology focusing on how real-time measurements may increase the accuracy of state estimation results, considering the usage of pseudo-measurements to degrade the state estimation results, is presented in [
4]. A probabilistic formulation of the radial power flow is adopted for the state estimation procedure in [
5]. The distribution state estimation algorithm using the magnitude and phase angles of the branch currents is investigated in [
6].
The traditional WLS approach is considered in [
7,
8,
9,
10]. A minimum set of measurements is determined in [
7] to improve observability and yield acceptable state estimates. In the heuristic technique [
8], the optimal locations for voltage and flow measurements are selected in order to decrease the voltage uncertainty at unmeasured buses. The applicability of different state estimation approaches is evaluated using a statistical framework in [
9]. Current magnitude measurements are transformed to active and reactive power measurements in [
10] utilizing power factor information from the measurement area where the measurements are taken.
Methods [
11,
12,
13,
14,
15] identify the locations for placement of real-time measurements (power flows and voltages) reducing the standard deviation of voltages on the unmeasured buses. In [
11], a stochastic planning research identifies the network locations where measuring data reduces the uncertainty of state estimation results to the lowest level possible. Statistical indices are used to quantify the confidence in the estimated states from a modified power flow [
12]. In [
13], a set of pseudo-measurements and a limited number of real measurements from specific important locations of the system are used to estimate network operational state. The objective of the meter placement procedure [
14] is to minimize the relative errors in the estimates below predefined thresholds, for all network buses, by sequentially adding measurements. An improved state estimation technique for selecting the optimal locations of smart meters and phasor measurement units (PMUs) is proposed in [
15].
WLS methods for load estimation based on historical data in distribution networks can be found in [
16,
17,
18]. Reference [
16] describes a real-time distribution circuit load modeling approach based on stochastic load models. A method based on automatic meter reading (AMR) data and customer class curves is suggested in [
17]. An alternative WLS methodology uses a system state that includes node voltages as well as load change parameters [
18].
The connection of distributed generation (DG) sources [
19,
20,
21,
22] will result in meshed distribution networks for which only the classical SE techniques are applicable. Reference [
19] suggests a distributed control paradigm for microgrids based on a multi-agent system. An advanced algorithm based on a virtual power plant (VPP) approach is introduced in [
20]. A methodology for evaluating the technical aspects of connecting DG to the distribution network based on conservative (safe-side) assumptions is proposed in [
21]. The method [
22] examines the integration of the AMR system with supervisory control and data acquisition (SCADA) and distribution-management-system (DMS) control center applications to employ AMR meters in real-time monitoring and fault indication in low-voltage networks.
Different aspects, like the accurate solution for multi-area state estimation in distribution grids based on a modified WLS formulation [
23] and the inclusion of any type of measurement regardless of their statistical model through a Bayesian approach [
24], have also been included to the SE problem. The reduction of the execution time of the decentralized information filter for the system decoupling by means of the stochastic collocation [
25] and the exploitation of smart meter measurements for monitoring medium and low-voltage distribution grids [
26], have been also considered in the SE literature. Finally, the influence of correlations on the quality of the estimation [
27], the impact of current and power measurements on the accuracy of the estimator [
28], the consideration of uncertainties related with smart meter measurements bounded according to the vendor’s specifications [
29], and the improvement of measurement redundancy and robustness of the robust ensemble Kalman filter for bad data and unknown system process noise [
30], are some other topics discussed and incorporated for the SE.
The condition of various switching devices in distribution networks may be unknown or suspicious since reconfiguration operations are prevalent and the number of telemetered measurements is generally limited. Consequently, it is not possible to find and fix one topology beyond any kind of uncertainty. Before beginning the SE process, only one topology should be considered and the formulation should be flexible enough to detect topology changes [
31,
32,
33,
34,
35,
36]. Considering smart distribution networks integrated with microgrids and a specified number of actual measurements, the load data can be extracted by historical or forecasted data and smart meters. The main contributions of this paper are summarized in the following:
A WLS state estimation formulation with equality constraints is proposed.
A high-performance solver is used for the sparse symmetric indefinite system of state estimation equations.
State estimation algorithm can be executed in either grid-connected or islanded operation mode.
Single or multiple breaker status errors at the main substations and feeders are effectively identified.
The paper is organized as follows.
Section 2 presents the control architecture of the distribution network. In
Section 3, the actual, virtual, and pseudo-measurements are processed using a WLS procedure constrained by equalities. The status of switching devices is monitored, adopting the state estimation formulation presented in
Section 4. The impact of switching operations on distribution systems in terms of network splitting is studied in
Section 5.
Section 6 examines the efficiency of the proposed algorithms using a 55-bus distribution network with distributed power generation.
Section 7 concludes the paper.
2. Control Architecture of the Distribution System
The structure of a distribution system is mainly radial, consisting of radial feeders having single or two-phase laterals and loads on the feeders that can be single- and two-phase (for residential customers) or three-phase (for commercial and industrial customers). Therefore, distribution systems are unbalanced in nature. Moreover, distributed generation (DG) units may be connected directly to the distribution network. The penetration of DG will change the characteristics of the existing radial distribution networks, which will be no more passive with unidirectional power flows. Feeder line sections are characterized by high ratios and they are usually un-transposed and short. This characteristic renders the conventional decoupling, exploited in transmission system analysis, inappropriate. There are also more switching operations in distribution systems, making the task of keeping an up-to-date network model difficult. Considering the impact of either the preplanned switching operations or the disturbances that may occur, the distribution network operates in two possible modes, namely, grid-connected or islanded.
Advanced Distribution Management Systems (ADMS) offer smart monitoring and control of various devices at substation and feeders (circuit breakers (CB), reclosers, line switches, capacitor banks, etc.) and provide the dispatchers with accurate state estimates [
37,
38,
39,
40,
41]. In [
37], the cooperation of multilayered load agents maximizes the customer comfort and minimizes the energy consumption at the same time. Considering new technologies such as advanced metering, automation, communication, distributed generation, and distributed storage, the impact of smart grid-related challenges on distribution system design is examined in [
38]. The distribution system operator (DSO) may control the capacity and output of the connected DG in real-time considering an enormous amount of sensor data [
39]. State estimation and locational marginal pricing considering the impact of advanced electronic control in distribution systems is examined in [
40]. A new smart grid architecture for active distribution systems that allows the continuous monitoring of distribution system operations as well as a customer’s power consumption is described in [
41].
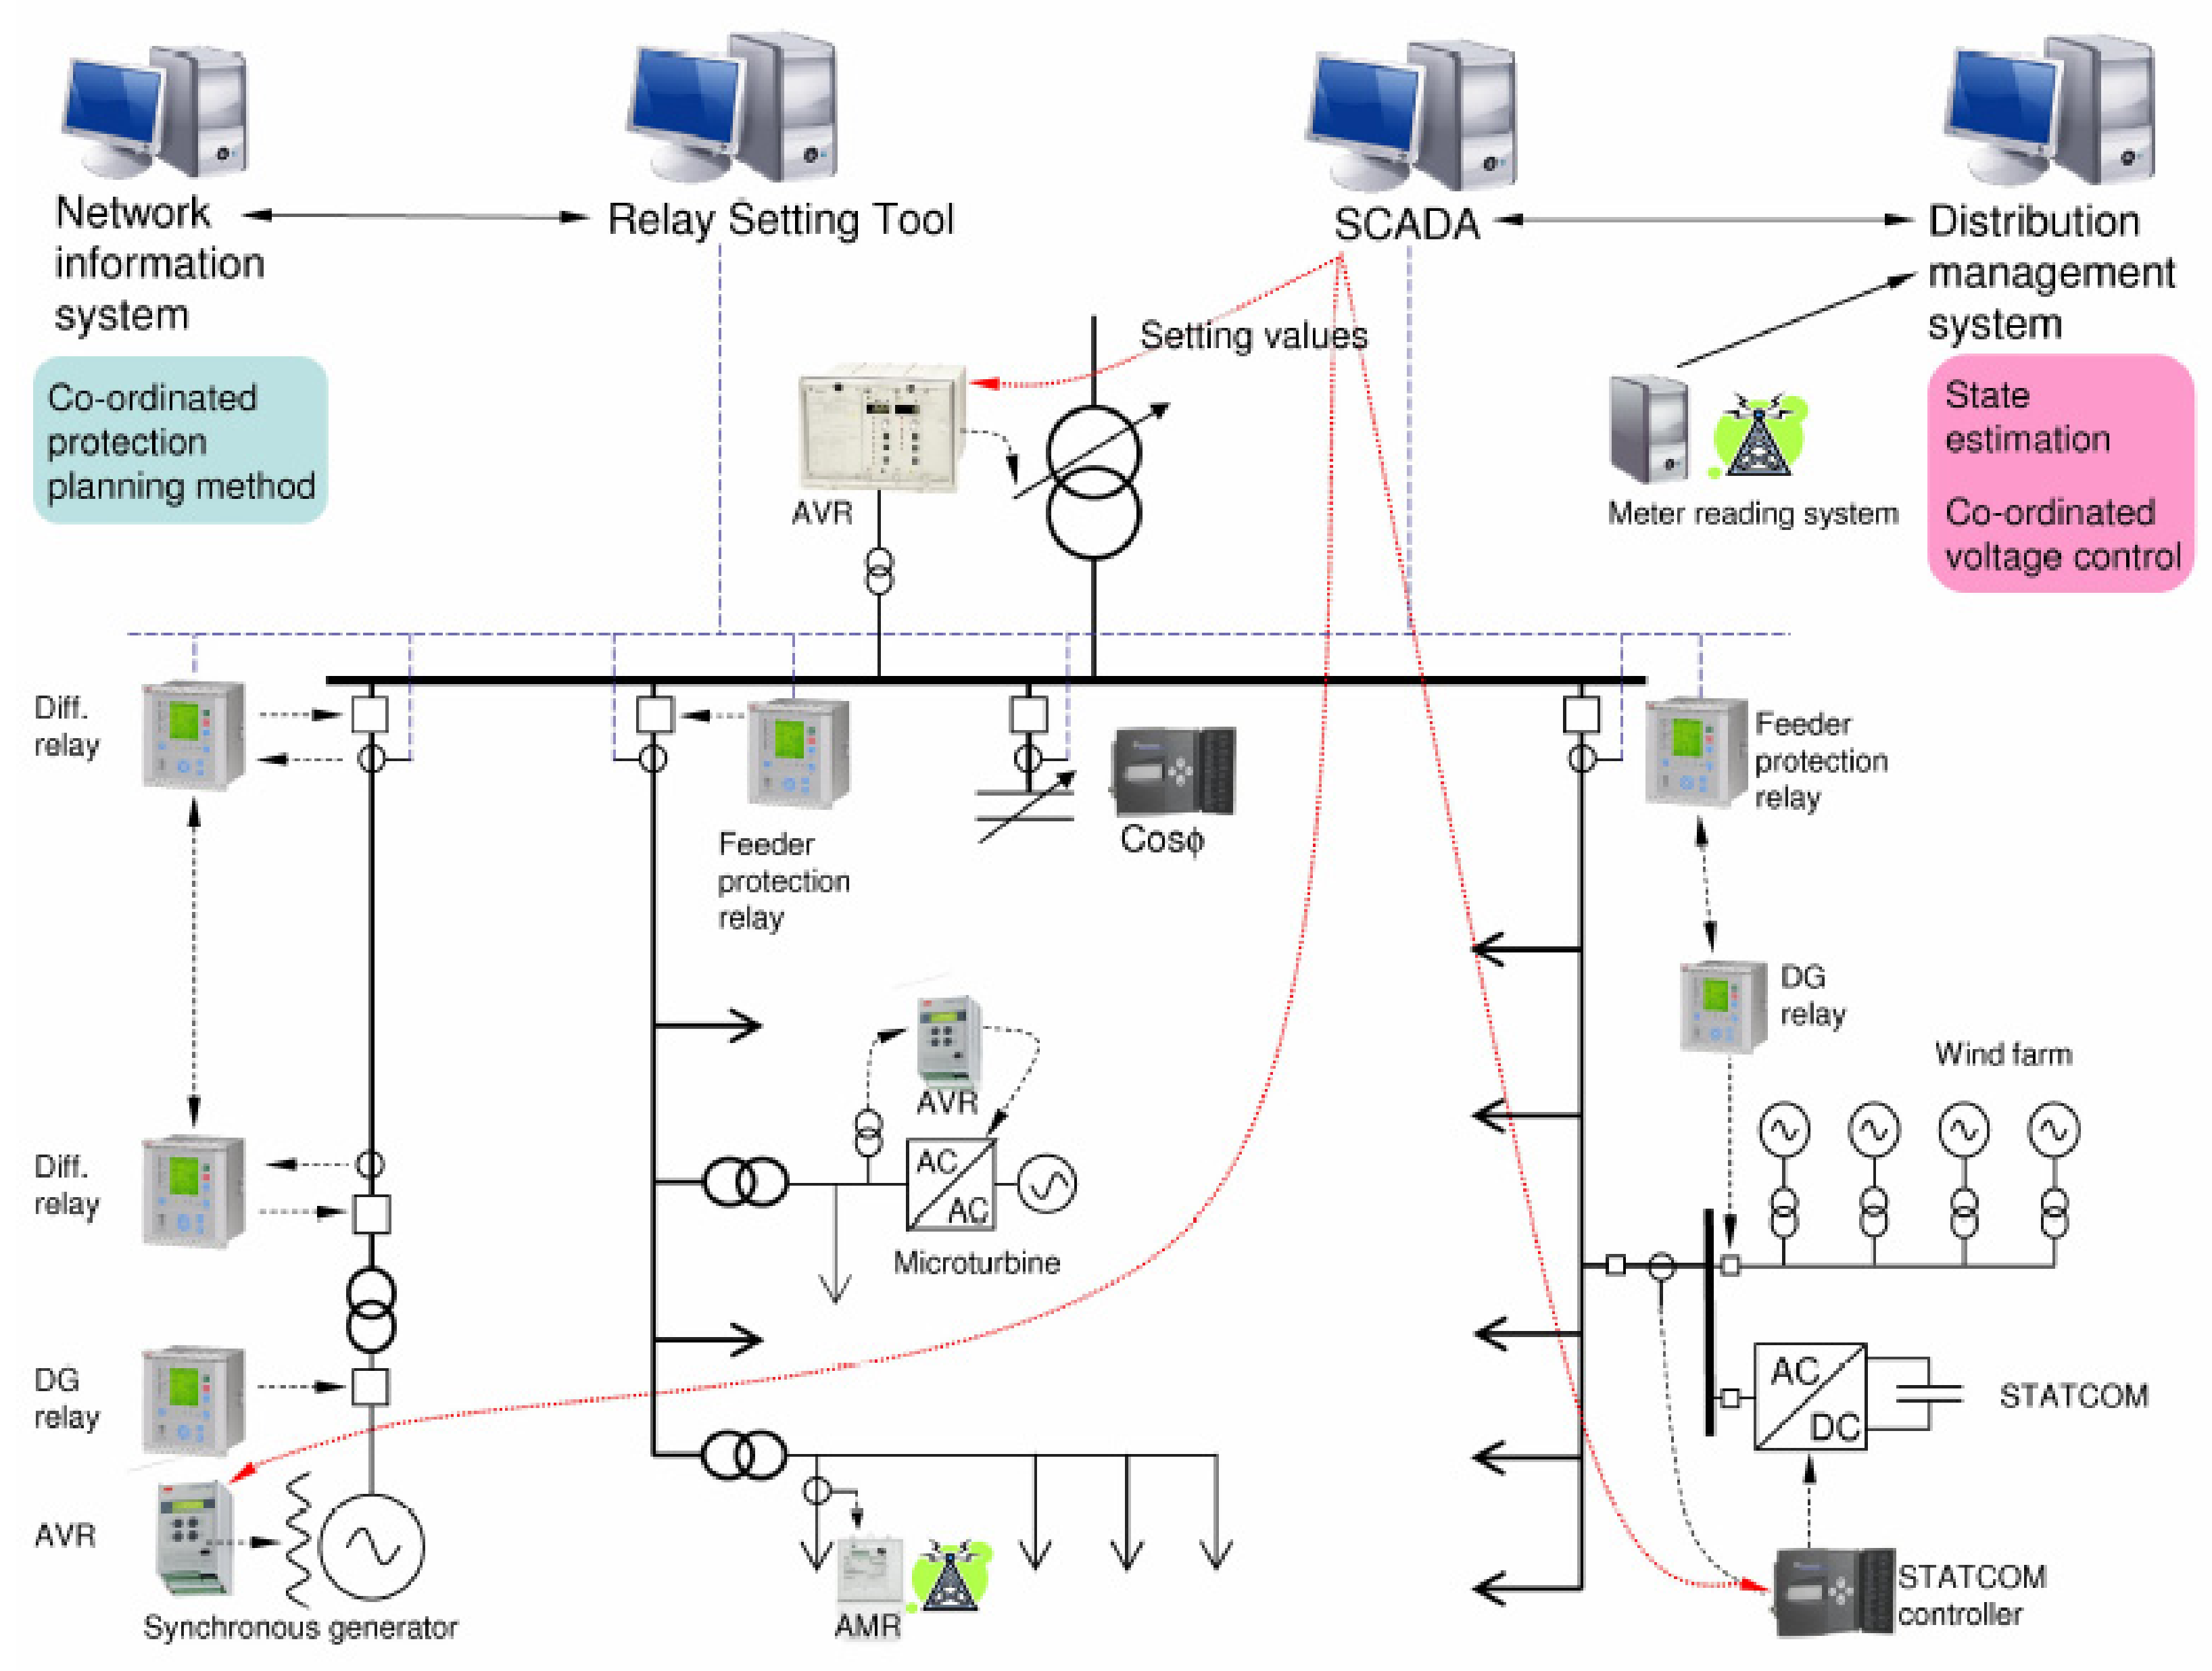
ADMS should automatically detect topology reconfigurations of the smart distribution grid and reformulate the state estimation problem. In
Figure 1, the control levels of the smart distribution network with embedded microgrids are shown, as proposed in [
22].
The telemetering of all points in a distribution system is impossible since the number of connected consumers is large.
The available set of measurements on a distribution system includes current, power flow, and voltage active measurements on feeder heads as well as on the primary of distribution substation transformers. Moreover, the measurement set includes power injection and voltage active measurements on distributed generators and measurements related with switching devices statuses. Finally, pseudo-measurements of loads related with the unmeasured buses of the distribution system based on forecasting and historical data are also included in the set.
The load data can be modeled from one of the following sources:
Historical samples obtained for different seasons, days and times, are stored separately for different load types (residential, industrial, and commercial). The main problem is that most companies do not update this data often enough.
Advanced Metering Infrastructure (AMI), which transfer customer load information to the utility DMS in a bidirectional way [
42,
43].
Automated Meter Reading (AMR) systems, which transmit energy consumption data to the utility for billing, between defined time intervals (minutes to hours), in a unidirectional way [
10].
Advanced AMR meters, which work as intelligent monitoring devices and utilize the communication infrastructure to provide vital information on low voltage levels [
44,
45].
Smart GPS synchronized PMU devices are located at strategic nodes of the network to measure voltage and current phasors [
41].
3. The State Estimation Algorithm
We employ the widely used weighted least squares (WLS) algorithm for estimating the state of the distribution system, which is assumed to be balanced and represented by the single-phase model. The mathematical formulation is based on the blocked sparse matrix methodology [
46], avoiding the possibility of ill-conditioned cases [
47], and can be written as follows:
where
, and
and
represent the
“squared” and
“unsquared” measurement vectors, respectively, vector functions
and
non-linearly correlate the measurements with the vector of true states
, while the virtual measurements are modelled by the vector function of true states
.
Assuming that the measurement errors are independent and uncorrelated following a Gaussian distribution with zero mean, diagonal matrices and represent the covariance matrices of errors. Note that power injection measurements corresponding to vector are expressed in an unsquared form, while the rest of the measurements corresponding to vector are expressed in a squared form, respectively.
The estimated vector
is obtained using the following iterative scheme [
40]:
where
, and
are the measurement Jacobian matrices corresponding to active squared, unsquared, and virtual measurements, respectively,
,
, while
and
are the Lagrange multipliers. The sparse symmetric coefficient matrix of Equation (2) is indefinite, which means that 1 × 1 and 2 × 2 pivoting for numerical stability must be combined with sparsity-oriented techniques for its triangular factorization [
48,
49].
The observability of the network is checked by examining the singularity and the rank of the coefficient matrix presented in (2). The network is said to be observable if
[
46], otherwise the observability restoration is achieved by using a hybrid-numerical algorithm and additional measurements [
50].
Detection and identification of bad data is very important since these errors have a significant impact on the state estimation process. It is proven that for a single or multiple non-interacting bad data, a measurement is suspected as a bad datum if its normalized residual is the largest,
, with 0.27% false alarm probability [
51], and it must be removed from the set of measurements before a new successive estimation cycle. This procedure is repetitively implemented until removing all bad data.
There are two major categories of measurements, namely, noncritical (
redundant) and critical (
nonredundant). A critical measurement is defined as a measurement that renders the network unobservable when it is eliminated from the set of measurements. Noncritical measurements have nonzero residuals, allowing detection and possibly identification of their errors. Critical measurements have zero residuals and therefore their errors cannot be detected. A set of measurements is defined as a minimally dependent set (MDS) if the elimination of any measurement from this set, makes the remaining measurements critical [
52]. All the measurements of a MDS have equal absolute values of their normalized residuals [
52]. As a consequence, gross error on one or more measurements of a MDS can be detected but not identified. Since the measurement redundancy is low in distribution networks, a few critical measurements and minimally dependent sets may occur, making the bad data elimination process rather difficult. This is the reason why historical or forecasted load pseudo-measurements should be as accurate as possible.
4. Monitoring of Switching Devices
In conventional state estimation, the statuses of switching devices (switchers, breakers, fuses, sectionalisers, etc.) are processed by the network topology processor to define the bus-branch network model, by merging bus sections joined by closed switching devices into buses. The status of these switching devices can be telemetered or entered manually by system operators. Thus, the topology is assumed to be known and correct. Since the topology of a distribution system frequently changes, an initial topology has to be proposed to start the SE process. This formulation should be quite flexible to allow topology changes and identification of status errors. To solve this problem, an enhanced generalized state estimation is proposed. The state vector is extended by the active and reactive power flow (
and
) and the probabilistic status (random variable)
(
) of each switching device
with unknown or unsecure status [
31,
53]. In this way, the topology will be estimated at the same time with analog information.
Consider that the variables
,
,
,
,
,
,
represent the true values of the angle, voltage, active, and reactive power flow and switching status of a switching device
, the superscript
stands for measured values, and the variables
represent the measurement errors, the real-time, and pseudo-measurements. They are summarized in
Table 1 and
Table 2, respectively. In
Table 1, the set of buses connected to bus
through distribution lines or switching devices are denoted with
and
, respectively. In
Table 2, note that initiated open and closed statuses correspond to zero power flow and voltage drop on the switching device
. Considering the actual open (closed) status of the switching device
, the last (first) two general mathematical expressions as well as the expressions correspond to the initiated open (closed) measured status of the
Table 2 and become equality constraints.
5. The Splitting Problem
Every subnetwork of the system that includes a set of interconnected buses with (without) generation capability is called an energized (isolated) island. The successive implementation of the state estimation process requires the selection of a local angle reference bus for each observable energized island. If the switching devices have an unknown or suspicious status, the number of islands is, a priori, unknown as well as the number of angle reference buses.
The splitting problem is related to the determination of state variables in all electrically disconnected and energized islands. Generally, when the network topology is known and fixed, the total network can be considered as a pre-defined number of islands or a unique connected island and the splitting is not feasible due to the assumption of a unique angle reference bus.
The uncertainties on the switching device statuses lead to overestimated or underestimated numbers of the system islands in comparison with the real existing one. The splitting of the network to more than one disconnected island, due to the reporting of open status switching devices, leads to a non-observable network and inability to estimate the system states.
The splitting problem is solved considering a reference angle for each separated island of the network or a single reference angle for a completely connected network. More specifically, considering the reported open status of a set of switching devices
, let a network be divided to
islands. The island 1 is initially chosen as the island including the global reference bus of the network. For every other island of the network, a critical pseudo-measurement is introduced as follows:
To solve this problem, an enhanced generalized state estimation is proposed. The state vector is where and belong to different islands and is the angle of the reference bus in island with respect to that of island . Practically, a Gaussian noise is added at the right hand side of (3) to introduce a degree of uncertainty.
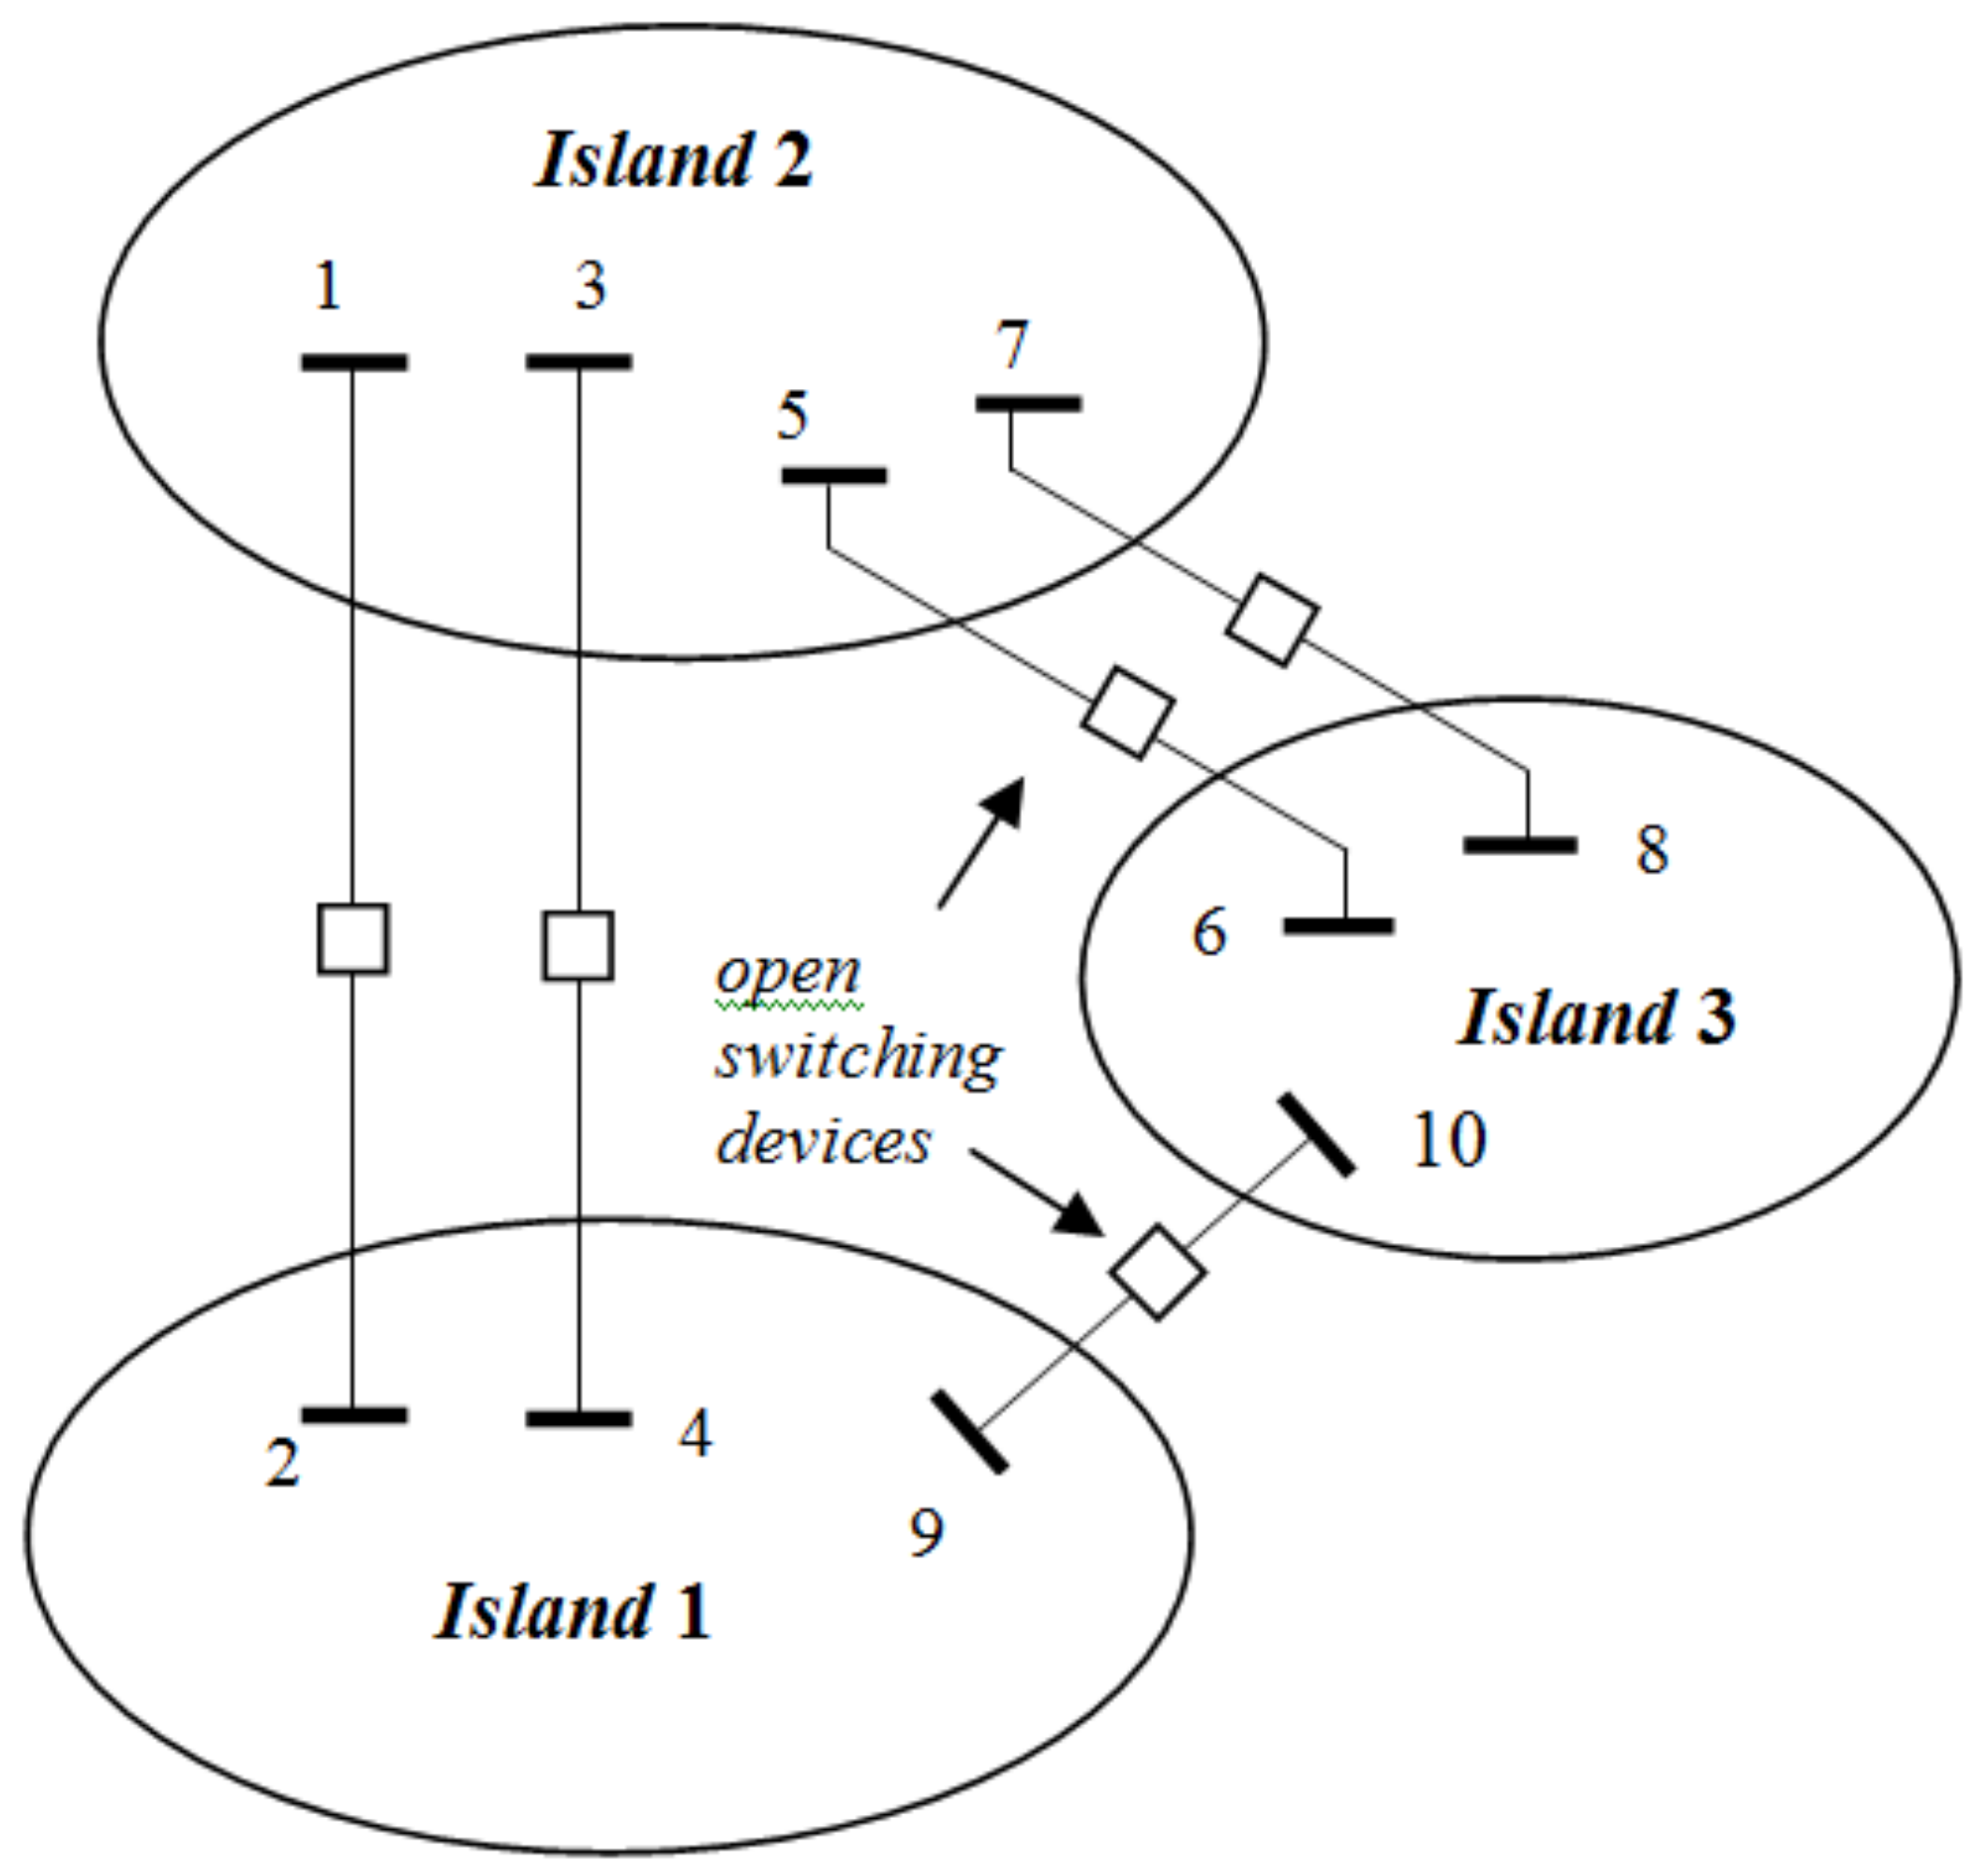
The illustrative example of
Figure 2 is used to describe the above method considering the splitting of a network to three islands and focusing on Island 2.
The following pseudo-measurement of type (3) is introduced:
If the actual statuses of switching devices related with Island 2 are open, , the Island 2 is isolated, having its own local reference bus for the local estimation of its states (). Alternatively, if, during the iterations, the actual status of any switching device related with Island 2 is closed, there is no influence on the angle of the local reference bus since and two critical pseudo-measurements of type (3) are needed to render the network observability and permit the estimation of the state vector.
6. Test Results
The proposed state estimation algorithms are implemented in a MATLAB (Mathworks, Inc., Natick, MA, USA) environment. For solving the sparse symmetric indefinite system (2), the very efficient and robust linear solver MA57 (Rutherford Appleton Laboratory, Chilton, UK) [
49], written in Fortran 90, is called from MATLAB. The Fortran subroutines of the MA57 program are converted to MEX-files, which behave just like M-files and are built-in functions that the MATLAB interpreter can automatically load and execute.
The proposed methods are illustrated with a balanced distribution network whose schematic diagram is shown in
Figure 3. Network data for the network can be found in [
54]. The network consists of 55 buses, 10 generation buses, 27 lines, 27 transformers, 16 load buses, and 3 capacitor banks. Bus 60 is the main high voltage (HV) supply point through a 150/15 kV, HV/MV transformer. Five microgrids are connected at the low voltage (LV) buses 3, 8, 10, 16, and 21 (0.4 kV), having the same mix of distributed generators: a small doubly-fed induction machine (DFIM) coupled to a wind-generator, a fuel cell, a microturbine, a photovoltaic generator, and a storage element connected to the grid via a voltage source inverter (VSI). A large VSI, a large DFIM, a hydro, a combined heat and power (CHP), and a small diesel (70) generator are connected to MV buses 73, 72, 90, 80, and 70, respectively. The network also includes three capacitor banks at buses 71, 90, and 34. Buses 31–33, 35–46, 48–56, 61, 73, and 81 are zero-injection buses. All breakers are assumed to be normally closed (NC) except breakers in line 81−40. The remaining LV buses are load buses.
The active and reactive power of a load bus considering the transformer rated power supplying the bus in
MVA, the % loading, and the load power factor,
PF, are calculated in
MW and
MVAr, respectively, as follows:
Table 3 summarizes the measurement types, numbers, and locations related to the measurement configuration of the 55-bus distribution system shown in
Figure 3. The number of measurements and states is 134 and 109, respectively. Thus, the measurement redundancy is 1.23, which is rather low.
Noisy measurements are generated by adding a Gaussian noise to the true measurements as shown:
where
is the measured value,
is the true value provided by a load-flow solution,
is the standard deviation of the measurement error, and
is a
random number. If
is the mean value of the
measurement, then a
deviation around the mean covers about 99.7% of the Gaussian curve. Consequently, the standard deviation
will be given by [
9]:
The measurement error for voltages, power flows and injections, as well as for load pseudo-measurements, is considered equal to 1%, 3%, and 15%, respectively.
The bad data simulations are conducted by adding gross errors to some measurements according to the following equation:
where the multiplier
.
Since the load pseudo-measurements are statistical in nature, we use the state error covariance matrix to assess the accuracy of the state estimation solution [
8]:
The
diagonal entry
of
is the variance of the
state. To avoid the explicit computation of the dense matrix
, the diagonal elements
are computed by the effective sparse inverse matrix method [
55].
By an expression similar to (7), we compute the uncertainty of each state:
where
is the true state value (voltage or angle) of the
bus.
It is proven that the measurement configuration of
Table 3 ensures the network observability and all measurements are non-critical. The measurement system contains 24 minimally dependent sets as shown in
Table 4.
6.1. Bad Data Identification Considering Grid-Connected Operation
The capability of the state estimation algorithm to efficiently identify bad data will be tested assuming two cases.
Case 1: Gross errors of
and
are added at the voltage measurements of DG buses 3 and 21, respectively. The five largest normalized residuals, sorted in descending order, for two identification/elimination cycles of the
are given in
Table 5. After removing the two bad data, the test is terminated since all the
values are below the detection threshold 3. As can be seen, voltage magnitude errors have a big influence in the estimated values of voltage magnitude and reactive injection measurements.
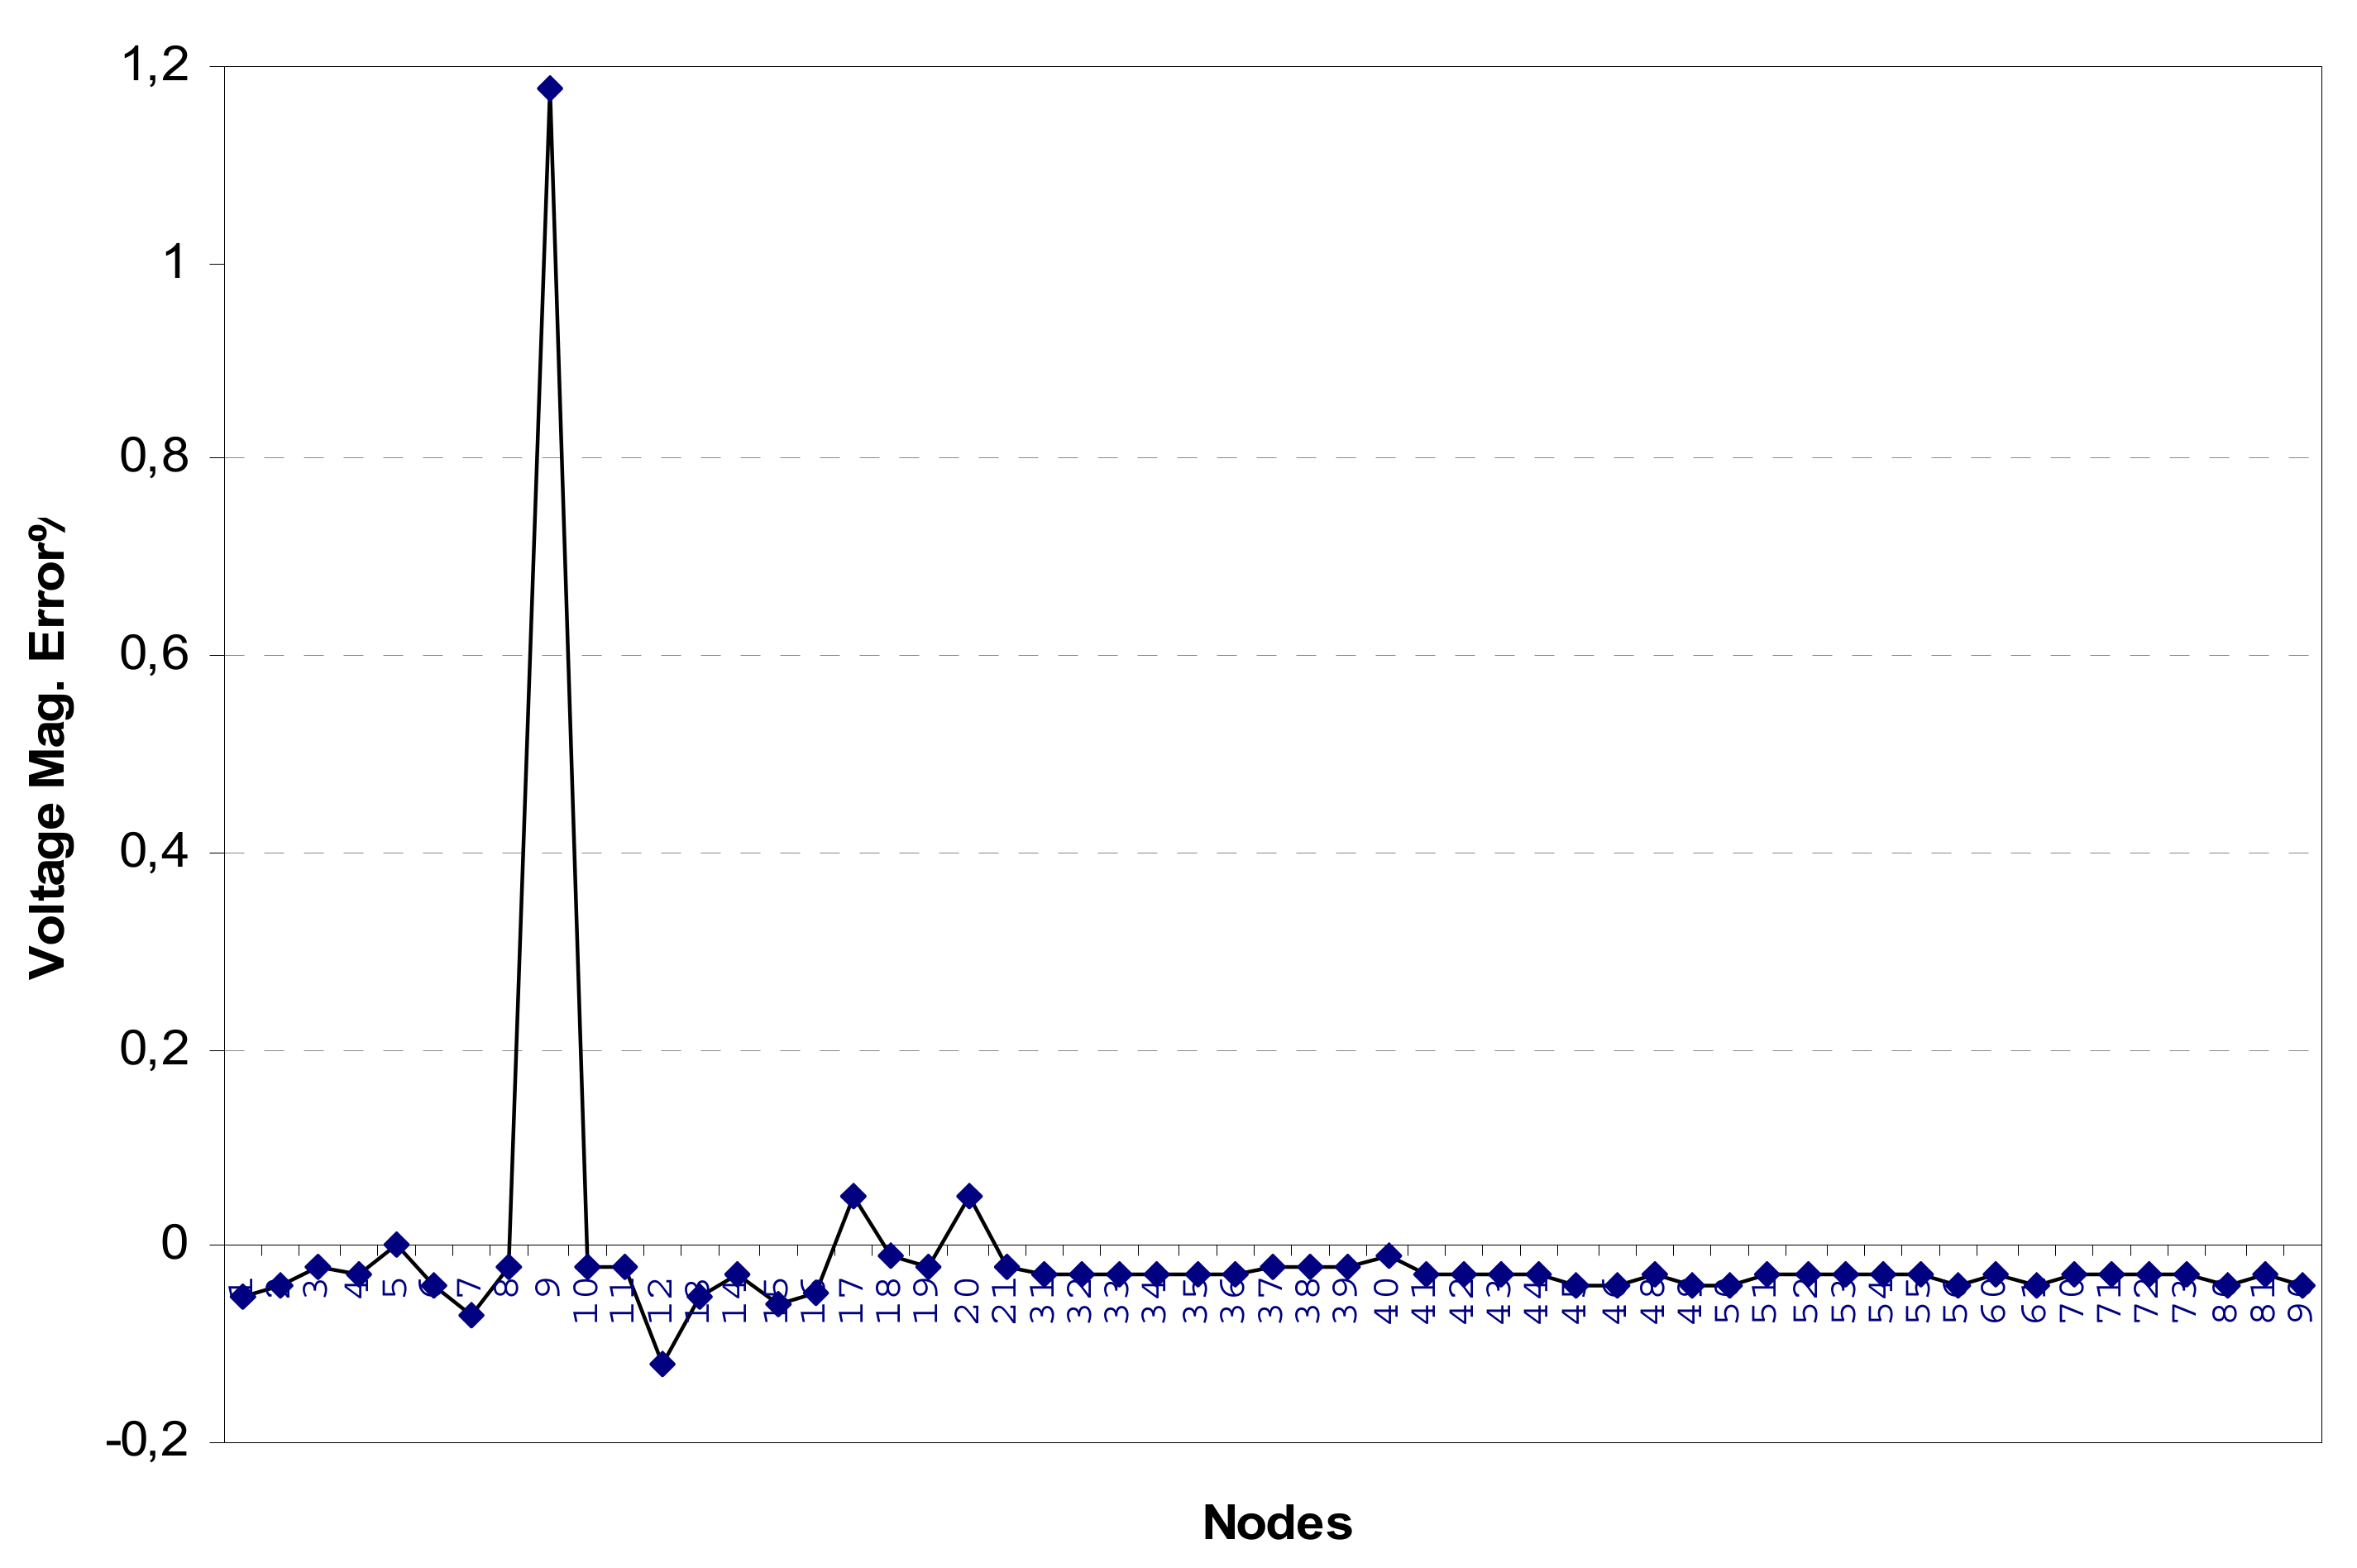
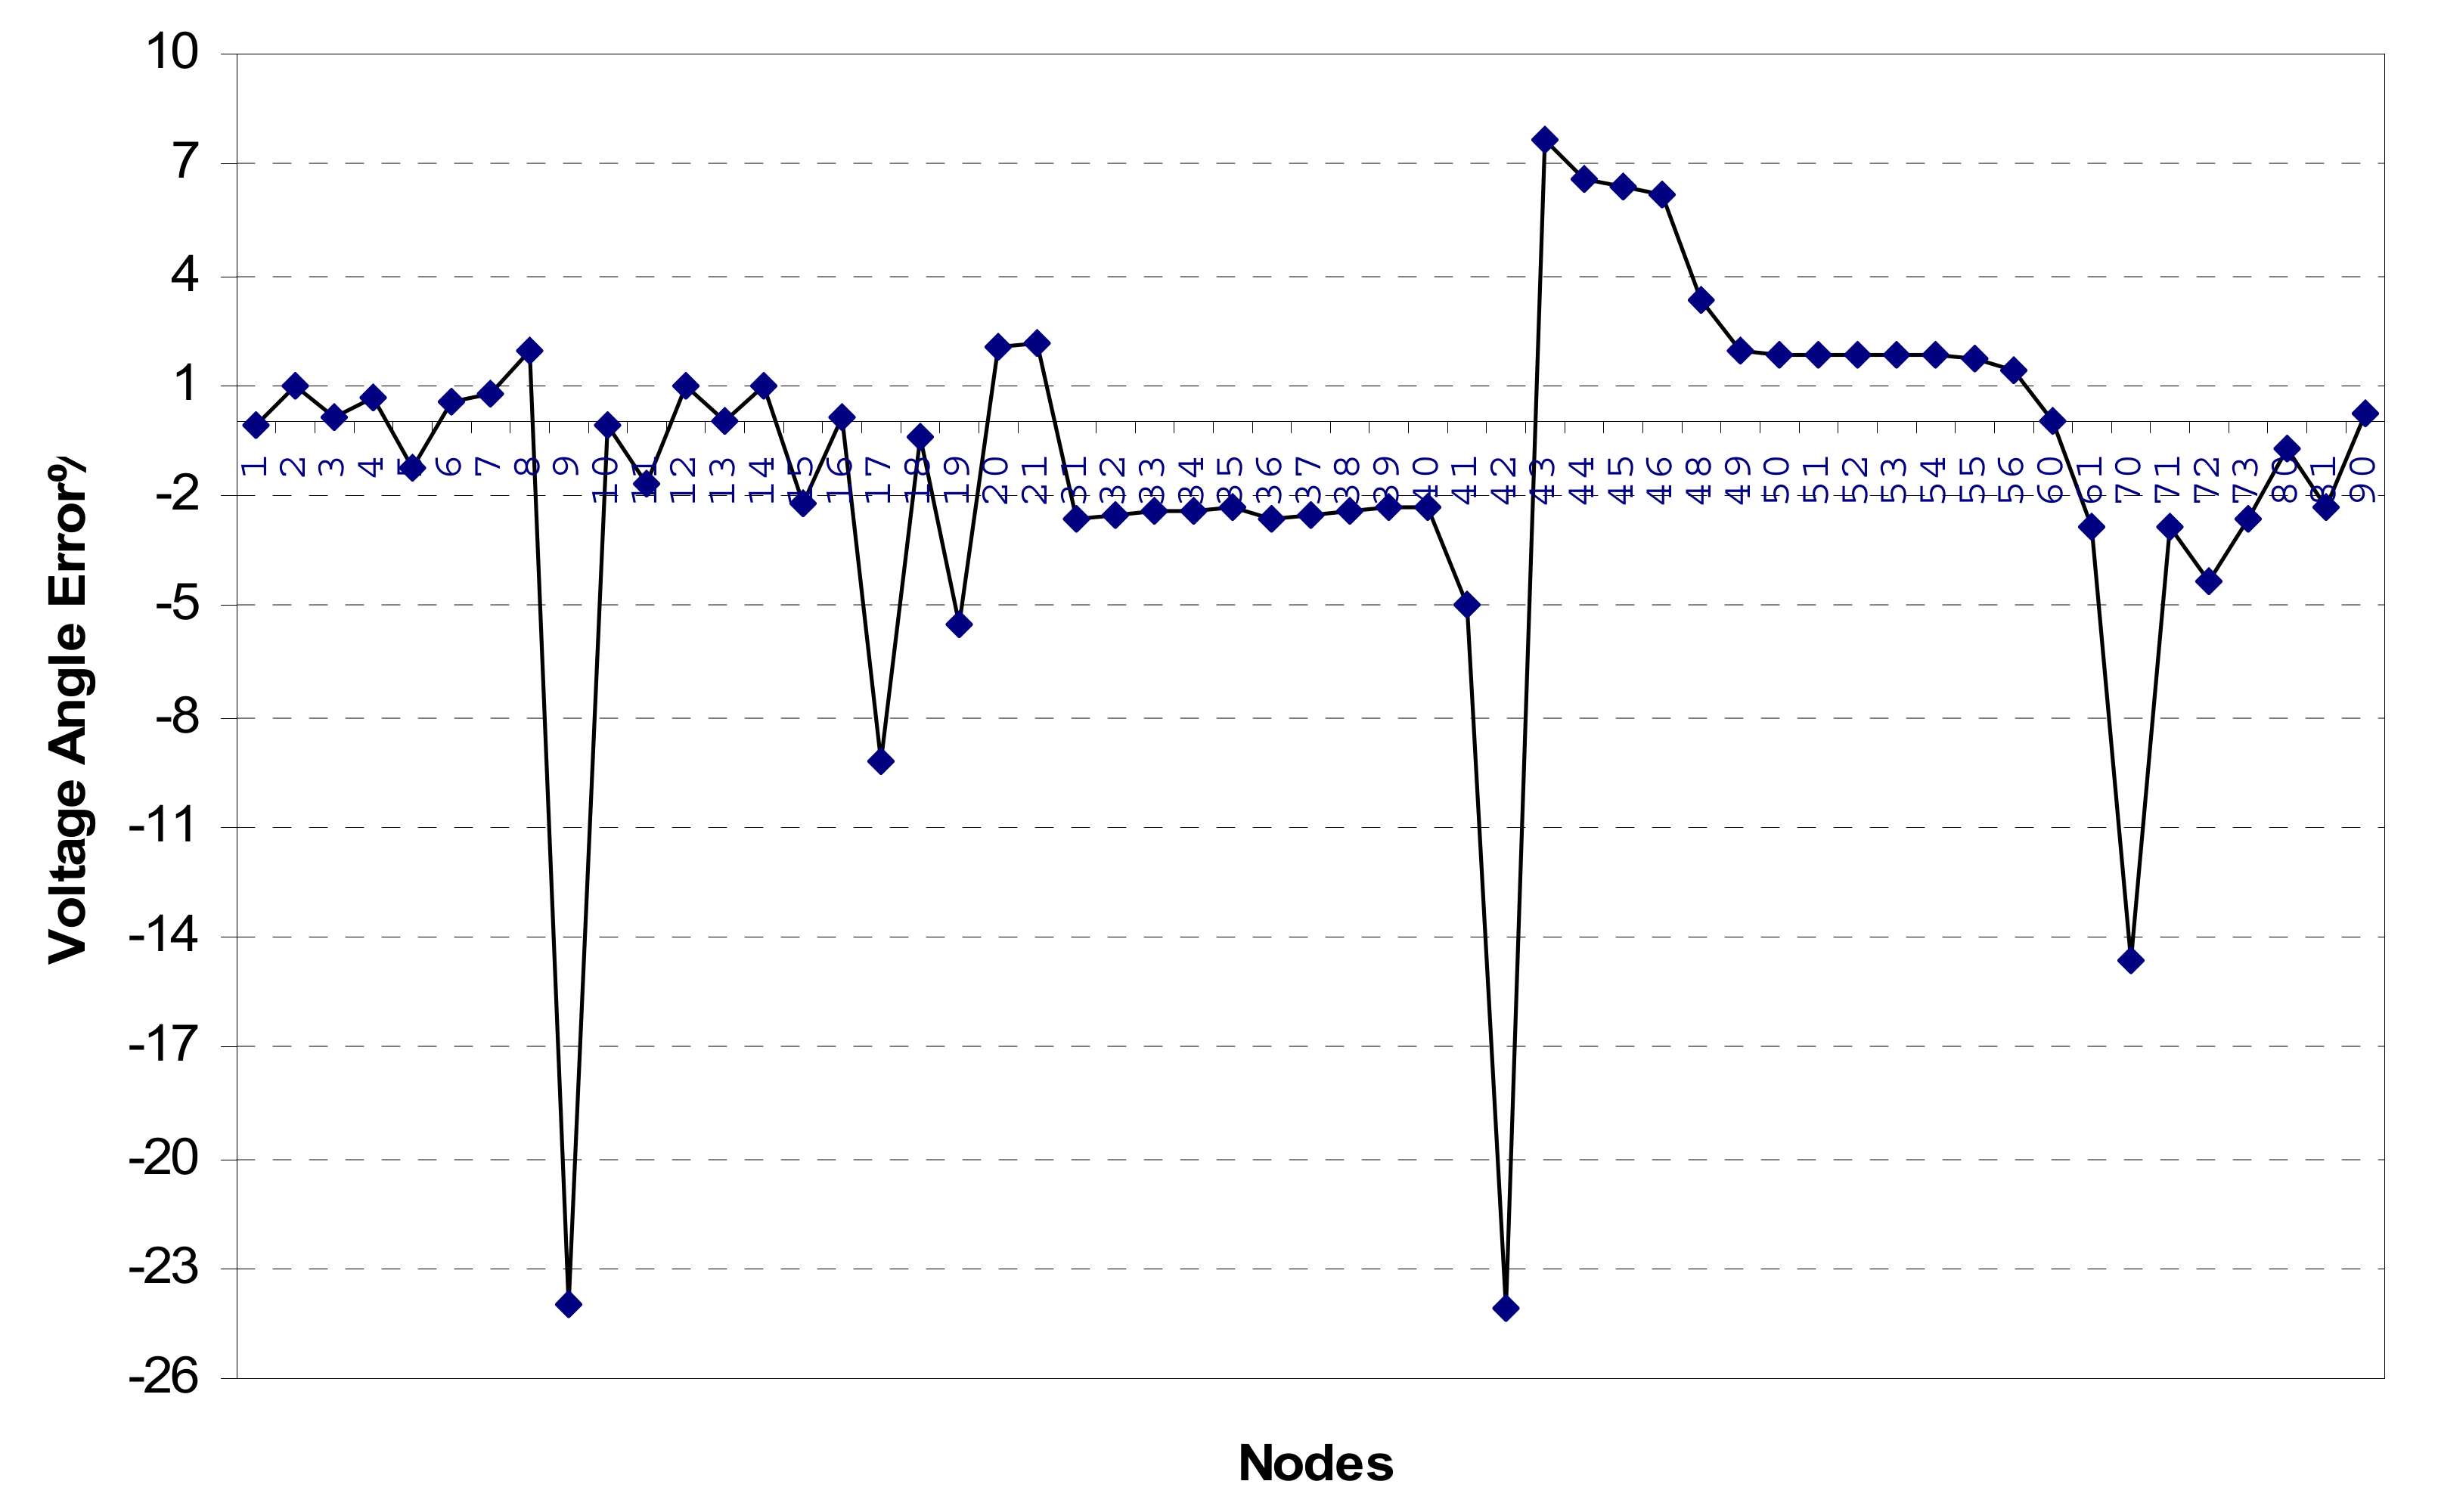
Case 2: Bad data of
and
are introduced to the active and reactive power injections at load bus 9. The percent errors of the bus voltage magnitudes and angles with regard to the true values are defined by:
where
and
are the true and the estimated values of voltage magnitude and angle of the
bus, respectively.
Figure 4 and
Figure 5 show the percent voltage magnitude and angle errors for all network buses.
As can be concluded, the effect of load model accuracy is more significant on voltage angle estimates, because of the very low reactive load consumption. We reach similar conclusions for any of the load buses.
The reactive power injection , which has the largest normalized residual , can be identified as a bad datum and removed, because zero injection , which belongs to MDS #8 with , is modeled as an equality constraint (perfect measurement). After removing this bad data and reevaluating the normalized residuals, the active injection , which has the largest and belongs to MDS #7, is identified as bad data.
6.2. Topology Errors Considering Islanded Network Operation
The islanded operation is simulated, introducing three fictitious buses, namely 100, 101, and 102, to explicitly model the three breakers at the feeder heads. Analog measurements are assumed to be error-free. The reported statuses of switching devices 71−100 and 71−102 are open whereas their actual statuses are closed as presented in
Table 6.
The reported statuses of the switching devices have as a result the network splitting into three energized islands and the singularity of the coefficient matrix. To overcome singularity and identify the correct topology (breaker statuses), we introduce two pseudo-measurements of type (3) for the two islands created:
Note that buses 100 and 102 are selected as the reference buses for the islands formed by feeders 1 and 3, respectively, while no pseudo-measurement is considered for the island which contains the infinite bus.
After a cycle of successive state estimation runs and a successful bad data identification and elimination procedure conducted until
, all bad data are identified.
Table 7 presents the estimated status for each switching device and state estimation run along with the three largest normalized residuals. It should be noted that an identified bad status is not removed but is replaced by its correct value. After identifying and correcting the two bad status data, the test is terminated since all the
values are below the detection threshold 3.
6.3. Bus Voltage Uncertainties Considering Grid-Connected Operation
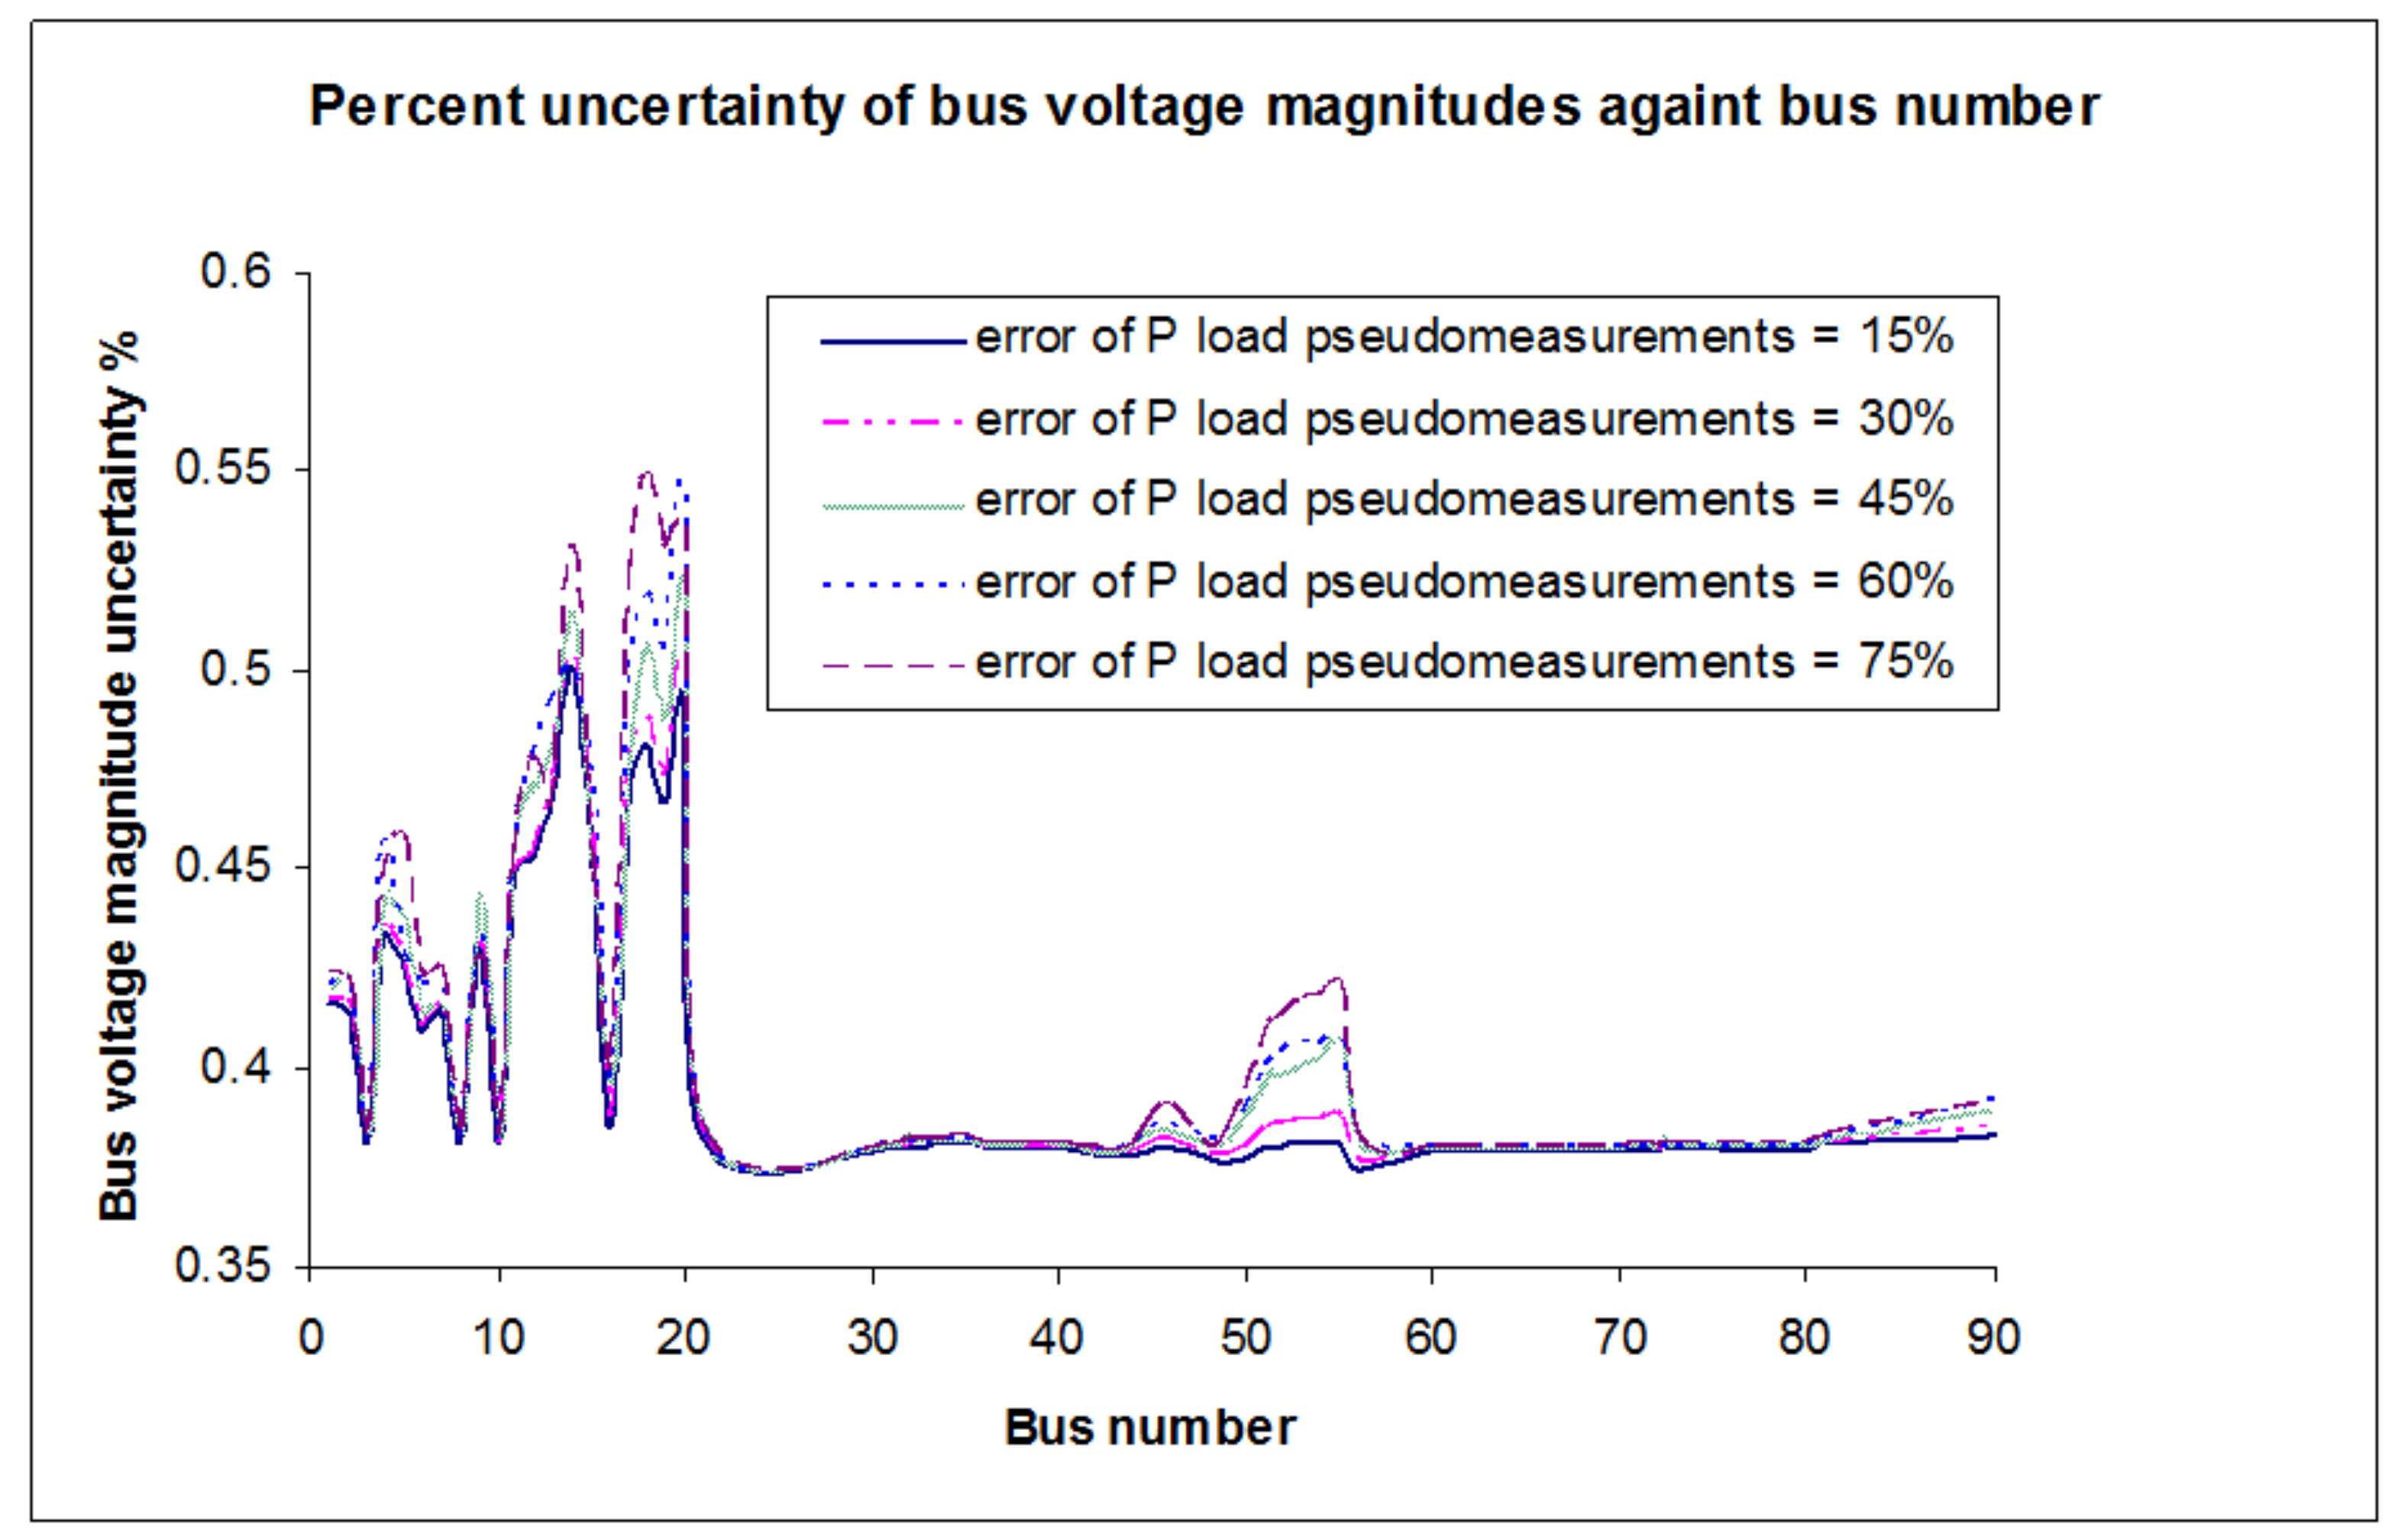
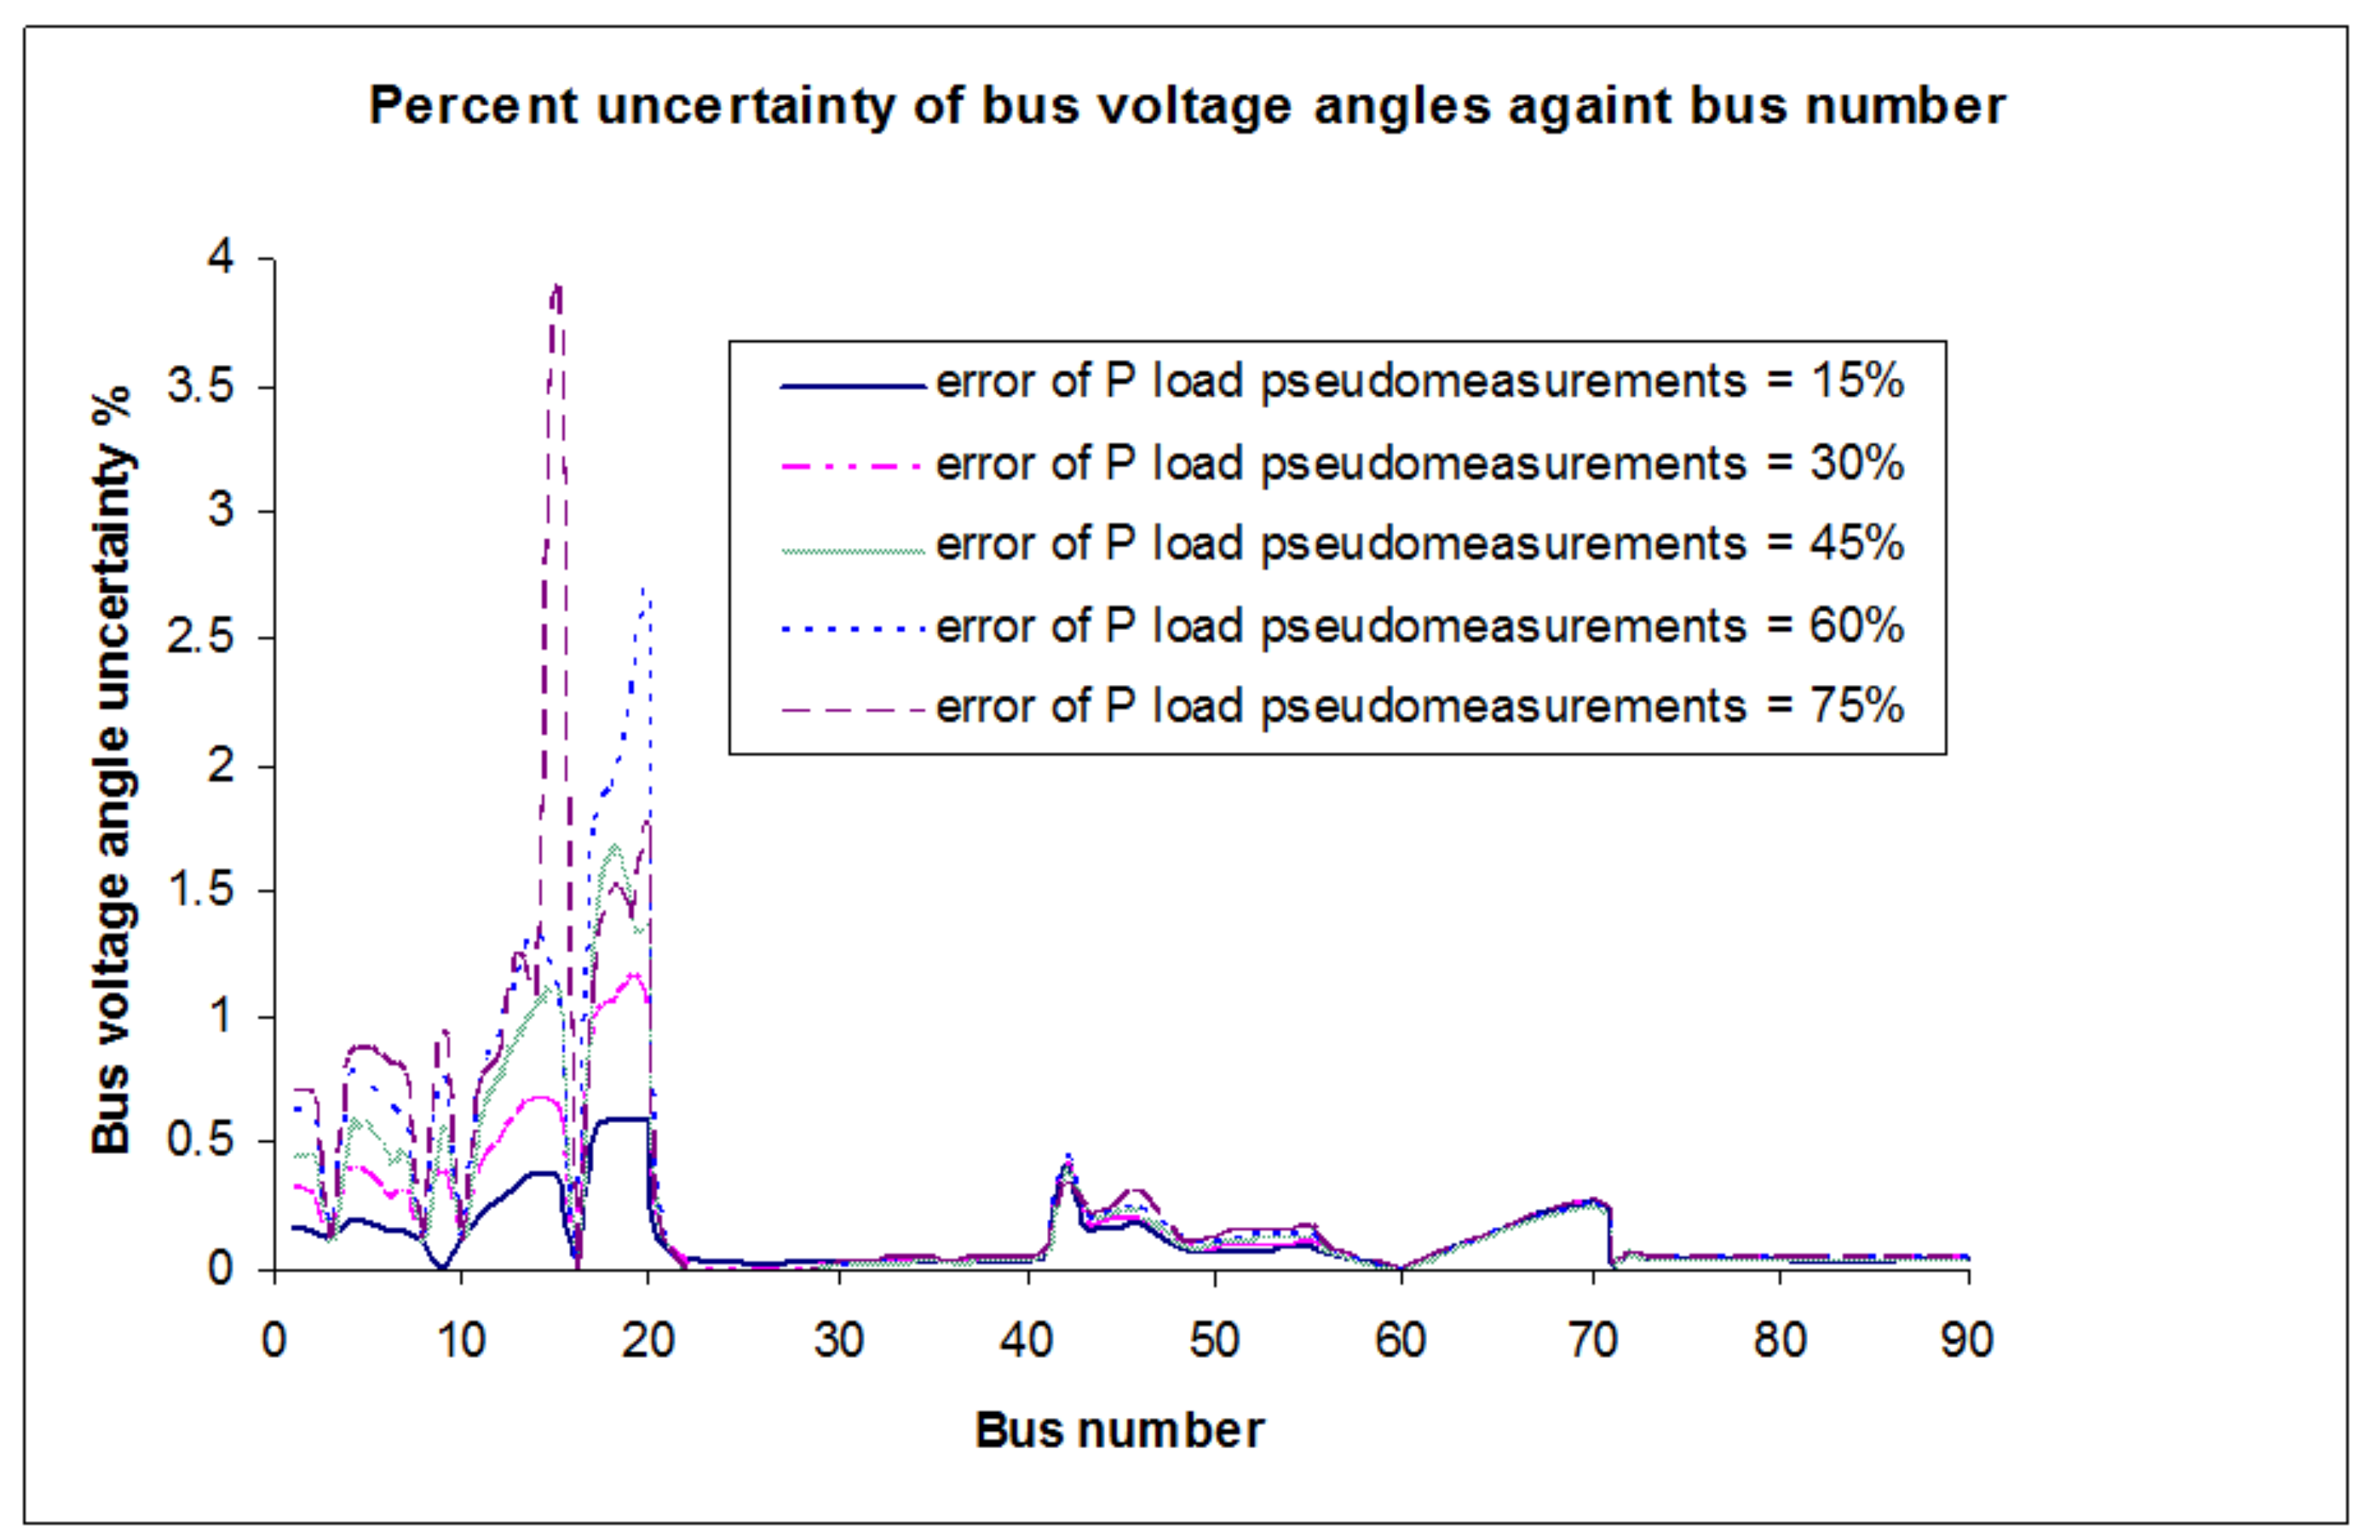
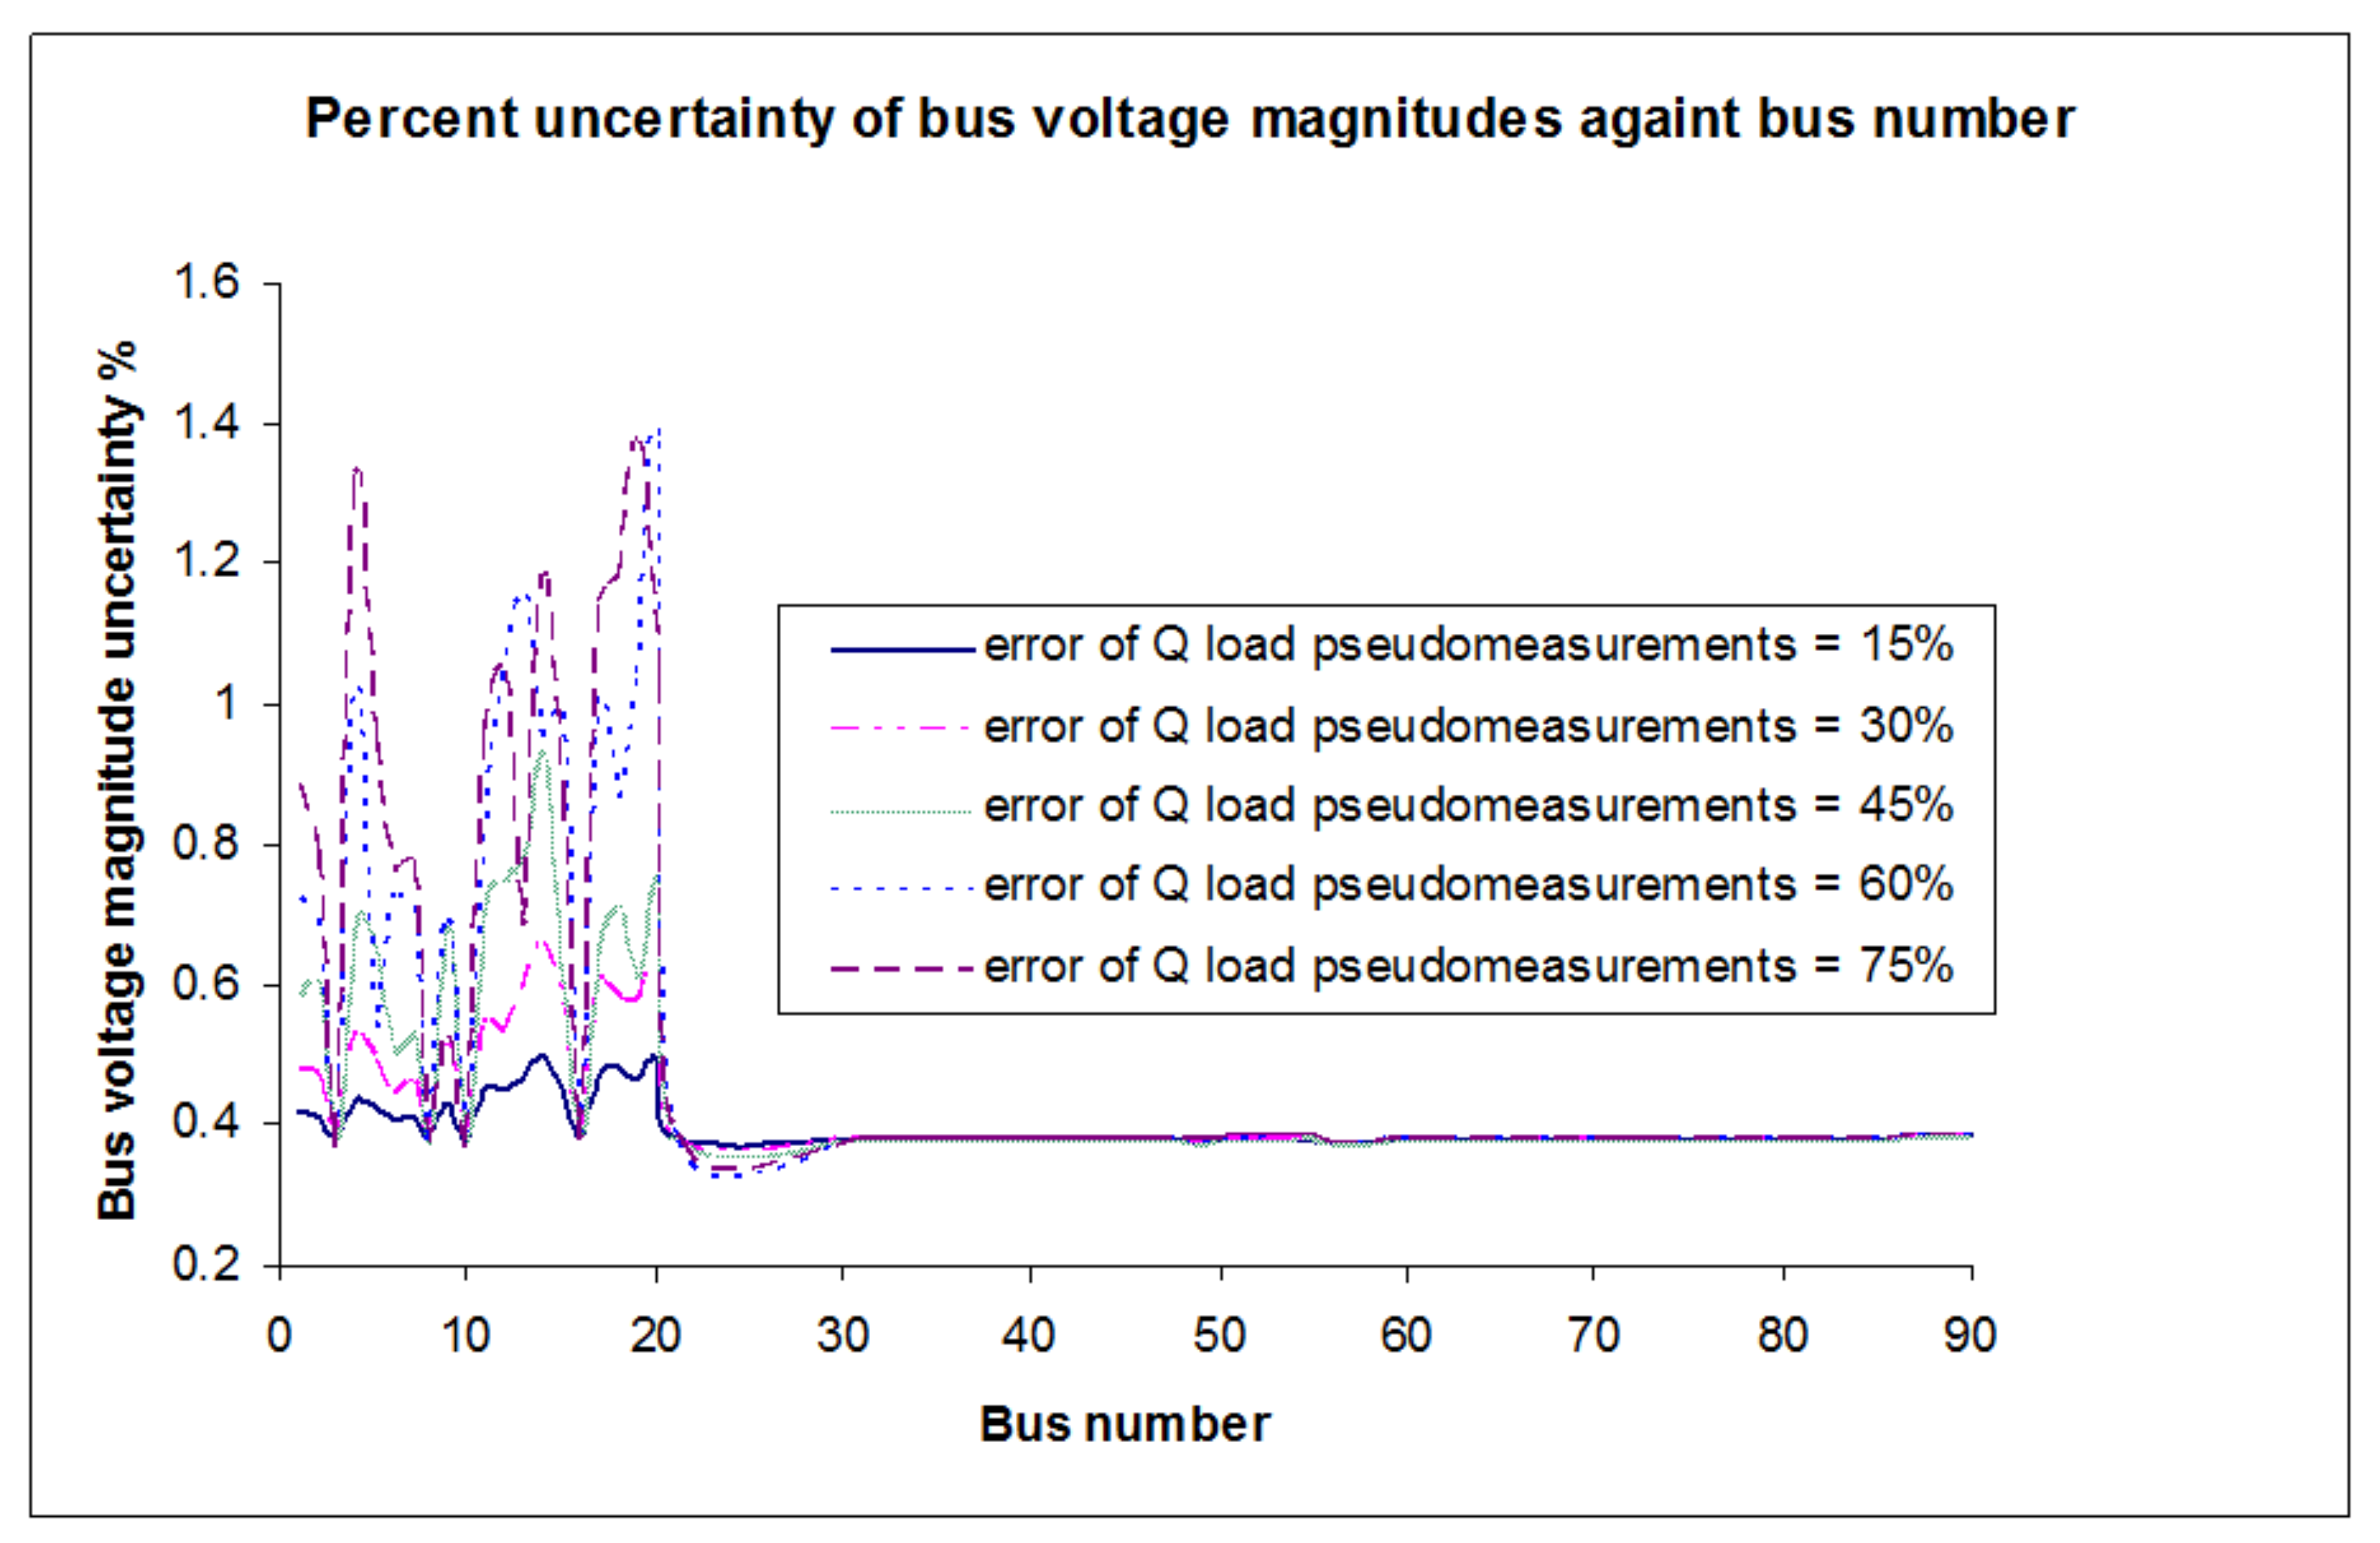
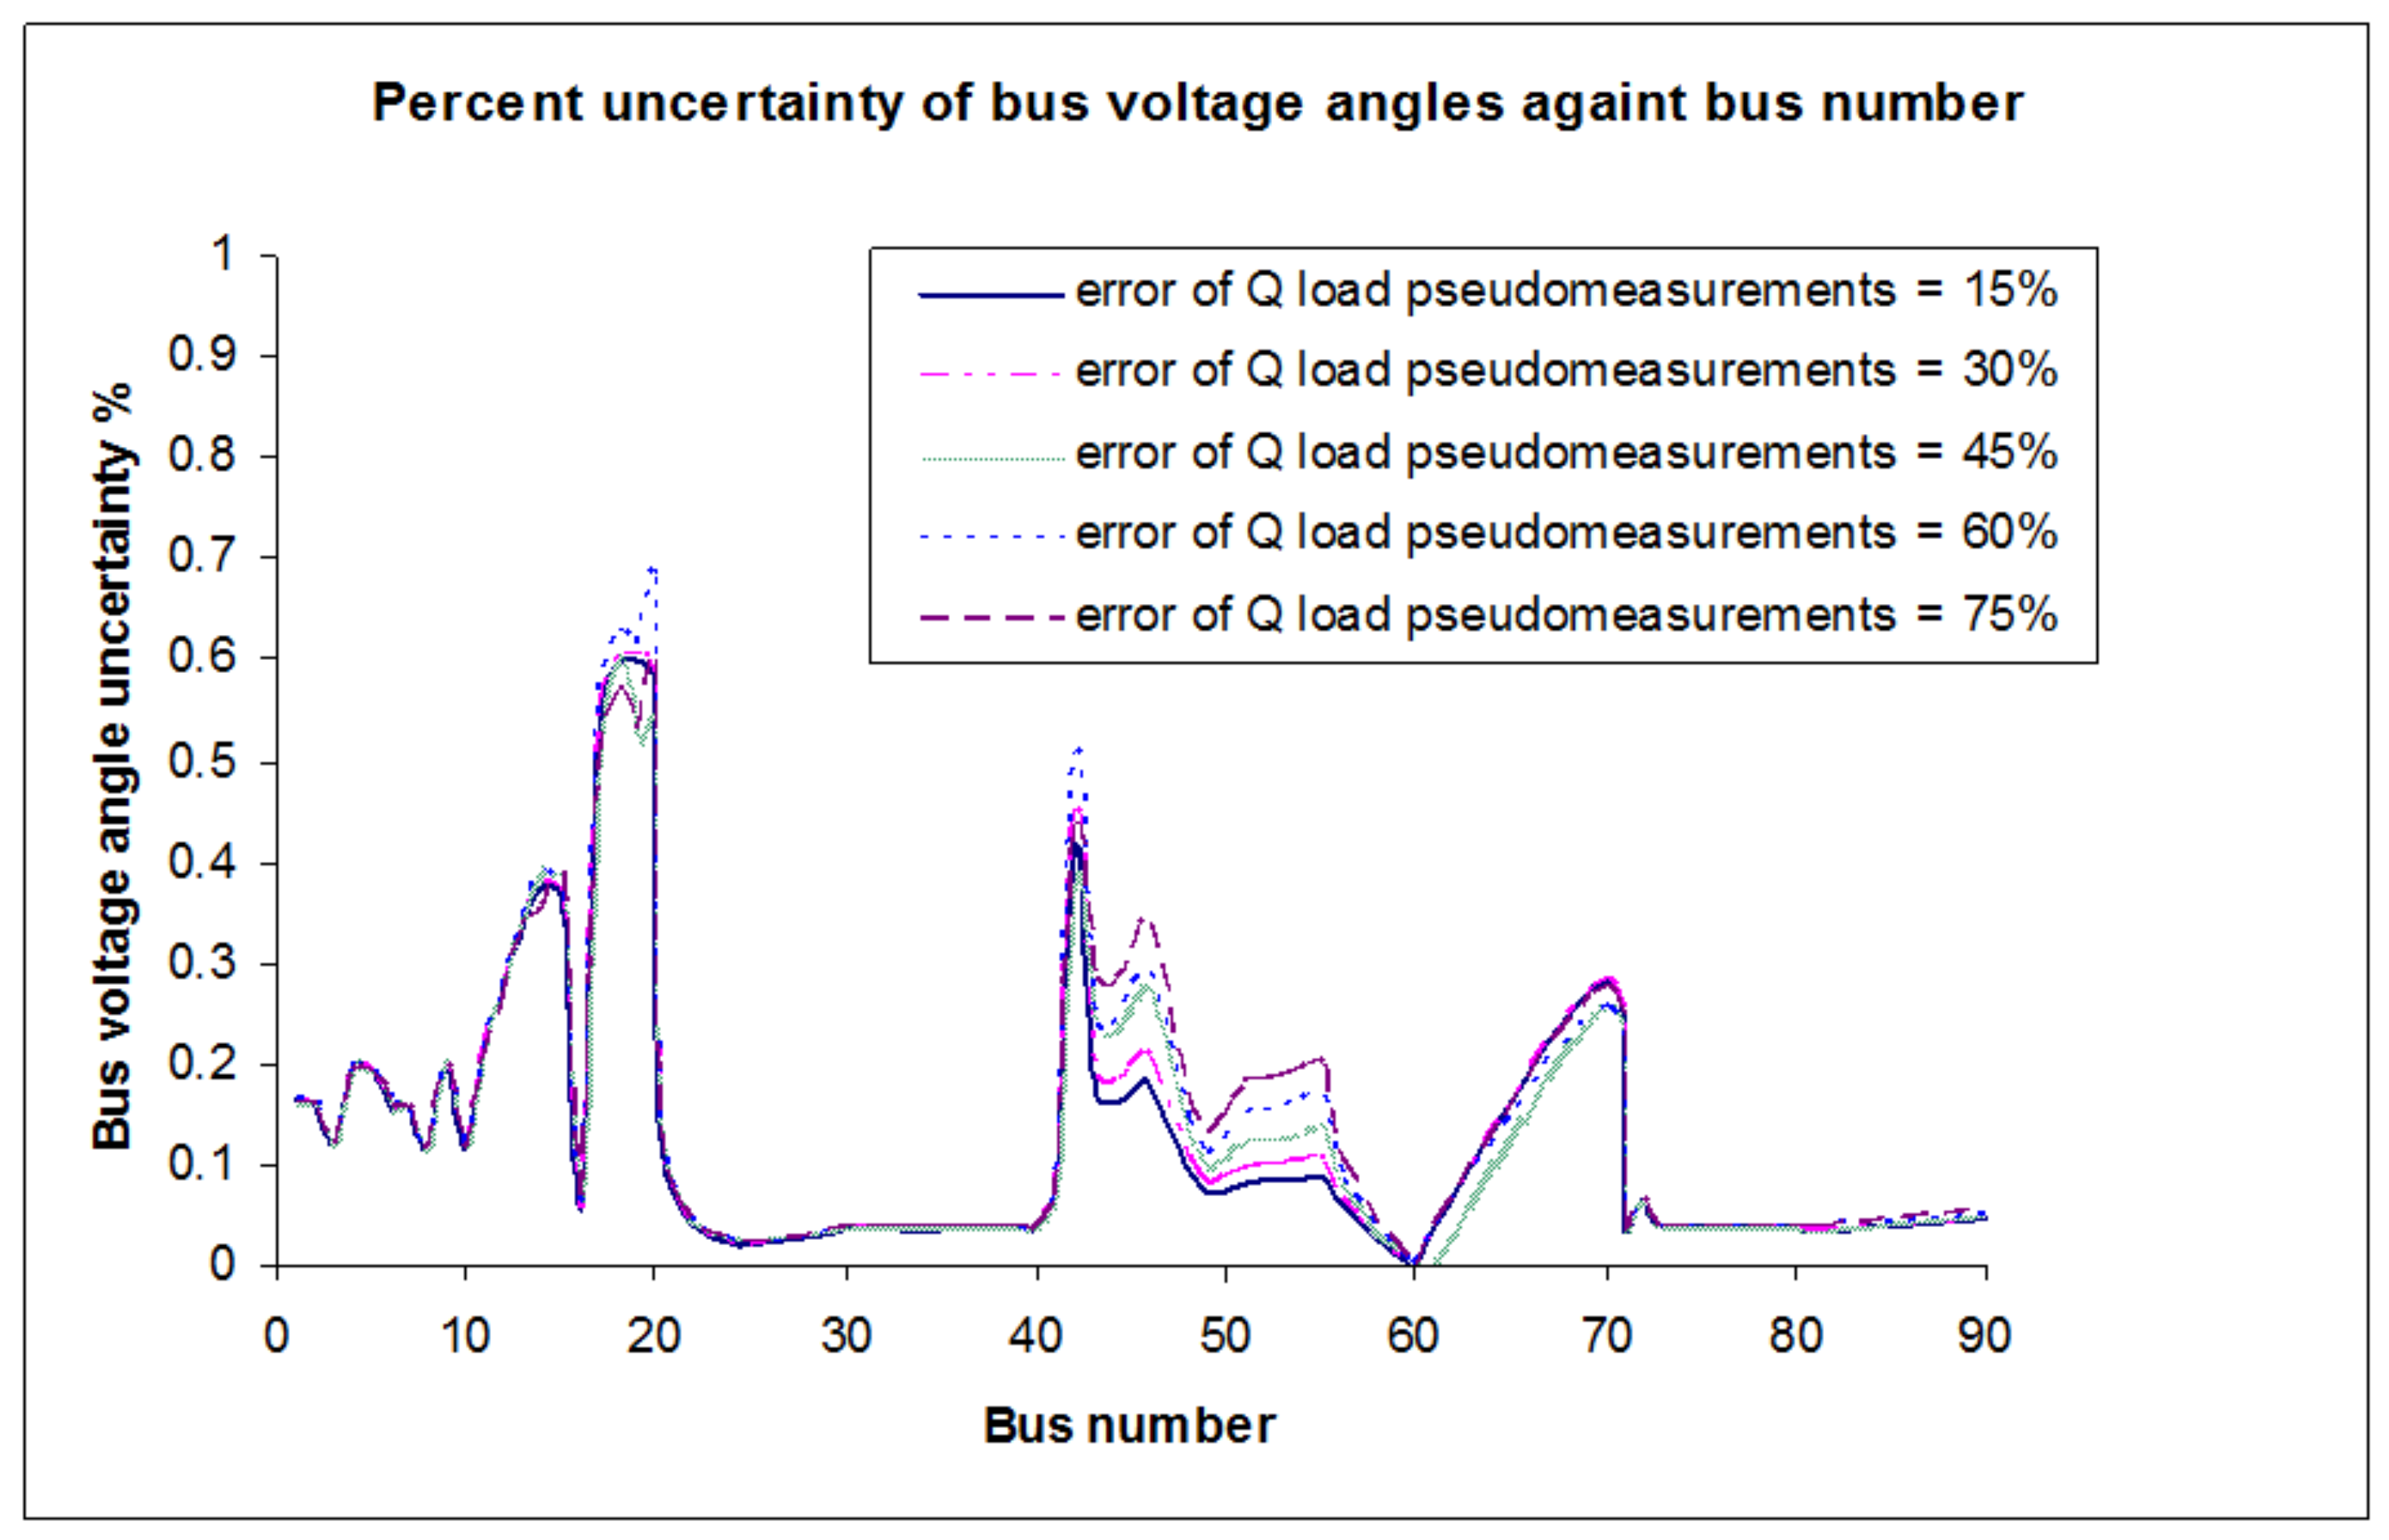
The voltage magnitude and angle uncertainties, with different accuracy levels of active and reactive load pseudo-measurements, are shown in
Figure 6,
Figure 7,
Figure 8 and
Figure 9. Referring to
Figure 6 and
Figure 7, even for an error of 75% in the active load estimates, the voltage magnitude and angle uncertainty at all buses remains below 0.55% and 3.89%, respectively.
As
Figure 6 and
Figure 7 show, the voltage magnitude and angle uncertainties of zero-injection and generation buses are even lower. Referring to
Figure 8 and
Figure 9, even for an error of 75% in the reactive load estimates, the voltage magnitude and angle uncertainty at all buses remains below 1.37% and 0.68%, respectively. As
Figure 8 and
Figure 9 show, the voltage magnitude and angle uncertainties of zero-injection and generation buses are even lower.
Moreover, from
Figure 6,
Figure 7,
Figure 8 and
Figure 9, it is obvious that the effect of the load estimate inaccuracy is more severe at the unmeasured load buses, because of the low local measurement redundancy which limits the error spread. As was expected, there is a strong correlation between bus voltage magnitude (angle) uncertainties and the errors in reactive (active) load estimates. It is worthwhile that uncertainties for all adjacent buses at the primary MV substation are low, because of the high accuracy and redundancy of the local real-time measurements. This fact enables the correct identification of topology errors and network splitting.
6.4. Comprarative Analysis of the Proposed Methodology
For comparison reasons, a grid-connected operation case with a single bad datum is examined. More specifically, we consider the measurement set described in [
54] and a gross error of 20
σ that is added at the true value of voltage measurement at bus 8.
Table 8 summarizes the comparative simulation results.
Considering the status of circuit breakers, the network is divided into two islands and the Jacobian matrix becomes singular. After a cycle of successive SE runs, all bad data are identified and eliminated.
Table 9 shows the estimated status for each switching device of the simulated case.
From the results of
Table 8, it is obvious that the estimated statuses of circuit breakers provided by the proposed method are similar or identical to those found in work [
54] and the true breaker statuses are successfully identified. As an additional piece of evidence of the efficacy of the proposed approach,
Table 9 shows that the proposed algorithm provides the same estimated status for each SE run as in work [
54].
Since the status of breakers is crucial for the operation and control of distribution power systems, the identification of their true status is of major importance. For this reason, a further investigation is needed to quantify the deviation between the simulation results regarding the estimated status of the switching devices and their true status. For this reason, the following performance metric is introduced:
where
and
are the estimated and true values of the status of the
switching device, respectively, and
is the total number of switching devices in the network.
Considering that the true status of each switching device mentioned in
Table 8 is “
normally closed” (
), we calculate the value of metric (13) for the corresponding estimated status of the three switching devices. Its value was found equal to 0.037 or 3.7%. This result proves the efficacy of the proposed formulation, since it can reliably estimate the status of each switching device with a small deviation in comparison with its true state.
7. Conclusions
In this paper, an advanced state estimator for smart distribution systems is developed, based on the block sparse WLS formulation with equality constraints. The existence of sufficient measurement redundancy permits the efficient implementation of the proposed methodology in both grid-connected and islanded modes. Moreover, it is possible to successfully identify breaker status errors at major substations and feeders.
The measurement set contains a limited number of real-time data at the substations and DG locations and a huge number of load data. The main source for the load data is the historical information and recently the advanced AMI and AMR devices. The impact of the accuracy of the DG voltage measurements and load estimates on estimated states and the analog bad data identification capability of the proposed algorithms are investigated. Topology errors in telemetered portions of the network are efficiently identified by a smart algorithm. A 55-bus test system with a distributed generation was used to validate the performance of the proposed algorithms.
In order to demonstrate the efficiency of the proposed WLS algorithm, the simulation results were compared with thοse of existing methods regarding identification of breaker statuses. From the comparison conducted, it is verified that the proposed method can be effectively used and provide results similar to those of already published works. Moreover, to further quantify the results, the normalized error of switching device statuses was adopted as an appropriate performance metric.
Future work will focus on extending the proposed formulation to consider the existence of synchronized measurements provided by phasor measurement units as well as the transition into smart-microgrids enabling applications of the internet of things. The problems of defending against false data injection (FDI) attacks on state estimation and enhancing the network resiliency against cyber-attacks will be also investigated.


