Article

Moisture Risk Analysis for Three Construction Variants of a Wooden Inverted Flat Roof

by
Agnieszka Sadłowska-Sałęga
* and
Krzysztof Wąs
Faculty of Environmental Engineering and Land Surveying, University of Agriculture in Krakow, 31-120 Kraków, Poland
*
Author to whom correspondence should be addressed.
Energies 2021, 14(23), 7898; https://doi.org/10.3390/en14237898
Submission received: 26 October 2021 / Revised: 9 November 2021 / Accepted: 22 November 2021 / Published: 25 November 2021

Abstract

:
The paper presents an analysis of the hygrothermal performance of an inverted flat roof with a CLT (cross-laminated timber) structure in a building that meets the requirements of Passive House Standard (PHS) with regards to the potential risk of moisture. The calculations were made in the WUFI®Plus and WUFI®Bio software. The following variants were taken into account: three structure configurations, three different external climates and different scenarios of microclimate control and air change rate. The results of the calculations show that, especially in cooler climates, there is an actual moisture risk in the structure despite the excellent thermal insulation. The structure of the inverted flat roof, due to the use of a tight membrane on the outer side, allows for the partition to discharge the excess moisture only to the inside of the building. Ensuring the comfort of users may require periodic humidification of internal air, which translates directly into an increase in moisture content of the structure. The performed analysis clearly showed that there are no universal solutions. It is important to point out that for the proper performance of inverted wooden roofs, it is crucial to analyse moisture, not only thermal and energy parameters.

1. Introduction

Currently, wood and wood-based materials are becoming an ecological alternative to materials commonly used in the construction of buildings (such as concrete, steel or ceramics) [1]. Investors and designers appreciate naturalness, ease of processing and the so-called low carbon footprint (CFP) of wood [2]. Including landfill methane emissions, the lifecycle of a wooden house yields 20 tons of CO2-eq. emissions compared to 72 tons for the typical house [3]. Wooden houses also consume about 45% of the fossil fuels used in the typical house [3] during their lifecycle. For the European building sector, an achievable potential for net carbon storage can reach about 46 million tonnes CO2-eq. per year in 2030 [1]. Wooden structures are used not only in single-family housing but also in multi-apartment, office and public buildings (i.e., schools, swimming pools). It is possible to create various types of partitions: walls, floors, ceilings and roofs.
Wooden construction buildings can meet the highest energy efficiency standards, including the Passive House Standard (PHS), nZEB or NZEB. Wooden frame structures allow for high insulation performance with a relatively small partition thickness [4]. Mass timber products (MTPs), including mainly structural composite lumber (SCL), glued-laminated timber (GLT, glulam), cross-laminated timber (CLT) and nailed-laminated timber (NCL), perfectly correspond to this trend. Furthermore, as the amount of waste that remains from the tree cross-section after the production process is minimal, the production process allows for the optimal use of raw materials compared to traditional wooden construction. Due to the fact that MTPs are produced in a factory, all the dimensions and opening can be very precisely cut; therefore, it is possible to benefit from faster assembly and minimal construction waste [5]. Consequently, CLTs can obtain the lowest Global Warming Potential (GWP) of timber structures [6].
Inverted roofs (“protected membrane” or “upside down roofs”) are becoming an increasingly popular alternative to traditional roofs. In this roof construction, the waterproofing layer lies beneath the insulation instead of above it. They employ insulation that can resist water absorption, provide excellent thermal performance, be unaffected by freeze/thaw cycles, withstand surface traffic and be protected from UV and mechanical damage. This configuration is believed to provide a longer life cycle and greater protection for the roof elements [7]. The heat loss of an inverted roof for different regions of Europe was described in [8,9]. The downside of this solution is the direct exposure of the insulation to the outdoor climate [10,11,12]. The risk of temperature decrease in the inner surface of the insulation below the dew point (resulting from the ingress of cold rainwater/melting snow going through the joints between the boards of thermal insulation) by specifying the ratio of the water undergoing the thermal insulation was studied in [13].
In the case of inverted roofs, insulation boards are loose-laid on top of the membrane and then weighted down with paving slabs, gravel ballast or soil. This provides a perfect foundation for a terrace, garden or green roof, which are commonly used to improve the indoor thermal environment, reduce air-conditioning (cooling and heating) load and mitigate the Urban Heat Island (UHI) effect [14,15,16,17,18,19,20,21].
The environment has a negative impact on the building from the moment it is constructed, which in the case of wood can be strongly affected by prolonged exposure to moisture. Based on research in [22,23], it can be estimated that 75–80% of all the problems with building envelope develop as a result of moisture impact. This may include, for example, degradation, moisture, deformation or dimensional change. The destructive effect of fungi and insects, which is referred to as biological deterioration, is the main reason for wood degradation [24]. Moreover, as wooden materials are exposed to moisture, they may lose strength and stiffness. Mould growth and other moisture-related problems can be prevented by paying close attention to the hygrothermal performance of building assemblies.
The moisture behaviour of CLT was studied repeatedly: starting with the moisture content of materials at the stage of building construction [25,26,27] to the moisture management and monitoring in mass timber buildings [28]. Based on these studies, the problems to be addressed in CLT were identified:
  • The presence of internal gaps indicating the potential for the development of condensation on the probes within the panel;
  • Different moisture distribution, even in close proximity, due to the heterogeneity of the wood and the complex geometry of the CLT;
  • The possibility of moisture stagnation (for long periods) under adverse conditions, even though CLT is able to dry quickly (within a few weeks) to safe levels.
Several studies on timber products (including CLT and OSB—Oriented Strand Board) using hygrothermal simulations were carried out [29,30,31,32,33,34,35,36,37]. In the majority of these, calculations were performed with the support of WUFI—a commercial hygrothermal simulation software (developed by Fraunhofer Institute for Building Physics). WUFI®Plus makes it possible to model coupled heat and moisture transport problems for different building components. Furthermore, heat and moisture loads are taken into account, as well as ventilation, heating, cooling, dehumidification and humidification processes.
Wooden (or wood-based) partitions typically need vapour insulation at the warm side to avoid interlayer condensation due to vapour diffusion and air leakages from the interior. These are either vapour retarders or vapour barriers. The distinction between the types is not strict, but in general, it can be said that vapour retarders are defined to have a vapour resistance (the diffusional equivalent of the air layer thickness that creates a barrier for the water vapour diffusion) 0.34 m < Sd < 3.4 m and vapour barriers—Sd > 3.4 m [38]. At first, polyethylene vapour insulations were used (it is still considered a classic solution). The latest solution is the so-called Smart Vapor Barrier (SVB). The physical performance of these products varies, but the main principle is that the vapour barrier should function as an ordinary tight vapour barrier most of the time, preventing vapour diffusion into the construction from the indoor air (e.g., Sd-value at approximately 4–5 m when the RH is below about 40% [39,40,41]). If the construction becomes wet, the relative humidity (RH) on the exterior side of the vapour retarder becomes high, and the vapour resistance is reduced (e.g., Sd = 0.1–0.2 when the RH is above 80% [39,40,41]). As a result, inwards drying is possible. There are known studies on the impact of using different variants of a vapour barrier. Geving and Holme [40] conducted research in order to find some threshold value for the maximum vapour resistance of a vapour retarder—when a requirement is that it should have a relatively large effect on the total drying of the wall. Results of hygrothermal simulations carried out in order to investigate if vapour barrier of polyethylene foil could be omitted or replaced by other materials in the case of a wood-frame structure (for Norther Europe climate) can be found in [42]. Comparison of the in situ hygrothermal performance of wood–hemp composite insulation in panels with and without a vapour barrier, with identical hygrothermal boundary conditions can be found in [43]. Moisture and temperature conditions in three full-scale flat compact wooden roofs with SVB were investigated in [44].
The comfort of users must not be forgotten either in housing or in public utility construction. As the research shows, Indoor Air Quality (IAQ)—defined by the depiction of concentrations of pollutants and thermal conditions—has a significant impact, for example, on the quality of work or the number of sick days [45,46,47,48]. During the development of ASHRAE Standard 62-1989 version [49], the committee set a minimum ventilation rate of 7.5 L·s−1 per person to control body odour. This was increased to 10 L·s−1 per person in many building types to account for contaminants other than human bioeffluents, such as building materials and furnishings [50]. The European Standard EN 15251:2007 [51] estimates that a ventilation rate of 10 L·s−1 per person will leave 15% of occupants dissatisfied. EN 16789-1:2019 [52] is an update of the EN 15251:2007 standard, covering indoor environmental criteria (for both residential and non-residential structures) for the design of buildings and room conditioning systems. Design ventilation rate for non-residential buildings can be derived using one or more of the following methods: based on perceived air quality, using limit values for substance concentration or based on predefined ventilation air flow rates. For an office building (no-low polluting building) and for the perceived air quality method, the total ventilation rate for the breathing zone is found by combining the ventilation for people and the building. The unit ventilation rates for occupancy per person and for emissions from the building are equal, respectively, to [52]:
  • For high expectations (category I), 36.00 m3·h−1 per person and 7.20 m3·h−1·m−2;
  • For medium expectations (category II), 25.20 m3·h−1 per person and 5.04 m3·h−1·m−2;
  • For moderate expectations (category III), 14.40 m3·h−1 per person and 2.88 m3·h−1·m−2;
  • For low expectations (category IV), 9.00 m3·h−1 per person and 2.16 m3·h−1·m−2.
In the case of residential buildings, air flow rates can be specified as an air change rate for each room and/or outdoor air supply per person and/or required extract rates.
In addition to air purity, the parameters of thermal comfort are also important. Thermal criteria used within [52] are based on the predefined Predicted Mean Vote (PMV) and Predicted Percentage Dissatisfied (PPD) calculations [53,54]. These are employed as bases for defining the input for heating and cooling load calculations, equipment sizing, and determining the energy balance of a building. Depending on the level of expectation (categories of the indoor environment), the standard [52] define temperature (T) ranges for inner air are as follows:
  • For high expectations (category I), 21.0–23.0 °C for the heating season and 23.5–25.5 °C for the cooling season;
  • For medium expectations (category II), 20.0–24.0 °C for the heating season and 23.0–26.0 °C for the cooling season;
  • For moderate expectations (category III), 19.0–25.0 °C for the heating season and 22.0–27.0 °C for the cooling season;
  • For low expectations (category IV), 17.0–25.0 °C for the heating season and 21.0–28.0 °C for the cooling season.
In the case of moisture control (recommended criteria for dehumidification and humidification), designed RH is in the range 30–50%RH for category I, 25–60%RH for category II, 20–70%RH for category III and no control for category IV.
As mentioned earlier, the thermal properties of inverted roofs without a vegetation layer and green roofs are widely analysed in the literature. There are also numerous studies on the mass evapotranspiration transfer in a green roof [55]. However, there is a lack of detailed research on the moisture content of inverted wooden roofs. CLT offers less air permeability and has a greater capacity for storing humidity in comparison to lightweight timber construction [56]. The factor that has a key impact on its durability and proper long-term performance is the moisture level in the material and the environment. The key parameter for the durability of such partitions is their degree of moisture. Omission of this aspect may lead to the degradation of the partition in a short time and, consequently, to its destruction. It is, therefore, necessary to design a layering system that will allow proper CLT performance by maintaining a safe level of moisture content in the partition and will not allow for its condensation inside the structure [29].
The construction of an inverted roof requires the use of a tight layer that does not allow for moisture transfer. It must be flexible and highly durable. This is especially important in the case of wooden structures susceptible to moisture, which leads to biological deterioration of the material and, consequently, to the degradation and damage of the building structure. Damp-proof insulation is most often made of various types of polymers that meet the above-mentioned requirements. However, such a barrier, protecting the structure against moisture from the outside, prevents the structure from drying out to the external environment. Thus, as a consequence, it is possible to give off excess moisture only to the interior. In such a situation, an efficient ventilation system that will remove excess moisture from the rooms is of key importance. It is also important to verify whether the humidity level would not exceed the permissible values inside the structures in a partition with high thermal insulation properties, meeting the standard of a passive building.
The aim of the presented study is an analysis of the hygrothermal performance of an atypical inverted flat roof with a CLT structure in a building that meets the requirements of Passive House Standard (PHS) with regards to the potential risk of moisture. The research concerned only the humidity conditions in the partition related to the phenomenon of condensation/moisture diffusion. Moisture and air infiltration caused by damage or leakage was not taken into account. This paper is an attempt to answer whether the analysed structures can function safely in terms of humidity in various European climates, taking into account stringent requirements regarding the indoor microclimate.

2. Materials and Methods
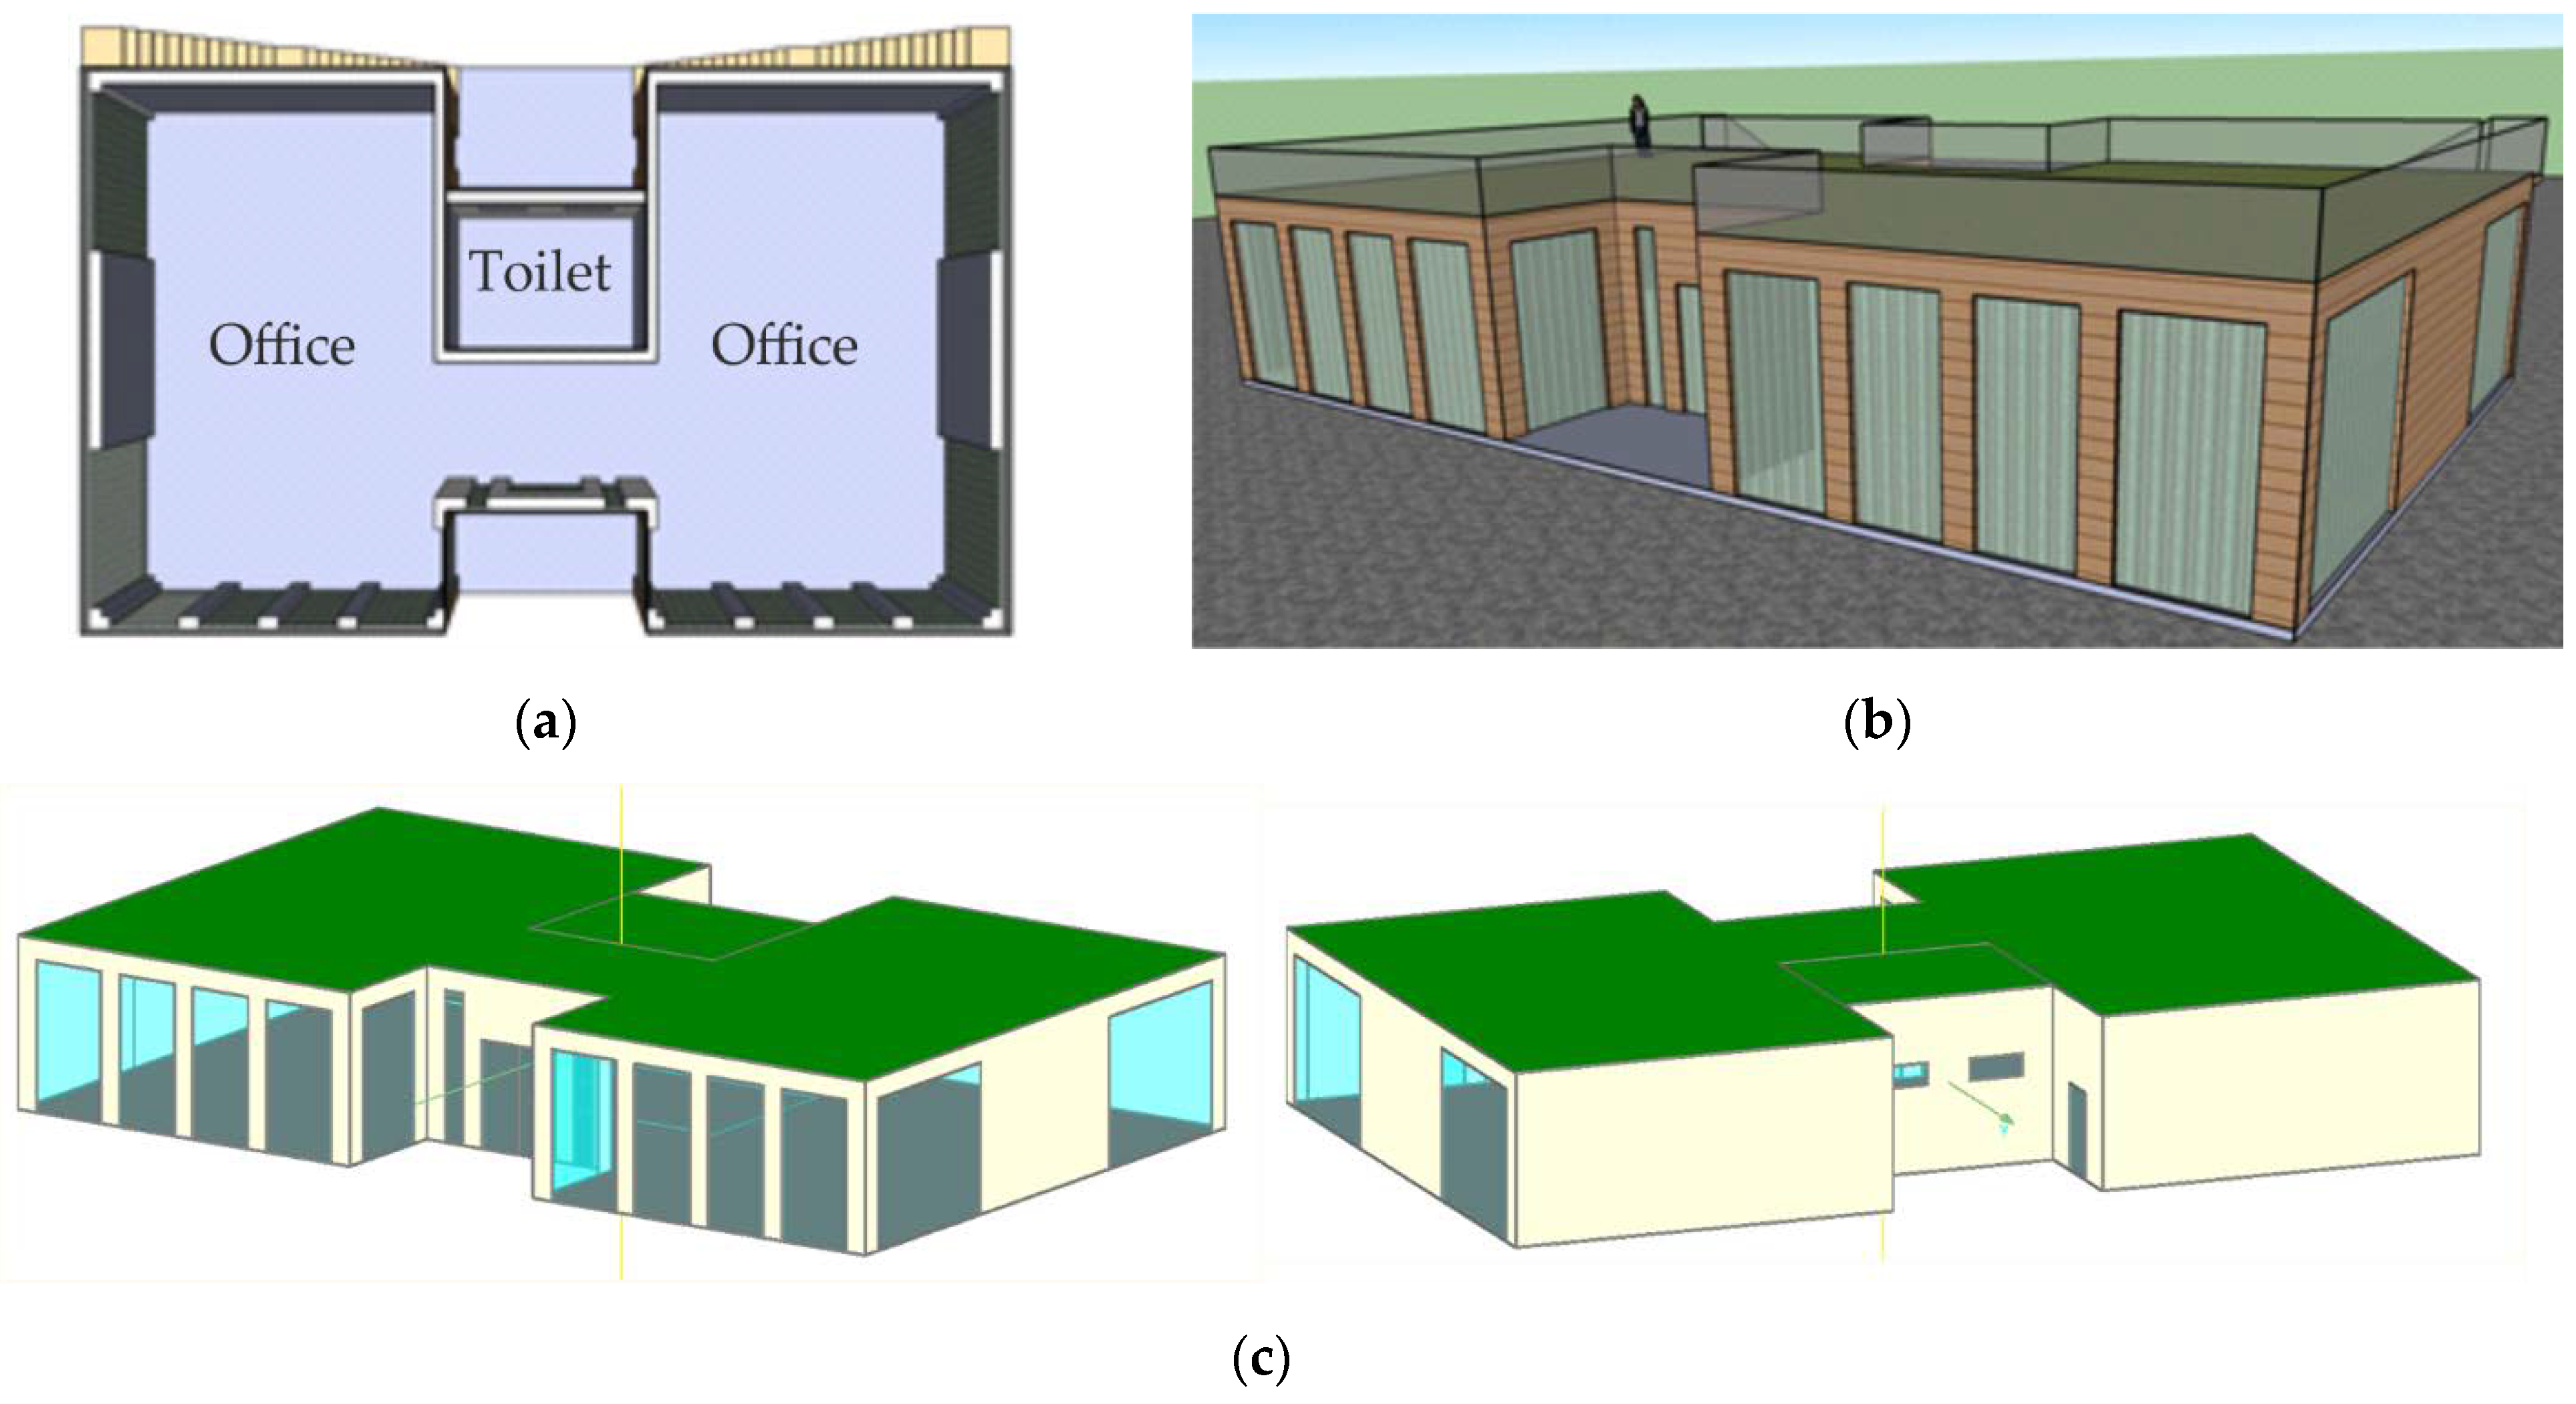
A generic building with a light wooden structure was tested. The assumption was to create an office building that meets the passive, ecological standards and, at the same time, is quick to build. Hence the concept of using prefabrication in as many building elements as possible. This also applied to the flat roof, the structure of which was designed in a wooden frame system filled with insulation and closed on both sides with CLT panels. Since such elements are manufactured in specific dimensions, the geometry of the building was adapted to the product’s dimensions.
The analysed partition is not a typical inverted roof, where the thermal insulation is above the tight barrier protecting the structure against external moisture (which can be found, among others, in reinforced concrete structures). In the tested case, the insulation was placed in the load-bearing structure. However, the basic principle of an inverted roof remains the same—the roof layers can only dry to the interior. In the analysed case, a CLT panel with a total thickness of 0.334 m was used, for which the thermal transmittance (U-value) equals 0.115 W·m−2·K−1. Therefore, this partition meets the requirements of Passive House Standard [57], for which the maximum value of U-value is 0.15 W·m−2·K−1. The structure of the flat roof is based on a review of the solutions used so that it meets the strength requirements. In this case, the load transfer is carried out by the ceiling module in the form of a CLT truss, stiffened on both sides with CLT plates. The width of such modules may be approximately up to 2.5 m, while the standard length is up to 6.0 m, and with reinforcements up to 12.0 m. All structures assume (meeting market expectations), finishing with a CLT (wooden) layer from the side of the rooms.

2.1. Model

The calculations and analysis are based on the example of a single-story, passive, wooden-frame office building (Figure 1a) with a usable area of 292 m2, of which 272 m2 are office space, and 20 m2 are sanitary facilities. Due to the different nature of these rooms, two calculation zones were introduced with different indoor climate parameters.
For the purposes of the analysis, a three-dimensional model of the building was prepared in an external graphic software SketchUp (Figure 1b). This model corresponds to the geometry of the planned office building. This model was implemented in the WUFI®Plus (Figure 1c), where building partitions were configured, and boundary conditions were defined.
The analysis covered three material configurations of the inverted flat roof, for which there is one common element: the CLT construction panel filled with rock wool, protected against moisture with EPDM (Ethylene Propylene Diene Monomer) on the outside and covered with a layer of soil intended potentially for green planting. The differences between the variants concerned the internal layers of the partition. These variants are described and presented below:
(a)
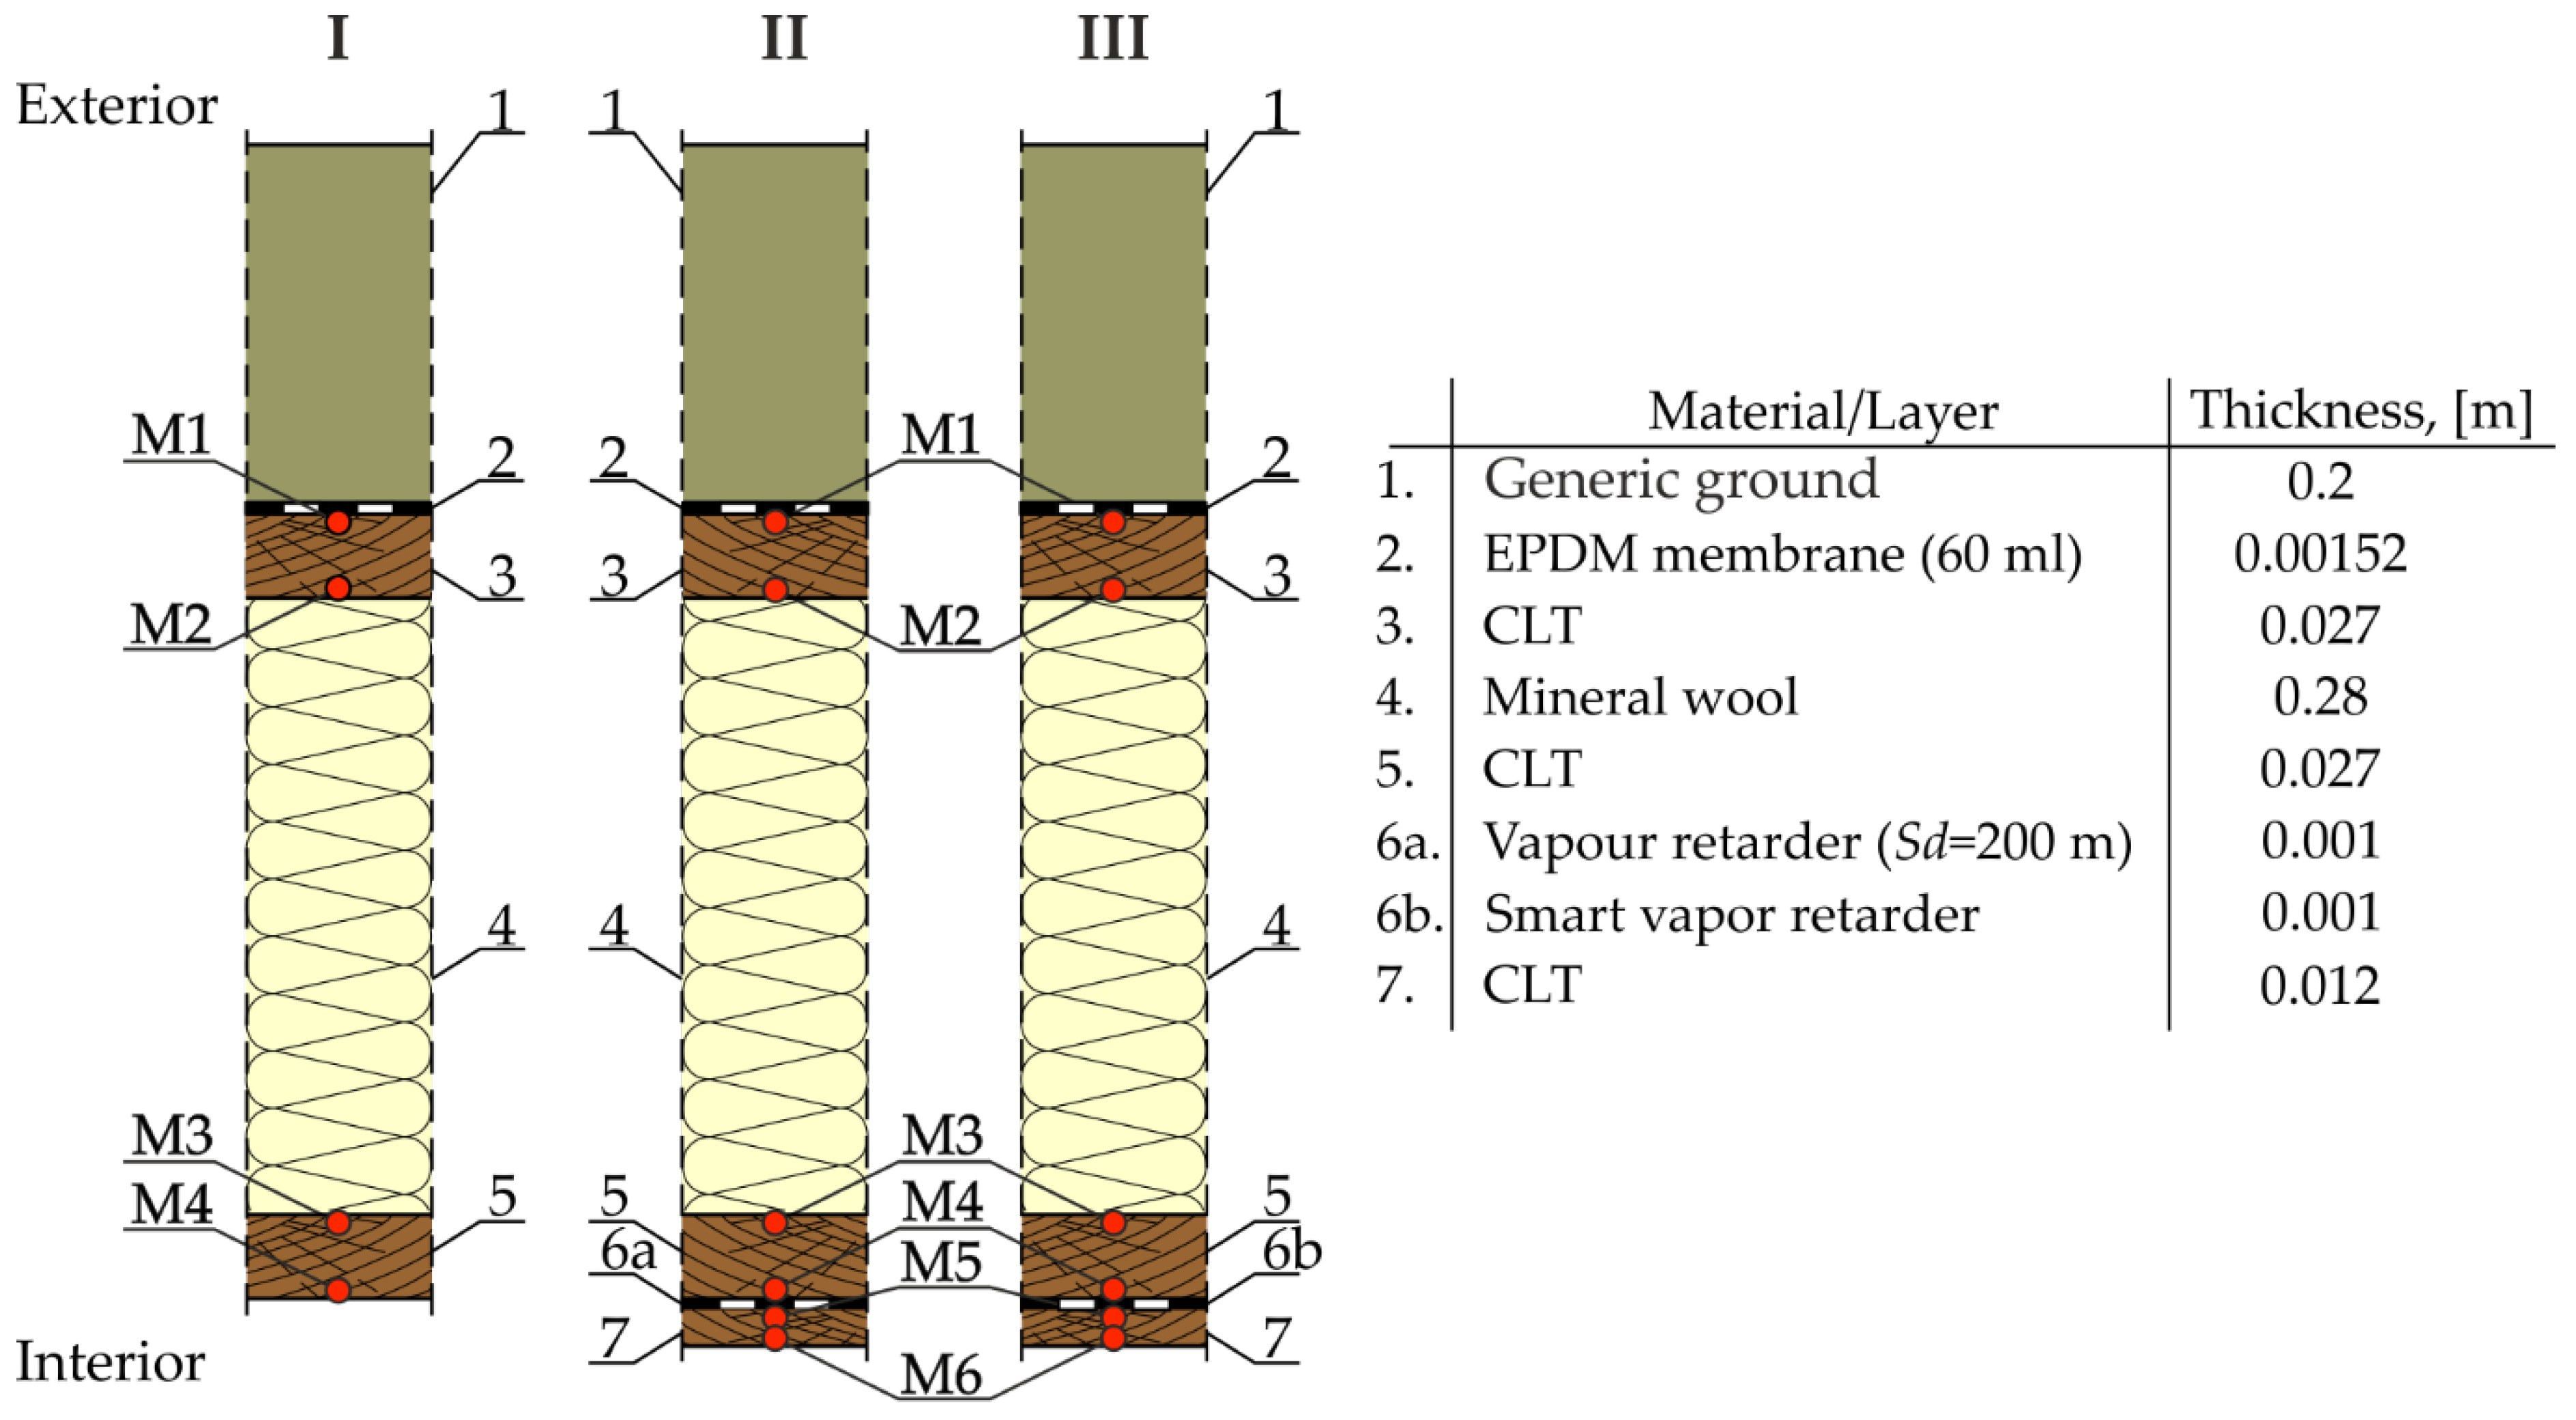
CLT panel filled with rock wool without a vapour barrier (I on Figure 2);
(b)
CLT panel filled with rock wool, secured with a typical polyethylene vapour barrier with the Sd-value (Vapour Diffusion Thickness) of 200 m and an additional layer of CLT board (II on Figure 2);
(c)
CLT filled with rock wool, secured from the inside with an SVR—adaptive foil (in these case ISOVER Vario) with a variable diffusion resistance coefficient (III on Figure 2).
The moisture content in the CLT layers (on its inner and outer surface) was analysed according to the schemes presented in Figure 2. The remaining partitions in the building, i.e., walls and the ground floor, were not included in the analysis. Due to the adopted scenarios of indoor climate parameters, they had no impact on the calculations.

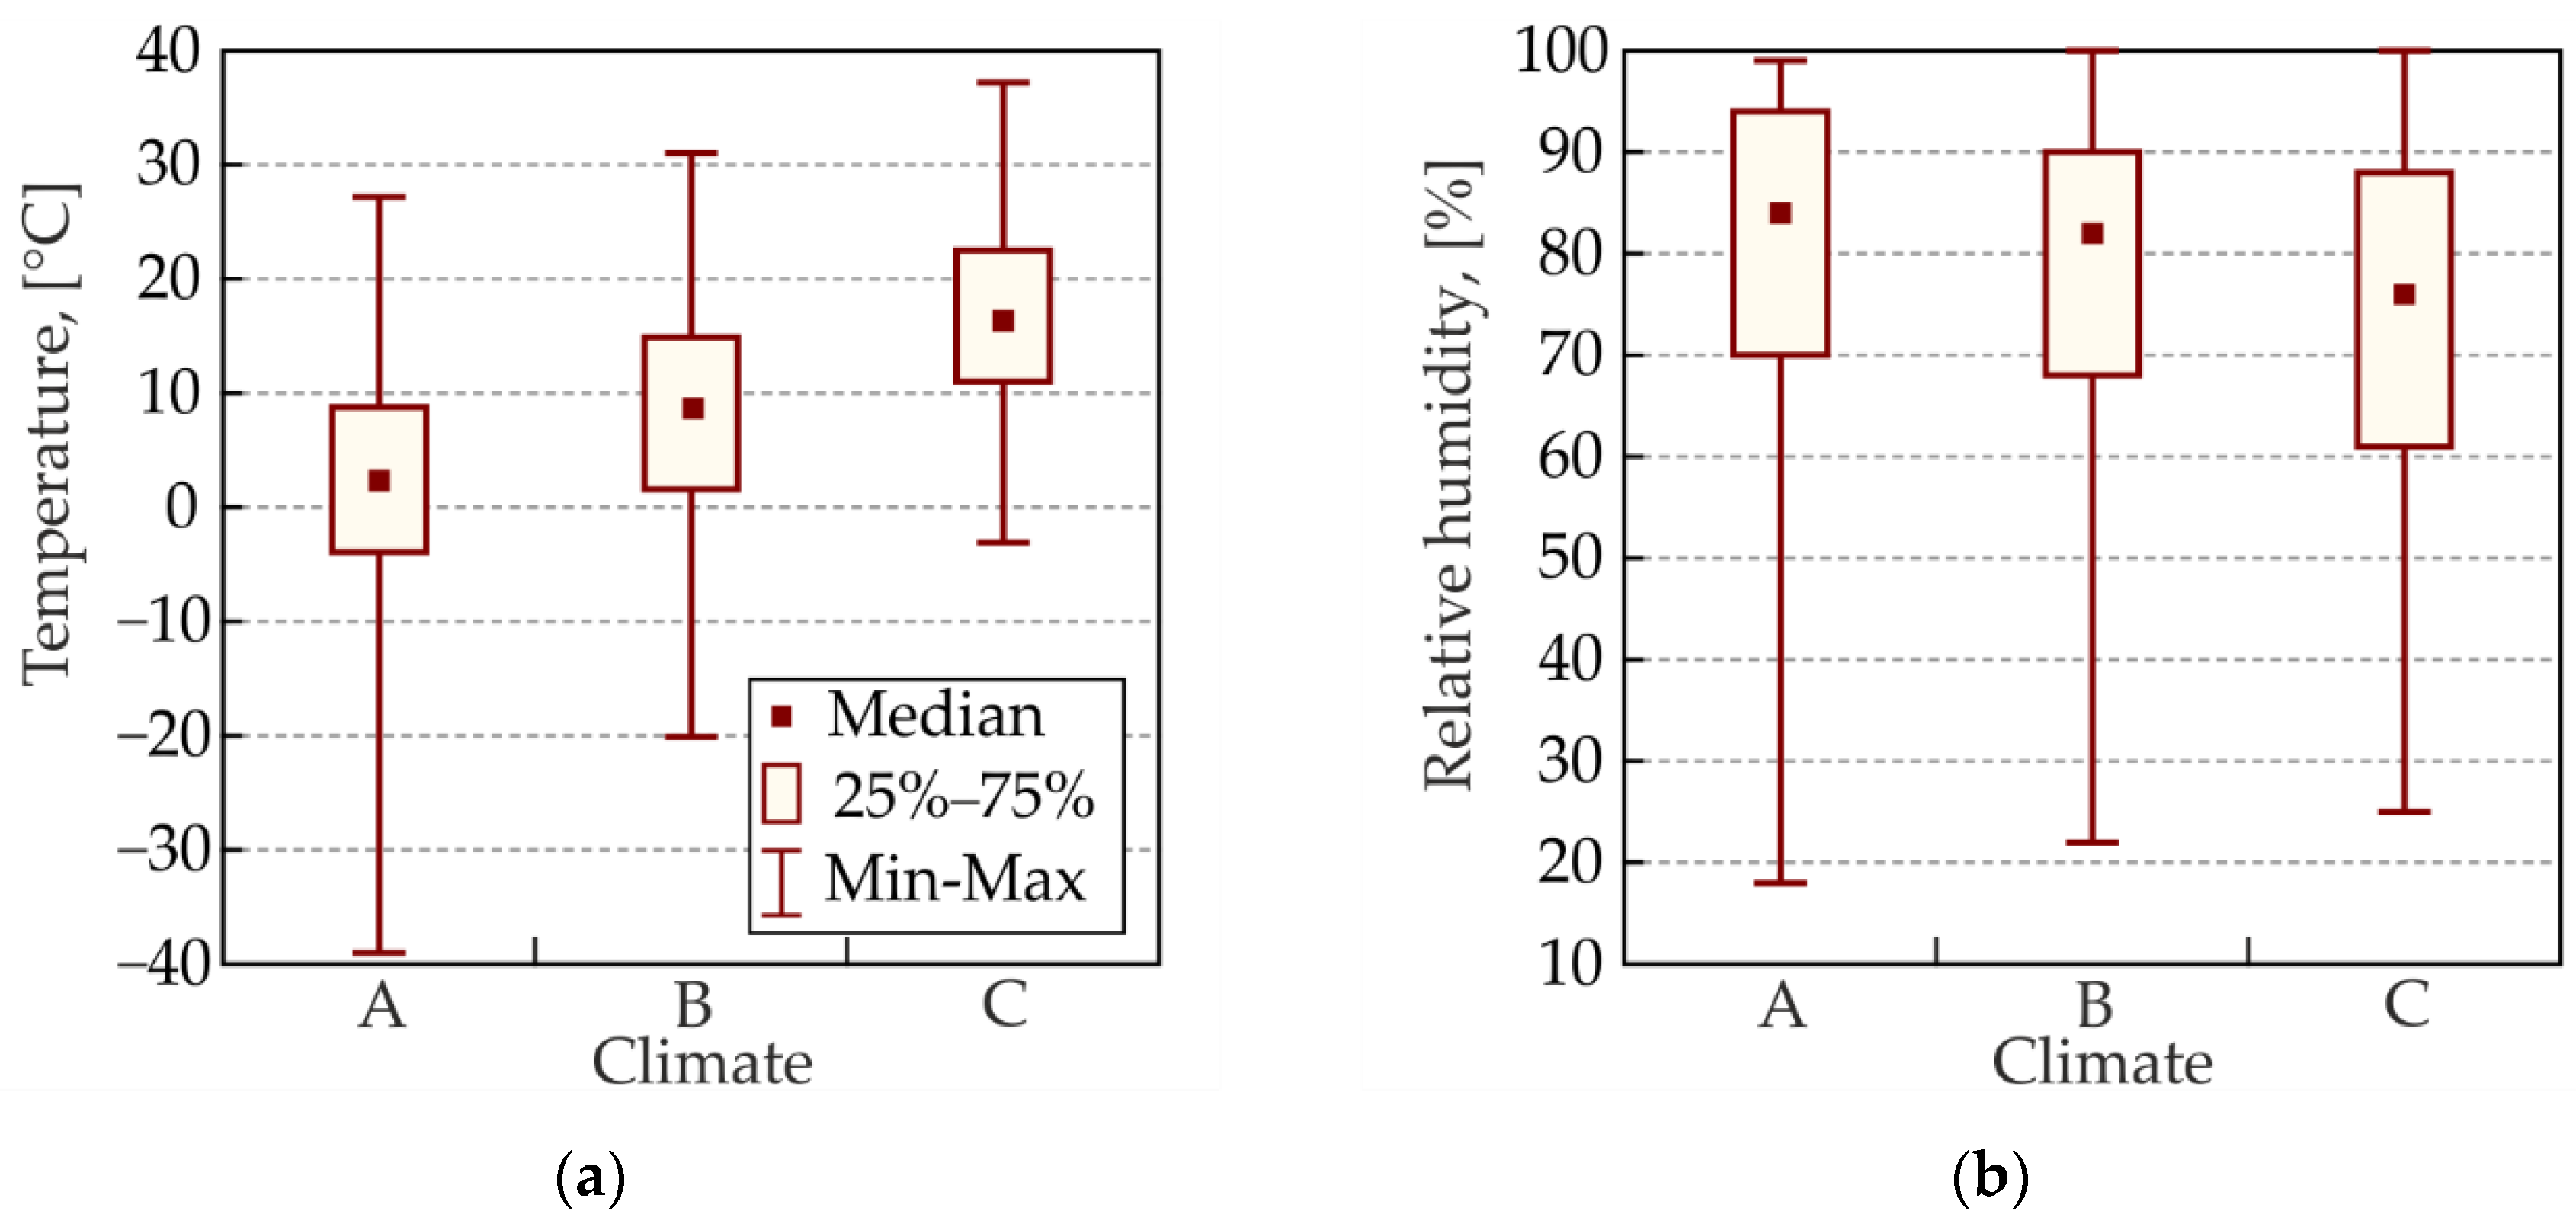
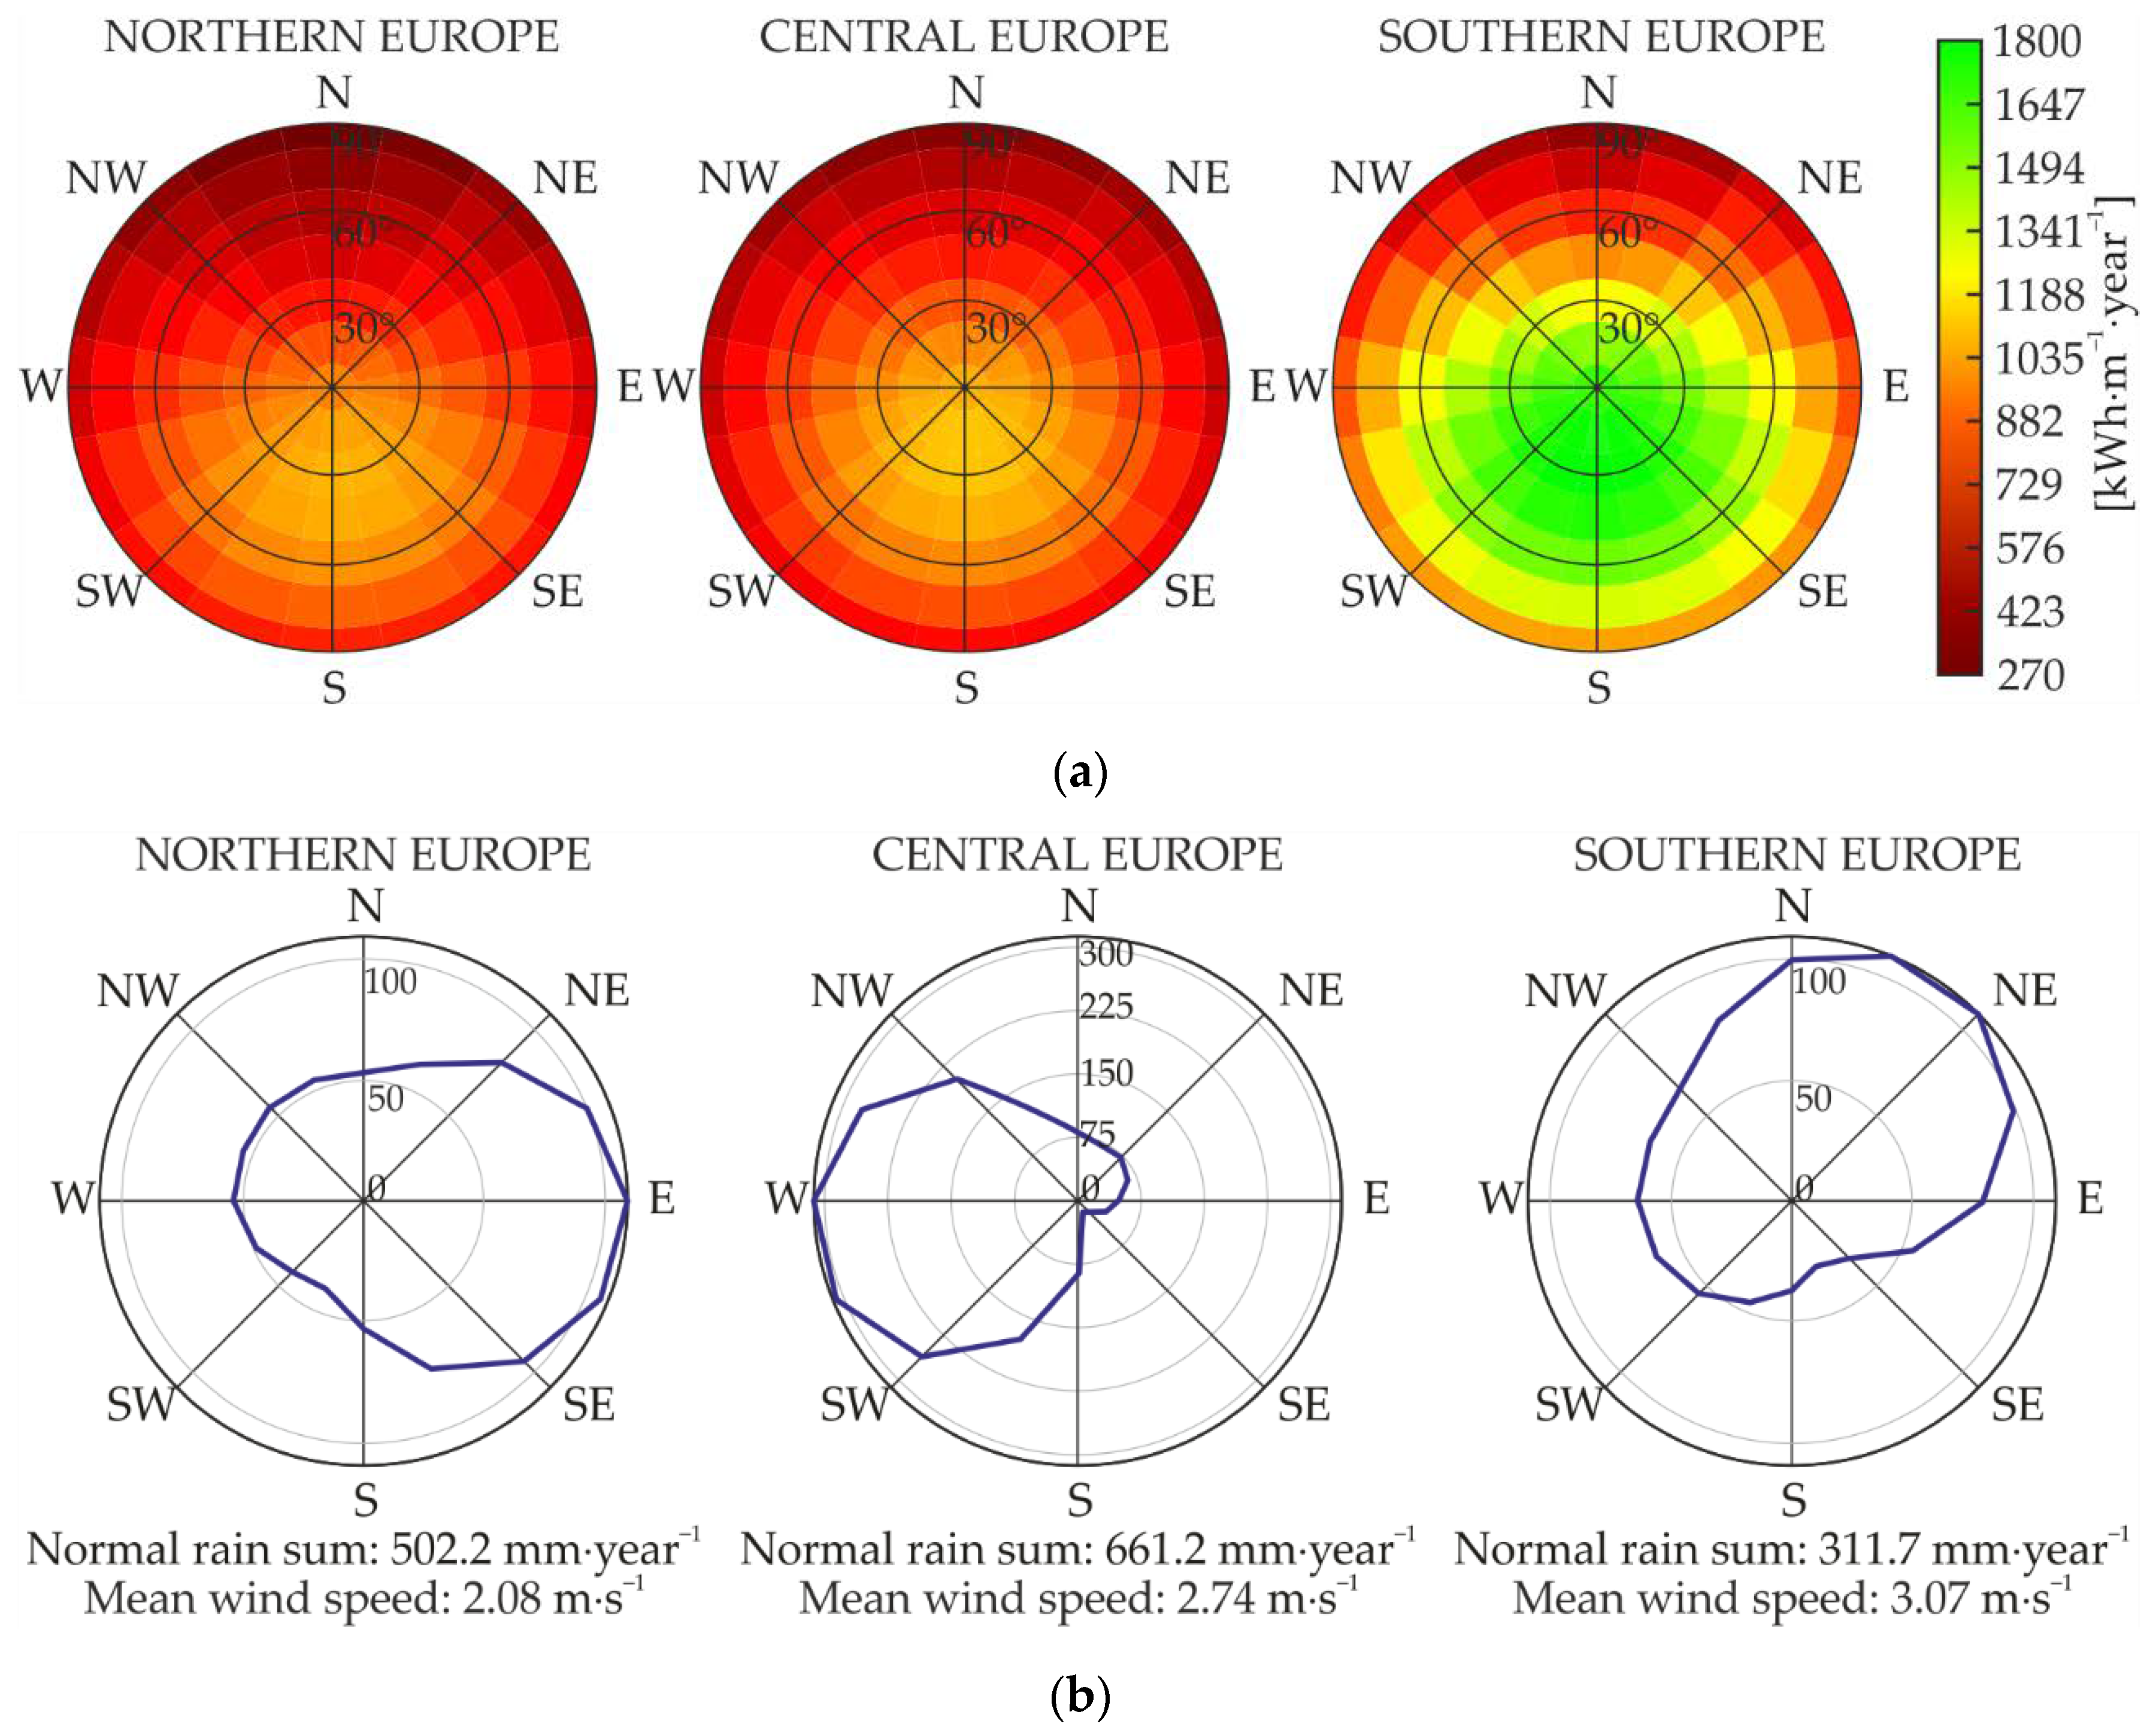
2.2. External Climate

Outdoor conditions, which affect building performance, are of key importance in the analysis. In the case of inverted roofs, the temperature on the outer surface of the construction layer is vital, as it affects the possibility of moisture condensation. The three statistical climates available in the WUFI database were adopted for the analysis:
-
For Northern Europe—Östersund in Sweden (climate A on Figure 3);
-
For Central Europe—Krakow in Poland (climate B on Figure 3);
-
For Southern Europe—Palma de Mallorca in Spain (climate C on Figure 3).
They were chosen to represent different types of outdoor conditions.
As shown in Figure 3a, the temperature for Northern Europe has the lowest median (2.2 °C) and the highest amplitude (−39.0–27.2 °C), while Southern Europe climate has the highest median (16.4 °C) and the lowest amplitude (−3.1–37.2 °C). In the case of RH (Figure 3b), the Northern Europe climate has the highest median (84%) with the highest amplitude (18–99%), and Southern Europe has the lowest median (76%) with the lowest amplitude (25–100%).
Obviously, the sum of solar radiation in the south of Europe (Figure 4) is much higher than in Central and Northern Europe. The highest sum of precipitation is assumed for Central Europe (annually 661.2 mm) and the lowest for Northern Europe (annually 311.7 mm).

2.3. Internal Climate

Moisture in the indoor air is the source of moisture for inverted roofs. Therefore, it is crucial to actively maintain a proper internal climate. The calculations assume internal gains of heat and moisture suitable for office spaces. The influence of the type of microclimate control was also tested. Regardless of the thermal conditions control variant, the operation of mechanical ventilation was assumed.

2.3.1. Heat and Moisture Loads

The office is operated from 8 am to 6 pm. Every company and professional group has its own space requirements for one person (e.g., architects will need more space than administrative staff), so there is no one-size-fits-all method to how much office space per employee is required. For the purpose of the study, it was assumed that there would be 34 people, so there is 8 m2 of space per 1 person. This value corresponds to the average space for one office worker (including equipment), as recommended in [58]. A metabolic rate of 1.2 met (which corresponds to office work) was estimated. The unit gains of heat and moisture for this activity were adopted from the WUFI database (convective heat loads—84 W·per person, radiant heat loads—42 W per person and moisture loads—92 g·h−1 per person). Hourly gains of heat and moisture from three people were assumed in the toilet. Moisture gains (resulting from hand washing) equal to 200 g h−1 were also added. They are equivalent to washing the dishes after one meal [59].

2.3.2. Temperature and Relative Humidity of Internal Air

Two variants of microclimate control were assumed:
(1)
Full control (ideal HVAC installation—the power of the devices allows for maintaining defined microclimatic conditions):
-
in the office rooms, temperature range 20–26 °C are allowed (this corresponds to the II comfort class according to [52]), RH is maintained in the range of 40–70%RH;
-
the temperature in the toilet is maintained at the same level as in the office rooms, but it is permissible to increase the RH to 90%.
(2)
The heating system only with a minimum temperature of 20 °C.

2.3.3. Ventilation

The calculation of the ventilation air flow was based on the Perceived Air Quality Method [52,60]. According to this method, the total ventilation rate for the breathing zone is found by combining the ventilation for people and the building. The simulations were carried out for two variants of the supply air stream corresponding to the I and II air quality categories. Unit air streams were adopted based on [52]. After taking the usable area of the rooms and the number of people into account, the Air Change Rate (ACH) was calculated. For the I and II air quality categories, they amounted to 3.9 h−1 and 2.7 h−1, respectively.

2.4. Variants of Calculation

By taking into account the above assumptions, 36 basic variants of calculation were developed. These variants are summarised in Table 1. All variants were calculated by assuming that there was no shading of the roof.

2.5. Moisture Risk Assessment

The assessment of the moisture risk was based on the analysis of exceedances of the so-called Critical Moisture Content (CMC). The equilibrium moisture content of wood is a state corresponding to the air temperature and RH, in which the moisture content of the wood remains steady. Previous work has shown that moisture content caused by RH of above 65% can reduce the stiffness in CLT [61]. Wood begins to suffer damage if its moisture content (MC) exceeds 20% for long periods of time [62,63]. Target moisture content is defined in the standard EN 14298 [64]. The acceptable moisture content in wood depends on the final choice of the wood, the type and thickness of wood, and the average RH in the environment where the wood is to be used (e.g., for the coastal climates, the EMC of wood is greater than for inland ones). Based on common guidelines or recommendations, the acceptable moisture content for wood objects used indoors is 9% to 14% for construction [29].
Biological deterioration is a huge threat to wooden structures. Dry wood does not rot, even if it is infected with fungi. Mould fungi do not grow below RH of 75% within a temperature range of 5–40 °C [65]. In practice, it is found that the minimum moisture content of wood necessary for mould development is within 22–24%. Wood whose MC does not exceed 20% is protected against any common fungus causing decay [66].
In reality, continual changes in RH and temperature on surfaces and in building structures can be observed. As a result, it is not practicable to establish a single limit value for the hygrothermal design of building structures. Instead, mould growth formation should be described by dynamic models that take into account fluctuations in RH and the time needed for mould growth on a given material. This requires the use of dynamic data on the RH and temperature in the structure or material. These can be either measured or calculated with simulation tools [29]. The isopleth model and its extension, the transient bio-hygrothermal model [67,68], are widely used mould growth models.
Based on the above, the safe MC in wood-based materials is assumed to be 20% of dry material density, which for CLT is 410 kg·m−3. Thus, for this material, the CMC is 82 kg·m−3. The EMC in wood-derived materials varies depending on the region of the world. However, it is assumed that the maximum amount is approximately 16–17% of the density of the material in a dry state. For safety reasons, 16% was assumed in the further analysis, which corresponds to the moisture content of 65.6 kg·m−3.
In the calculations, the following initial typical built-in moisture content was assigned:
-
Generic ground—0.4 kg·m−3;
-
EPDM—0.0018 kg·m−3;
-
CLT—48 kg·m−3;
-
Mineral wool—0.17 kg·m−3.
The initial temperature in components also was assigned: 20 °C.

2.6. Risk of Fungal Contamination

In order to define the risk of mould contamination, calculations were made in the WUFI®Bio software [69]. For the bio-hygrothermal simulations, substrate class I (Bio-utilisable substrates, such as wallpaper, plasterboard, building products made of biologically degradable materials, materials for permanently elastic joints, strongly contaminated surfaces) was assumed.
The bio-hygrothermal model used by WUFI®Bio gives the amount of mould in terms of the size of a growing mould blotch as well as uses a six-level Mould Index (MI) describing the mould-infested fraction of a surface (based on the Viitanen model [65]):
  • MI = 0—no growth;
  • MI = 1—some growth visible under microscope;
  • MI = 2—moderate growth visible under microscope, coverage more than 10%;
  • MI = 3—some growth detected visually, thin hyphae found under microscope;
  • MI = 4—visual coverage more than 10%;
  • MI = 5—coverage more than 50%l
  • MI = 6—tight coverage—100%.
Due to a more intuitive assessment of the risk of mould growth, MI was used in this paper.

3. Results

In order to avoid the so-called initial error, preliminary calculations were made for two years, and the analysis of data was carried out for the third calendar year.

3.1. Results of WUFI®plus Simulation

As a result of calculations, variability courses for moisture content (MC) for individual layers of the partition were obtained. The moisture content of CLT (on the inner and outer surface of layers) was analysed in detail—monitors M1–M6 in Figure 2. These values were compared with equilibrium and critical moisture content.
For all the variants for M3–M6 monitors, the moisture content does not exceed EMC (Figure 5, Figure 6 and Figure 7 show the least favourable results for the office). Therefore, they will not be discussed further in the paper.

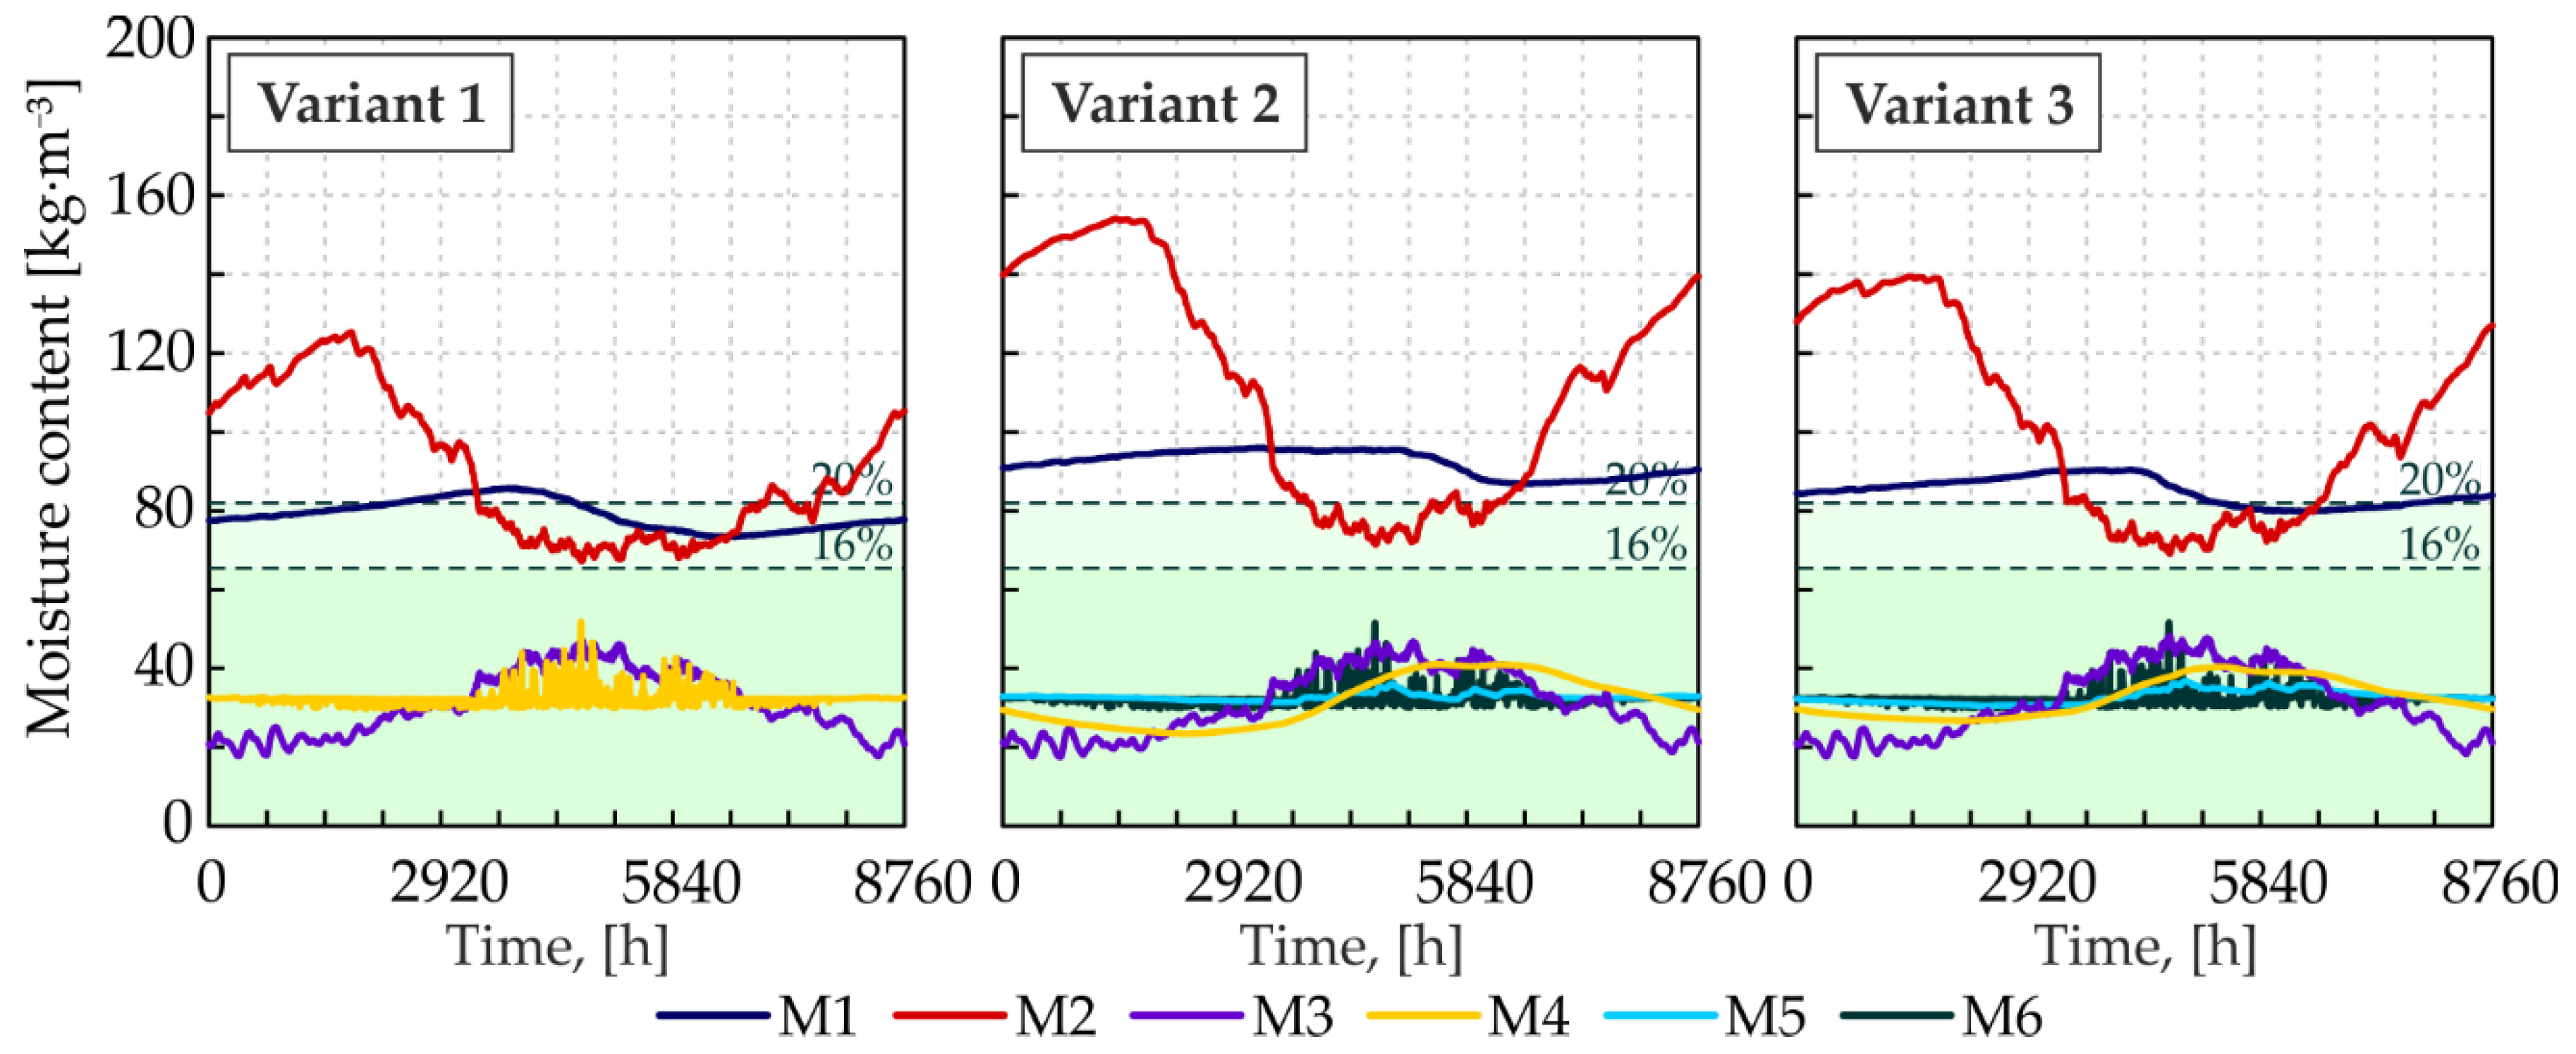
3.1.1. Northern Europe

Taking into account the assumption of full microclimate control inside office spaces and ACH = 3.9 h−1, in the climate of Northern Europe, the outer layer of CLT is exposed to exceedances of CMC (regardless of the type of flat roof structure). It should be noted that the variability of the moisture content for the M2 monitor (average amplitude 70.5 kg·m−3) is greater than for the M1 monitor (average amplitude 11.1 kg·m−3). The maximum and average moisture contents of the material are also higher (Figure 8). For M1, the maximum MC for the variant without insulation (variant 1) is 85.0 kg·m−3, with Sd = 200 m foil (variant 2) 95.4 kg·m−3, and with SVR (variant 3) 89.8 kg·m−3. For the M2 monitor, it is 123.6 kg·m−3, 155.2 kg·m−3 and 139.0 kg·m−3, respectively. For the M2 monitor, these exceedances are significant. Maximum MC for variant 1 is 123.6 kg·m−3 (30.2%), for variant 2 it is 155.2 kg·m−3 (37.9%) and for variant 3 it is 139.0 kg·m−3 (33.9%).
For the M2 monitor, the number of hours (per year) with exceeding the CMC in case of lack of moisture barrier (variant 1) is 4706 (which is 53.7% of the year), 6474 (73.9%) in the case of Sd = 200 m foil (variant 2) and 5670 (64.7%) in case of SVR (variant 3). For the M1 monitor, these numbers are 1866 (21% of the year), 8760 (100%) and 5670 (64.7%), respectively.
MC for all three variants decreases, below CMC, for M2 in the period between June and September (Figure 5). In the same period, a slight increase in moisture content can be observed for M1.
The change in the method of active microclimate control also causes a change in the moisture content in the partition. As it results from the comparison of full microclimate control with a heating-only system (Figure 9), no significant changes were observed in the case of using Sd = 200 m foil (variant 1 vs. variant 8). A clear improvement was observed for the remaining two variants of the construction. In the absence of insulation for the M2 monitor, the MC did not exceed the CMC. Over 79.7% of the year, this MC does not exceed EMC. For M1, this share increases to 92.1%. When SVR was used, the maximum MC for M1 was 81.4 kg·m−3 (19.9%). For M2, the maximum MC in the material was 104.9 kg·m−3 (25.9%). This is a reduction of 24.5% compared to the variant with full microclimate control. The CMC was exceeded for 2711 h, which is 30.9% of the year.
In rooms where an increase in the permissible RH is assumed (toilets), the moisture content in partitions also increases (Figure 10). This change is noticeable for variants for which no insulation was assumed and SVR was applied. These differences concern only the amount of MC except for the period June–October. For toilets, the MC in the flat roof is on average higher than in office rooms by 2.0 kg·m−3 for M1 and by 4.2 kg·m−3 for M2. The maximum differences are 3.3 kg·m−3 and 9.9 kg·m−3, respectively. For variants with Sd = 200 m foil, these differences are not statistically significant.
The change in ACH did not affect the MC of M1 and M2. The average difference in the results was 0.9 kg·m−3 (with a maximum of 2.4 kg·m−3).

3.1.2. Central Europe

For the Central European climate, for the variant assuming no insulation (variant 13), the maximum MC for M1 was 67.5 kg·m−3, and for the M2 75.1 kg·m−3. For the Sd = 200 m foil (variant 14), 88.3 kg·m−3 and 145.8 kg·m−3, respectively. For SVR (variant 15), 76.6 kg·m−3 and 88.7 kg·m−3, respectively (Figure 6 and Figure 11). For the variant where no insulation is assumed, the CMC is not exceeded. For the variant with SVR, the exceedances were observed for M2—it amounted to a total of 806 h, which is 9.2% per year. The CMC exceedances for Sd = 200 m foil are significant. For M1, they account for 39.2% of the year (3433 h), and for M2, 55.7% of the year (4878 h).
With the heating was on in the winter season, in the absence of insulation, the maximum MC for M2 was 63.9 kg·m−3. In this case, not only the CMC but also the EMC was not exceeded. With the use of the Sd = 200 m foil, the maximum MC for the M2 was 144.5 kg·m−3, and the CMC exceeded 55.4% of the year. For the variant with SVR, the maximum MC for M2 was 80.9 kg·m−3; therefore, no CMC exceedances were observed. EMC exceedance accounted for 40.4% of the year. As in the case of the Northern European climate, the impact of ACH is negligible.

3.1.3. Southern Europe

In the case of the climate of Southern Europe, the risk of excessively high MC in the inverted flat roof layers occurs only in the cases when the Sd = 200 m foil (Figure 7 and Figure 12) was used—variant 26. The maximum moisture content for M2 is 100.3 kg·m−3; the CMC exceedances amounted to 26.2% of the year (2294 h). Taking into account the use of only heating resulted in the reduction in the maximum moisture content for M2 (variant 32) to 97.8 kg·m−3; however, the exceedance period was not significantly reduced and amounted to 25.2% of the year (2209 h). For the other variants, even with full microclimate control, there is no risk of high MC (variants 25 and 27). The maximum MC for these cases for M2 did not exceed 60.5 kg·m−3; therefore, not only the CMC but also the EMC exceeded was not observed. As in the cases described above, the impact of ACH is negligible.

3.2. WUFI®Bio Results

The results obtained in the WUFI®Plus software were imported to WUFI®Bio. The analysis of the results confirms that for the variants in which Sd = 200 m foil was assumed, the risk of biological deterioration is significant for external CLT panels. For climates of Central and Northern Europe with full microclimate control, MI exceeds 5, which corresponds to mould growth of 400 mm·year−1 and more. For the Southern European climate, the minimum MI was 4 (mould growth 240 mm·year−1). This means that the mould growth risk and the severity of the infestation are not acceptable. Changing the microclimate control method (to heating only) does not reduce this risk.
For variants using SVR, in the case of full microclimate control for the climate of Northern Europe, the minimum MI is 5; for Central and Southern Europe, it is 3.5. This means that mould growth risk is not acceptable for these cases. With additional thermal insulation, the risk remains unacceptable for Northern Europe, while for Central Europe, it is minimised. After introducing a limitation on the maximum RH to 30% MI, the climate of Northern Europe does not exceed 1.75 (mould growth less than 200 mm/year). It means that additional criteria or investigations are needed for assessing the acceptability. For other variants with SVR, MI is lower than 0.5.
For variants in which no moisture barrier is assumed, only for the climate of Northern Europe, with full microclimate control, the risk of mould growth is unacceptable (MI = 5). For other variants with no moisture barrier, the growth is below 50 mm·year−1, which corresponds to a MI of a maximum of 0.5.

3.3. Additional Variants

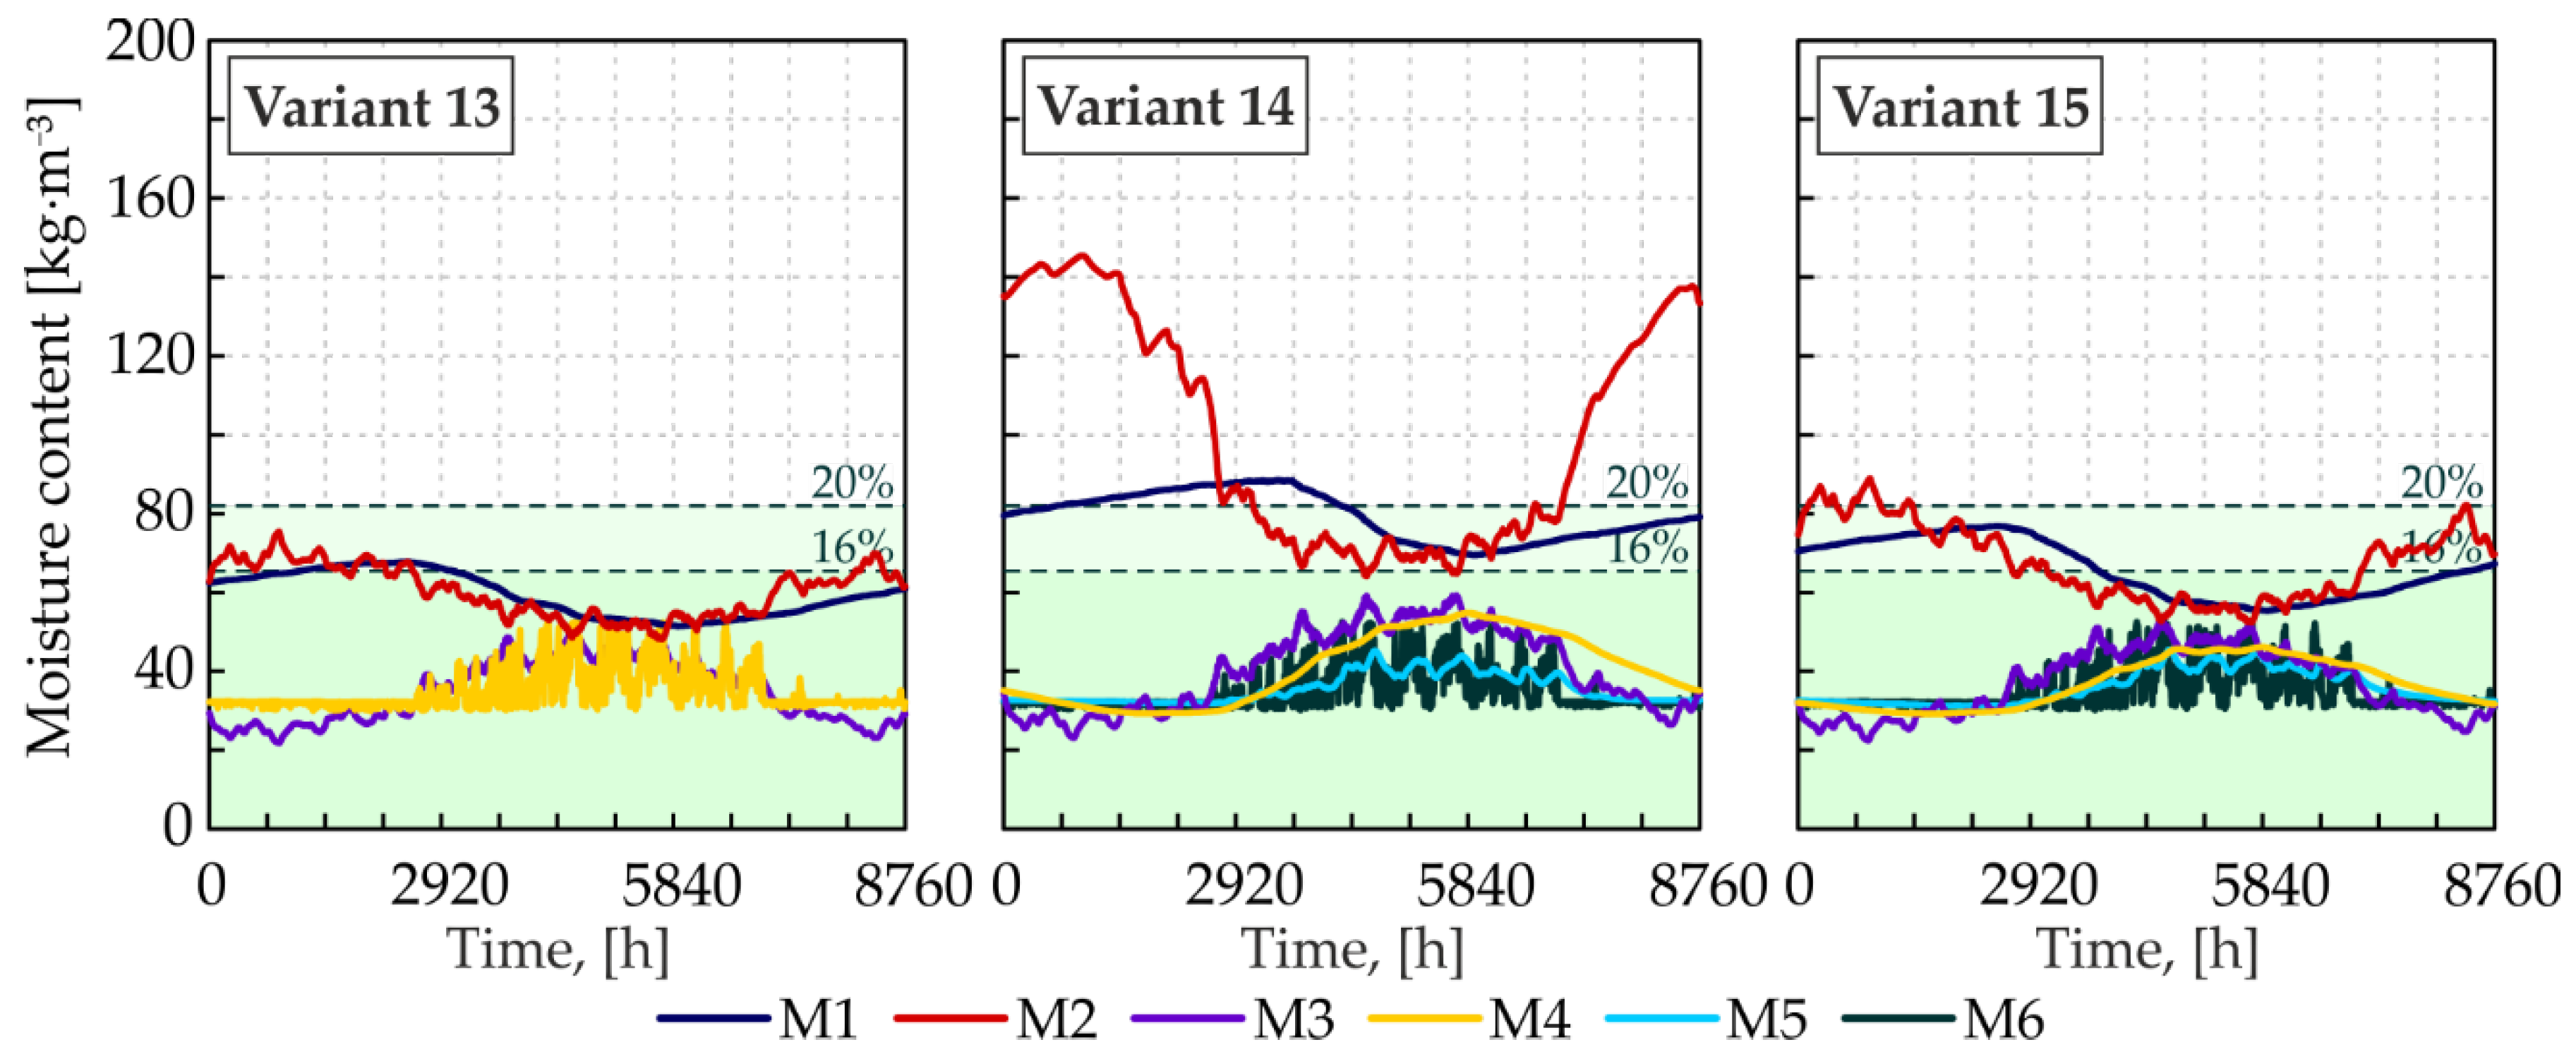
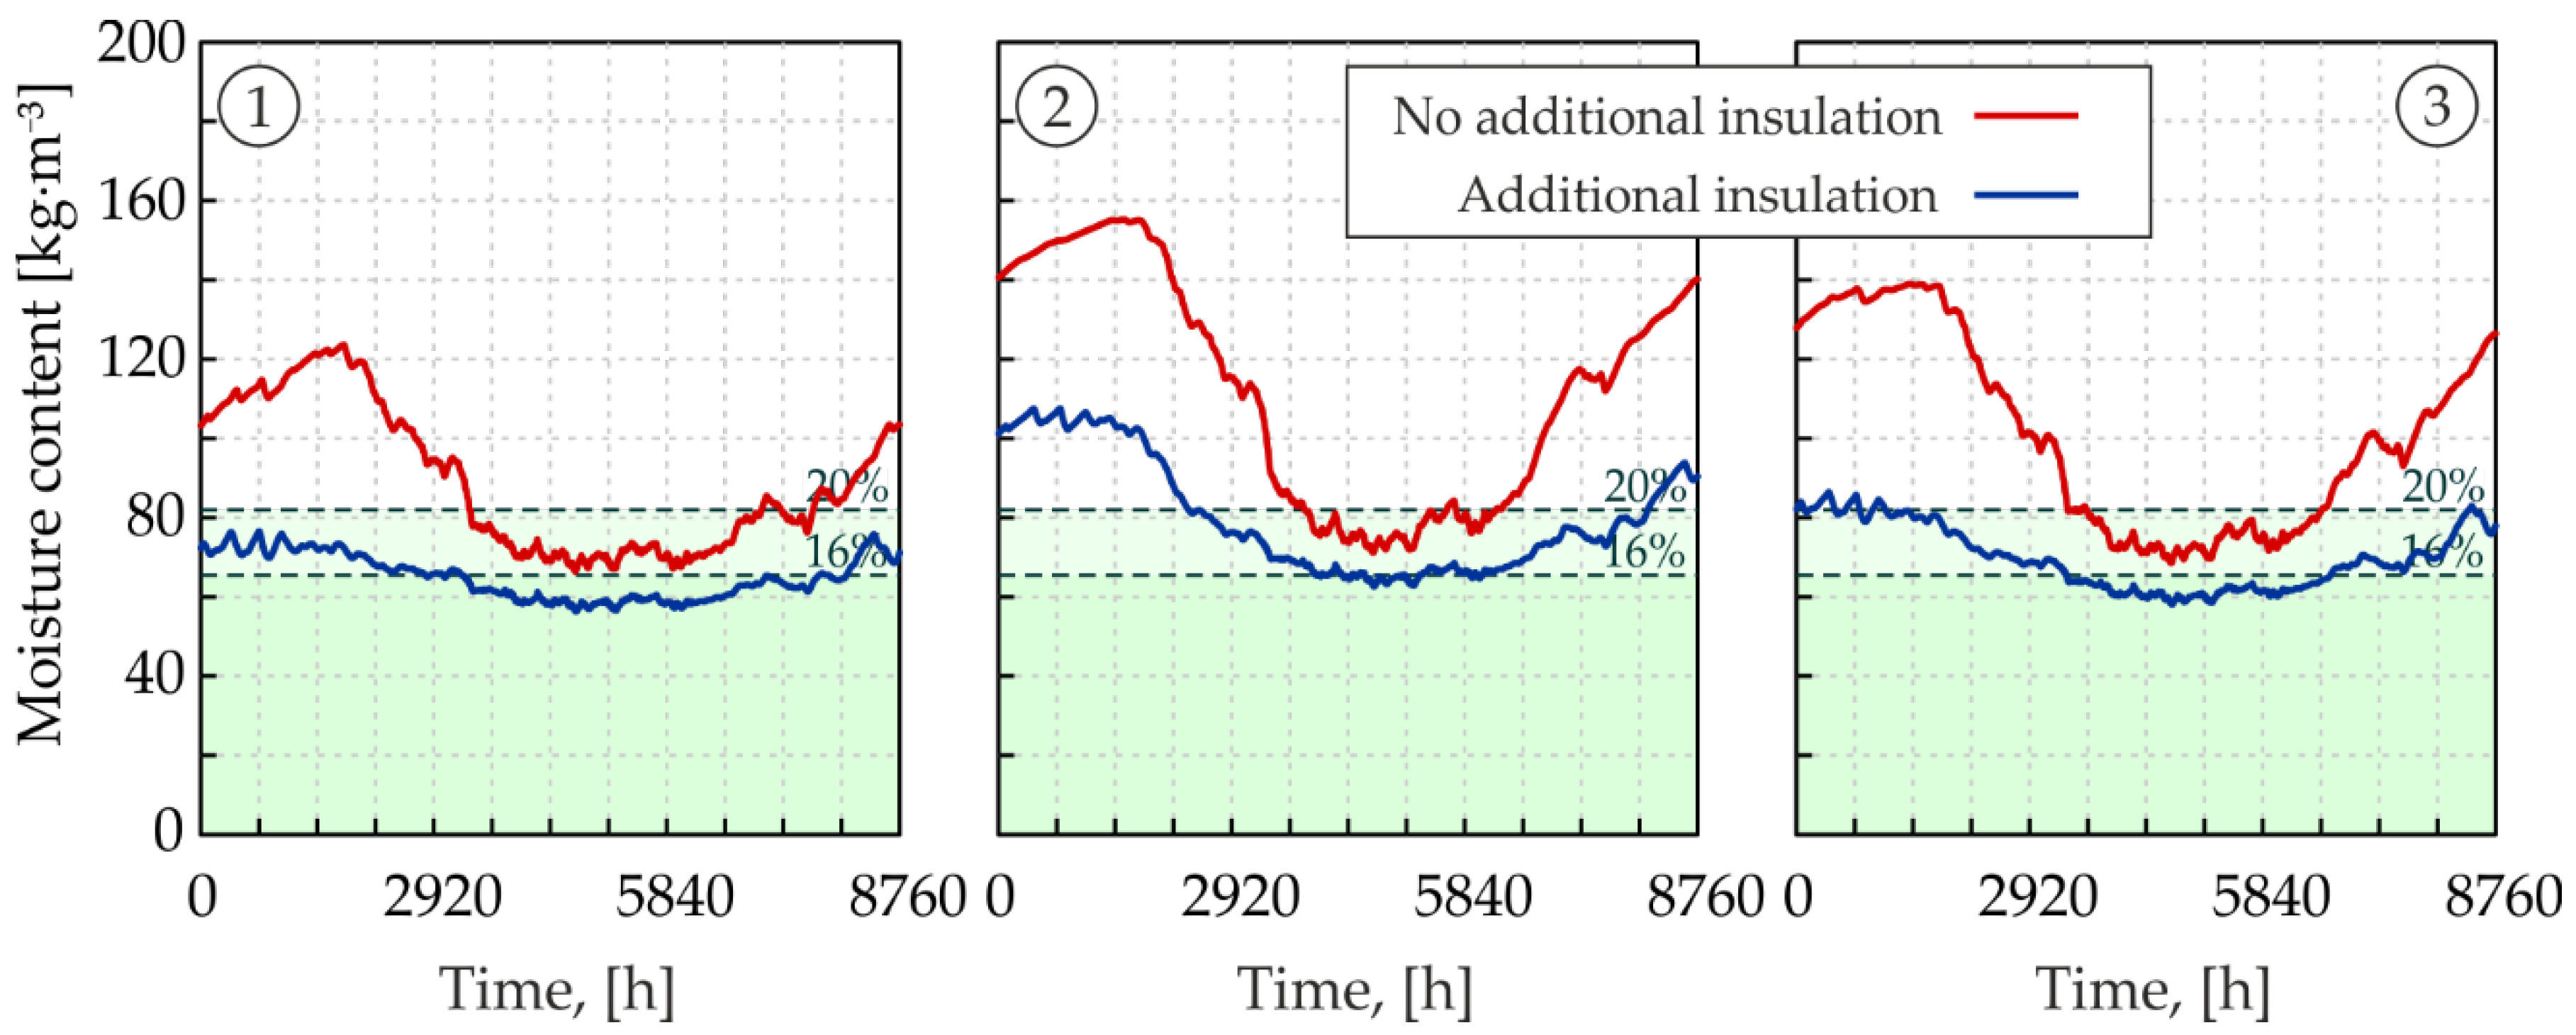
3.3.1. Additional Thermal Insulation

Due to the fact that for the climates of Northern Europe and partly for Central Europe, there is a risk of the partitions becoming damp in the winter, a solution with an additional layer of thermal insulation was tested. Two insulation thicknesses of 5 and 10 cm were tested. Each of these were placed between the EPDM membrane and the ground. In principle, this solution was to limit the condensation of moisture in the upper CLT slab (M1 and M2 monitors) caused by too low temperature in this partition layer.
The desired results were obtained with an additional insulation thickness of 10 cm. For variant 1 (no insulation), the MC did not exceed 76.6 kg·m−3 (Figure 13). For variant 3 (with SVR), the maximum MC was 86.5 kg·m−3. CMC exceedances were observed in 9.2% of the year (817 h). For the Sd = 200 m foil (variant 2), the maximum MC for the M2 was 107.6 kg·m−3, and the exceedances amounted to 34.3% of the year (3006 h).

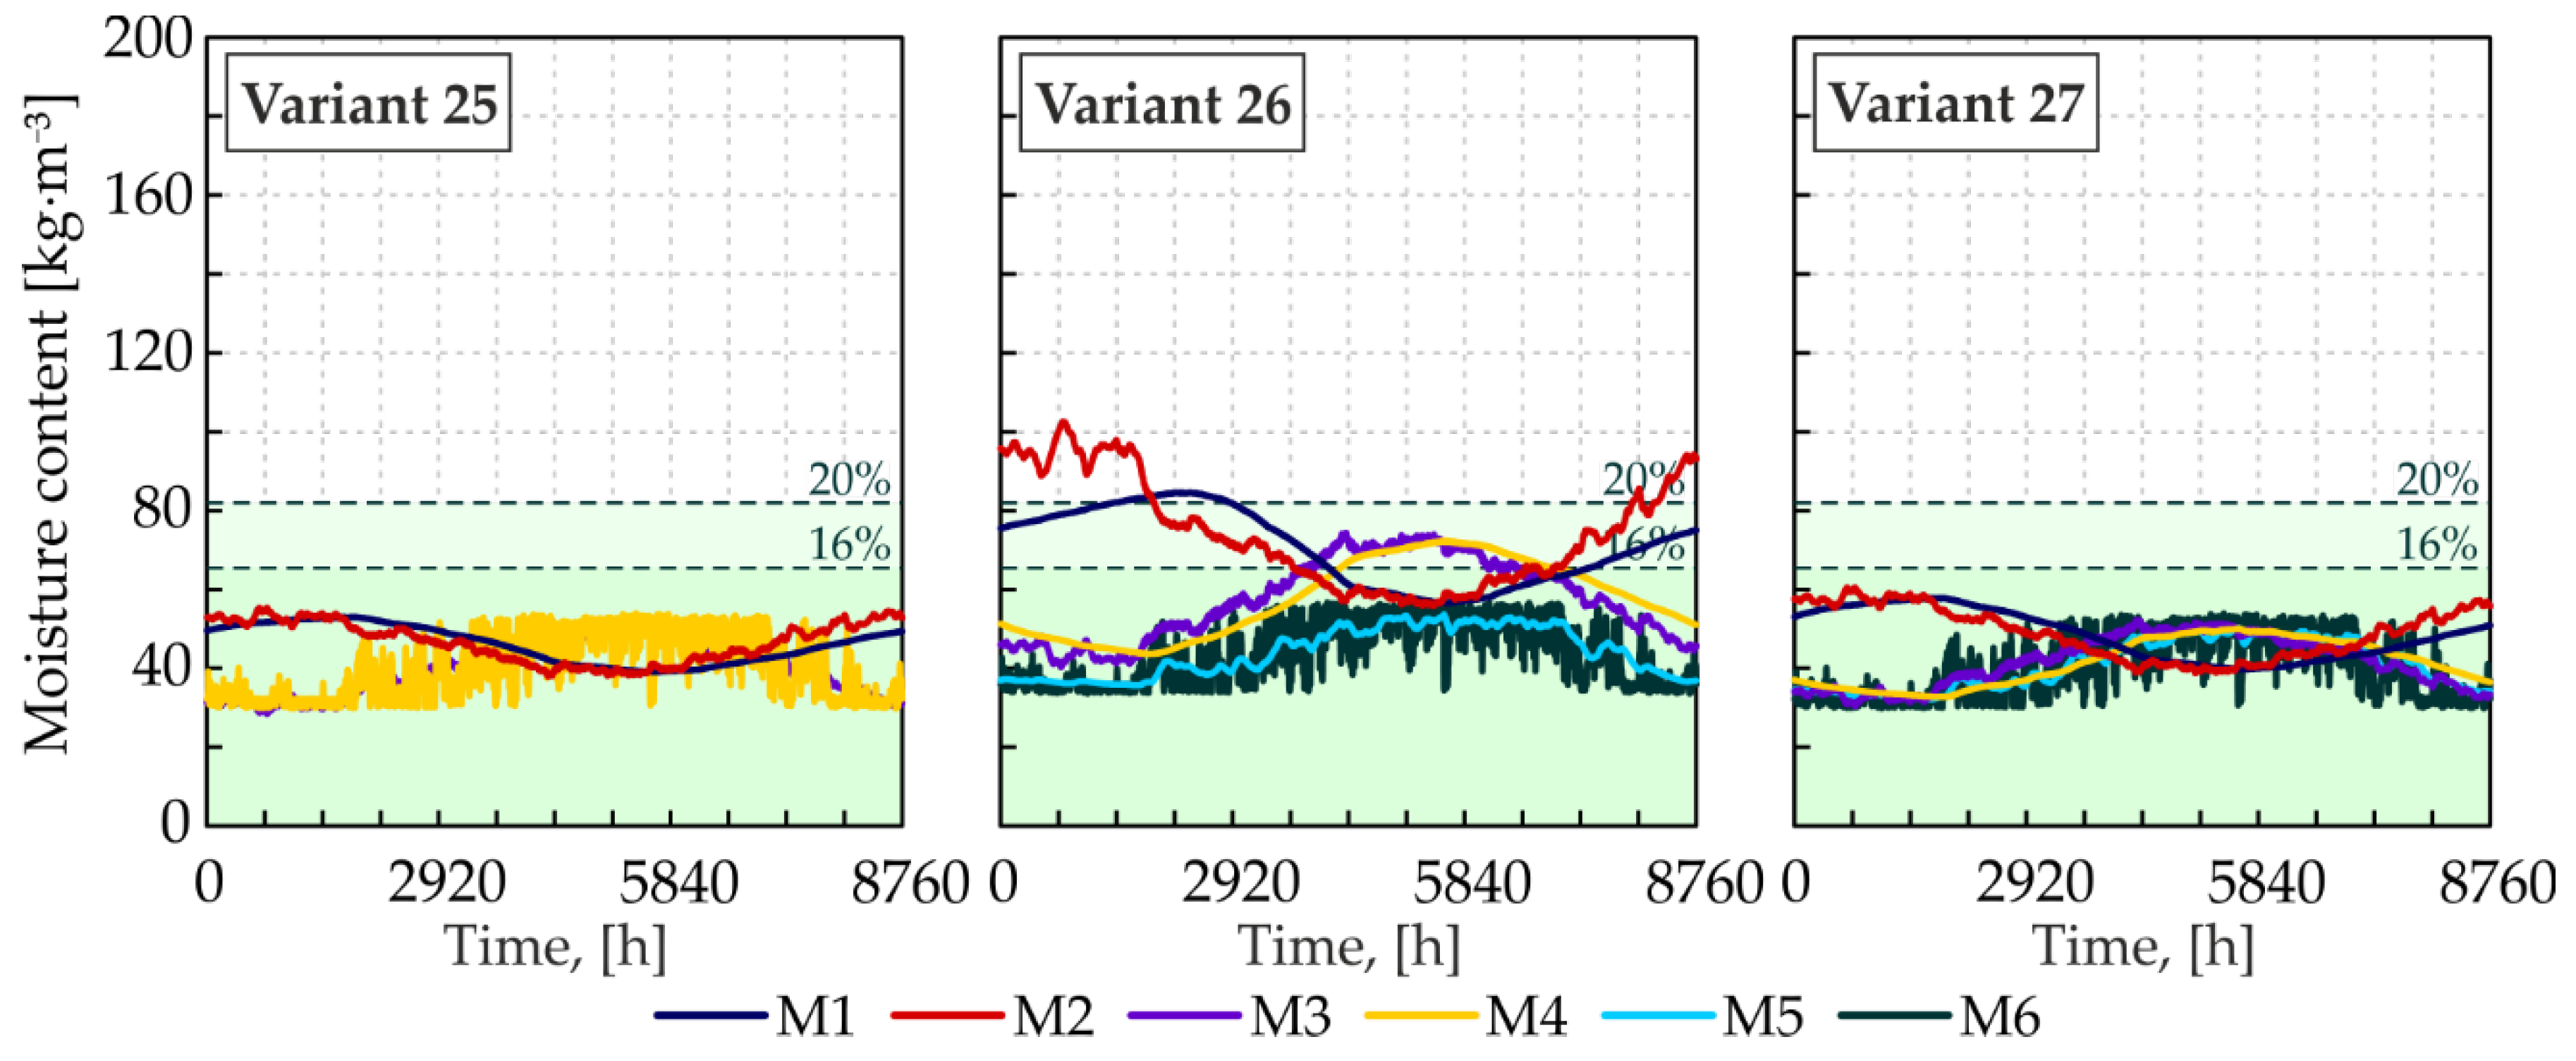
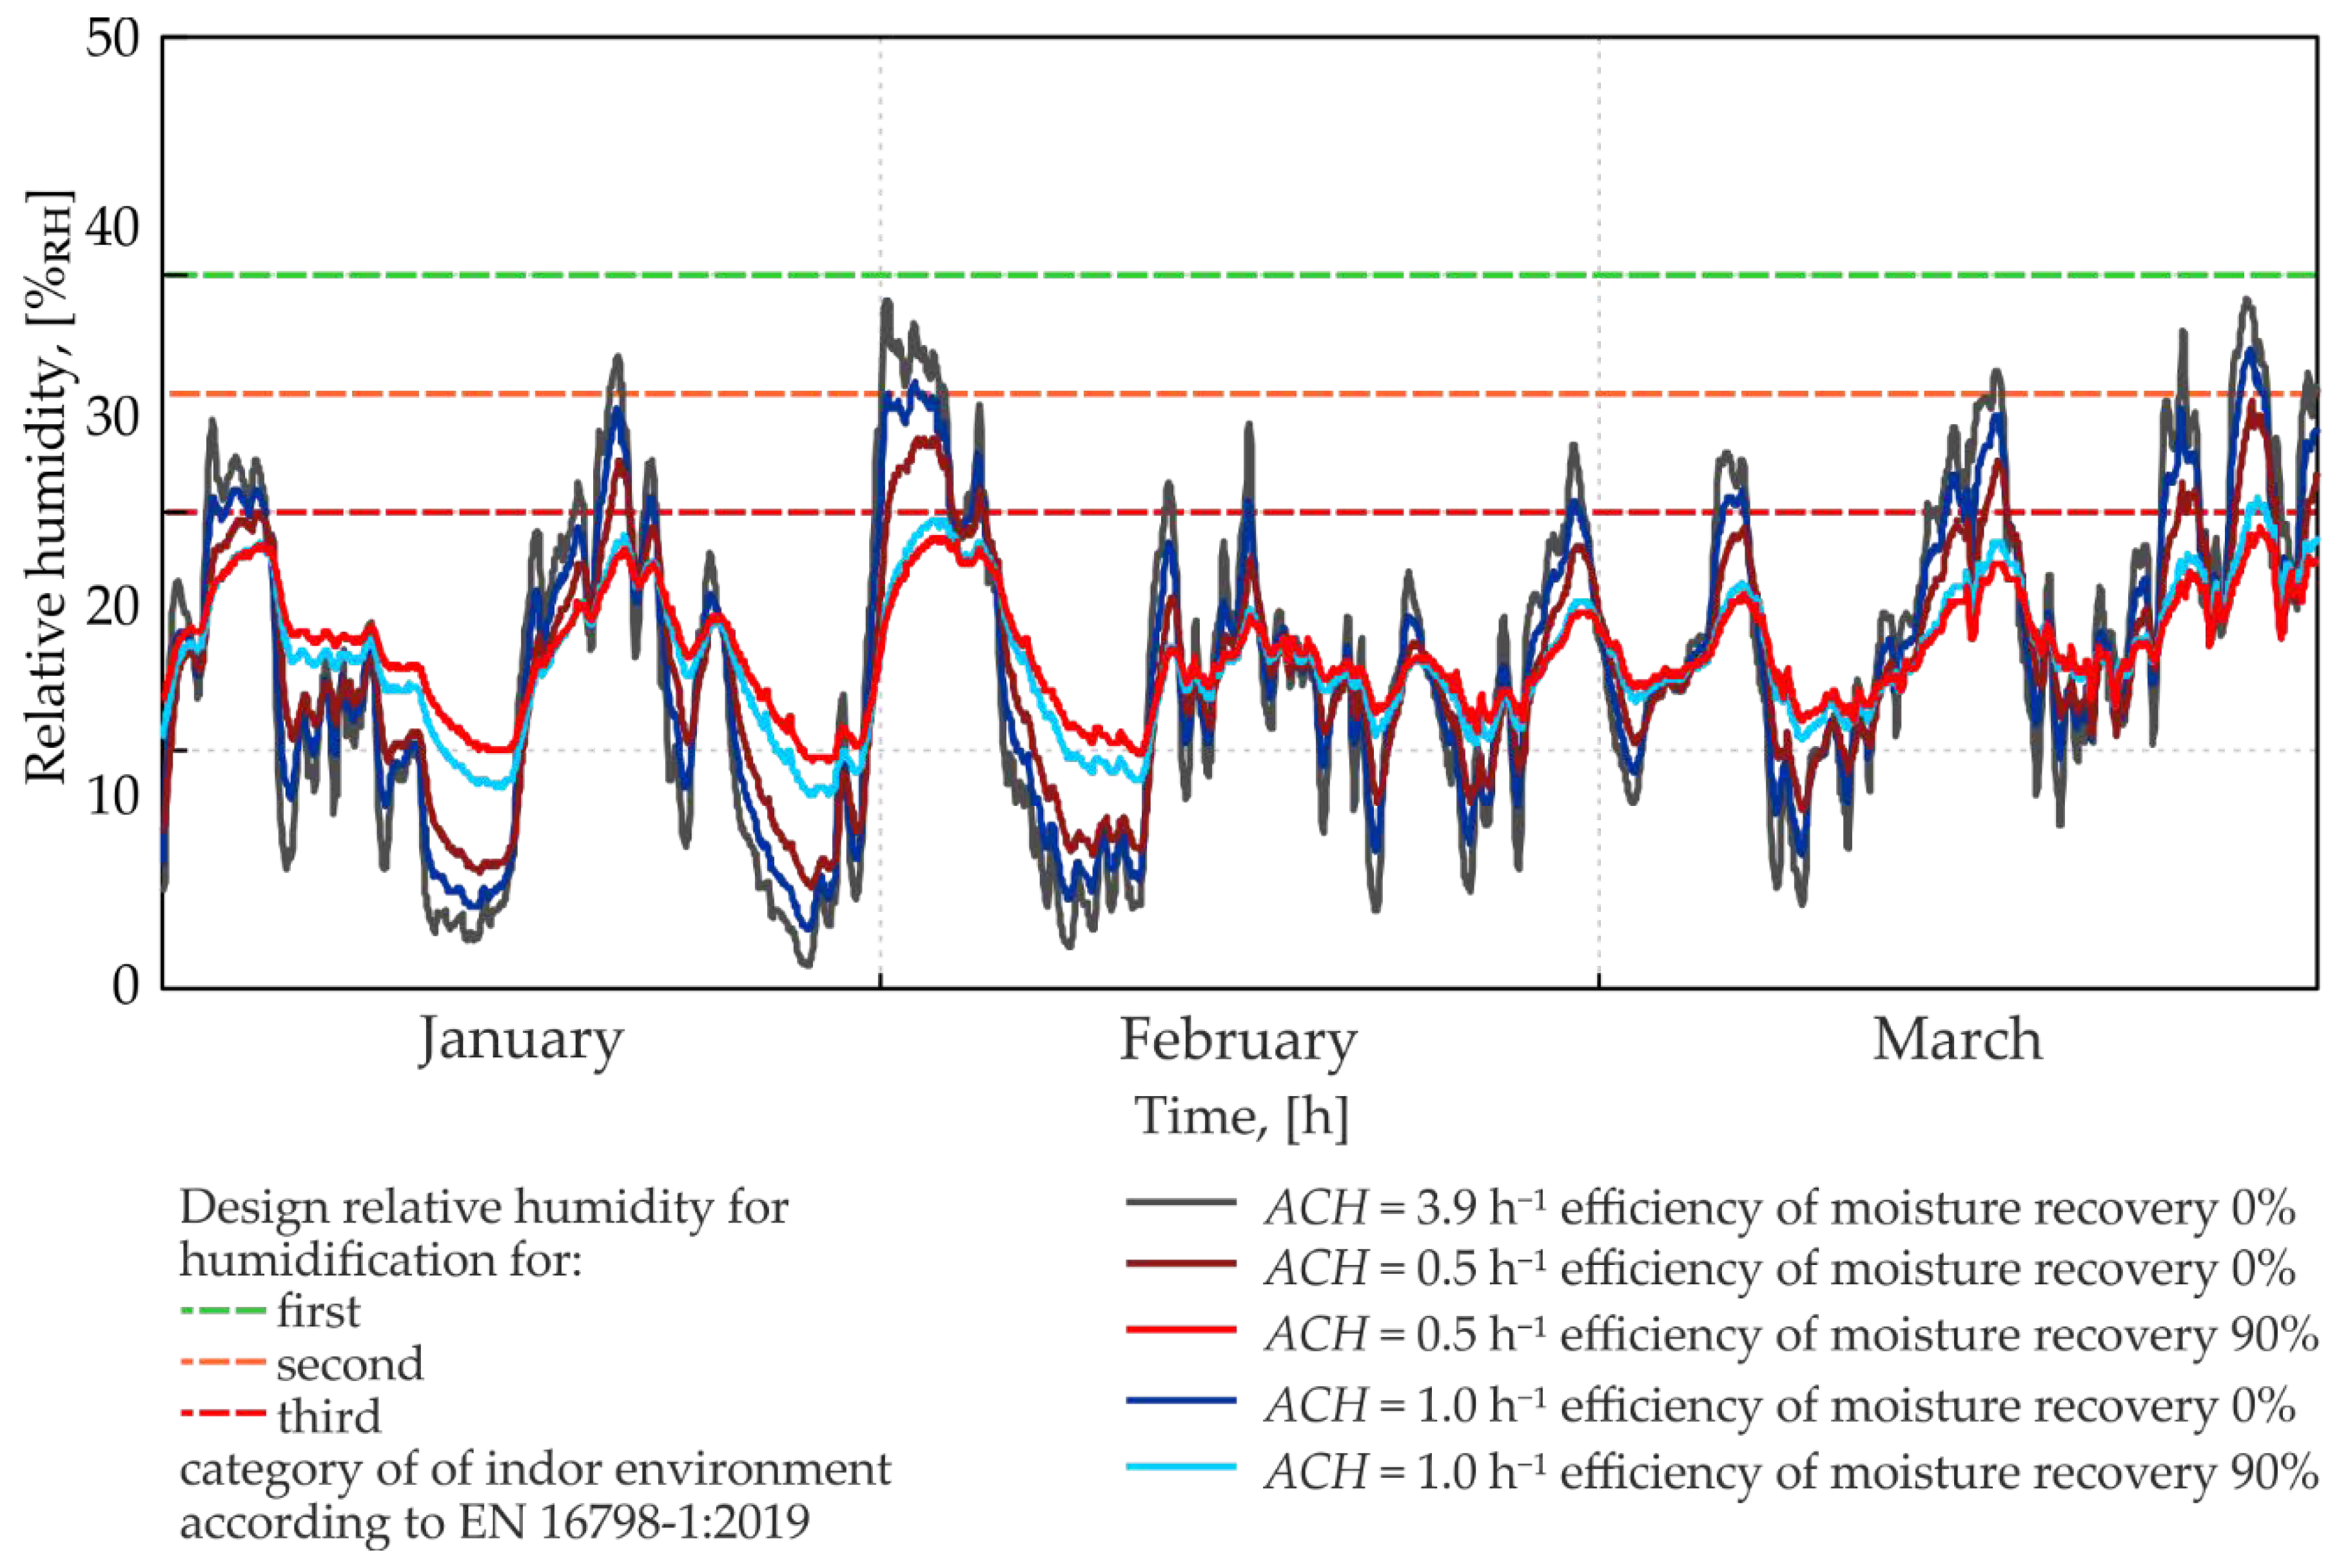
3.3.2. Control of Moisture in Indoor Air

Changing the microclimate control method from full microclimate control to heating only resulted in minimising the risk of dampness, even for the climate of Northern and Central Europe. However, it also caused the RH of inner air to drop below 20%RH (for winter months). Reduction in the ACH to 0.5 h−1 (minimum allowed for offices acc. to EN 12831-1:2017 [70]) and the use of moisture recovery (enthalpy exchangers) increased RH in the room. However, even under these conditions, the RH fell below 20% (Figure 14). ACH reduction in combination with moisture recovery resulted in an increase in the MC in the partition to a level above 20%.
Therefore, variants with air humidification in winter were tested (with humidification only up to the limit comfort). After taking into account this correction (RHmax = 30%RH—design RH for humidification for Category I of the indoor environment [36]) and for the other basic assumptions from variants 1–3 (Figure 15), the maximum MC in the absence of insulation for M2 was 83.1 kg·m−3, for Sd = 200 m MCmax = 154.4 kg·m−3 and for SVR MCmax = 119.4 kg·m−3. The CMC exceedances concerned 50 h (which constitutes 0.6% of the year), 6376 h (72.8%) and 4295 h (49%), respectively.
After taking into account the additional thermal insulation, the MC was further reduced: for the variant without moisture barrier to a level below EMC—64.3 kg·m−3, for SVR to a level below CMC—78.8 kg·m−3, and for Sd = 200 m foil to 106.2 kg·m−3 (exceeding the CMC for 2946 h—33.6%).

4. Discussion and Conclusions

The conducted analysis concerned a generic building that meets the requirements of the Passive House Standard [57]. The building model and the calculations were made in the WUFI®plus software. Due to the lack of experimental data on the hygrothermal assembly performance, the model could only be validated indirectly. It should be noted that the used software was extensively validated for various building typologies and structures. A detailed validation of the hygrothermal WUFI®plus model can be found in [71,72]. In particular, in a very complex system of boundary conditions, and with a large number of unknowns, it was possible to achieve high compliance of the model with the measurements. Despite the application of well-validated software and carefully defined boundary conditions, no precise reflection of real hygrothermal behaviour of partition could be achieved [72]. However, even in very complex buildings, sufficient model compliance can be achieved:
-
Goodness of Fit (GOF) in the range of 81.2–84.8% depending on the degree of model (microclimate calculation) simplification [71];
-
The Mean Absolute Error MAE = 0.4 °C, Normalised Mean Bias Error NMBE = ±0.3%, Coefficient of Variation of the Root Mean Square Error (CV)RMSE = 5.0%, R2 = 99% and GOF = 89.9% (for temperature on the partition surface before calibration of the model) [72].
In both cases, as in the present paper, material data were taken from the WUFI database.
In the case of inverted roofs, the transport of moisture to the outside is blocked by the EPDM membrane, which protects the partition against external moisture. Therefore, the possibility of drying to the inside is crucial. Based on the performed calculations, it can be concluded that this feature determines the moisture risk:
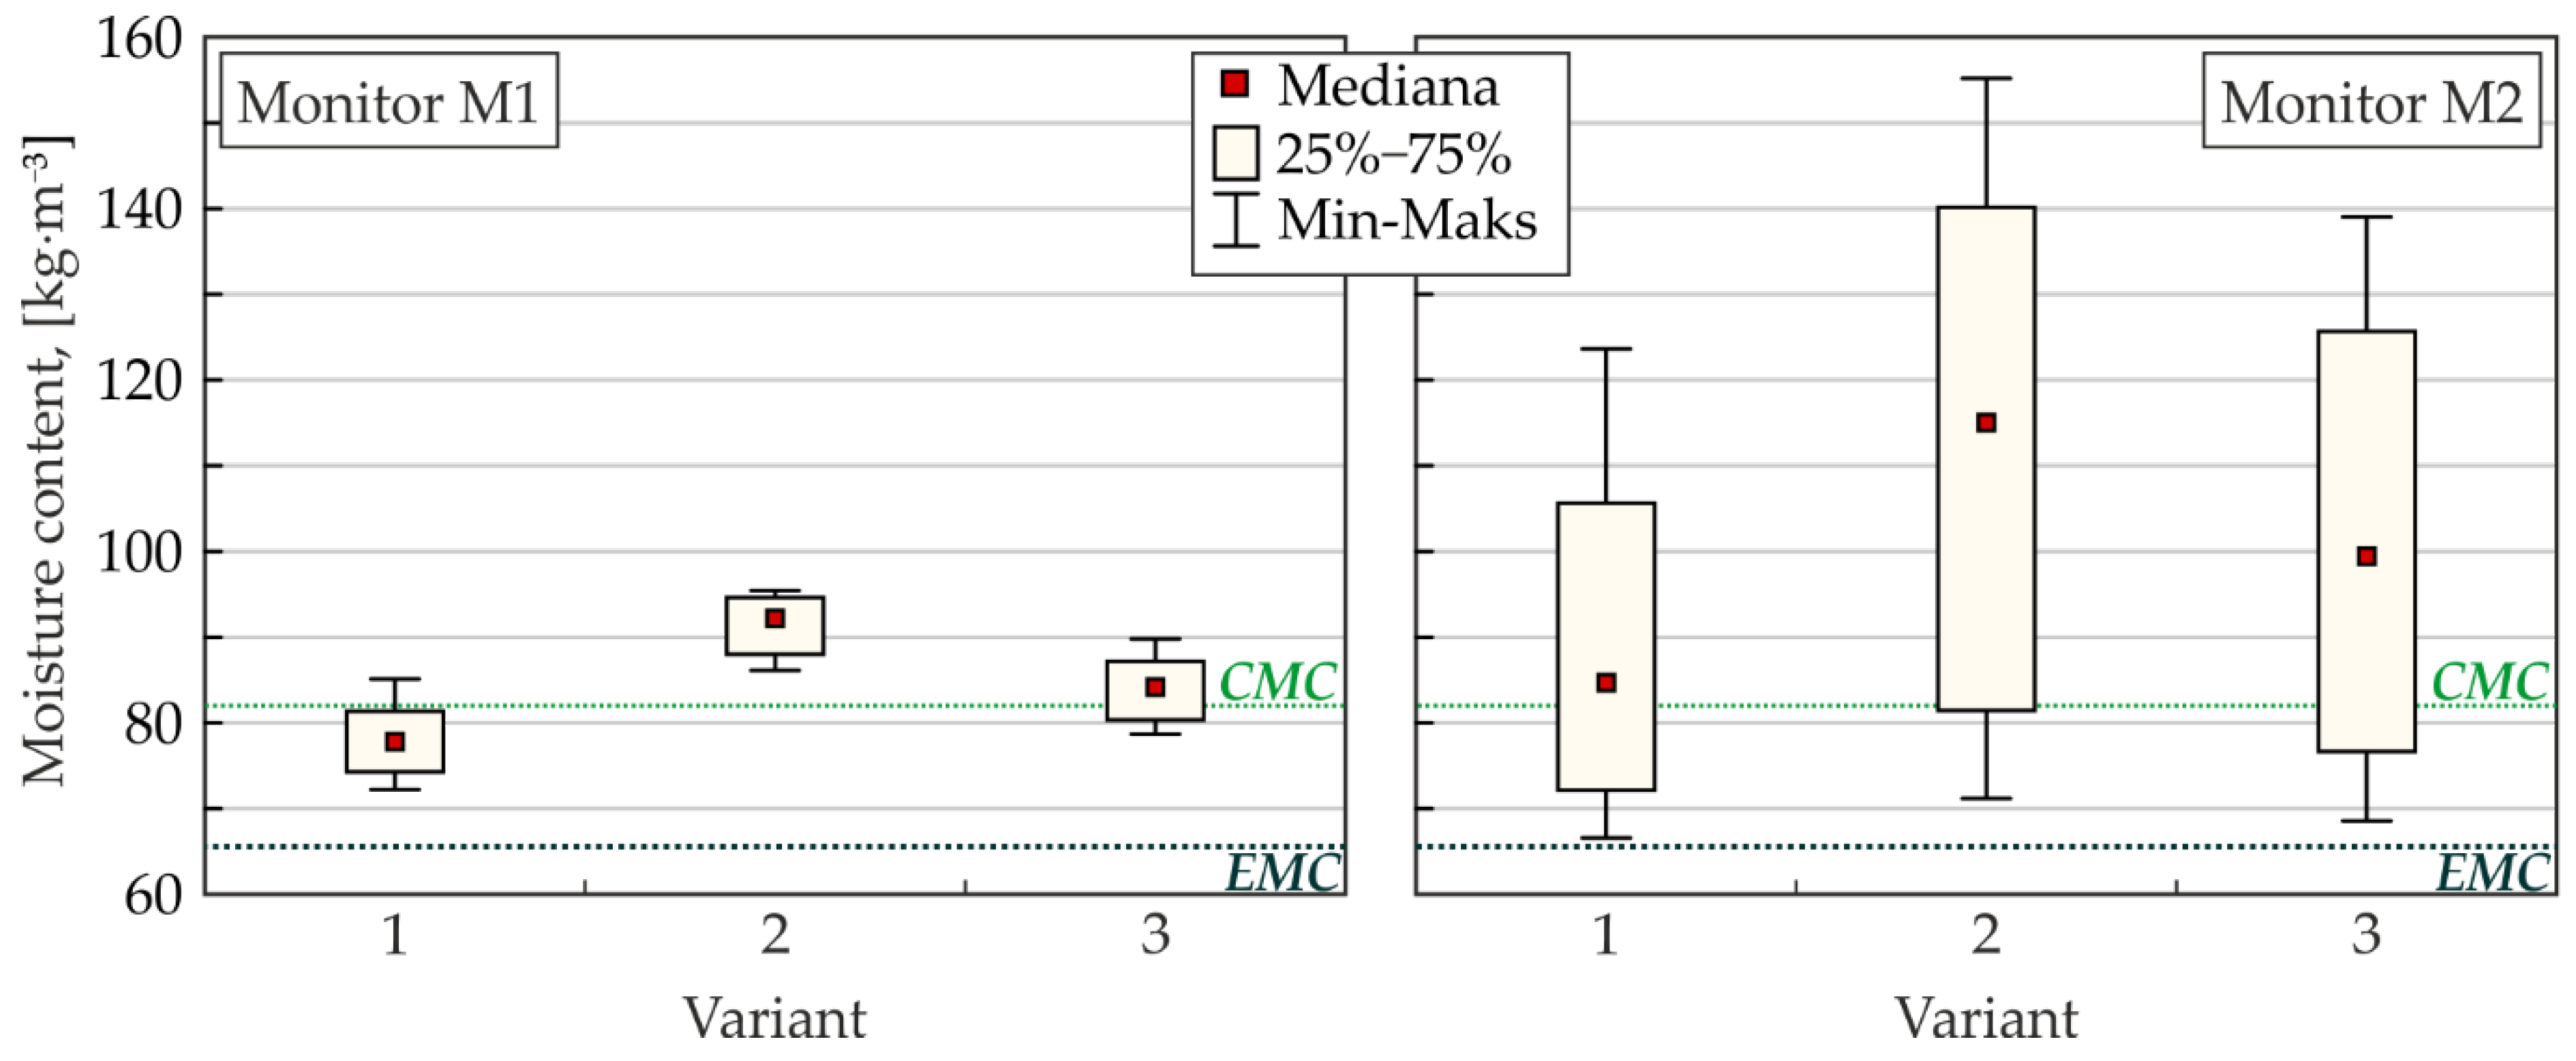
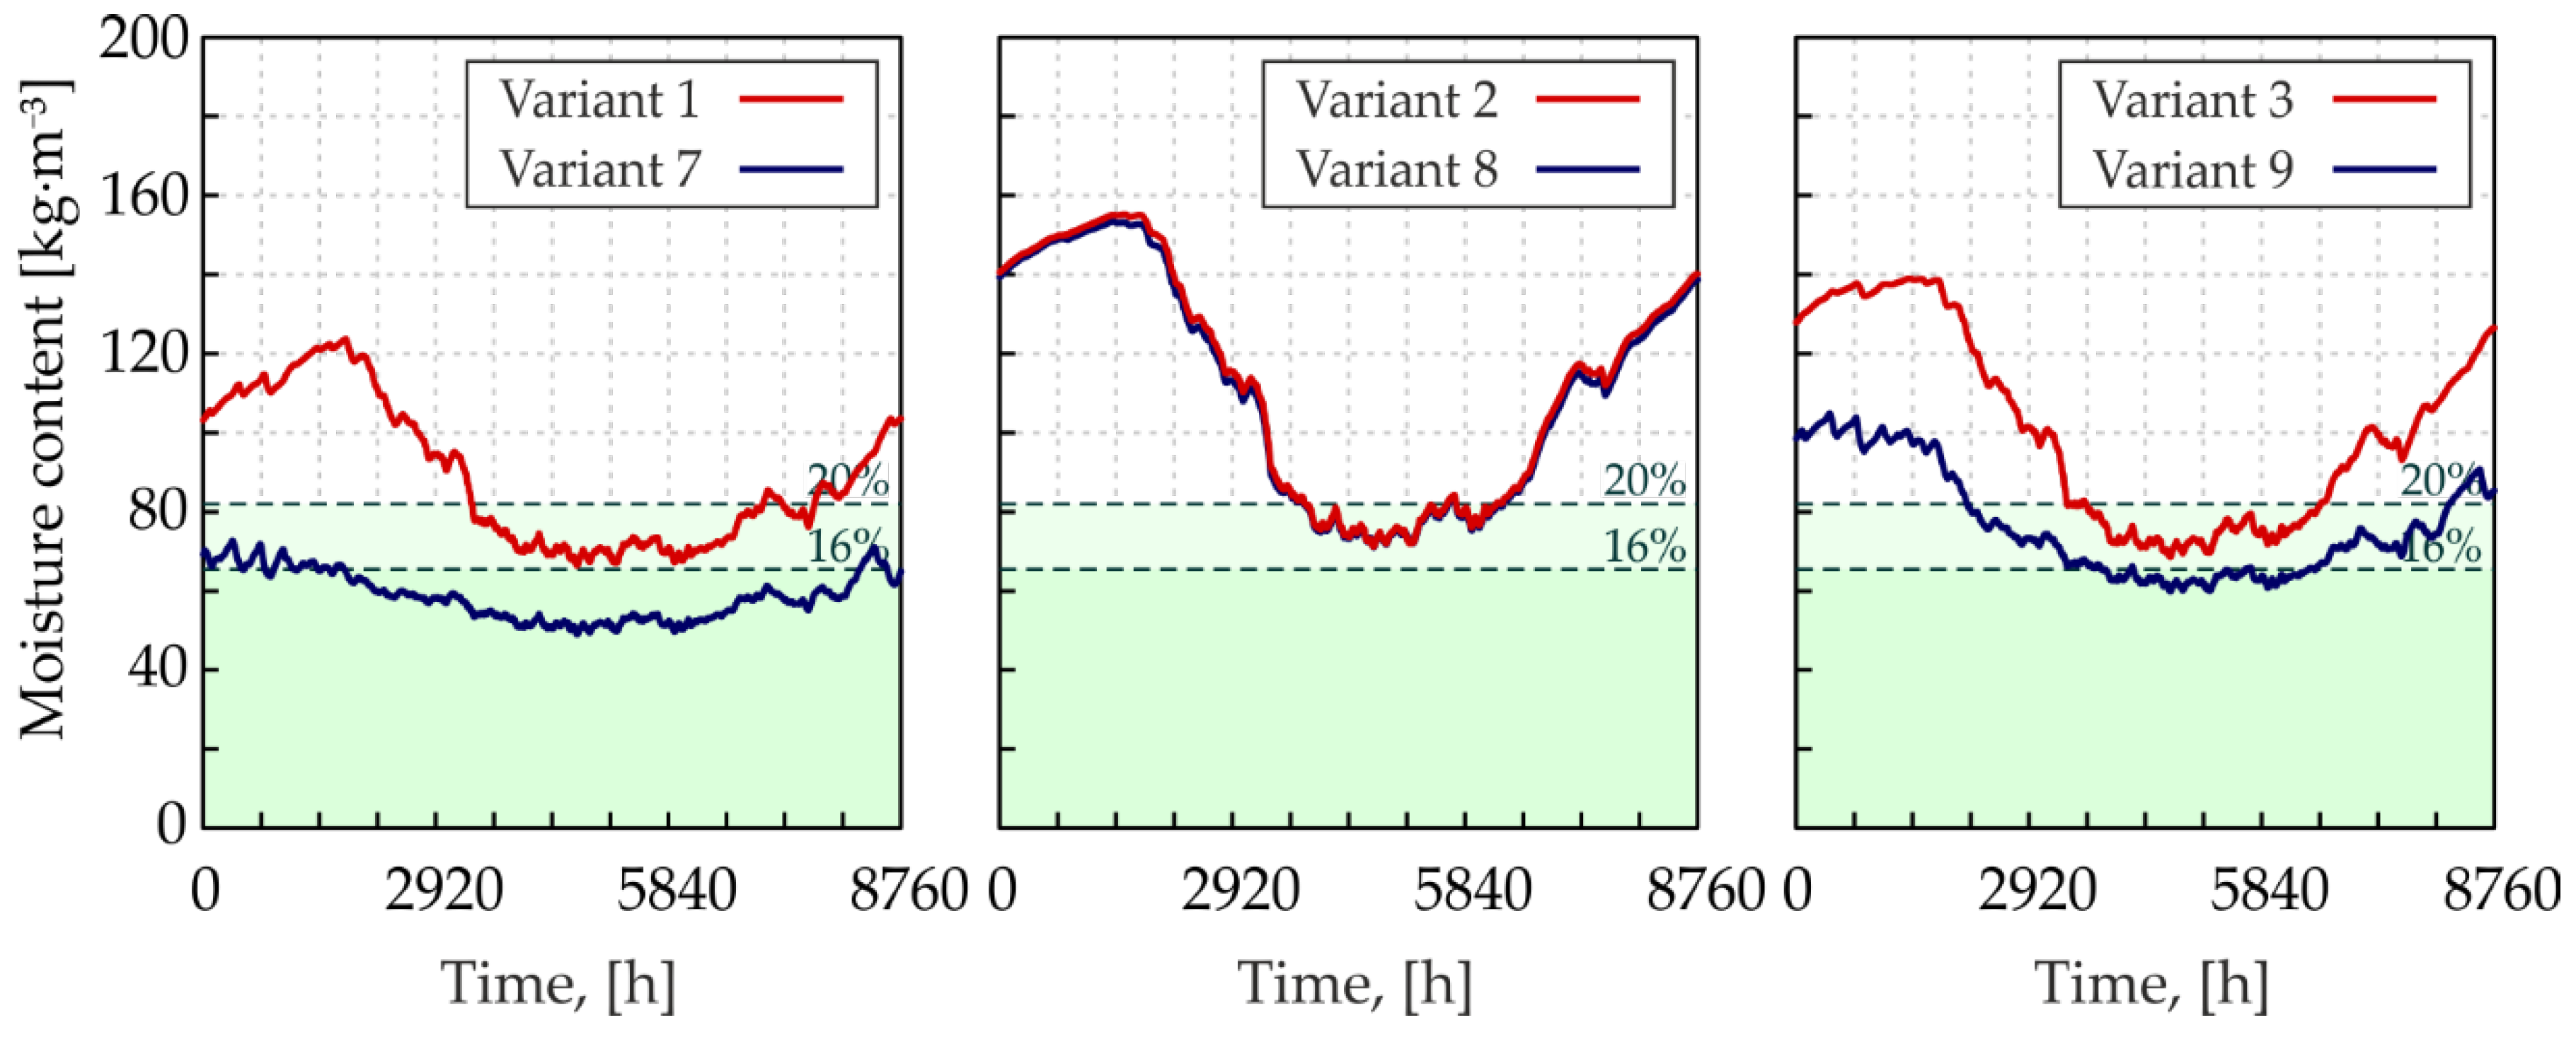
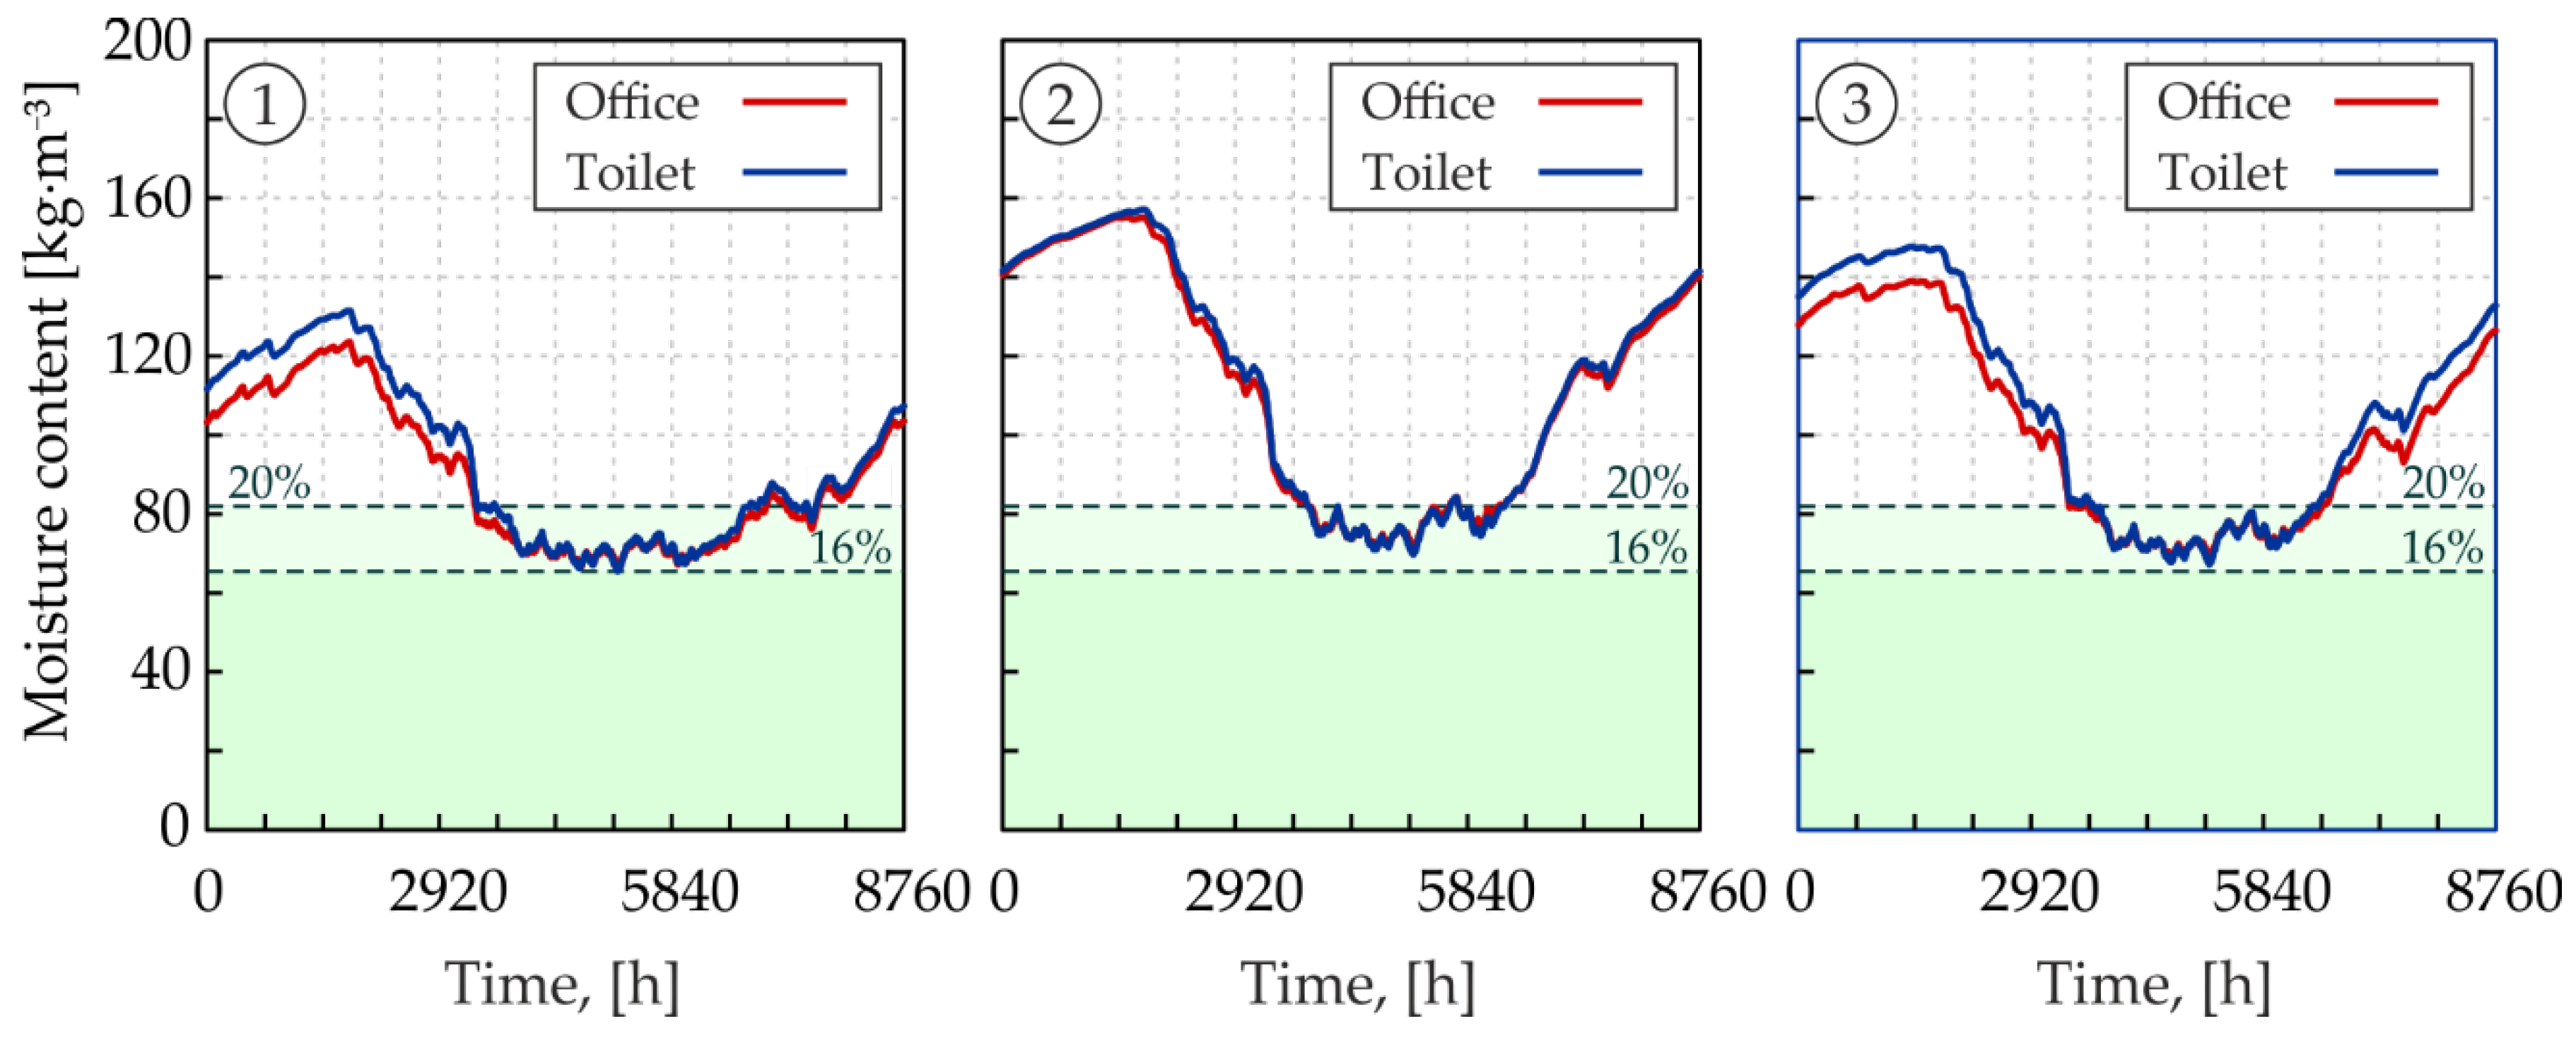
  • The construction of the partition, in which the upper CLT layer is closed between EPDM (from the side of the external environment) and typical PE vapour barrier from the inside (Sd = 200 m), is subject to periodically increased moisture content. Even in the climate of southern Europe, for the best variant, CMC exceedances were noted. The exceedances are within the scope 25.0–73.9% of the year. This results in a significantly profitable mould infestation—for all variants, the MI value shows that the predicted mould growth is at least 240 mm·year−1. The Sd = 200 m barrier does not completely protect against the ingress of moisture into the flat roof, and at the same time, effectively reduces drying out inside. Consequently, this solution is not recommended in any case of external climate or microclimate control;
  • In the case of the construction in which the upper CLT layer is closed between EPDM and SVR, exceedances of the CMC level are significantly lower than in the case of traditionally PE foil (the exceedances are within the scope 9.2–64.7% of the year);
  • The variants, in which no vapour barrier was used, show the lowest amount of moisture (there were no exceedances for the climates of Central and Southern Europe, and for the climates of Northern Europe, the exceedances are 53.7% of the year). Layer arrangement in these variants makes the partition open to diffusion, which allows it to dry freely to the inside. This is in line with the insulation contractors’ observations [73];
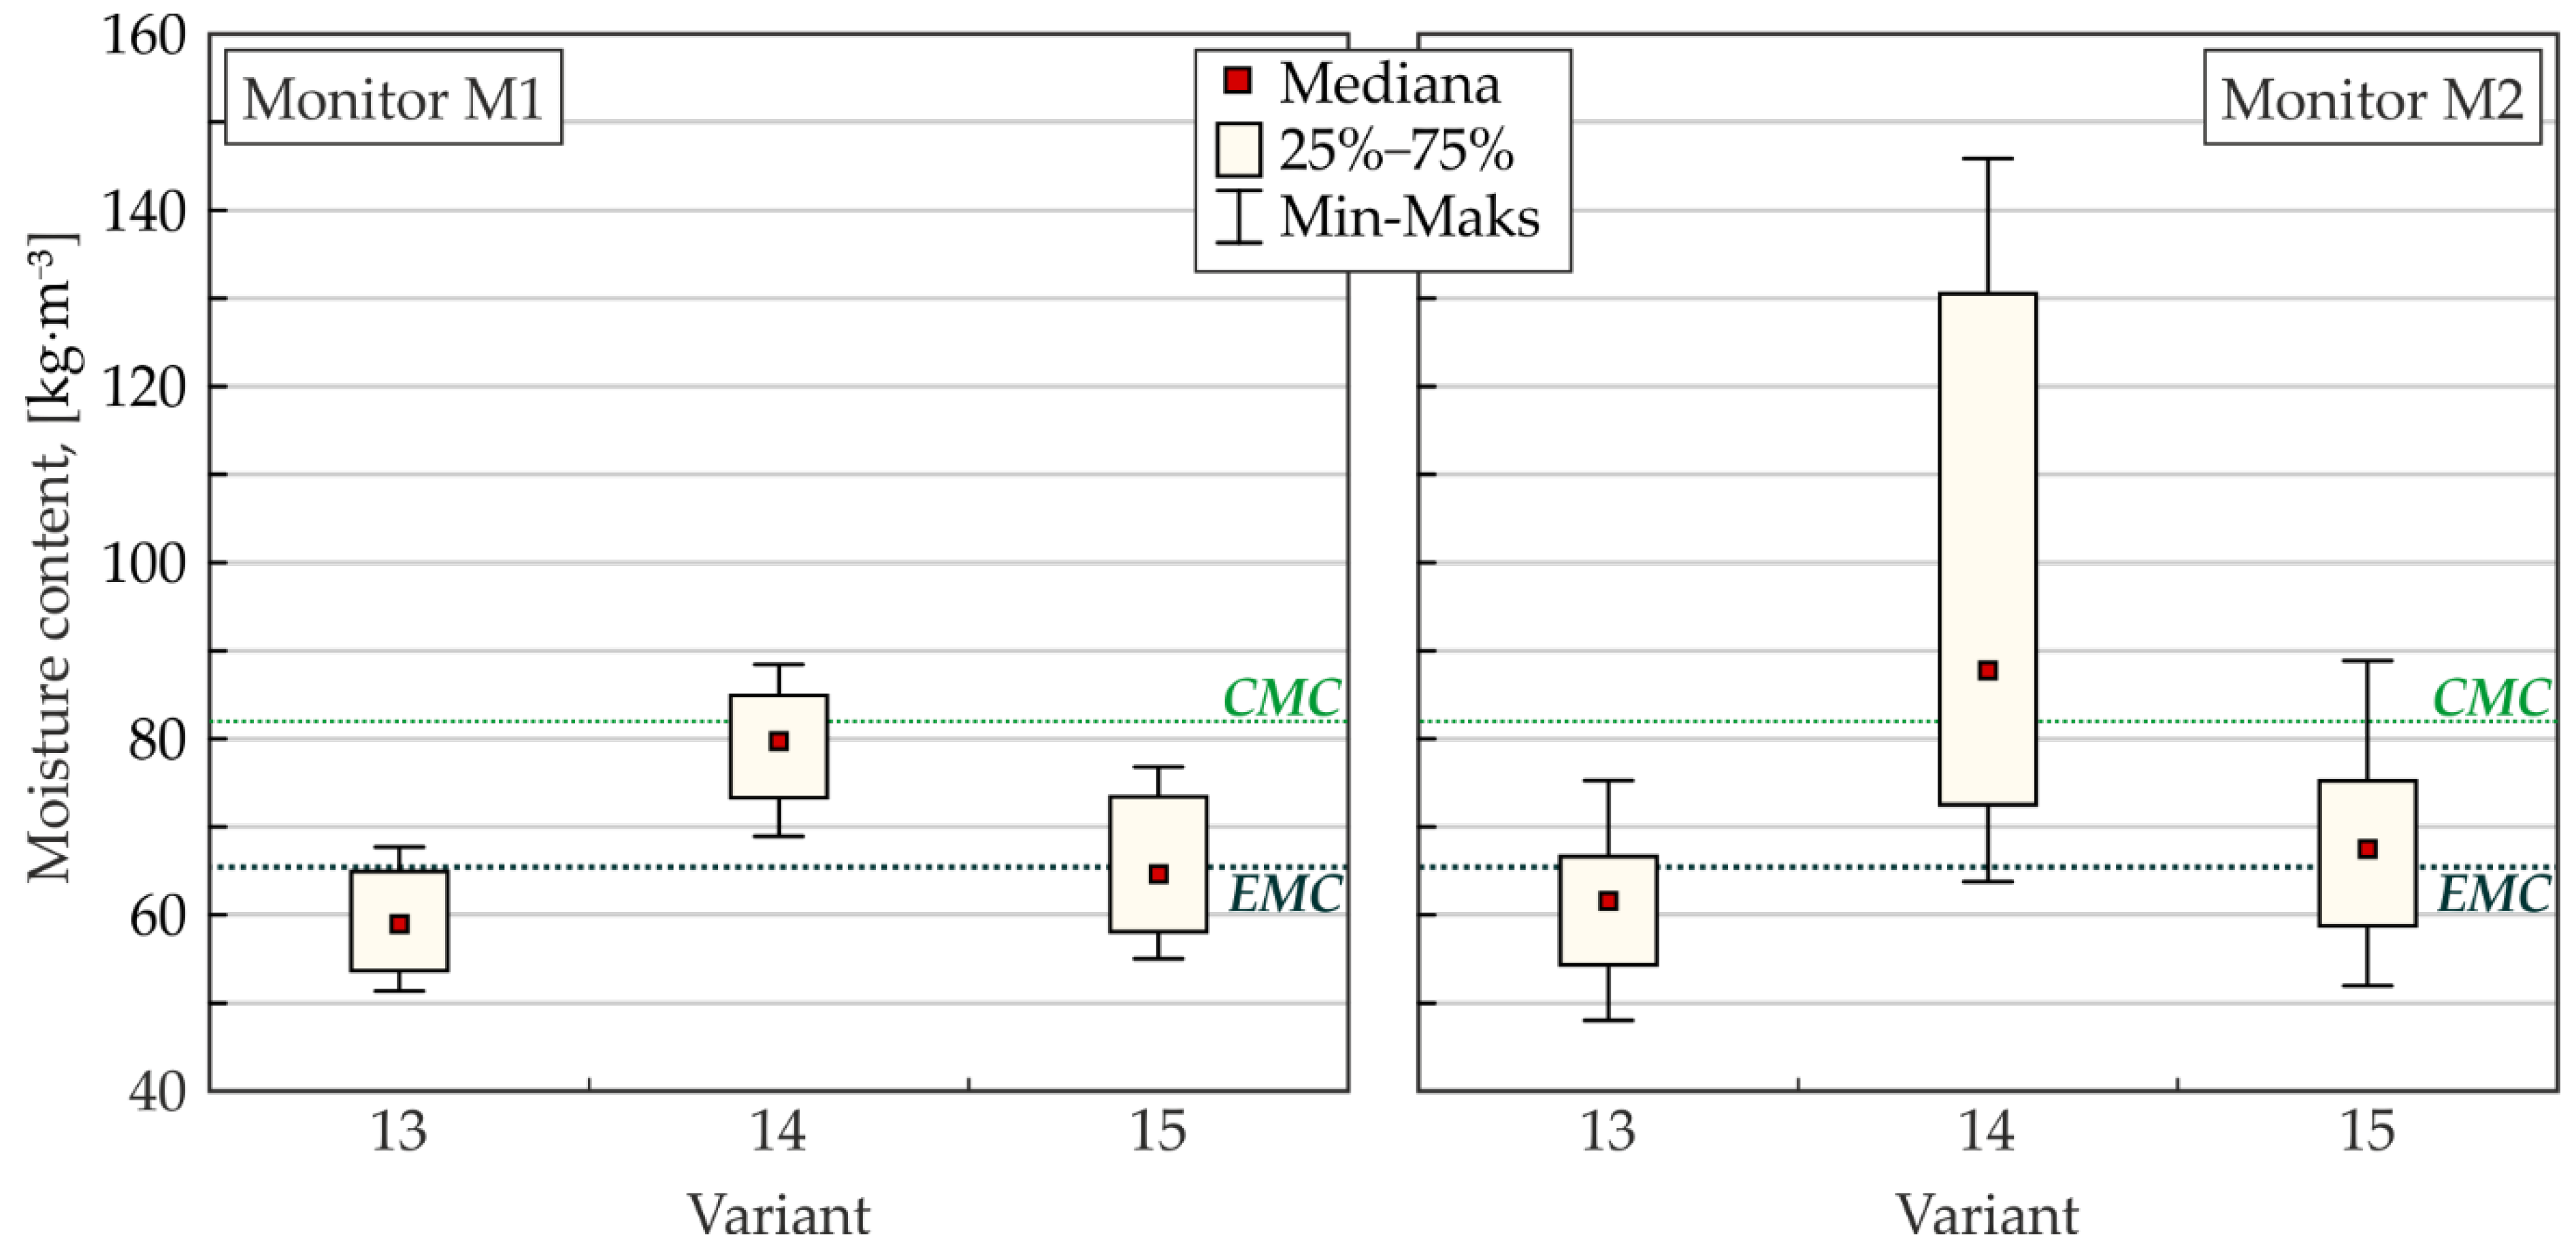
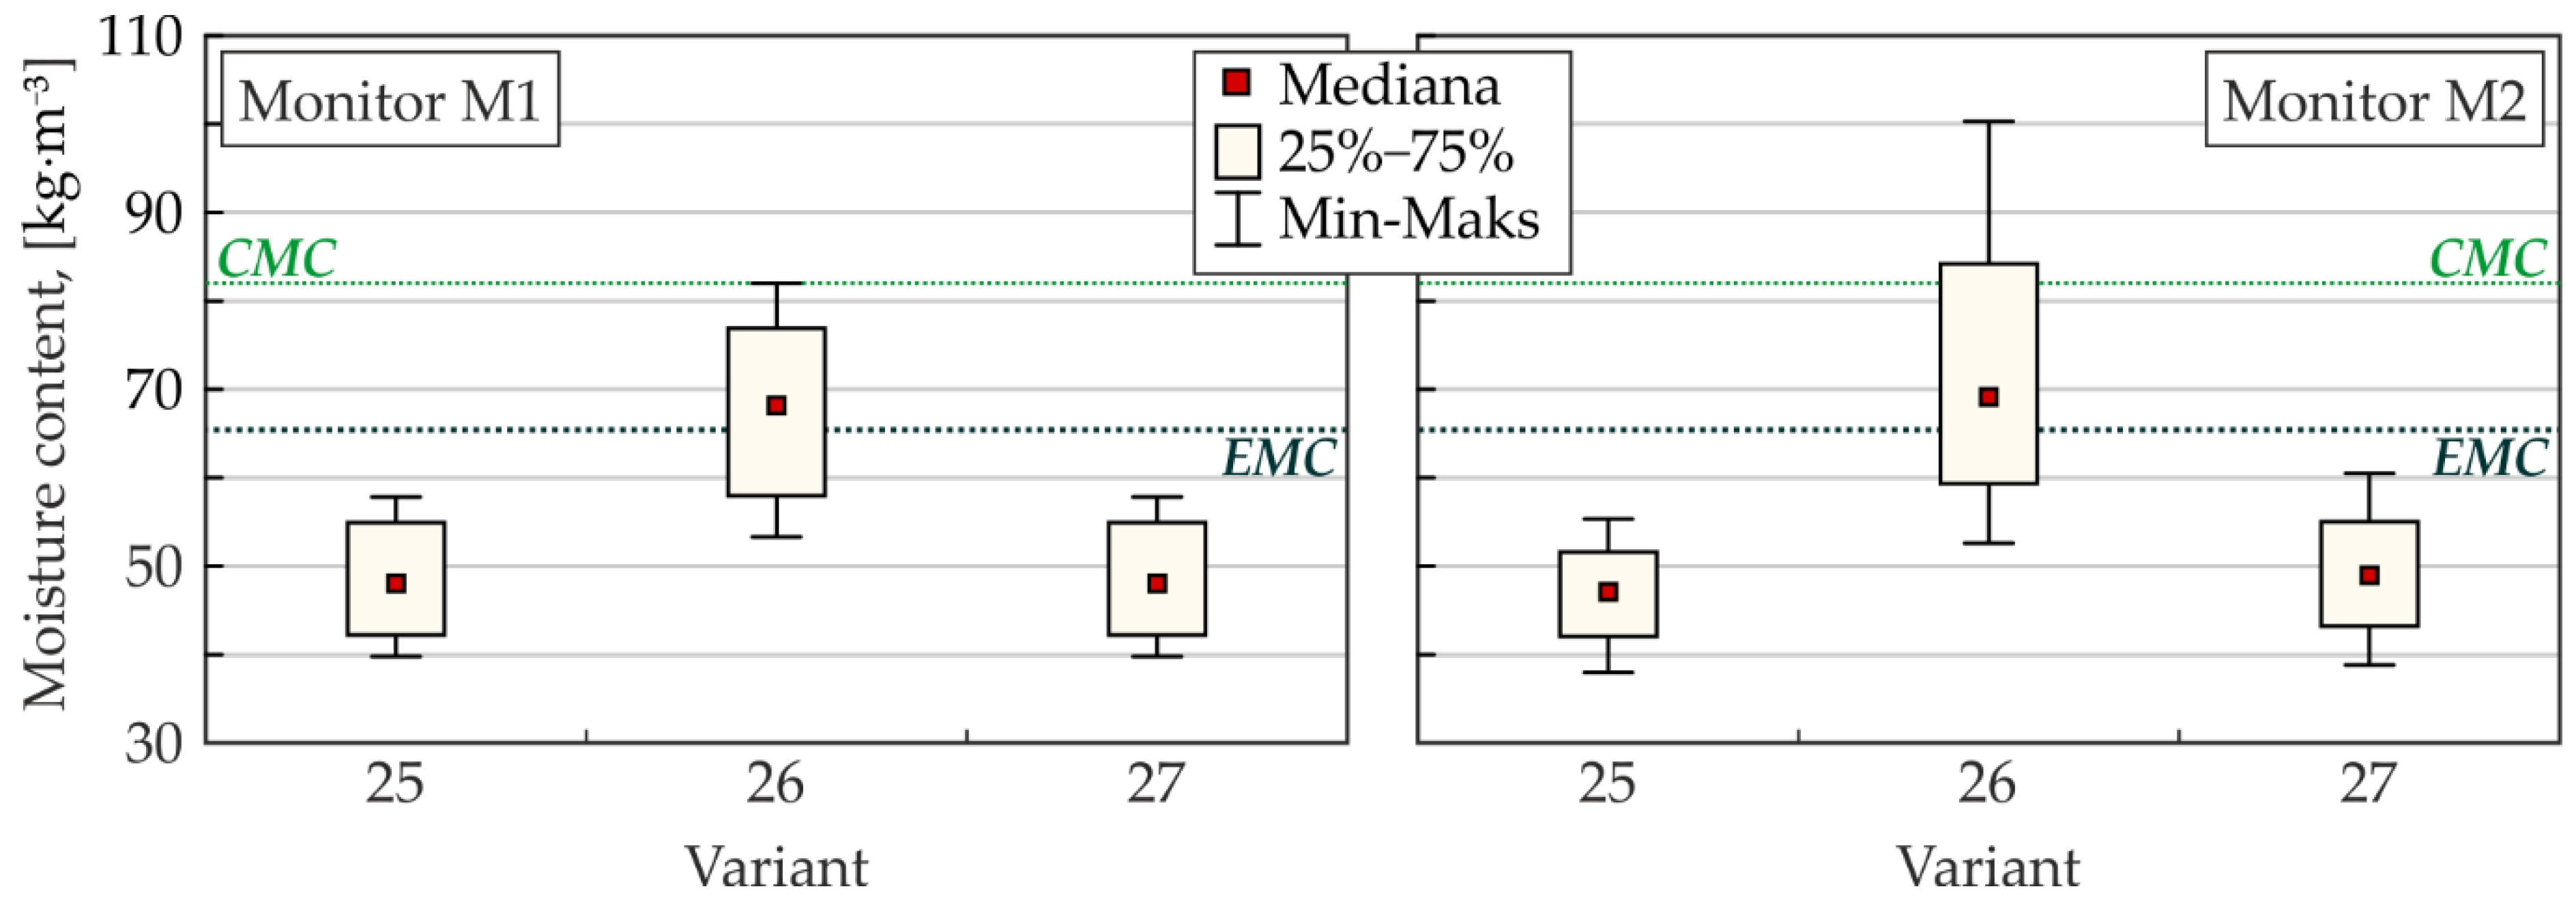
  • Adding extra thermal insulation (for moderate or cold climate) reduces the moisture content in the flat roof (the exceedances are within the scope 0.0–34.3% of the year). With an appropriate active microclimate control (keeping the RH of the inner air at the lowest level acceptable for comfort, that is with RHmax = 30%), it is possible to minimise the risk of moisture condensation in the CLT layer (the exceedances are within the scope 0.6–72.8% of the year). The combination of both solutions can eliminate the risk of moisture condensation in the CLT layer. In this case, small and short-term CMC exceedances do not increase the risk of mould contamination. Nevertheless, in colder climates, additional criteria or investigations are needed to assess acceptability.
As a general rule, these results correspond to the results obtained in the studies presented in [40,42,43,44], where the hygrothermal phenomena in various types of roofs were analysed.
The tested variants do not reflect the real phenomenon in the green roof. Due to the complicated processes concerning estimation of evapotranspiration, which depends not only on air temperature, water vapour pressure or soil moisture content but also on the type of soil itself and the type of vegetation (e.g., plant species and the density of their seedlings) [74,75], it is not recommended to simplify the model of the ground in software such as WUFI®plus.
The literature focuses mainly on purely thermal (insulating properties) calculations and analyses, while the moisture aspect is neglected. When designing buildings made of wood-based materials, bearing in mind their durability, it is also necessary to analyse the moisture content of a given partition in the conditions of a specific climate. The use of universal design solutions without appropriate analysis carries the risk of a significant reduction in the performance of the partition. Despite the high thermal insulation performance that meets the PHS, the inverted roofs under consideration do not ensure moisture safety in colder climates. For these climates, additional thermal insulation may be necessary. Some studies confirm that the energy benefit of a green roof, and therefore also inverted roofs, on a highly insulated building in a subarctic climate is low [76]. Therefore, it can be assumed that the tested solutions are not recommended in colder climates.
It is worth noting the precision in determining the method of microclimate control. The study analysed variants of climate control that affect periodic air quality. Calculations for cold and moderate climates, when only heating is used, show that (in winter) RH of inner air drops below 20%. This can cause discomfort or even medical problems to the occupants of the building [45]. Thus, the construction of the partition, which is most favourable from the point of view of partition safety, cannot be accepted in the case of human comfort. There are local humidifiers on the market today. Therefore, it should be taken into account that even if there is no central RH control, the users may humidify the air in the winter. Examples may be found in the literature that the building users do not always comply with the design assumptions [77]. An uncontrolled increase in RH may lead to CMC exceedances. It may be advisable to introduce full microclimate control and to carry out analyses/simulations (treating each building as a case study) to establish what maximum RH of inner air is acceptable.

Author Contributions

Conceptualisation, A.S.-S. and K.W.; Formal analysis, A.S.-S.; Investigation, A.S.-S. and K.W.; Supervision, A.S.-S.; Visualisation, A.S.-S. and K.W.; Writing—original draft, A.S.-S.; Writing—review and editing, A.S.-S. and K.W. All authors have read and agreed to the published version of the manuscript.

Funding

This research received no external funding.

Institutional Review Board Statement

Not applicable.

Informed Consent Statement

Not applicable.

Data Availability Statement

Not applicable.

Acknowledgments

The authors would like to thank Jan Radoń for his kind consultations and advice.

Conflicts of Interest

The authors declare no conflict of interest.

References

  1. Hildebrandt, J.; Hagemann, N.; Thrän, D. The contribution of wood-based construction materials for leveraging a low carbon building sector in Europe. Sustain. Cities Soc. 2017, 34, 405–418. [Google Scholar] [CrossRef]
  2. Padilla-Rivera, A.; Amor, B.; Blanchet, P. Evaluating the Link between Low Carbon Reductions Strategies and Its Performance in the Context of Climate Change: A Carbon Footprint of a Wood-Frame Residential Building in Quebec, Canada. Sustainability 2018, 10, 2715. [Google Scholar] [CrossRef] [Green Version]
  3. Salazar, J.; Meil, J. Prospects for carbon-neutral housing: The influence of greater wood use on the carbon footprint of a single-family residence. J. Clean. Prod. 2009, 17, 1563–1571. [Google Scholar] [CrossRef]
  4. Timber Frame Home Design-Is it Right for You? Available online: https://www.eco-home-essentials.co.uk/timber-frame-home-design.html (accessed on 3 November 2021).
  5. Wei, P.; Wang, B.J.; Li, H.; Wang, L.; Peng, S.; Zhang, V. A comparative study of compression behaviors of cross-laminated timber and glued-laminated timber columns. Constr. Build. Mater. 2019, 222, 86–95. [Google Scholar] [CrossRef]
  6. Hafnes, A.; Schäfer, S. Environmental aspects of material efficiency versus carbon storage in timber buildings. Eur. J. Wood Wood Prod. 2018, 76, 1045–1059. [Google Scholar] [CrossRef]
  7. Pedrosa González, A.; del Río Merino, M.; Fonseca Valero, C. Durability Analysis of PVC-P Membrane in Inverted Flat Roof. In Construction and Building Research; Springer: Dordrecht, The Netherlands, 2014. [Google Scholar] [CrossRef]
  8. Leimer, H.; Dreyer, J.; Fechner, O.; Künzel, H.; Rode, C.; Tejchmann-Konarzewski, J. Requirements of inverted roofs with a drainage layer. In Proceedings of the 7th Nordic Symposium on Building Physics, Reykjavik, Iceland, 13–15 June 2005; pp. 570–577. [Google Scholar]
  9. Espinosa-Fernández, A.; Echarri-Iribarren, V.; Sáez, C. Water-Covered Roof Versus Inverted Flat Roof on the Mediterranean Coast: A Comparative Study of Thermal and Energy Behavior. Appl. Sci. 2020, 10, 2288. [Google Scholar] [CrossRef] [Green Version]
  10. Francke, A.; Gerylo, R. Inverted roof insulation kits and their durability. MATEC Web Conf. 2018, 163, 08005. [Google Scholar] [CrossRef]
  11. Leslie, A.; Tariku, F.; Simpson, Y. Thermal and moisture properties of extruded polystyrene from inverted roofs: A pilot study. In Proceedings of the Thermal Performance of the Exterior Envelopes of Whole Buildings XIII International Conference, Clearwater, FL, USA, 4–8 December 2016. [Google Scholar]
  12. Zirkelbach, A.; Schafaczek, B.; Künzel, H. Thermal Performance Degradation of Foam Insulation in Inverted Roofs Due to Moisture Accumulation. In Proceedings of the International Conference of Building Materials and Components, Porto, Poltugal, 12–15 April 2011. [Google Scholar]
  13. Misar, I.; Novotný, M. Defects and behaviour of inverted flat roof from the point of building physics. MATEC Web Conf. 2017, 93, 02002. [Google Scholar] [CrossRef]
  14. He, Y.; Yu, H.; Ozaki, A.; Dong, N. Thermal and energy performance of green roof and cool roof: A comparison study in Shanghai area. J. Clean. Prod. 2020, 267, 122205. [Google Scholar] [CrossRef]
  15. Zhong, T.; Zhang, N.; Lv, M. A numerical study of the urban green roof and cool roof strategies’ effects on boundary layer meteorology and ozone air quality in a megacity. Atmos. Environ. 2021, 264, 118702. [Google Scholar] [CrossRef]
  16. Bevilacqua, P.; Bruno, R.; Arcuri, N. Green roofs ia a Mediterranean climate: Energy performances based on in-situ experimental data. Renew. Energy 2020, 152, 1414–1430. [Google Scholar] [CrossRef]
  17. Fioretti, R.; Palla, A.; Lanza, L.; Principi, P. Green roof energy and water related performance in the Mediterranean climate. Build. Environ. 2010, 45, 1890–1904. [Google Scholar] [CrossRef]
  18. Alcazar, S.S.; Olivieri, F.; Neila, J. Green roofs: Experimental and analytical study of its potential for urban microclimate regulation in Mediterranean-continental climates. Urban Clim. 2016, 17, 304–317. [Google Scholar] [CrossRef]
  19. Teotónio, I.; Silva, C.M.; Oliveira Cruz, C. Economics of green roofs and green walls: A literature review. Sustain. Cities Soc. 2021, 69, 102781. [Google Scholar] [CrossRef]
  20. Manso, M.; Teotónio, I.; Silva, C.M.; Cruz, C.O. Green roof and green wall benefits and costs: A review of the quantitative evidence. Renew. Sustain. Energy Rev. 2021, 135, 110111. [Google Scholar] [CrossRef]
  21. Jamei, E.; Chau, H.; Seyedmahmoudian, M.; Stojcevski, A. Review on the cooling potential of green roofs in different climates. Sci. Total Environ. 2021, 791, 148407. [Google Scholar] [CrossRef]
  22. Bomberg, M.; Brown, W. Building envelope and environmental control: Part 1-heat, air and moisture interactions. Constr. Can. 1993, 35, 15–18. [Google Scholar]
  23. Ronald, P. Relevant moisture properties of building construction materials. In Moisture Control in Buildings; Trechsel, H.R., Ed.; American Society for Testing and Material: Philadelphia, PA, USA, 1994. [Google Scholar]
  24. Morrel, J.J. Wood-based building components: What have we learned? Int. Biodeterior 2002, 49, 253–258. [Google Scholar] [CrossRef]
  25. Wang, J. Wetting and drying performance of wood-based assemblies related to on-site moisture management. In Proceedings of the World Conference on Timber Engineering (WCTE 2016), Vienna, Austria, 22–25 August 2016; pp. 5522–5531. [Google Scholar]
  26. Chang, S.J.; Wi, S.; Kang, S.G.; Kim, S. Moisture risk assessment of crosslaminated timber walls: Perspectives on climate conditions and water vapor resistance performance of building materials. Build. Environ. 2020, 168, 106502. [Google Scholar] [CrossRef]
  27. Schmidt, E.; Riggio, M.; Barbosa, R.; Mugabo, I. Environmental response of a CLT floor panel: Lessons for moisture management and monitoring of mass timber buildings. Build. Environ. 2019, 148, 609–622. [Google Scholar] [CrossRef]
  28. Schmidt, E.; Riggio, M. Monitoring Moisture Performance of Cross-Laminated Timber Building Elements during Construction. Buildings 2019, 9, 144. [Google Scholar] [CrossRef] [Green Version]
  29. Sadłowska-Sałęga, A.; Wąs, K. Risk of Moisture in Diffusionally Open Roofs with Cross-Laminated Timber for Northern Coastal Climates. Buildings 2020, 10, 10. [Google Scholar] [CrossRef] [Green Version]
  30. Alev, U.; Kalamees, T. Avoiding mould growth in an interiorly insulated log wall. Build. Environ. 2016, 105, 104–115. [Google Scholar] [CrossRef]
  31. Goto, Y.; Wakili, K.G.; Ostermeyer, Y.; Frank, T.; Ando, N.; Wallbaum, H. Preliminary investigation of a vapor-open envelope tailored for subtropical climate. Build. Environ. 2011, 46, 719–728. [Google Scholar] [CrossRef]
  32. Häglund, M. Moisture content penetration in wood elements under varying boundary conditions. Wood Sci. Technol. 2001, 41, 477–490. [Google Scholar] [CrossRef]
  33. Hameury, S. Moisture buffering capacity of heavy timber structures directly exposed to an indoor climate: A numerical study. Build. Environ. 2005, 40, 1400–1412. [Google Scholar] [CrossRef]
  34. Kalamees, T.; Vinha, J. Hygrothermal calculations and laboratory tests on timber-framed structures. Build. Environ. 2003, 38, 689–697. [Google Scholar] [CrossRef]
  35. McClung, R.; Ge, H.; Straube, J.; Wang, J. Hygrothermal performance of cross-laminated timber wall assemblies with built-in moisture: Fild measurments and simulation. Build. Environ. 2014, 71, 95–110. [Google Scholar] [CrossRef]
  36. Öberg, J.; Wiege, E. Moisture Risks with CLT-Panels Subjected to Outdoor Climate during Construction-Focus on Mould and Wetting Processes. Bachelor’s Thesis, KTH Royal Institute of Technology Stockholm, Stockholm, Sweden, June 2018. [Google Scholar]
  37. Setter, L.; Smoorenburg, E.; Wijesuriya, S.; Taberes-Velasco, P. Energy and hygrothermal performance of cross laminated timber single-family homes subjected to constant and variable electric rates. J. Build. Eng. 2019, 25, 100784. [Google Scholar] [CrossRef]
  38. Listiburek, J. Moisture control for buildings. ASHRAE J. 2002, 44, 36–41. [Google Scholar]
  39. Künzel, H.M. Humidity controlled vapour retarders reduce risk of moisture damages. In Proceedings of the 4th Symposium on Building Physics in the Nordic Countries, Espoo, Finland, 9–10 September 1996; pp. 447–454. [Google Scholar]
  40. Geving, S.; Holme, J. Vapour retarders in wood frame walls and their effect on the drying capability. Front. Archit. Res. 2013, 2, 42–49. [Google Scholar] [CrossRef] [Green Version]
  41. Fechner, H.; Meißner, F. Advanced modelling of vapor resistance of moisture dependent vapor retarder. Energy Procedia 2017, 132, 201–206. [Google Scholar] [CrossRef]
  42. Morelli, M.; Rasmussen, T.V.; Therkelsen, M. Exterior Wood-Frame Walls—Wind–Vapour Barrier Ratio in Denmark. Buildings 2021, 11, 428. [Google Scholar] [CrossRef]
  43. Latif, E.; Ciupala, M.A.; Tucker, S.; Wijeyesekera, D.C.; John Newporta, D.J. Hygrothermal performance of wood-hemp insulation in timber frame wall panels with and without a vapour barrier. Build. Environ. 2015, 92, 122–134. [Google Scholar] [CrossRef] [Green Version]
  44. Bunkholt, N.S.; Gullbrekken, L.; Geving, S.; Tore Kvande, T. Compact wooden roofs with smart vapour barrier–Pilot project experiences. E3S Web Conf. 2020, 172, 07010. [Google Scholar] [CrossRef]
  45. Wargocki, P. Improving Indoor Air Quality Improves the Performance of Office Work and School Work; Energy Systems Laboratory: Bryan, TX, USA, 2008. [Google Scholar]
  46. Wargocki, P.; Wyon, D. Ten questions concerning thermal and indoor air quality effects on the performance of office work and schoolwork. Build. Environ. 2017, 112, 359–366. [Google Scholar] [CrossRef] [Green Version]
  47. Mannan, M.; Al-Ghamdi, S.G. Indoor Air Quality in Buildings: A Comprehensive Review on the Factors Influencing Air Pollution in Residential and Commercial Structure. Int. J. Environ. Res. Public Health 2021, 18, 3276. [Google Scholar] [CrossRef] [PubMed]
  48. Kubba, S. Handbook of Green Building Design and Construction. Chapter Seven–Indoor Environmental Quality, 2nd ed.; Butterworth-Heinemann: Oxford, UK, 2017; pp. 353–412. [Google Scholar] [CrossRef]
  49. Ventilation for Indoor Air Quality ASHRAE Standard 62-1989; American Society of Heating, Refrigerating and Air-conditioning Engineers: Peachtree Corners, GA, USA, 1989.
  50. Persily, A. What we Think we Know about Ventilation. Int. J. Vent. 2006, 5, 275–290. [Google Scholar] [CrossRef]
  51. EN 15251:2007. Indoor Environmental Input Parameters for Design and Assessment of Energy Performance of Buildings Addressing Indoor Air Quality, Thermal Environment, Lighting and Acoustics; European Committee for Standardization: Brussels, Belgium, 2007. [Google Scholar]
  52. EN 16798-1:2019. Energy Performance of Buildings. Ventilation for Buildings. Indoor Environmental Input Parameters for Design and Assessment of Energy Performance of Buildings Addressing Indoor Air Quality, Thermal Environment, Lighting and Acoustics; European Committee for Standardization: Brussels, Belgium, 2019. [Google Scholar]
  53. Thermal Environmental Conditions for Human Occupancy ASHRAE Standard 55; American Society of Heating, Refrigerating and Air-conditioning Engineers: Peachtree Corners, GA, USA, 2004.
  54. ISO 7730:2005. Ergonomics of the Thermal Environment—Analytical Determination and Interpretation of Thermal Comfort Using Calculation of the PMV and PPD Indices and Local Thermal Comfort Criteria; International Organization for Standardization: Geneva, Switzerland, 2005. [Google Scholar]
  55. Cascone, S.; Coma, J.; Gagliano, A.; Pérez, G. The evapotranspiration process in green foofs: A review. Build. Environ. 2019, 147, 337–355. [Google Scholar] [CrossRef]
  56. Brandner, R.; Flatscher, G.; Ringhofer, A.; Schickhof, G.; Thiel, A. Cross laminated timber (CLT): Overview and development. Eur. J. Wood Wood Prod. 2016, 74, 331–351. [Google Scholar] [CrossRef]
  57. Passive House Institute (PHI). Available online: https://passivehouse.com (accessed on 19 September 2021).
  58. How Much Office Space Do I Need? Available online: https://www.commercialrealestate.com.au/advice/how-much-office-space-do-i-need-57459/ (accessed on 3 November 2021).
  59. Antosiewicz, B.; Koczyk, H. Wpływ wentylacji higrosterowalnej na obniżenie zużycia energii wielorodzinnych budynków mieszkalnych (ang. Influence of humidity-controlled ventilation on the reduction of energy consumption in multi-family residential buildings). Fiz. Budowli W Teor. I Prakt. 2007, T-2, 7–10. [Google Scholar]
  60. EN 16798-3:2017. Energy Performance of Buildings. Ventilation for Buildings. Part 3: For Non-Residential Buildings. Performance Requirements for Ventilation and Room-Conditioning Systems; European Committee for Standardization: Brussels, Belgium, 2017. [Google Scholar]
  61. Gülzow, A.; Richter, K.; Steiger, R. Influence of wood moisture content on bending and shear stiffness of cross laminated timber panels. Eur. J. Wood Wood Prod. 2011, 69, 193–197. [Google Scholar] [CrossRef] [Green Version]
  62. Acceptable Moisture Levels in Wood–Knowing the Moisture Content. Available online: https://www.wagnermeters.com/moisture-meters/wood-info/acceptable-moisture-levels-wood/ (accessed on 19 September 2021).
  63. Moisture Properties of Wood. Available online: https://www.woodproducts.fi/content/moisture-properties-wood (accessed on 19 September 2021).
  64. EN 14298:2017. Sawn Timber. Assessment of Drying Quality; European Committee for Standardization: Brussels, Belgium, 2017. [Google Scholar]
  65. Viitanen, H.; Ritschkoff, A.C. Mould Growth in Pine and Spruce Sapwood in Relation to Air Humidity and Temperature; Swedish University of Agricultural Sciences: Uppsal, Swedish, 1991. [Google Scholar]
  66. Cartwright, S.G.; Findlay, W.P.K. Decay of Timber and Its Prevention; H.M. Stationery Office: London, UK, 1969. [Google Scholar]
  67. Sedlbauer, K. Prediction of Mould Fungus Formation on the Surface of and Inside Building Components. Ph.D. Thesis, Universität Stuttgart, Stuttgart, Germany, 2001. [Google Scholar]
  68. Sedlbauer, K.; Krus, M.; Breuer, K. Mould Growth Prediction with a New Biohygrothermal Method and its Application in Practice Materials. In Proceedings of the IX Polska Konferencja Naukowo-Techniczna Fizyka Budowli w Teorii i Praktyce, Lodz, Poland, 10–13 June 2003; Available online: https://docplayer.net/92192580-Mould-growth-prediction-with-a-new-biohygrothermal-method-and-its-application-in-practice.html (accessed on 28 September 2021).
  69. Vereecken, E.; Vanoirbeek, K.; Roels, S. A Preliminary Evaluation of Mould Prediction Models Based on Laboratory Experiments. Energy Procedia 2015, 78, 1407–1412. [Google Scholar] [CrossRef] [Green Version]
  70. EN 12831-1:2017. Energy Performance of Buildings-Method for Calculation of the Design Heat Load-Part 1: Space Heatings Load, Module M3-3; European Committee for Standardization: Brussels, Belgium, 2017. [Google Scholar]
  71. Coelho, G.; Silva, H.E.; Henriques, F. Calibrated hygrothermal simulation models for historical buildings. Build. Environ. 2018, 142, 439–450. [Google Scholar] [CrossRef]
  72. Sadłowska-Sałęga, A.; Radoń, J. Feasibility and limitation of calculative determination of hygrothermal conditions in historical buildings: Case study of st. Martin church in Wiśniowa. Build. Environ. 2020, 186, 107361. [Google Scholar] [CrossRef]
  73. Smart Vapor Retarders. Available online: https://www.greenbuildingadvisor.com/article/smart-vapor-retarders (accessed on 28 September 2021).
  74. Sailor, D.J. A green roof for building energy simulation programs. Energy Build. 2008, 40, 1466–1478. [Google Scholar] [CrossRef]
  75. Vilar, M.L.; Tello, L.; Hidalgo, A.; Bedoya, C. An energy balance model of heterogeneous extensive green roofs. Build. Environ 2021, 250, 111265. [Google Scholar] [CrossRef]
  76. Schade, J.; Lidelöw, S.; Lönnqvist, J. The thermal performance of a green roof on a highly insulated building in a sub-arctic climate. Energy Build. 2021, 241, 110961. [Google Scholar] [CrossRef]
  77. Wąs, K.; Radoń, J.; Sadłowska-Sałęga, A. Maintenance of Passive House Standard in the light of long-term study on energy use in a prefabricated lightweight passive house in Central Europe. Energies 2020, 13, 2801. [Google Scholar] [CrossRef]
Figure 1. Simplified plan of the building (a) as well as building models in the SketchUp (b) and WUFI®plus (c).
Energies 14 07898 g001
Figure 2. Roof structure variants (description in the text).
Energies 14 07898 g002
Figure 3. Median, extremes and percentiles (25% and 75%) for outdoor air temperature (a) and relative humidity (b) for assumed climates.
Energies 14 07898 g003
Figure 4. Statistical sun radiation sum (a) and driving rain sum (b) for the climate of Northern Europe, Centrale Europe and Southern Europe.
Energies 14 07898 g004
Figure 5. Moisture content variability (for individual monitors) for Northern Europe with full microclimate control and the exchange rate of 3.9 h−1.
Energies 14 07898 g005
Figure 6. Moisture content variability (for individual monitors) for Central Europe with full microclimate control and the exchange rate of 3.9 h−1.
Energies 14 07898 g006
Figure 7. Moisture content variability of the (for individual monitors) for Southern Europe with full microclimate control and the exchange rate of 3.9 h−1.
Energies 14 07898 g007
Figure 8. Variability of the moisture content (for M1 and M2) for Northern Europe with full microclimate control and the ACH of 3.9 h−1 without insulation (variant 1) with Sd = 200 m foil (variant 2) and with SVR (variant 3).
Energies 14 07898 g008
Figure 9. Moisture content for the M2 monitor for variants 1–3 (ACH = 3.9 h−1, full microclimate control) and for variants 7–9 (ACH = 3.9 h−1, only heating).
Energies 14 07898 g009
Figure 10. Moisture content for the M2 monitor for variants 1–3 and for office and toilet.
Energies 14 07898 g010
Figure 11. Variability of moisture content (for M1 and M2) for Central Europe with full microclimate control and the ACH of 3.9 h−1 without insulation (variant 13) with Sd = 200 m foil (variant 14) and with SVR (variant 15).
Energies 14 07898 g011
Figure 12. Variability of moisture content (for M1 and M2) for Southern Europe with full microclimate control and the ACH of 3.9 h−1 without insulation (variant 25) with Sd = 200 m foil (variant 26) and with SVR (variant 27).
Energies 14 07898 g012
Figure 13. Moisture content for the M2 monitor for variants 1–3 with and without additional insulation (10 cm).
Energies 14 07898 g013
Figure 14. Relative humidity of inner air (January–March) for climate of Northern Europe with different ACH and with different efficiency of moisture recovery.
Energies 14 07898 g014
Figure 15. Moisture content for the M2 monitor for variants 1–3 with air humidification in winter, with and without additional insulation (10 cm).
Energies 14 07898 g015
Table 1. Variants of calculation.
VariantExternal ClimateMicroclimate ControlWater Vapour BarrierACH
[h−1]
Northern Europe (A)Central Europe (B)Southern Europe (C)TRHNonVapour Retarder (Sd = 200 m)Smart
Vapour
Retarder
3.92.7
1X XXX X
2X XX X X
3X XX XX
4X XXX X
5X XX X X
6X XX X X
7X X X X
8X X X X
9X X XX
10X X X X
11X X X X
12X X X X
13 X XXX X
14 X XX X X
15 X XX XX
16 X XXX X
17 X XX X X
18 X XX X X
19 X X X X
20 X X X X
21 X X XX
22 X X X X
23 X X X X
24 X X X X
25 XXXX X
26 XXX X X
27 XXX XX
28 XXXX X
29 XXX X X
30 XXX X X
31 XX X X
32 XX X X
33 XX XX
34 XX X X
35 XX X X
36 XX X X
Publisher’s Note: MDPI stays neutral with regard to jurisdictional claims in published maps and institutional affiliations.

