
Financial Balance Analysis of Geothermal Companies in Poland Based on Managerial Cash Flows


Abstract
:1. Introduction
- a just transition, providing new development opportunities for the most affected regions in connection with a low-carbon energy transition;
- a zero-carbon energy system, based on the deployment of nuclear and offshore wind energy and increasing the role of distributed and civic energy;
- good air quality.
2. A Conceptual Framework: State of the Use of Geothermal Energy in the World and in Poland
3. Materials and Methods
4. Results
5. Discussion
5.1. Economic Limitations on Geothermal Energy Use
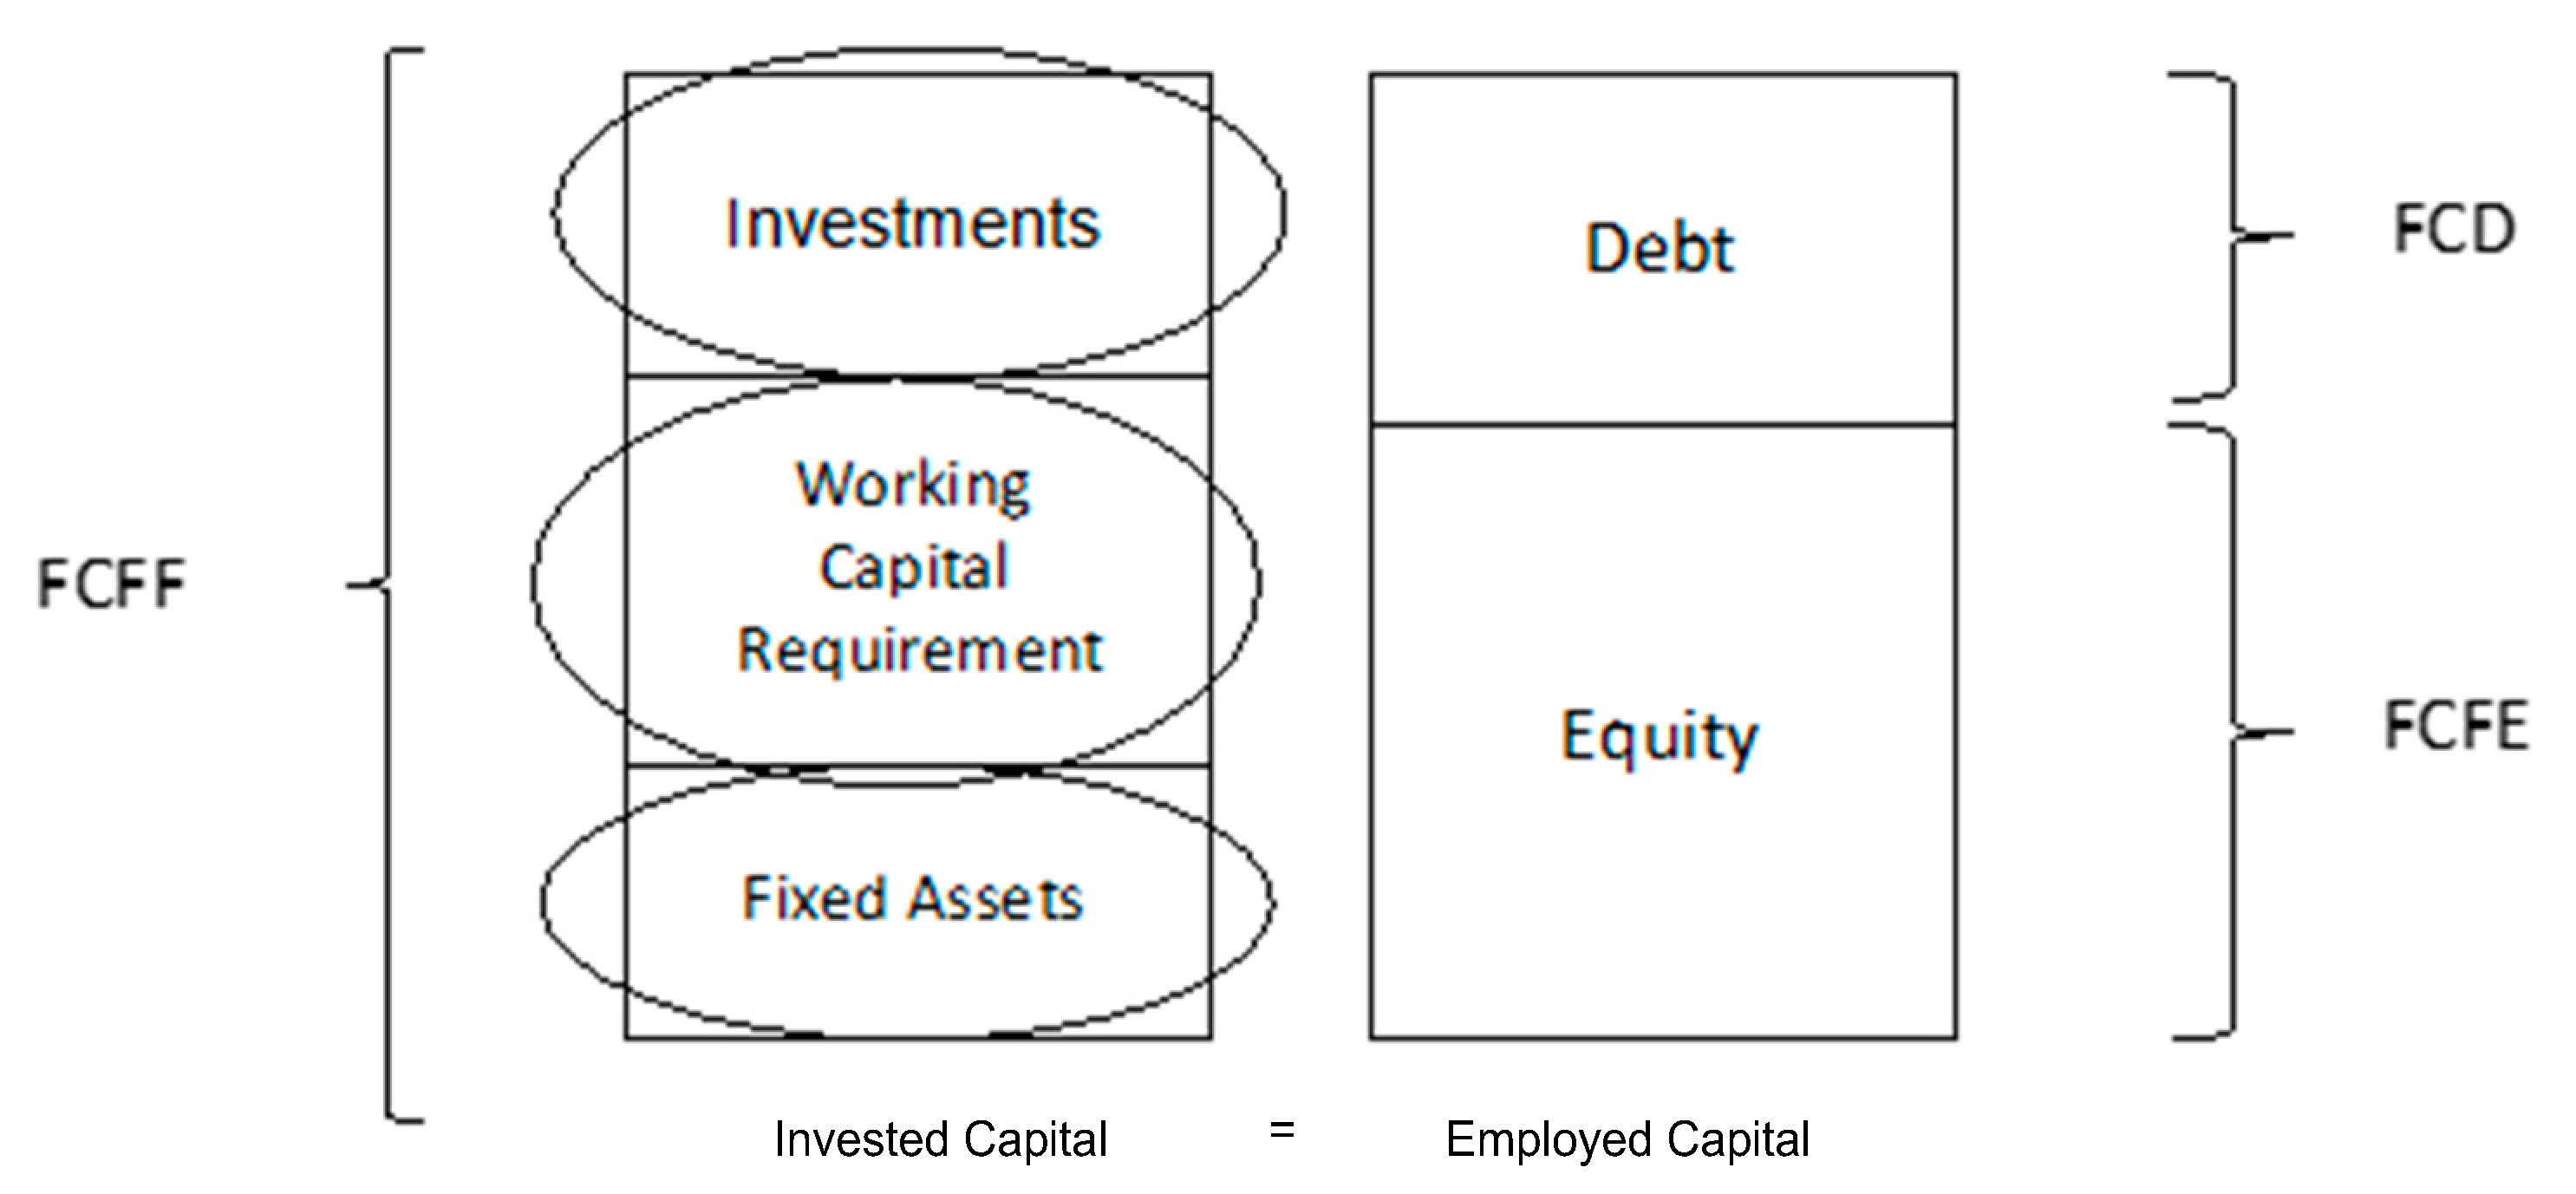
5.2. Comparative Analysis in the Context of the FCFF Model in the Example of Geothermal Enterprises in Poland
- -
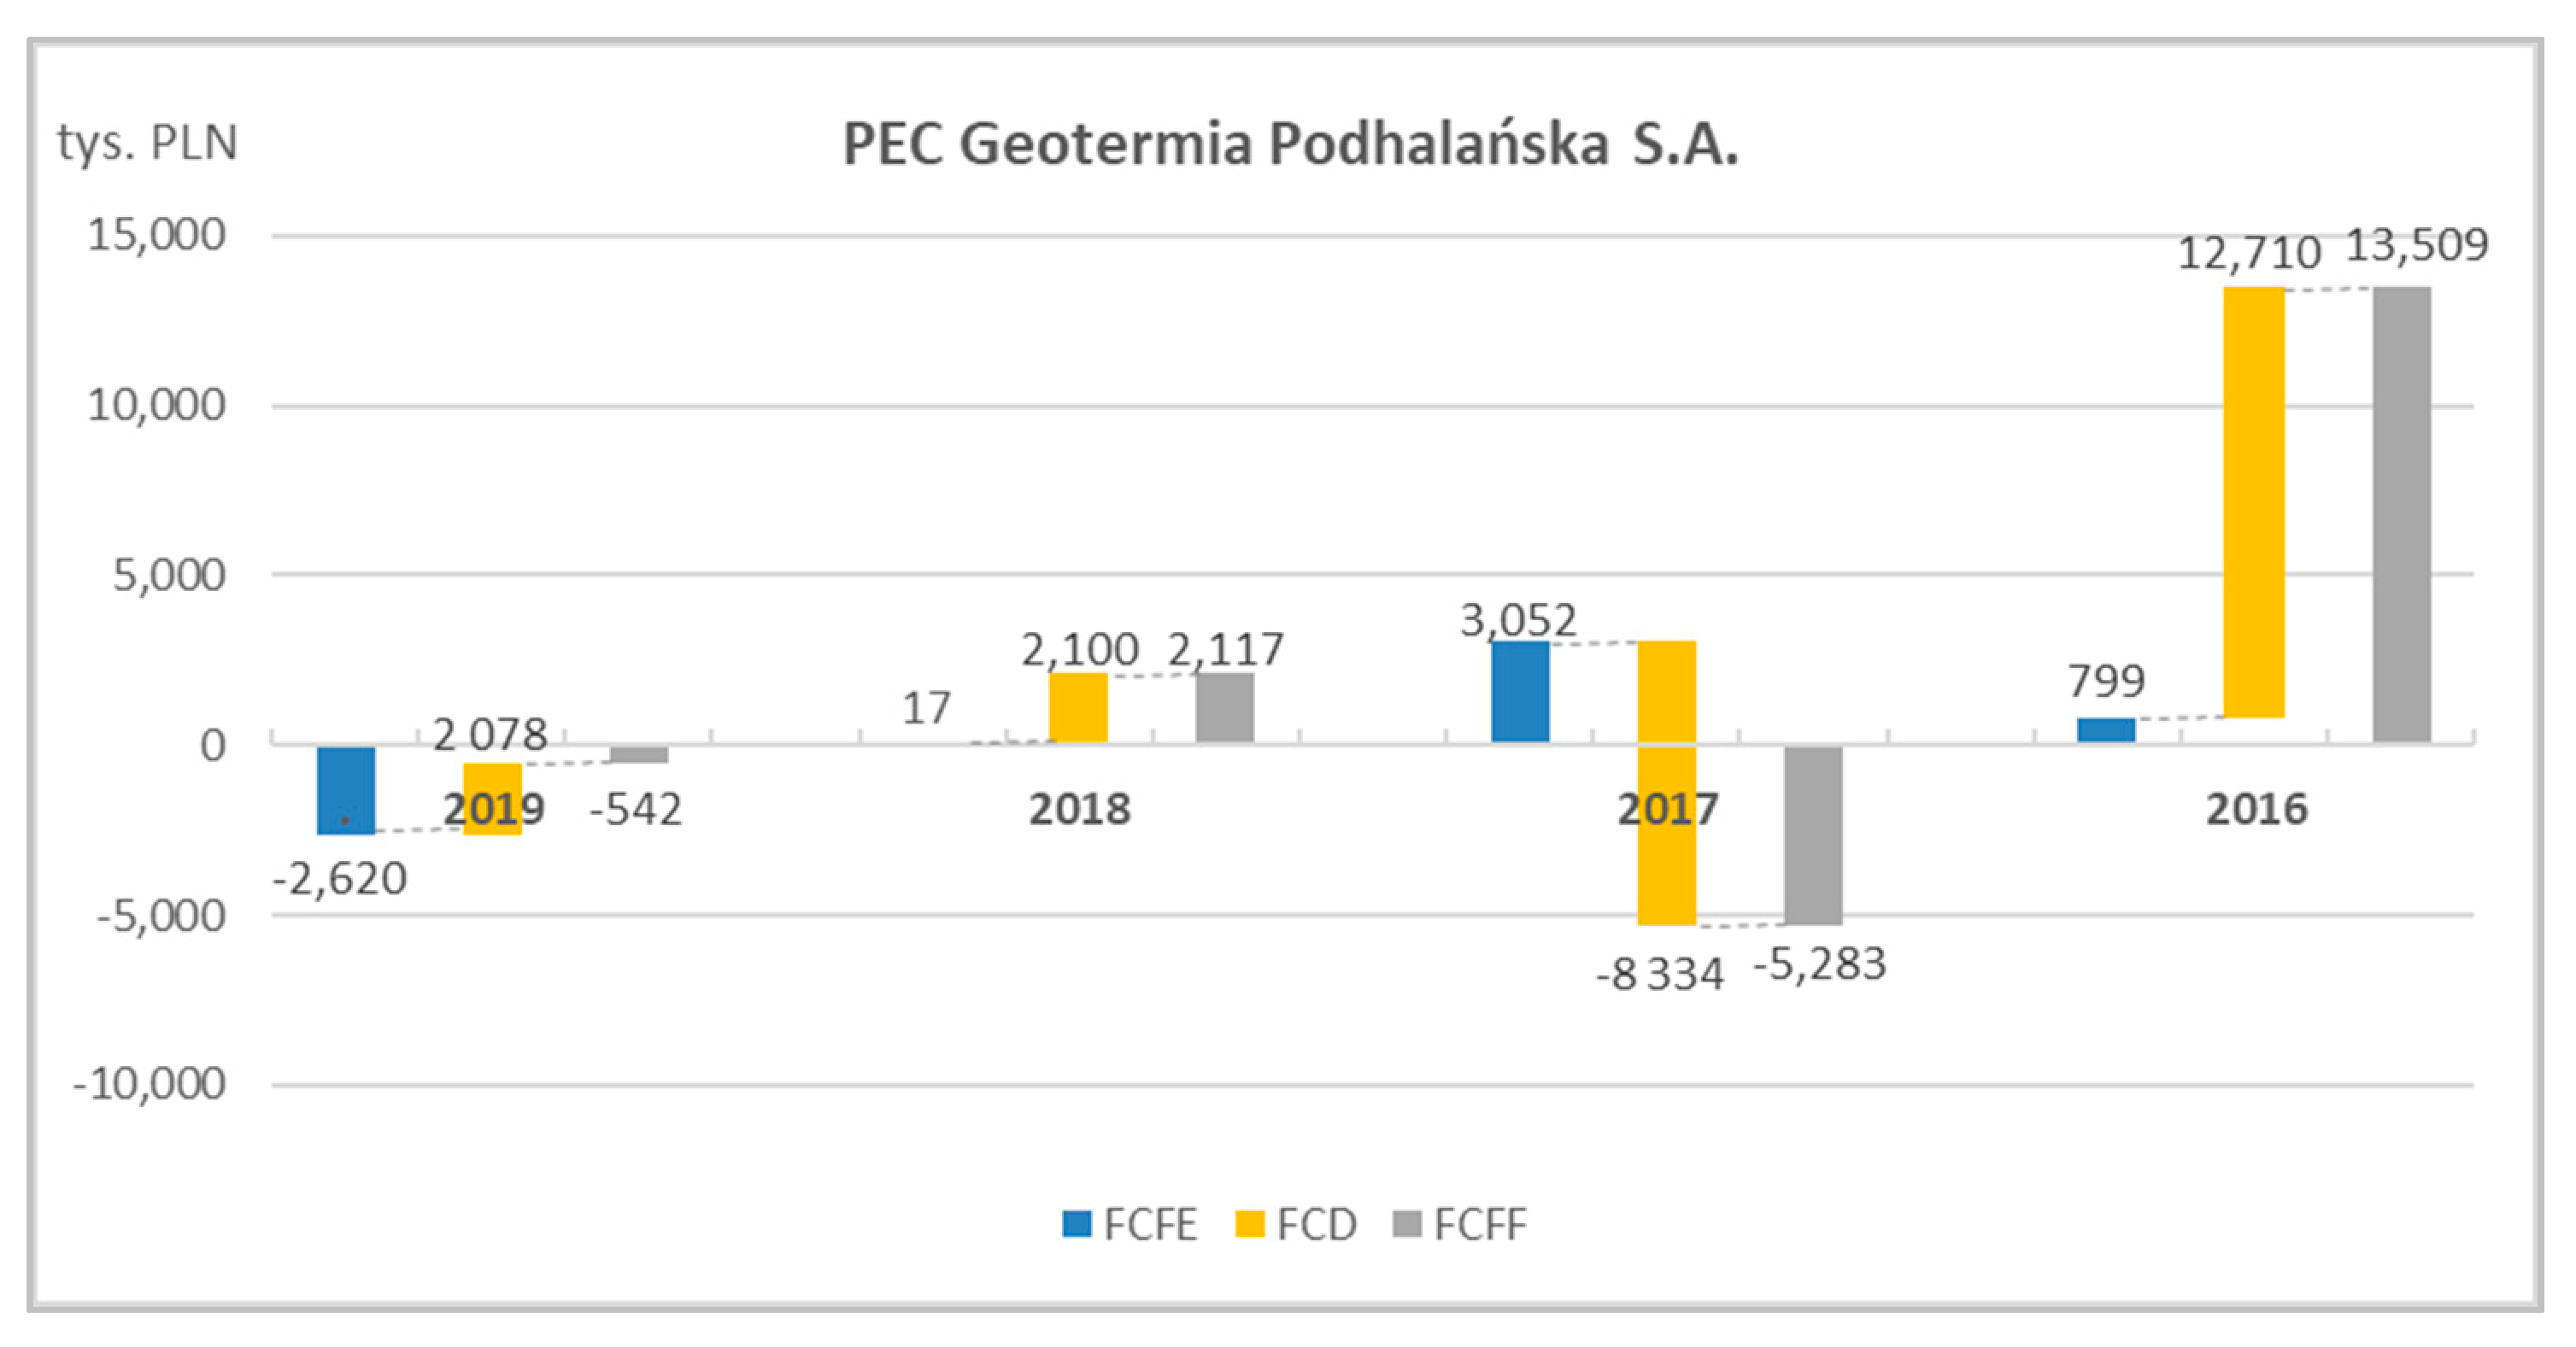
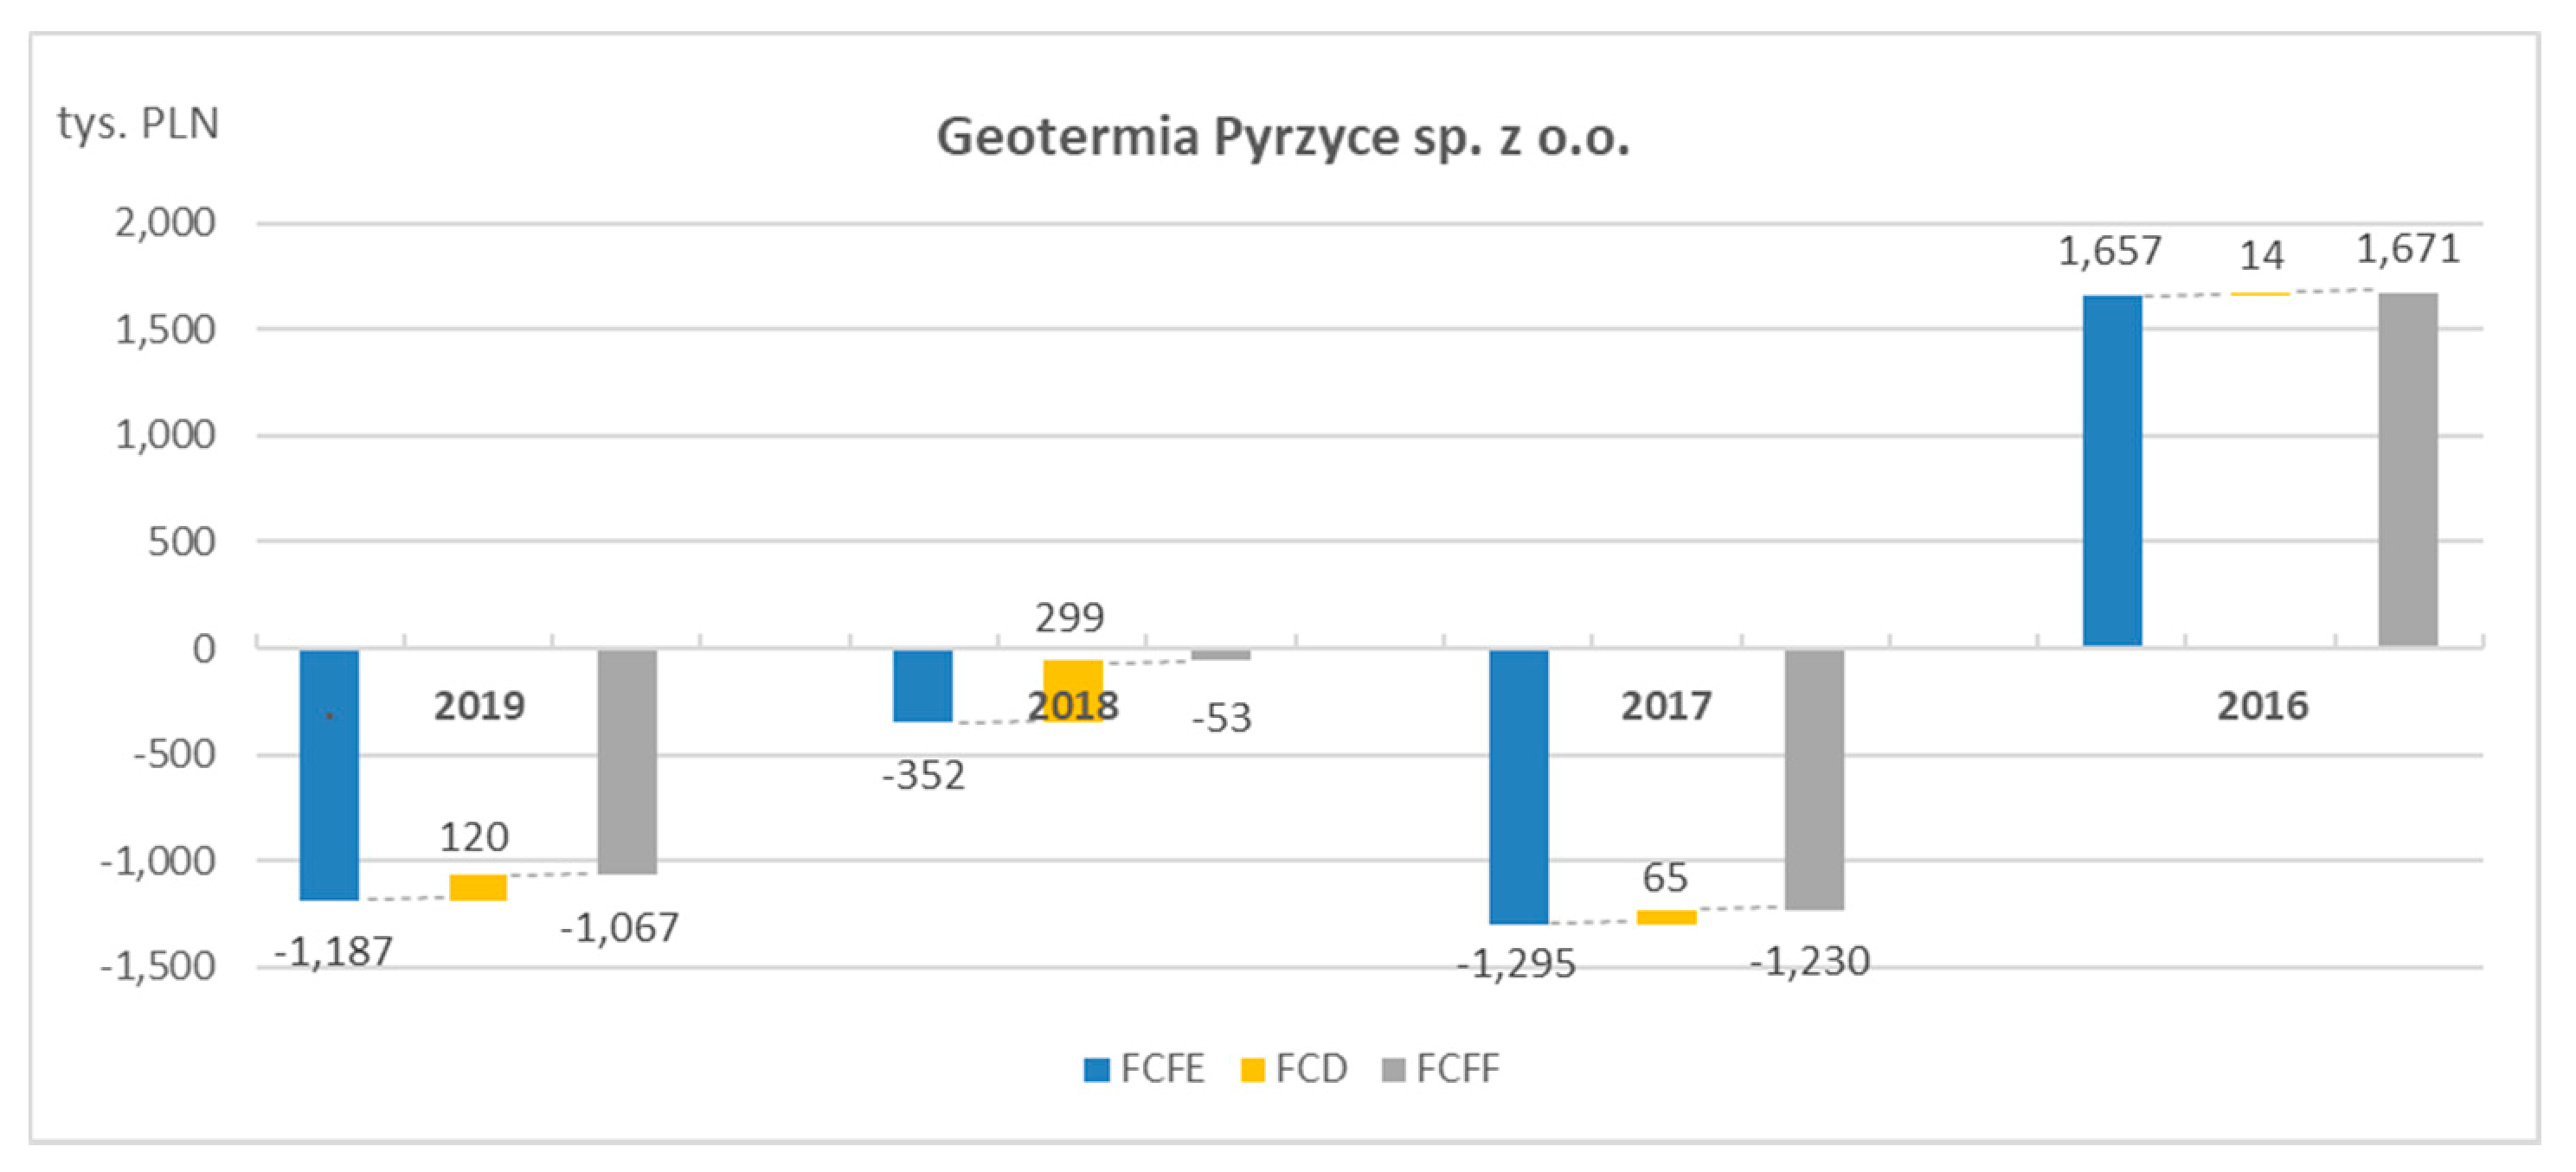
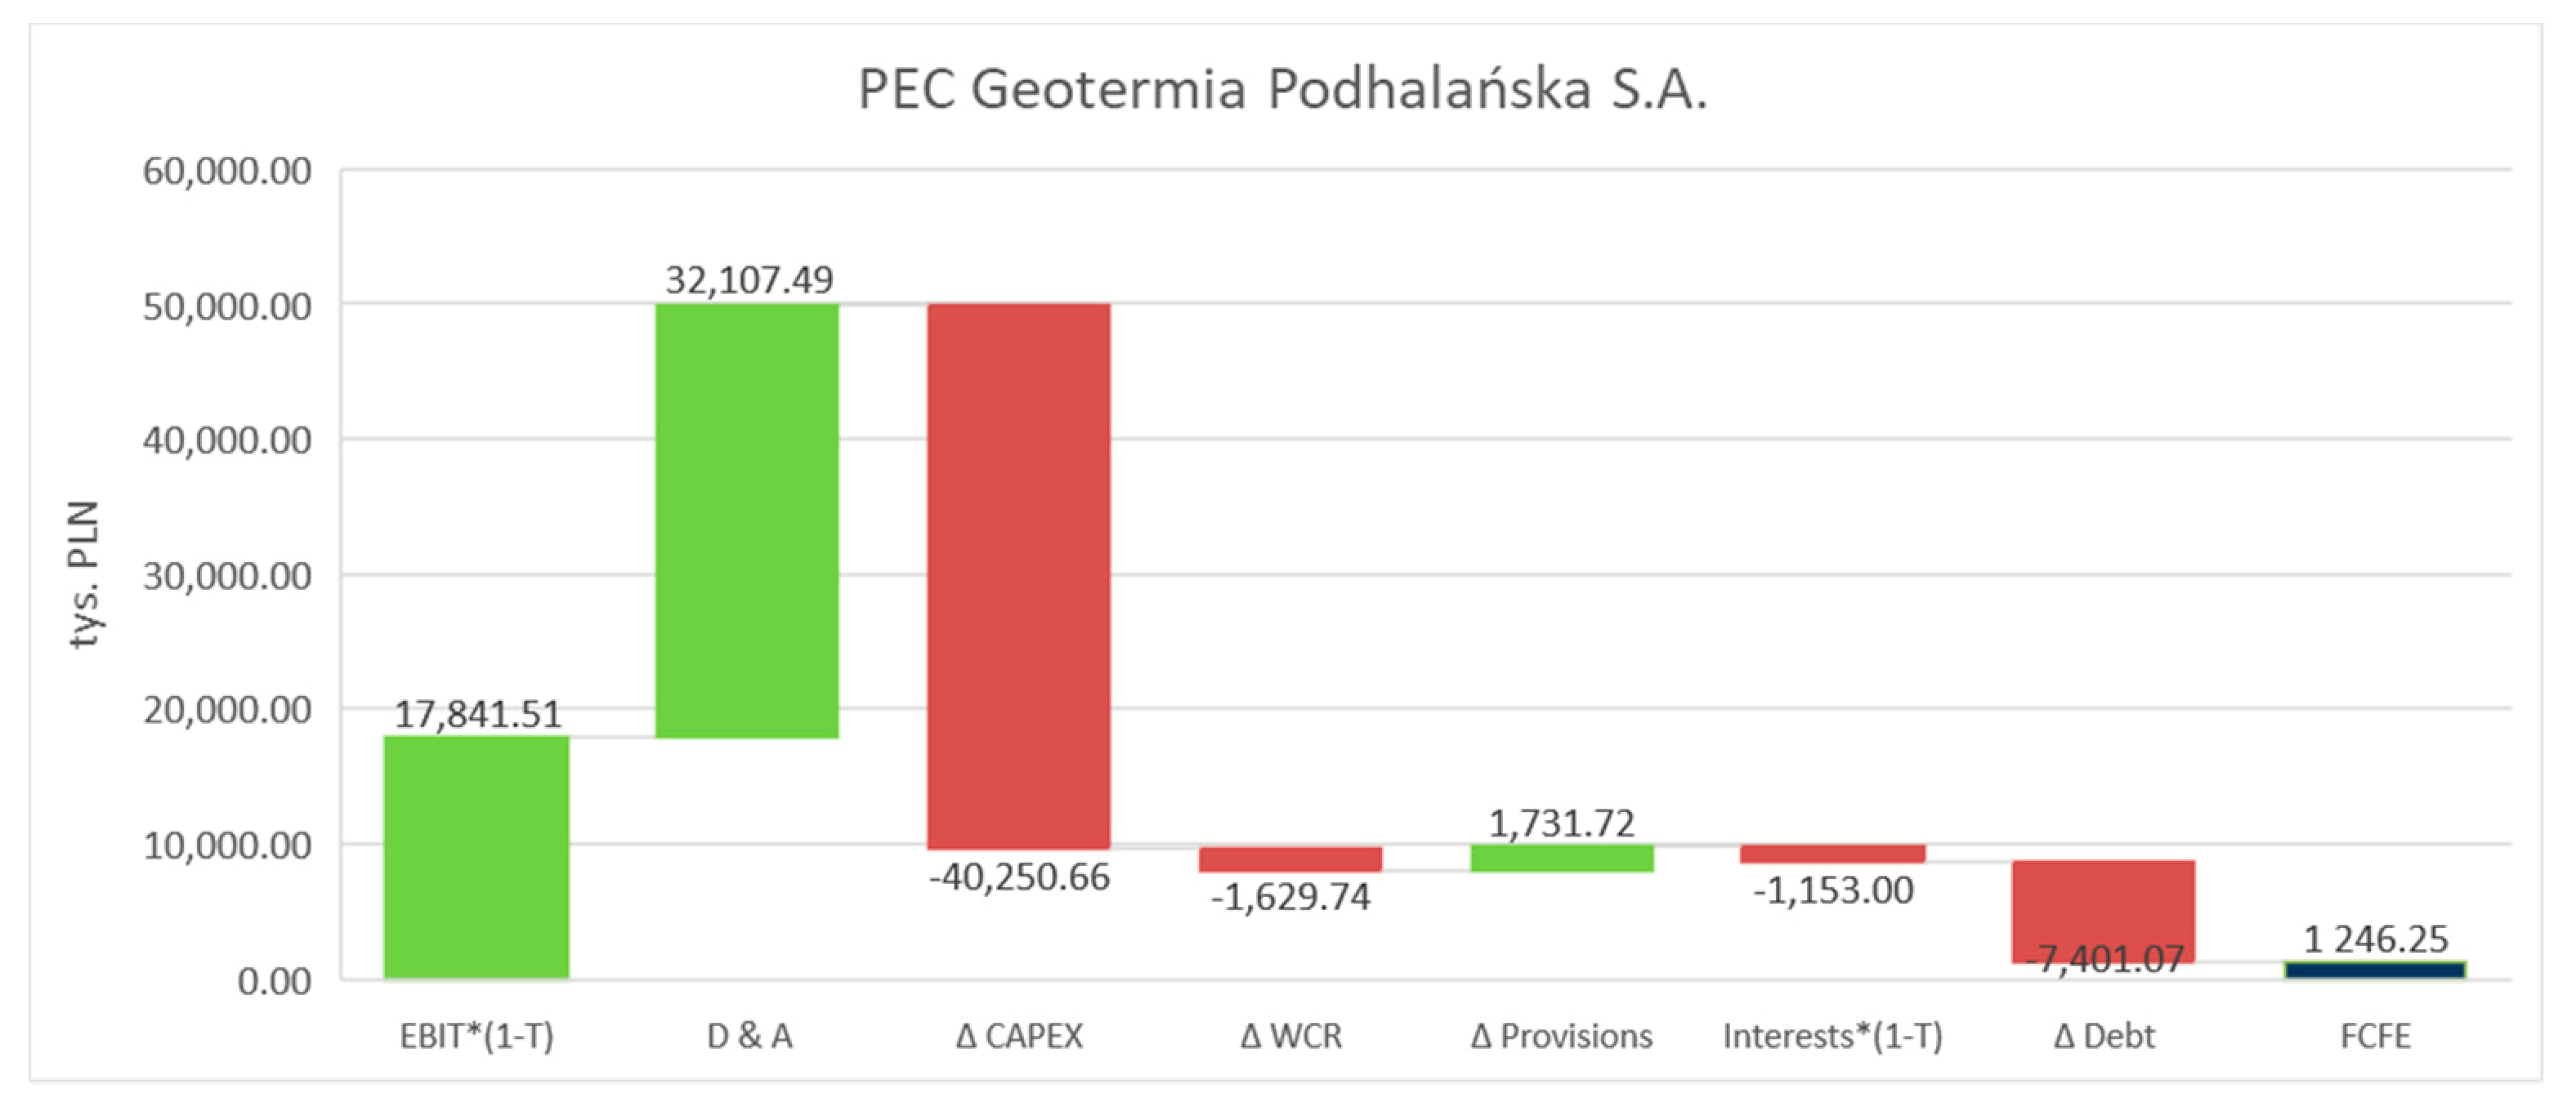
- Geotermia Podhalańska S.A. showed the highest operating profitability in total, in the analysed years, with PLN 17,842 thousand, while the lowest was Geotermia Pyrzyce Sp. z o.o., with PLN 1618 thousand.
- -
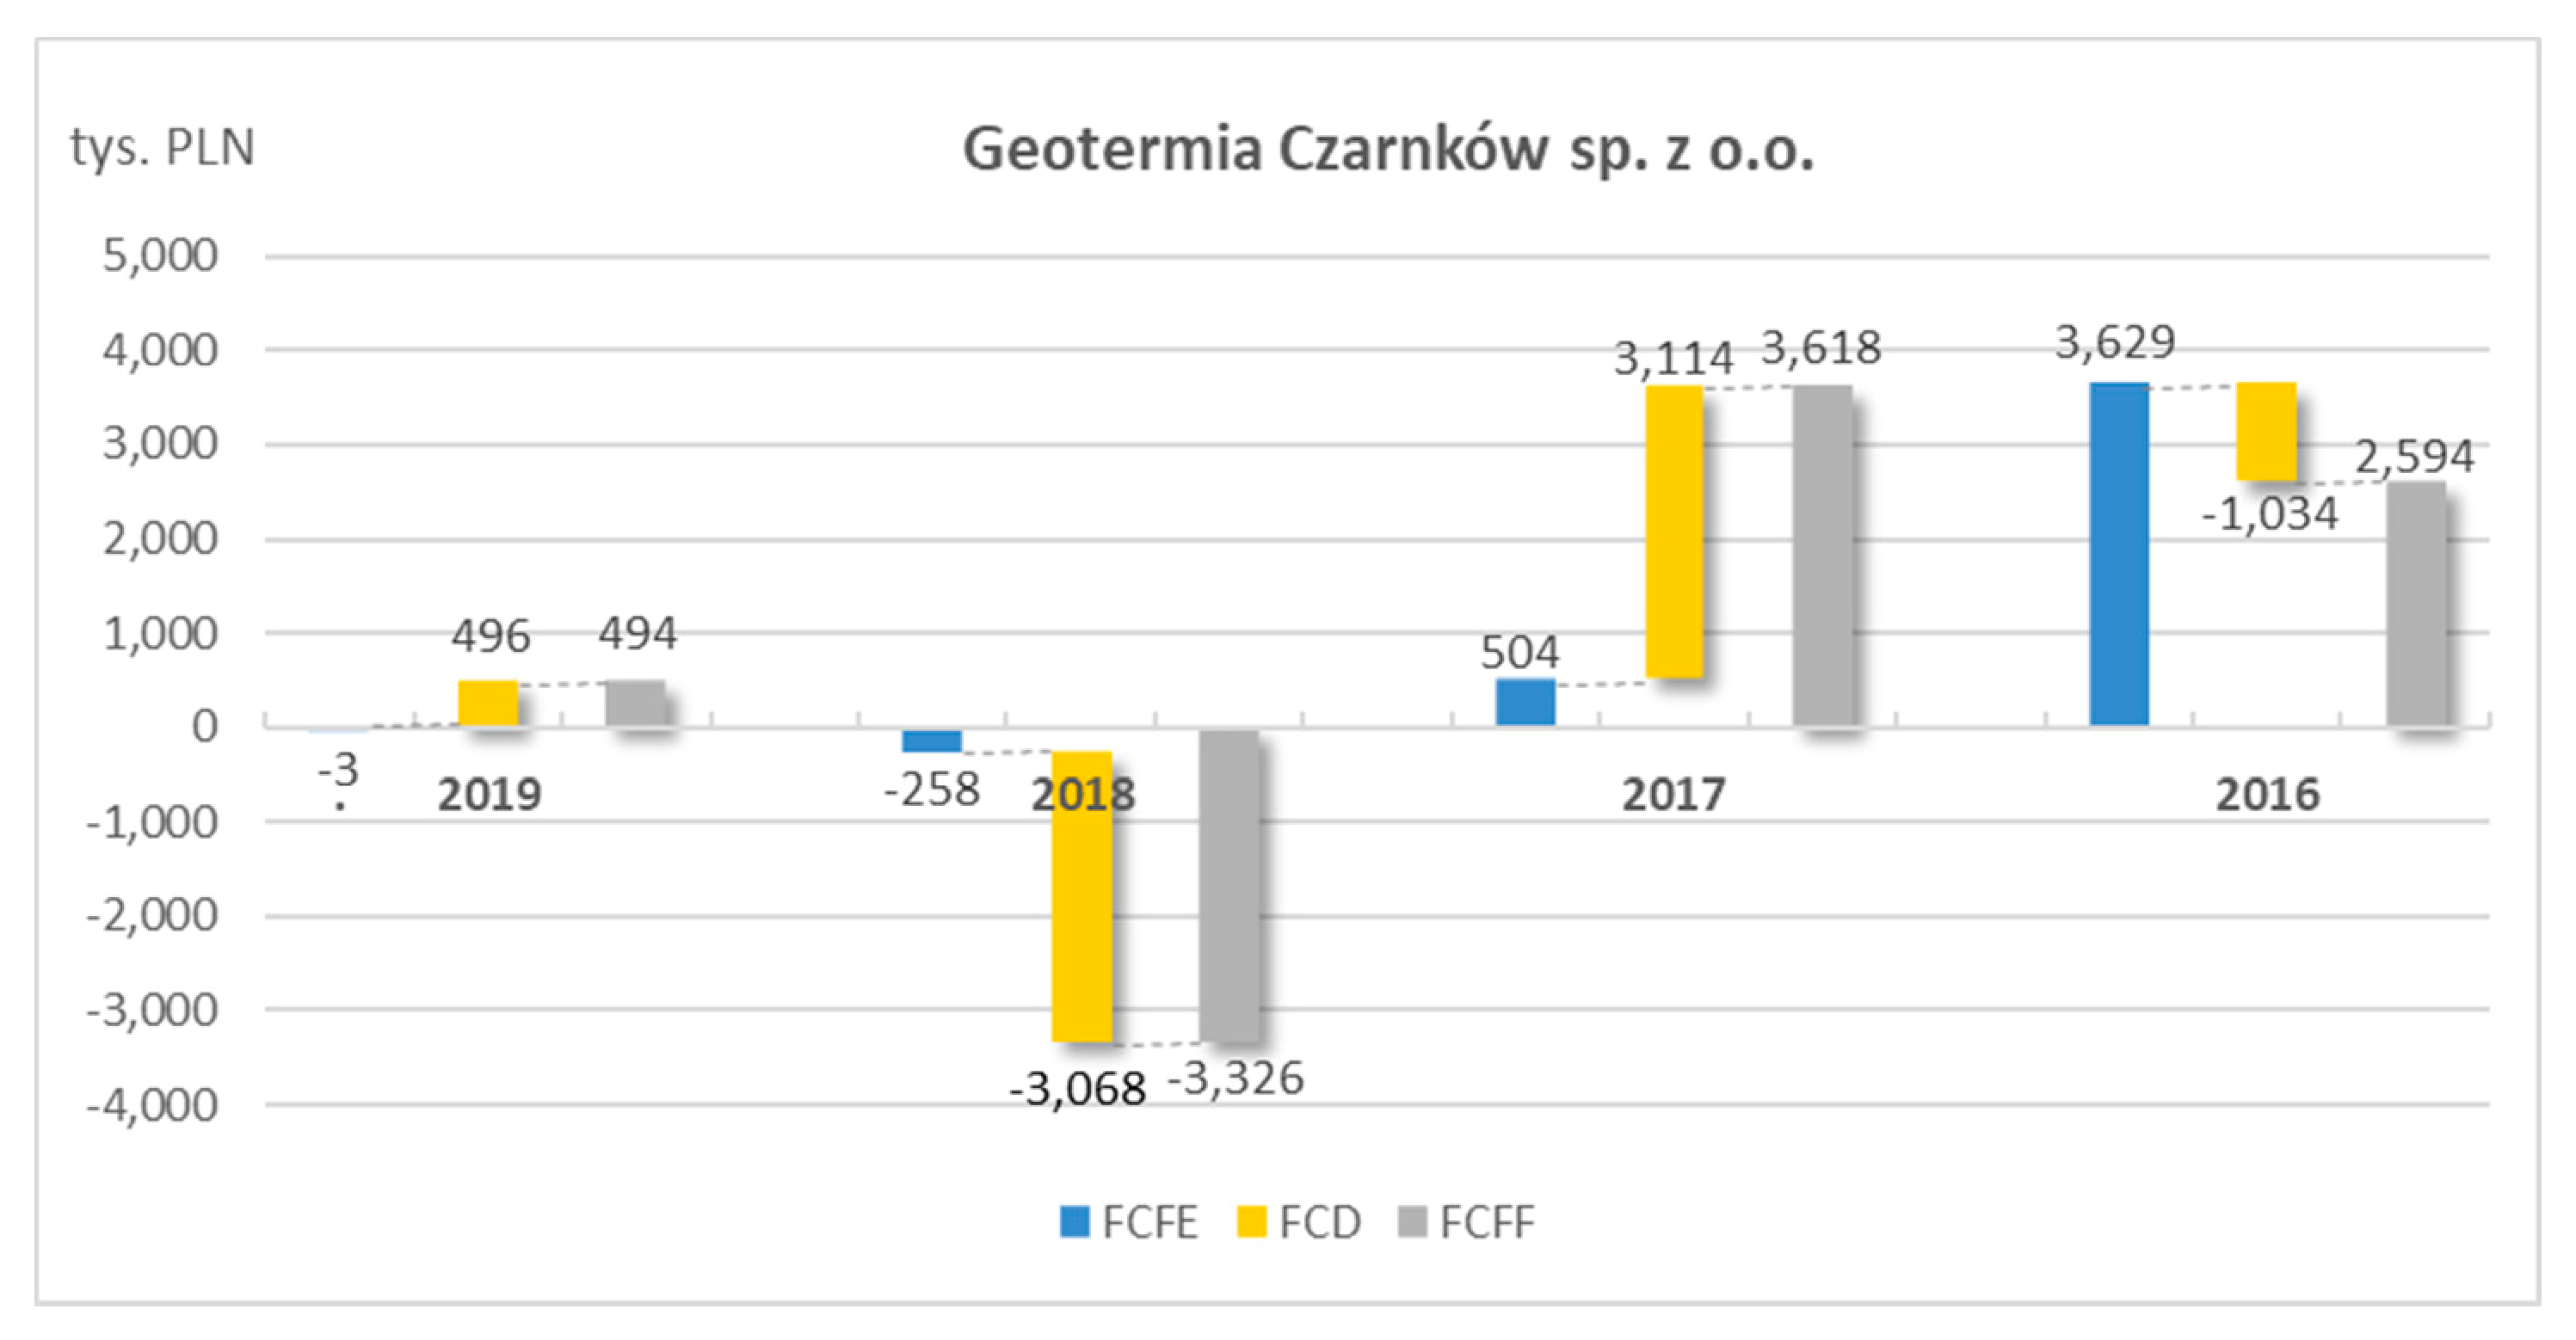
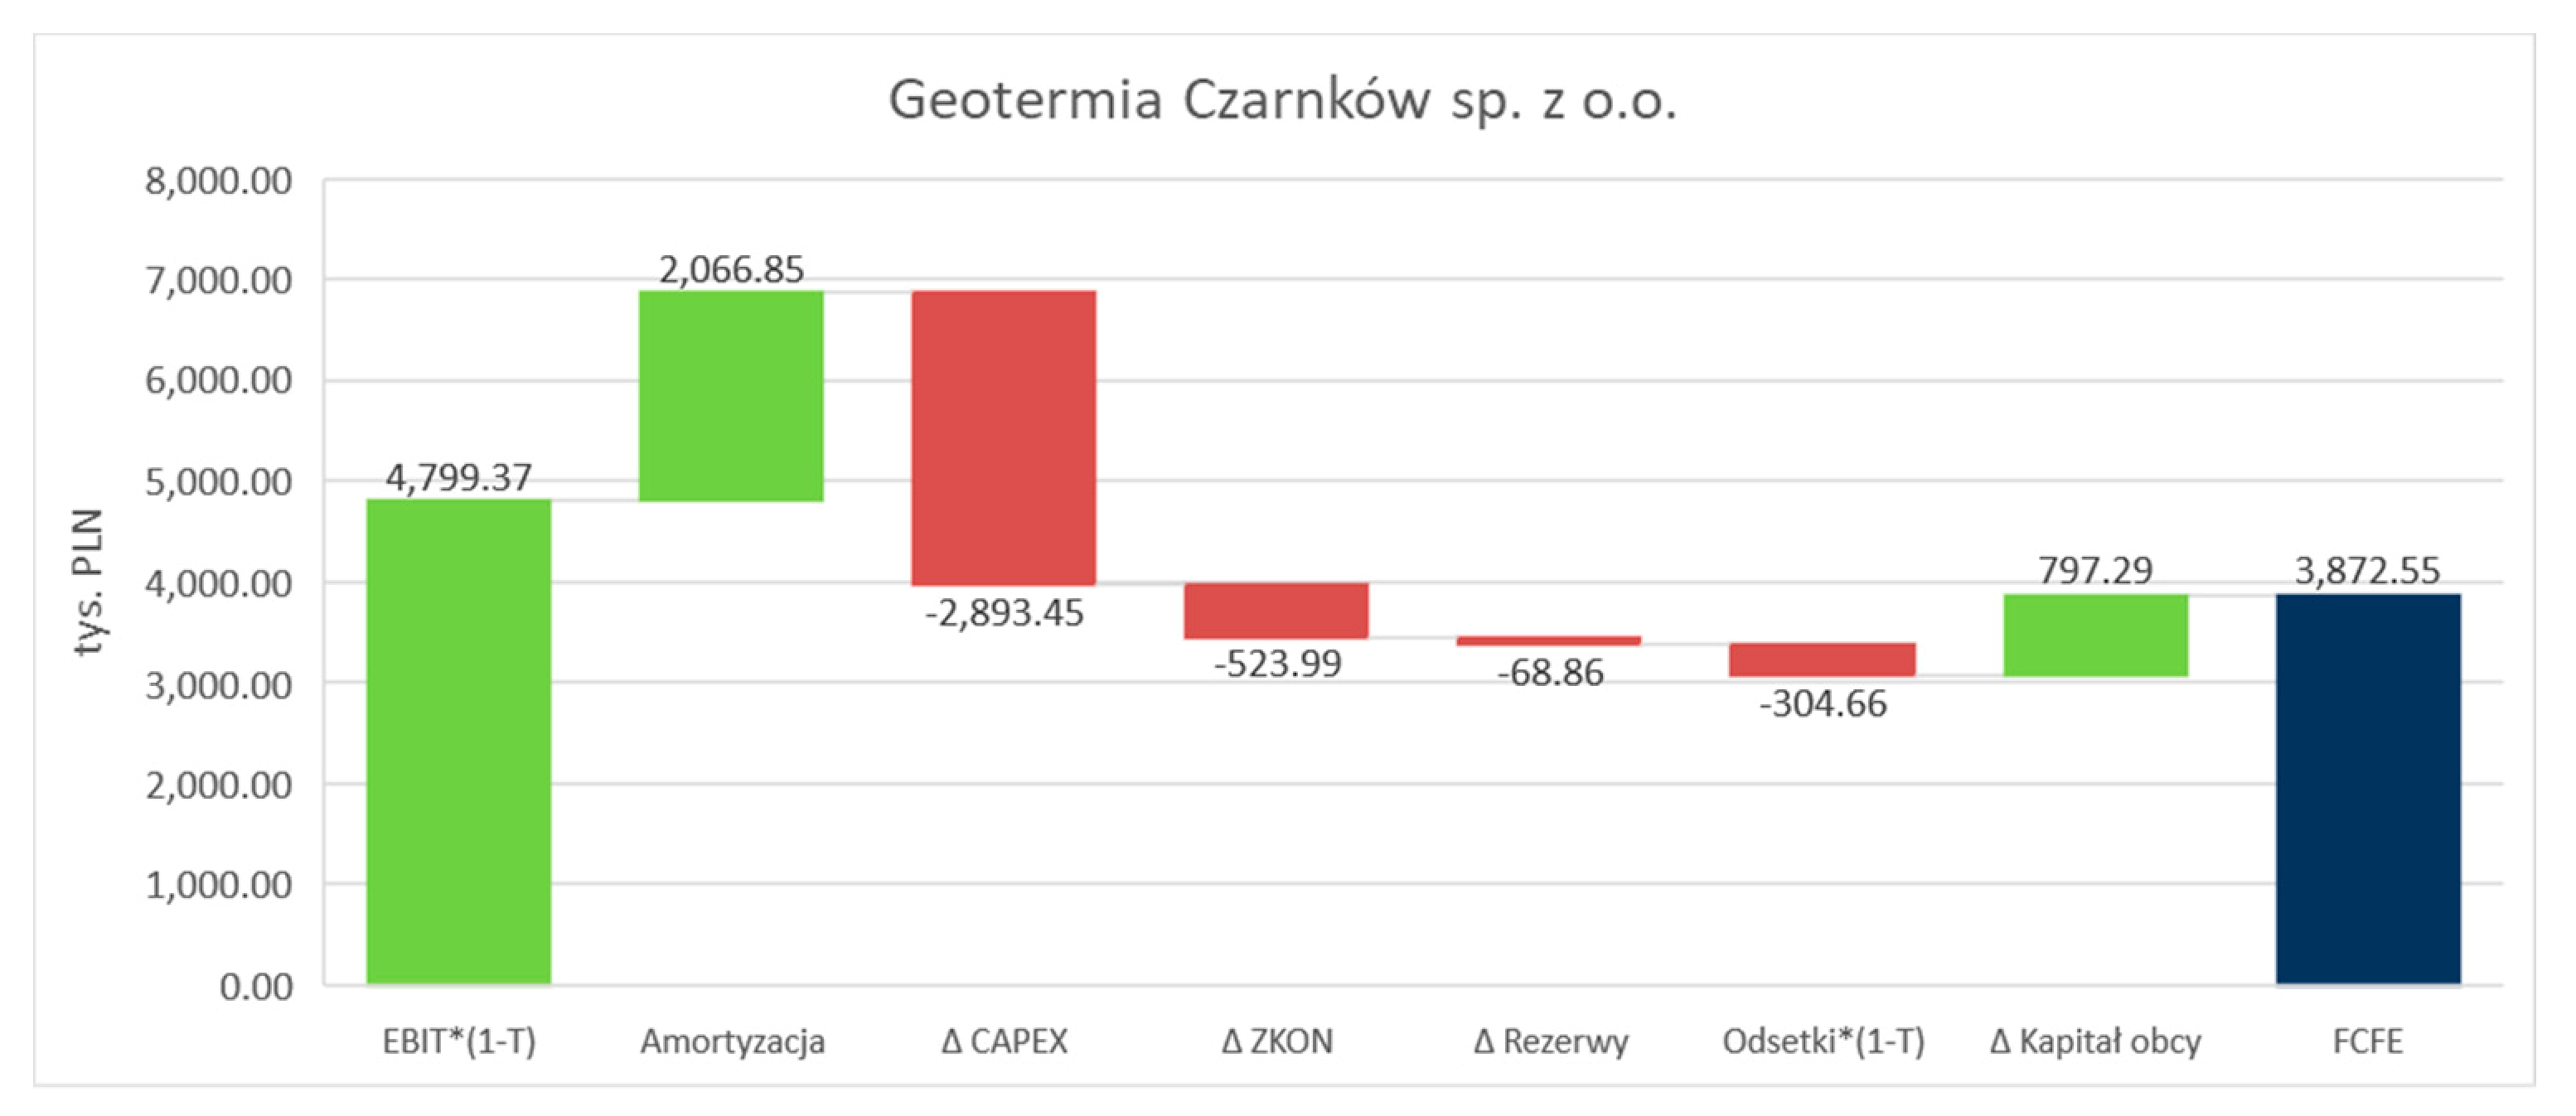
- Total depreciation and amortization costs treated as unspent and affecting flows in a favourable view are the highest in Geotermia Podhalańska S.A., at PLN 32,107 thousand. The lowest level of depreciation was recorded in Geotermia Czarnków Sp. z o.o., at PLN 2067 thousand. The level of depreciation depends on the capital invested in the form of tangible and intangible fixed assets.
- -
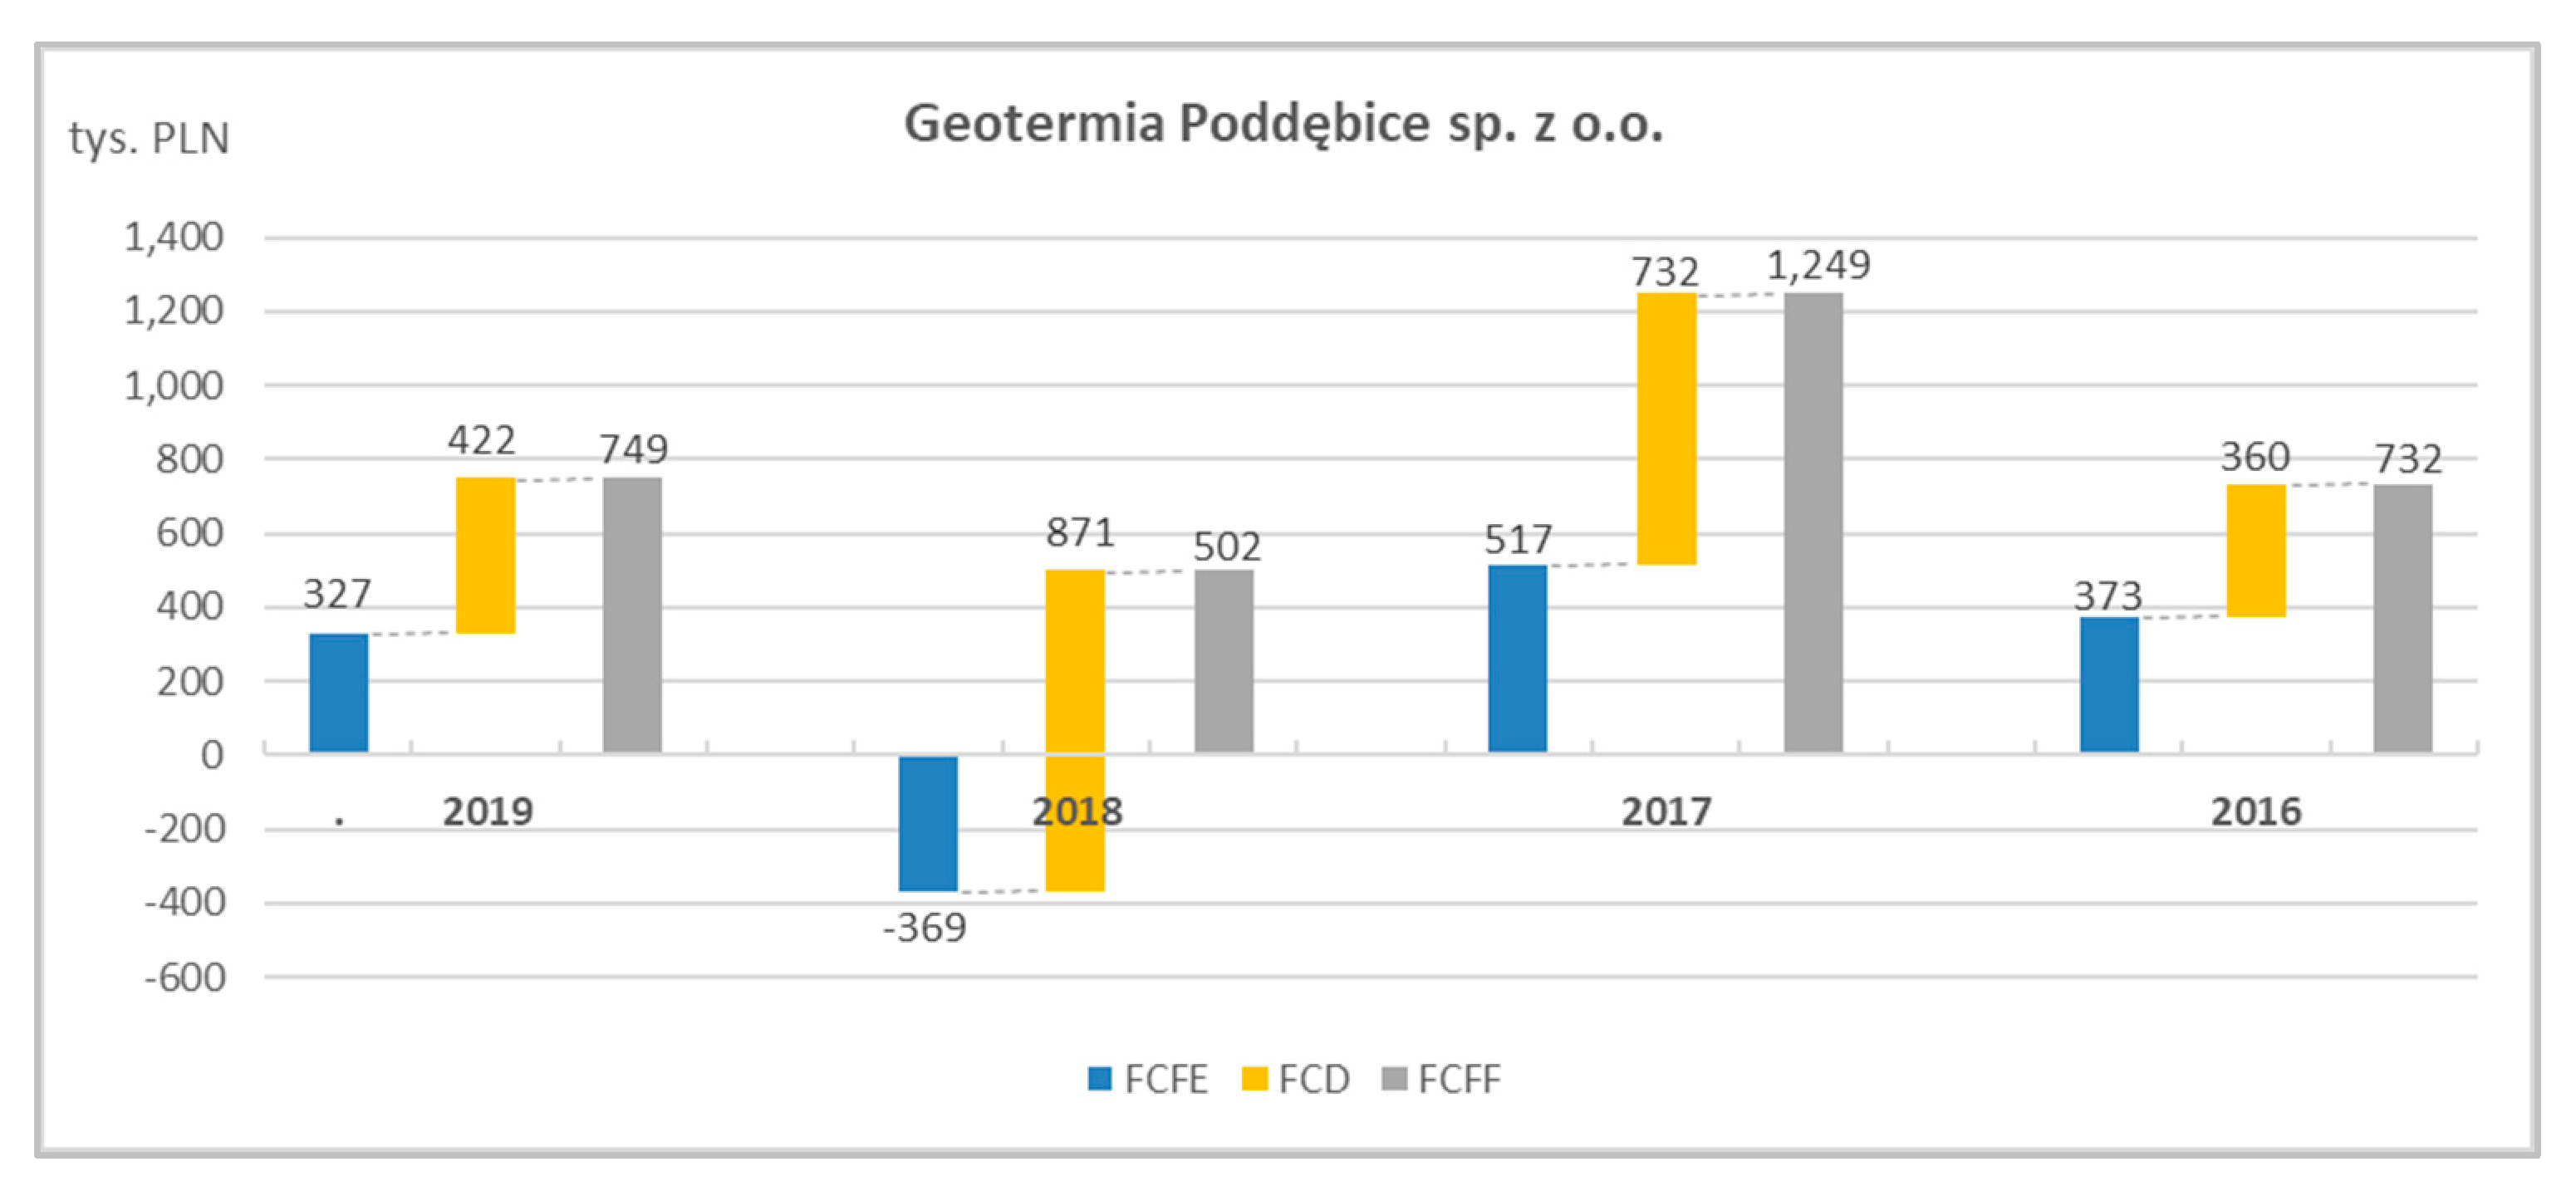
- The highest cumulative CAPEX incurred in Geotermia Podhalańska S.A., at PLN 40,251 thousand. As a consequence of such investments, fixed assets have the highest value in the form of invested capital. On the other hand, Geotermia Poddębice Sp. z o.o. has a positive balance on investments connected with fixed assets, which may mean their disinvestment.
- -
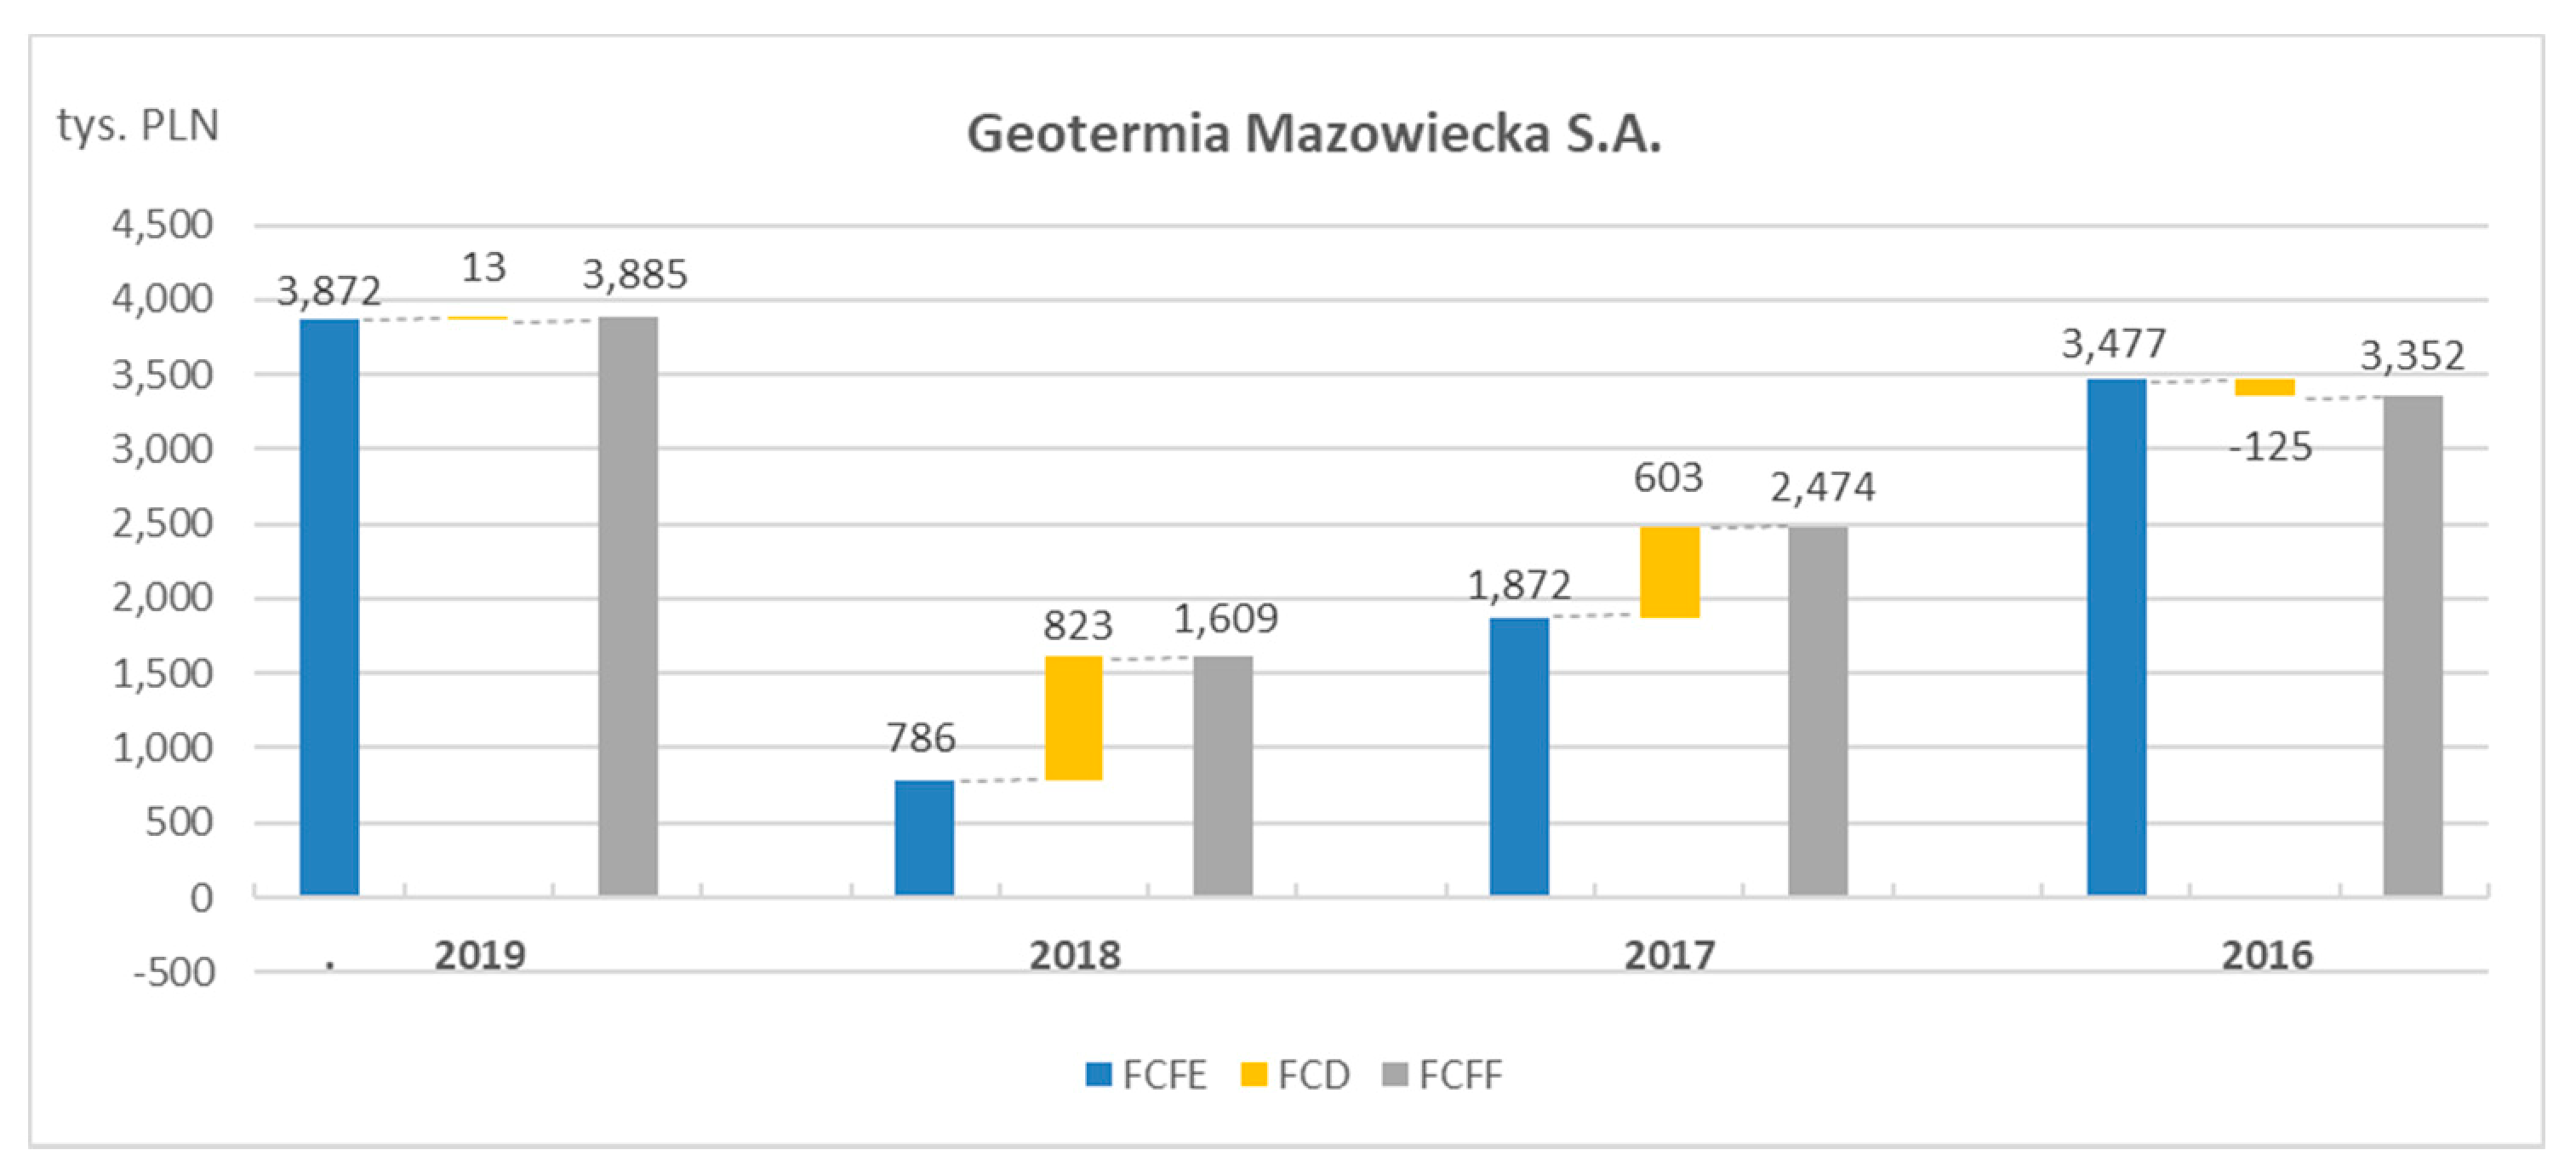
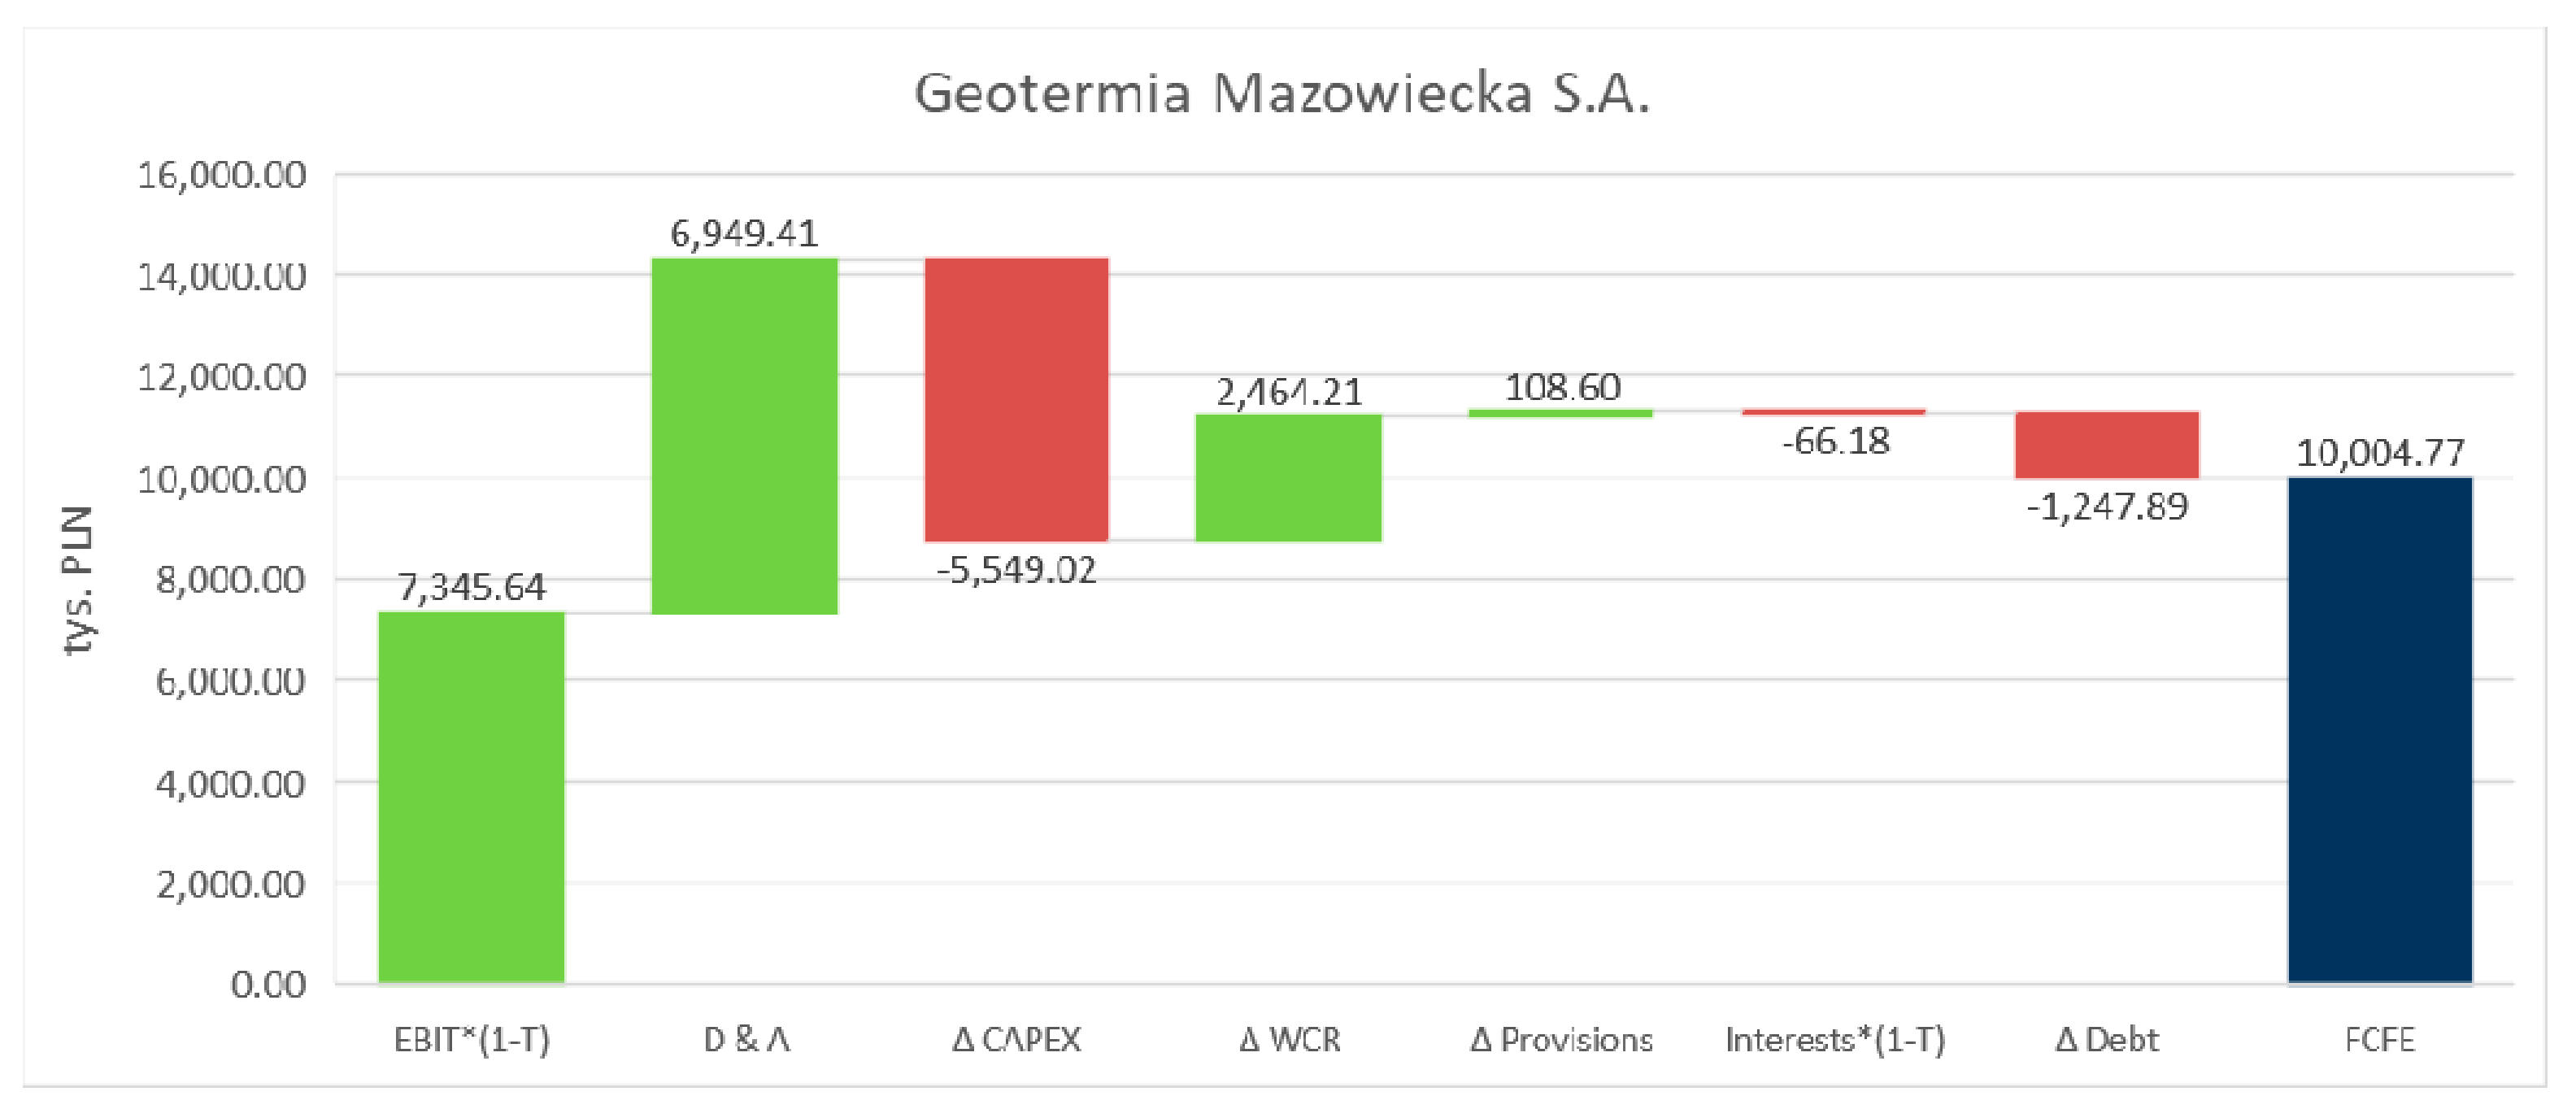
- Demand for net working capital in total was a source of cash creation in FCFE flows in three out of five analyzed companies, while the highest impact on this account was identified in Geotermia Mazowiecka S.A. and amounted to PLN 2464 thousand. The highest negative impact of demand on cash flows occurred in Geotermia Podhalańska S.A. and amounted to PLN −1630 thousand.
- -
- Analysis of provisions and accruals shows that the highest positive impact of this item on cash flows of FCFE occurred in Geotermia Pyrzyce and amounted to PLN 5969 thousand. This positive impact represents an increase in provisions that are costly in nature and have a negative impact on financial performance. Due to the fact that these are unspent costs, they affect the increase in the balance of generated cash flows for the analysed period. The largest negative impact of released or used provisions occurred in Geotermia Poddębice Sp. z o.o. and amounted to PLN −3534 thousand.
- -
- The highest level of repaid financial liabilities with interest in total was identified in Geotermia Podhalańska S.A., and amounted to PLN −8554 thousand. In turn, a positive balance in relations with external financing institutions was recorded by Geotermia Czarnków Sp. z o.o., which increased cash flows to the owner of FCFE by PLN 797 thousand.
6. Conclusions
Author Contributions
Funding
Institutional Review Board Statement
Informed Consent Statement
Data Availability Statement
Conflicts of Interest
References
- Barbier, E.B. The concept of sustainable economic development. Environ. Conserv. 1987, 14, 101–110. [Google Scholar] [CrossRef]
- Barbier, E.B.; Burgess, J.C. The sustainable development goals and the systems approach to sustainability. Economics 2017, 11, 1–23. [Google Scholar] [CrossRef] [Green Version]
- Holmberg, J.; Sandbrook, R. Sustainable development: What is to be done? In Policies for a Small Planet: From the International Institute for Environment and Development (19–38); Holmberg, J., Ed.; Earthscan Publications: London, UK, 1992. [Google Scholar]
- United Nations. The Sustainable Development Goals Report. 2020. Available online: https://unstats.un.org/sdgs/report/2020 (accessed on 1 July 2021).
- Udo, V.; Pawlowski, A. Human Progress towards Equitable Sustainable Development, part II: Empirical Exploration. Probl. Sustain. Dev. 2011, 6, 33–62. [Google Scholar]
- Dincer, I. Renewable Energy and Sustainable Development: A Crucial Review. Renew. Sustain. Energy Rev. 2000, 4, 157–175. [Google Scholar] [CrossRef]
- Kung, C.-C.; McCarl, B.A. Sustainable Energy Development under Climate Change. Sustainability 2018, 10, 3269. [Google Scholar] [CrossRef] [Green Version]
- Wang, Q.; Zhan, L. Assessing the sustainability of renewable energy: An empirical analysis of selected 18 European countries. Sci. Total Environ. 2019, 692, 529–545. [Google Scholar] [CrossRef]
- Augutis, J.; Krikštolaitis, R.; Martišauskas, L.; Urbonienė, S.; Urbonas, R.; Barbora Ušpurienė, A. Analysis of energy security level in the Baltic States based on indicator approach. Energy 2020, 199, 117427. [Google Scholar] [CrossRef]
- Bluszcz, A.; Manowska, A. Panel Analysis to Investigate the Relationship between Economic Growth, Import, Consumption of Materials and Energy. IOP Conf. Ser. Earth Environ. Sci. 2019, 362, 012153. [Google Scholar] [CrossRef] [Green Version]
- Lior, N. Thoughts about future power generation systems and the role of exergy analysis in their development. Energy Convers. Manag. 2002, 43, 1187–1198. [Google Scholar] [CrossRef]
- Rybak, A.; Rybak, A.; Sysel, P. Modeling of Gas Permeation through Mixed-Matrix Membranes Using Novel Computer Application MOT. Appl. Sci. 2018, 8, 1166. [Google Scholar] [CrossRef] [Green Version]
- Bekun, F.V.; Alola, A.A.; Sarkodie, S.A. Toward a sustainable environment: Nexus between CO2 emissions, resource rent, renewable and non-renewable energy in 16-EU countries. Sci. Total Environ. 2019, 657, 1023–1029. [Google Scholar] [CrossRef]
- Sobczyk, W.; Sobczyk, E.J. Varying the Energy Mix in the EU-28 and in Poland as a Step towards Sustainable Development. Energies 2021, 14, 1502. [Google Scholar] [CrossRef]
- Gunnarsdottir, I.; Davidsdottira, B.; Worrellb, E.; Sigurgeirsdottirc, S. Sustainable energy development: History of the concept and emerging themes. Renew. Sustain. Energy Rev. 2021, 141, 110770. [Google Scholar] [CrossRef]
- Golušin, M.; Dodić, S.; Popov, S. Sustainable Energy Management; Elsevier Science Publishing Co Inc.: Oxford, UK, 2013. [Google Scholar]
- Ligus, M.; Peternek, P. The Sustainable Energy Development Index—An Application for European Union Member States. Energies 2021, 14, 1117. [Google Scholar] [CrossRef]
- Mitchell, C. The Political Economy of Sustainable Energy; Palgrave Macmillan: London, UK, 2010; p. 9. [Google Scholar]
- Project Definition of Sustainable Energy, LG Action. Available online: https://www.acrplus.org/images/pdf/LG_Action_Final_Public_Report-www.pdf (accessed on 1 July 2021).
- Our Common Future, World Commission on Environment and Development, United Nations. 1987. Available online: http://www.un-documents.net/wced-ocf.htm (accessed on 3 July 2021).
- Report: Polityka Energetyczna Polski do 2040. Available online: https://www.gov.pl/web/klimat/polityka-energetyczna-polski (accessed on 20 June 2021).
- Stober, I.; Bucher, K. History of geothermal energy use. In Geothermal Energy: From Theoretical Models to Exploration and Development; Stober, I., Bucher, K., Eds.; Springer: Berlin/Heidelberg, Germany, 2013. [Google Scholar]
- Hollenbach, D.F.; Herndon, J.M. Deep-Earth reactor: Nuclear fission, helium, and the geo-magnetic field. Proc. Natl. Acad. Sci. USA 2001, 20, 11085–11090. [Google Scholar] [CrossRef] [PubMed] [Green Version]
- Lipiński, K. Wpływ wykorzystania energii geotermalnej na stan środowiska naturalnego Gminy Pyrzyce. In Proceedings of the International Scientific Conference “Geothermal Energy in Underground Mines”, Ustroń, Poland, 21–23 November 2001. [Google Scholar]
- Ślimak, C. PEC Geotermia Podhalańska—Stan obecny, perspektywy rozwoju. Instal 2016, 2, 6–8. Available online: https://www.cire.pl/pliki/2/9141art.pdf (accessed on 25 June 2021).
- Kaczmarczyk, M. Potential of existing and newly design geothermal heating plants in limiting of low emissions in Poland. E3S Web Conf. 2018, 44, 62. [Google Scholar] [CrossRef] [Green Version]
- Smętkiewicz, K. Opinia społeczna o wykorzystaniu wód geotermalnych na przykładzie mieszkańców gminy i odwiedzających w Uzdrowisku Uniejów. Tech. Poszuk. Geol. 2016, 1, 53–65. [Google Scholar]
- Report on Public Acceptance—Public Acceptance of Geothermal Electricity Production. 2013. Available online: http://www.geoelec.eu/wp-content/uploads/2014/03/D-4.4-GEOELEC-report-on-public-acceptance.pdf (accessed on 7 June 2021).
- World Energy Assessment (WEA), World Energy Assessment (WEA) Report: Energy and the Challenge of Sustainability; United Nations Development Programme (UNDP), Bureau for Development Policy, One United Nations Plaza: New York, NY, USA, 2000; Available online: https://sustainabledevelopment.un.org/content/documents/2423World_Energy_Assessment_2000.pdf (accessed on 1 June 2021).
- International Energy Agency. Renewables. Available online: https://www.iea.org/topics/renewables/ (accessed on 2 June 2021).
- Rybach, L. Geothermal Power Growth 1995–2013—A Comparison with Other Renewables. Energies 2014, 7, 4802–4812. [Google Scholar]
- GGA Brochure: Tap into Geothermal Insights and Experience. Available online: https://www.globalgeothermalalliance.org/About/-/media/Files/IRENA/GGA/About/GGA_Brochure_2021_Final.ashx (accessed on 18 November 2021).
- Younger, P.L. Geothermal Energy: Delivering on the Global Potential. Energies 2015, 8, 11737–11754. [Google Scholar] [CrossRef] [Green Version]
- Lund, J.W.; Toth, A.N. Direct utilization of geothermal energy 2020 worldwide review. Geothermics 2021, 90, 101915. [Google Scholar] [CrossRef]
- Geothermal District Heating. Available online: http://geodh.eu/ (accessed on 10 May 2021).
- Earth’s Geothermal Hotspots: New Dataset Launched. Available online: https://ec.europa.eu/jrc/en/news/earths-geothermal-hotspots-new-dataset-launched (accessed on 11 June 2021).
- Energia ze źródeł Odnawialnych w 2018 r. Available online: https://stat.gov.pl/files/gfx/portalinformacyjny/pl/defaultaktualnosci/5485/3/13/1/energia_ze_zrodel_odnawialnych_2018.pdf (accessed on 5 May 2021).
- Szulc-Wrońska, A.; Tomaszewska, B. Low Enthalpy Geothermal Resources for Local Sustainable Development: A Case Study in Poland. Energies 2020, 13, 5010. [Google Scholar] [CrossRef]
- Kępińska, B. Geothermal Energy Use—Country Update for Poland, 2016–2018. In Proceedings of the European Geothermal Congress, The Hague, The Netherlands, 11–14 June 2019. [Google Scholar]
- Prawo Geologiczno-Górnicze, Dz.U. z 2005 r., nr 228, poz. 1947 as Amended. Available online: https://isap.sejm.gov.pl/isap.nsf/download.xsp/WDU20111630981/U/D20110981Lj.pdf (accessed on 10 November 2021).
- Dang, C.; Li, F.; Yang, C. Measuring Firm Size in Empirical Corporate Finance. J. Bank. Financ. 2018, 86, 159–176. [Google Scholar] [CrossRef]
- Coles, J.; Li, F. Managerial Attributes, Incentives, and Performance. SSRN Electron. J. 2013, 10, 2139. [Google Scholar]
- Kopecky, K.J.; Li, Z.; Sugrue, T.F.; Tucker, A.L. Revisiting M&M with Taxes: An Alternative Equilibrating Process. Int. J. Financ. Stud. 2018, 6, 10. [Google Scholar] [CrossRef] [Green Version]
- Fernández, P. Valuing companies by cash flow discounting: Ten methods and nine theories. Managerial Finance. Emerald Group Publ. 2007, 33, 853–876. [Google Scholar]
- Mielcarz, P.; Mlinarič, F. The superiority of FCFF over EVA and FCFE in capital budgeting. Econ. Res.—Ekon. Istraživanja 2014, 27, 559–572. [Google Scholar] [CrossRef] [Green Version]
- Dagnino, G.B.; Giachetti, C.; La Rocca, M.; Picone, P.M. Behind the curtain of international diversification: An agency theory perspective. Glob. Strat. J. 2019, 9, 555–594. [Google Scholar] [CrossRef]
- Georgios, P.N.; Chris, G. Employing valuation tools for public and private companies. The food sector in Greece. In Procedia Economics and Finance, Proceeding of the Economies of Balkan and Eastern Europe Countries in the Changed World, Kavala, Greece, 8–10 May 2015; Karasavoglou, A.G., Kyrkilis, D., Polychronidou, P., Eds.; Elsevier: Amsterdam, The Netherlands, 2015. [Google Scholar]
- Gołębiowski, G.; Szczepankowski, P. Analiza Wartości Przedsiębiorstwa; Difin: Warszawa, Poland, 2007. [Google Scholar]
- Koller, T.; Geodhart, M.; Wessels, D. Valuation: Measuring and Managing the Value of Companies, 5th ed.; John Wiley & Sons, Inc.: Hoboken, NJ, USA, 2010. [Google Scholar]
- Hawawini, G.; Viallet, C. Finance for Executives: Managing for Value Creation, 4th ed.; South-Western Cengage Learning: Boston, MA, USA, 2009; pp. 110–114. [Google Scholar]
- Financial Statements of PEC Geotermia Podhalańska S.A for the Years 2009–2018. Available online: https://www.emis.com/pl (accessed on 10 July 2021).
- Financial Statements of Geotermia Poddębice. Sp. z o.o. for the Years 2009–2018. Available online: https://www.emis.com/pl (accessed on 10 July 2021).
- Financial Statements of Geotermia Mazowiecka S.A for the Years 2009–2018. Available online: https://www.emis.com/pl (accessed on 10 July 2021).
- Financial Statements of Geotermia Pyrzyce Sp. z o.o. for the years 2009–2018. Available online: https://www.emis.com/pl (accessed on 10 July 2021).
- Financial Statements of Geotermia Czarnków Sp. z o.o. for the Years 2009–2018. Available online: https://www.emis.com/pl (accessed on 10 July 2021).
- Harber, A. Study into the Potential for Deep Geothermal Energy in Scotland; Scottish Government Project Number: AEC/001/11; AECOM/Scottish Government: Edinburgh, UK, 2013; Volume 1, p. 216. Available online: http://www.gov.scot/Publications/2013/11/2800/9 (accessed on 3 July 2021).
- Kurpaska, S.; Janowski, M.; Gliniak, M.; Krakowiak-Bal, A.; Ziemiańczyk, U. The Use of Geothermal Energy to Heating Crops under Cover: A Case Study of Poland. Energies 2021, 14, 2618. [Google Scholar] [CrossRef]
- Boguniewicz-Zabłocka, J.; Łukasiewicz, E.; Guida, D. Analysis of the Sustainable Use of Geothermal Waters and Future Development Possibilities—A Case Study from the Opole Region, Poland. Sustainability 2019, 11, 6730. [Google Scholar] [CrossRef] [Green Version]
- Maliszewski, N. Profitability of geothermal energy use in localities of various population. In Proceedings of the International Geothermal Days Poland 2004, Zakopane, Poland, 13–17 September 2004; International Summer School of Direct Application of Geothermal Energy, Polish Geothermal Association: Zakopane, Poland, 2004. Available online: https://www.geothermal-energy.org/pdf/IGAstandard/ISS/2004Poland/4_4__maliszewski.pdf (accessed on 30 October 2021).
- Colmenar-Santos, A.; Palomo-Torrejón, E.; Rosales-Asensio, E.; Borge-Diez, D. Measures to Remove Geothermal Energy Barriers in the European Union. Energies 2018, 11, 3202. [Google Scholar] [CrossRef] [Green Version]


| Location | Official Names of Individual Plants | Total Installed Thermal Capacity (MW) | Installed Geothermal Thermal Power (MW) | Share of Geothermics (%) |
|---|---|---|---|---|
| Bańska Niżna | PEC Geotermia Podhalańska S.A. | 77.9 | 38.8 | 50 |
| Stargard | G-Term Energy Sp. z o.o. | 12.6 | 12.6 | 100 |
| Poddębice | Geotermia Poddębice Sp. z o.o | 10 | 10 | 100 |
| Pyrzyce | Geotermia Pyrzyce Sp. z o.o. | 22 | 6 | 27 |
| Mszczonów | Geotermia Mazowiecka S.A. | 8.3 | 3.7 | 45 |
| Uniejów | Geotermia Uniejów im. Stanisława Olasa Sp. z o.o | 7.4 | 3.2 | 43 |
| Total | 138.2 | 74.6 | - | |
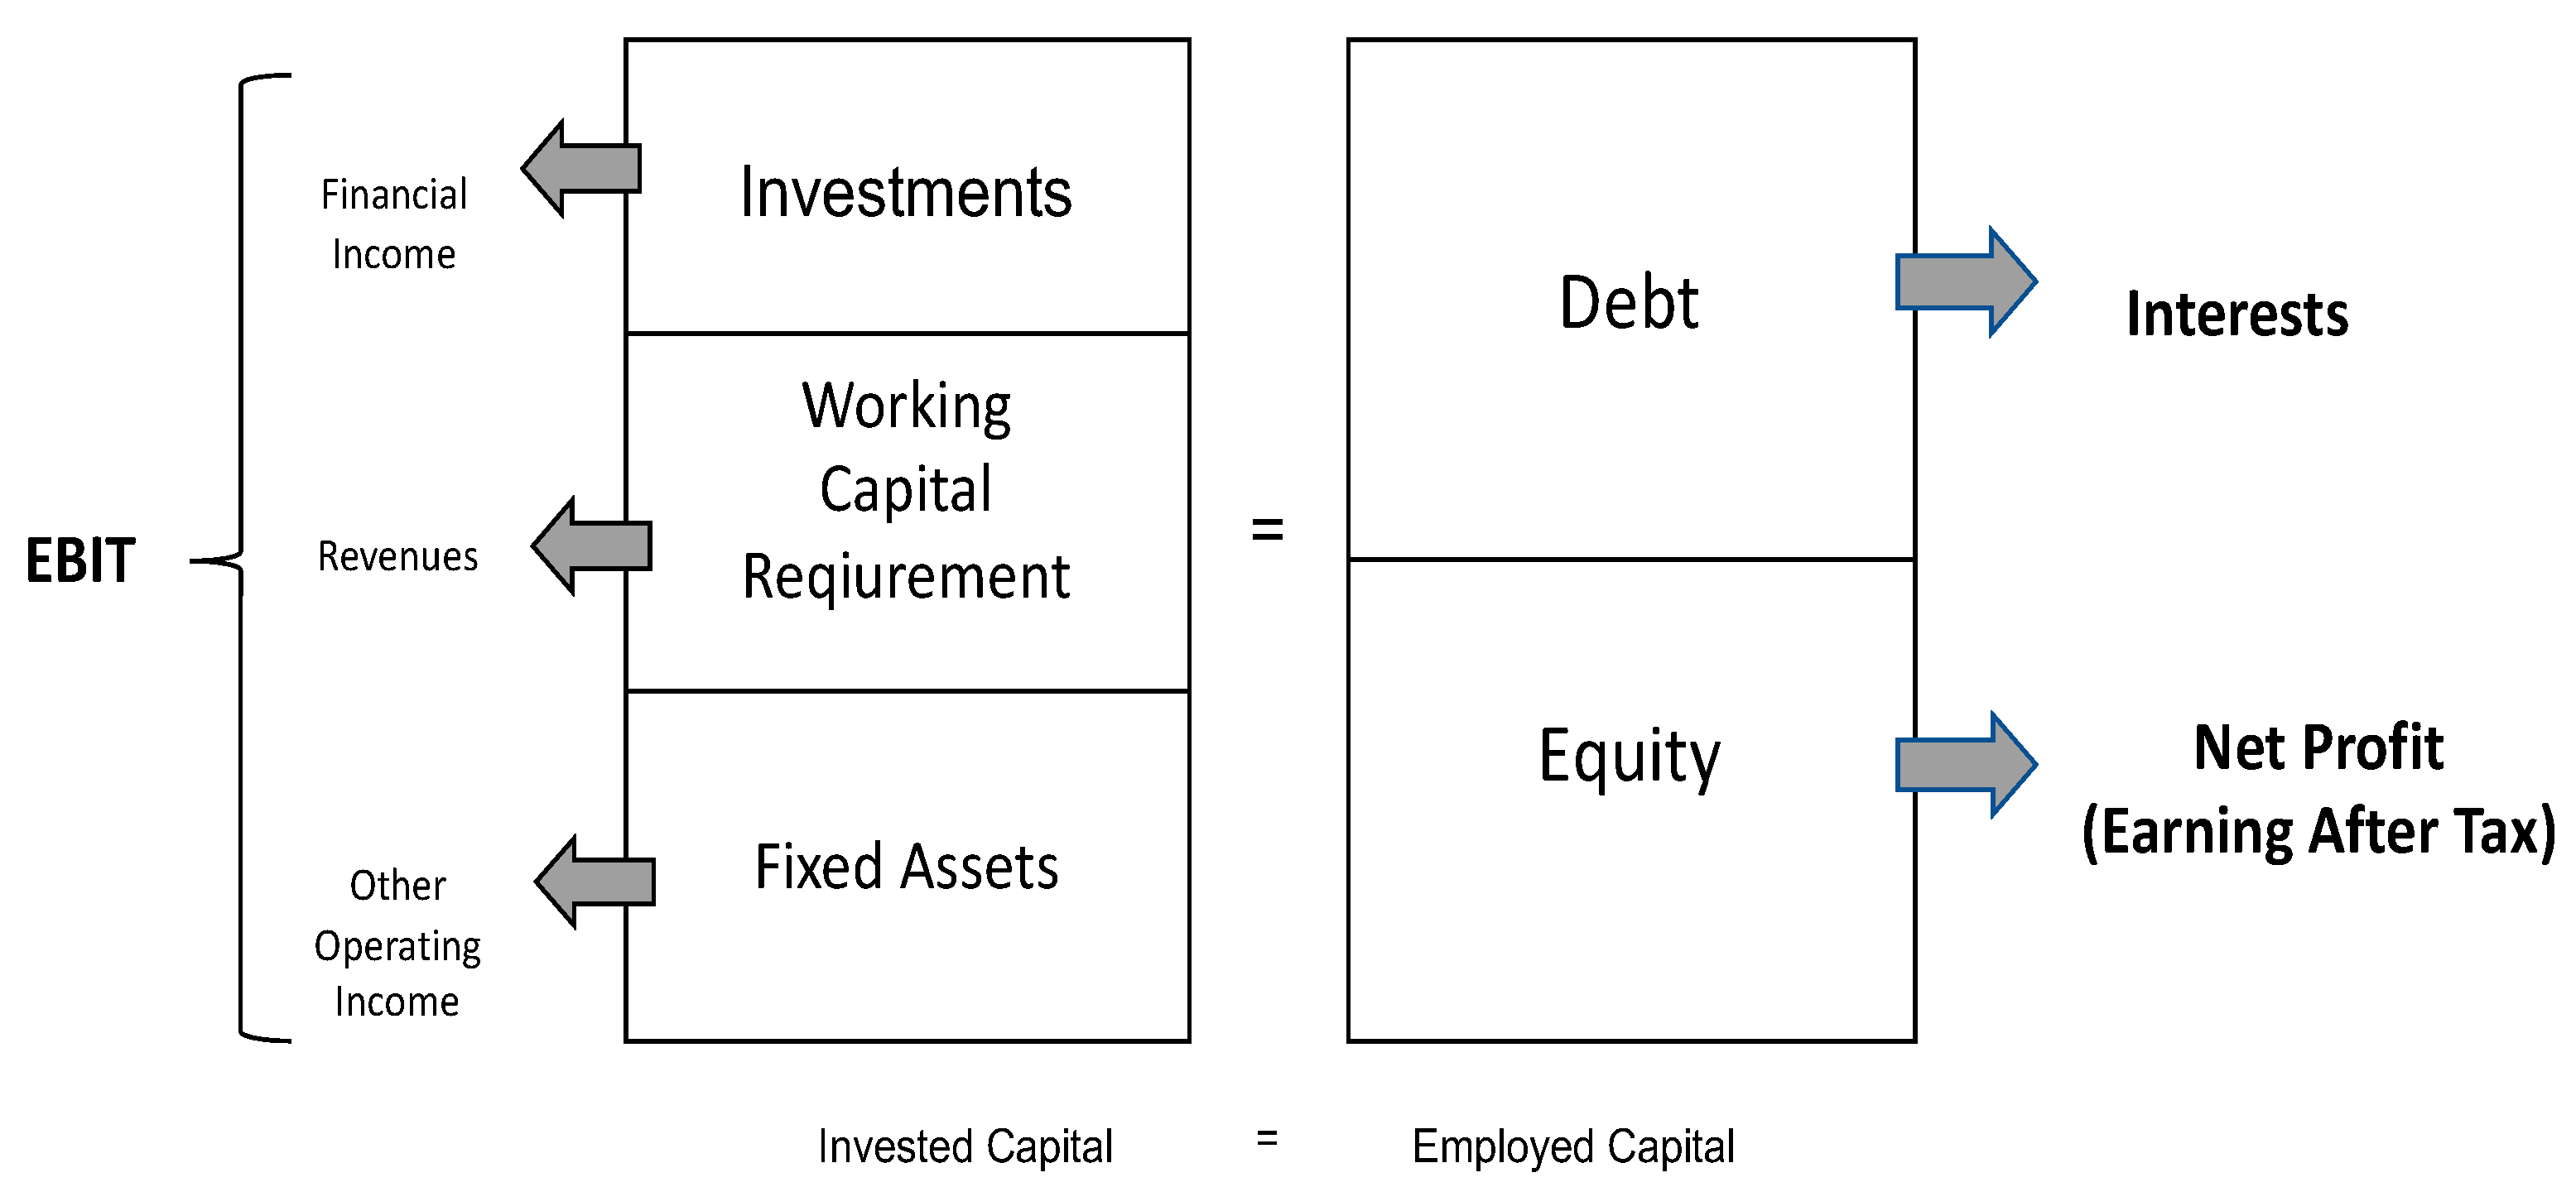
| (=) Free Cash Flow to the Firm (FCFF) | (=) Free Cash Flow to Equity (FCFE) | (=) Free Cash Flow to Debt (FCD) |
| (=) Earning Before Interests and Taxes (EBIT (1 − T)) (+) Depreciation and Amortization (−) CAPEX (+/−) Working Capital Requirement (+/−) Provisions | (=) EAT (Earning After Tax) (+) Depreciation and Amortization (−) CAPEX (+/−) Working Capital Requirement (+/−) Provisions (+/−) Debt | (+/−) Debt (+) Financial Interests |
| 2019 | 2018 | 2017 | 2016 | |
|---|---|---|---|---|
| Cash | 7366 | 9986 | 9985 | 7712 |
| Working capital requirement (WCR) | 669 | −1188 | 214 | −44,211 |
| Net fixed assets | 169,195 | 165,764 | 159,055 | 15,5541 |
| IC | 177,230 | 174,562 | 169,254 | 119,042 |
| Debt | 6790 | 8640 | 10,490 | 1850 |
| Provisions | 41,414 | 43,040 | 38,639 | 0 |
| Owner’s equity | 129,026 | 122,882 | 120,125 | 117,192 |
| EC | 177,230 | 174,562 | 169,254 | 119,042 |
| 2019 | 2018 | 2017 | 2016 | |
|---|---|---|---|---|
| EBIT | 7964.77 | 3825.61 | 5027.00 | 5486.00 |
| Effective Tax | 20% | 21% | 20% | 19% |
| EBIT × (1 − T) | 6371.95 | 3022.47 | 4017.05 | 4430.03 |
| Depreciation and Amortization | 8328.07 | 7802.42 | 7732.00 | 8245.00 |
| Δ CAPEX | −11,759.00 | −14,511.66 | −11,246.00 | −2734.00 |
| Δ WCR | −1856.98 | 1402.24 | −44,425.00 | 43,250.00 |
| Δ Provisions | −1626.43 | 4401.15 | 38,639.00 | −39,682.00 |
| FCFF | −542.39 | 2116.62 | −5282.95 | 13,509.03 |
| Net profit | 6144.27 | 2772.25 | 3712.00 | 4061.00 |
| Depreciation and Amortization | 8328.07 | 7802.42 | 7732.00 | 8245.00 |
| Δ CAPEX | −11,759.00 | −14,511.66 | −11,246.00 | −2734.00 |
| Δ WCR | −1856.98 | 1402.24 | −44,425.00 | 43,250.00 |
| Δ Provisions | −1626.43 | 4401.15 | 38,639.00 | −39,682.00 |
| Δ Debt | −1850.40 | −1849.67 | 8640.00 | −12,341.00 |
| FCFE | −2620.47 | 16.73 | 3052.00 | 799.00 |
| Interests | 284.60 | 316.72 | 383.00 | 457.00 |
| Effective Tax | 20% | 21% | 20% | 19% |
| Interests × (1 − T) | 227.68 | 250.23 | 306.05 | 369.03 |
| Δ Debt | 1850.40 | 1849.67 | −8640.00 | 12,341.00 |
| FCD | 2078.08 | 2099.90 | −8333.95 | 12,710.03 |
| 2019 | 2018 | 2017 | 2016 | |
|---|---|---|---|---|
| Cash | 1876 | 1580 | 1883 | 923 |
| Working capital requirement (WCR) | −503 | −752 | −347 | −374 |
| Net fixed assets | 14,686 | 15,528 | 15,188 | 16,252 |
| IC | 16,059 | 16,356 | 16,725 | 16,801 |
| Debt | 650 | 1034 | 1459 | 1850 |
| Provisions | 5044 | 5521 | 6007 | 6808 |
| Owner’s equity | 10,365 | 9801 | 9259 | 8142 |
| EC | 16,059 | 16,356 | 16,725 | 16,801 |
| 2019 | 2018 | 2017 | 2016 | |
|---|---|---|---|---|
| EBIT | 696.88 | 812.70 | 884.33 | 579.69 |
| Effective Tax | 9% | 15% | 16% | 20% |
| EBIT × (1 − T) | 632.18 | 687.73 | 743.07 | 460.91 |
| Depreciation and Amortization | 1018.23 | 981.46 | 1072.20 | 1009.23 |
| Δ CAPEX | −176.03 | −256.95 | 792.97 | −208.12 |
| Δ WCR | −248.83 | 377.31 | −73.24 | −45.31 |
| Δ Provisions | −476.68 | −1287.21 | −1286.17 | −484.43 |
| FCFF | 748.87 | 502.34 | 1248.83 | 732.28 |
| Net profit | 593.67 | 632.96 | 676.63 | 376.14 |
| Depreciation and Amortization | 1018.23 | 981.46 | 1072.20 | 1009.23 |
| Δ CAPEX | −176.03 | −256.95 | 792.97 | −208.12 |
| Δ WCR | −248.83 | 377.31 | −73.24 | −45.31 |
| Δ Provisions | −476.68 | −1287.21 | −1286.17 | −484.43 |
| Δ Debt | −383.81 | −816.19 | −665.61 | −275.00 |
| FCFE | 326.55 | −368.62 | 516.78 | 372.51 |
| Interests | 42.45 | 64.72 | 79.07 | 106.63 |
| Effective Tax | 9% | 15% | 16% | 20% |
| Interests × (1 − T) | 38.51 | 54.77 | 66.44 | 84.78 |
| Δ Debt | 383.81 | 816.19 | 665.61 | 275.00 |
| FCD | 422.32 | 870.96 | 732.05 | 359.78 |
| 2019 | 2018 | 2017 | 2016 | |
|---|---|---|---|---|
| Cash | 11,493 | 7621 | 6836 | 4964 |
| Working capital requirement (WCR) | −142 | 2448 | 1150 | 652 |
| Net fixed assets | 18,792 | 18,609 | 19,674 | 20,813 |
| IC | 30,144 | 28,677 | 27,660 | 26,429 |
| Debt | 0 | 0 | 812 | 1386 |
| Provisions | 692 | 510 | 592 | 790 |
| Owner’s equity | 29,452 | 28,167 | 26,256 | 24,253 |
| EC | 30,144 | 28,677 | 27,660 | 26,429 |
| 2019 | 2018 | 2017 | 2016 | |
|---|---|---|---|---|
| EBIT | 1647.27 | 2423.38 | 2551.00 | 2630.00 |
| Effective Tax | 21% | 21% | 20% | 20% |
| EBIT × (1 − T) | 1297.40 | 1922.84 | 2030.66 | 2094.74 |
| Depreciation and Amortization | 1661.31 | 1676.69 | 1776.00 | 1835.41 |
| Δ CAPEX | −1844.98 | −611.24 | −637.00 | −2455.80 |
| Δ WCR | 2589.53 | −1297.86 | −498.00 | 1670.54 |
| Δ Provisions | 181.66 | −81.80 | −198.00 | 206.74 |
| FCFF | 3884.92 | 1608.63 | 2473.66 | 3351.63 |
| Net profit | 1284.55 | 1911.71 | 2003.00 | 2082.00 |
| Depreciation and Amortization | 1661.31 | 1676.69 | 1776.00 | 1835.41 |
| Δ CAPEX | −1844.98 | −611.24 | −637.00 | −2455.80 |
| Δ WCR | 2589.53 | −1297.86 | −498.00 | 1670.54 |
| Δ Provisions | 181.66 | −81.80 | −198.00 | 206.74 |
| Δ Debt | 0.00 | −812.00 | −574.00 | 138.11 |
| FCFE | 3872.07 | 785.50 | 1872.00 | 3477.00 |
| Interests | 16.31 | 14.03 | 36.00 | 17.00 |
| Effective Tax | 21% | 21% | 20% | 20% |
| Interests × (1 − T) | 12.85 | 11.13 | 28.66 | 13.54 |
| Δ Debt | 0.00 | 812.00 | 574.00 | −138.11 |
| FCD | 12.85 | 823.13 | 602.66 | −124.57 |
| 2019 | 2018 | 2017 | 2016 | |
|---|---|---|---|---|
| Cash | 2969 | 4156 | 4508 | 5803 |
| Working capital requirement (WCR) | −49 | 46 | 213 | 1298 |
| Net fixed assets | 43,025 | 44,650 | 46,093 | 32,039 |
| IC | 45,945 | 48,852 | 50,814 | 39,140 |
| Debt | 0 | 0 | 0 | 0 |
| Provisions | 6638 | 9647 | 11,922 | 598 |
| Owner’s equity | 39,307 | 39,205 | 38,892 | 38,542 |
| EC | 45,945 | 48,852 | 50,814 | 39,140 |
| 2019 | 2018 | 2017 | 2016 | |
|---|---|---|---|---|
| EBIT | 328.60 | 474.96 | 352.00 | 282.00 |
| Effective Tax | 32% | −29% | −18% | −31% |
| EBIT × (1 − T) | 222.36 | 611.57 | 414.81 | 369.41 |
| Depreciation and Amortization | 1987.90 | 2114.92 | 1703.00 | 1603.00 |
| Δ CAPEX | −363.06 | −671.70 | −15,757.00 | 963.97 |
| Δ WCR | 94.82 | 166.88 | 1085.00 | −1194.03 |
| Δ Provisions | −3008.63 | −2275.02 | 11,324.00 | −71.20 |
| FCFF | −1066.61 | −53.35 | −1230.19 | 1671.15 |
| Net profit | 102.39 | 312.48 | 350.00 | 355.00 |
| Depreciation and Amortization | 1987.90 | 2114.92 | 1703.00 | 1603.00 |
| Δ CAPEX | −363.06 | −671.70 | −15,757.00 | 963.97 |
| Δ WCR | 94.82 | 166.88 | 1085.00 | −1194.03 |
| Δ Provisions | −3008.63 | −2275.02 | 11,324.00 | −71.20 |
| Δ Debt | 0.00 | 0.00 | 0.00 | 0.00 |
| FCFE | −1186.58 | −352.44 | −1295.00 | 1656.74 |
| Interests | 177.29 | 232.29 | 55.00 | 11.00 |
| Effective Tax | 32% | −29% | −18% | −31% |
| Interests × (1 − T) | 119.97 | 299.10 | 64.81 | 14.41 |
| Δ Debt | 0.00 | 0.00 | 0.00 | 0.00 |
| FCD | 120.29 | 298.81 | 64.64 | 14.10 |
| 2019 | 2018 | 2017 | 2016 | |
|---|---|---|---|---|
| Cash | 170 | 173 | 432 | 295 |
| Working capital requirement (WCR) | 838 | 701 | −70 | 604 |
| Net fixed assets | 6244 | 6794 | 3958 | 6438 |
| IC | 7252 | 7669 | 4320 | 7338 |
| Debt | 2722 | 3125 | 0 | 3039 |
| Provisions | 107 | 125 | 0 | 172 |
| Owner’s equity | 4422 | 4419 | 4320 | 4127 |
| EC | 7252 | 7669 | 4320 | 7338 |
| 2019 | 2018 | 2017 | 2016 | |
|---|---|---|---|---|
| EBIT | 97.02 | 227.17 | 690.00 | 3991.12 |
| Effective Tax | 0% | 31% | 8% | 2% |
| EBIT × (1 − T) | 97.02 | 156.86 | 635.62 | 3909.87 |
| Depreciation and Amortization | 550.85 | 541.00 | 528.00 | 447.00 |
| Δ CAPEX | 0.00 | −3377.47 | 1952.09 | −1468.07 |
| Δ WCR | −136.47 | −771.49 | 674.25 | −290.28 |
| Δ Provisions | −17.77 | 124.97 | −171.78 | −4.28 |
| FCFF | 493.63 | −3325.82 | 3618.25 | 2594.26 |
| Net profit | 3.37 | 100.13 | 560.00 | 3830.18 |
| Depreciation and Amortization | 550.85 | 541.00 | 528.00 | 447.00 |
| Δ CAPEX | 0.00 | −3377.47 | 1952.09 | −1468.07 |
| Δ WCR | −136.47 | −771.49 | 674.25 | −290.28 |
| Δ Provisions | −17.77 | 124.97 | −171.78 | −4.28 |
| Δ Debt | −402.49 | 3124.78 | −3039.00 | 1114.00 |
| FCFE | −2.51 | −258.08 | 503.56 | 3628.55 |
| Interests | 93.64 | 82.12 | 81.00 | 81.36 |
| Effective Tax | 0% | 31% | 8% | 2% |
| Interests × (1 − T) | 93.64 | 56.70 | 74.62 | 79.70 |
| Δ Debt | 402.49 | −3124.78 | 3039.00 | −1114.00 |
| FCD | 496.13 | −3068.08 | 3113.62 | −1034.30 |
Publisher’s Note: MDPI stays neutral with regard to jurisdictional claims in published maps and institutional affiliations. |
© 2021 by the authors. Licensee MDPI, Basel, Switzerland. This article is an open access article distributed under the terms and conditions of the Creative Commons Attribution (CC BY) license (https://creativecommons.org/licenses/by/4.0/).
Share and Cite
Kustra, A.; Lorenc, S. Financial Balance Analysis of Geothermal Companies in Poland Based on Managerial Cash Flows. Energies 2021, 14, 7885. https://doi.org/10.3390/en14237885
Kustra A, Lorenc S. Financial Balance Analysis of Geothermal Companies in Poland Based on Managerial Cash Flows. Energies. 2021; 14(23):7885. https://doi.org/10.3390/en14237885
Chicago/Turabian StyleKustra, Arkadiusz, and Sylwia Lorenc. 2021. "Financial Balance Analysis of Geothermal Companies in Poland Based on Managerial Cash Flows" Energies 14, no. 23: 7885. https://doi.org/10.3390/en14237885
APA StyleKustra, A., & Lorenc, S. (2021). Financial Balance Analysis of Geothermal Companies in Poland Based on Managerial Cash Flows. Energies, 14(23), 7885. https://doi.org/10.3390/en14237885