
An Electrochemical Platform for the Carbon Dioxide Capture and Conversion to Syngas


 ,
,  ,
,  ,
,  ,
, 

Abstract
:1. Introduction
2. Materials and Methods
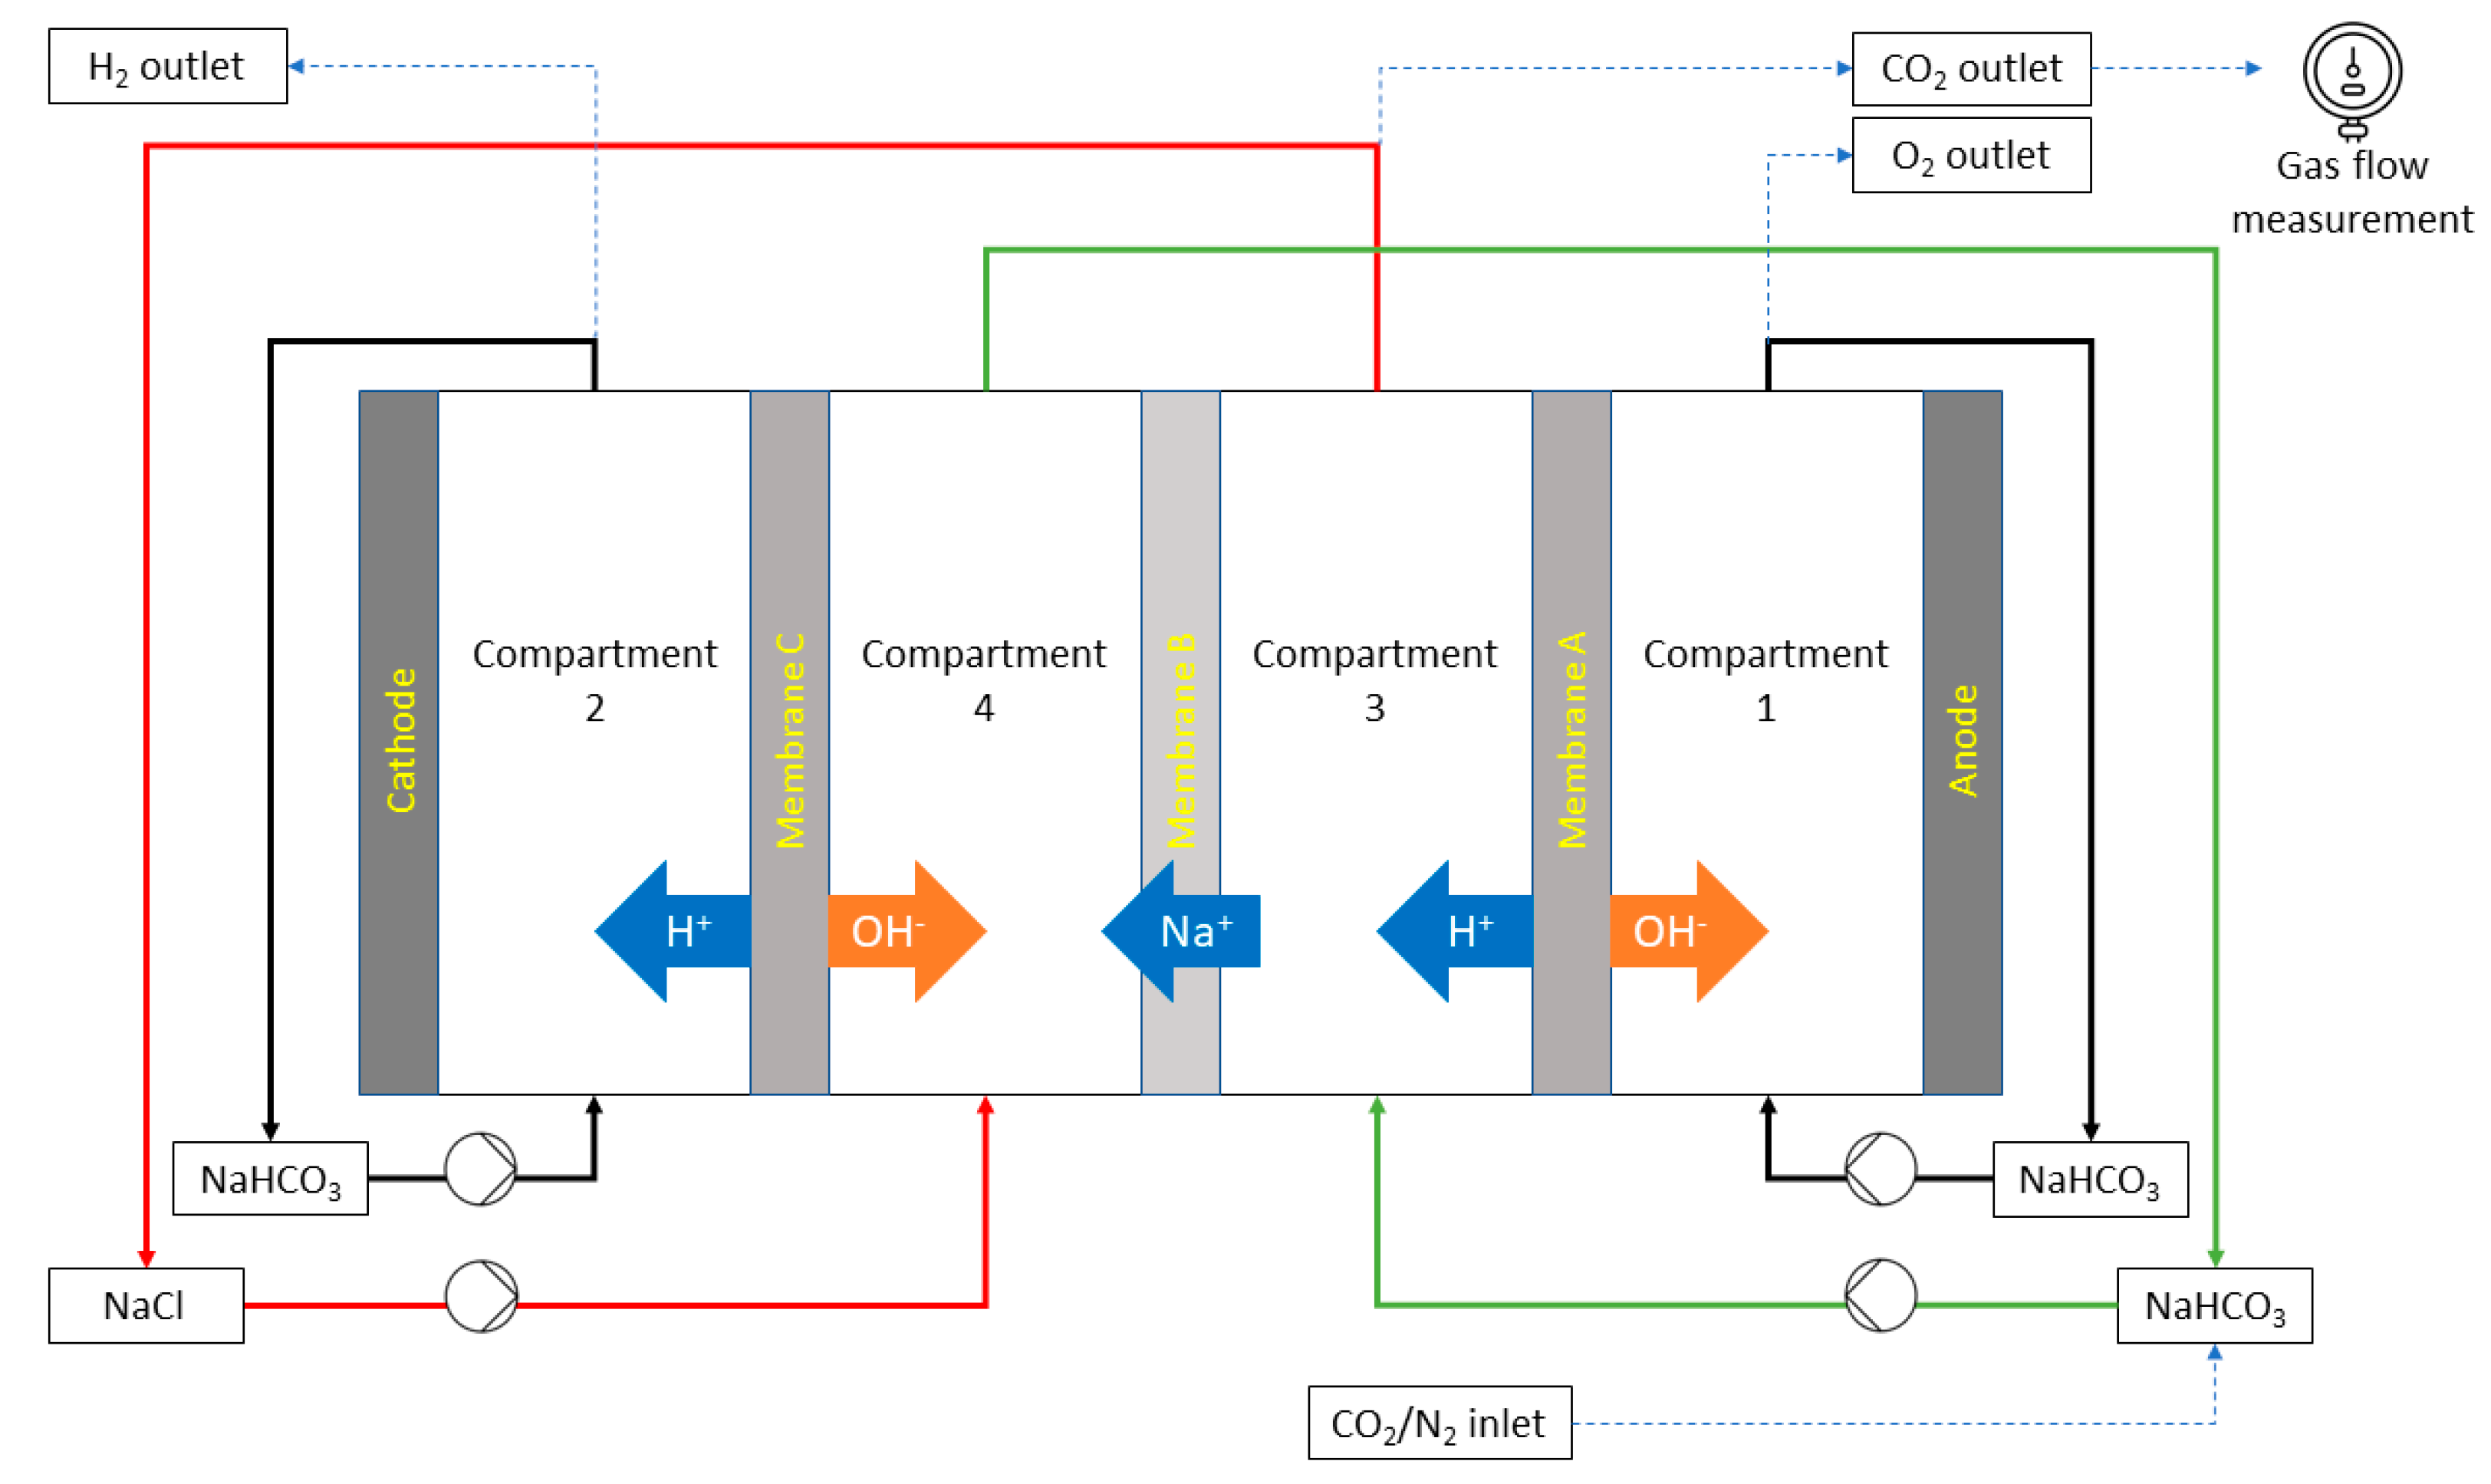
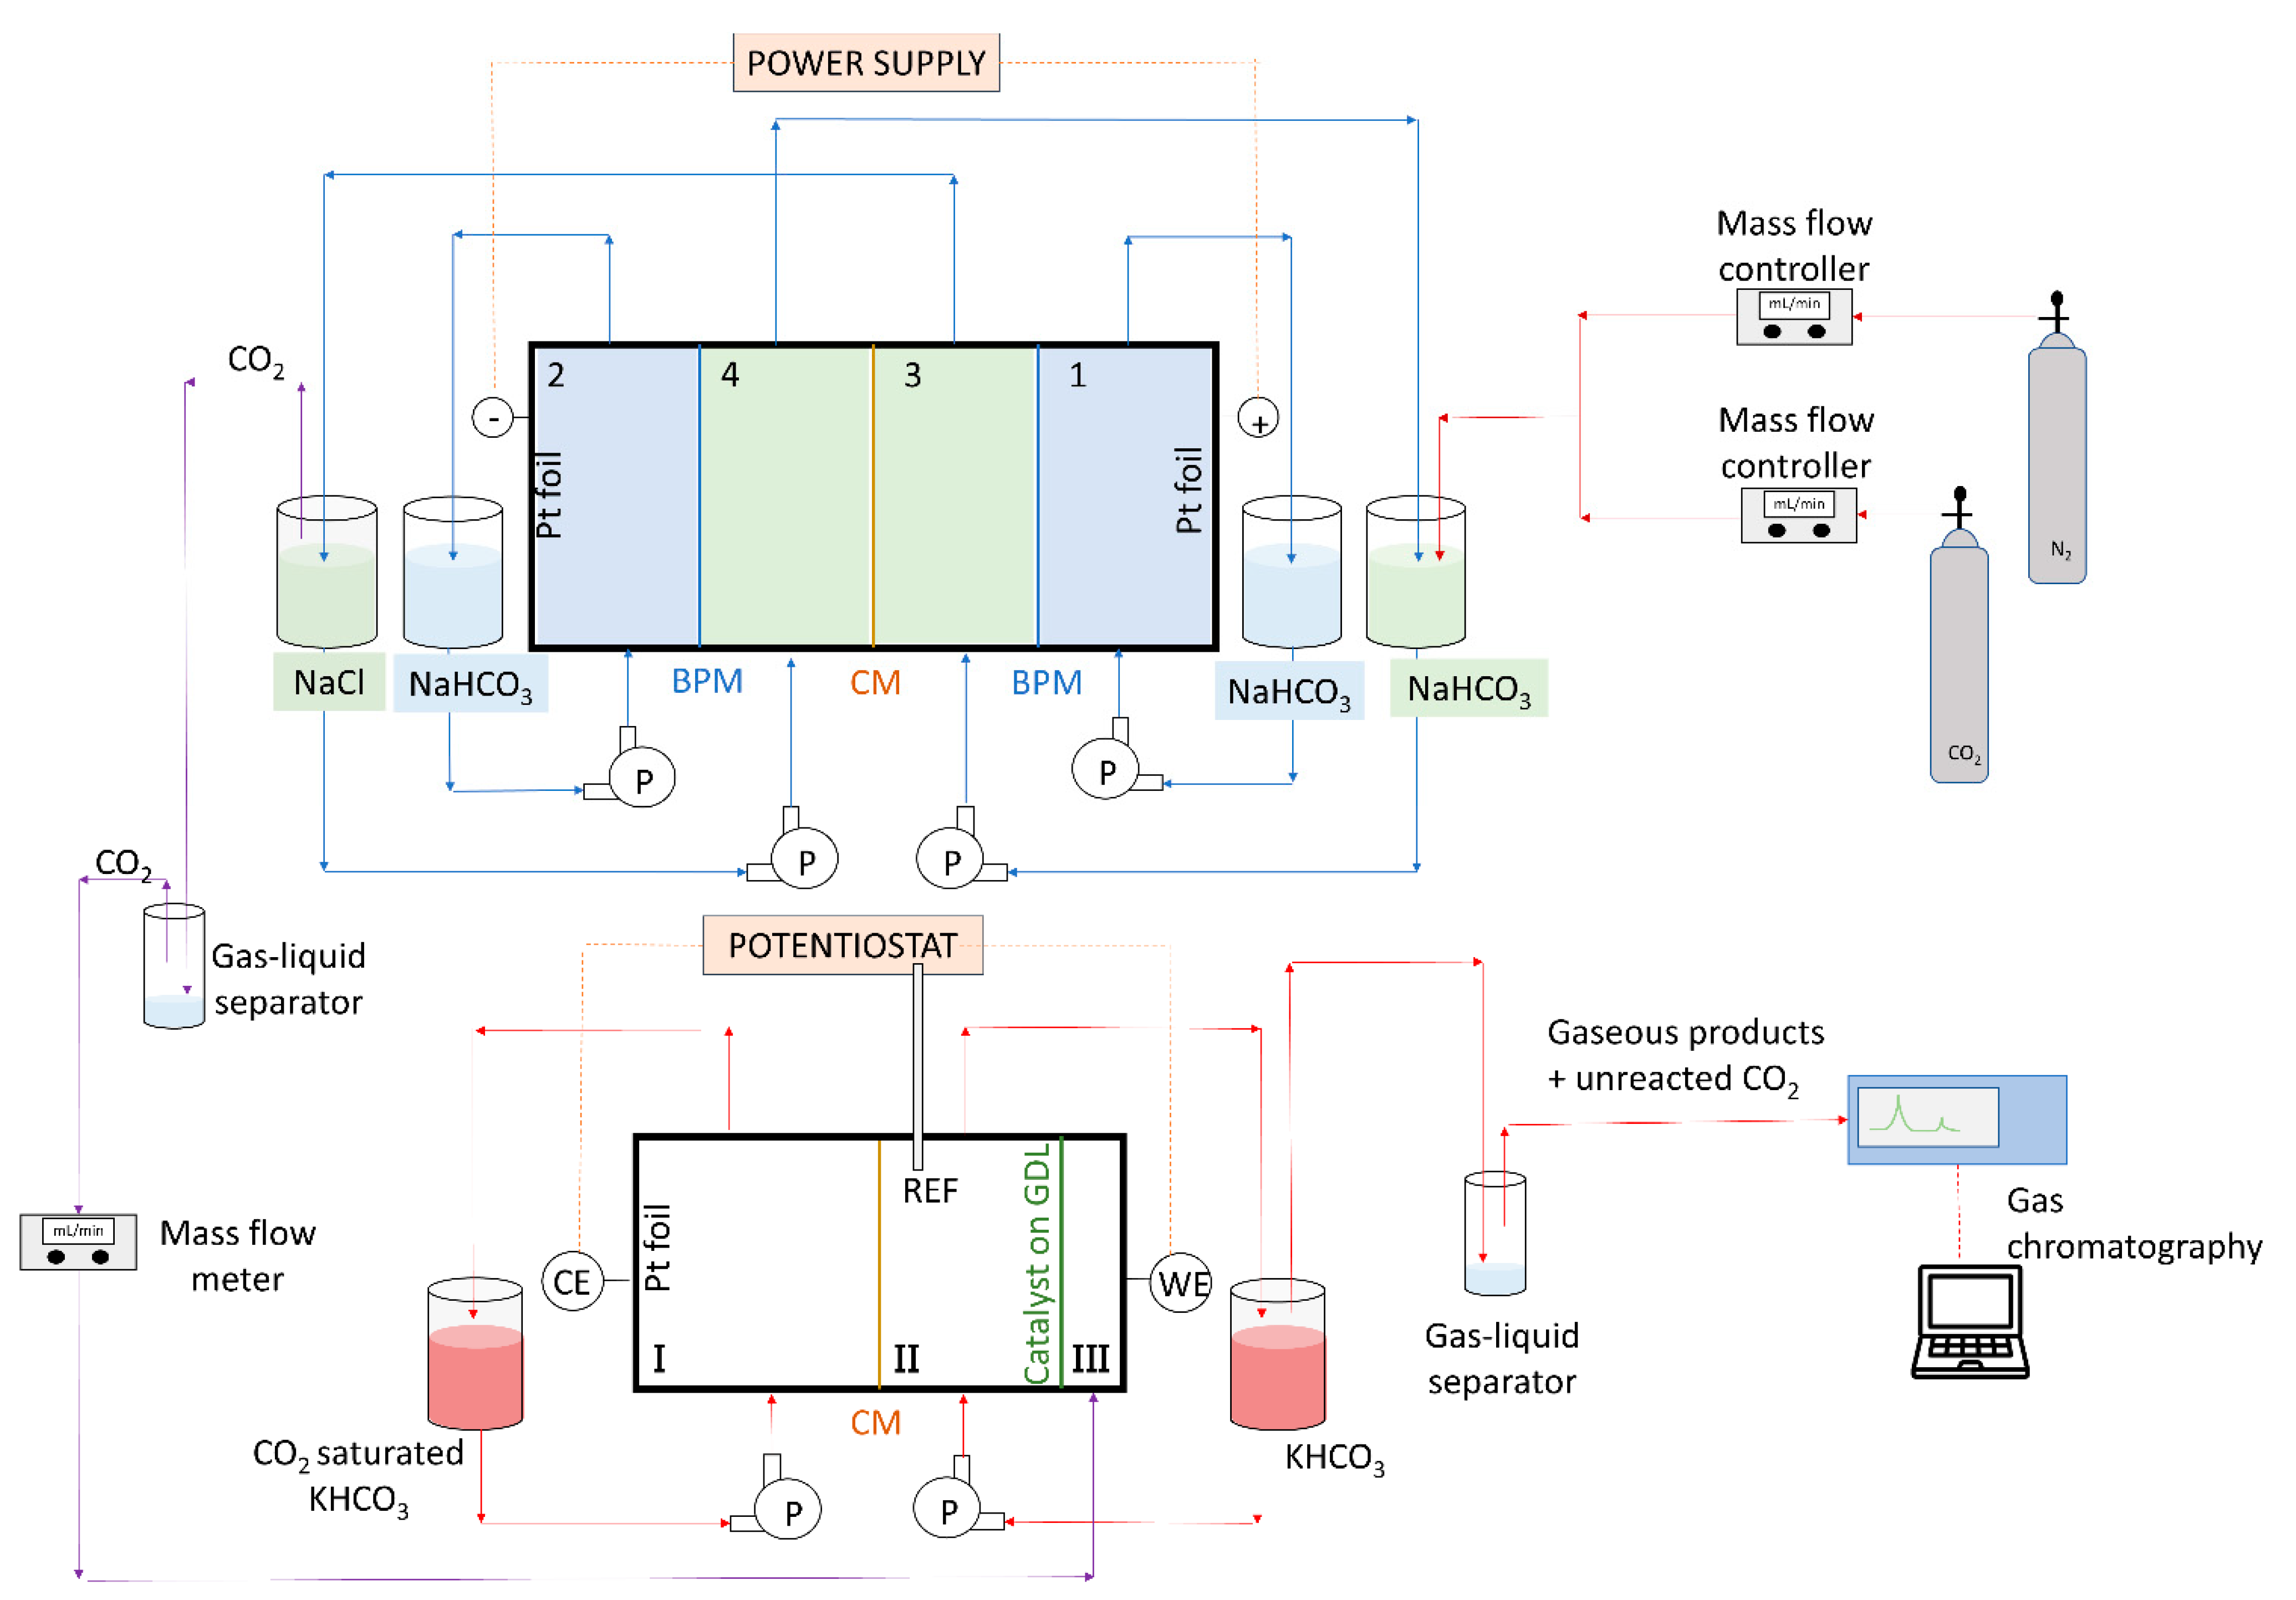
2.1. Capture and Release Module
2.2. Conversion Module
3. Results and Discussion
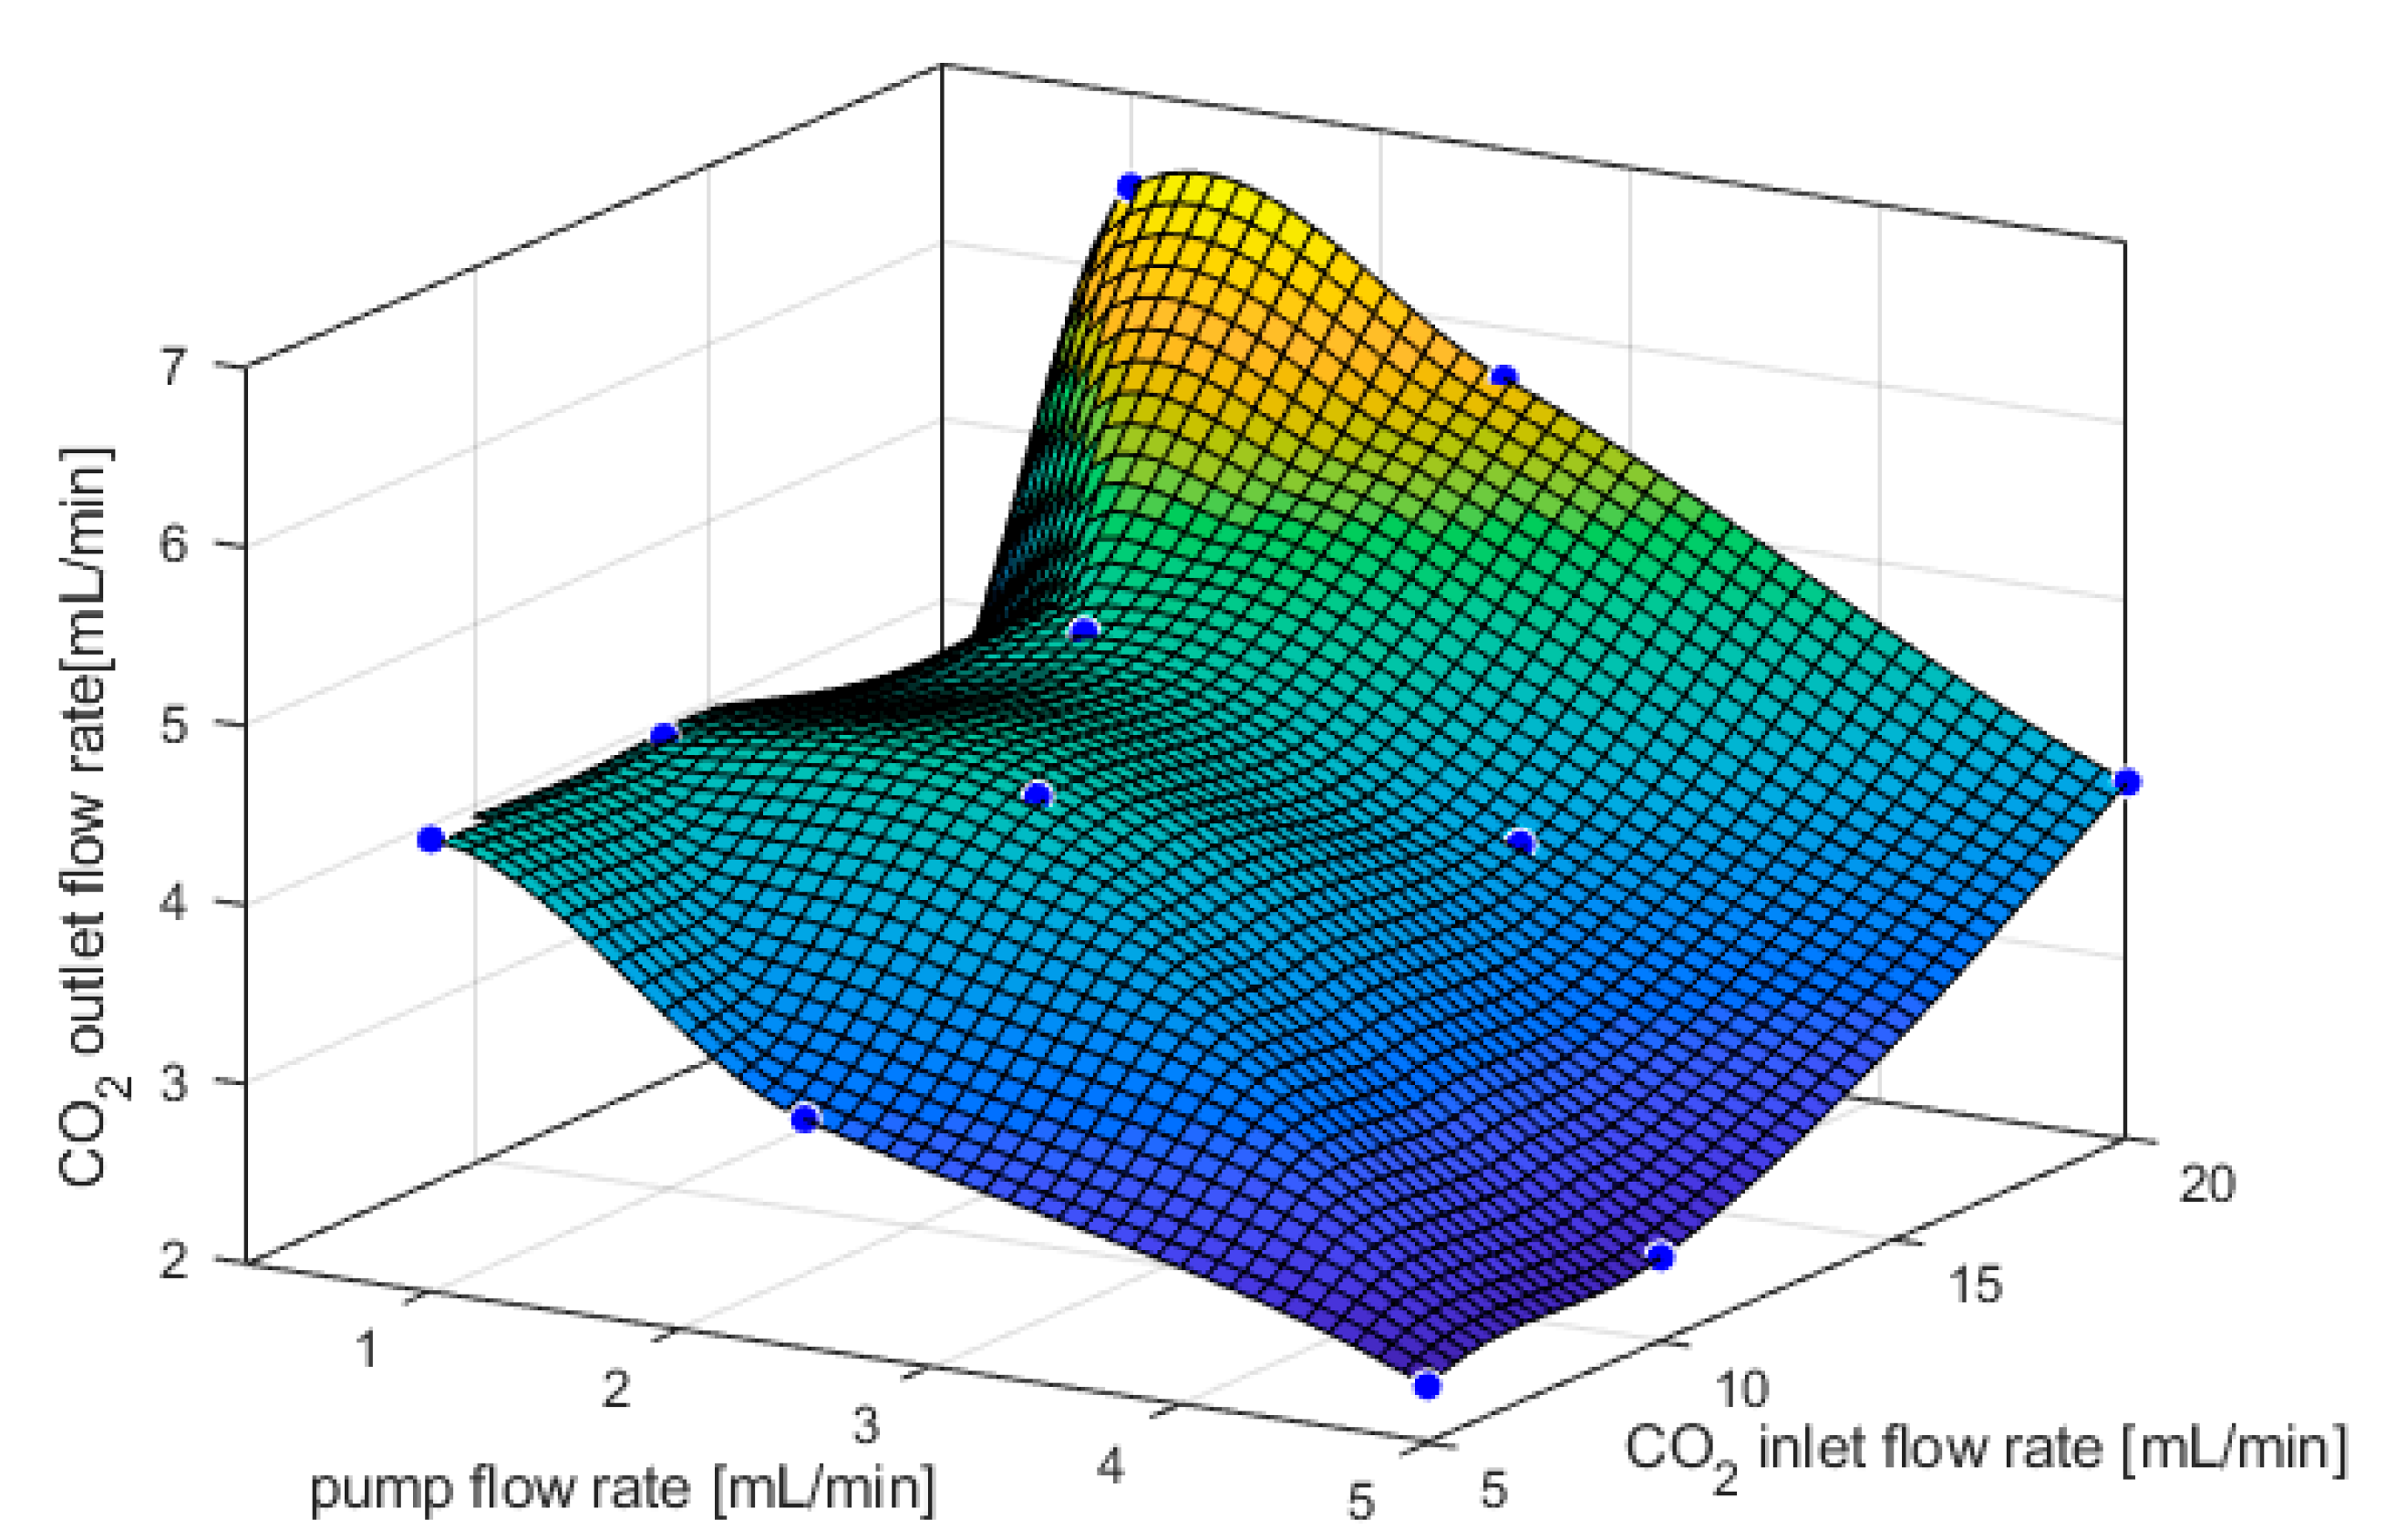
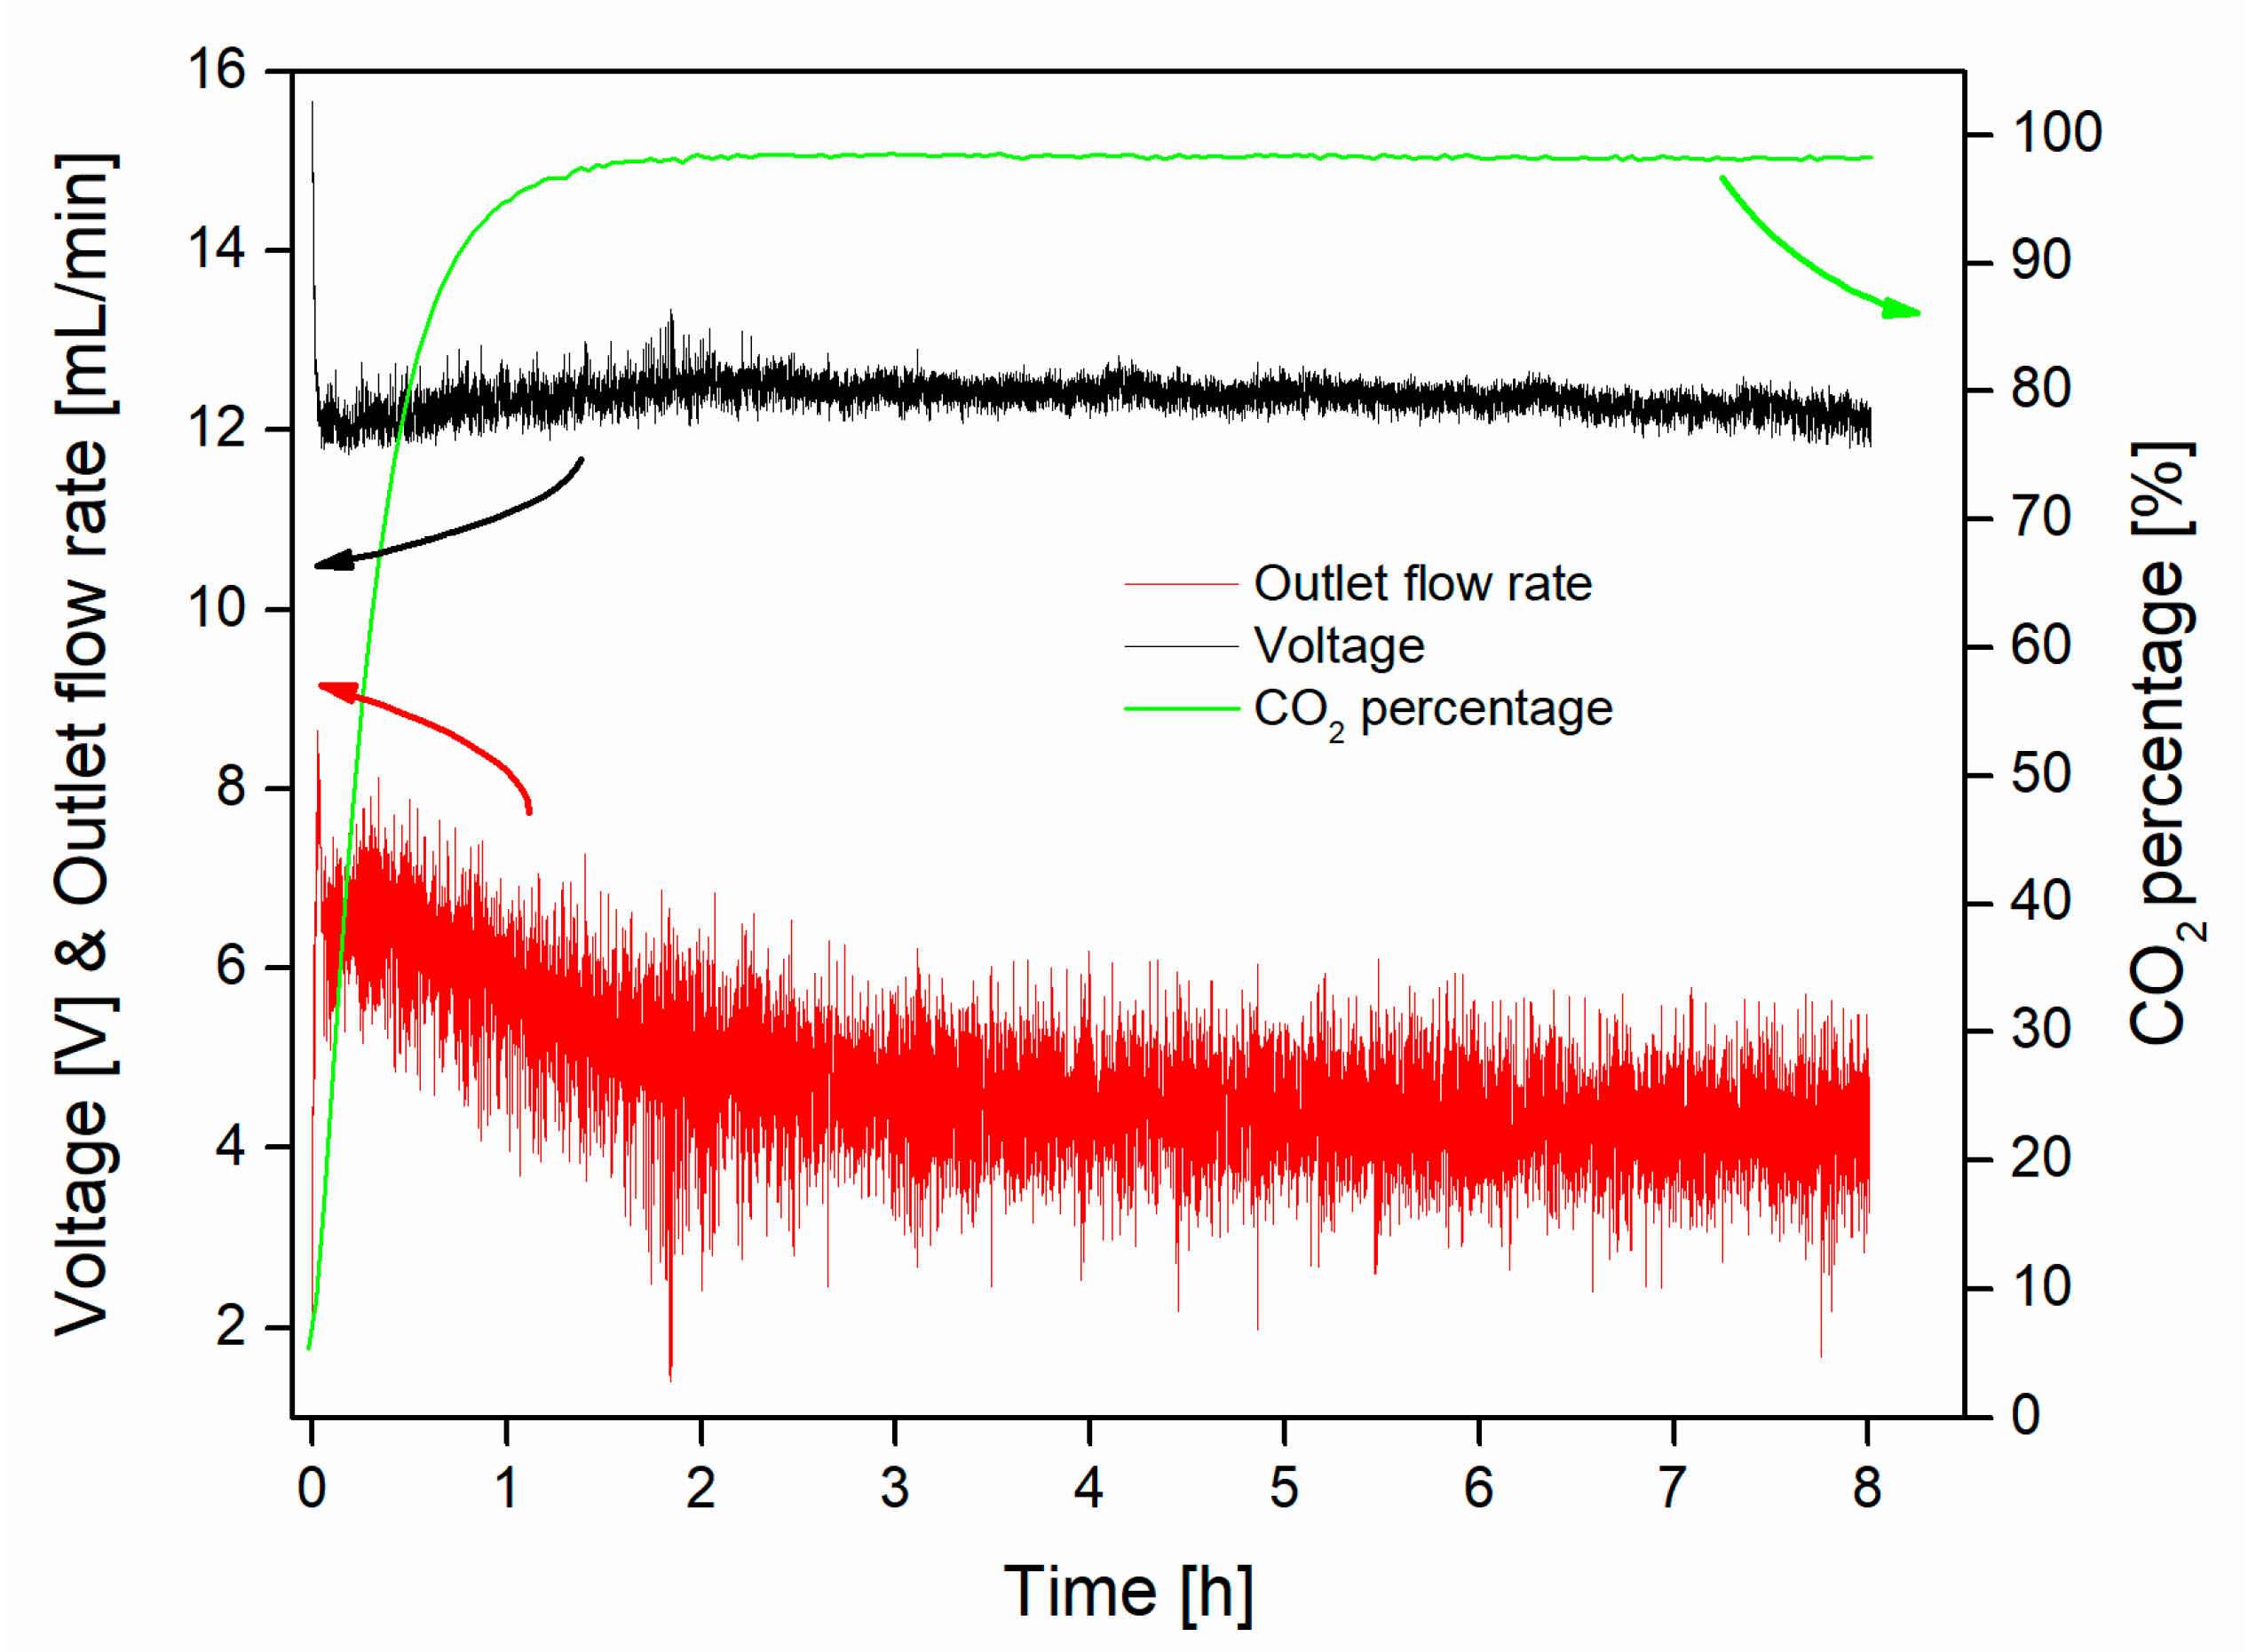
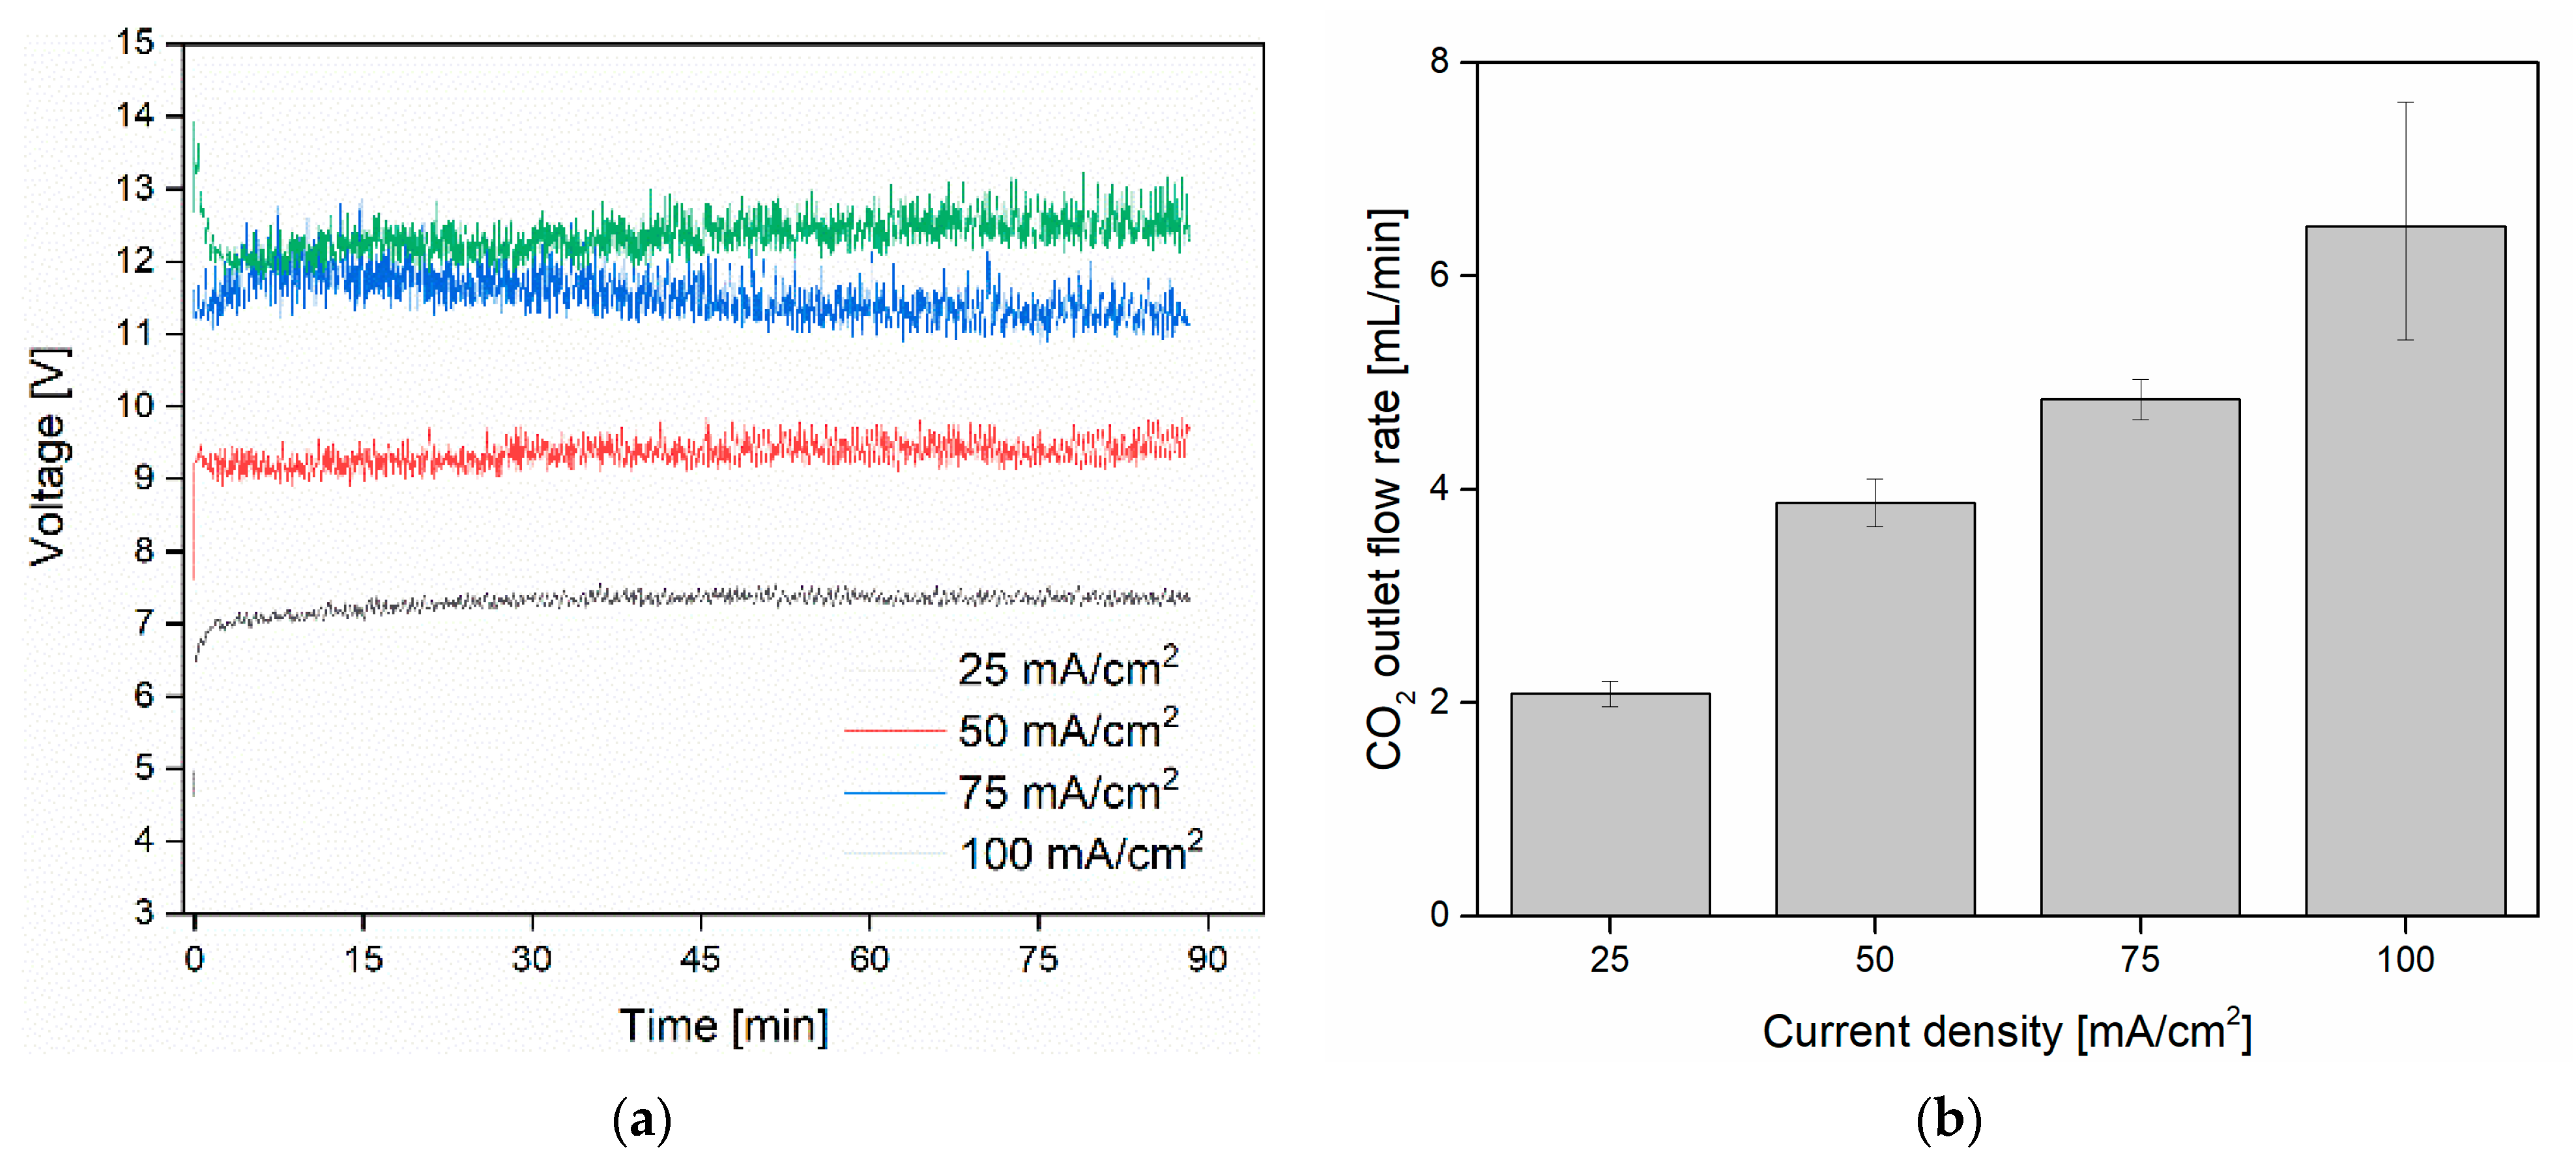
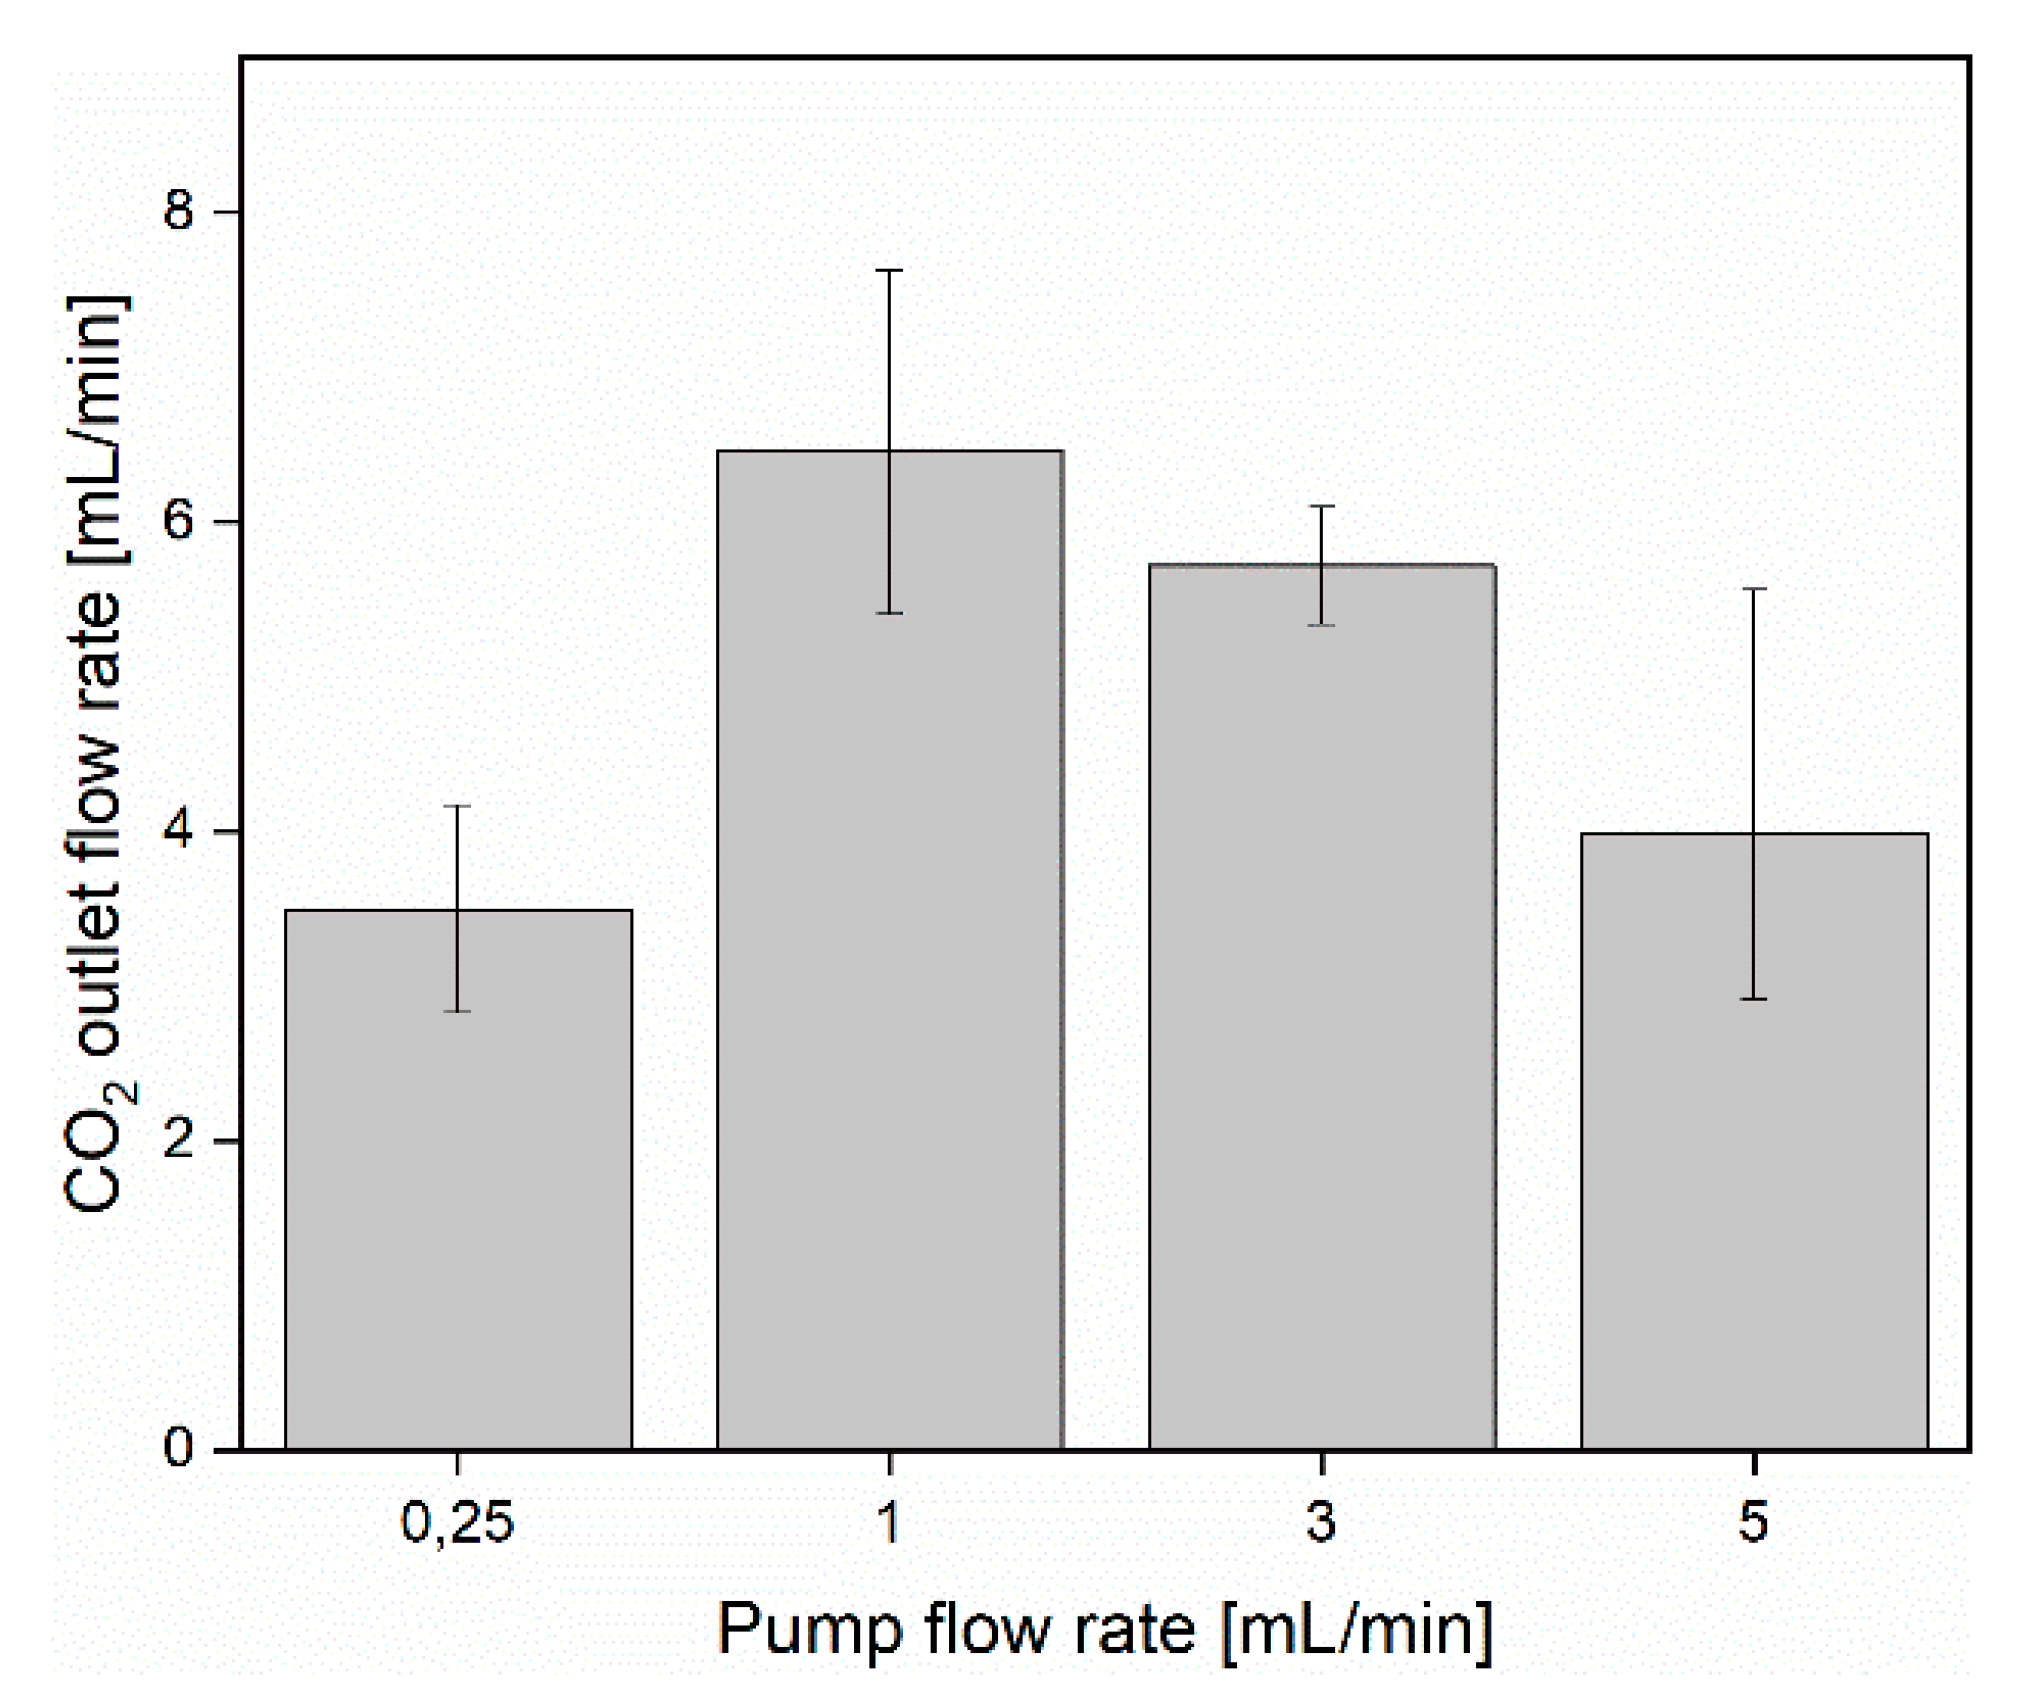
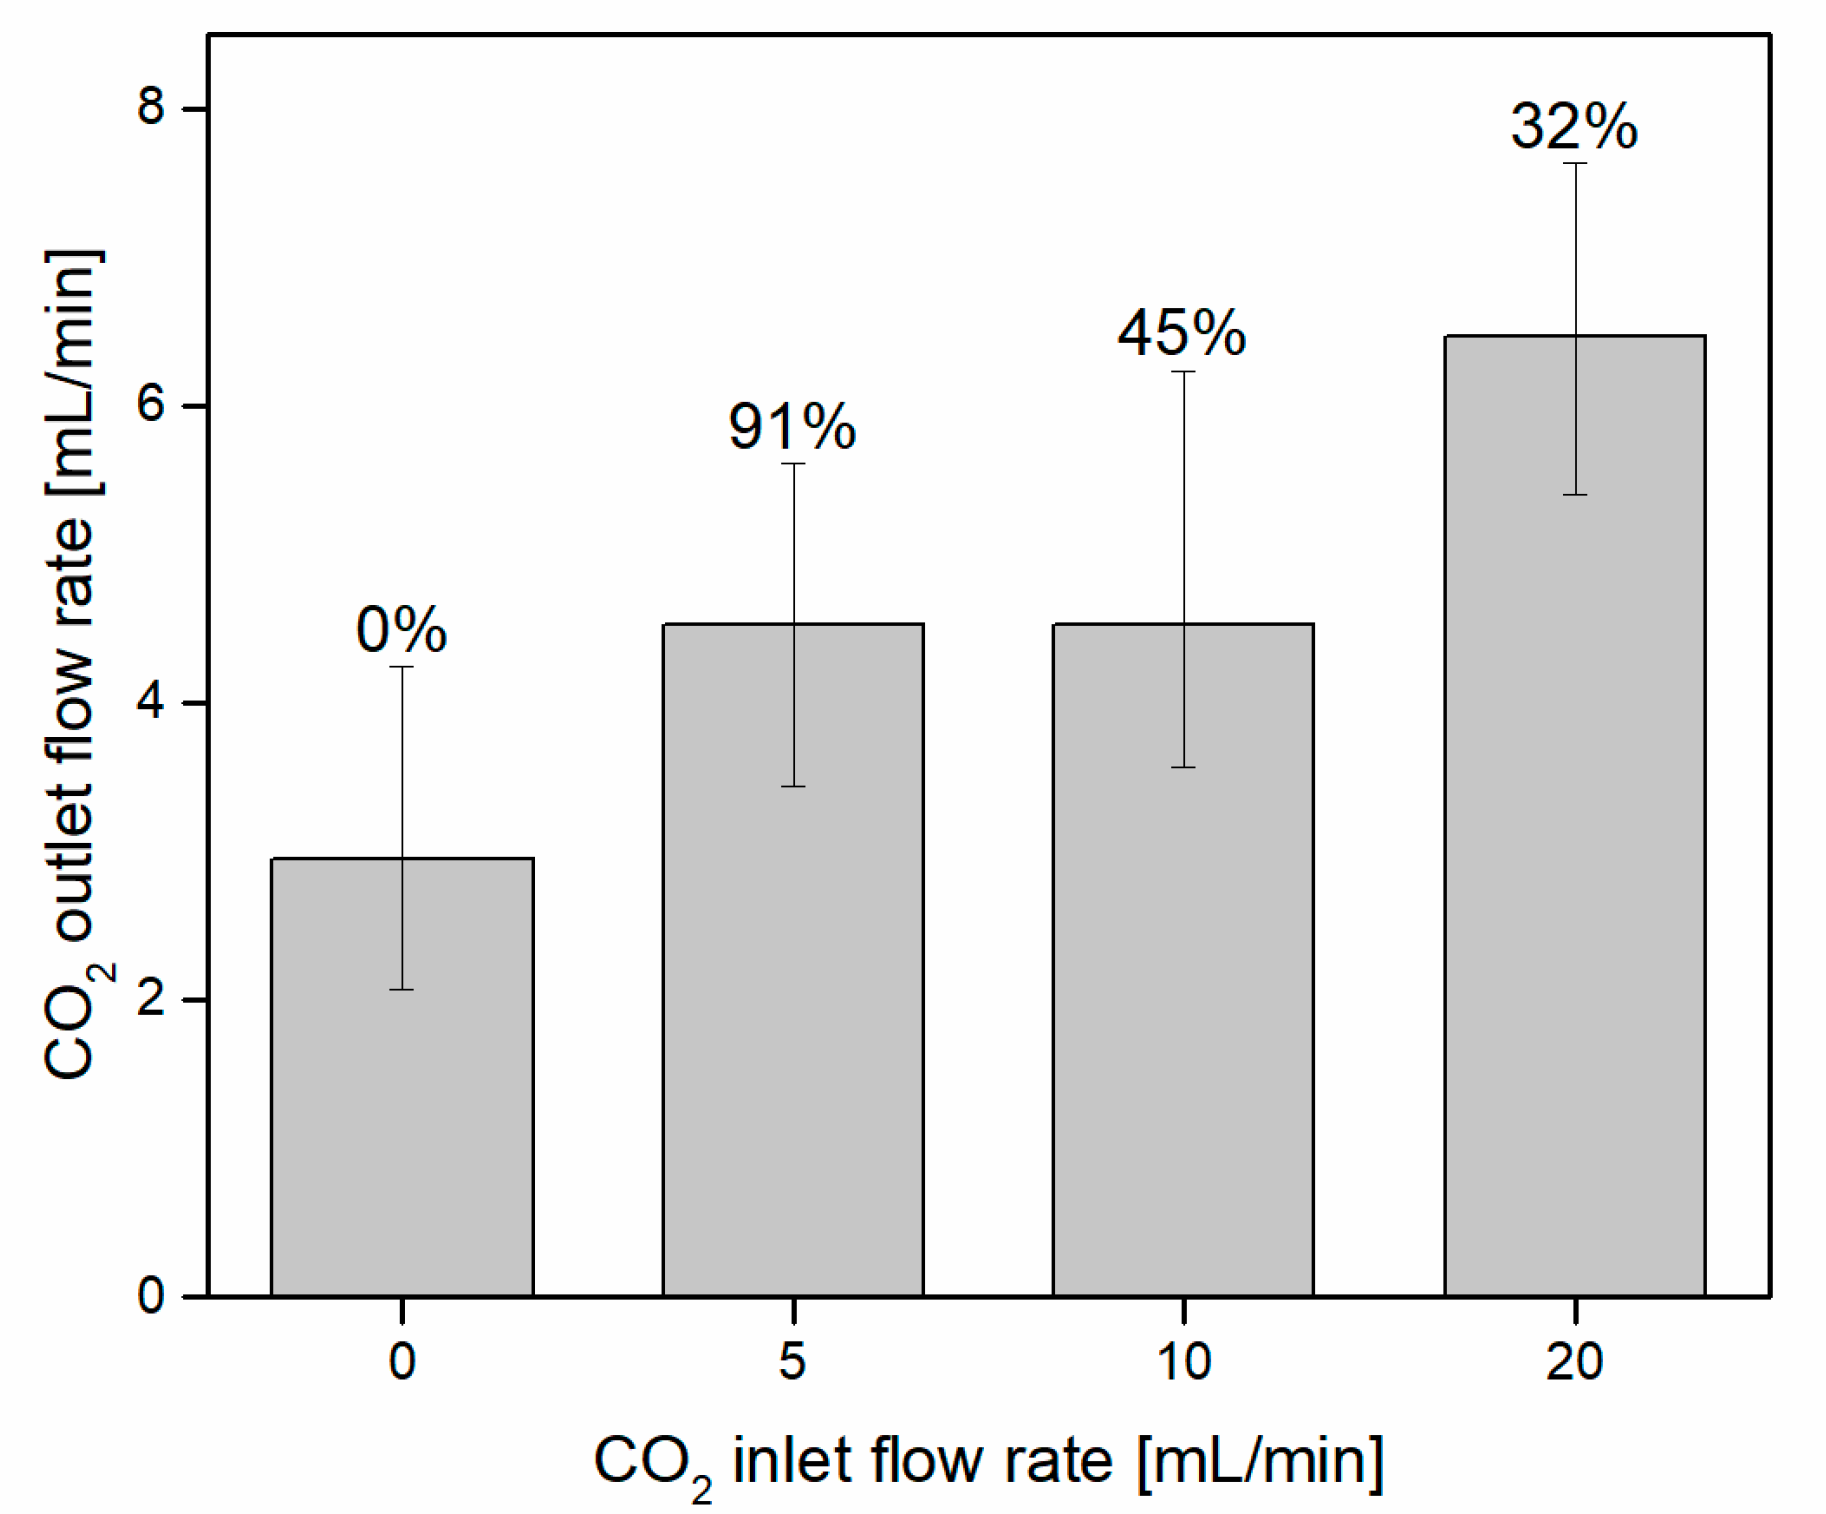
3.1. CO2 Capture and Release
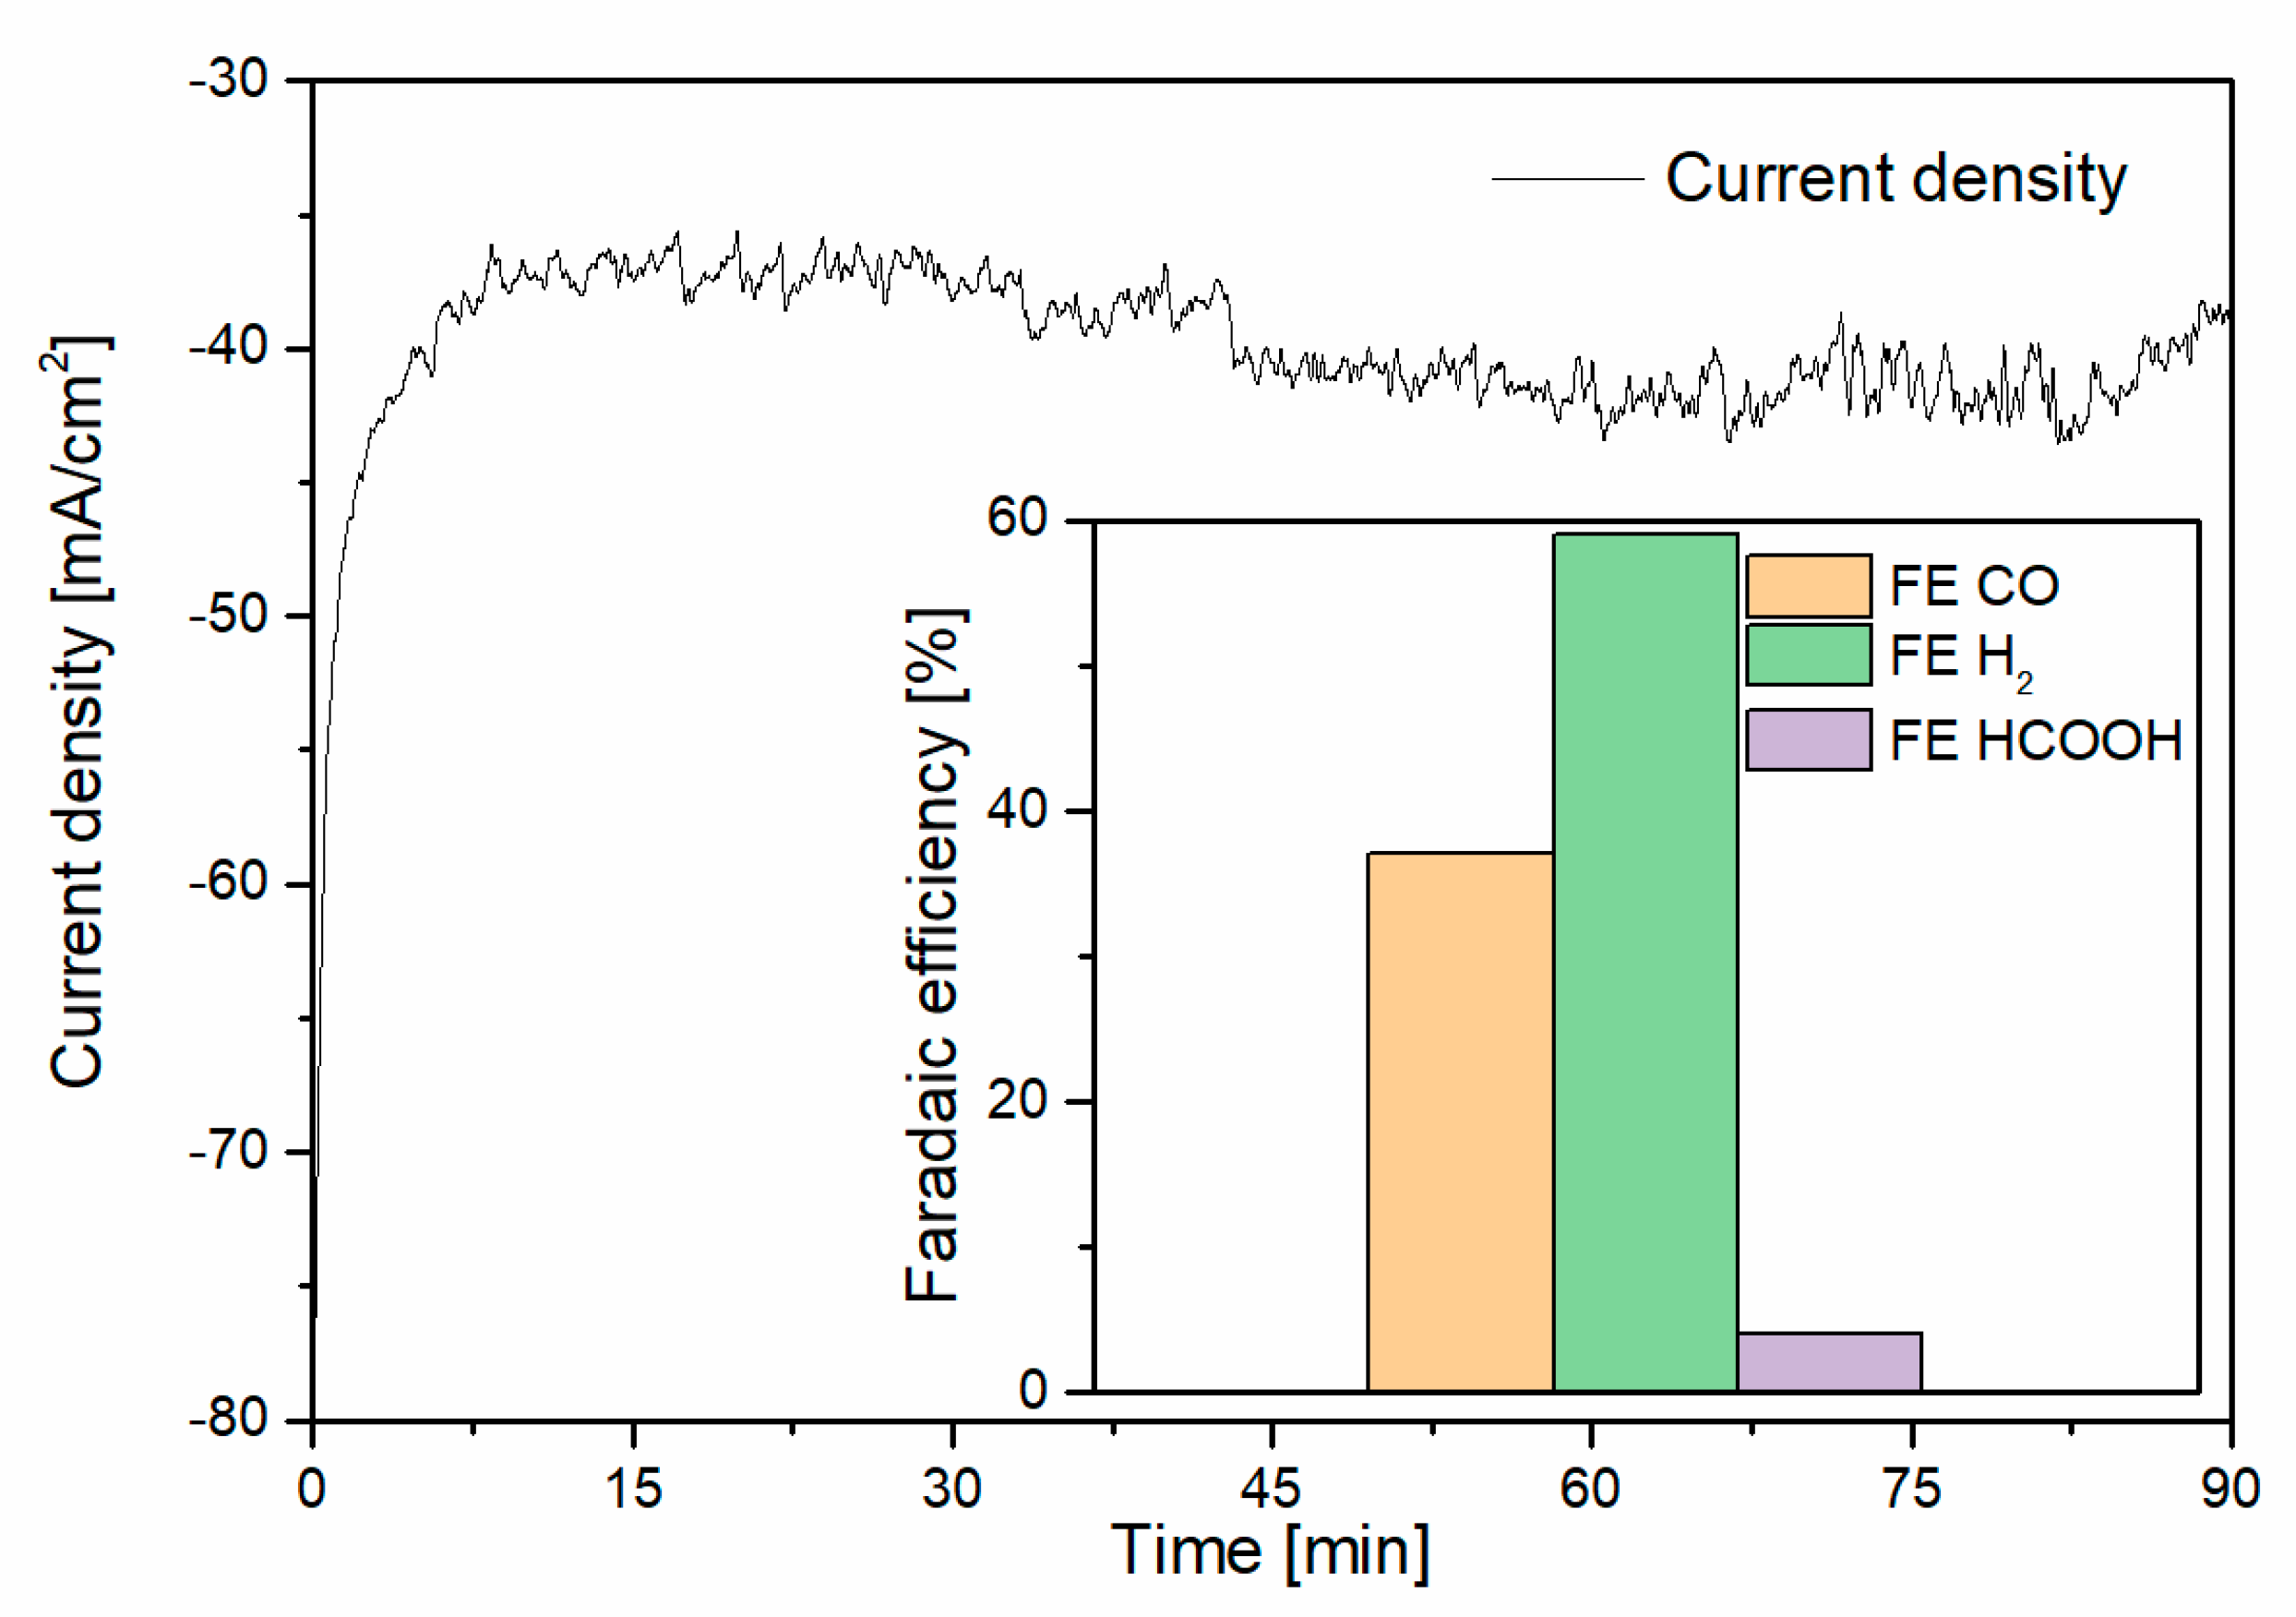
3.2. Capture–Conversion Coupling
4. Conclusions
Author Contributions
Funding
Data Availability Statement
Conflicts of Interest
References
- Gibbins, J.; Chalmers, H. Carbon capture and storage. Energy Policy 2008, 36, 4317–4322. [Google Scholar] [CrossRef] [Green Version]
- Pardal, T.; Messias, S.; Sousa, M.; Machado, A.S.R.; Rangel, C.M.; Nunes, D.; Pinto, J.V.; Martins, R.; da Ponte, M.N. Syngas production by electrochemical CO2 reduction in an ionic liquid based-electrolyte. J. CO2 Util. 2017, 18, 62–72. [Google Scholar] [CrossRef]
- Jung, J.; Jeong, Y.S.; Lim, Y.; Lee, C.S.; Han, C. Advanced CO2 Capture Process Using MEA Scrubbing: Configuration of a Split Flow and Phase Separation Heat Exchanger. Energy Proc. 2013, 37, 1778–1784. [Google Scholar] [CrossRef] [Green Version]
- Liu, M.; Asgar, H.; Seifert, S.; Gadikota, G. Novel aqueous amine looping approach for the direct capture, conversion and storage of CO2 to produce magnesium carbonate. Sustain. Energy Fuels 2020, 4, 1265–1275. [Google Scholar] [CrossRef]
- Liu, M.; Gadikota, G. Integrated CO2 Capture, Conversion, and Storage to Produce Calcium Carbonate Using an Amine Looping Strategy. Energy Fuels 2019, 33, 1722–1733. [Google Scholar] [CrossRef]
- Bhattacharya, M.; Sebghati, S.; VanderLinden, R.T.; Saouma, C.T. Toward Combined Carbon Capture and Recycling: Addition of an Amine Alters Product Selectivity from CO to Formic Acid in Manganese Catalyzed Reduction of CO2. J. Am. Chem. Soc. 2020, 142, 17589–17597. [Google Scholar] [CrossRef]
- Lombardo, L.; Ko, Y.; Zhao, K.; Yang, H.; Züttel, A. Direct CO2 Capture and Reduction to High-End Chemicals with Tetraalkylammonium Borohydrides. Angew. Chem. Int. Edit. 2021, 60, 9580–9589. [Google Scholar] [CrossRef]
- Wilkes, J.S. A short history of ionic liquids—from molten salts to neoteric solvents. Green Chem. 2002, 4, 73–80. [Google Scholar] [CrossRef]
- Kosaka, F.; Liu, Y.; Chen, S.-Y.; Mochizuki, T.; Takagi, H.; Urakawa, A.; Kuramoto, K. Enhanced Activity of Integrated CO2 Capture and Reduction to CH4 under Pressurized Conditions toward Atmospheric CO2 Utilization. ACS Sustain. Chem. Eng. 2021, 9, 3452–3463. [Google Scholar] [CrossRef]
- Duyar, M.S.; Treviño, M.A.A.; Farrauto, R.J. Dual function materials for CO2 capture and conversion using renewable H2. Appl. Catal. B Environ. 2015, 168–169, 370–376. [Google Scholar] [CrossRef]
- Ampelli, C.; Genovese, C.; Errahali, M.; Gatti, G.; Marchese, L.; Perathoner, S.; Centi, G. CO2 capture and reduction to liquid fuels in a novel electrochemical setup by using metal-doped conjugated microporous polymers. J. Appl. Electrochem. 2015, 45, 701–713. [Google Scholar] [CrossRef]
- Song, C.; Pan, W. Tri-reforming of methane: A novel concept for catalytic production of industrially useful synthesis gas with desired H2/CO ratios. Catal. Today 2004, 98, 463–484. [Google Scholar] [CrossRef]
- Nagasawa, H.; Yamasaki, A.; Iizuka, A.; Kumagai, K.; Yanagisawa, Y. A new recovery process of carbon dioxide from alkaline carbonate solution via electrodialysis. AIChE J. 2009, 55, 3286–3293. [Google Scholar] [CrossRef]
- Zeng, J.; Bejtka, K.; Di Martino, G.; Sacco, A.; Castellino, M.; Re Fiorentin, M.; Risplendi, F.; Farkhondehfal, M.A.; Hernández, S.; Cicero, G.; et al. Microwave-Assisted Synthesis of Copper-Based Electrocatalysts for Converting Carbon Dioxide to Tunable Syngas. ChemElectroChem 2020, 7, 229–238. [Google Scholar] [CrossRef] [Green Version]
- Zeng, J.; Rino, T.; Bejtka, K.; Castellino, M.; Sacco, A.; Farkhondehfal, M.A.; Chiodoni, A.; Drago, F.; Pirri, C.F. Coupled Copper–Zinc Catalysts for Electrochemical Reduction of Carbon Dioxide. ChemSusChem 2020, 13, 4128–4139. [Google Scholar] [CrossRef]
- Lourenço, M.A.O.; Zeng, J.; Jagdale, P.; Castellino, M.; Sacco, A.; Farkhondehfal, M.A.; Pirri, C.F. Biochar/Zinc Oxide Composites as Effective Catalysts for Electrochemical CO2 Reduction. ACS Sustain. Chem. Eng. 2021, 9, 5445–5453. [Google Scholar] [CrossRef]
- Jin, S.; Wu, M.; Gordon, R.G.; Aziz, M.J.; Kwabi, D.G. pH swing cycle for CO2 capture electrochemically driven through proton-coupled electron transfer. Energy Environ. Sci. 2020, 13, 3706–3722. [Google Scholar] [CrossRef]
- Iizuka, A.; Hashimoto, K.; Nagasawa, H.; Kumagai, K.; Yanagisawa, Y.; Yamasaki, A. Carbon dioxide recovery from carbonate solutions using bipolar membrane electrodialysis. Sep. Purif. Technol. 2012, 101, 49–59. [Google Scholar] [CrossRef]
- Feng, S.; Yang, G.; Zheng, D.; Wang, L.; Wang, W.; Wu, Z.; Liu, F. A dual-electrolyte aluminum/air microfluidic cell with enhanced voltage, power density and electrolyte utilization via a novel composite membrane. J. Power Sources 2020, 478, 228960. [Google Scholar] [CrossRef]
- Ma, X.; Zhang, H.; Sun, C.; Zou, Y.; Zhang, T. An optimal strategy of electrolyte flow rate for vanadium redox flow battery. J. Power Sources 2012, 203, 153–158. [Google Scholar] [CrossRef]
- Chae, H.J.; Kim, J.-H.; Lee, S.C.; Kim, H.-S.; Jo, S.B.; Ryu, J.-H.; Kim, T.Y.; Lee, C.H.; Kim, S.J.; Kang, S.-H.; et al. Catalytic Technologies for CO Hydrogenation for the Production of Light Hydrocarbons and Middle Distillates. Catalysts 2020, 10, 99. [Google Scholar] [CrossRef] [Green Version]


Publisher’s Note: MDPI stays neutral with regard to jurisdictional claims in published maps and institutional affiliations. |
© 2021 by the authors. Licensee MDPI, Basel, Switzerland. This article is an open access article distributed under the terms and conditions of the Creative Commons Attribution (CC BY) license (https://creativecommons.org/licenses/by/4.0/).
Share and Cite
Mezza, A.; Pettigiani, A.; Monti, N.B.D.; Bocchini, S.; Farkhondehfal, M.A.; Zeng, J.; Chiodoni, A.; Pirri, C.F.; Sacco, A. An Electrochemical Platform for the Carbon Dioxide Capture and Conversion to Syngas. Energies 2021, 14, 7869. https://doi.org/10.3390/en14237869
Mezza A, Pettigiani A, Monti NBD, Bocchini S, Farkhondehfal MA, Zeng J, Chiodoni A, Pirri CF, Sacco A. An Electrochemical Platform for the Carbon Dioxide Capture and Conversion to Syngas. Energies. 2021; 14(23):7869. https://doi.org/10.3390/en14237869
Chicago/Turabian StyleMezza, Alessio, Angelo Pettigiani, Nicolò B. D. Monti, Sergio Bocchini, M. Amin Farkhondehfal, Juqin Zeng, Angelica Chiodoni, Candido F. Pirri, and Adriano Sacco. 2021. "An Electrochemical Platform for the Carbon Dioxide Capture and Conversion to Syngas" Energies 14, no. 23: 7869. https://doi.org/10.3390/en14237869
APA StyleMezza, A., Pettigiani, A., Monti, N. B. D., Bocchini, S., Farkhondehfal, M. A., Zeng, J., Chiodoni, A., Pirri, C. F., & Sacco, A. (2021). An Electrochemical Platform for the Carbon Dioxide Capture and Conversion to Syngas. Energies, 14(23), 7869. https://doi.org/10.3390/en14237869