Article

The Role of BECCS in Achieving Climate Neutrality in the European Union

1
National Centre for Emissions Management (KOBiZE), Chmielna 132/134, 00-805 Warsaw, Poland
2
Institute of Environmental Protection—National Research Institute (IEP-NRI), Krucza 5/11D, 00-548 Warsaw, Poland
*
Authors to whom correspondence should be addressed.
Energies 2021, 14(23), 7842; https://doi.org/10.3390/en14237842
Submission received: 8 October 2021 / Revised: 16 November 2021 / Accepted: 19 November 2021 / Published: 23 November 2021
(This article belongs to the Special Issue Energy Systems Analysis and Modelling towards Decarbonisation)

Abstract

:
The achievement of climate neutrality in the European Union by 2050 will not be possible solely through a reduction in fossil fuels and the development of energy generation from renewable sources. Large-scale implementation of various technologies is necessary, including bioenergy with carbon capture and storage (BECCS), carbon capture and storage (CCS), and carbon capture and utilisation (CCU), as well as industrial electrification, the use of hydrogen, the expansion of electromobility, low-emission agricultural practices, and afforestation. This research is devoted to an analysis of BECCS as a negative emissions technology (NET) and the assessment of its implementation impact upon the possibility of achieving climate neutrality in the EU. The modelling approach utilises tools developed within the LIFE Climate CAKE PL project and includes the MEESA energy model and the d-PLACE CGE economic model. This article identifies the scope of the required investment in generation capacity and the amount of electricity production from BECCS necessary to meet the greenhouse gas (GHG) emission reduction targets in the EU, examining the technology’s impact on the overall system costs and marginal abatement costs (MACs). The modelling results confirm the key role of BECCS technology in achieving EU climate goals by 2050.

1. Introduction

The new 55% net greenhouse gas emission reduction target [1] and the Fit for 55 package [2] are key elements of the European Green Deal strategy [3]. This set of policy initiatives presents a milestone towards the vision of making Europe a climate-neutral continent by 2050, in line with the Paris Agreement (aiming to limit global warming to below 2 °C and preferably keep it at 1.5 °C), while at the same time increasing the competitiveness of European industry and aiming to ensure a just transition [4] for the affected regions.
Achieving this goal will require substantial efforts [5,6,7,8], including the application of new reduction technologies [9,10,11] that are currently in the early stages of technological development [12,13]. One such technology is bioenergy with carbon capture and storage (BECCS) [14,15,16], which is classified as a negative emission technology (NET) [17,18]. NETs are geo-engineering methods of removing greenhouse gases from the atmosphere and mitigating the impact of the energy system on global warming [19].
One of the main advantages of BECCS is the ability to generate negative greenhouse gas emissions [20,21] due to CO2 removal and injection into geological formations or utilisation in industrial processes. The fuel in this process is the biomass, which absorbs CO2 from the atmosphere in the process of photosynthesis. The CO2 emitted during combustion is then captured. Negative emissions from this technology can compensate for emissions in areas where total reduction is impossible, such as agriculture and industry. The cost optimisation results obtained by [22] indicate the high competitiveness of BECCS technology in view of the high prices of CO2 emission allowances.
BECCS appears in many climate stabilisation scenarios and is envisaged as a feature of the energy sector [23]. The IPCC Special Report [24] presents BECCS in three of four illustrative pathways as essential for the achievement of mitigation targets. The need to use BECCS is emerging in numerous research centres across the globe dealing with energy modelling [25,26,27,28,29,30,31]. Climate scenarios that keep global warming within the Paris Agreement limits rely on large-scale application of technologies that can remove CO2 from the atmosphere in large volumes. This is necessary to compensate for the insufficiency of currently planned mitigation measures, which could lead to cumulative emissions of GHG overshooting the levels set by the EU climate legislation [32].
As part of the “Clean Planet for All” initiative, the European Commission (EC) published an in-depth analysis to support the long-term strategic vision of the economy [33]. This analysis shows reduction potentials of ca. 275 Mt CO2 bioenergy with carbon capture, utilisation, and storage (BECCUS) and 178 Mt CO2 for BECCS in the 1.5TECH scenario in the EU-28 by 2050. Scenarios ENTSO-E and ENTSO-G in the TYNDP 2020 report [34] calculate cumulative absorption by BECCS by 2050 within the EU-28 at the level of 808 Mt CO2 in the Global Ambition scenario. BECCS in the energy sector is also an important part of all of the Climate Change Committee (CCC)’s Net-Zero scenarios, contributing to annual negative emissions in the range of 16–39 Mt CO2 for the United Kingdom by 2050 [35] or even 51 Mt CO2 of removal in the Further Ambition scenario by the same year [36]. Thus, the understanding of the feasibility of large-scale BECCS technology deployment in the EU, alongside deeper research of its possibilities, required conditions, and potential limitations, is important.
This article elaborates on selected research results obtained within the LIFE Climate CAKE PL project [37], focusing on BECCS technology’s implementation and its role in the achievement of climate neutrality in the EU. The study examines the technical, economical, and environmental feasibility of BECCS and focuses on the application of this technology for the generation of electricity and district heat by power plants and combined heat and power (CHP) installations. It identifies barriers and indicates technological solutions in individual sectors of the economy that are influenced by the EU’s energy and climate policy.
The article is divided into seven sections. Section 2 is devoted to a brief description of the analysed technology and its competitiveness; Section 3 focusses on the methods and materials used within the research; Section 4 provides in-depth modelling assumptions; Section 5 presents the research results; Section 6 discusses the results obtained, based on a comparison with other research, and aims to understand its advantages and drawbacks, as well as to define the peculiarities of the analysed technology’s potential implementation on a large scale. Finally, Section 7 presents the research conclusions and limitations.

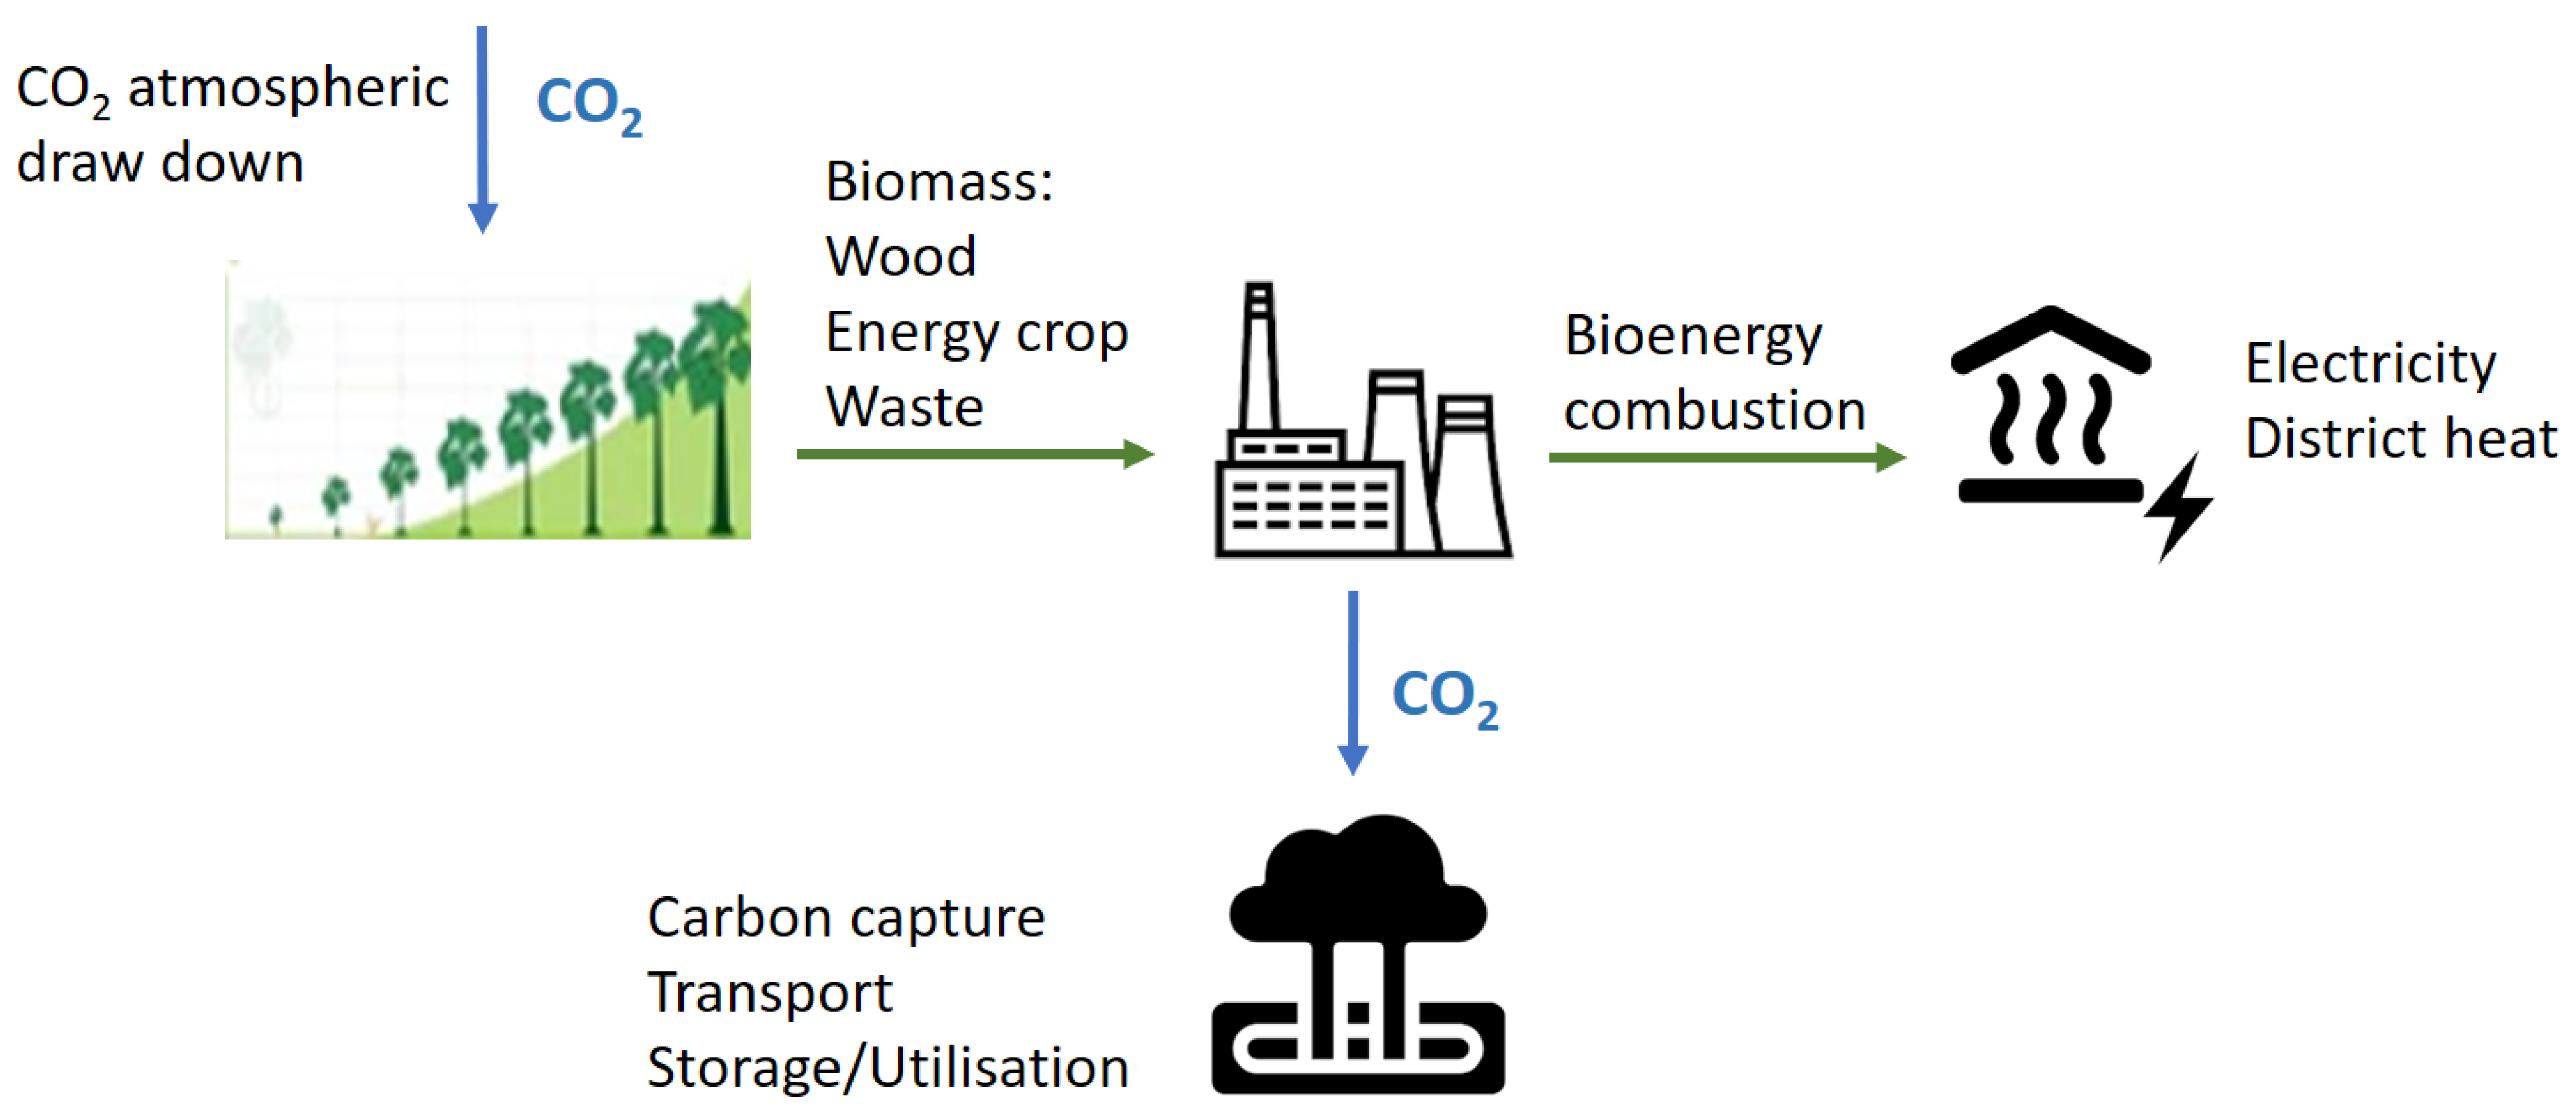
2. BECCS: The Technology and Factors of Its Competitiveness

BECCS is a technology that uses biomass (mainly wood and agricultural biomass, including energy crops) as fuel, equipped with a CCS installation that captures the carbon dioxide generated during the conversion to energy. Sequestrated CO2 is then stored in geological formations or used to produce certain by products through CCU processes. The concept of BECCS became known in 1996 through the work of Robert H. Williams [38]. He assumed that biomass, combined with CCS, would remove carbon dioxide from the atmosphere, and, based on this finding, the concept of negative emissions was born [39]. Since then, BECCS has captured the attention of decision makers [40].
This technology operates within the following algorithm: At the first stage of the BECCS chain, CO2 is absorbed from the atmosphere within the photosynthesis process, occurring during plant growth. It is then combusted in power plants equipped with technologies that capture the CO2, thus preventing gas from being released into the atmosphere. The captured CO2 is then injected into deep geological formations. The CO2 is thus transferred from the atmosphere, if the emissions linked with supplying the biomass and capturing the CO2 do not exceed the amount removed from the air via photosynthesis. Therefore, by delivering net-negative emissions, BECCS compensates for any increases in GHG emissions caused by delays in the implementation of climate policy, especially in sectors where GHG reduction is difficult because of technical limitations [41]. The full schematic of the process is shown in Figure 1.
The conversion of land for bioenergy production purposes may cause greenhouse gas emissions, which should be added to the supply chain emissions. The emissions can be direct, which refer to the change in total carbon stock present in the vegetation and soil of converted land, and indirect, which occur when the previous activity on land that is converted to bioenergy purposes moves to a different location and causes land use change and, therefore, emissions elsewhere [41].
Technology seems to be promising in light of the ambitious reduction targets. Next to afforestation and direct air capture with carbon storage (DACCS), it could be the main way of enabling negative CO2 emissions, which are highly desirable when full carbon neutrality cannot be achieved in other sectors. Region-specific challenges may impact the technical possibility and efficiency of potential large-scale BECCS installations, including water availability and fertiliser needs.
The aforementioned factors are driving the growing interest from decision makers and investors. This raises the question of the technical potential of this technology and the existing limitations. The high uncertainty is primarily related to the limitations of the CO2 storage potential, resulting from both technical and geological conditions and possible local social opposition, as well as others, such as biomass availability, conflict with food security and biodiversity goals, costs and financing options, competition for land, fertilisers, and water.
The economic effectiveness of BECCS depends on assumptions related to the type of biomass, the cost of transport, the technology solutions applied, and the fossil fuel emissions offset in the energy system. There are many types of biomass, and they can vary significantly in price. An important factor is the distance from which the biomass is transported and the means of transport, which influences the cost of the biomass. Probably the most significant challenge to the implementation of BECCS at bioenergy plants is the large investment and operational costs of CCS [43]. Thus, this paper presents estimates of the investment and operational costs of BECCS based on the assumptions of acknowledged research centres, data from which were the key input for the optimisation analyses of electricity and district heat generation structure in the EU.
Another important consideration is that the deployment of BECCS as a major climate mitigation solution will require planting bioenergy crops on large land areas. This aspect becomes particularly important in the context of the requirements for biomass in the EU’s second Renewable Energy Directive (RED II) [44]. This directive, among others, sets renewable energy targets in the final gross consumption in the EU for 2021–2030. It is one of the main documents in the EU defining the scope, direction, and mechanisms of promotion of renewable energy sources (RESs).
According to the provisions of the aforementioned directive, biomass should meet the sustainability criteria, which means that obtaining it may turn out to be more difficult than it has been to date. Some part of biomass will not be qualified as renewable fuel, and biomass imports will also be limited. The construction of CCS installations can be economically justified in the case of large production units, for which ensuring an adequate level of biomass supply can require importing long distances, which will additionally generate a specific carbon footprint. According to the guidelines of RED II, this footprint must also be taken into account in the CO2 balance. This is a significant factor hindering the large-scale application of BECCS technology.
From the standpoint of the cost efficiency of BECCS projects, there is currently no market for negative emissions. Currently, the negative emissions are not incentivised, and no remuneration or support exists for such actions; therefore, there is no adequate return for the investment needed to achieve them. Because different technologies have variable benefits and spill overs, at the early stage of implementing carbon payments, the full technology neutrality between greenhouse gas removal technologies is not desirable.
The following options can be considered to support BECCS technology in the short term [45]:
  • Power Contract for Difference (CfD): the investor obtains the strike price for the generated electricity in the whole contract period. The strike price allows the investor to cover all costs related to electricity production (capital and operational). The difference between the market price and the strike price is usually covered by the government.
  • Carbon payment: the investor obtains the strike price for the generated negative emissions in the whole contract period. The investor obtains predetermined remuneration only for negative emissions. This is a strike price for negative emission units.
  • Carbon payment and power CfD: the investor obtains the strike price for the generated electricity and also for the negative emissions in the whole contract period. This is a combination of the two options mentioned above. Carbon payment provides remuneration for negative emissions, while power CfD covers electricity production costs.
Two potential NET-supporting systems can be analysed in the medium term, wherein all greenhouse gas removal technologies will compete, but payments for other complementary products should be implemented to avoid over-support for some technologies [45]:
  • Carbon payment (and CfD for other complementary products, e.g., electricity or hydrogen): the investor obtains a fixed payment per tonne of generated negative emissions in the whole contract period.
  • Negative CO2 obligation scheme (and CfD for other complementary products, e.g., electricity or hydrogen): this option requires emitters to cover part of their emissions with negative emission certificates. NET investors earn these certificates and can sell them on the market.
The long-term goal for NET-supporting systems is to create a comprehensive CO2 market [44] on which greenhouse gas removal technologies will compete with abatement technologies to reach the net-zero target.
From a regulatory point of view, there could be two main financing options for the long-term future of NETs in the system of emission management [46]:
  • Separate NETs and EU ETS systems with different prices and goals—less cost effective, but BECCS technology could start its development using the opportunity caused by varying price levels in different systems.
  • Inclusion of NET into the EU ETS—the most cost-effective way, but it could delay the start of the development of BECCS technology if the CO2 price is too low in the first stage of BECCS development. Based on the existence of a link between emissions and CCS, and because the European Commission targets preserve the environmental integrity of the EU ETS (the most important policy instrument in the EU for reducing CO2 emissions), this option seems to be the most beneficial for the future.

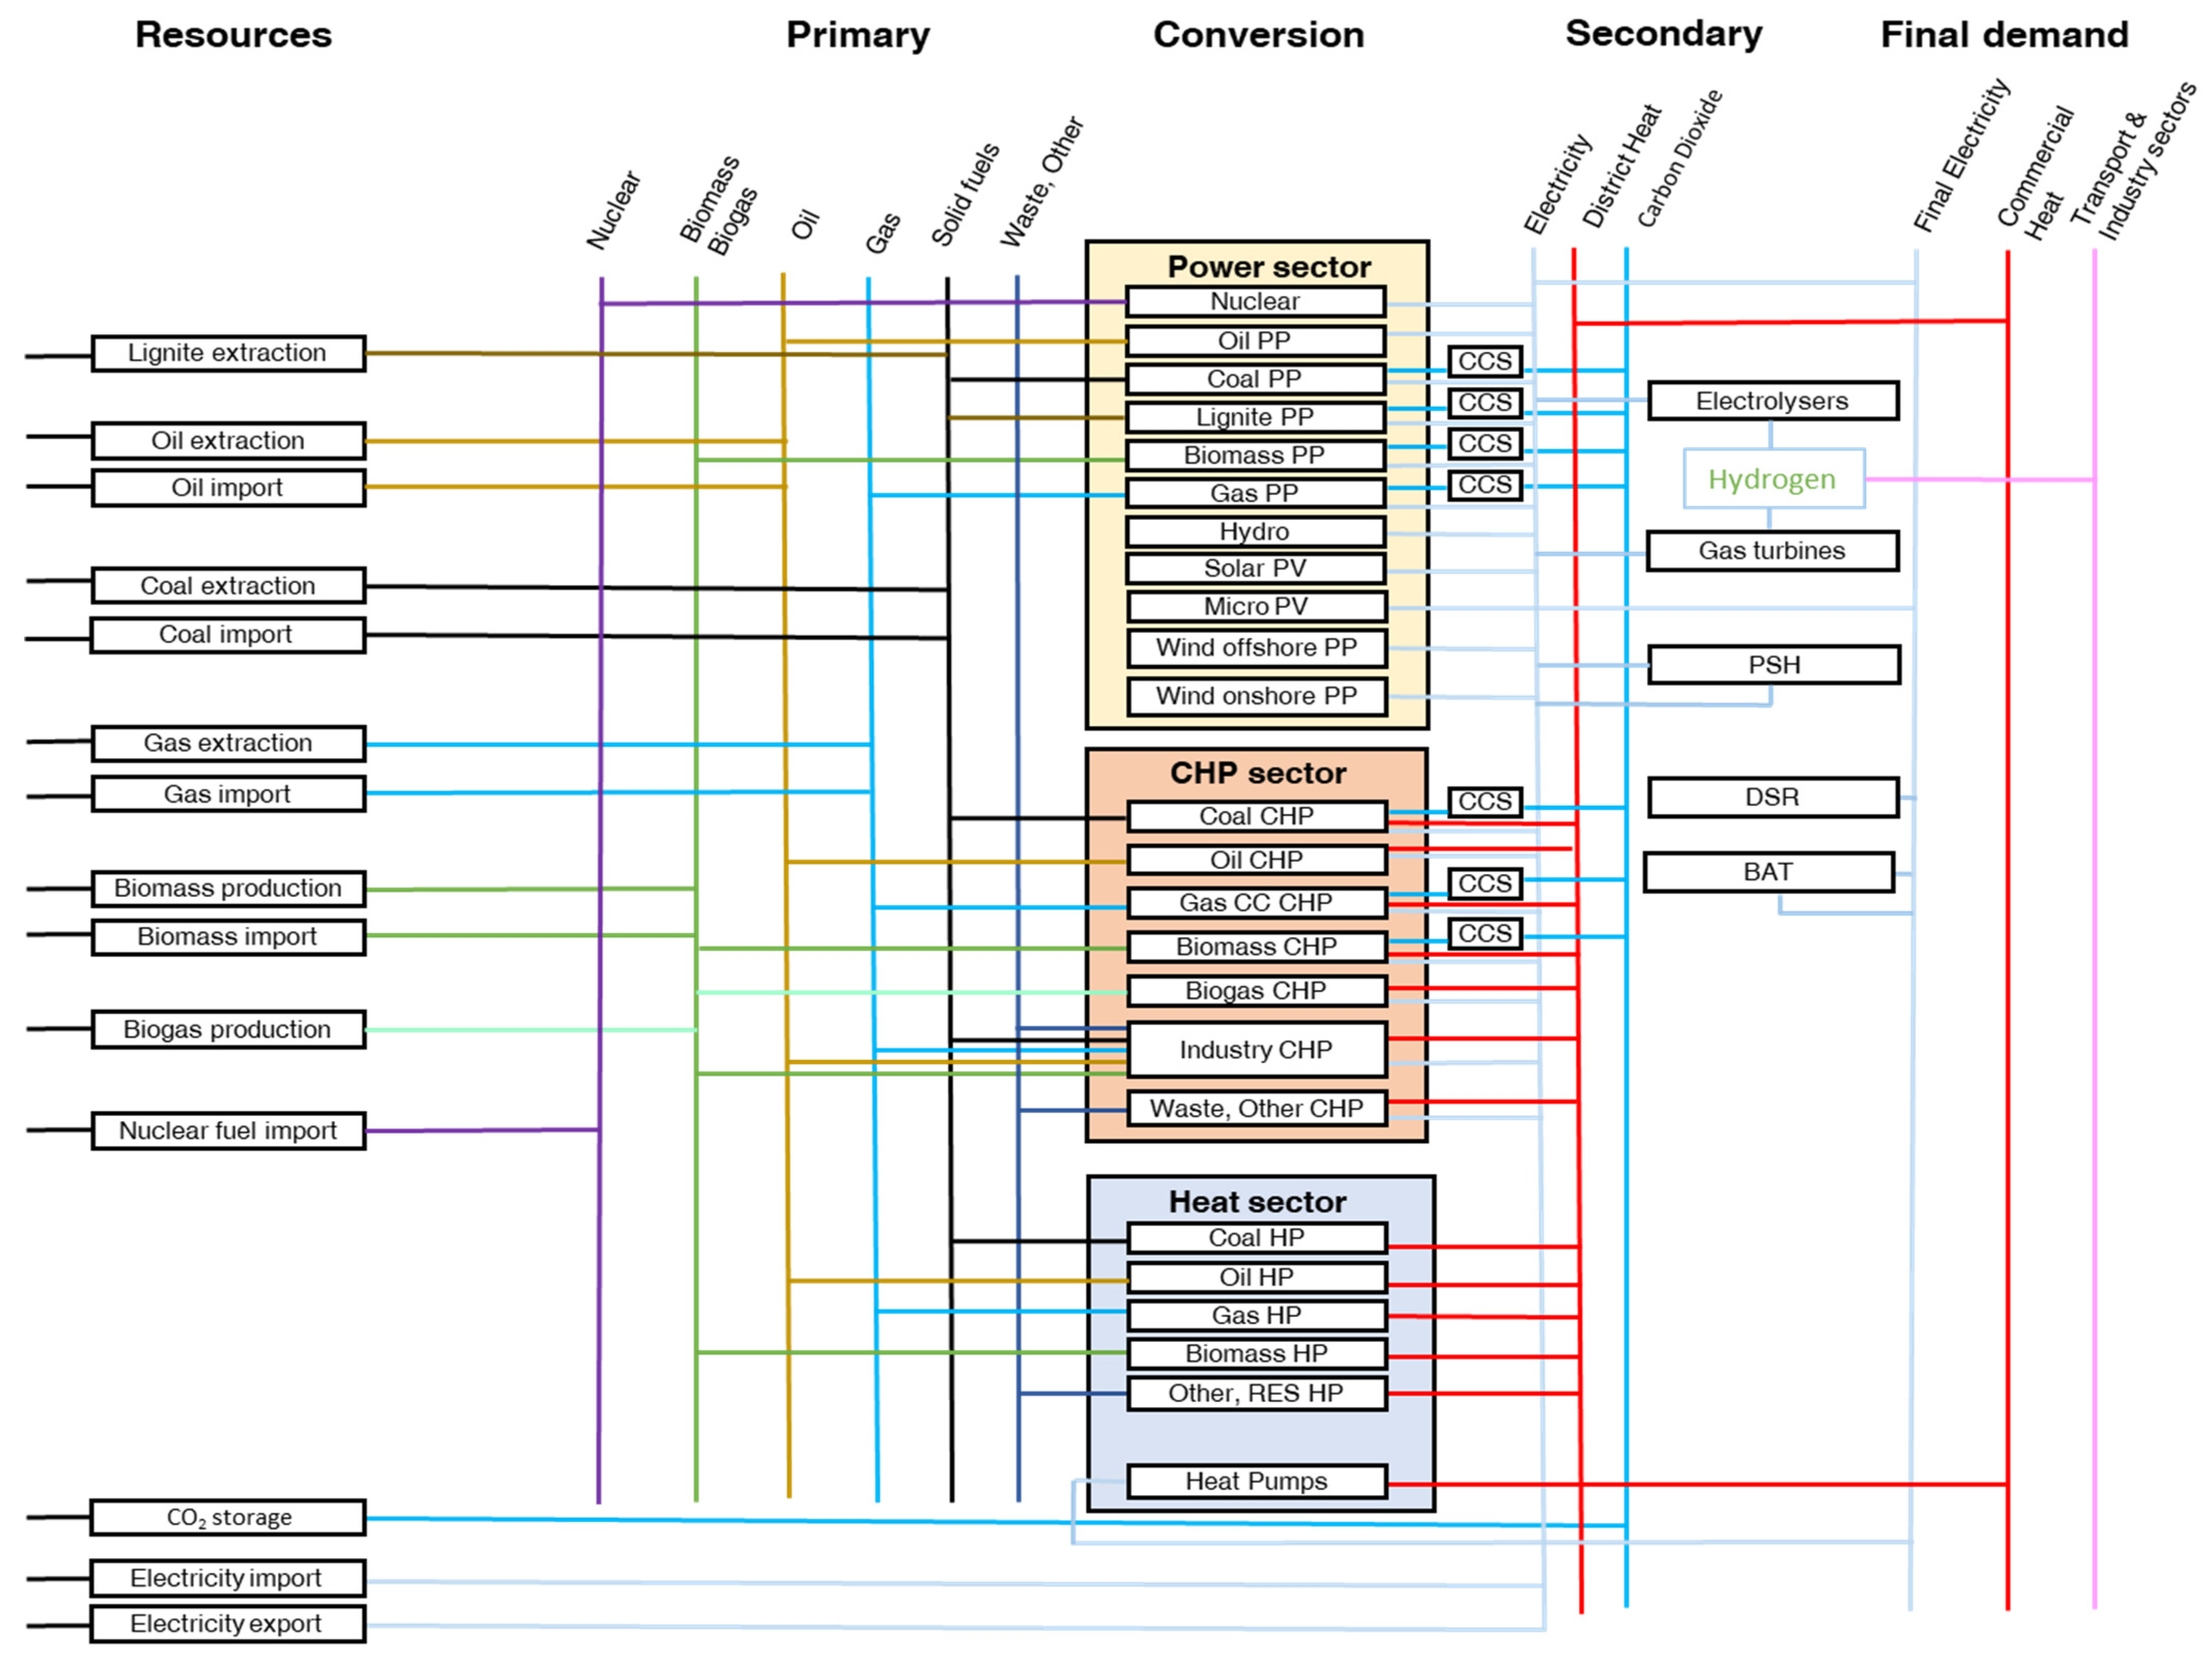
3. Materials and Methods

BECCS technology may be implemented in a variety of industries utilising various biomass feedstock and energy conversion methods [42]. In this paper, the research area is narrowed down to electricity and electricity and heat generation technologies; therefore, the term BECCS is used assuming only electricity and heat generation. One of the main advantages of BECCS is that it can be applied to a wide range of technologies with a varying coefficient of CO2 emissions, e.g., combined heat and power plants (CHPs), dedicated or co-firing power plants (PPs), and other industry and biofuel production technologies, which are outside the scope of this article.
The role of BECCS in the electricity system of the EU was evaluated by applying an energy model utilising linear programming. The principle of the model is based on finding the lowest-cost feasible solution for investing in and operating a system under the given constraints for a year (the objective function is the lowest overall cost of the system over the entire analysed period). The model used, entitled Model for European Energy System Analysis (MEESA), is built on the basis of the OSeMOSYS [47], and was developed within the LIFE Climate CAKE project [37], its detailed description is available in [48]; thus, within this article, only key concepts and assumptions are listed.
MEESA is a model of the energy system of the EU Member States (EU-27), also including the United Kingdom, Switzerland, and Norway (thereafter called the EU+), designed for long-term planning. MEESA evaluates alternative energy supply strategies under user-defined constraints. Such restrictions are usually the following:
  • Limits on new investment;
  • Fuel availability and trade;
  • Environmental regulations;
  • Market regulations;
  • Cross-border energy flow;
  • Required levels of emission reduction;
  • Required share of RESs in a given period, etc.
The model covers the most important dynamics and relations that reflect the functioning of the electricity and district heat sectors. The MEESA model is part of a complex toolkit designed for energy and economic systems analysis developed within the LIFE Climate CAKE project. In addition to the MEESA model, the toolkit also includes a global general equilibrium (CGE) d-PLACE model [49] and cooperative sectoral models: EPICA [50] for agriculture and TR3E [51] for transport (Figure 2). The use of an integrated set of models allows for the analysis of aspects related to energy and climate policy in all sectors of the economy. Changes in one sector do not remain unaffected by other sectors, which, using the proposed set of tools, makes it possible to capture these changes. It uses computational loops with a specific sequence of actions, and the results obtained are the consequence of iterative processes.
The MEESA model optimises the energy supply technology options meeting the given demand (electricity, district heat, and hydrogen) under a set of defined constraints. The main criterion of optimisation is the total discounted system cost in a given period of time (usually long term). The results are divided into four categories: activity, capacity, emissions, and costs. Activity means the production of various energy carriers, which, in the model, currently focusses on electricity, heat, and hydrogen.
The MEESA model is capable of working year by year, yet it was decided to implement a five-year resolution. Energy demand data are exogenous to the model (they come from the d-PLACE model in the five-year resolution). The MEESA allows for the modelling of all steps in the energy flows, starting from energy demand through transmission, distribution, and conversion to energy resources. Figure 3 shows the energy chain schematic representation defined in the MEESA model.
Approximately 50 different technology types are defined in the MEESA model, including existing and new conventional thermal units, RESs, energy storage, electrolysers, and demand side response (DSR) services. The hydrogen produced by electrolysers can be used in the model to produce electricity in gas turbines or directed to sectors where there is a demand for this energy carrier. Each technology defined in the model was assigned an appropriate CO2 emissions factor related to its generating unit, which allows us to predict the total emissions from the energy sector and to include in the optimisation the costs related to the necessity of purchasing allowances on the market.
The model disaggregates demand in the optimised year for electricity and heat into 18 time slices based on historical data of the demand profile for each country according to seasons (winter and summer), types of days (low-, medium-, and high-demand or different RES productivity), and time of day (day, night, and peak demand period). This allows one to take into account both the average and extreme states of operation of PV and wind sources. This provides a basis for determining the mode of operation of individual units in the system. This solution also enables an analysis of the level and direction of intersystem electricity exchange, with each region being one node. The model ensures this by providing a 15% power margin. Each technology has a defined availability, e.g., photovoltaic 0%, wind onshore 10%, wind offshore 15%, BECCS CHP 70%, BECCS PP 80%, nuclear PP 90%, GAS PP 95%, and pumped-storage PP 100%. The MEESA model is integrated with an economic model that determines the economic impact of energy and climate policy changes and with sectoral models (TR3E and EPICA). The d-PLACE model is a recursive dynamic global and multisector general equilibrium (CGE) model. The d-PLACE model is based on a static CGE model. The input data used to calibrate the base year (2015) come from the Global Trade Analysis Project (GTAP-10) database. The baseline scenario (up to 2050) is consistent with the external projections of changes in GDP, emission limits for the EU, and emission limits for the rest of the world. The effects of the individual regulations analysed in the climate policy scenarios are presented in this model as deviations from the baseline scenario. A characteristic feature of this model is the highly detailed elaboration of GHG emissions.
The model distinguishes carbon dioxide (CO2), methane (CH4), nitrous oxide (N2O), and hydrofluorocarbons (HFCs). Emissions from the different gases are expressed as the CO2 equivalent [52]. Emissions from fuel combustion and process emissions are modelled separately. Emissions are divided into two main categories:
  • Emissions related to fuel combustion—emissions are proportional to energy/fuel consumed;
  • Process emissions (e.g., CO2 emissions from cement production)—related to the level of activity and proportional to production.
Crucially, the d-PLACE model includes the full balance of emissions at the EU level and divides them into EU ETS and non-ETS, taking into account the targets set in the energy and climate policy of the EU. The model also includes emission reduction targets for regions outside the EU that are signatories of the Paris Agreement.
Energy consumption is modelled in detail in the d-PLACE model. The sectors defined in the model (industry, services, and households) respond to changes in the relative prices of various fuels (including the cost of emissions) and electricity and, in this way, adjust their energy demand patterns. Additionally, manufacturers can replace energy by capital and labour. The production process is modelled by a nested constant elasticity of substitution (CES) function and a Leontief production function [53]. To examine the impact of energy and climate policies, the model distinguishes between energy-intensive and carbon-intensive industries. The model also enables the analysis of the impact of climate and energy policies on aggregate household welfare, including the calculation of compensation mechanisms to offset increased product costs for consumers [49].
The d-PLACE model allows for an analysis of the relative emission reduction potentials across sectors and countries because it includes sector- and country-specific production technologies and consumption patterns. This allows us to look at environmental and climate policy goals from a cost-minimisation perspective, as well as to compare burdens across countries [22]. However, CGE models have significant limitations in terms of modelling specific aspects of the power system operation. By linking d-PLACE with MEESA, it is possible to overcome these limitations. Therefore, it is worth mentioning exactly what kind of data are being exchanged between the two models in an iterative process.
When the MEESA model is used in the connection mode, it uses marginal abatement cost in the EU ETS, demand for electricity and district heat, and demand for hydrogen obtained from the d-PLACE model. Electricity and hydrogen include the demand from the transport sector provided by the TR3E model, uploaded to MEESA by d-PLACE, which in this case also serves as a hub for information exchange with other models. After the MEESA model results are obtained, the following data are transferred to the d-PLACE model: average prices of electricity, district heat and hydrogen, use of fuels in the electricity and district heat generation, investments in the energy sector, and CO2 emissions related to fuel consumption (including negative emissions associated with the use of BECCS technology). This iterative process is conducted until a convergence of results is achieved.
Due to the use of several cooperating models (i.e., macroeconomic d-PLACE and sectoral ones: energy MEESA, transport TR3E, and agriculture EPICA), it was possible to show interactions between various sectors and take into account how changes in one sector affect the possible development of other branches of the economy, as well as household consumption and GDP value.
It is important to note that this article presents the results of BECCS technology modelling based on the last of the NETs’ financing schemes mentioned in Section 2, assuming that revenues for negative emissions come from the EU ETS system and depend on the CO2 price determined within this system.
The applied approach, based on modelling the electricity and district heat system in the EU, with connection to other sectors through the EU ETS system, allows us to consider the role of BECCS technologies not only in the energy system but in the entire economy. The necessary scope of investments, the related costs, and the expected GHG reductions were indicated, taking into account the entire GHG emission chain (resulting from land use change and removals during growth, acquisition, transport, and use of biomass in energy boilers). Despite the identified barriers to the development of this technology, in the conditions of high prices of allowances and striving for a reduction in carbon dioxide in the atmosphere, this technology is competitive and plays an important role in the EU energy mix.

4. Modelling Assumptions

4.1. Scenarios

Within the conducted analysis, two scenarios were developed, a comparison of which enables the assessment of the impact of BECCS technology on energy generation structure, CO2 emission reduction level, and costs, respectively:
  • The EU Climate Neutrality Scenario (NEU) is a baseline scenario assuming ca. 90% emission reductions in 2050 vs. 1990 and net-zero emissions (including removals) throughout the EU economy. In this scenario, no restrictions are placed on the development of any available technologies. The only limitations are imposed on the projected technical and investment potential. This scenario assumes achievement of the targets set in the Fit for 55 package for a given timeframe and strives towards realisation of the climate neutrality target by 2050.
  • Scenario with no BECCS technology (NO BECCS)—the assumptions for this scenario were exactly as above, except that a complete limitation on BECCS technology was implemented. This scenario is necessary for comparison purposes and to determine the impact of BECCS technology on electricity generation and overall system costs.
The assumptions that have the greatest impact on the modelling results obtained include electricity and district heating demand, technical and economic parameters of BECCS (including capital expenditures, operating costs, energy conversion efficiency, and efficiency of CO2 capture from flue gases), biomass prices with transport, CO2 emissions at different stages of biomass utilisation (according to the scheme presented in Figure 1, which illustrates the complete CO2 cycle for BECCS technology), and the method of accounting for negative emissions in the EU ETS system. These assumptions are described below.

4.2. Electricity, District Heat, and Hydrogen Demand

Electricity, district heat, and hydrogen demand are the input to the MEESA from the d-PLACE macroeconomic model. In general, the electricity demand for the MEESA model is exogenous, but MEESA also calculates additional demand for heat pumps, energy storages, and hydrogen production; therefore, the final electricity demand is a sum of the demand provided by the d-PLACE model and the demand generated internally within the MEESA model. The situation is similar with hydrogen—generally, the demand for industry and transport sectors is provided by the d-PLACE model, but hydrogen generated in the MEESA model can also be used internally for electricity and heat generation, as a form of energy storage. Hydrogen is produced in the process of electrolysis, preferably during the periods of the day in which the electricity price is at the lowest level, to cover the hydrogen demand. The prices of electricity, heat, and hydrogen generated in the MEESA model for specific demand levels and for a particular year are sent back to d-PLACE and affect the estimated new level of demand; this iterative process is repeated until equilibrium between models is achieved.

4.3. Techno-Economic Parameters

The technical and economic parameters and assumptions for electricity and heat generation technologies defined in the MEESA model were based on the final assumptions adopted in the new PRIMES Reference Scenario 2020 [53]. Table 1 presents the set of techno-economic parameters of technologies adopted for model calculations.
There are also technologies in a different data layout, e.g., batteries have a 115 thousand EUR/MWh investment cost and 6.5 EUR/kWyr in operation and maintenance costs. In storage technologies, as well as in hydrogen generating technology, the price of electricity for a particular time slice is crucial. Whenever particular necessary data were missing from the PRIMES Reference Scenario 2020, the MEESA model used data from recognised research institutions, dealing with energy modelling and investment processes, such as the National Technical University of Athens (NTUA), Tractebel, Ecofys, International Energy Agency (IEA), Joint Research Centre (JRC), and Frontier Economics.
A limited decrease in future investment costs was assumed due to the potential of the economic scale effect for CCS installations that have not yet been fully commercialised. Since the techno-economic data for BECCS provided by PRIMES Reference Scenario 2020 show the investment costs for power plants, the costs for CHPs were assumed to be 35% higher. The energy conversion efficiency of BECCS was lower by 8% compared to the technology without CCS due to the high coefficient of CO2 capture process needs. The overall efficiency of CO2 capture from flue gases was assumed to be 87%, which is a rather conservative assumption given the early stage of development of this technology [55].

4.4. Fuel Prices

Primary fuel prices, excluding biomass, were assumed for the calculations based mainly on projections coming from the World Energy Outlook [56]. The prices for biomass were defined on different sources and are basically the result of an expert assessment based on historical data and the analysis of forecasts published by recognised research centres. Biomass prices depend on a number of factors, including the type of biomass (e.g., wood, agricultural products, and solid waste), availability, direct and indirect production support system, demand, and import possibilities. As a result, biomass prices tend to vary from country to country. The potential of biomass was determined for the purpose of this paper based on the following analysis [57,58]. The first publication is a part of the “Biomass role in achieving the Climate Change & Renewables EU policy targets” (BIOMASS FUTURES) project. This publication provides an overview of the potential of different types of biomass feedstock throughout the European Union. This information was then combined with extraction cost estimates to make supply–demand curves. The resulting prices were then averaged to create a trajectory, the same for all EU countries, to enter into the model. This is a simplified approach but acceptable given the purpose of the analysis. The trajectory adopted in the calculations assumes a moderate increase in biomass prices from 5.3 EUR’2015/GJ in 2015 to 12.5 EUR’2015/GJ in 2050. The potential assumed from the first publication has been revised based on more recent sources. The final assumed potential for modelling purposes is in line with the average potential from the 2015 JRC study [58]. It should be noted that the potential in this study may be overestimated, as it does not take into account the need for sustainability criteria, included in Annex IX of RED II [44]. It was assumed in the MEESA model that a maximum of 60% of the biomass production potential in the EU can be used for electricity and heat; the rest of the potential remains available for industry and households.

4.5. EU ETS Allowance Prices

CO2 allowance prices are the result of an iteration process between the MEESA, d-PLACE, and other sectoral models. Shifts in this parameter cause changes in the energy mix and affect the balance of allowances in the EU ETS, which has a certain impact on prices. Therefore, the prices of CO2 emission allowances in the proposed methodology are not exogenous data, but the result of model calculations that take into account emission reduction targets along with changes in the fuel mix and process emissions in the EU ETS sectors. This method allows us to establish the marginal cost of CO2 emissions in a given year.

4.6. Net Emissions Accounting
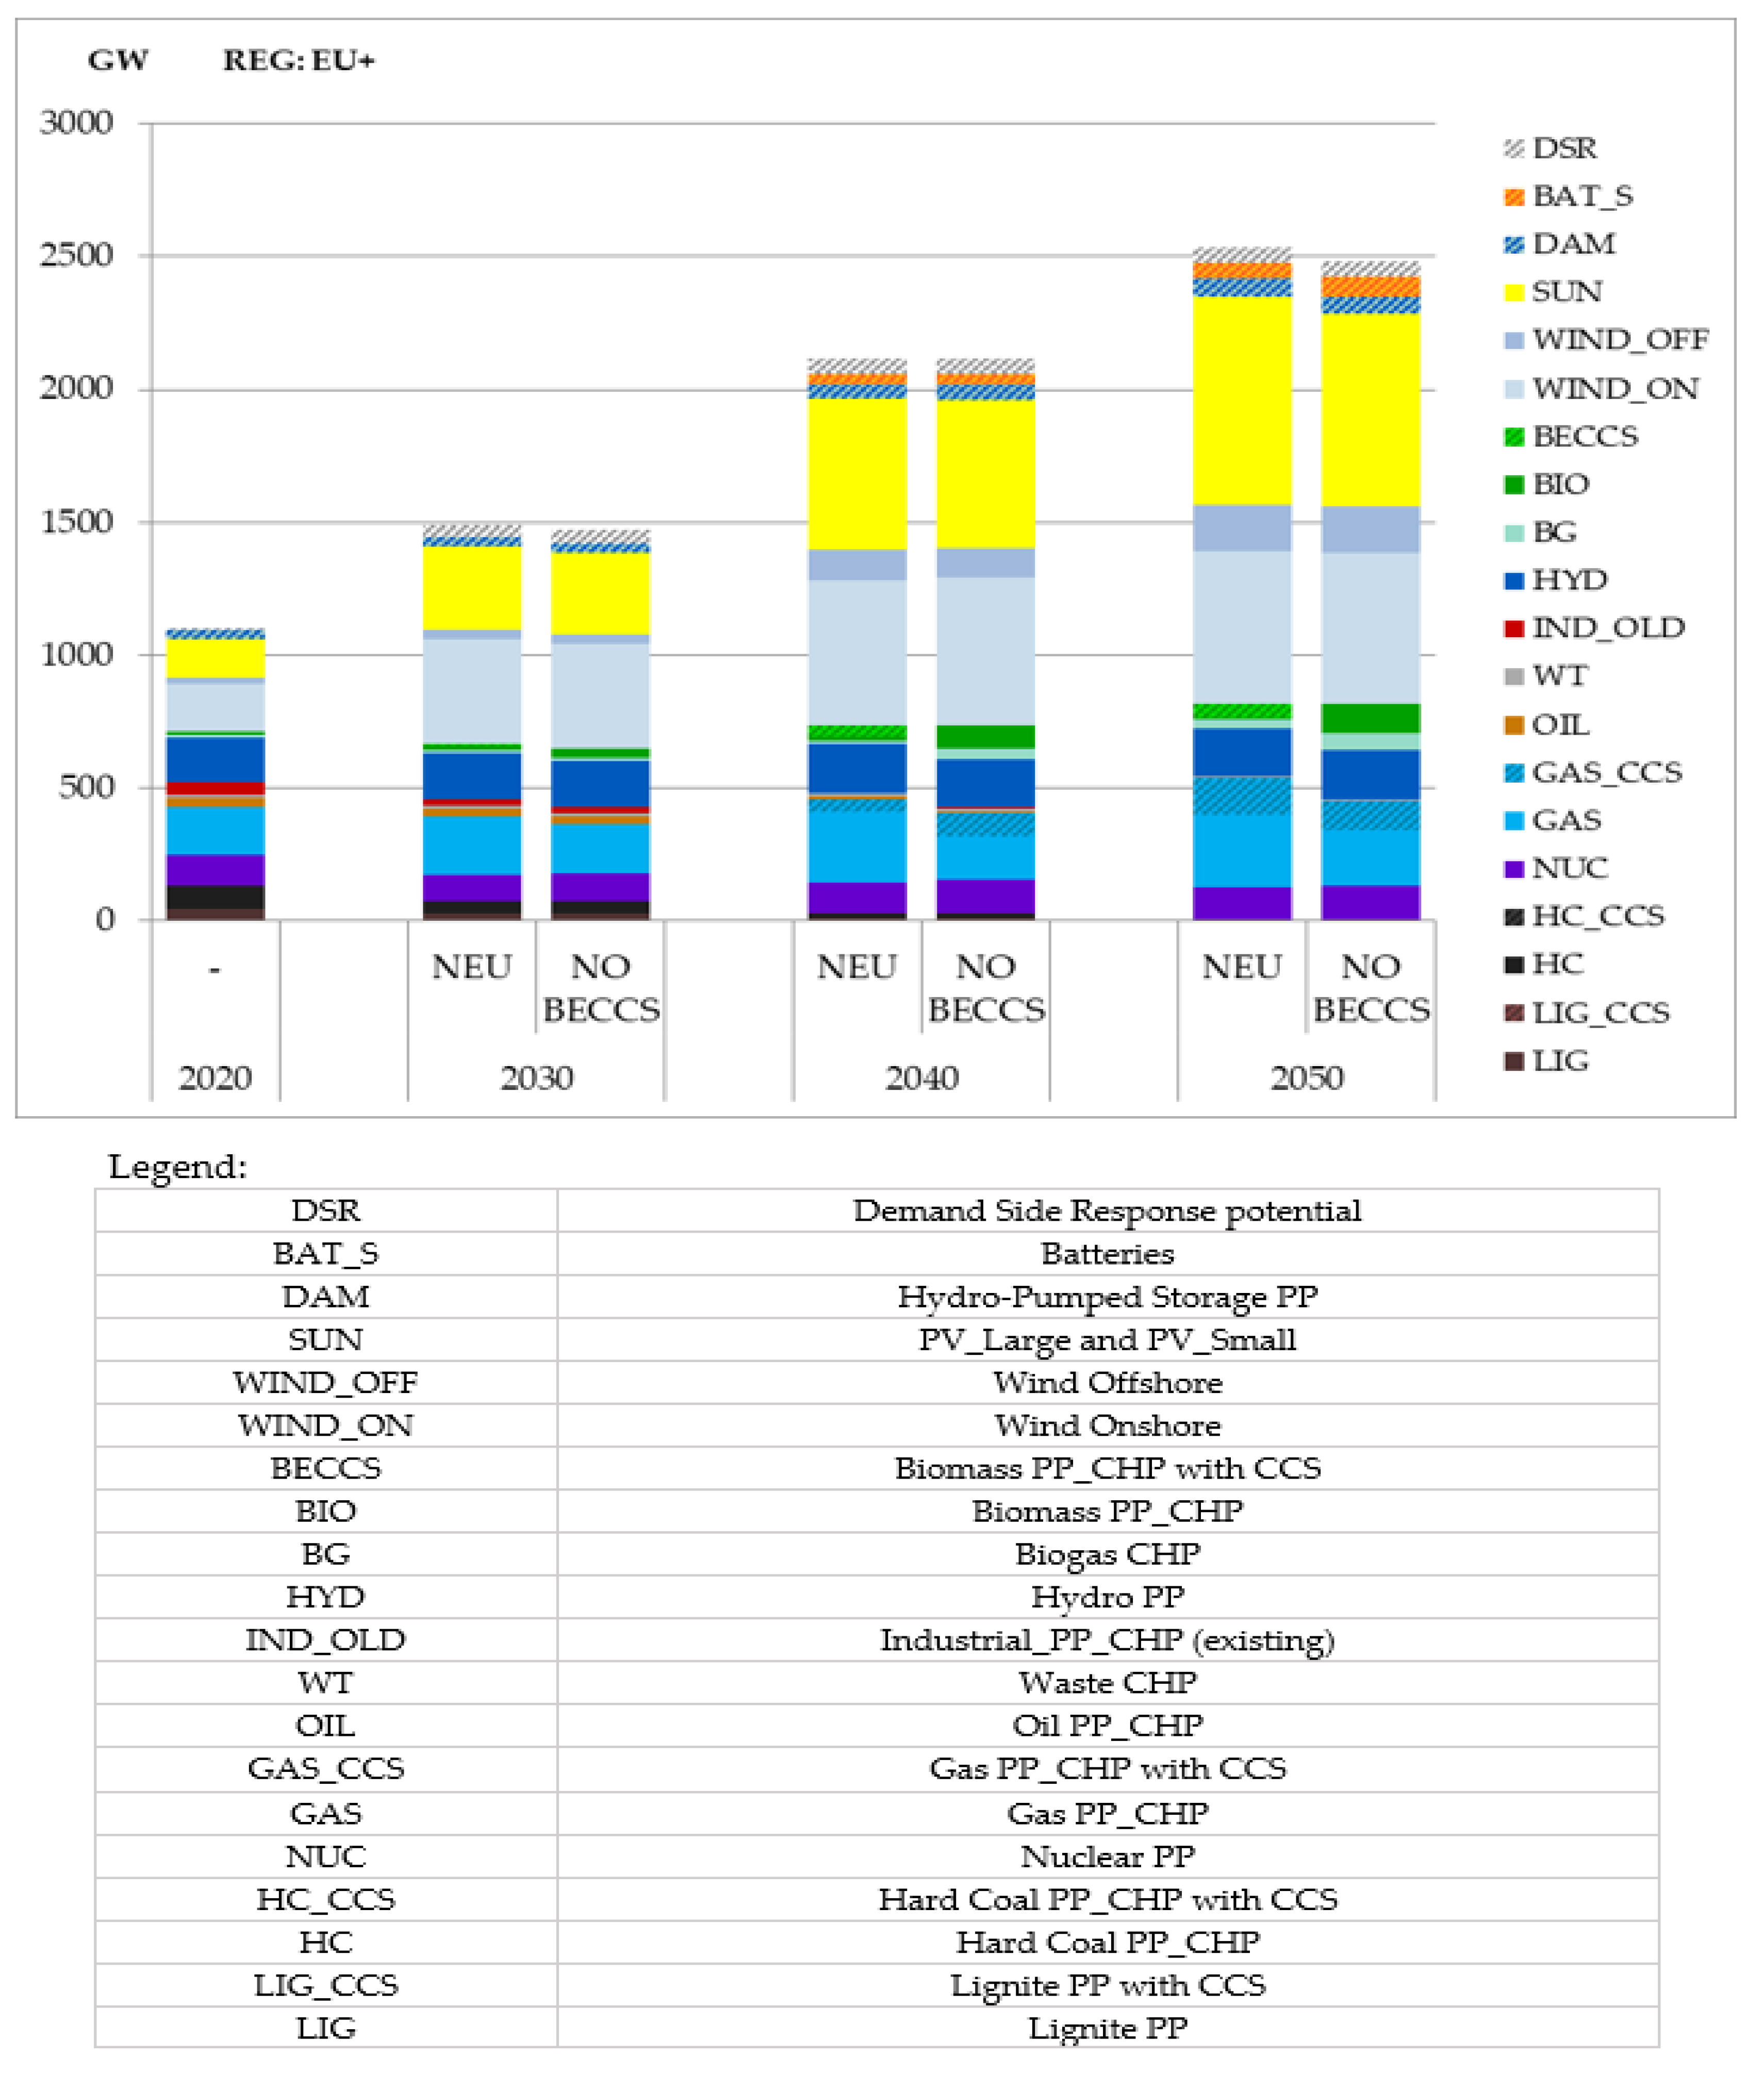
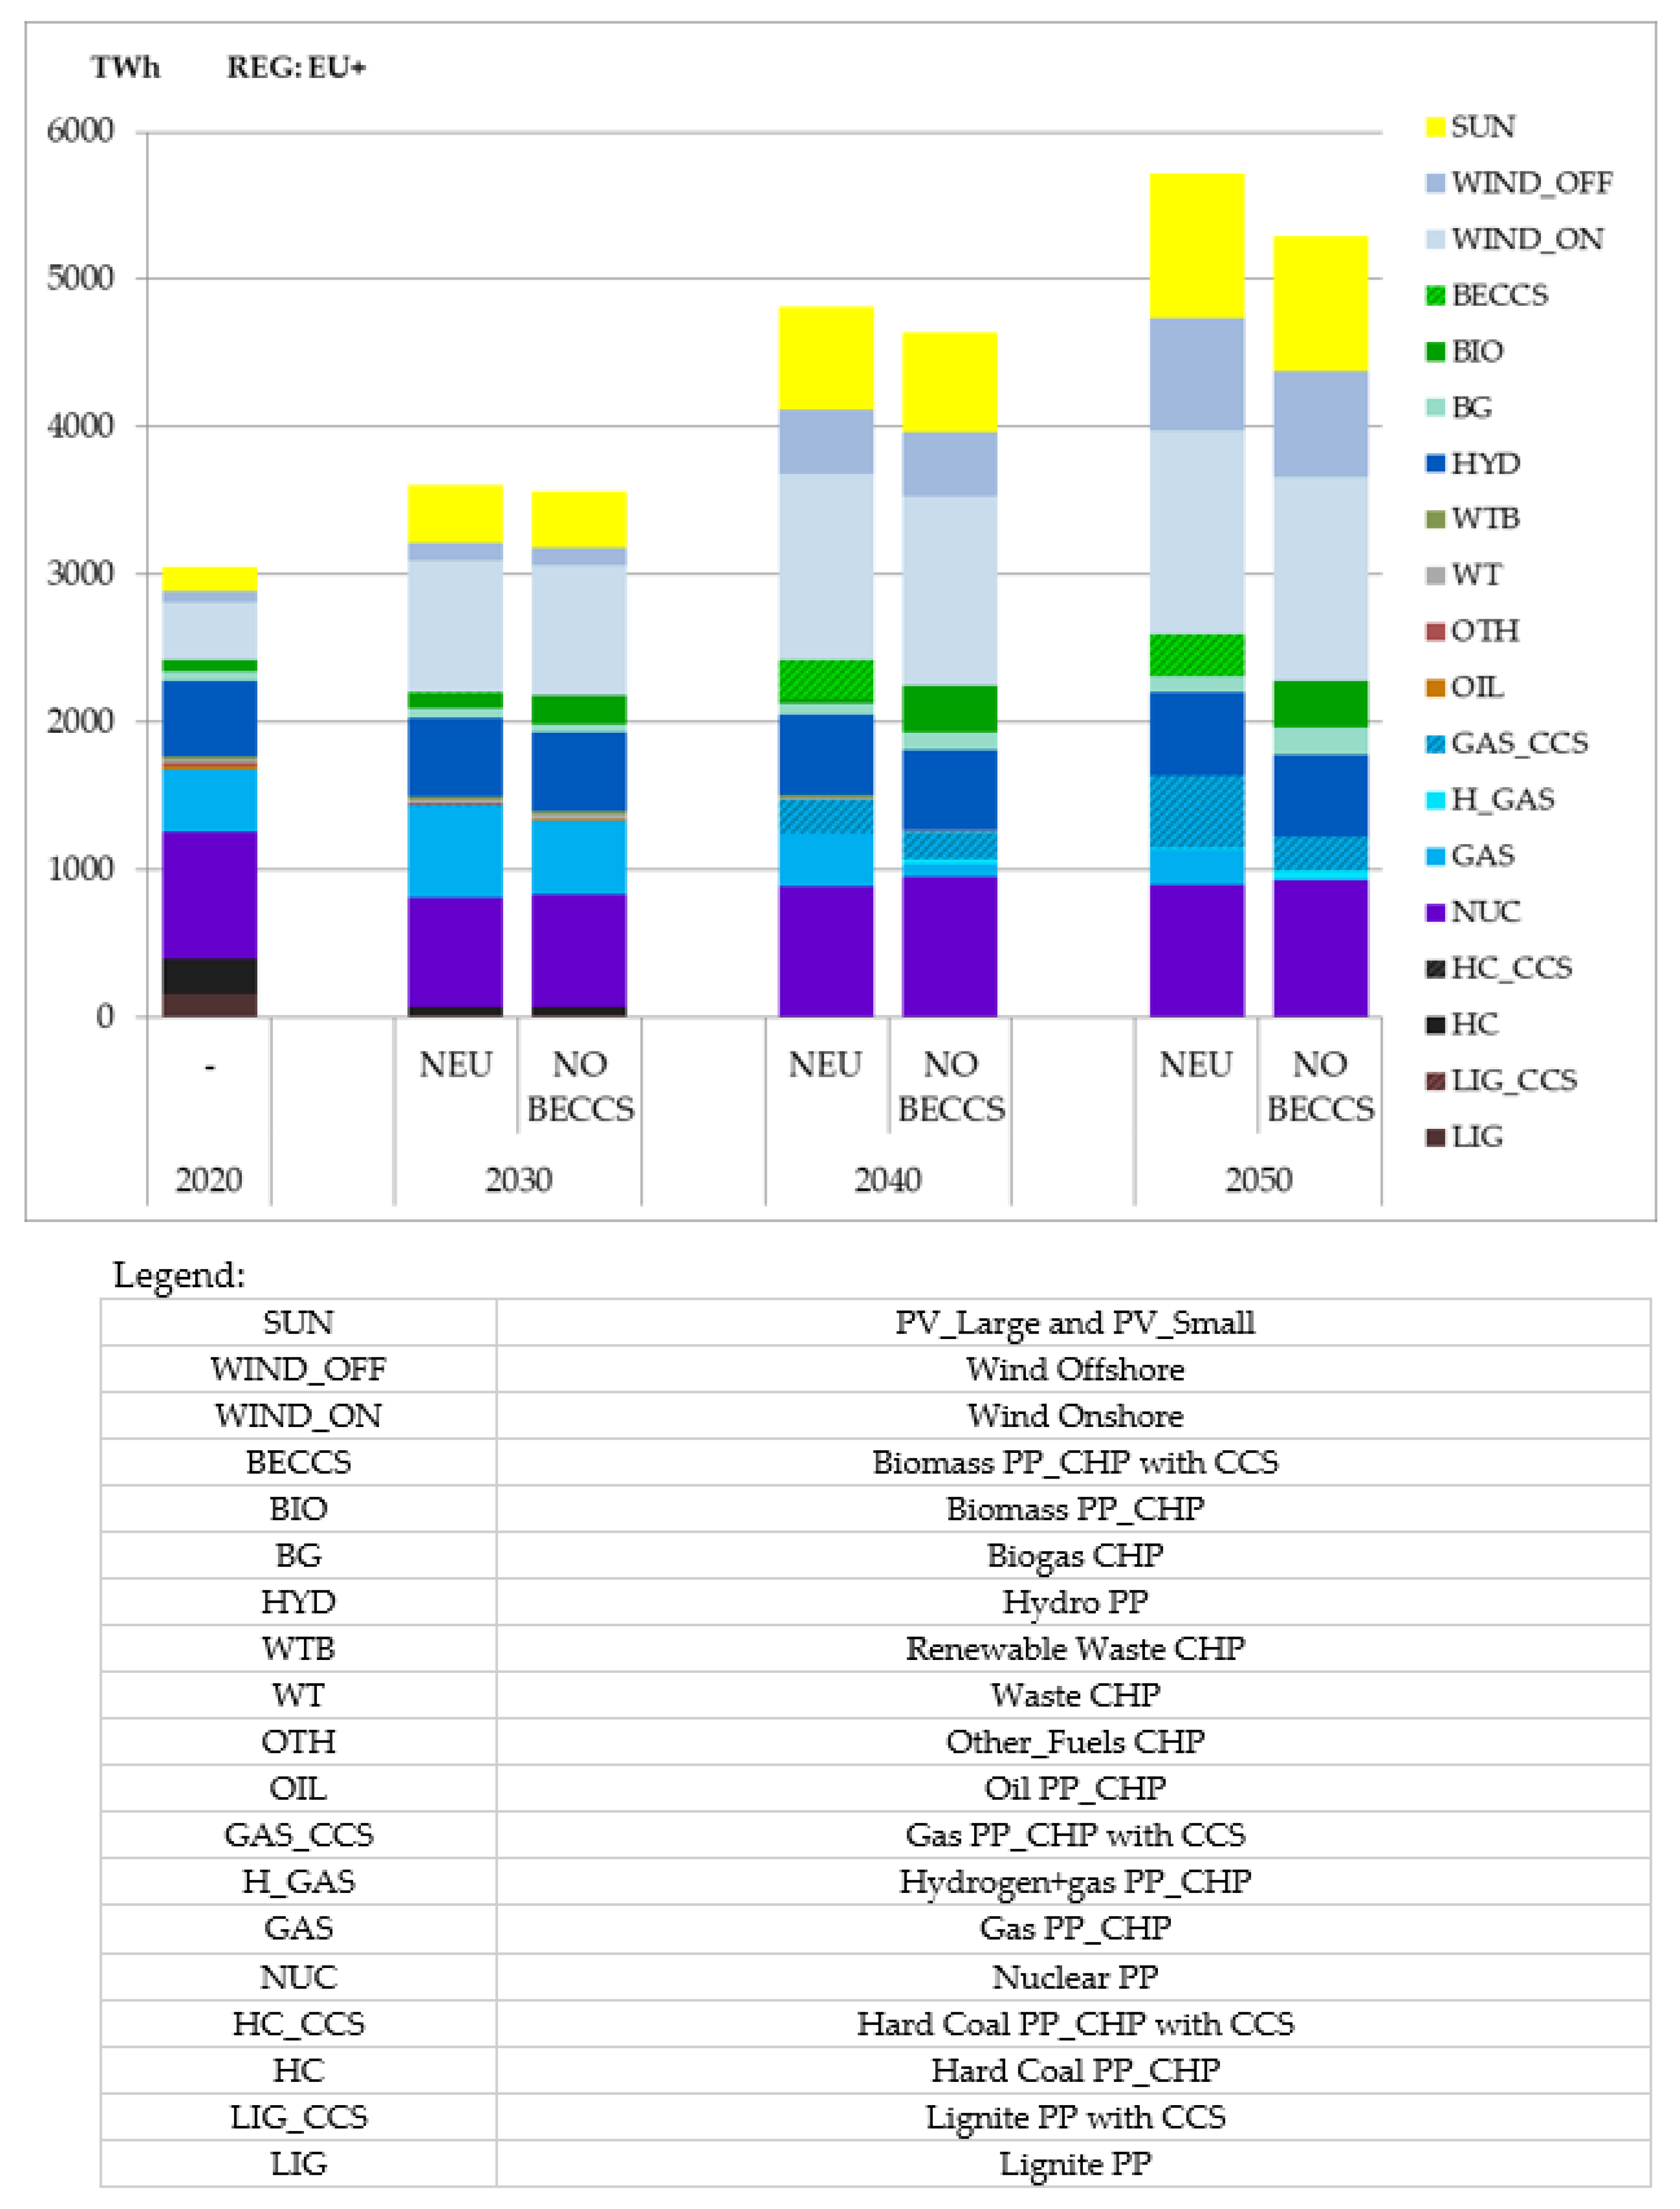
A key aspect with respect to the viability of investing in BECCS is accounting for negative emissions. As previously mentioned, currently, negative emissions are not incentivised, and no remuneration or support exists for such actions. It is likely (in the authors’ opinion) that in the long term, NETs would be implemented into the EU ETS system. Thus, model calculations were based on this assumption. The accounting method adopted allows for a full reflection of GHG emissions from the entire cycle of biomass generation, processing, and transport, as well as revenues from the sale of negative emissions in the market. Emissions data for each part of the emission chain were based on the information contained in Annex VI of RED II and also on the IPCC report [59]. The IPCC calculated the median lifecycle emissions for biomass slightly above 20 g CO2eq/MJ. The biomass emission range in the RED II is between 3 and 54 g CO2eq/MJ. In the analysis, it was assumed that only 80% of the absorbed emissions can be considered as avoided; i.e., the indirect emissions of the entire biomass life cycle will be in the range of 22 g CO2eq/MJ (the EU+). Taking into account the indirect emissions related to biomass acquisition and the efficiency of the CO2 carbon capture unit, the overall amount of assumed negative emissions is about 70% of the direct CO2 emissions of a biomass power plant without CCS (per fuel input; this share calculated per energy output would be even smaller due to the energy consumption by the CCS unit).

5. Results

The following section presents the modelling results regarding the electricity demand and the structure of electricity generation in the EU+ within two scenarios (NEU and NO BECCS). The aim of the comparison was to capture significant differences in the two scenarios, enabling the assessment of the impact of BECCS technology on the power generation mix, CO2 marginal abatement costs, and the overall system costs.
In the NEU scenario, the range of necessary investments in BECCS capacity in the EU+ is 39 GW and 52 GW in 2040 and 2050, respectively (Figure 4). Before 2035, this technology plays a marginal role due to its high costs and too-low CO2 prices to ensure the competitiveness of these installations. After 2035, BECCS starts to develop rapidly in the EU+. In this period, the decline in unit construction investment costs and the increase in MAC are considerable. At the same time, a further tightening of reduction targets in all sectors of the economy makes it necessary to look for negative emissions that can in some way offset emissions from sectors where reduction is difficult or sometimes even impossible for technical reasons. BECCS technologies, along with gas and nuclear, are becoming a major source of stable and predictable electricity generation (which is important in view of the high share of RESs, such as wind and solar), while at the same time providing the possibility of accounting for negative emissions that have been captured and stored in geological formations. Although they do not constitute a substantial group in quantitative terms, they play an important role in the EU energy system.
According to the results presented in Figure 5, the electricity production of BECCS plants will be 257 TWh and 286 TWh in 2040 and 2050, respectively. BECCS technologies act both as a baseload power source and as a component of a wider mitigation strategy. It can be said that the role of BECCS in providing negative emissions is almost as important as energy production. The scenario with BECCS enables higher use of fossil fuels (because of high CO2 prices, mostly natural gas) in the energy sector. Without BECCS, biomass PPs play an important role in power generation during the winter, as they are not complemented by the GAS PPs (due to very high CO2 prices), thus requiring more capacity than is available. In the summer, overall demand is lower, and photovoltaics (combined with batteries) cover a large part of the energy demand; therefore, biomass PPs are mainly needed in the winter. Fossil fuel power without CCS is used very rarely in 2040–2050; CCS is very important for reserve power balance. The lack of BECCS technology also increases the use of hydrogen in the power sector.
Figure 6 depicts the use of biomass in power plants (PPs), combined heat and power plants (CHPs), and heat plants (HPs). In both scenarios, the utilisation of this fuel increases significantly from the 2050 perspective, and it is more or less at the same level. This means almost complete utilisation of the assumed potential of biomass [58]. However, the distribution of biomass use between PPs, CHPs, and HPs differs greatly. The NEU scenario is dominated by PPs and CHPs, which means that HPs (which are not equipped with CCS) are less cost effective. This scenario, which assumes full CCS availability, shows that under high CO2 allowance prices, CCS installation becomes economically viable. In 2050, more than half of biomass use comes from power plants. In the NO BECCS scenario, the share of CHPs and HPs in biomass consumption is greater than in NEU. This is probably due to the fact that in NO BECCS, biomass becomes more attractive than other options in heat production. With high CO2 prices, gas-fired CHPs and HPs in NO BECCS practically disappear, and also, heat pumps are less competitive due to higher electricity prices. In this situation, most of the available biomass is used in district heating, as there are more options for producing low-emission energy in electricity.
It is worth mentioning that the method used, based on the combination of sectoral models and the core CGE model, allows one to estimate the impact of increased energy prices on energy demand. In the NO BECCS scenario, the electricity demand is nearly 8% lower than in the NEU scenario (Figure 7). Changes in electricity demand, resulting from CGE model simulations, can be interpreted as a compound effect of economic growth, energy efficiency improvement, substitution of other energy sources for electricity, and changes in the structure of production. A distinctively high increase in electricity use is observed in the household and transport service sectors, largely attributed to the expansion of electric vehicles. On the other hand, demand from energy-intensive industries grows much more slowly, partly because the share of those industries (particularly the extractives) in total output decreases. Under the no BECCS scenario, the demand increase is weaker than in the NEU scenario, due to both higher electricity prices and more moderate economic growth.
The average electricity generation costs in the EU+ countries (Figure 8) differ between scenarios, and in NO BECCS, they are ca. 10% higher within the 2040–2050 period compared to the NEU scenario. The increase in energy costs may intensify energy efficiency improvement but could also have a negative impact on industrial production.
However, for industry, the increased cost of CO2 allowances is much more important. Without BECCS, this cost becomes significant. Marginal abatement costs of CO2 emissions arise from the iteration process between the d-PLACE and sectoral models (Figure 9). The obtained results for the CO2 reduction costs are ca. 100 EUR/tCO2 in 2030 for both scenarios, 200 EUR/tCO2 for NEU and almost 600 EUR/tCO2 for NO BECCS in 2040, and 400 EUR/tCO2 in NEU and 2000 EUR/tCO2 in NO BECCS in 2050. Such high price levels should be treated with caution due to the methodological limitations of the modelling toolkit used. Nevertheless, this shows that BECCS technology can have a significant impact on the marginal costs of abatement. It must be noted that DACCS technology has not been included in the model. Perhaps adding this technology could mitigate the increase in CO2 abatement cost. This technology, due to its early stage of development and uncertainty, was not considered. However, it could be a direction of the future development of the MEESA model.
The CO2 emissions differ for the energy sector depending on the scenario (Figure 10). Crucially, as soon as 2040, negative emissions are viable in the power sector, which makes it possible to offset emissions from other sectors. The overall negative emissions in the EU+ achieved in the scenario associated with BECCS technology were almost 300 Mt CO2 (total negative emissions in the EU+ take into account positive emissions in the energy sector in the NEU scenario at ca. 180 Mt CO2). This shows that BECCS technology is a promising option to support the EU’s climate neutrality goal.

6. Discussion

The results of the analysis conducted indicate the important role that BECCS could play in achieving the EU’s climate goals by 2050. The biggest advantage, assuming large-scale implementation of these technologies, is the generation of negative emissions, which are necessary to compensate for CO2 emissions in hard-to-decarbonise sectors. Without this technology, negative emissions in the energy sector would be difficult to achieve. Furthermore, the impact of this technology in reducing marginal abatement costs across the economy is evident from the results obtained. A comparison of results from the NEU and NO BECCS scenarios (Figure 7) shows the significant impact of this technology. In the NO BECCS scenario, achieving climate neutrality requires relatively expensive solutions that increase the overall abatement cost to the economy. An analysis prepared using a set of integrated energy and economic models (MEESA and d-PLACE) indicates the need for the deployment of BECCS in the EU on a large scale. Production needs have been set at 250-300 TWh annually after 2040 in order to fulfil climate neutrality goals and secure energy supply safety. Early large-scale deployment of BECCS technology is unlikely due to the high cost and long investment process involved in building the CCS facilities.
The results obtained and presented in this article are, to an extent, in line with the conclusions of other research in this field referred to in the Introduction [33,34,35,36]. BECCS is the most scalable negative emissions technology available to remove CO2 from the atmosphere in the near future. Bioenergy is already widely used, and biomass energy conversion technologies are mature. However, it is important to keep in mind that the component technology for BECCS, carbon capture and sequestration, although relatively well understood, for economic reasons, has limited commercial utilisation [60]. The problem is the high installation costs, both capital and operational. The use of CCS installations reduces the efficiency of fuel conversion into energy by 8–12%, which also affects the economic efficiency of such projects. Nevertheless, given ambitious GHG emission reduction targets and high carbon prices, BECCS could gradually become more economically competitive.
Despite the fact that, from this perspective, BECCS technology looks promising, one cannot forget the barriers and drawbacks that exist. In addition to cost considerations, these elements will undoubtedly have a significant impact on the feasibility of large-scale application. One barrier may be the lack of public acceptance of CO2 capture and storage [61,62,63]. A “Not in My Backyard (NIMBY) effect” is found both for pipelines and storage in respondent surveys [64]. Transporting and injecting CO2 into geological reservoirs raises concerns about carbon leakage, seismic activity, and water pollution. A solution to this problem could be placing the generating units near storage sites.
Social resistance can be overcome by creating mutual trust between stakeholders and commitment to each other and to the project. This can be accomplished by including all stakeholders in the project process at an early stage and communicating about the project and its process to the community [65,66]. State officials, local authorities, self-government representatives, and potential investors should convey knowledge in a gradual and elaborate manner, as well as involve local communities in the planning of BECCS investments and environmental impact assessment processes. Moreover, new incentives and enabling reforms to existing policy instruments are needed [67].
Besides the problem of the transport and storage of CO2, there is controversy arising from the competition for arable land and fresh water [68], as well as additional risks for biodiversity [24]. Converting large areas of land to bioenergy crops could increase food prices. The U.S. National Academy of Sciences found that, in negative emissions scenarios using BECCS, every Gt of CO2 stored per year requires approximately 30–40 million hectares of BECCS feedstock [69]. According to the Carbon Sequestration Leadership Forum (CSLF), this equates to ca. 300–700 million hectares of land dedicated to bioenergy crops [70]. Taking these figures as correct, in the NEU scenario, where the annual emissions removed by BECCS technology equal 250 Mt CO2 in 2040 and 300 Mt in 2050, the total land requirement for energy crops would be 75–175 million hectares in 2040 and 90–210 million hectares in 2050 only to meet the needs of BECCS plants. These are large numbers, but they are much lower than those presented in other sources. Limited biomass potential also means that not all of it can be used for electricity generation; a significant amount will also be used for district heat.
Nevertheless, according to the results obtained, BECCS technology appears to be an important element of the energy generation system, without which it would be difficult to achieve negative emissions in the power industry and, thus, fail to meet the ambitious climate goals set for 2050. However, it certainly cannot be perceived as a “golden mean” solving most climate challenges. The results of the analysis take into account the development of a number of other technologies and solutions in the energy sector, such as energy efficiency improvement, the use of hydrogen, DSR services, and gas units equipped with CCS. There are also other technologies not yet covered by the model, such as direct air carbon capture and storage (DACCS); however, an initial analysis has shown that, at this point in the technology’s development, the cost of large-scale installation is lower for other NET options [71]. Overall, this demonstrates the importance of complementary solutions in achieving climate goals rather than concentrating on a limited number of technologies.
The assumption in the MEESA model of the inclusion of NETs into the EU ETS allows us to specify the level of support needed for the development and implementation of BECCS technology. The modelling results show a swift increase in installed BECCS capacity after 2030 and prices in the EU ETS system over 100 EUR/tCO2; the earlier development of this technology on lower CO2 levels would obviously require some additional financing. This information obtained from the MEESA model could be used by decision makers to accelerate and direct the development of BECCS.
A problem worth mentioning, not yet analysed in the research, is connected to the amount of support to be transferred to BECCS installations in the long term. As the EU approaches the net-zero target in terms of emissions, the price of CO2 would intensely increase and could be significantly higher than that necessary for installations such as BECCS. The EU should start addressing this potential problem at the stage of designing the future mechanism of integrating negative emissions into the EU ETS.

7. Conclusions

The results of our study confirm that BECCS technology could play an important role in reducing GHG emissions and achieving climate neutrality by 2050. Its main advantage is the possibility of providing negative emissions. The results of the analysis of the EU’s energy system indicate the necessity of developing this technology on a large scale in order to compensate for GHG emissions from other sectors. The electricity and district heat sectors are the only ones where negative emissions are possible on a large scale, except for afforestation and inventions aimed at CO2 capture from the air (which are currently still in the experimental stage, i.e., DACCS).
Additionally, BECCS installations provide a stable energy supply, which is particularly important in energy systems with a high share of intermittent RESs. They represent a valid sustainable alternative to natural gas and nuclear power plants. Moreover, biomass can be used from local sources of supply, which has a positive impact on regional economic development and job creation.
However, it is important to keep in mind that, despite the many advantages, there are barriers associated with the development of this technology that may prove difficult to overcome. One of the most important things from the point of view of the net-zero emissions goal for BECCS technology is the origin of biomass and its lifecycle CO2 emissions. The problem is noted in RED II and will play an important role in the coming years. In order to maintain the consistency of the EU ETS system, the emissions actually avoided should be carefully calculated. According to the provisions of the aforementioned directive, biomass must also meet sustainability criteria, which may limit its supply in the future and affect the increase in raw material prices.
Moreover, BECCS is a relatively expensive technology, especially when it comes to the capital expenditures to build CCS installations. While this may change over time with the technology’s development, currently, it can significantly affect the economic efficiency of such projects. CCS also reduces the efficiency of the conversion process. The deployment of BECCS will require public policy interventions at different levels. At the early stage, there is a need for additional financing to de-risk and/or co-finance investments in large-scale demonstration units. In our opinion, there is an urgent need to implement policy mechanisms that take into account and reward negative emissions.

Author Contributions

Conceptualisation, I.T., M.L., S.S., V.K. and R.J.; methodology, I.T., M.L., S.S. and R.J.; writing—original draft preparation, I.T., M.L., S.S. and V.K.; writing—review and editing, I.T., M.L., S.S., V.K., R.J., M.P., K.S. and M.S.; visualisation, I.T., M.L. and S.S.; supervision, I.T., M.L. and R.J. All authors have read and agreed to the published version of the manuscript.

Funding

This research has received funding from the European Union’s LIFE Programme and the National Fund for Environmental Protection and Water Management under grant LIFE16 GIC/PL/000031.s.

Institutional Review Board Statement

Not applicable.

Informed Consent Statement

Not applicable.

Data Availability Statement

Not applicable.

Acknowledgments

The article was prepared within the Centre for Climate and Policy Analysis (CAKE) set up by the National Centre for Emission Management (KOBiZE), which is part of the Institute of Environmental Protection–National Research Institute (IEP–NRI). It was prepared within the project “The system of providing and exchanging information in order to strategically support implementation of the climate and energy policy (LIFE Climate CAKE PL)” (LIFE16 GIC/PL/000031), which is co-financed by the EU LIFE programme and by funds from the National Fund for Environmental Protection and Water Management. More about the project can be found at http://climatecake.pl (accessed on 14 November 2021).

Conflicts of Interest

The authors declare no conflict of interest.

References

  1. Stepping Up Europe’s 2030 Climate Ambition. Investing in a Climate-Neutral Future for the Benefit of Our People. Communication from the Commission to the European Parliament, the Council, the European Economic and Social Committee and the Committee of the Regions of 17 September 2020, COM(2020) 562 Final. Available online: https://eur-lex.europa.eu/legal-content/EN/TXT/?uri=COM:2020:562:FIN (accessed on 10 September 2021).
  2. “Fit for 55”: Delivering the EU’s 2030 Climate Target on the Way to Climate Neutrality. Communication from the Commission to the European Parliament, the Council, the European Economic and Social Committee and the Committee of the Regions of 14 July 2021, COM(2021) 550 Final. Available online: https://eur-lex.europa.eu/legal-content/EN/TXT/?uri=CELEX%3A52021DC0550 (accessed on 12 September 2021).
  3. The European Green Deal. Communication from the Commission to the European Parliament, the European Council, the Council, the European Economic and Social Committee and the Committee of the Regions of 11 December 2019, COM(2019) 640 Final. Available online: https://eur-lex.europa.eu/legal-content/EN/TXT/?uri=CELEX%3A52019DC0640 (accessed on 10 September 2021).
  4. European Commission. The Just Transition Mechanism: Making Sure No One Is Left Behind. 2021. Available online: https://ec.europa.eu/info/strategy/priorities-2019-2024/european-green-deal/finance-and-green-deal/just-transition-mechanism_en (accessed on 4 September 2021).
  5. Guterres, A.; United Nations. Carbon Neutrality by 2050: The World’s Most Urgent Mission. 2020. Available online: https://www.un.org/sg/en/content/sg/articles/2020-12-11/carbon-neutrality-2050-the-world%E2%80%99s-most-urgent-mission (accessed on 10 September 2021).
  6. Huang, M.-T.; Zhai, P.-M. Achieving Paris Agreement temperature goals requires carbon neutrality by middle century with far-reaching transitions in the whole society. Adv. Clim. Chang. Res. 2021, 12, 281–286. [Google Scholar] [CrossRef]
  7. Chappell, B. To Be Carbon-Neutral By 2050, No New Oil and Coal Projects, Report Says. NPR. 2021. Available online: https://www.npr.org/2021/05/18/997834721/no-new-oil-and-coal-projects-now-to-be-carbon-neutral-by-2050-report-says?t=1633534811152 (accessed on 18 September 2021).
  8. Levin, K.; Fransen, T.; Schumer, S.; Davis, C.; World Resources Institute. What Does “Net-Zero Emissions” Mean? 8 Common Questions, Answered. 2021. Available online: https://www.wri.org/insights/net-zero-ghg-emissions-questions-answered (accessed on 8 September 2021).
  9. Tso, K.; Krol, A.; Plata, D.; MIT Climate Portal. Do We Have the Technology to Go Carbon Neutral Today? Available online: https://climate.mit.edu/ask-mit/do-we-have-technology-go-carbon-neutral-today (accessed on 24 September 2021).
  10. Wettengel, J.; Clean Energy Wire. Negative Emissions Technologies Must Be Deployed Early for Climate Neutrality. 2021. Available online: https://www.cleanenergywire.org/news/negative-emissions-technologies-must-be-deployed-early-climate-neutrality-report (accessed on 21 September 2021).
  11. Wolf, S.; Teitge, J.; Mielke, J.; Schütze, F.; Jaeger, C. The European Green Deal—More Than Climate Neutrality. Intereconomics 2021, 56, 99–107. [Google Scholar] [CrossRef] [PubMed]
  12. Budinis, S.; International Energy Agency. Going Carbon Negative: What Are the Technology Options? 2020. Available online: https://www.iea.org/commentaries/going-carbon-negative-what-are-the-technology-options (accessed on 15 September 2021).
  13. Nicolaides, C. Mission Possible—The Mission on Climate Neutral and Smart Cities A new approach to sustainable urban transformation and urban transition to climate neutrality. Renew. Energy Sustain. Dev. 2021, 7, 41–42. [Google Scholar]
  14. Babin, A.; Vaneeckhaute, C.; Iliuta, M.C. Potential and challenges of bioenergy with carbon capture and storage as a carbon-negative energy source: A review. Biomass Bioenergy 2021, 146, 105968. [Google Scholar] [CrossRef]
  15. Li, M.; Lu, Y.; Huang, M. Evolution patterns of bioenergy with carbon capture and storage (BECCS) from a science mapping perspective. Sci. Total Environ. 2021, 766, 144318. [Google Scholar] [CrossRef] [PubMed]
  16. Fajardy, M.; Morris, J.; Gurgel, A.; Herzog, H.; Mac Dowell, N.; Paltsev, S. The economics of bioenergy with carbon capture and storage (BECCS) deployment in a 1.5 °C or 2 °C world. Glob. Environ. Chang. 2021, 68, 102262. [Google Scholar] [CrossRef]
  17. Talei, S.; Soleimani, Z. An Overview of Bioenergy with Carbon Capture and Storage Process as a Negative Emission Technology. J. Environ. Agric. Biol. Sci. 2021, 3, 1–11. [Google Scholar] [CrossRef]
  18. Diyary, H.A. Bioenergy with Carbon Capture and Storage (BECCS) as an Approach to Achieve Negative Emissions in Europe. Master’s Thesis. 2021. Available online: https://dspace.library.uu.nl/handle/1874/402526 (accessed on 21 September 2021).
  19. Nicolle, W. Four Negative Emission Technologies (NETs) That Could Get Us to Net Zero. Policy Exchange. 2020. Available online: https://policyexchange.org.uk/four-negative-emission-technologies-nets-that-could-get-us-to-net-zero (accessed on 1 October 2021).
  20. Tanzer, S.E.; Blok, K.; Ramírez, A. Decarbonising Industry via BECCS: Promising Sectors, Challenges, and Techno-economic Limits of Negative Emissions. Curr. Sustain./Renew. Energy Rep. 2021. [Google Scholar] [CrossRef]
  21. Rosa, L.; Sanchez, D.; Mazzotti, M. The Role of Beccs to Deliver Negative CO2 Emissions in Europe. In Proceedings of the TCCS-11—Trondheim Conference on CO2 Capture, Transport and Storage, Trondheim, Norway, 21–23 June 2021; Available online: https://hdl.handle.net/11250/2780214 (accessed on 9 September 2021).
  22. Pyrka, M.; Jeszke, R.; Boratyński, J.; Tatarewicz, I.; Witajewski-Baltvilks, J.; Rabiega, W.; Wąs, A.; Kobus, P.; Lewarski, M.; Skwierz, S.; et al. Mapa Drogowa Osiągnięcia Wspólnotowych Celów Polityki Klimatycznej dla Polski do 2050 r. Instytut Ochrony Środowiska—Państwowy Instytut Badawczy/Krajowy Ośrodek Bilansowania i Zarządzania Emisjami (KOBiZE), Warszawa. 2021. Available online: https://climatecake.ios.edu.pl/wp-content/uploads/2021/07/CAKE_Mapa-drogowa-net-zero-dla-PL.pdf (accessed on 15 September 2021).
  23. Creutzig, F.; Erb, K.-H.; Haberl, H.; Hof, C.; Hunsberger, C.; Roe, S. Considering sustainability thresholds for BECCS in IPCC and biodiversity assessments. GCB Bioenergy 2021, 13, 510–515. [Google Scholar] [CrossRef]
  24. IPCC. 2018: Summary for Policymakers. In Global Warming of 1.5 °C. An IPCC Special Report on the Impacts of Global Warming of 1.5 °C Above Pre-Industrial Levels and Related Global Greenhouse Gas Emission Pathways, in the Context of Strengthening the Global Response to the Threat of Climate Change, Sustainable Development, and Efforts to Eradicate Poverty; Masson-Delmotte, V., Zhai, P., Pörtner, H.-O., Roberts, D., Skea, J., Shukla, P.R., Pirani, A., Moufouma-Okia, W., Péan, C., Pidcock, R., et al., Eds.; in press; Intergovernmental Panel on Climate Change: Geneva, Switzerland.
  25. IEA. Carbon Removal through BECCS and DACS in the Sustainable Development Scenario and IPCC SR1.5 Scenarios, 2030–2100. Paris, France, 2020. Updated 23 September 2020. Available online: https://www.iea.org/data-and-statistics/charts/carbon-removal-through-beccs-and-dacs-in-the-sustainable-development-scenario-and-ipcc-sr1-5-scenarios-2030-2100 (accessed on 26 September 2021).
  26. Global Energy Assessment Scenario Database. 2019. Available online: https://iiasa.ac.at/web/home/research/researchPrograms/Energy/Global-Energy-Assessment-Database.en.html (accessed on 30 September 2021).
  27. Energy Modeling Forum. EMF 28: The Effects of Technology Choices on EU Climate Policy. Available online: https://emf.stanford.edu/projects/emf-28-effects-technology-choices-eu-climate-policy (accessed on 28 September 2021).
  28. Science for Global Insight. Public GEA Scenario Database. Available online: https://tntcat.iiasa.ac.at/geadb/dsd?Action=htmlpage&page=about (accessed on 27 September 2021).
  29. Science for Global Insight. AMPERE Project. Available online: https://tntcat.iiasa.ac.at/AMPEREDB/dsd?Action=htmlpage&page=about (accessed on 27 September 2021).
  30. Science for Global Insight. CD-LINKS Scenario Database (Version 1.0). Available online: https://db1.ene.iiasa.ac.at/CDLINKSDB/dsd?Action=htmlpage&page=10 (accessed on 27 September 2021).
  31. NGFS Climate Scenarios. Network for Greening the Financial System. Available online: https://www.ngfs.net/en/publications/ngfs-climate-scenarios (accessed on 28 September 2021).
  32. Regulation (EU) 2021/1119 of the European Parliament and of the Council of 30 June 2021 Establishing the Framework for Achieving Climate Neutrality and Amending Regulations (EC) No 401/2009 and (EU) 2018/1999 (European Climate Law). Available online: https://eur-lex.europa.eu/legal-content/EN/TXT/?uri=CELEX%3A32021R1119 (accessed on 12 September 2021).
  33. A Clean Planet for All, A European Strategic Long-Term Vision for a Prosperous, Modern, Competitive and Climate Neutral Economy. Communication from the Commission of 28 November 2018, COM(2018), 773 Final, Brussels, Belgium. Available online: https://eur-lex.europa.eu/legal-content/EN/TXT/?uri=CELEX%3A52018DC0773 (accessed on 3 September 2021).
  34. Ten Year Europe’s Network Development Plan to 2025, 2030 and 2040. ENTSO-E, 2020, Brussels, Belgium. Available online: https://tyndp.entsoe.eu (accessed on 30 September 2021).
  35. Climate Change Committee. The Sixth Carbon Budget, Greenhouse Gas Removals. 2020. Available online: https://www.theccc.org.uk/wp-content/uploads/2020/12/Sector-summary-GHG-removals.pdf (accessed on 17 September 2021).
  36. Climate Change Committee. Net Zero: The UK’s Contribution to Stopping Global Warming. 2019. Available online: https://www.theccc.org.uk/publication/net-zero-the-uks-contribution-to-stopping-global-warming (accessed on 17 September 2021).
  37. System of Providing and Disseminating Information in Order to Support the Strategic Implementation of Climate Policy (LIFE Climate CAKE PL) Project. Available online: http://climatecake.pl (accessed on 27 September 2021).
  38. Williams, R.H. Fuel Decarbonization for Fuel Cell Applications and Sequestration of the Separated CO2; PU/CEES Report No. 295; Center for Energy and Environmental Studies, Princeton University: Princetown, NJ, USA, 1996. [Google Scholar]
  39. Carton, W.; Asiyanbi, A.; Beck, S.; Buck, H.J.; Lund, J.F. Negative emissions and the long history of carbon removal. WIREs Clim. Chang. 2020, 11, e671. [Google Scholar] [CrossRef]
  40. Vandermel, J. Preventing Climate Change with BECCS: Bioenergy Carbon Capture and Storage; PSCI, Princeton University: Princetown, NJ, USA, 2020; Available online: https://psci.princeton.edu/tips/2020/11/15/preventing-climate-change-with-beccs-bioenergy-with-carbon-capture-and-storage (accessed on 23 September 2021).
  41. Fajardy, M.; Kὅberle, A.; Mac Dowell, N.; Fantuzzi, A. BECCS Deployment: A Reality Check; Briefing Paper No 28; Imperial College London, Graham Institute: London, UK, 2020. [Google Scholar]
  42. Consoli, C. Bioenergy and Carbon Capture and Storage: 2019 Perspective; Global CCS Institute: Melbourne, Australia, 2019; Available online: https://www.globalccsinstitute.com/wp-content/uploads/2019/03/BECCS-Perspective_FINAL_PDF.pdf (accessed on 7 September 2021).
  43. Budinis, S.; Krevor, S.; Dowell, N.M.; Brandon, N.; Hawkes, A. An assessment of CCS costs, barriers and potential. Energy Strategy Rev. 2018, 22, 61–81. [Google Scholar] [CrossRef]
  44. Directive (EU) 2018/2001 of the European Parliament and of the Council of 11 December 2018 on the Promotion of the Use of Energy from Renewable Sources, 11 December 2018. Available online: https://eur-lex.europa.eu/legal-content/EN/TXT/?uri=uriserv:OJ.L_.2018.328.01.0082.01.ENG (accessed on 21 September 2021).
  45. Supporting the Deployment of Bioenergy Carbon Capture and Storage (BECCS) in the UK: Business Model Options. Frontier Economics. A report for Drax, March 2021. Available online: https://www.drax.com/wp-content/uploads/2021/04/Frontier-Economics-Supporting-the-Deployment-of-BECCS.pdf (accessed on 26 September 2021).
  46. Rickels, W.; Proelß, A.; Geden, O.; Burhenne, J.; Fridahl, M. The Future of (Negative) Emissions Trading in the European Union; Kiel Working Paper, No. 2164; Kiel Institute for the World Economy (IfW): Kiel, German, 2020; Available online: http://pure.iiasa.ac.at/id/eprint/16704 (accessed on 25 September 2021).
  47. Howells, M.; Rogner, H.; Strachan, N.; Heaps, C.; Huntington, H.; Kypreos, S.; Hughes, A.; Silveira, S.; DeCarolis, J.; Bazilian, M.; et al. OSeMOSYS: The Open Source Energy Modeling System: An introduction to its ethos, structure and development. Energy Policy 2011, 39, 5850–5870. [Google Scholar] [CrossRef]
  48. Tatarewicz, I.; Lewarski, M.; Skwierz, S. The MEESA Model, Ver. 1.0; Institute of Environmental Protection—National Research Institute/National Centre for Emissions Management (KOBiZE): Warsaw, Poland, 2020. [Google Scholar]
  49. Gąska, J.; Pyrka, M.; Rabiega, W.; Jeszke, R. The CGE Model d-PLACE, Ver.1.0; Institute of Environmental Protection—National Research Institute/National Centre for Emissions Management (KOBiZE): Warsaw, Poland, 2020. [Google Scholar]
  50. Wąs, A.; Witajewski-Baltvilks, J.; Krupin, V.; Kobus, P. The EPICA Model, Ver. 1.0; Institute of Environmental Protection—National Research Institute/National Centre for Emissions Management (KOBiZE): Warsaw, Poland, 2020. [Google Scholar]
  51. Rabiega, W.; Sikora, P.; Gąska, J. The TR3E Model, Ver.1.0; Institute of Environmental Protection—National Research Institute/National Centre for Emissions Management (KOBiZE): Warsaw, Poland, 2020. [Google Scholar]
  52. IPCC. Climate Change 2007: Synthesis Report. In Contribution of Working Groups I, II and III to the Fourth Assessment Report of the Intergovernmental Panel on Climate Change; Core Writing Team, Pachauri, R.K., Reisinger, A., Eds.; IPCC: Geneva, Switzerland, 2007. [Google Scholar]
  53. Dixon, P.B.; Jorgenson, D. (Eds.) Handbook of Computable General Equilibrium Modelling; Elsevier: Amsterdam, The Netherlands, 2012; 888p. [Google Scholar]
  54. Primes Reference Scenario 2020. Final Assumptions, E3-Modelling; Brussels, Belgium. 2020. Available online: https://ec.europa.eu/energy/data-analysis/energy-modelling/eu-reference-scenario-2020_en (accessed on 20 September 2021).
  55. Carbon Capture, Utilisation and Storage. Joint Research Centre, EU Science Hub. 2021. Available online: https://ec.europa.eu/jrc/en/research-topic/carbon-capture-utilisation-and-storage (accessed on 30 September 2021).
  56. World Energy Outlook 2017; International Energy Agency: Paris, France, 2018; Available online: https://www.iea.org/reports/world-energy-outlook-2017 (accessed on 30 September 2021).
  57. Elbersen, B.; Startisky, I.; Hengeveld, G.; Schelhaas, M.-J.; Naeff, H. Atlas of EU Biomass Potentials. Deliverable 3.3: Spatially Detailed and Quantified Overview of EU Biomass Potential Taking into Account the Main Criteria Determining Biomass Availability from Different Sources; Alterra/IIASA: Wageningen, The Netherlands, 2012; 139p. [Google Scholar]
  58. Ruiz, P.; Sgobbi, A.; Nijs, W.; Thiel, C.; Longa, F.D.; Kober, T.; Elbersen, B.; Hengeveld, G. The JRC-EU-TIMES model. Bioenergy Potentials for EU and Neighbouring Countries; Publications Office of the European Union: Luxembourg, 2015. [Google Scholar]
  59. Schlömer, S.; Bruckner, T.; Fulton, L.; Hertwich, E.; McKinnon, A.; Perczyk, D.; Roy, J.; Schaeffer, R.; Sims, R.; Smith, P.; et al. Annex III: Technology-specific cost and performance parameters. In Climate Change 2014: Mitigation of Climate Change. Contribution of Working Group III to the Fifth Assessment Report of the Intergovernmental Panel on Climate Change; Edenhofer, O., Pichs-Madruga, R., Sokona, Y., Farahani, E., Kadner, S., Seyboth, K., Adler, A., Baum, I., Brunner, S., Eickemeier, P., et al., Eds.; Cambridge University Press: Cambridge, UK; New York, NY, USA, 2014. [Google Scholar]
  60. What Is BECCS? Fact Sheet 2020; American University: Washington, DC, USA, 2020.
  61. Fridahl, M.; Lehtveer, M. Bioenergy with carbon capture and storage (BECCS): Global potential, investment preferences, and deployment barriers. Energy Res. Soc. Sci. 2018, 42, 155–165. [Google Scholar] [CrossRef]
  62. Bellamy, R.; Lezaun, J.; Palmer, J. Perceptions of bioenergy with carbon capture and storage in different policy scenarios. Nat. Commun. 2019, 10, 743. [Google Scholar] [CrossRef] [PubMed] [Green Version]
  63. Gough, C.; Vaughan, N.E. Synthesising Existing Knowledge on the Feasibility of BECCS. AVOID 2 Programme. 2015. Available online: http://avoid-net-uk.cc.ic.ac.uk/wp-content/uploads/delightful-downloads/2015/07/Synthesising-existing-knowledge-on-the-feasibility-of-BECCS-AVOID-2_WPD1a_v1.pdf (accessed on 2 September 2021).
  64. Wallquist, L.; Seigo, S.L.; Visschers, V.; Siegrist, M. Public acceptance of CCS system elements: A conjoint measurement. Int. J. Greenh. Gas Control 2012, 6, 77–83. [Google Scholar] [CrossRef]
  65. Parmiter, P.; Bell, R. Public perception of CCS: A Review of Public Engagement for CCS Projects. 2nd Report of the Thematic Working Group on: Policy, Regulation and Public Perception. CCUS Project Network. 2020. Available online: https://www.ccusnetwork.eu/sites/default/files/TG1_Briefing-Report-Public-Perception-of-CCS.pdf (accessed on 8 September 2021).
  66. Jasiński, J.; Kozakiewicz, M.; Sołtysik, M. Determinants of Energy Cooperatives’ Development in Rural Areas—Evidence from Poland. Energies 2021, 14, 319. [Google Scholar] [CrossRef]
  67. Bellamy, R.; Fridahl, M.; Lezaun, J.; Palmer, J.; Rodriguez, E.; Lefvert, A.; Hansson, A.; Grönkvist, S.; Haikola, S. Incentivising bioenergy with carbon capture and storage (BECCS) responsibly: Comparing stakeholder policy preferences in the United Kingdom and Sweden. Environ. Sci. Policy 2021, 116, 47–55. [Google Scholar] [CrossRef]
  68. Fajardy, M.; Mac Dowell, N. Can BECCS Deliver Sustainable and Resource Efficient Negative Emissions? Energy Environ. Sci. 2017, 10, 1389–1426. [Google Scholar] [CrossRef] [Green Version]
  69. National Academy of Sciences (NAS). Negative Emissions Technologies and Reliable Sequestration: A Research Agenda; The National Academies Press: Washington, DC, USA, 2019. [Google Scholar] [CrossRef]
  70. Carbon Sequestration Leadership Forum. Technical Summary of Bioenergy Carbon Capture and Storage (BECCS). 2018. Available online: https://www.cslforum.org/cslf/sites/default/files/documents/Publications/BECCS_Task_Force_Report_2018-04-04.pdf (accessed on 7 September 2021).
  71. Realmonte, G.; Drouet, L.; Gambhir, A.; Glynn, J.; Hawkes, A.; Köberle, A.C.; Tavoni, M. An inter-model assessment of the role of direct air capture in deep mitigation pathways. Nat. Commun. 2019, 10, 3277. [Google Scholar] [CrossRef] [PubMed]
Figure 1. Bioenergy with carbon capture and storage (BECCS) technology. Source: own compilation based on [42].
Energies 14 07842 g001
Figure 2. LIFE Climate CAKE PL project: general scheme of models and interactions. Source: own elaboration [37].
Energies 14 07842 g002
Figure 3. Schematic of energy chain implemented in the MEESA model. Source: own elaboration [48].
Energies 14 07842 g003
Figure 4. Installed electricity generation capacity by fuels and technologies in the EU+ (in GW). Source: own calculations based on MEESA model results.
Energies 14 07842 g004
Figure 5. Electricity generation by fuels and sources in the EU+ (in MWh). Source: own calculations based on MEESA model results.
Energies 14 07842 g005
Figure 6. Use of biomass in the considered scenarios (in PJ). Source: own calculations based on MEESA model results.
Energies 14 07842 g006
Figure 7. Electricity demand in the considered scenarios (in PJ). Source: own calculations based on d-PLACE model results.
Energies 14 07842 g007
Figure 8. Average electricity generation cost in the EU+ countries (in EUR’2015/MWh). Source: own calculations based on MEESA model results.
Energies 14 07842 g008
Figure 9. CO2 price in the EU+ (in EUR/tCO2). Source: own calculations based on MEESA and d-PLACE models.
Energies 14 07842 g009
Figure 10. Total CO2 emissions in the EU+ energy sector (in Mt CO2). Source: own calculations based on MEESA model.
Energies 14 07842 g010
Table 1. Techno-economic parameters of key technologies covered by the model for selected years. Source: Primes [54] and own assumptions.
TechnologyOvernight Investment Cost *, EUR/kWFixed Operation and Maintenance Cost, EUR/kWyrVariable Cost, EUR/MWhElectrical Efficiency (Net) in Optimal Load Operation, RatioTechnical Lifetime, Years
203020402050203020402050203020402050203020402050
BECCS_PP370033003200696361 5.95.85.80.310.320.3240
BECCS_CHP5000450043009385828.07.87.80.250.260.2640
Biomass_PP1800170017004039383.63.63.60.390.400.4040
Biomass_CHP2450230023005453524.94.94.90.300.300.3030
Gas_PP5805755702120191.91.81.70.610.620.6330
GAS_CHP7807757702827262.62.42.30.480.480.4830
GAS_PP_CCS1625150015003835343.02.92.80.500.500.5030
GAS_CHP_CCS2200202520255247464.13.93.80.320.320.3230
Lignite_PP_CCS3340325031506562615.13.63.40.330.340.3540
Coal_PP_CCS3150289028506556545.04.84.80.370.380.3840
Biogas4654584502424232.62.62.60.380.390.3925
Nuclear5100490047001151081057.47.67.80.380.380.3860
Wind—onshore1175115011001312120.20.20.21.001.001.0030
Wind—offshore1650157715032726260.40.40.41.001.001.0030
Solar PV551529507151190.00.00.01.001.001.0030
Solar PV small543522500151190.00.00.01.001.001.0030
Hydro1670166016508880.00.00.01.001.001.0050
* Note: excluding financial costs during construction.
Publisher’s Note: MDPI stays neutral with regard to jurisdictional claims in published maps and institutional affiliations.

