
Thermal Comfort and Energy Analysis of a Hybrid Cooling System by Coupling Natural Ventilation with Radiant and Indirect Evaporative Cooling

 , ,
, , 
Abstract
:1. Introduction
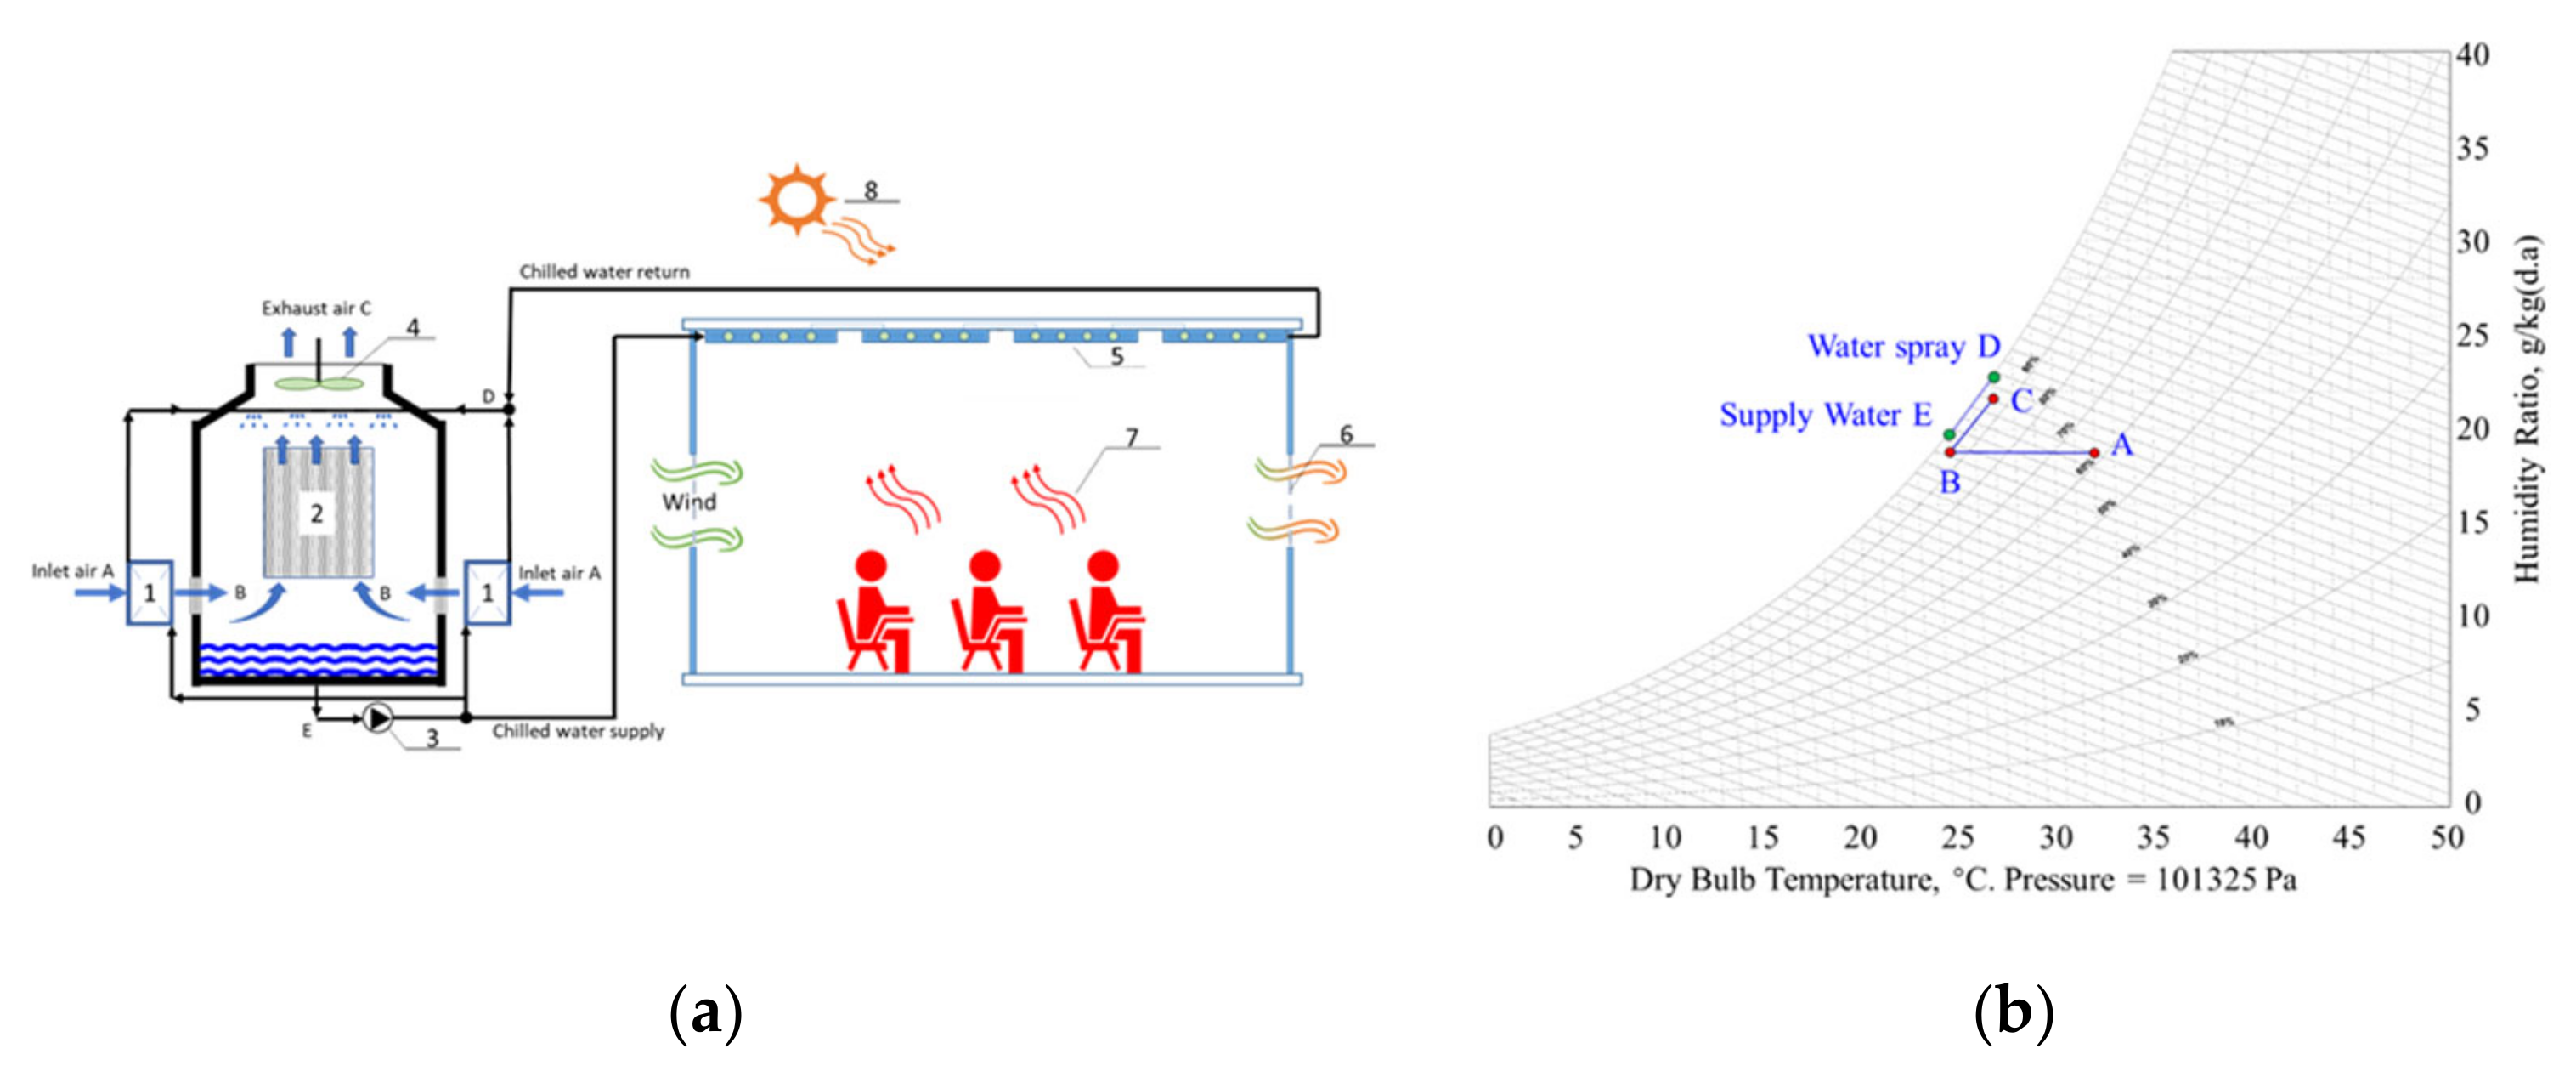
2. Proposed Hybrid Cooling System
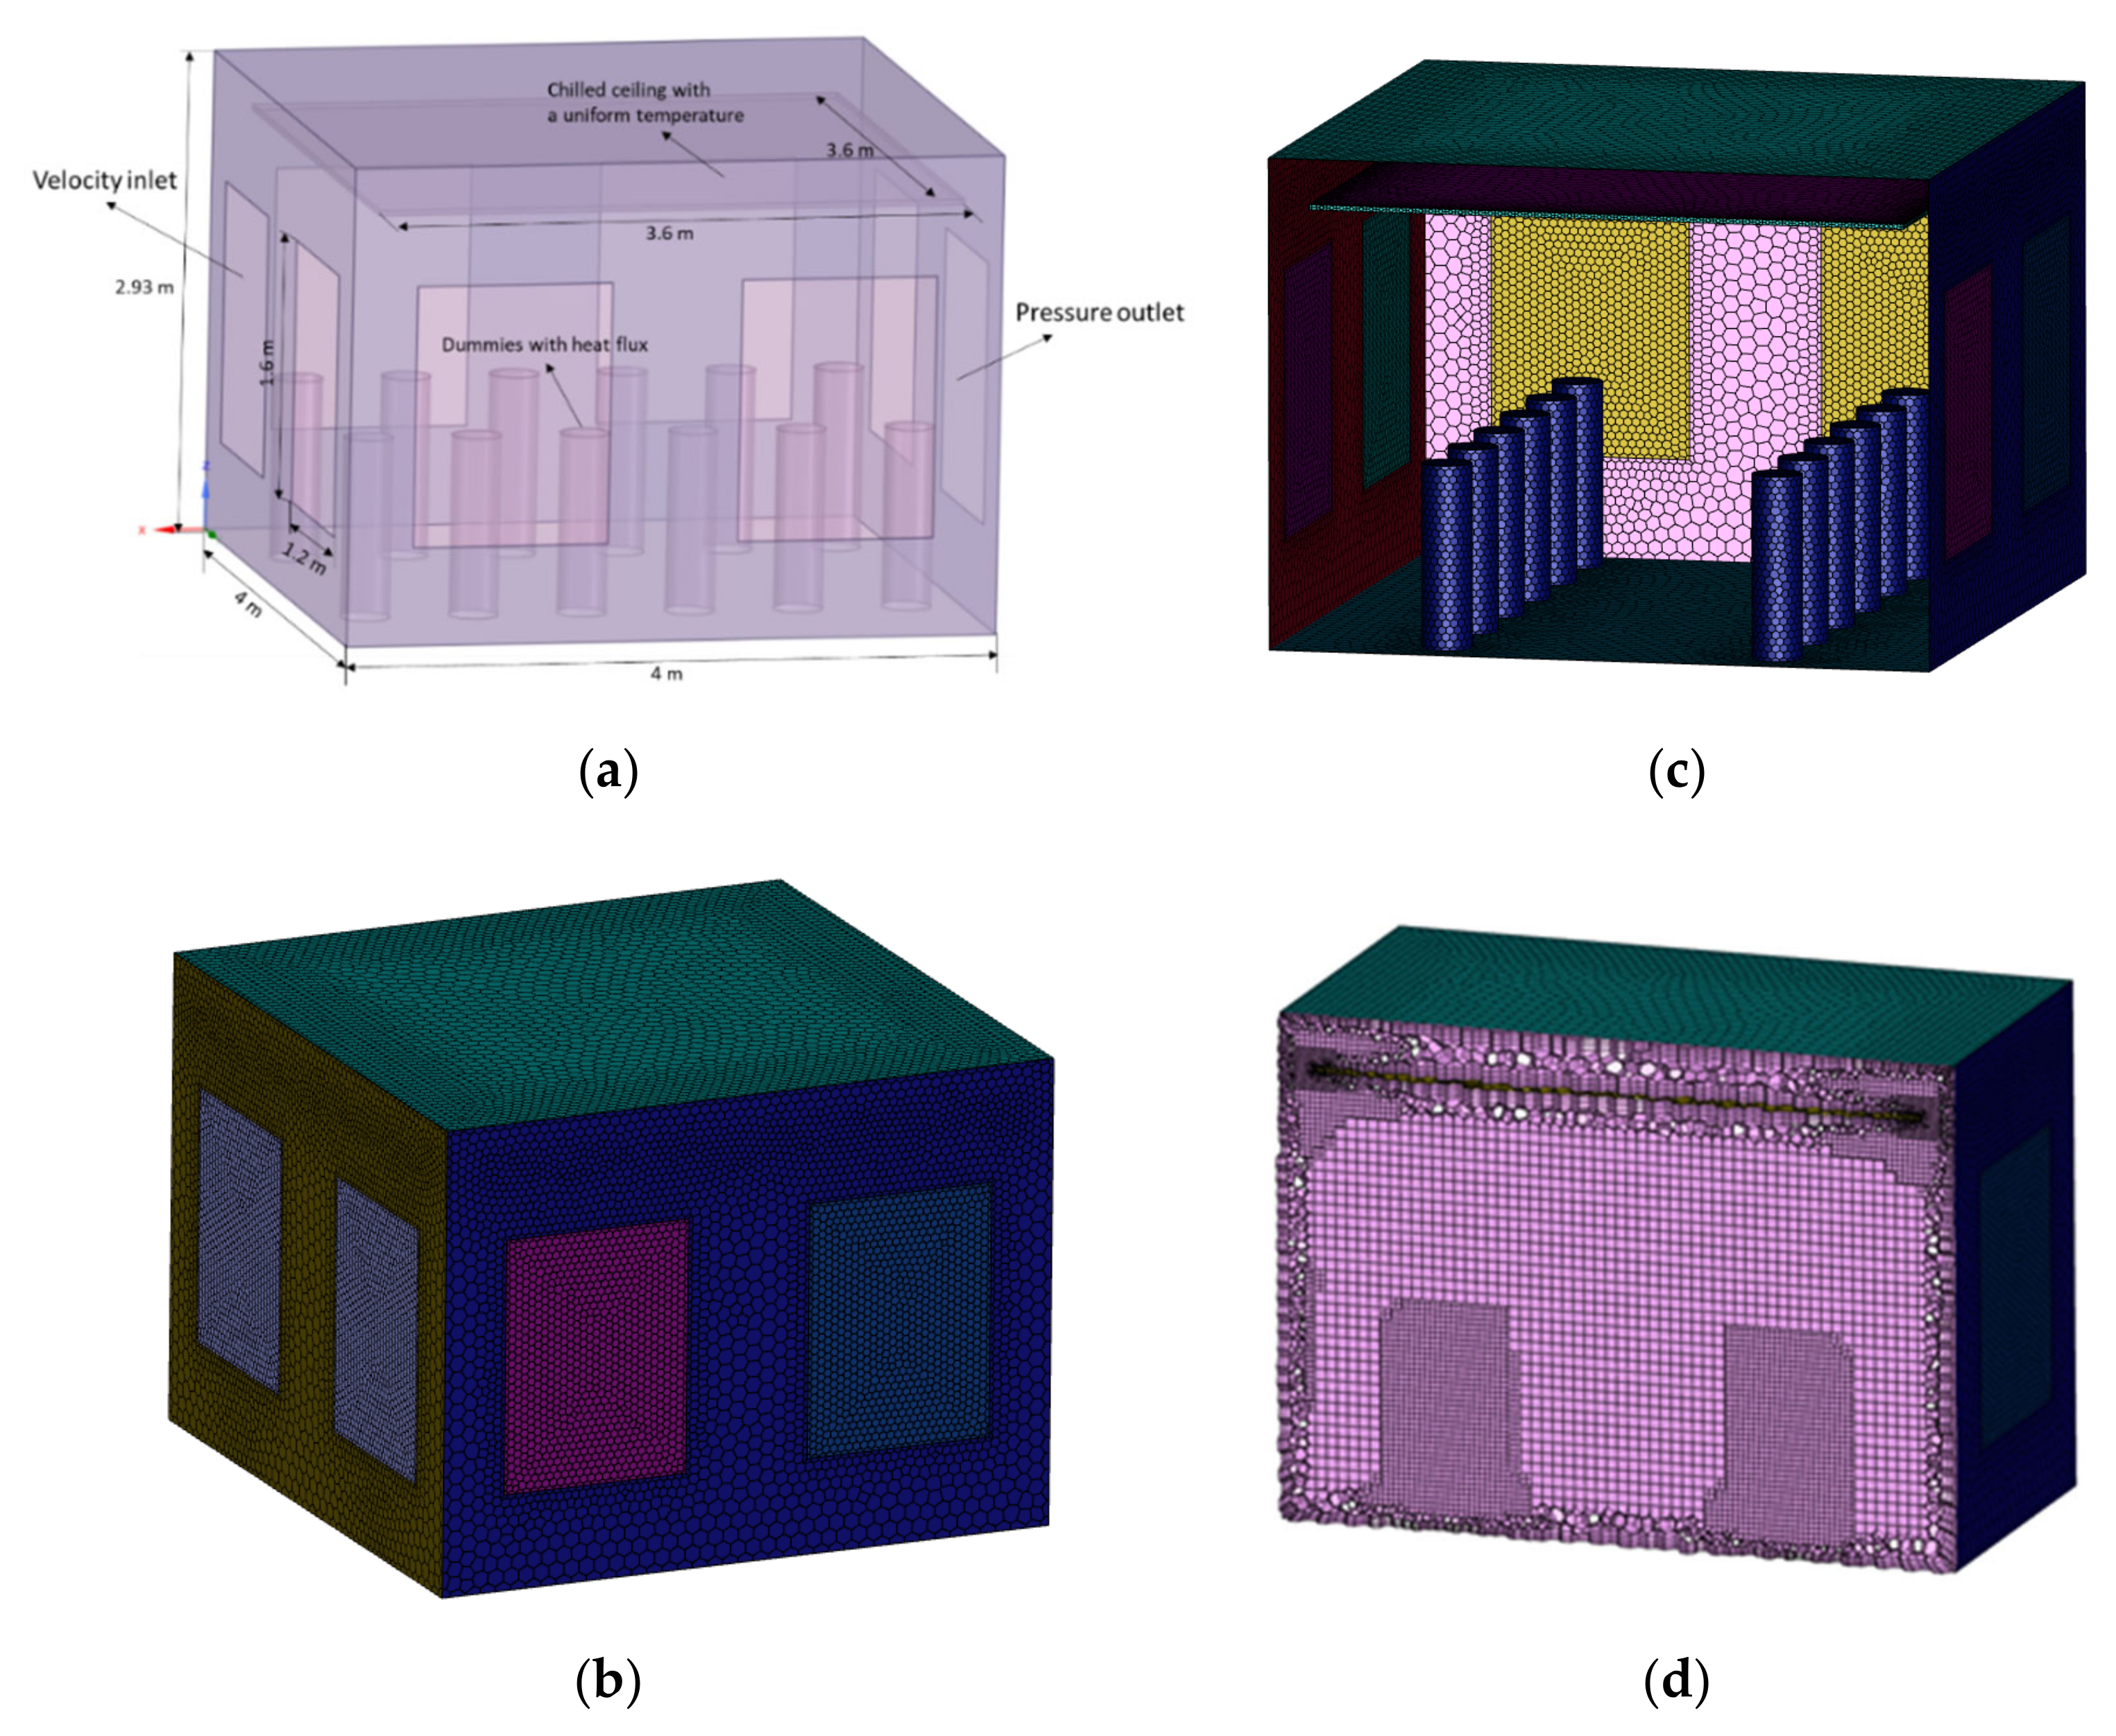
3. CFD Model
- Turbulent flow was obtained using the realizable (k-ε) model with enhanced wall treatment including the effects of gravity for flow analysis.
- An incompressible ideal gas model was assumed.
- A surface-to-surface radiation heat transfer model was used.
- A solution method employing a pressure-based coupled scheme for pressure-velocity coupling was used.
- A body force weighted method for the pressure interpolation scheme was used as it resulted in a stable solution for buoyancy calculations.
4. Mathematical Models
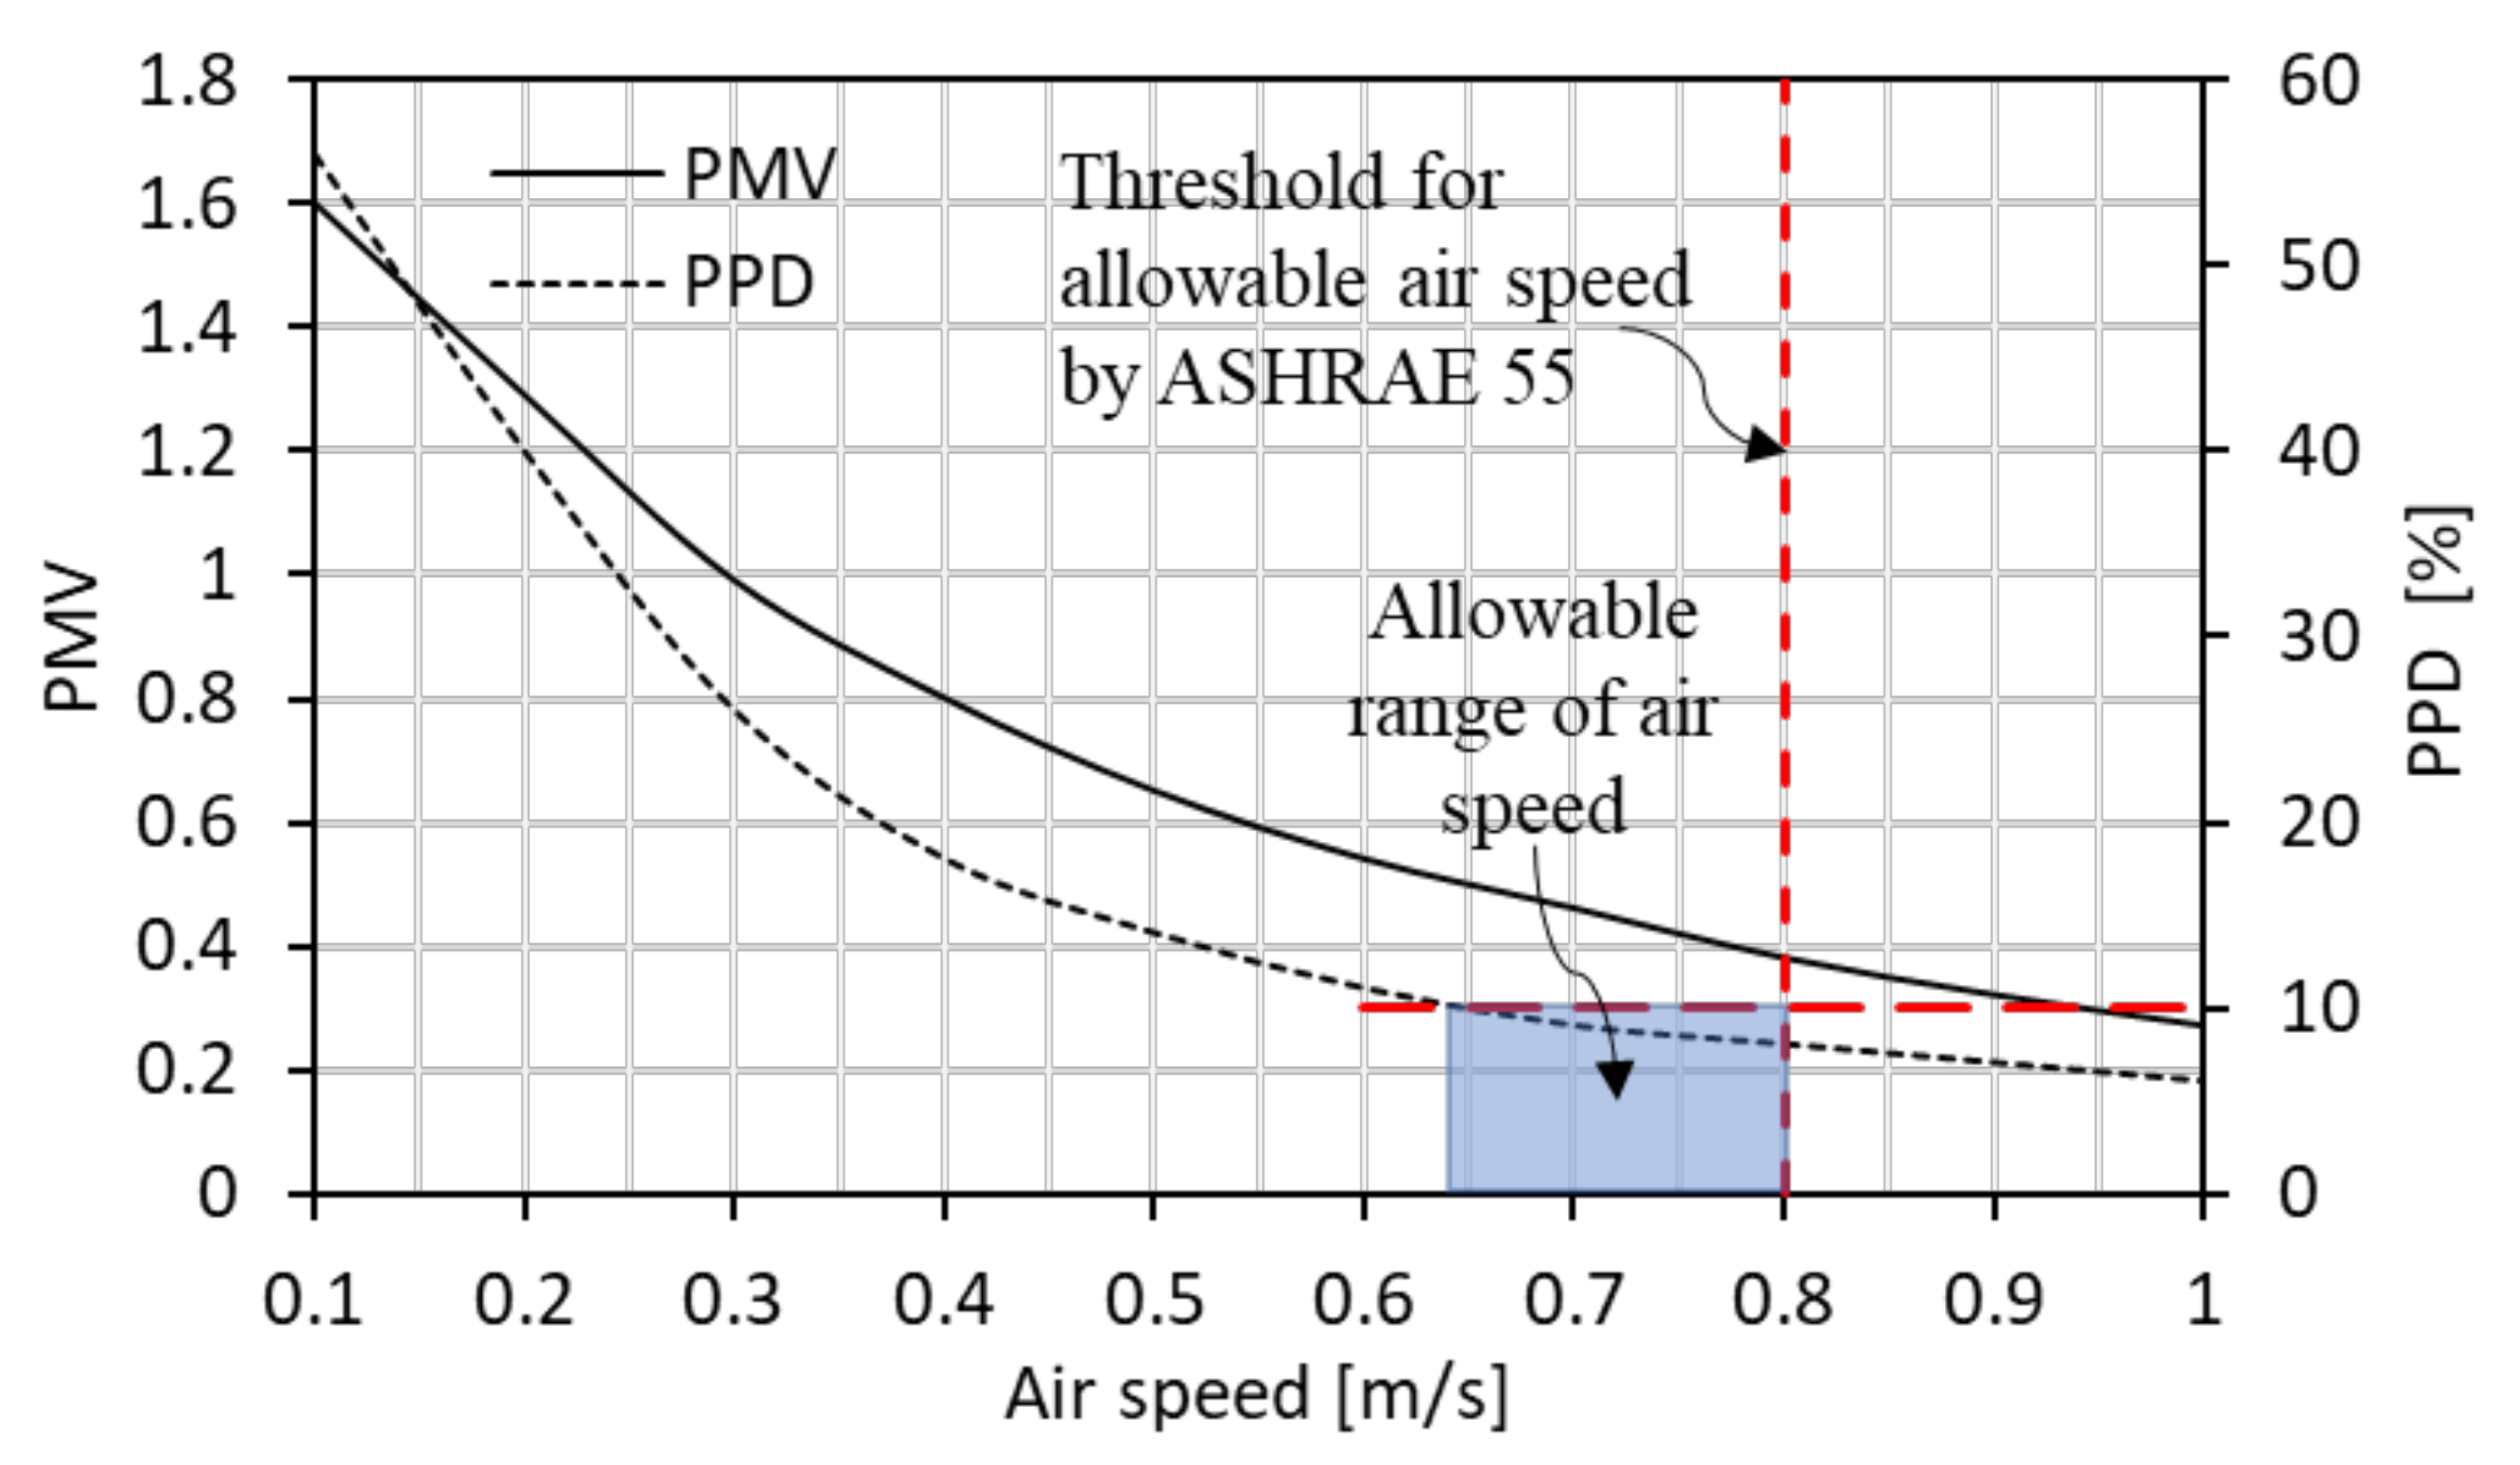
4.1. Thermal Comfort
4.2. Energy Calculation
- The supply fresh air comes from natural ventilation, leading to a reduced fan energy;
- Higher supply water temperature means higher COP of IEC;
- The hybrid system can achieve the same thermal comfort with a higher room temperature, because of the elevated air speed and lower MRT.
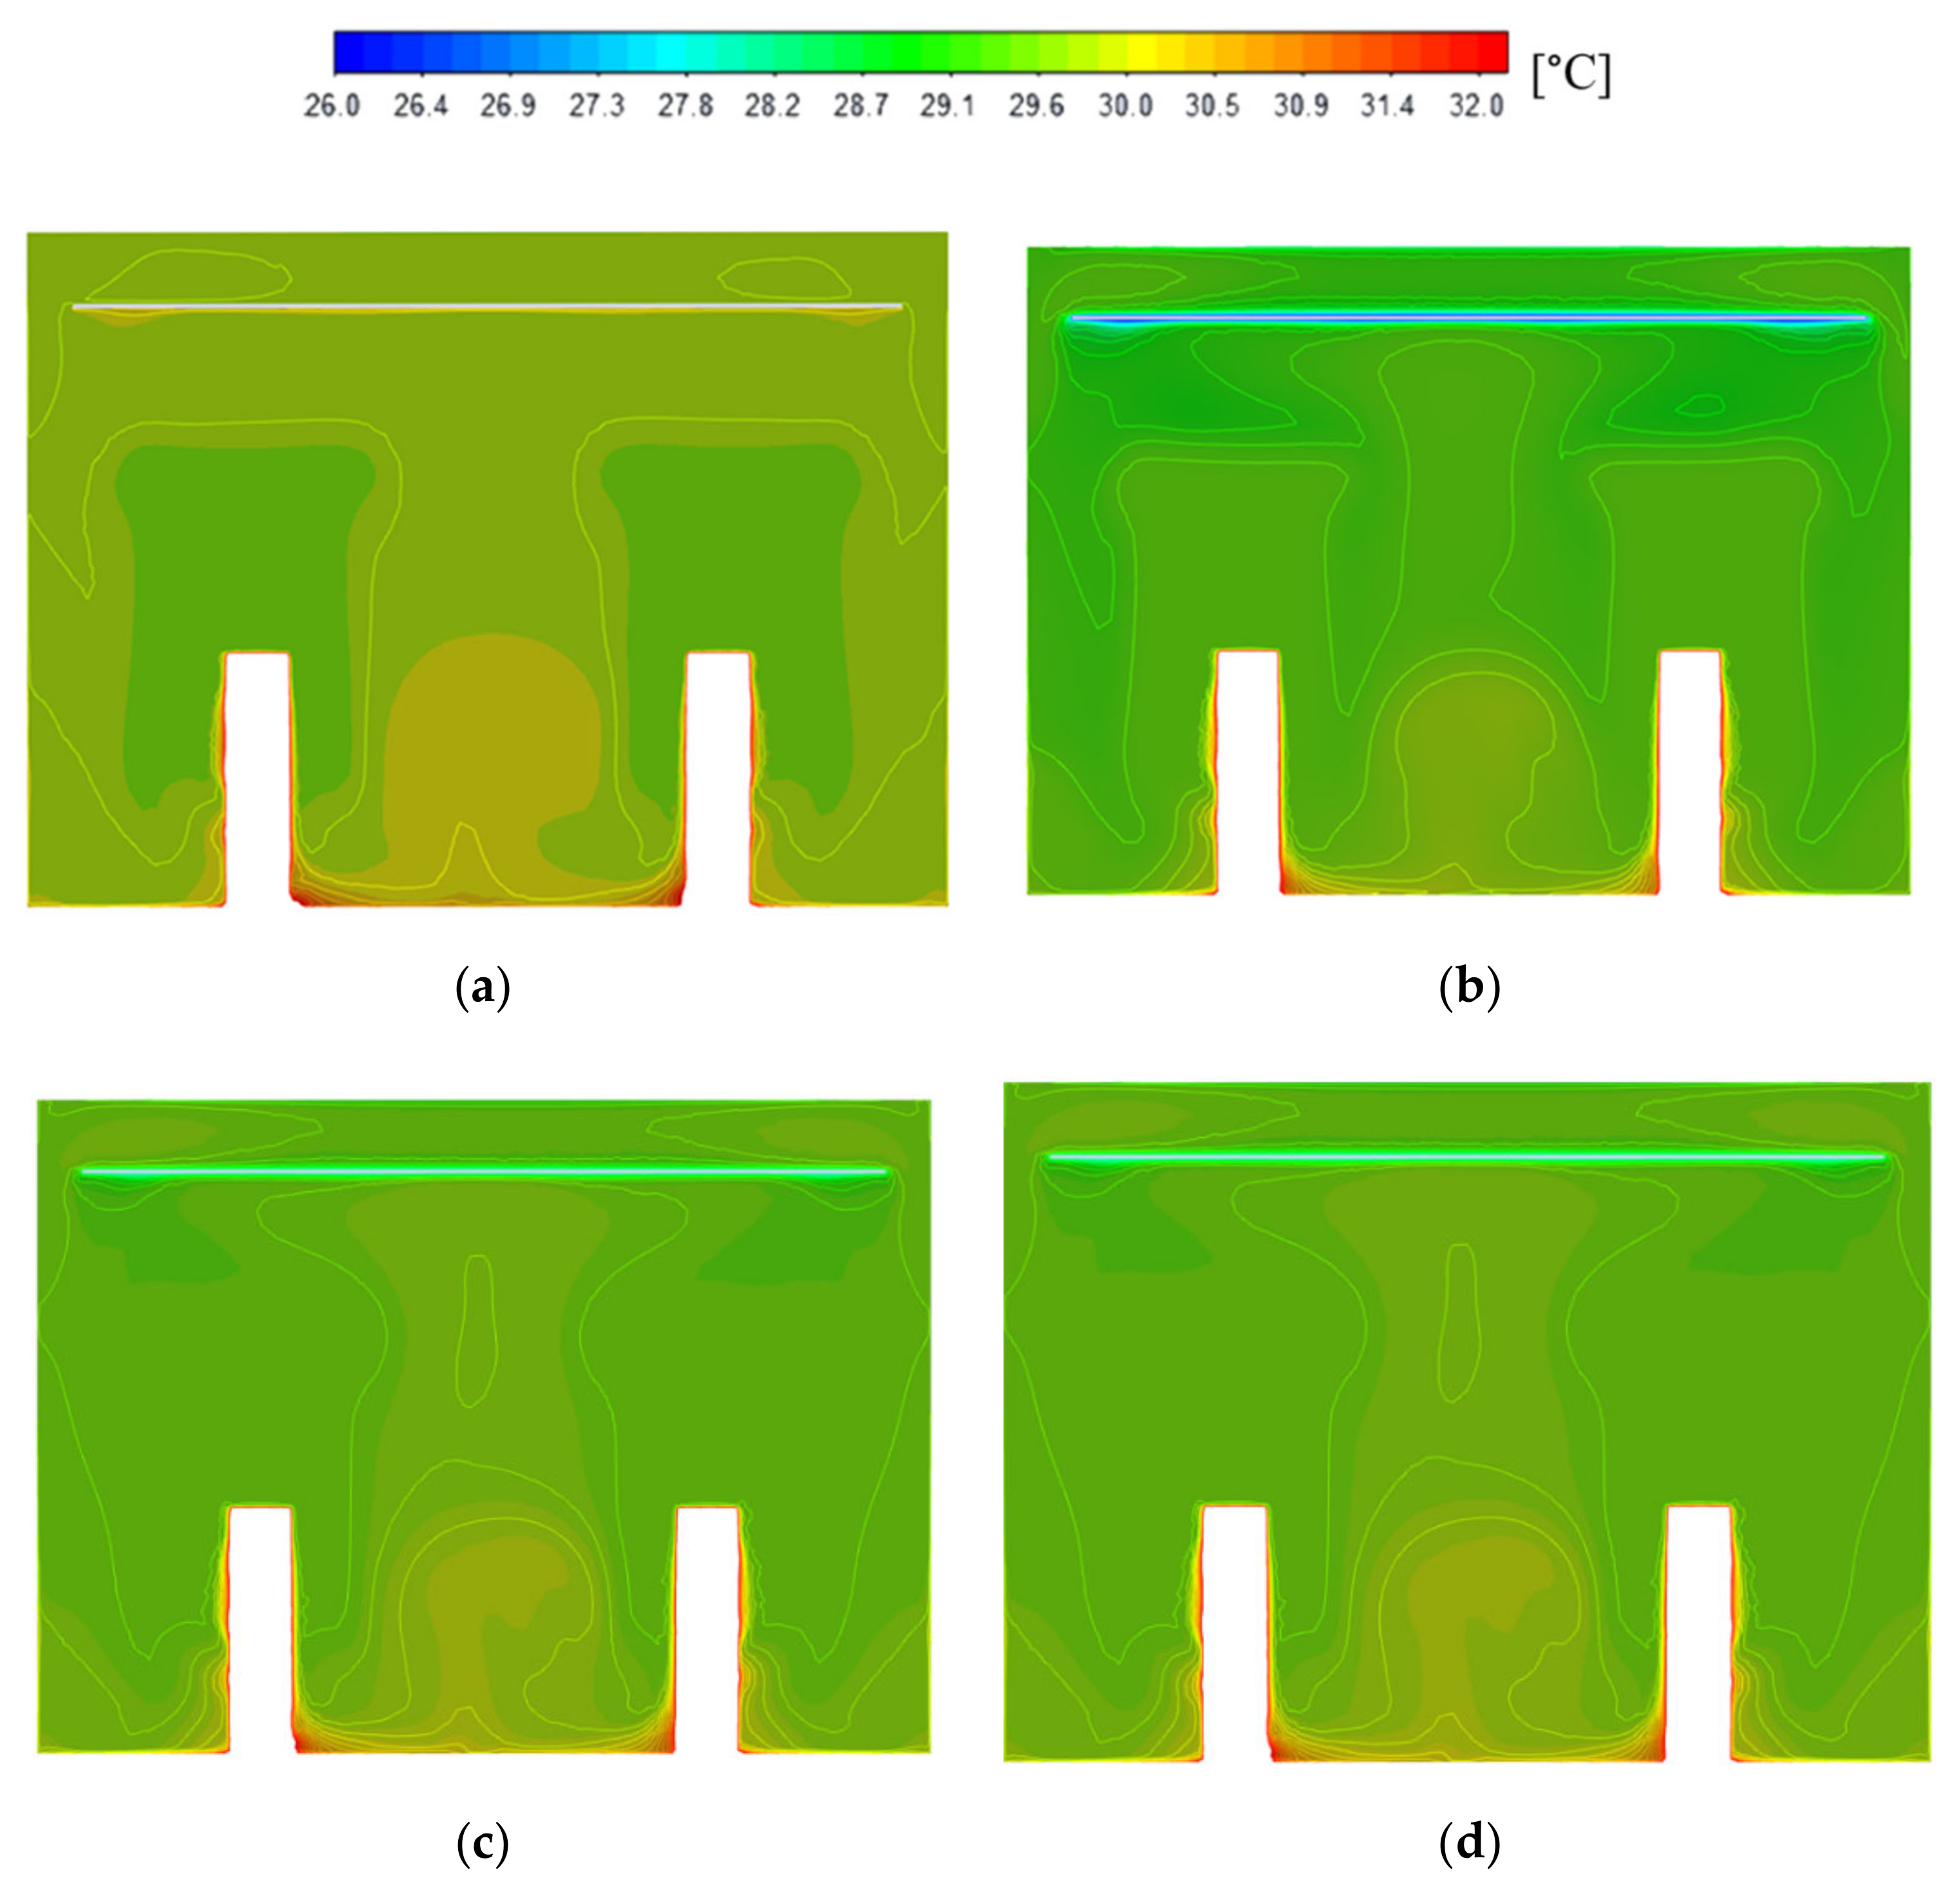
5. Results and Discussion
5.1. Effect of CCP Surface Temperature
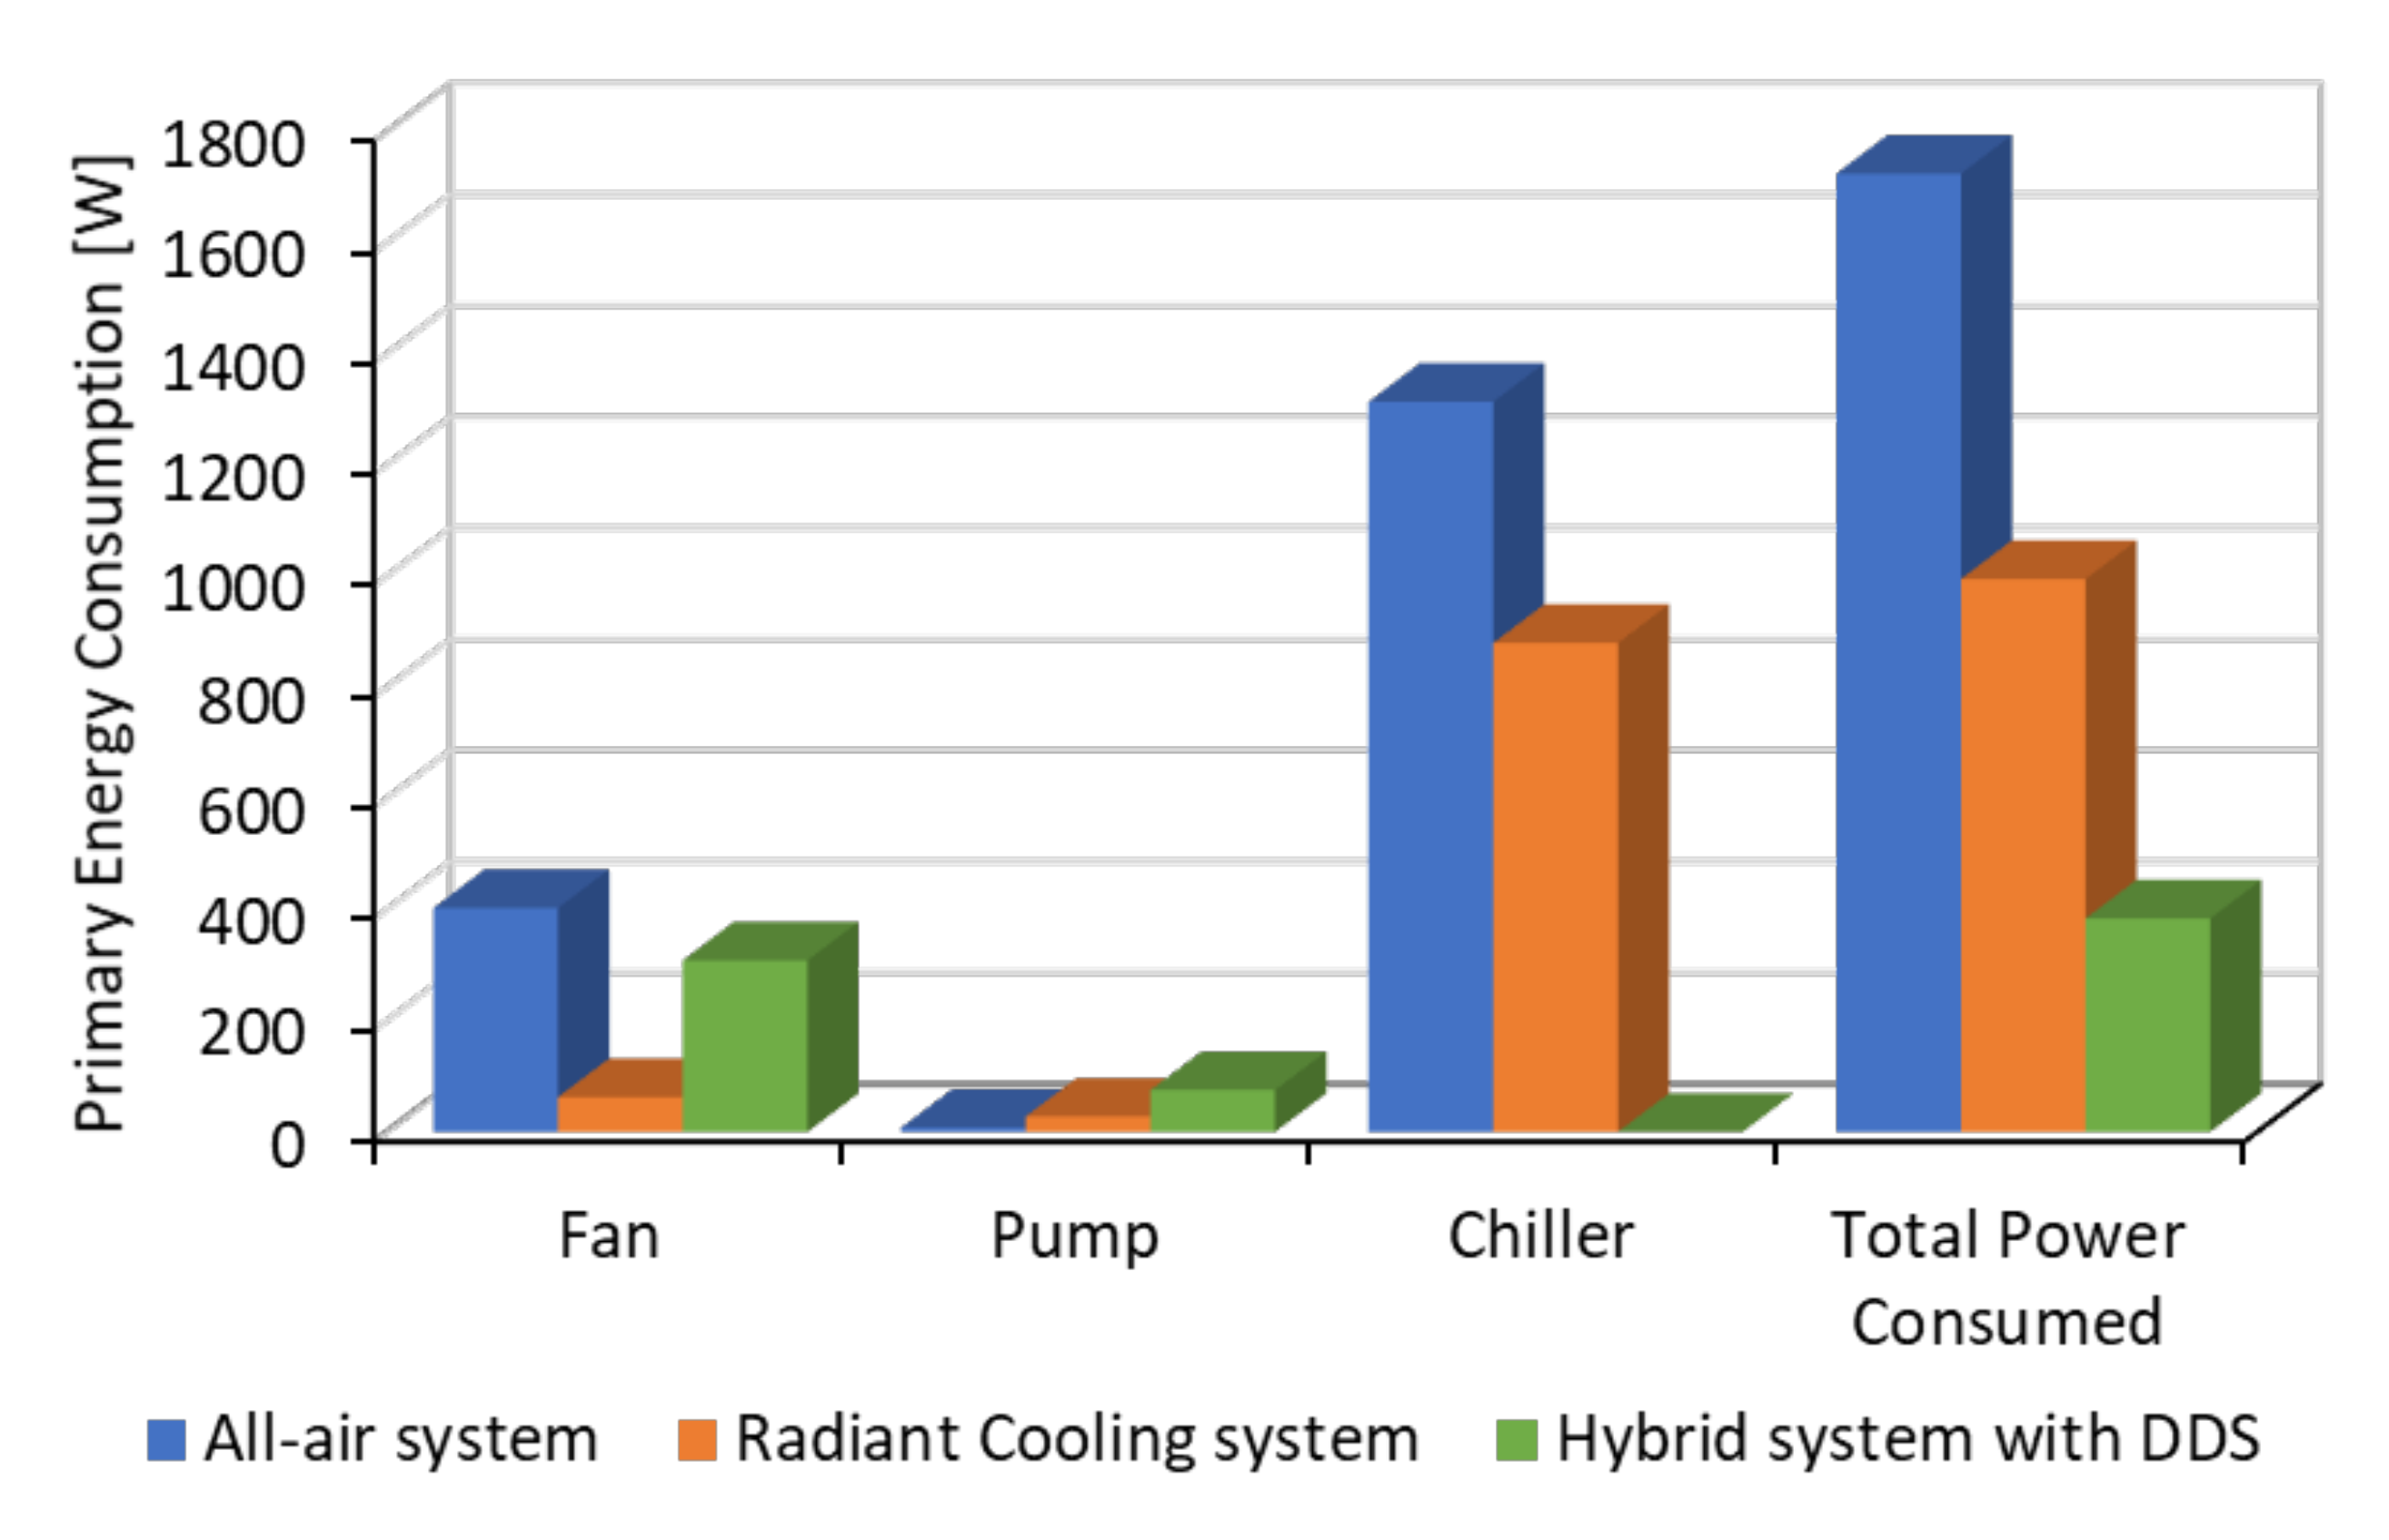
5.2. Energy Analysis
6. Conclusions
- (1)
- Compared to natural ventilation, cooling capacity and thermal comfort can be significantly enhanced by the proposed hybrid system with minimal energy increase due to the coupled high-temperature radiant cooling system.
- (2)
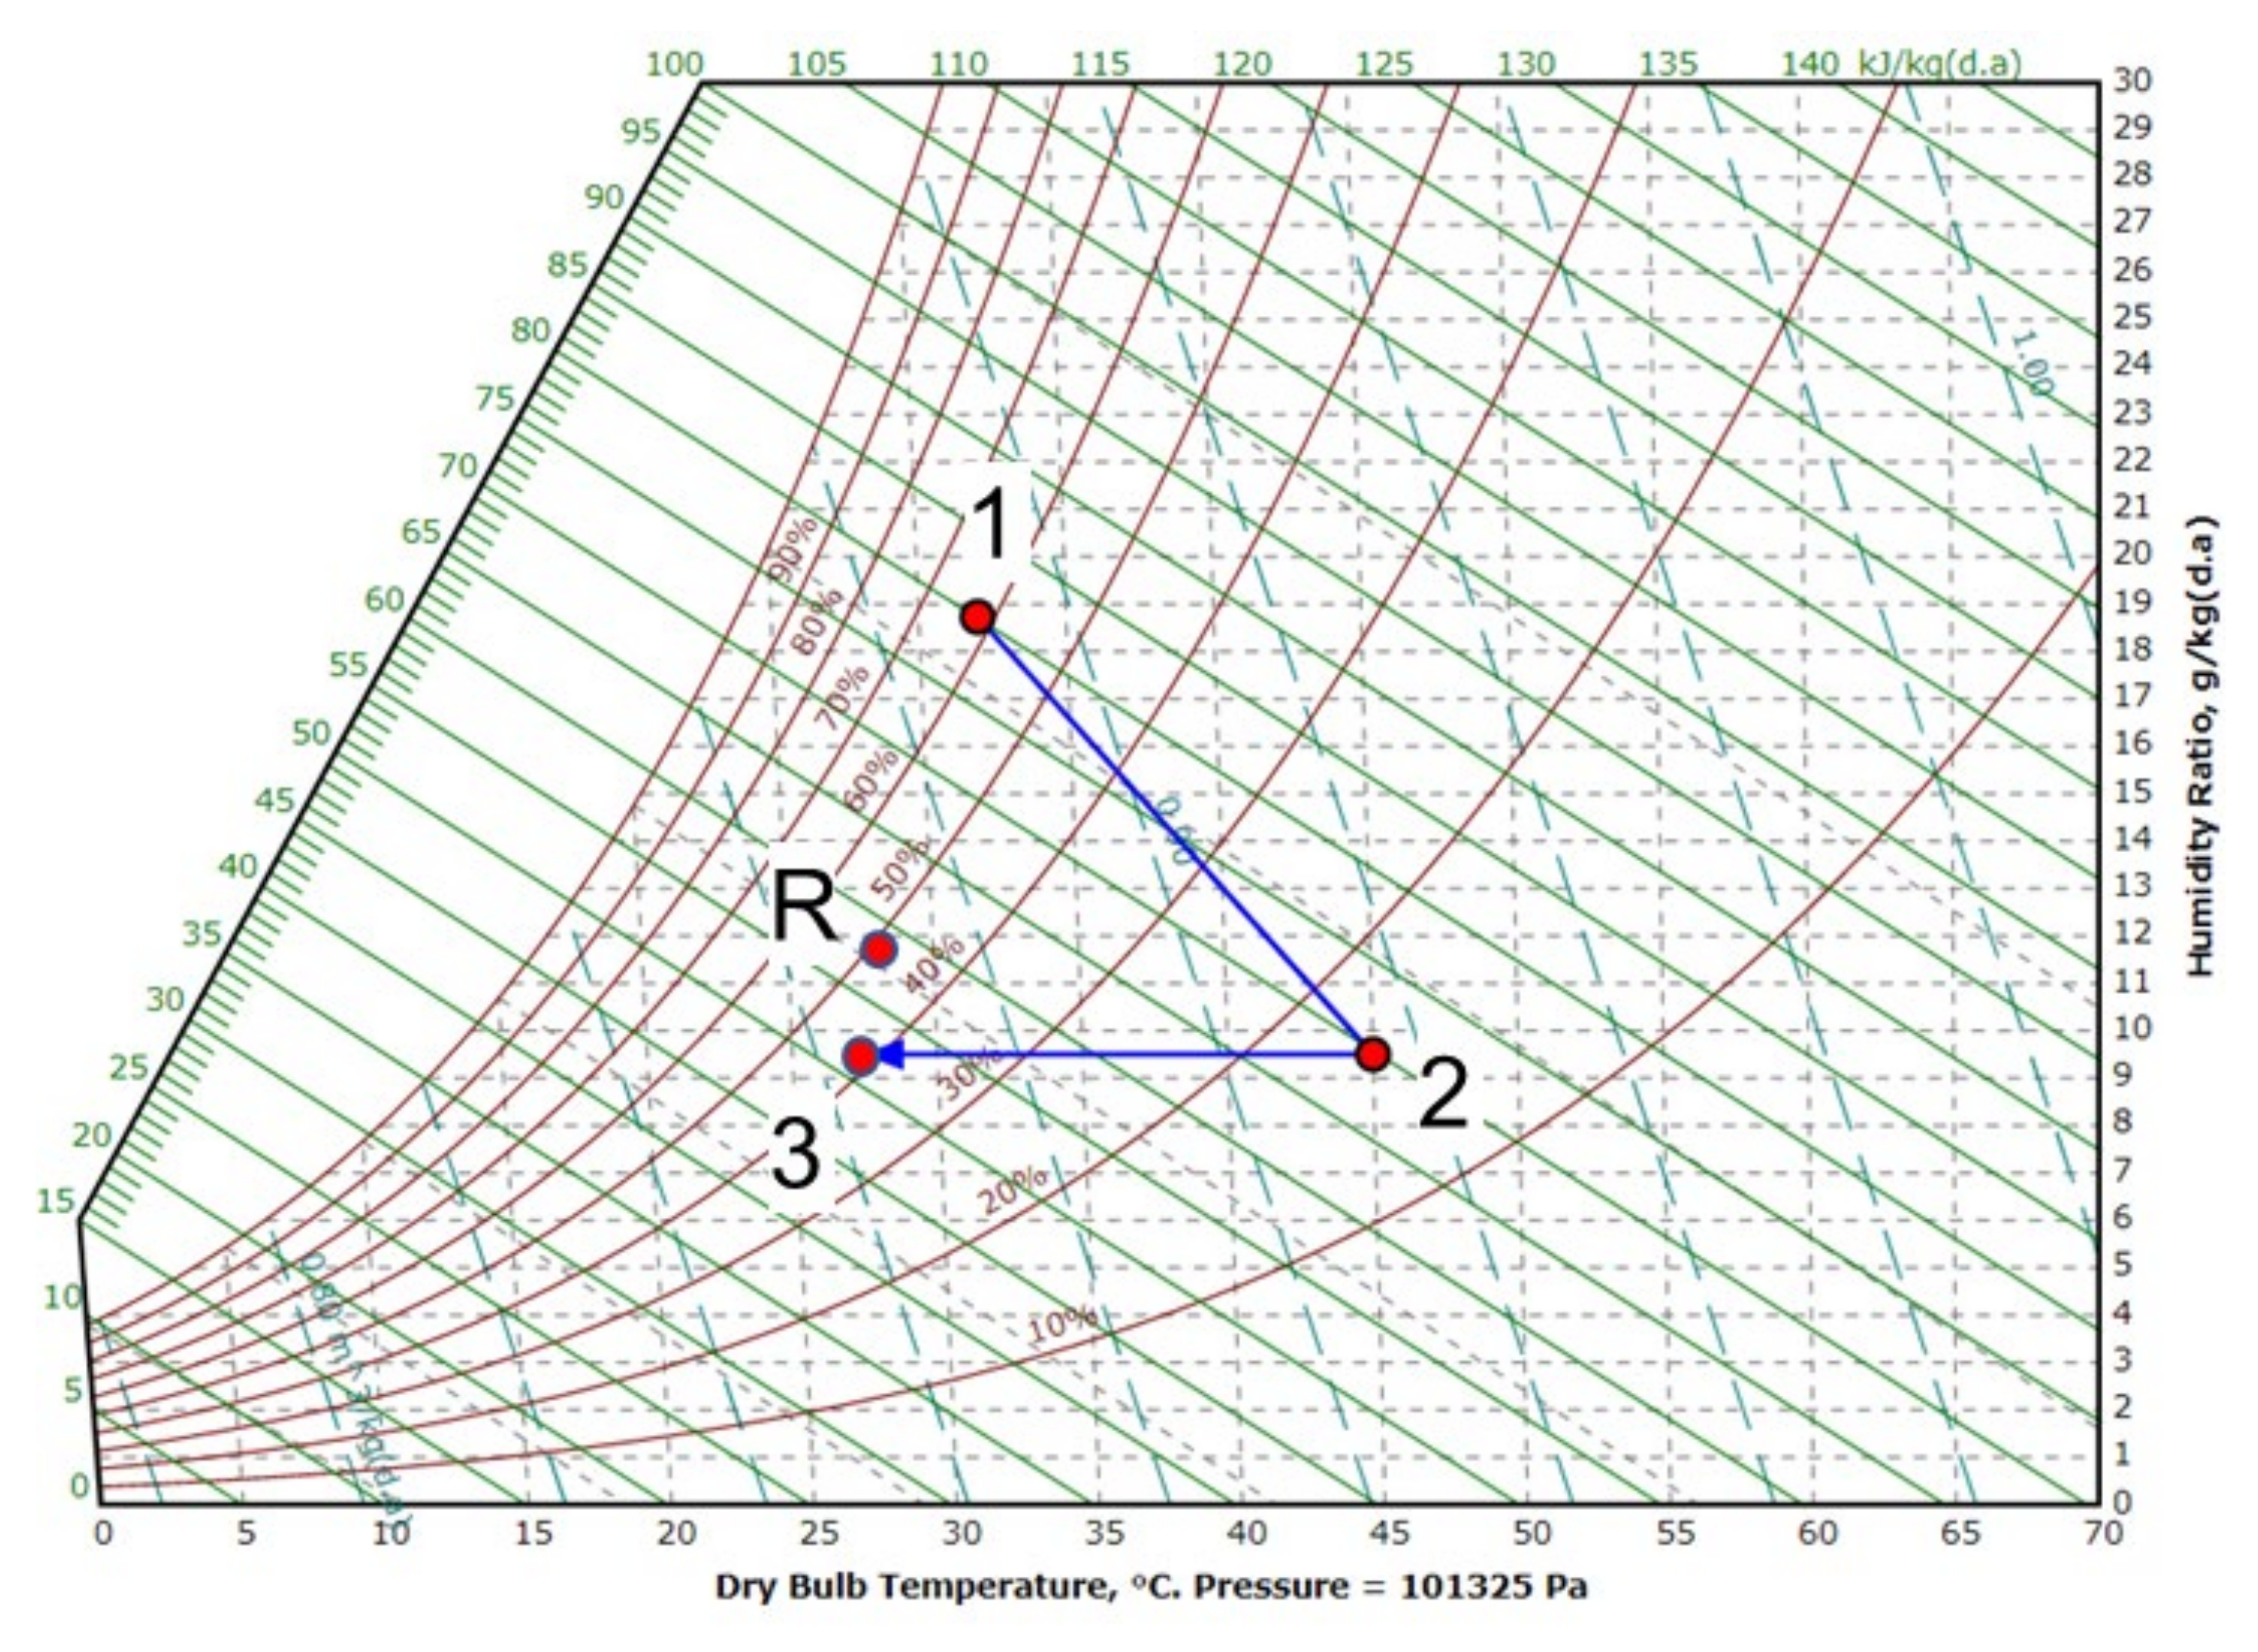
- While condensation issue can be avoided using the IEC to produce chilled water with a temperature slightly higher than dew point, in hot and humid climate countries such as Singapore, the hybrid system with natural ventilation alone cannot satisfy the thermal comfort requirement of heat-intensive office spaces in all climatic conditions, especially when the air supply from ventilation is low or when the outdoor dew point is higher than 24 °C. For a higher reliability of such a system, a secondary fresh air supply system such as DDS should be installed.
- (3)
- The proposed hybrid system with DDS can save up to 77% and 61% of primary energy in comparison with conventional all-air and radiant cooling systems, respectively.
- (4)
- The hybrid system by coupling natural ventilation with radiant cooling, IEC, and DDS is a feasible alternative to conventional air-conditioning systems for desired thermal comfort and minimal energy consumption in tropical areas with a hot and humid climate.
Author Contributions
Funding
Data Availability Statement
Acknowledgments
Conflicts of Interest
Appendix A
Appendix A.1. Macro Simulation

Appendix A.2. Results

| Wind Direction | Reference Velocity (Uref) |
|---|---|
| North | 2.0 |
| North-East (NE) | 2.9 |
| South | 2.8 |
| South-East (SE) | 3.2 |
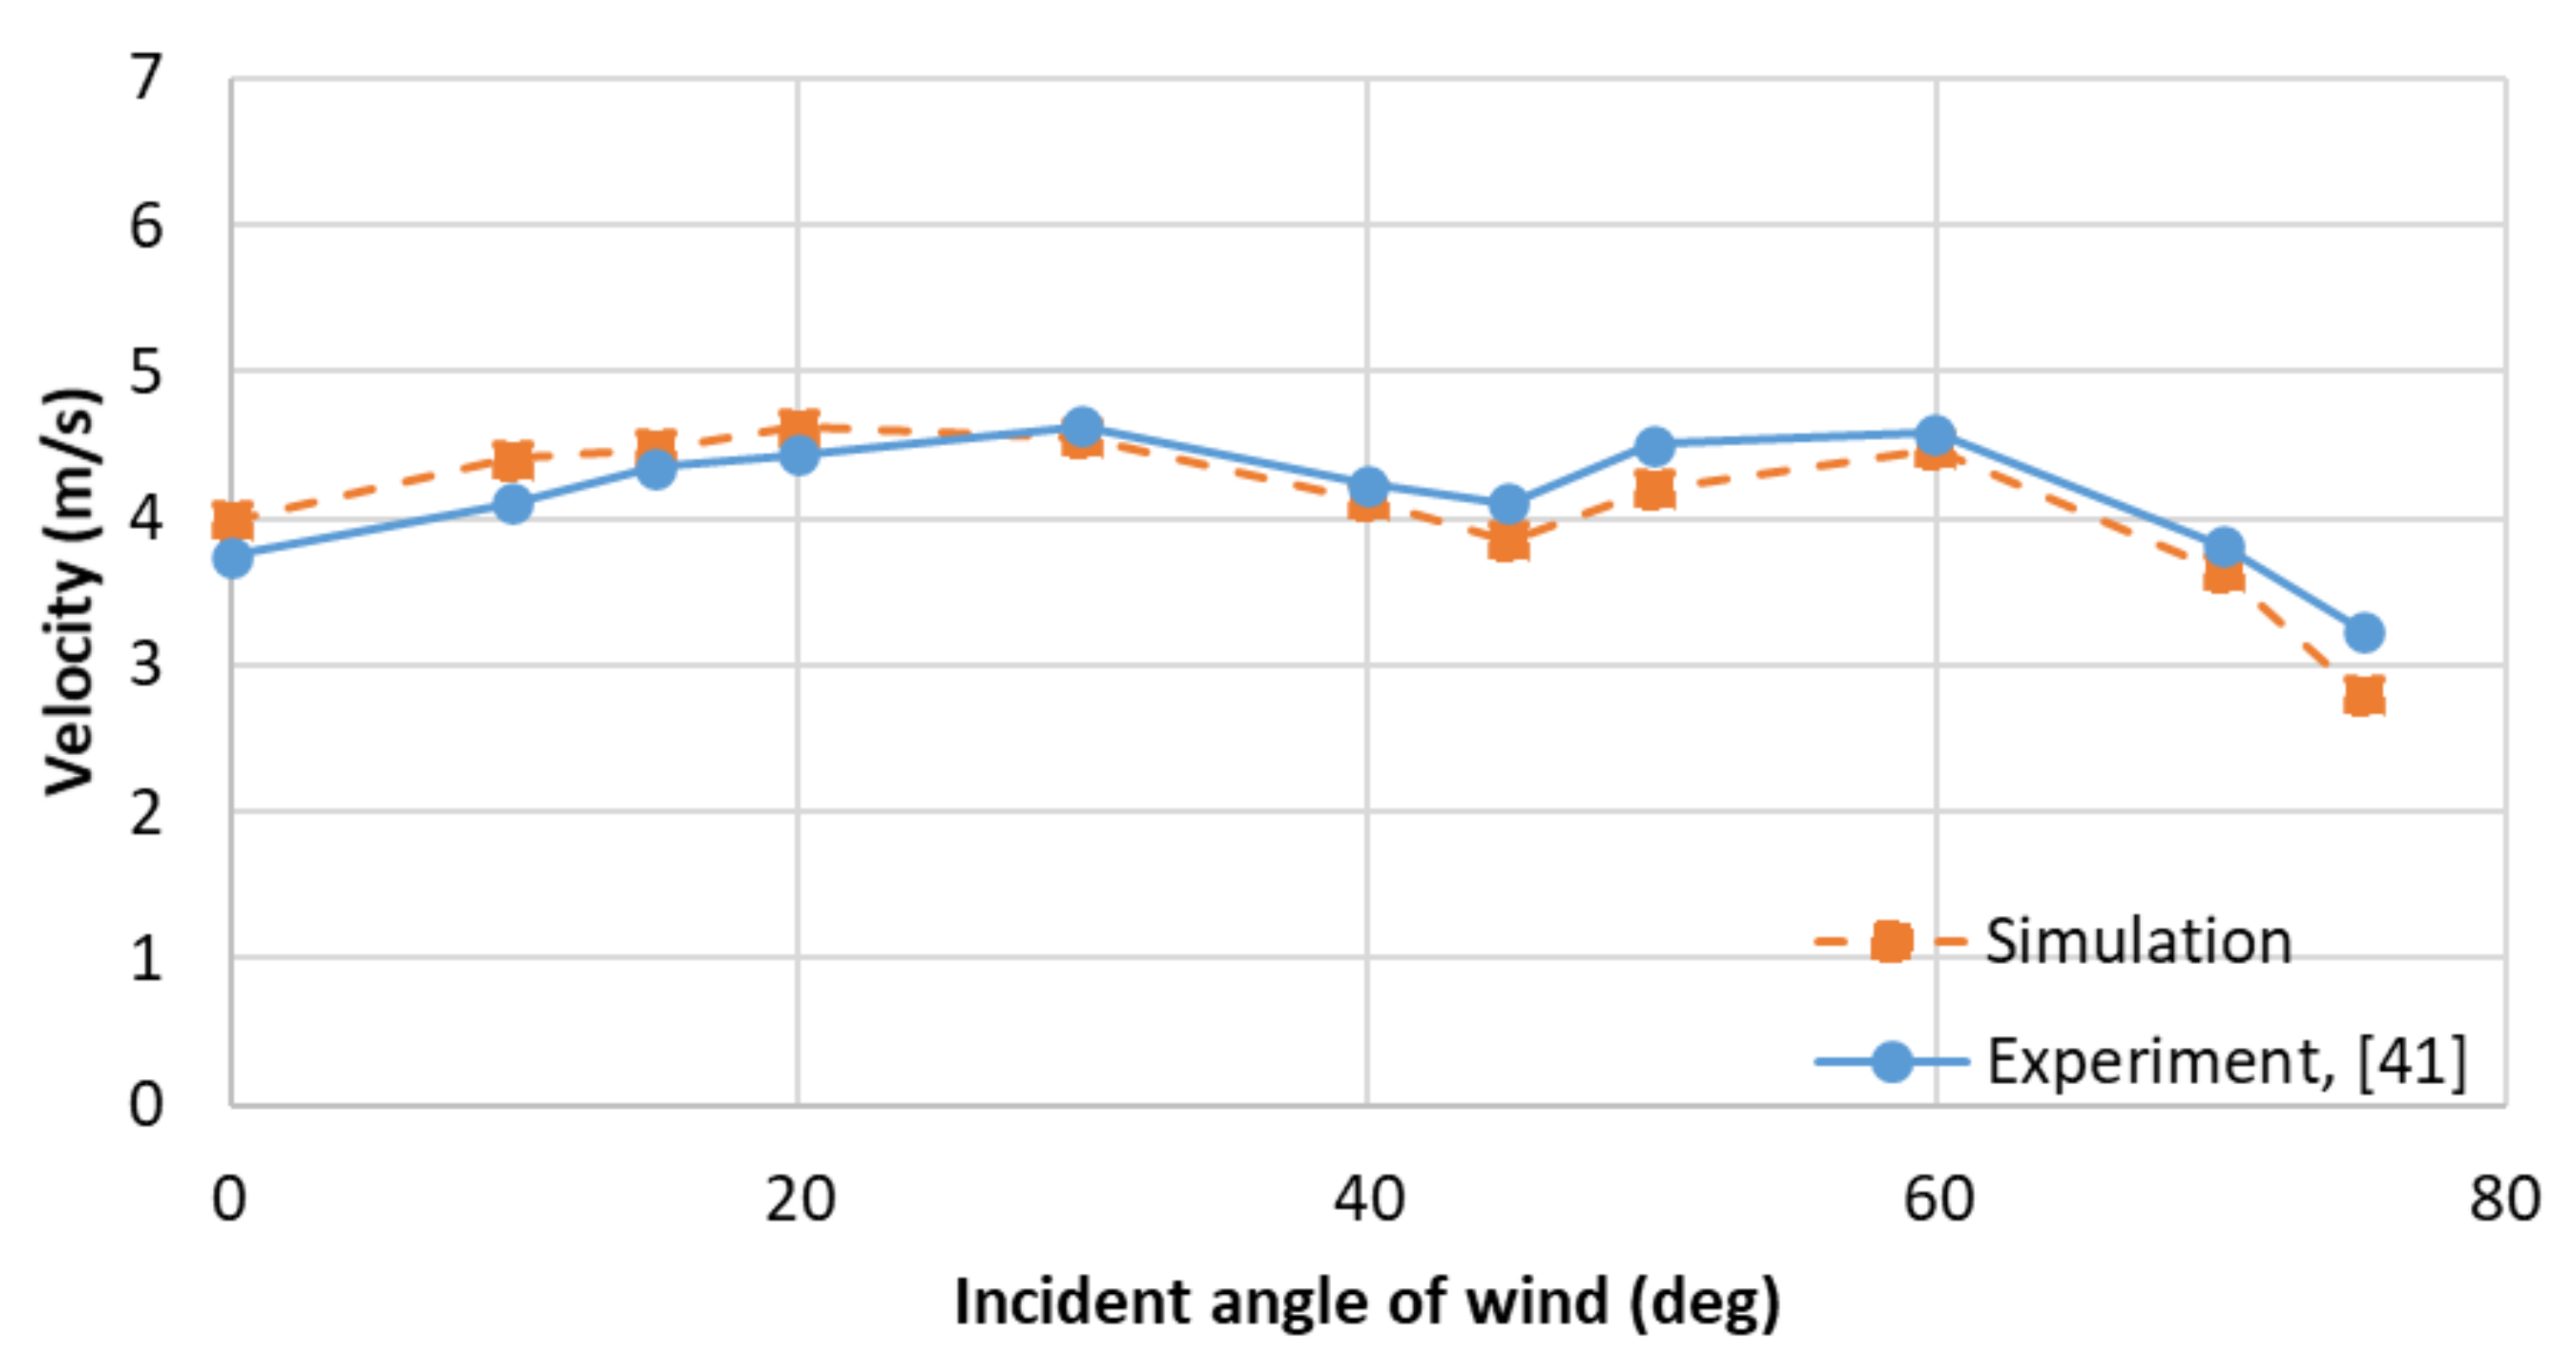
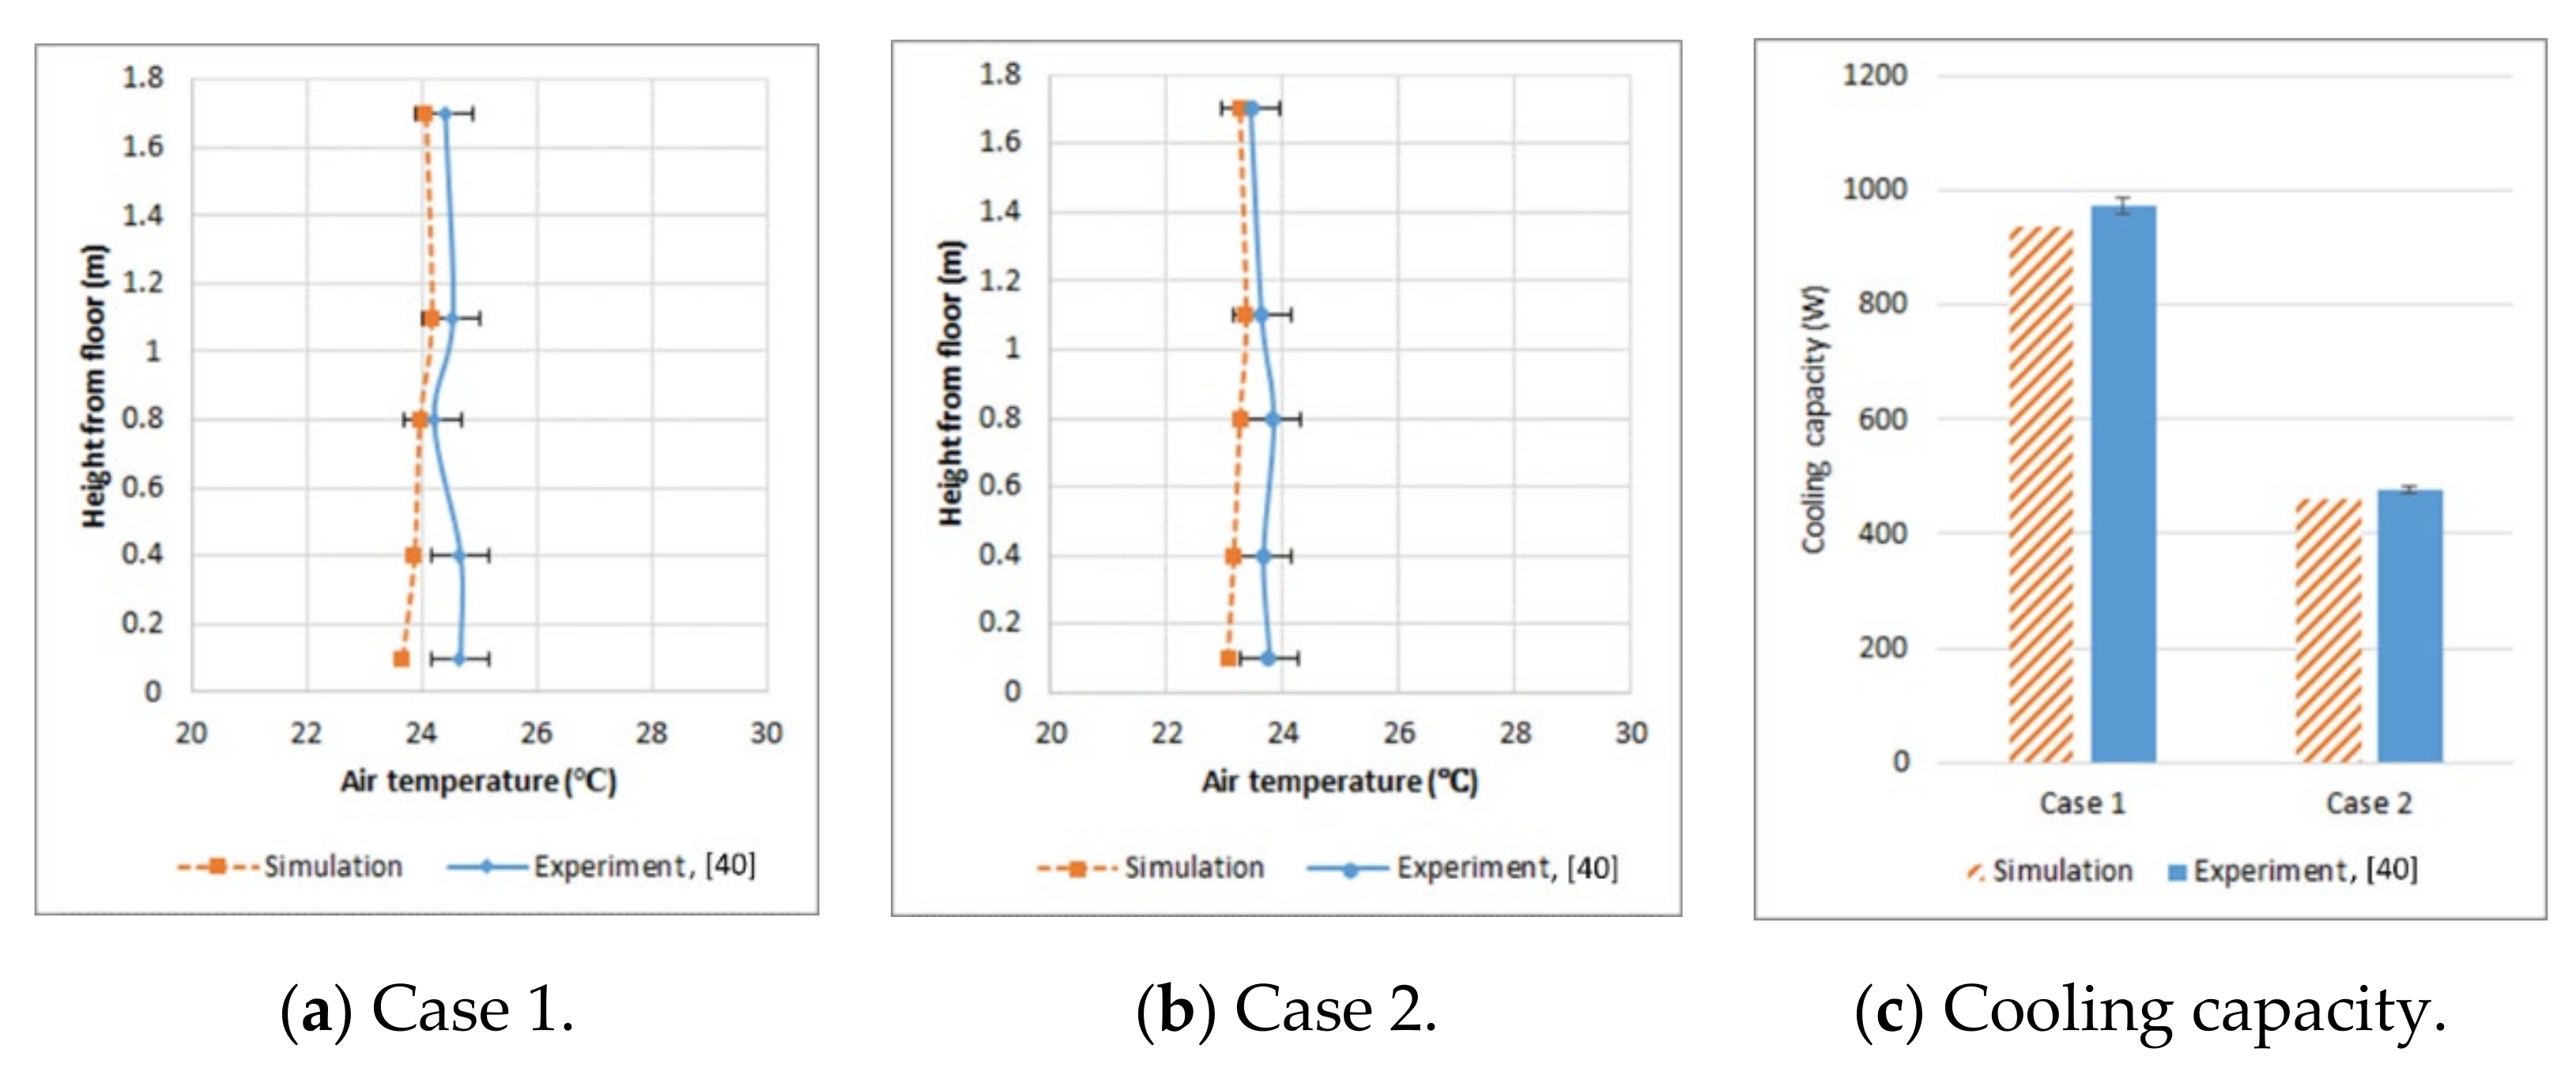
Appendix A.3. Model Validation
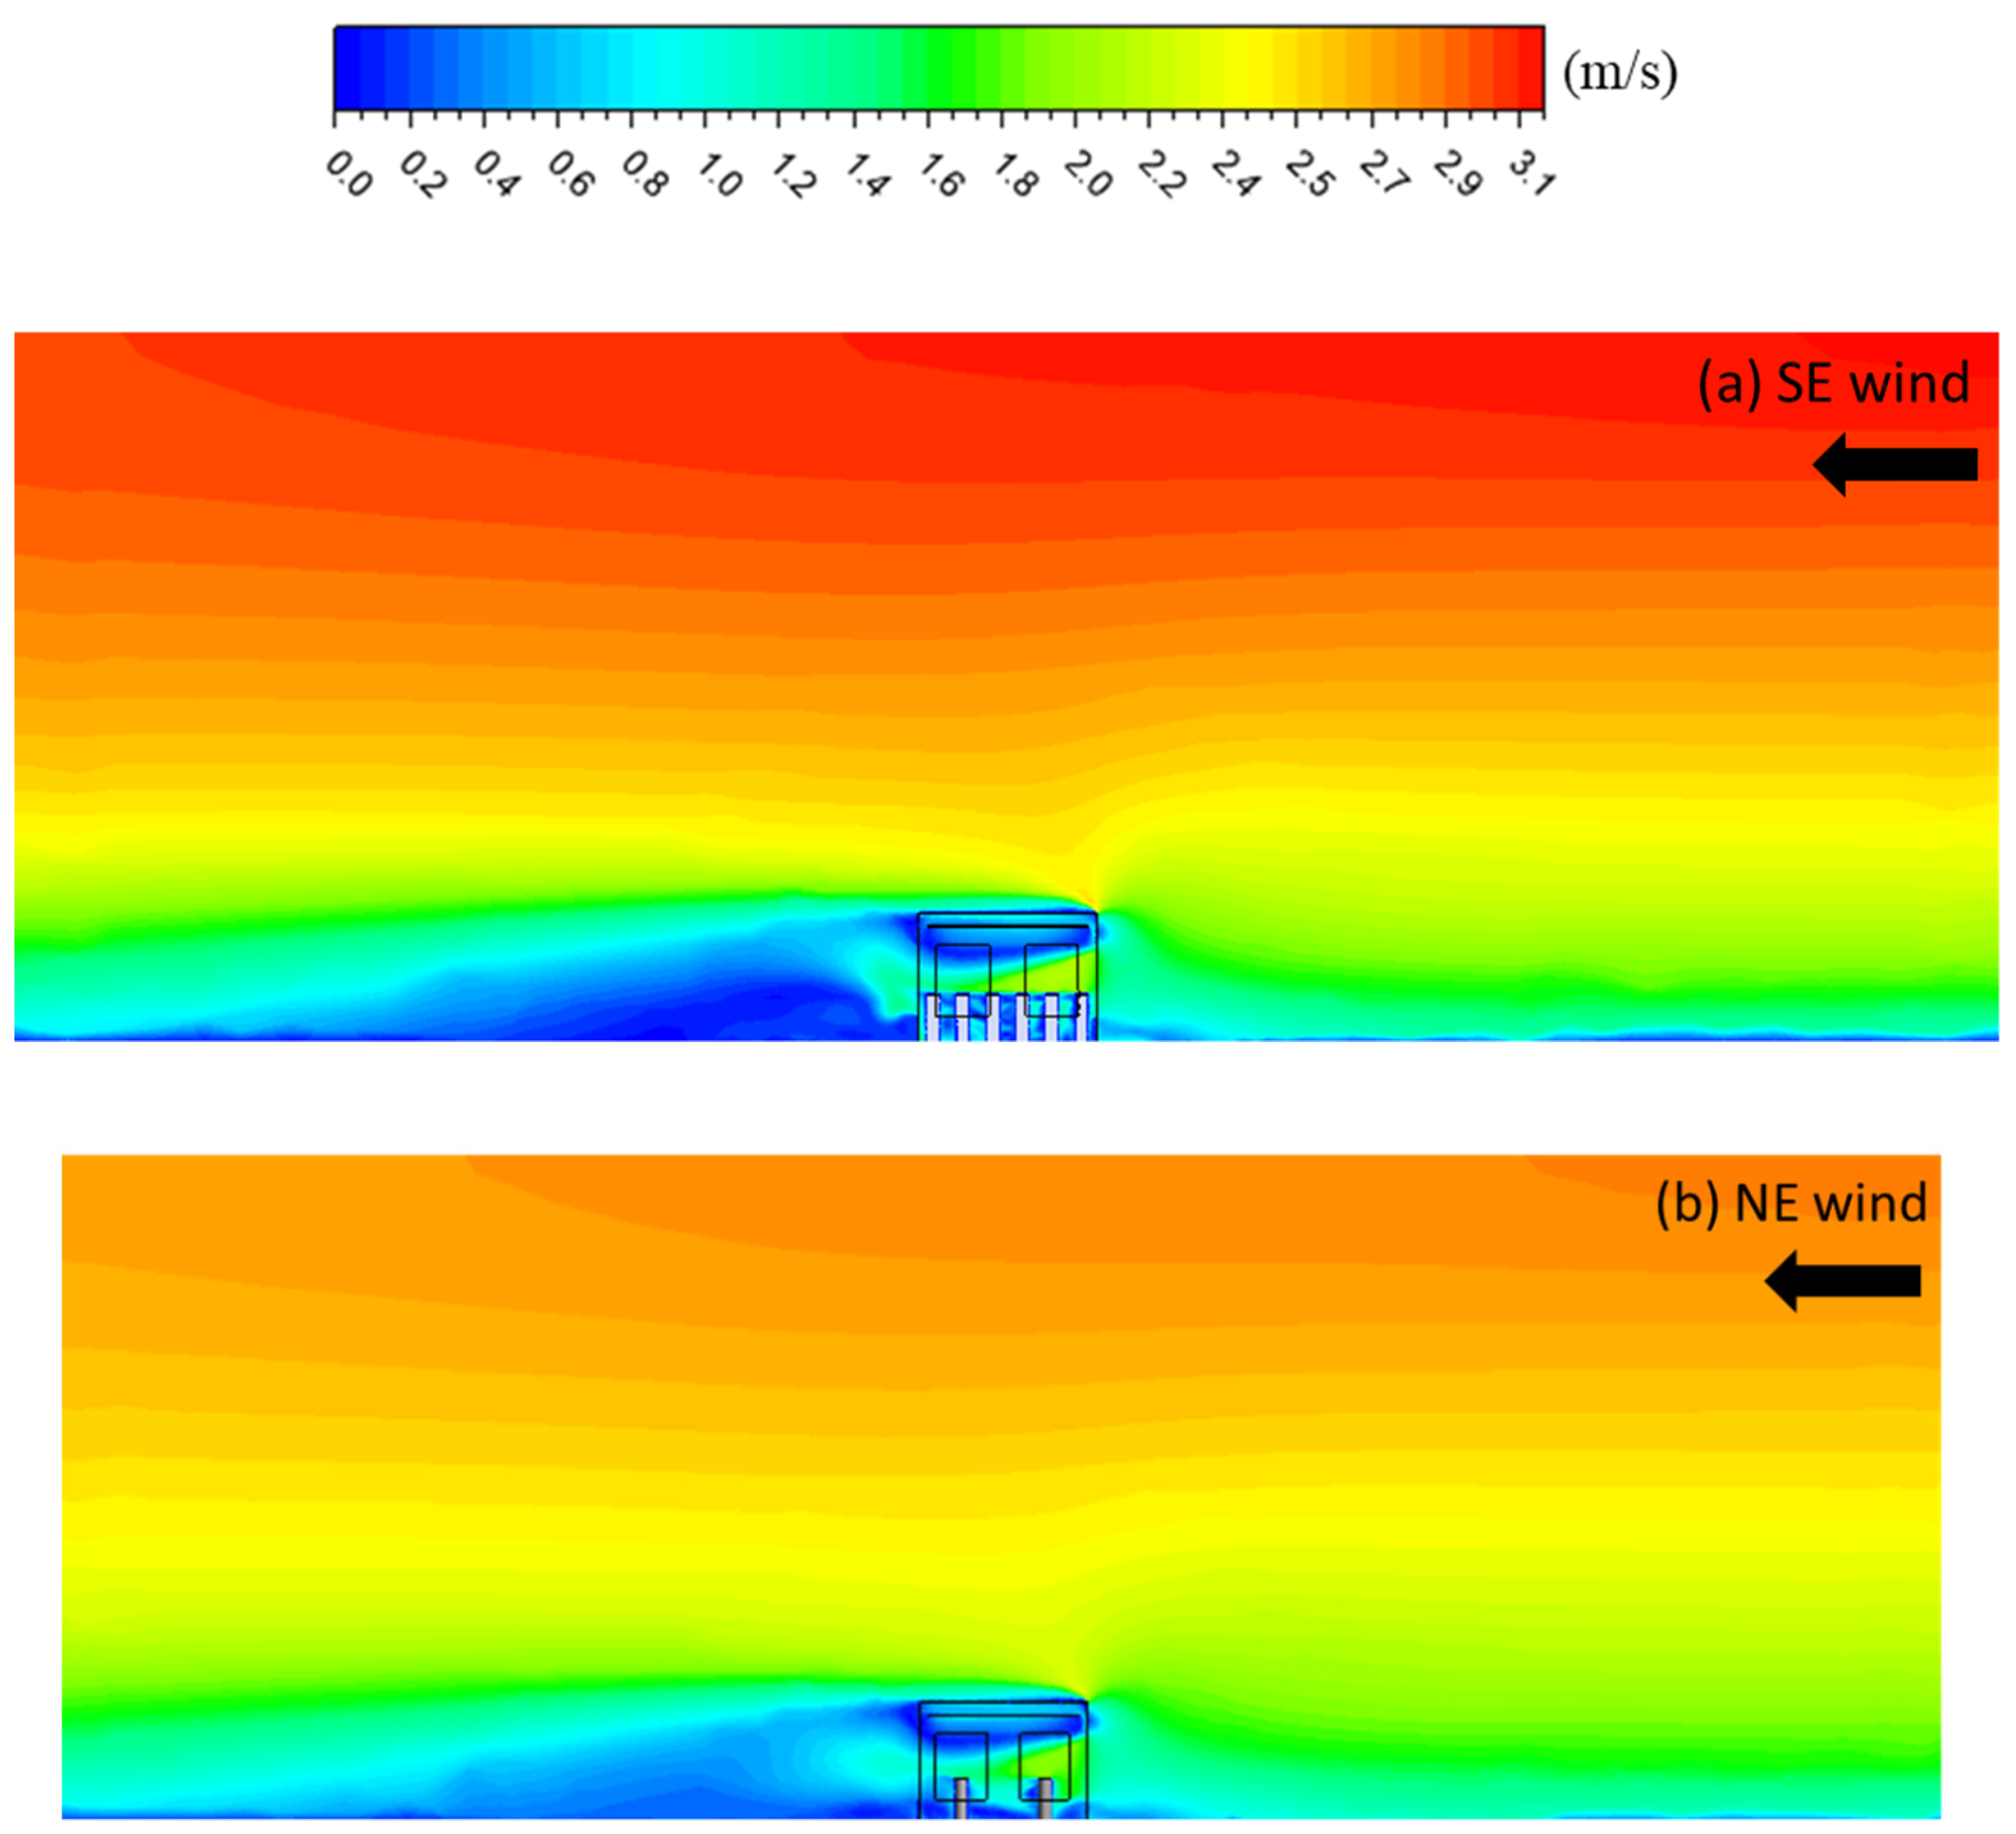
Appendix A.4. Macro Simulation
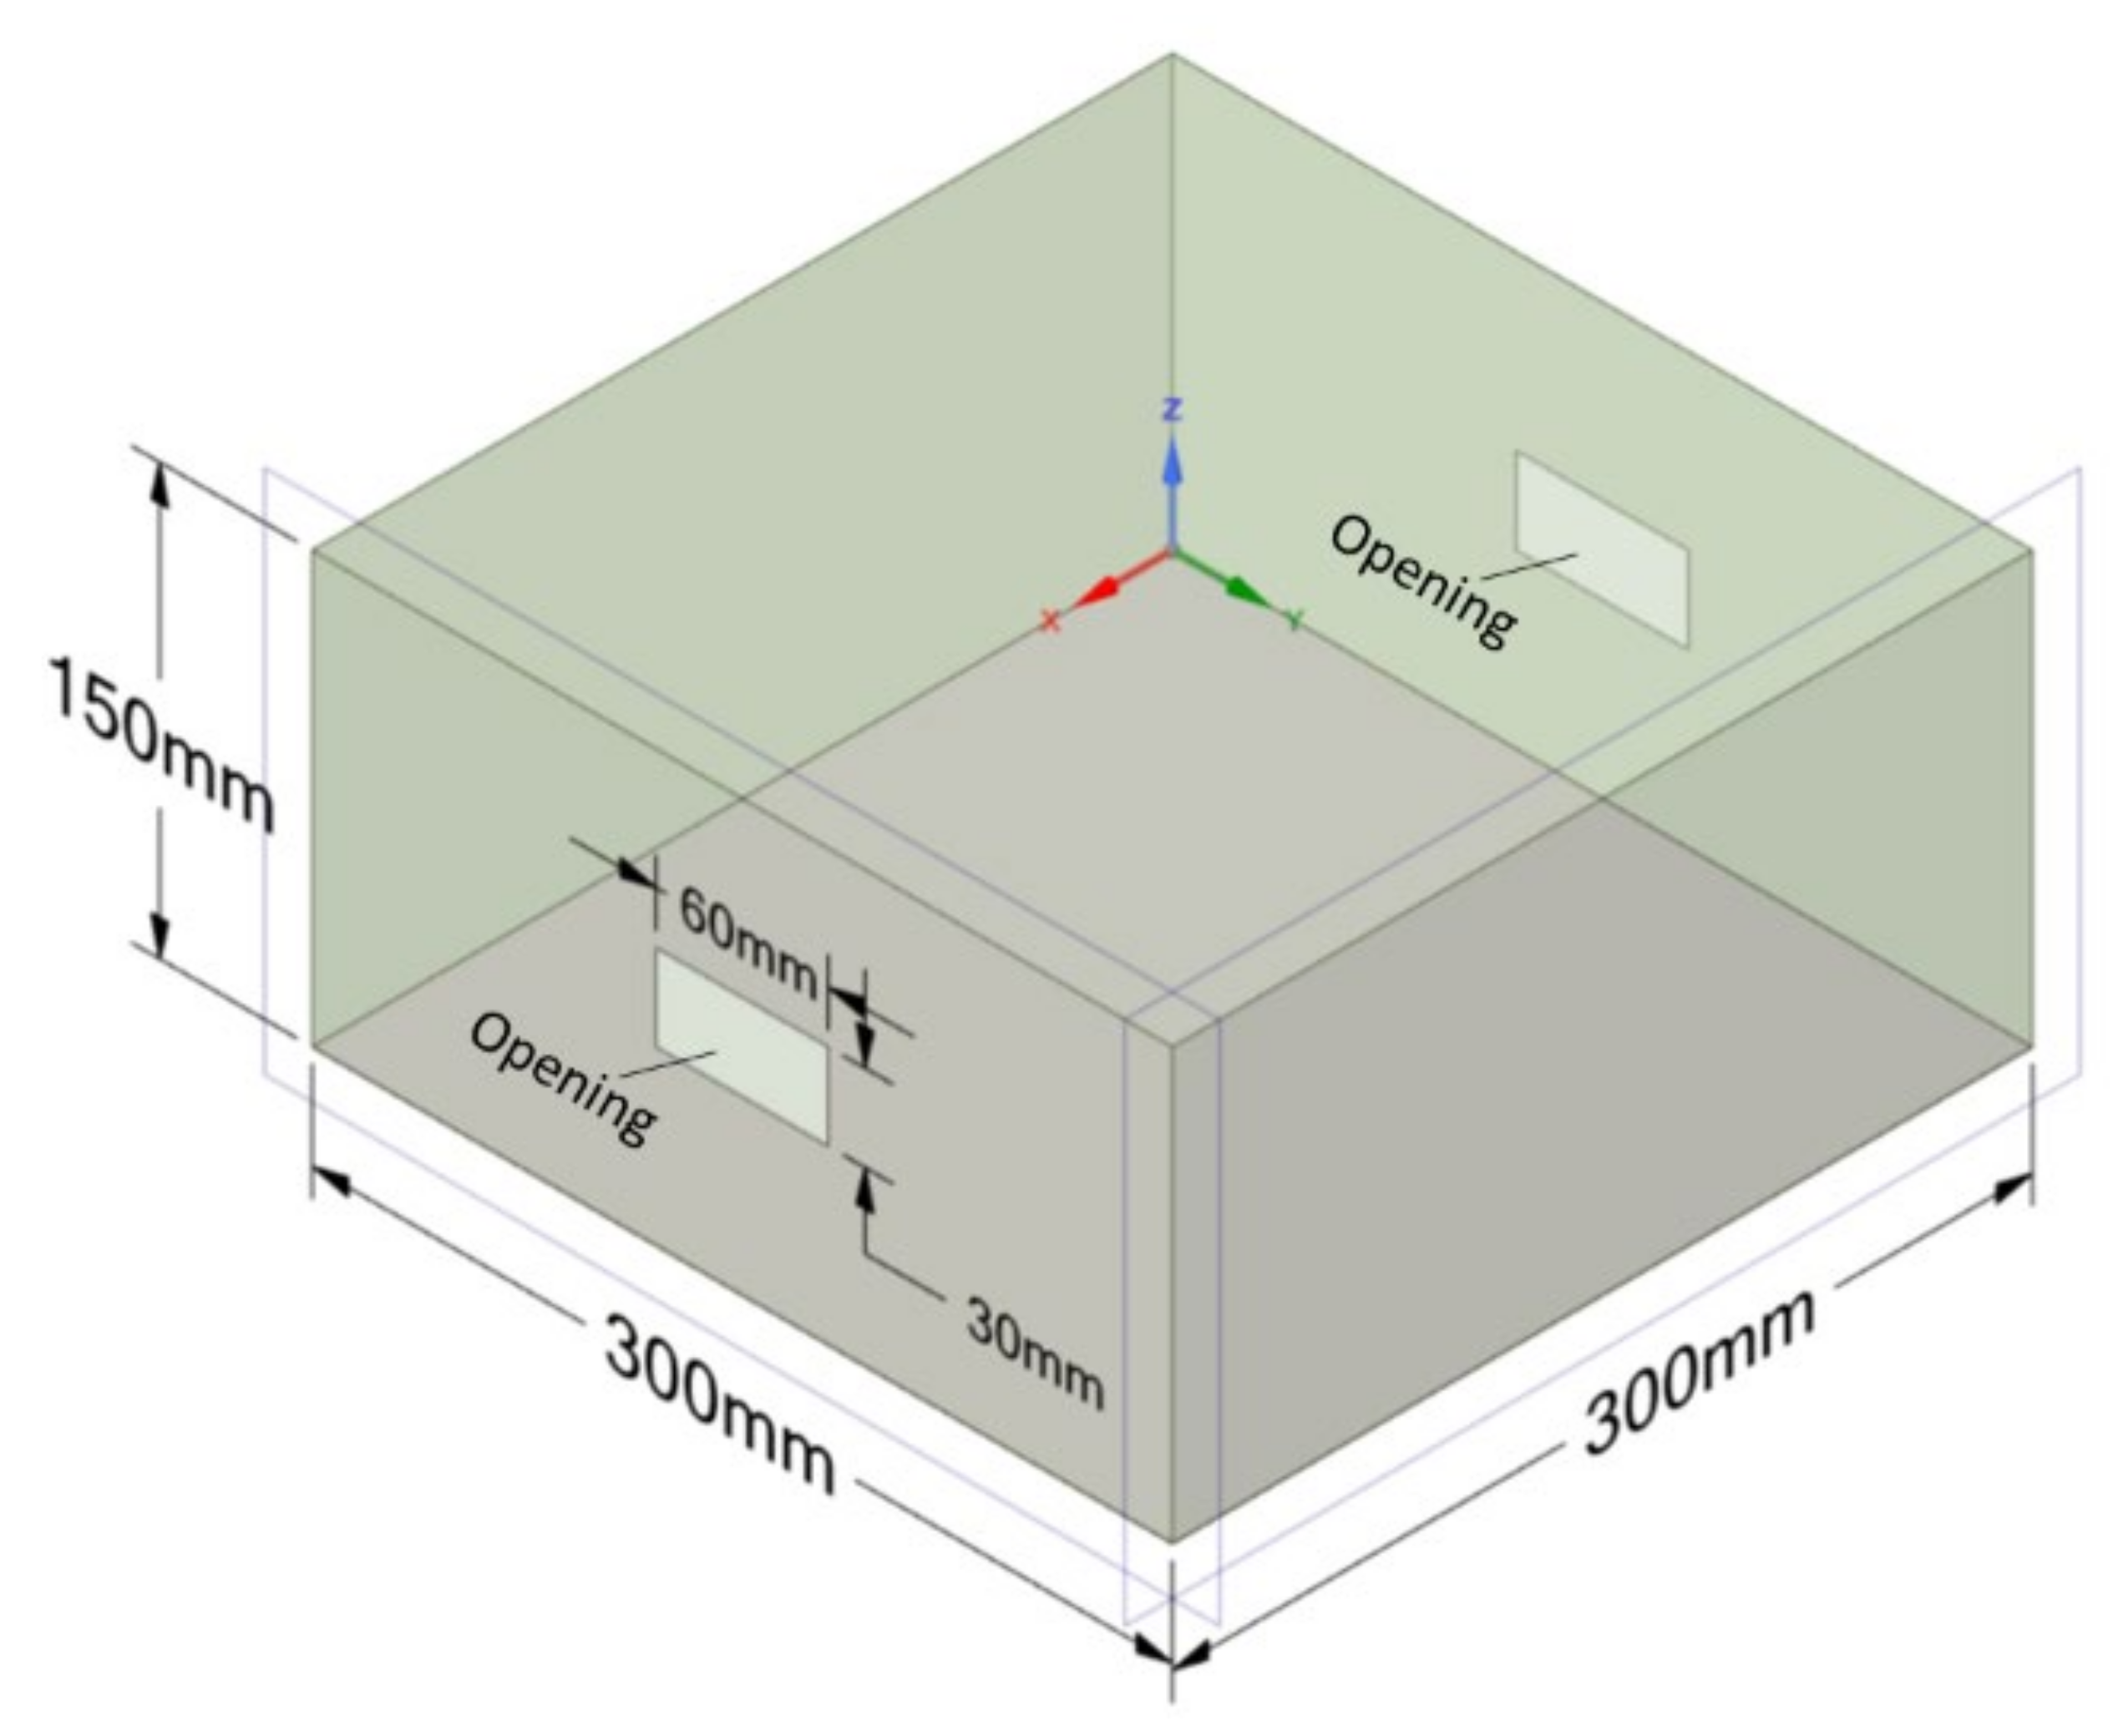
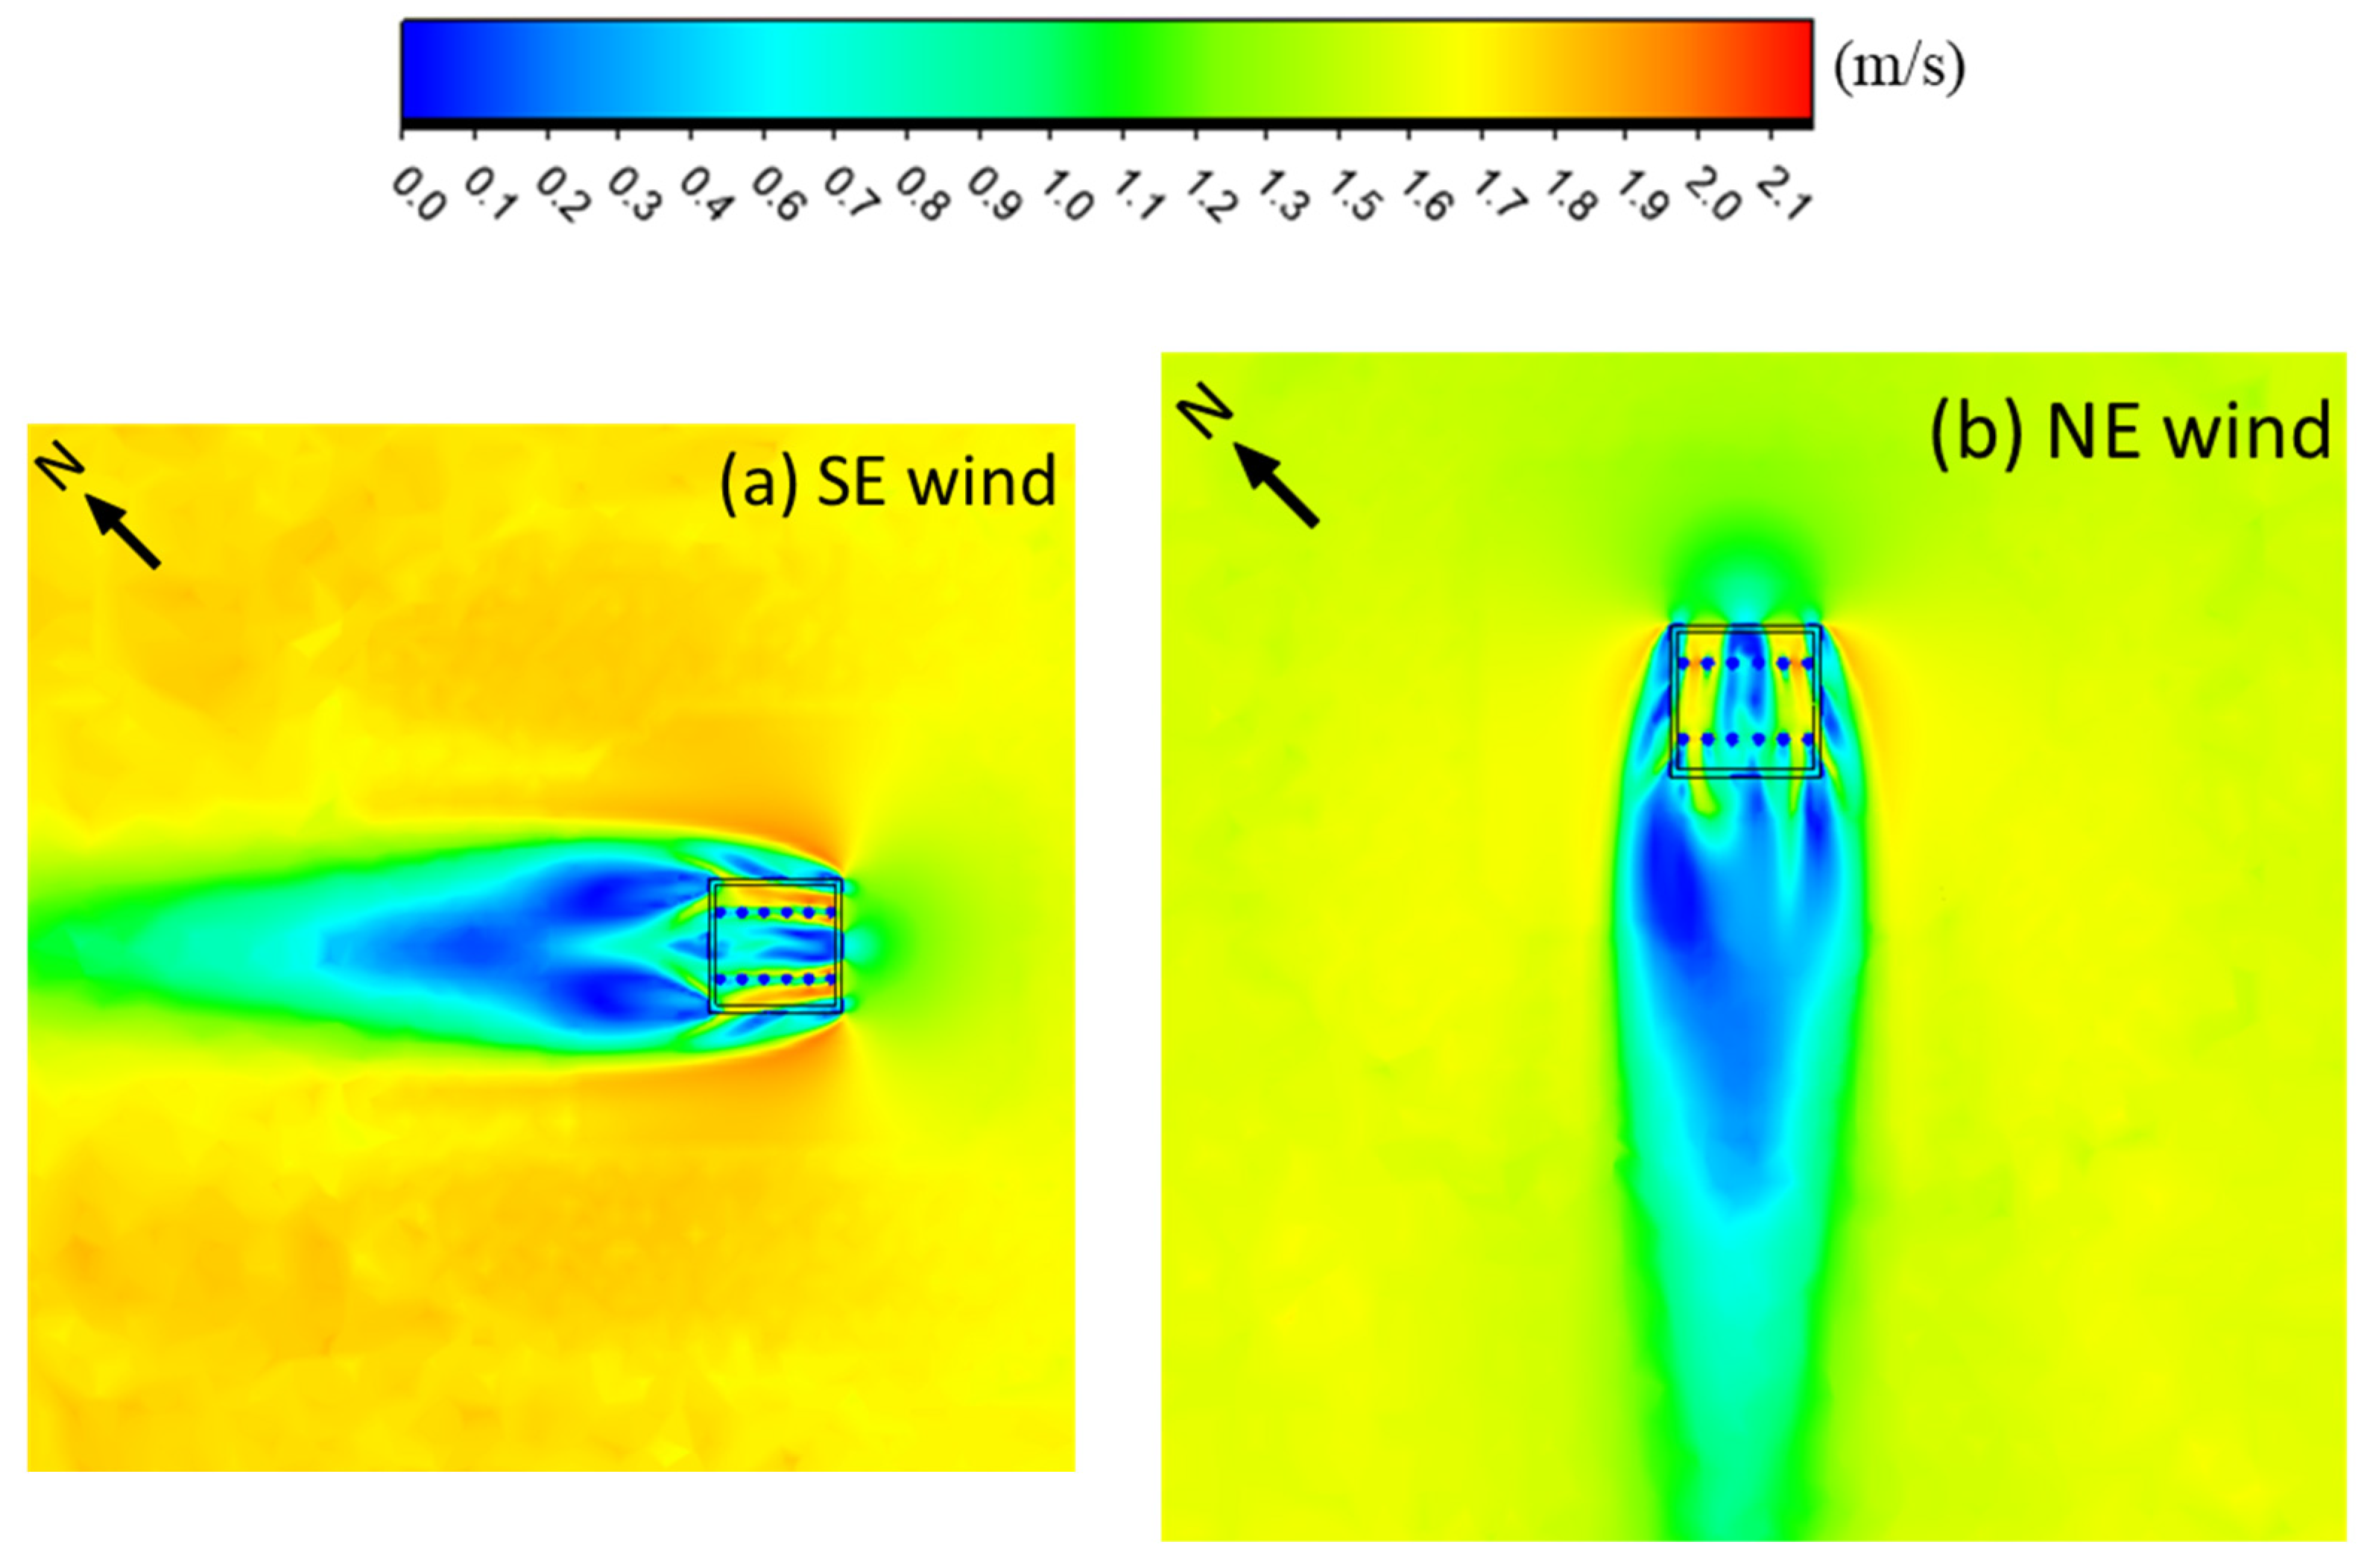
Appendix A.5. Micro Simulation
| No. | Case 1 | Case 2 |
|---|---|---|
| Heating capacity of dummy, W | 939.8 | 469.9 |
| Cooling water flow rate, lpm | 7 | 7 |
| Cooling water flow rate, g/s | 117 | 117 |
| Supply water temperature, °C | 15 | 17 |
References
- Oh, S.J.; Ng, K.C.; Thu, K.; Chun, W.; Chua, K.J.E. Forecasting long-term electricity demand for cooling of Singapore’s buildings incorporating an innovative air-conditioning technology. Energy Build. 2016, 127, 183–193. [Google Scholar] [CrossRef]
- Emmerich, S.; Dols, W.; Axley, J. Natural Ventilation Review and Plan for Design and Analysis Tools; NIST Interagency/Internal Report (NISTIR); National Institute of Standards and Technology: Gaithersburg, MD, USA, 2001. Available online: https://tsapps.nist.gov/publication/get_pdf.cfm?pub_id=860854 (accessed on 8 August 2021).
- Omrani, S.; Garcia-Hansen, V.; Capra, B.; Drogemuller, R. Natural ventilation in multi-storey buildings: Design process and review of evaluation tools. Build. Environ. 2017, 116, 182–194. [Google Scholar] [CrossRef] [Green Version]
- Gil-Baez, M.; Barrios-Padura, Á.; Molina-Huelva, M.; Chacartegui, R. Natural ventilation systems to enhance sustainability in buildings: A review towards zero energy buildings in schools. E3S Web Conf. 2017, 22. [Google Scholar] [CrossRef] [Green Version]
- Escombe, A.R.; Oeser, C.C.; Gilman, R.H.; Navincopa, M.; Ticona, E.; Pan, W.; Martínez, C.; Chacaltana, J.; Rodríguez, R.; Moore, D.A.J.; et al. Natural Ventilation for the Prevention of Airborne Contagion. PLoS Med. 2007, 4, e68. [Google Scholar] [CrossRef] [Green Version]
- Etheridge, D. Natural Ventilation of Buildings: Theory, Measurement and Design; John Wiley & Sons: Hoboken, NJ, USA, 2011. [Google Scholar]
- Khanal, R.; Lei, C. Solar chimney—A passive strategy for natural ventilation. Energy Build. 2011, 43, 1811–1819. [Google Scholar] [CrossRef]
- Nomura, M.; Hiyama, K. A review: Natural ventilation performance of office buildings in Japan. Renew. Sustain. Energy Rev. 2017, 74, 746–754. [Google Scholar] [CrossRef]
- Mochida, A.; Yoshino, H.; Takeda, T.; Kakegawa, T.; Miyauchi, S. Methods for controlling airflow in and around a building under cross-ventilation to improve indoor thermal comfort. J. Wind Eng. Ind. Aerodyn. 2005, 93, 437–449. [Google Scholar] [CrossRef]
- Karava, P.; Stathopoulos, T.; Athienitis, A.K. Wind-induced natural ventilation analysis. Sol. Energy 2007, 81, 20–30. [Google Scholar] [CrossRef]
- Aldawoud, A.; Clark, R. Comparative analysis of energy performance between courtyard and atrium in buildings. Energy Build. 2008, 40, 209–214. [Google Scholar] [CrossRef]
- Khan, N.; Su, Y.; Riffat, S.B. A review on wind driven ventilation techniques. Energy Build. 2008, 40, 1586–1604. [Google Scholar] [CrossRef]
- Cheng, X.; Shi, L.; Dai, P.; Zhang, G.; Yang, H.; Li, J. Study on optimizing design of solar chimney for natural ventilation and smoke exhaustion. Energy Build. 2018, 170, 145–156. [Google Scholar] [CrossRef]
- Lei, Y.; Zhang, Y.; Wang, F.; Wang, X. Enhancement of natural ventilation of a novel roof solar chimney with perforated absorber plate for building energy conservation. Appl. Therm. Eng. 2016, 107, 653–661. [Google Scholar] [CrossRef]
- Deuble, M.P.; de Dear, R.J. Mixed-mode buildings: A double standard in occupants’ comfort expectations. Build. Environ. 2012, 54, 53–60. [Google Scholar] [CrossRef]
- ASHRAE Handbook. HVAC SYSTEMS and Equipment; American Society of Heating, Refrigerating and Air-Conditioning Engineers, Inc.: Atlanta, GA, USA, 1996; Volume 39. [Google Scholar]
- Rhee, K.N.; Olesen, B.W.; Kim, K.W. Ten questions about radiant heating and cooling systems. Build. Environ. 2017, 112, 367–381. [Google Scholar] [CrossRef] [Green Version]
- Kim, M.K.; Leibundgut, H. A case study on feasible performance of a system combining an airbox convector with a radiant panel for tropical climates. Build. Environ. 2014, 82, 687–692. [Google Scholar] [CrossRef]
- Jiang, Y.; Xie, X. Theoretical and testing performance of an innovative indirect evaporative chiller. Sol. Energy 2010, 84, 2041–2055. [Google Scholar] [CrossRef]
- Kim, M.K.; Liu, J.; Cao, S.-J. Energy analysis of a hybrid radiant cooling system under hot and humid climates: A case study at Shanghai in China. Build. Environ. 2018, 137, 208–214. [Google Scholar] [CrossRef]
- Lipczynska, A.; Kaczmarczyk, J.; Melikov, A.K. Thermal environment and air quality in office with personalized ventilation combined with chilled ceiling. Build. Environ. 2015, 92, 603–614. [Google Scholar] [CrossRef]
- Al Assaad, D.; Ghali, K.; Ghaddar, N. Effectiveness of intermittent personalized ventilation assisting a chilled ceiling for enhanced thermal comfort and acceptable indoor air quality. Build. Environ. 2018, 144, 9–22. [Google Scholar] [CrossRef]
- Fernández-Hernández, F.; Fernández-Gutiérrez, A.; Martínez-Almansa, J.J.; del Pino, C.; Parras, L. Flow patterns and heat transfer coefficients using a rotational diffuser coupled with a radiant floor cooling. Appl. Therm. Eng. 2020, 168, 114827. [Google Scholar] [CrossRef]
- Hao, X.; Zhang, G.; Chen, Y.; Zou, S.; Moschandreas, D.J. A combined system of chilled ceiling, displacement ventilation and desiccant dehumidification. Build. Environ. 2007, 42, 3298–3308. [Google Scholar] [CrossRef]
- Rees, S.J.; Haves, P. An experimental study of air flow and temperature distribution in a room with displacement ventilation and a chilled ceiling. Build. Environ. 2013, 59, 358–368. [Google Scholar] [CrossRef] [Green Version]
- Hernández, F.F.; López, J.M.C.; Gutiérrez, A.F.; Muñoz, F.D. A new terminal unit combining a radiant floor with an underfloor air system: Experimentation and numerical model. Energy Build. 2016, 133, 70–78. [Google Scholar] [CrossRef]
- Yu, T.; Heiselberg, P.; Lei, B.; Pomianowski, M.; Zhang, C.; Jensen, R. Experimental investigation of cooling performance of a novel HVAC system combining natural ventilation with diffuse ceiling inlet and TABS. Energy Build. 2015, 105, 165–177. [Google Scholar] [CrossRef]
- Yu, T.; Heiselberg, P.; Lei, B.; Zhang, C.; Pomianowski, M.; Jensen, R.L. Experimental study on the dynamic performance of a novel system combining natural ventilation with diffuse ceiling inlet and TABS. Appl. Energy 2016, 169, 218–229. [Google Scholar] [CrossRef]
- Meggers, F.; Guo, H.; Teitelbaum, E.; Aschwanden, G.; Read, J.; Houchois, N.; Pantelic, J.; Calabrò, E. The Thermoheliodome—‘Air conditioning’ without conditioning the air, using radiant cooling and indirect evaporation. Energy Build. 2017, 157, 11–19. [Google Scholar] [CrossRef]
- Vangtook, P.; Chirarattananon, S. Application of radiant cooling as a passive cooling option in hot humid climate. Build. Environ. 2007, 42, 543–556. [Google Scholar] [CrossRef]
- British Standard—Ventilation for Buildings—Chilled Ceilings—Testing and Rating; BS EN 14240; British Standards Institution: London, UK, 2004.
- Shin, M.S.; Rhee, K.N.; Park, S.H.; Yeo, M.S.; Kim, K.W. Enhancement of cooling capacity through open-type installation of cooling radiant ceiling panel systems. Build. Environ. 2019, 148, 417–432. [Google Scholar] [CrossRef]
- Building and Construction Authority (BCA). Green Mark for New Non-Residential Buildings: Technical Guide and Requirements. 2021. Available online: https://www1.bca.gov.sg/buildsg/sustainability/green-mark-certification-scheme (accessed on 2 September 2021).
- Janssen, J. Ventilation for acceptable indoor air quality. ASHRAE J. 1989, 31, 40–42. [Google Scholar]
- ASHRAE Standard 55-2004: Thermal Environmental Conditions for Human Occupancy; American Society of Heating, Refrigerating and Air-Conditioning Engineers, Inc.: Atlanta, GA, USA, 2004.
- Singapore Standard: Code of Practice for Air-Conditioning and Mechanical Ventilation in Buildings; SS 553: 2009; Enterprise: Singapore, 2009.
- Yang, L.; Yan, H.; Lam, J.C. Thermal comfort and building energy consumption implications—A review. Appl. Energy 2014, 115, 164–173. [Google Scholar] [CrossRef]
- Fanger, P.O. Thermal Comfort: Analysis and Applications in Environmental Engineering; McGraw-Hill: New York, NY, USA, 1970. [Google Scholar]
- Catalina, T.; Virgone, J.; Kuznik, F. Evaluation of thermal comfort using combined CFD and experimentation study in a test room equipped with a cooling ceiling. Build. Environ. 2009, 44, 1740–1750. [Google Scholar] [CrossRef]
- ASHRAE Handbook: Fundamentals; American Society of Heating, Refrigerating and Air-Conditioning Engineers, Inc.: Atlanta, GA, USA, 2009.
- Fanger, P.O. Thermal Comfort; Robert E. Krieger Publishing Company: Malabar, FL, USA, 1982. [Google Scholar]
- National University of Singapore, Singapore, Geography Weather Station. 2021. Available online: https://inetapps.nus.sg/fas/geog/ (accessed on 22 September 2021).
- ASHRAE Energy Standard for Buildings Except Low-Rise Residential Buildings; American Society of Heating, Refrigerating and Air-Conditioning Engineers, Inc.: Atlanta, GA, USA, 2004; Volume 90.
- Narayanan, R.; Saman, W.Y.; White, S.D.; Goldsworthy, M. Comparative study of different desiccant wheel designs. Appl. Therm. Eng. 2011, 31, 1613–1620. [Google Scholar] [CrossRef]
- Katejanekarn, T.; Chirarattananon, S.; Kumar, S. An experimental study of a solar-regenerated liquid desiccant ventilation pre-conditioning system. Sol. Energy 2009, 83, 920–933. [Google Scholar] [CrossRef]
- Xu, M.M.; Li, H. Solar Desiccant Cooling System BT—Handbook of Energy Systems in Green Buildings; Wang, R., Zhai, X., Eds.; Springer: Berlin/Heidelberg, Germany, 2018; pp. 301–323. [Google Scholar]
- Niu, J.L.; Zhang, L.Z.; Zuo, H.G. Energy savings potential of chilled-ceiling combined with desiccant cooling in hot and humid climates. Energy Build. 2002, 34, 487–495. [Google Scholar] [CrossRef]
- Porumb, B.; Bălan, M.; Porumb, R. Potential of Indirect Evaporative Cooling to Reduce the Energy Consumption in Fresh Air Conditioning Applications. Energy Procedia 2016, 85, 433–441. [Google Scholar] [CrossRef] [Green Version]
- Coz, T.D.; Kitanovski, A.; Poredos, A. Primary energy factor of a district cooling system/Faktor primarne energije sistema daljinskega hlajenja. Stroj. Vestn. J. Mech. Eng. 2016, 62, 717–731. Available online: https://link.gale.com/apps/doc/A474041498/AONE?u=tacoma_comm&sid=googleScholar&xid=45003155 (accessed on 17 November 2021). [CrossRef]
- Celik, I.B.; Ghia, U.; Roache, P.J.; Freitas, C.J. Procedure for Estimation and Reporting of Uncertainty Due to Discretization in CFD Applications. J. Fluids Eng. 2018, 130, 078001. [Google Scholar]
- Ohba, M.; Irie, K.; Kurabuchi, T. Study on airflow characteristics inside and outside a cross-ventilation model, and ventilation flow rates using wind tunnel experiments. J. Wind Eng. Ind. Aerodyn. 2001, 89, 1513–1524. [Google Scholar] [CrossRef]
- Cheung, J.O.P.; Liu, C.-H. CFD simulations of natural ventilation behaviour in high-rise buildings in regular and staggered arrangements at various spacings. Energy Build. 2011, 43, 1149–1158. [Google Scholar] [CrossRef]
- Measurement of energy, demand, and water savings. In ASHRAE Guideline14-2014; American Society of Heating, Refrigerating and Air-Conditioning Engineers, Inc.: Atlanta, GA, USA, 2014.

| Heat from Envelope [33], W/m2 | Internal Loads [34,35] | Minimum Outdoor Supply Air [36], l/s/Person | |||
|---|---|---|---|---|---|
| Occupant Density, /100 m2 | Occupant Activity, W/Person | Lighting, W/m2 | Equipment, W/m2 | ||
| 40 | 5 | 75 (Sensible), 55 (Latent) | 12 | 16 | 8.5 |
| S. No. | System | Heat through Envelope (W/m2) | Heat Output of Dummy (W/m2) | Wind Temperature (°C) | CCP Surface Temperature (°C) |
|---|---|---|---|---|---|
| 1 | Natural ventilation | 40 | 38 | 29.5 | / |
| 2 | The hybrid system | 26 | |||
| 3 | 27 | ||||
| 4 | 28 |
| S. No. | System | CCP Surface Temperature (°C) | Simulation Results | ||
|---|---|---|---|---|---|
| Air Velocity (m/s) | Air Temperature (°C) | MRT (°C) | |||
| 1 | Natural ventilation | \ | 0.66 | 29.7 | 30.9 |
| 2 | The hybrid system | 26 | 0.64 | 29.5 | 29.9 |
| 3 | 27 | 0.64 | 29.6 | 30.2 | |
| 4 | 28 | 0.65 | 29.6 | 30.4 | |
| 1 | 2 | 3 | 4 | |
|---|---|---|---|---|
| Compliance to thermal comfort | No | Yes | Yes | No |
| PMV | 0.57 | 0.43 | 0.46 | 0.5 |
| PPD | 12% | 9% | 9% | 10% |
| Sensation | Slightly warm | Neutral | Neutral | Slightly warm |
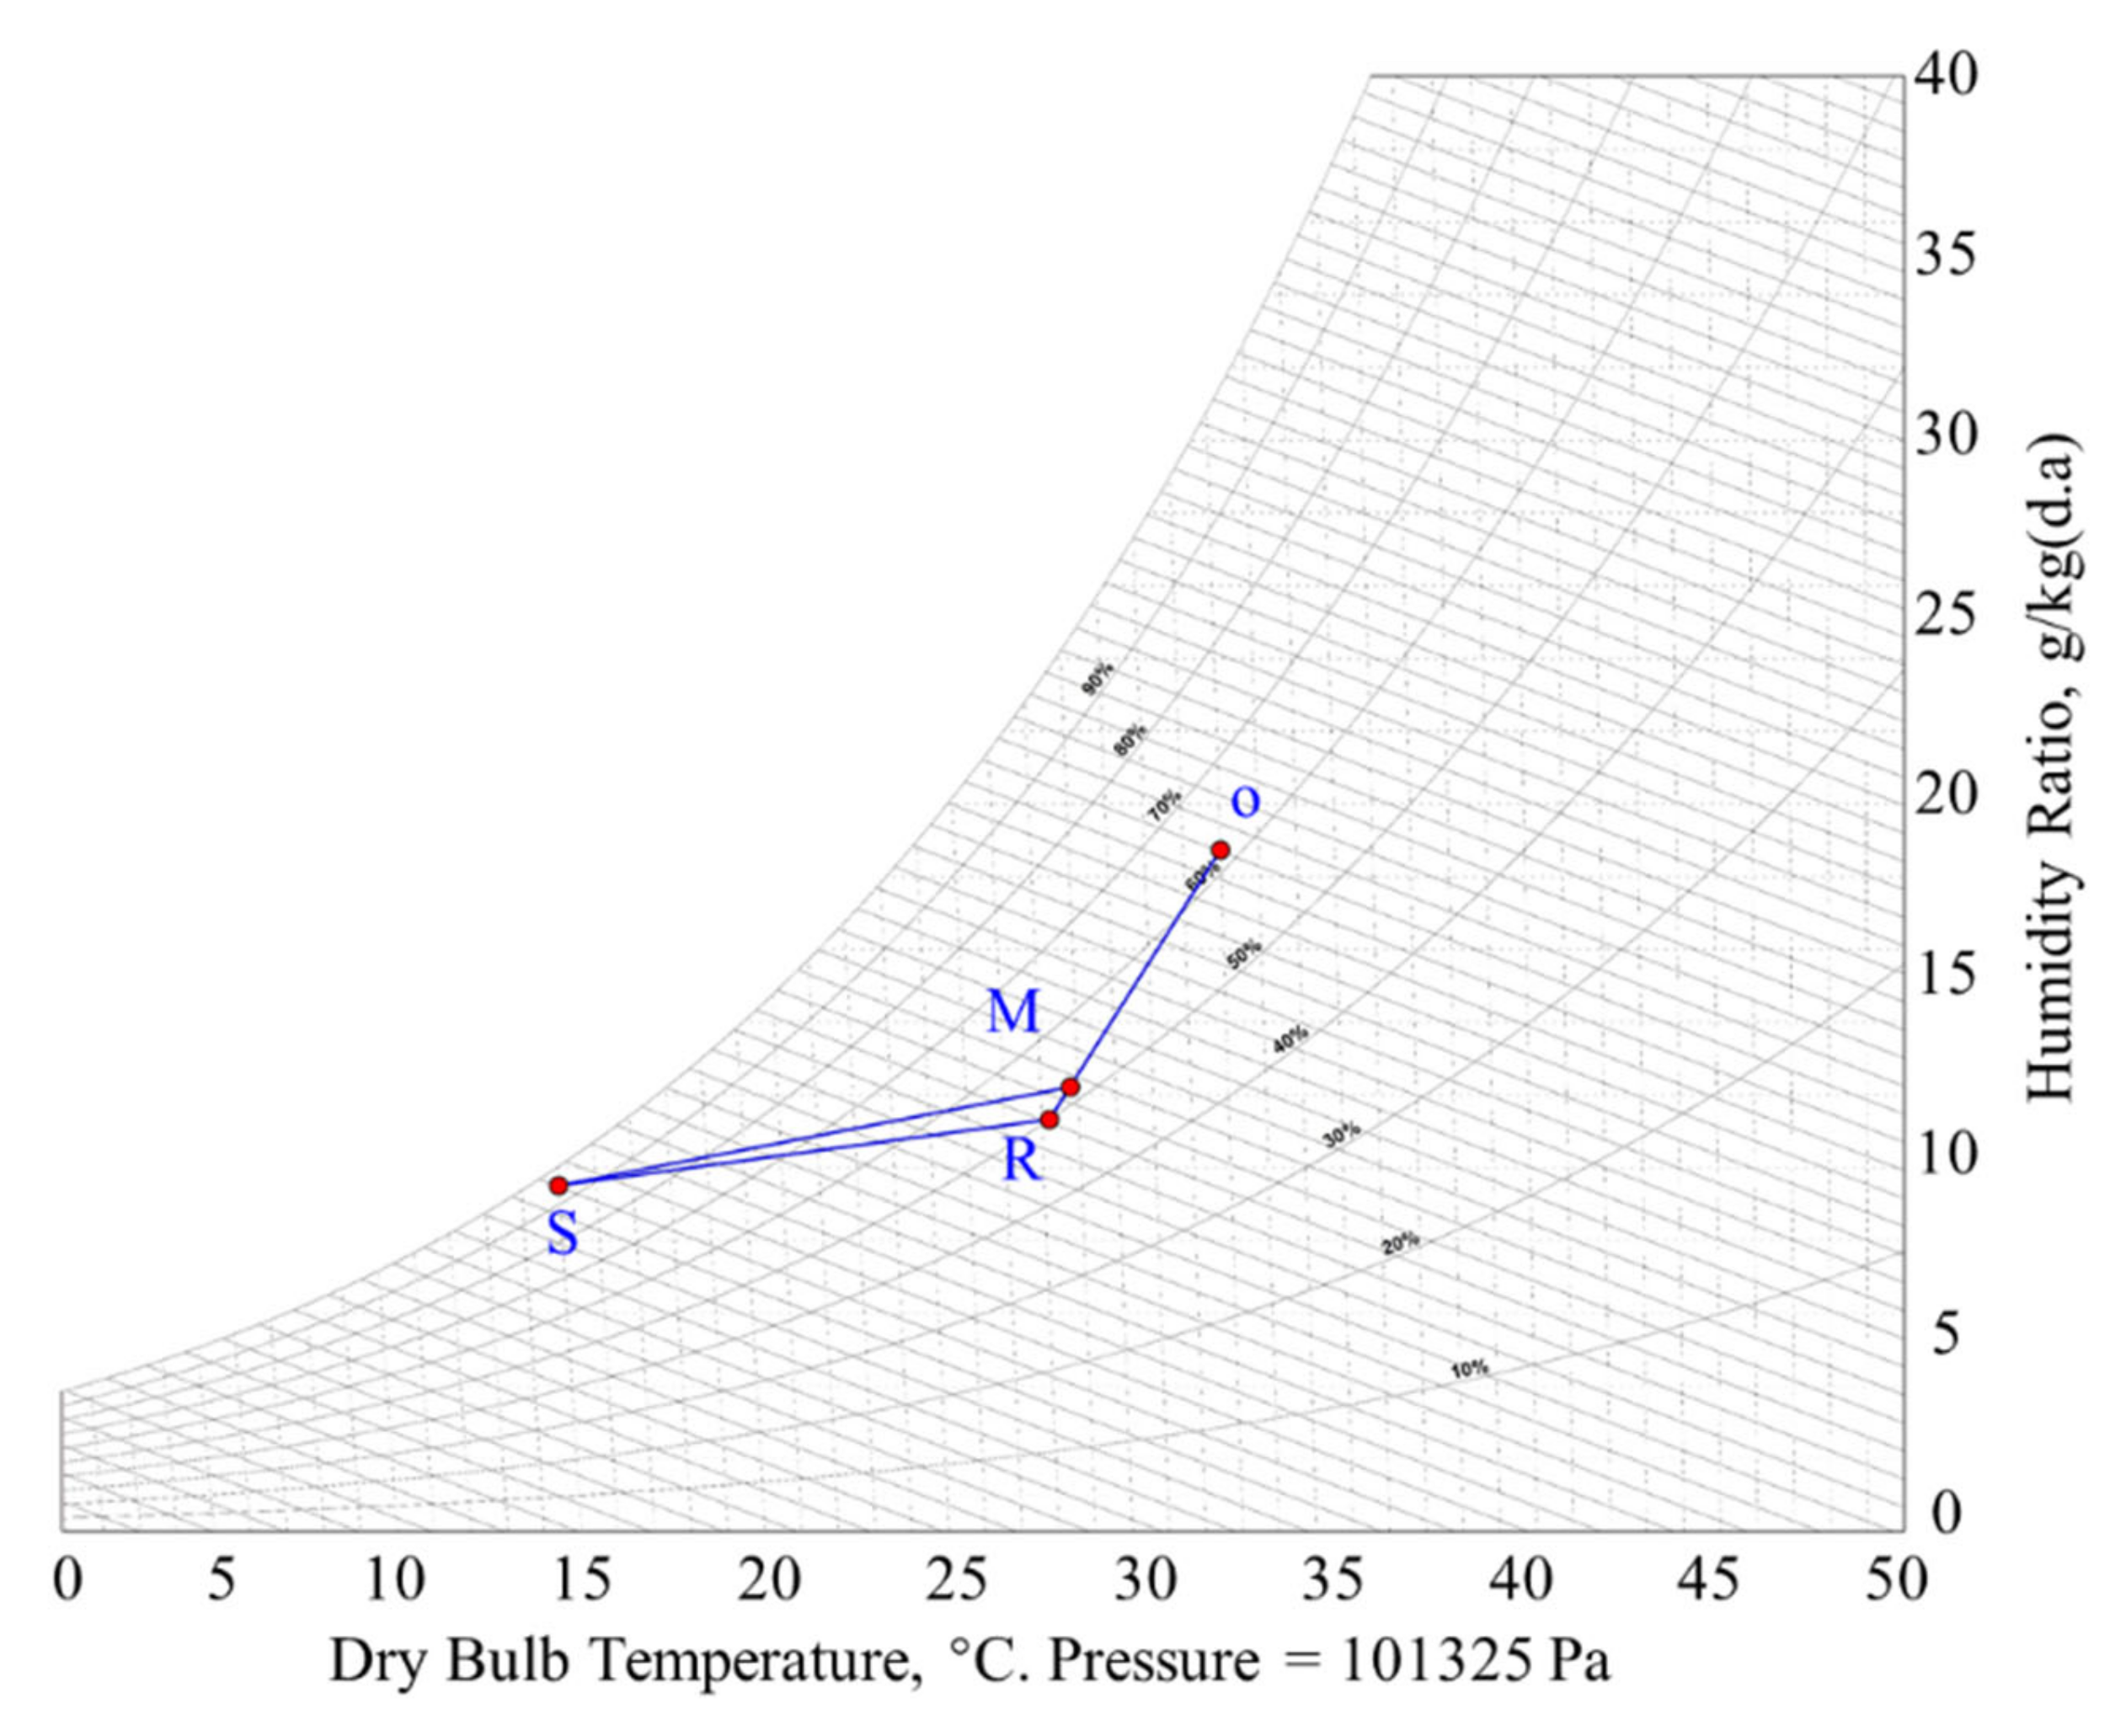
| State Point | Dry Bulb Temperature (°C) | Humidity Ratio (g/kg) | Specific Enthalpy (kJ/kg) | Relative Humidity (%) |
|---|---|---|---|---|
| O | 32 | 18.729 | 80.111 | 62 |
| M | 27.8 | 12.3 | 59.4 | 52 |
| R | 27.2 | 11.324 | 56.237 | 50 |
| S | 14 | 9.502 | 38.088 | 95 |
| State Point | Dry Bulb Temperature (°C) | Humidity Ratio (g/kg) | Specific Enthalpy (kJ/kg) | Relative Humidity (%) |
|---|---|---|---|---|
| A | 32 | 18.7 | 80.111 | 63 |
| B | 25 | 18.7 | 72.89 | 93.5 |
| C | 27 | 21.2 | 81.16 | 93.5 |
| State Point | Dry Bulb Temperature (°C) | Humidity Ratio (g/kg) | Specific Enthalpy (kJ/kg) | Relative Humidity (%) |
|---|---|---|---|---|
| 1 | 32 | 18.729 | 80.111 | 62 |
| 2 | 45 | 9.5 | 69.730 | 15.827 |
| 3 | 27.2 | 9.5 | 51.585 | 42 |
| R | 27.2 | 11.324 | 56.237 | 50 |
Publisher’s Note: MDPI stays neutral with regard to jurisdictional claims in published maps and institutional affiliations. |
© 2021 by the authors. Licensee MDPI, Basel, Switzerland. This article is an open access article distributed under the terms and conditions of the Creative Commons Attribution (CC BY) license (https://creativecommons.org/licenses/by/4.0/).
Share and Cite
Shakya, P.; Ng, G.; Zhou, X.; Wong, Y.W.; Dubey, S.; Qian, S. Thermal Comfort and Energy Analysis of a Hybrid Cooling System by Coupling Natural Ventilation with Radiant and Indirect Evaporative Cooling. Energies 2021, 14, 7825. https://doi.org/10.3390/en14227825
Shakya P, Ng G, Zhou X, Wong YW, Dubey S, Qian S. Thermal Comfort and Energy Analysis of a Hybrid Cooling System by Coupling Natural Ventilation with Radiant and Indirect Evaporative Cooling. Energies. 2021; 14(22):7825. https://doi.org/10.3390/en14227825
Chicago/Turabian StyleShakya, Pradeep, Gimson Ng, Xiaoli Zhou, Yew Wah Wong, Swapnil Dubey, and Shunzhi Qian. 2021. "Thermal Comfort and Energy Analysis of a Hybrid Cooling System by Coupling Natural Ventilation with Radiant and Indirect Evaporative Cooling" Energies 14, no. 22: 7825. https://doi.org/10.3390/en14227825
APA StyleShakya, P., Ng, G., Zhou, X., Wong, Y. W., Dubey, S., & Qian, S. (2021). Thermal Comfort and Energy Analysis of a Hybrid Cooling System by Coupling Natural Ventilation with Radiant and Indirect Evaporative Cooling. Energies, 14(22), 7825. https://doi.org/10.3390/en14227825