Abstract
Enclosed airspaces to reduce heat flow have been recognized for well over 100 years. Airspaces with one or more reflective surfaces define reflective insulation (RI) assemblies, a product type used in walls, roofs, windows with multiple panes, curtain walls and skylights. The thermal resistance (R value) of airspaces depends on the emittance of all surfaces, airspace dimensions and orientation, heat flow direction and surfaces temperatures. The modeling of RI now includes CFD coupled with radiation to quantify the total heat transfer. This study compares a validated model for airspace R values with existing methods such as ISO 6946 and hot-box results that provide the R values in the ASHRAE Handbook of Fundamentals. The existing methods do not include an airspace aspect ratio. This study showed that the aspect ratio can impact the R value by a factor of two. The impact of aspect ratio was calculated for double airspaces variation such as that for single airspaces. The present calculations are two-dimensional and also consider all the bounding airspace surfaces, while previous methods are one-dimensional and do not include surface temperature variations or detailed radiative transport.
1. Introduction
The use of all types of thermal insulations for energy use reduction for conditioning is an important part of efforts to achieve zero energy buildings. One example of these insulations is material with low thermal emittance (high thermal reflectance) that has been studied and utilized for over 100 years to reduce thermal radiation across airspaces [1]. The resulting product type, reflective insulation, utilizes air, with low thermal conductivity (25.1 mW/(m∙K) at 25 °C) [2], to reduce radiative heat transport and, in some cases, reduce convective heat transport to provide high thermal resistance. Many insulations used in buildings rely on the thermal resistance of air with fibers or particles to limit heat transfer by convection and radiation [3]. Reflective insulation assemblies belong to the above class of “air-based” insulations.
The thermal resistance provided by airspaces, especially reflective airspaces, gained recognition in the mid-20th century due to the publication of thermal test results from the U.S. National Bureau of Standards (NBS) [4]. The NBS’ results provided a basis for calculating the thermal resistance of airspaces for conditions typically encountered in buildings. The ASHRAE Handbook of Fundamentals (HOF) contains selected data from the NBS database [5,6]. The database for the thermal resistances of airspaces was extended by additional data published in 1990–1991 [7,8] and the evaluation of reflective airspaces has been represented at the international level by ISO 6946 [9].
Briefly, the thermal resistances or R values based on the Standard ISO 6946 used equations C.1, D.1, D.3 and D.4 in Annex D of the Standard [9]. The R value is defined as the ratio of ΔT (the temperature difference across the airspace) to (the heat flux across the airspace). The coefficients for convection–conduction are provided for the following heat flow directions: (a) upward (horizontal airspace, θ = 0°), (b) downward (horizontal airspace, θ = 0°) and (c) horizontal (vertical airspace, θ = 90°) as either constants or proportional to ΔT1/3. The terms for upward heat flow include a term for the airspace distances/thicknesses (δ). The ISO calculation uses the Stefan–Boltzmann Equation for determining the net radiative transport between large/infinite parallel surfaces [10]. Thus, the effects of the aspect ratio and heat transfer by radiation on the surfaces of the two ends of the airspace on the thermal resistance are not included in ISO 6946. The total heat flux in ISO 6946 is represented as the sum of the radiation flux and the conduction–convection flux. The ISO method for calculating the thermal resistance differs from the method used by Robinson and Powell [4] in the procedure for determining the convection–conduction flux. In addition, ISO 6946 does not include a reference to the basis for the equations presented in the Standard.
The correlations for thermal resistance in HRP 32 use data from 146 guarded hot box tests of enclosed reflective airspaces for different types of reflective insulations [4]. An important part of the analysis and correlation was a determination of the heat flux due to convection–conduction by subtracting the radiative component from the experimentally determined total heat flux with a subsequent graphical presentation of the Nusselt Number (Nu). Addition test data and analytical representations of the Nu data for five heat flow directions commonly discussed were published in 1990–1991 [7,8] with a recently improved set of constants [11]. The data contained in the ASHRAE Handbook of Fundamental [6] are a sub-set of the NBS data set mentioned above. Similar to the ISO 6946, the effects of aspect ratio and the heat transfer by radiation on the surfaces of the two ends of airspace on the R value are not discussed in HRP 32 [4] or the ASHRAE Handbook of Fundamental [6].
As the methodology that was used for determining the convection–conduction heat flux in ISO 6946 [9] is different from that used in HRP 32 [4], the calculated R values using ISO and HRP 32 are different. As will be shown later for a given effective emittance, the differences between the ISO R values and HRP 32 R value depend mainly on both the heat flow direction and the orientation of the enclosed airspaces.
The data sets used for evaluating the thermal resistance of airspaces described above have limitations. The test data are representative of only parallel isothermal surfaces with five heat flow directions represented [6]. These data were obtained for a single airspace aspect ratio with a few exceptions in the 1991 data from Tye and Desjarlais [7], and the number of independent variable assignments needed to quantify the resistance to heat flow.
Advanced numerical models and an ever-increasing computational speed have made the simulation of heat transfer in enclosed regions by all the modes achievable. The governing equations that were solved by the present model using the finite element method have been described in previous publications [12,13,14,15]. The model includes CFD to characterize convective heat transport inside the enclosed airspaces. This capability to accurately calculate heat transfer with all the modes of heat transfer represented enables results to be obtained as a function of heat flow direction, aspect ratio, operating conditions and all of the previously considered independent variables [16,17]. Additionally, the model was used to assess the hygrothermal performance of building envelopes (e.g., see [18] for the case of roofing systems subjected to hot and humid climate).
With a numerical model that is used in this research study and briefly described below, practical correlations were developed for regions with various orientations, dimensions and environments [19,20,21,22,23,24]. In addition, the capabilities of this model were recently extended to estimate the impact of (a) wind washing, (b) air infiltration/exfiltration, (c) cross-airflow between adjacent reflective airspaces [25] and (d) the imperfect installation of low-emittance materials/sheets on the overall thermal resistance of regions for a range of aspect ratios, inclinations, temperatures and heat flow directions [25]. These capabilities remove many of the limitations of previous techniques for evaluating the heat transfer across enclosed reflective airspaces [25]. The theoretical background of the present model is briefly presented in the Appendix A.
2. Description and Validation of the Numerical Model
For the various airspace thicknesses (δ), aspect ratios (AR), average temperatures (Tavg), temperature differences (ΔT) and effective emittances (E), the numerical model used in this study provides R value results for vertical enclosed airspaces (θ = 90°) with horizontal heat flow [19], horizontal enclosed airspaces (θ = 0°) with an upward and downward heat flow [20,21], sloped enclosed airspaces (θ = 45°) with an upward and downward heat flow [22,23] and low-sloped enclosed airspaces (θ = 30°) with a downward heat flow [24]. The model has been widely used to create a design and optimization tool called “Reflective Airspace Tool” for use by the technical community to determine thermal resistances for a variety of unventilated/enclosed airspaces with different dimensions and operating conditions. The full capabilities and features of this tool were recently presented to the membership of the trade association for reflective insulation [26]. As provided in [25] for non-rectangular airspaces, this model was recently used to assess the performance of an attic radiant barrier and the impact of the imperfect installation of multilayer airspaces on the R value. In addition, the model has been used to investigate the effect of cross-airflow through openings of different sizes at different locations between adjacent airspaces on the assembly R value [25].
The model simultaneously solves the moisture transport equation, the energy equation, the surface-to-surface radiation equation, such as shown in Figure 1, and surface-to-surface and surface-to-ambient radiation for the case of open airspaces such as radiant barriers and adjust airspaces with an opening between them (e.g., see [25]), and the air transport equation for the layers of materials present in the structure. The Navier–Stokes equation is used for the airspace layers, while the Darcy equation for Darcy numbers DN < 10−6 and the Brinkman equation for DN > 10−6 are used for porous material layers. The full details of moisture transport equation are available in [13]. Additionally, the full details of the energy equation, momentum equation (Navier–Stokes equation, Darcy equation, Brinkman equation), surface-to-surface equation and surface-to-ambient radiation equation are available in [12,14,15]. These equations were discretized using the finite element method (FEM). The use of the FEM is important as it permits modelling complicated geometries with less discretizing errors. The model has been validated for a number of building applications involving full-scale and small-scale building assemblies with and without reflective insulations (see [12,13,14,15,16,17,18] for more details).
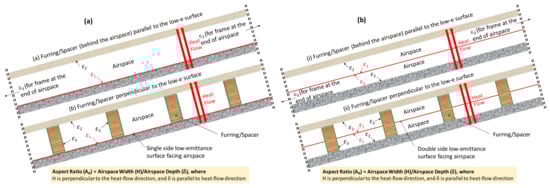
Figure 1.
Schematic of enclosed airspace systems for building applications ((a) single-enclosed airspace system and (b) double-enclosed airspace system).
For the case of building assemblies with reflective insulations, the results obtained with the model have been successfully compared with the test results for a reflective insulation in a full-scale wall system [15] obtained using a guarded hot box facility in accordance with ASTM C1363 [27]. The calculated R value differed from the measured value by 1.2%. Additionally, the model predictions for the thermal resistance results were also compared with test data obtained using a heat flow meter apparatus in accordance with the ASTM C518 [28]. The predicted heat fluxes were within ±1.0% of the measured values [16,29].
In this study, the model was also validated by comparing the predicted R values with the HRP 32 R values [4]. The guarded hot box specimens used for the HRP 32 were 813 mm (32 inches) wide with various airspace thicknesses. These specimens were subjected to horizontal, upward and downward heat flow. The model validations were conducted for single airspaces of 89 mm (3.5 inches) thick (i.e., aspect ratio of 9.1) and double airspaces of 45.5 mm (1.75 inches) thick each (i.e., aspect ratio of 18.3). For single and double airspaces with an average temperature of 23.9 °C (75 °F) and a temperature difference of 16.6 °C (30 °F) (i.e., TH = 32.2 °C (90 °F) and TL = 15.6 °C (60 °F)), Figure 2a through Figure 2f show comparisons of the predicted R values with the HRP 32 R values for a wide range of effective emittance (0–0.82). The inserts in these figures show the temperature (T) and resultant air velocity (Vres) distributions in the enclosed airspaces at an effective emittance of 0.05. With a horizontal heat flow in a vertical single airspace in which one convection loop was formed, Figure 2a shows that both predicted and HRP 32 R values are in good agreement. Likewise, for vertical double airspaces with a horizontal heat flow (one convection loop was formed in each airspace), the predicted R values are in good agreement with the HRP 32 R values, as shown in Figure 2b.
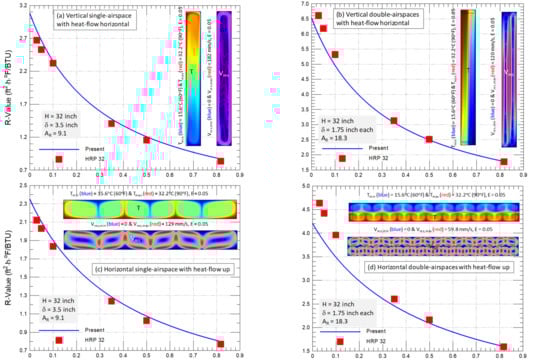
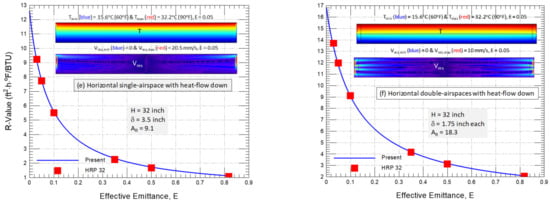
Figure 2.
Model validation against HRP 32 test data [4] for single airspace of Aspect ratio of 9.1 and double airspaces of aspect ratio of 18.3 for a horizontal heat flow (a,b), an upward heat flow (c,d) and a downward heat flow (e,f).
For a horizontal single airspace with an upward heat flow, six convection loops were formed in the airspace (Figure 2c). However, for horizontal double airspaces with an upward heat flow, 16 convection loops were formed in the top airspace, and 22 convection loops were formed in the bottom airspace (Figure 2d). As shown in Figure 2c for a horizontal single airspace with an upward heat flow, the predicted R values were in good agreement with HRP 32 R values for the full range of effective emittance. For horizontal double airspaces with an upward heat flow, Figure 2d shows that the predicted R values are in good agreement with the HRP 32 R value for the high effective emittance values (≥0.35); but, the predicted R values were lower than the HRP-32 R values for the low effective emittance values (≤0.1). For an upward heat flow up in horizontal single airspace and double airspaces, two convection loops were formed in each airspace (Figure 2e,f). For the full range of effective emittance, Figure 2e shows that both predicted and HRP 32 R values are in good agreement for a horizontal single airspace with a downward heat flow. Furthermore, for horizontal double airspaces with a downward heat flow, the predicted R values are in good agreement with the HRP 32 R values (Figure 2f).
Providing that the uncertainties in the R value measurements using guarded hot box in accordance with ASTM C1363 are ±5% [27], Figure 2a through Figure 2f show that most of the predicted R values are in good agreement with HRP 32 R values (within the same uncertainties of ±5%). As such, the model was used with confidence in this study to quantify the effects of the aspect ratio and radiative heat transfer at the two airspace ends on the R values for single and double airspaces of various inclination angles and subjected to different operating conditions and heat flow directions.
3. Objectives
Reflective insulation products use thin foil/coatings of low emittance, usually less than 0.2 mm thick. The lower the emittance is, the higher the thermal resistance is for a building assembly with reflective insulation [30,31]. Previous studies (e.g., see [32,33] for more details) have shown degradations/reductions in the thermal performance of reflective insulation products as a result of surface contamination or the condensation of water on the low-e surfaces. Dust accumulation or water condensation on low-e surfaces increases their emittance. Thus, an important reason for this study was to quantify the effect of increasing the effective emittance on the thermal resistance of unventilated air spaces. Furthermore, the enclosed region aspect ratio, AR (AR = airspace width perpendicular to the heat flow direction (H)/airspace depth parallel to the heat flow direction (δ)), is not accounted for in the currently available methods to calculate the thermal resistance. Hence, another objective was to establish the dependence of the R value on the aspect ratio of unventilated airspaces of various inclination angles and heat flow directions.
For a wide range of simulation variables, the model was used to quantify the increase in the R values as a result of dividing the enclosed airspace into two enclosed airspaces of equal thickness. As shown in Figure 1, the main airspace was divided using a foil with low-emittance sides. The calculated R values were compared with those from the HRP 32 data for single airspaces and double airspaces [4] as well as those calculated using the ISO 6946 [9] for single airspaces. Finally, consideration was given to investigate the effect of radiative exchange with the surfaces of the ends of the enclosed airspaces, called “end effect”, on the thermal resistance. Note that the surfaces of the two ends represent the surfaces of the framing/spacers of the enclosed airspaces (e.g., furred airspace assembly shown in Figure 1). This end effect is not accounted for in the other available methods, for example, ISO 6946 [9] and ASHRAE [5,6].
4. Results and Discussions
The calculated thermal performance for five cases is contained in the section:
- (a)
- Vertical airspaces (θ = 90°) with horizontal heat flow to represent walls, windows and curtain walls with reflective insulation (RI).
- (b)
- Horizontal airspaces (θ = 0°) with upward heat flow to represent building components such as flat roofs or skylights with RI during the cold season.
- (c)
- Horizontal airspaces (θ = 0°) with downward heat flow to represent building components such as flat roofs or flat skylights with RI during the hot season.
- (d)
- Sloped airspaces (θ = 45°) with upward heat flow to represent building components such as sloped roofs or skylights with RI during the cold season.
- (e)
- Sloped airspaces (θ = 45°) with downward heat flow to represent building components such as sloped roofs or flat skylights with RI during the hot season.
Results have been obtained for enclosed airspaces with a thickness/depth, δ, of 89 mm (3.5 inches); aspect ratios, AR, from 1.1 to 27.4; with an effective emittance, E, from 0 to 0.82. In each case, the warm side temperature, TH, was taken to be 32.2 °C (90 °F) and the cool side temperature, TL, was taken to be 15.6 °C (60 °F) (i.e., ΔT = 16.6 °C (30 °F)). In addition, results are obtained in this paper for the five cases, (a) through (e), listed above after splitting the airspace shown in Figure 1a (δ = 89 mm (3.5 inches)) into two airspaces of equal thickness (δ = 45.5 mm (1.75 inches), see Figure 1b) by installing a thin sheet with emittances on both sides ranging from 0 to 0.9.
Unlike the other available methods, such as ISO 6946 [9] and ASHRAE [5,6], for calculating the thermal resistance of enclosed air-filled regions, the heat transfer by radiation from all the surfaces that bound the airspace was included in the present model. In this study, the emittance value of all the surfaces that bound the airspace (ε2 and ε3) except the low-emittance surface (ε1) were taken to be 0.9 [6] (i.e., ε2 = ε3 = 0.9, see Figure 1a,b). The effective emittance of the enclosed airspace (E) is calculated as follows [5,6]:
E = 1/[1/ε1 + 1/ε2 − 1]
Note that for the case of no low-emittance foil/coating installed in the enclosed airspace (i.e., ε1 = ε2 = 0.9 [6]), the corresponding value of E is equal to 0.82. Throughout this paper, unless otherwise specified, the case before splitting the airspace (Figure 1a) is called a “single airspace”, whereas the case after splitting the airspace into two airspaces of equal thickness (Figure 1b) is called “double airspaces”. The present values for thermal resistances were checked against those obtained using ISO 6946 [9] and those based on the data contained in HRP 32 [4]. Since the ISO 6946 method is not applicable for sloped airspaces and double airspaces, the ISO 6946 R values for only cases (a), (b) and (c) listed above are compared with the present thermal resistances for single airspaces.
Heat transfer occurs in the air-filled regions by conduction, radiation and convection. To show the importance of convection, calculations were conducted with and without heat transfer by convection for single and double airspaces of 89 mm (3.5 inches) thick and 16 inches long at TH = 90 °F and TL = 60 °F. These simulations were conducted for the following two cases:
- (i)
- No radiation takes place at the two ends of airspace surfaces (i.e., ε3 = 0.0, see the insert in Figure 3). This case is called “without end effect”, which represents the case of net radiative transport between two large/infinite parallel surfaces that are currently being used in the ISO 6946 [9] and ASHRAE [5,6] methods. The surfaces of the two ends of the airspace are usually the surfaces of the framing (e.g., furring or spacers) that bind the airspace. Note that the case of without end effect would represent the situation in which low-e material is present on the surfaces of the framing/spacers facing the airspace. It is important to point out that the main reason to address this case in this study is to explore, for reflective insulation manufactures, building authorities and designers, the impact on R value due to installing low-e foil or coating on the surfaces of the framing/spacers that face the airspace and parallel to the heat-flow direction (see the green lines in Figure 1a,b).
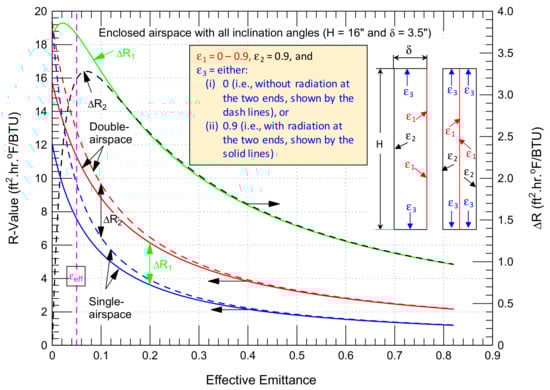 Figure 3. Comparisons of the thermal resistances for single and double airspaces in the absence of heat transfer by convection with end effect (i.e., ε3 = 0.9) and without end effect (i.e., ε3 = 0.0) at H = 16 inches, total δ = 3.5 inches, TH = 90 °F, TL = 60 °F.
 - (ii)
- Radiation takes place at the two ends of the airspace surfaces represented by green lines in Figure 1a,b (i.e., ε3 = 0.9 [6]). This case is called the “with end effect”.
4.1. R Values in Absence of Convection
In the absence of convection, the R value results for the range of effective emittance (E) from 0 to 0.82 are plotted on the left y-axis of Figure 3 for the cases (i) and (ii) listed above. In this figure, ΔR1 and ΔR2, respectively, which are plotted on the right y-axis, represent the contributions to the R values due to splitting the main airspace into two airspaces of equal thickness with end effect (i.e., ε3 = 0.9) that is shown by the solid green line, and without end effect (i.e., ε3 = 0.0) that is shown by a black line. The results shown in Figure 3 are applicable for single and double airspaces (H = 16 inches and δ = 89 mm (3.5 inches)) of various inclination angles (θ). At a theoretical effective emittance of zero (E = 0 at which foil or coating emittance, ε1, equal 0.0), no heat transfer by radiation takes place for the case without end effect (i.e., ε3 = 0.0). As such, in the absence of convection in this case (E = 0), the heat transfer inside the airspace is by conduction only in which the R values for both single and double airspaces are the same (i.e., ΔR2 = 0, see Figure 3). However, for the case with end effect (ε3 = 0.9), Figure 3 shows that at a theoretical effective emittance of zero, the value of ΔR1 was 3.69 ft2·h·°F/BTU. Increasing the effective emittance resulted in increasing both ΔR1 and ΔR2 until they reached their highest values (ΔR1,max = 3.86 ft2·h·°F/BTU at which E = 0.02 and ΔR2,max = 3.28 tf2·h·°F/BTU at which E = 0.07). Further increasing the effective emittance has resulted in decreasing both ΔR1 and ΔR2 (see Figure 3). At an effective emittance of 0.03 and 0.05, respectively, the obtained values for ΔR1 were 3.85 and 3.72 ft2·h·°F/BTU, and those for ΔR2 were 2.75 and 3.19 ft2·h·°F/BTU.
Figure 3 shows that both cases with end effect and without end effect have resulted in an insignificant effect on the R values for effective emittance greater than ~0.3 for both single and double airspaces, and thus, there is no need to include radiative transport at the two ends of the airspace. In other words, the use of the Stefan–Boltzmann Equation is adequate for determining the R values of airspaces with E > 0.4. However, the end effect has resulted in significant changes in the R values of the single and double airspaces with E < 0.2. For example, for effective emittance of 0.03 and 0.05, respectively, for a single airspace, the R values with end effect (R = 8.89 and 7.57 ft2·h·°F/BTU) were overestimated by 3.19 and 2.08 ft2·h·°F/BTU due to the end effect at which R = 12.08 and 9.69 ft2·h·°F/BTU being neglected. Similarly, for double airspaces with the same effective emittance (0.03 and 0.05, respectively), the R values with end effect (R = 12.74 and 11.29 ft2·h·°F/BTU) were also overestimated by 2.09 and 1.55 ft2·h·°F/BTU due to the end effect at which R = 14.83 and 12.88 ft2·h·°F/BTU being neglected. Note that the contribution of the end effect to the R values of single and double airspaces can be greater for a shorter width (H < 16 inches) and smaller for a longer width (H > 16 inches) than those shown in Figure 3.
4.2. Impact of Convection on R Values
For a given operating condition (TH and TL), convective heat transport depends on the angle of inclination (θ), heat-flow direction and dimensions (δ and H). By accounting for the heat transfer by convection for the same operating condition (TH = 90 °F and TL = 60 °F), single and double airspaces’ dimensions (δ = 89 mm (3.5 inches) and H = 406 mm (16 inches)) and an effective emittance range of 0–0.82, numerical simulations were performed for vertical airspaces with a horizontal heat flow, horizontal airspace with upward and downward heat flow, and 45° sloped airspace with upward and downward heat flow. These simulations were conducted for both cases with end effect (ε3 = 0.9) and without end effect (ε3 = 0.0).
At an E value of 0.05, Figure 4a, Figure 5a, Figure 6a and Figure 7a, respectively, show the contours of temperature (T), horizontal velocity (Vx) vertical velocity (Vy) and resultant velocity (Vres) for single airspaces as a function of orientation and heat-flow direction. The corresponding results for double airspaces are shown in Figure 4b, Figure 5b, Figure 6b and Figure 7b, respectively. Additionally, in order to show the number, shapes and sizes of the convections loops, these figures also show the streamlines of the air velocity field. Due to the large differences in the velocities in the airspaces, auto contour levels were used in Figure 5 for Vx, Figure 6 for Vy and Figure 7 for Vres.
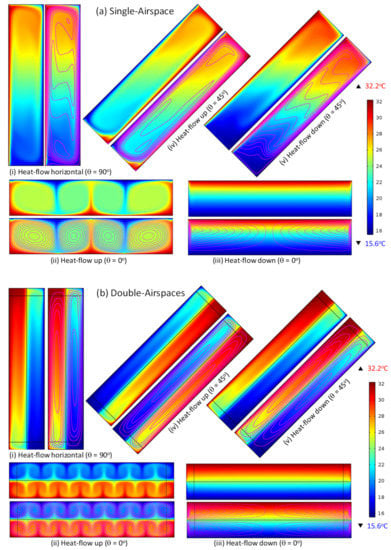
Figure 4.
Distributions of temperature and velocity field streamlines in (a) a single airspace and (b) double airspaces (H = 406 mm (16 inches) and δ = 89 mm (3.5 inches), TH = 32.2 °C (90 °F), TL = 15.6 °C (60 °F), E = 0.05).
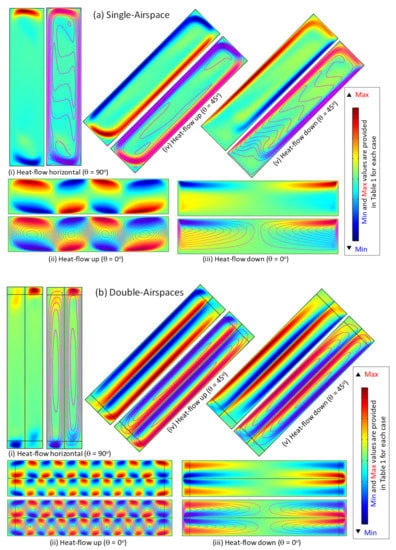
Figure 5.
Distributions of horizontal velocity and velocity field streamlines in (a) a single airspace and (b) double airspaces (H = 406 mm (16 inches) and δ = 89 mm (3.5 inches), TH = 32.2 °C (90 °F), TL = 15.6 °C (60 °F), E = 0.05).
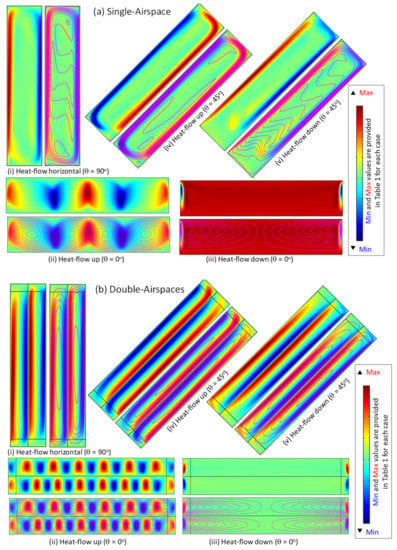
Figure 6.
Distributions of vertical velocity and velocity field streamlines in (a) a single airspace and (b) double airspaces (H = 406 mm (16 inches) and δ = 89 mm (3.5 inches), TH = 32.2 °C (90 °F), TL = 15.6 °C (60 °F), E = 0.05).
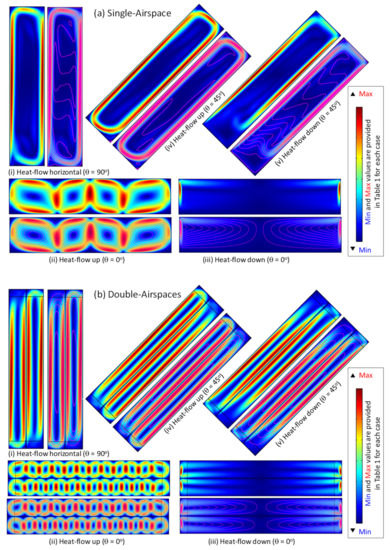
Figure 7.
Distributions of resultant velocity and velocity field streamlines in (a) a single airspace and (b) double airspaces (H = 406 mm (16 inches) and δ = 89 mm (3.5 inches), TH = 32.2 °C (90 °F), TL = 15.6 °C (60 °F), E = 0.05).
Five cases for single airspaces and another five cases for double airspaces are investigated in this study. These cases include (1) vertical airspaces with horizontal heat flow, (2) horizontal airspaces with an upward heat flow, (3) horizontal airspaces with a downward heat flow, (4) 45° airspaces with an upward heat flow and (5) 45° airspaces with a downward heat flow. To produce high quality contour plots and as well avoid the crowdedness in these plots (see Figure 5(ai) thorough (v) and Figure 5(bi) thorough (v) for Vx, Figure 6(ai) thorough (v) and Figure 6(bi) thorough (v) for Vy, and Figure 7(ai) thorough (v) and Figure 7(bi) thorough (v) for Vres), only one auto contour bar was used in which the maximum value and minimum values are listed in Table 1 for the five cases of single airspaces and the five cases of double airspaces. In each auto contour bar, the minimum values (Min) are represented by a blue color, while the maximum values (Max) is represented by a red color (Table 1, Figure 5, Figure 6 and Figure 7). For a given airspace orientation and heat-flow direction, due to the temperature difference across the single and double airspaces, flow occurs in each space due to the density differences, creating a mono-cellular airflow or a multi-cellular airflow with multiple convective loops, as shown in Figure 4, Figure 5, Figure 6 and Figure 7.

Table 1.
List of the ranges of contour bars (i.e., minimum value in blue color (Min) and maximum value in red color (Max) for each bar) for the contours plots of the velocity distributions inside the single and double airspaces shown in Figure 5 for horizontal velocity (Vx), Figure 6 for vertical velocity (Vy) and Figure 7 for resultant velocity (Vres).
4.2.1. Vertical Airspaces (θ = 90°) with Horizontal Heat Flow
At an E value of 0.05 for vertical single and double airspaces with a horizontal heat flow, Figure 4(ai,bi) through Figure 7(ai,bi) show that one convection loop appears in each enclosed space. Small vortexes of different sizes were developed inside the main convection loop in single airspaces. Table 1 lists the minimum and maximum values of the contour bars along with Figure 5(ai,bi) for Vx, Figure 6(ai,bi) for Vy, and Figure 7(ai,bi) for Vres. As shown in these figures, the air velocity in the single airspaces is typically much higher than that in double airspaces. For example, the highest resultant velocity in the single airspace (128 mm/s) is 55% greater than that in the double airspace (82.8 mm/s). Consequently, convective transport in the single airspace exceeds that in the double airspace. Additionally, for the same E value in the absence of convection, radiation inside the single airspace exceeds that in the double airspaces with a resulting increase in the R value, as shown in Figure 3.
The combined effect of heat transfer by convection and radiation results in lower R values for the single airspace than that for the double airspaces as shown in Figure 8a,b. For example, at E = 0.05, the predicted R value for the single airspace is 2.35 ft2·h·°F/BTU, which is 48% of that for the double airspaces (4.94 ft2·h·°F/BTU). In other words, a low-e thin foil equally dividing an airspace can more than double the R value.
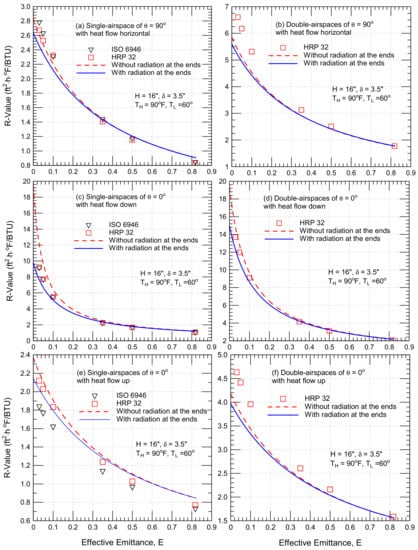
Figure 8.
Effect of effective emittance on the thermal resistances of a single airspace and double airspaces with end effect (i.e., ε3 = 0.9) and without end effect (i.e., ε3 = 0.0) of θ = 0° and 90° at H = 16 inches and total δ = 3.5 inches for a horizontal heat flow (a,b), a downward heat flow (c,d) and an upward heat flow (e,f).
For a single airspace of 16 inches long, Figure 8a shows the R values with end effect (solid line) and without end effect (dash line) with those obtained using ISO 6946 [9] and HRP 32 [4]. As shown in this figure, both ISO 6946 and HRP 32 R values agree with the present R values for E ≥ 0.35. However, the ISO 6946 and HRP 32 R values agree best with the present R values for a single airspace of 24 inches long (i.e., AR = 6.9, see Figure 10 in Section 4.3.1 for more details). Neglecting the end effect (i.e., without radiation at the two airspace ends) results in a higher calculated R value than that with end effect for E < 0.2. For example, at E = 0.05, the R value with no end effect (2.48 ft2·h·°F/BTU) exceeded the result with end effect by 6% (2.35 ft2·h·°F/BTU). Furthermore, at E = 0.05, the heat transfer by convection resulted in reducing the R value (2.35 ft2·h·°F/BTU in Figure 8a) by 5.22 ft2·h·°F/BTU in relation to the case with no convection (7.57 ft2·h·°F/BTU in Figure 3).
It is important to point out that the correlations for HRP 32 R values [4] are provided independent of the aspect ratio. However, these correlations were obtained using test data from 146 guarded hot box tests of enclosed reflective airspaces of 32 inches long (i.e., the aspect ratio of 9.1 and 18.3 for single airspace and double airspaces, respectively). As shown in Figure 2b, the HRP 32 R values for double airspaces with horizontal heat flow are in good agreement with the present R values for an airspace with the same dimensions as in the test (i.e., 32 inches long, AR = 18.3).
Figure 8b compares the present R values with HRP 32 R values [4] for 16-inch-long double airspaces. For E = 0.05 or 0.1, the HRP 32 R values are 25 or 20% greater than the present R values. However, as indicated above, the present and HRP 32 R values are in good agreement for an airspace of 32 inches long at which the HRP 32 correlations were obtained (see Figure 2b). On the other hand, both the present R values and HRP 32 R values are in closest agreement for the full range of the effective emittance of 48-inch-long double airspaces (AR = 27.4, see Figure 11 in Section 4.3.1 for more details). At E values of 0.03 and 0.05 for 16-inch-long double airspaces, the R values (5.18 and 4.94 ft2·h·°F/BTU in Figure 8b) were reduced by 7.56 and 6.35 ft2·h·°F/BTU, respectively, due to convection (12.74 and 12.29 ft2·h·°F/BTU in Figure 3).
4.2.2. Horizontal Airspaces (θ = 0°) with Downward Heat Flow
The distributions of the temperature, horizontal air velocity, vertical air velocity and resultant air velocity inside a horizontal single airspace of 16 inches long with a downward heat flow at an E value of 0.05 are shown in Figure 4(aiii), Figure 5(aiii), Figure 6(aiii) and Figure 7(aiii), respectively. The corresponding results occur inside 16-inch-long double airspaces as shown in Figure 4(biii), Figure 5(biii), Figure 6(biii) and Figure 7(biii). These results demonstrate that with a downward heat flow, a relatively stable stratification exists. This can easily be observed in the shape of the temperature distributions shown in Figure 4(aiii,biii), where two convection loops were formed inside each airspace with quite slow air movement in relation to vertical airspaces with horizontal heat flow (see Figure 5(ai,bi), Figure 6(ai,bi) and Figure 7(ai,bi)) and for horizontal airspaces with upward heat flow (to be shown next). For example, the highest resultant velocity inside the single airspace was 17.4 mm/s (Figure 7(aiii) and Table 1) and the corresponding value inside the double airspaces was 9.78 mm/s (Figure 7(biii) and Table 1). The R value reductions due to convection with a downward heat flow (θ = 0°) is much smaller than that for other airspace orientations of different heat-flow directions.
Figure 8c compares the present R values with and without end effect with the ISO 6946 [9] and HRP 32 [4] R values for a single airspace of 16 inches long. As indicated earlier, both the ISO and HRP 32 methods used different methodologies in determining the convection–conduction heat flux through the airspace. As the contribution of heat transfer by convection inside the enclosed airspaces for the case of a downward heat flow is insignificant in relation with the cases of horizontal heat flow and upward heat flow, the calculated R values using these methods for the case of downward heat flow are approximately the same as shown in Figure 8c and Figure 12 in Section 4.3.2. Figure 8c shows that both ISO 6946 and HRP 32 R values are in good agreement with the present R values for E ≥ 0.1. At E = 0.05, both ISO 6946 and HRP 32 R values exceed the present R value by 15%. Figure 12, however, shows that the ISO 6946 and HRP 32 R values agree closely with the present R values for a 24- and 36-inch-long single airspace (AR = 6.9 or 10.3). For double airspaces, Figure 8d compares the present R values with HRP 32 R values. As shown in this figure, the present and HRP 32 R values are in good agreement for E ≥ 0.1, while the HRP 32 R value are 9% greater than the present R values at E = 0.05. As will be shown later in Section 4.3.3, Figure 13 that both the present and HRP 32 R values are approximately the same within the whole range of effective emittance for double airspaces of 36 inches or 48 inches long (AR = 20.6 or 27.4).
Similar to airspaces with horizontal heat flow (θ = 90°), neglecting the end effect in airspaces with downward heat flow (θ = 0°) has resulted in obtaining a higher R value than that with end effect for the range of low effective emittance (E < 0.3). At E = 0.05 for single airspaces, Figure 8c shows that the R value without end effect (9.66 ft2·h·°F/BTU) exceeded the R value with end effect by 44% (6.70 ft2·h·°F/BTU). At this E value (0.05) for double airspaces, the R value without end effect (12.86 ft2·h·°F/BTU) exceeded the case with end effect (10.95 ft2·h·°F/BTU, Figure 8d) by 17%. Additionally, at E = 0.05 for single airspaces, convection reduced the R value (6.70 ft2·h·°F/BTU, Figure 8c) by only 0.87 ft2·h·°F/BTU when compared to the case with no convection (7.57 ft2·h·°F/BTU, Figure 3). Furthermore, at this E value for double airspaces, the convection resulted in reducing the R value (10.95 ft2·h·°F/BTU, Figure 8d) by 0.34 ft2·h·°F/BTU relative to no convection (11.29 ft2·h·°F/BTU, Figure 3).
4.2.3. Horizontal Airspaces (θ = 0°) with Upward Heat Flow
At E = 0.05, Figure 4(aii), Figure 5(aii), Figure 6(aii) and Figure 7(aii) show temperature, horizontal air velocity, vertical air velocity and resultant air velocity profiles for horizontal 16-inch-long single airspaces with upward heat flow. The corresponding results in 16-inch-long double airspaces are shown in Figure 4(bii), Figure 5(bii), Figure 6(bii) and Figure 7(bii). The maximum and minimum values of the contour bars in these figures are provided in Table 1. The effect of density variation with upward heat flow results in a flow with a varying number of convection loops. For a single airspace (89 mm (3.5 inches) thick), four convection loops were formed inside the airspace. However, for double airspaces (44.5 mm (1.75 inches) thick each), twelve convection loops were formed inside the top airspace, whereas fourteen convection loops were formed inside the bottom airspace.
The air velocity for an upward heat flow exceeds that for a downward heat flow. For a single airspace with an upward heat flow, the highest velocity (133 mm/s, Figure 7(aii) and Table 1) was 7.64 times that with a downward heat flow (17.4 mm/s, Figure 7(biii) and Table 1). Additionally, for double airspaces with an upward heat flow, the highest velocity (63.2 mm/s, Figure 7(bii) and Table 1) was also 7.50 times that with a downward heat flow (9.78 mm/s, Figure 7(biii) and Table 1). As such, the reductions in the R values due to heat transfer by convection inside the airspaces with an upward heat flow would be significantly greater than that with a downward heat flow. At E = 0.05 for single airspaces with an upward and downward heat flow, respectively, the R values with convection (1.95 ft2·h·°F/BTU shown in Figure 8e and 6.70 ft2·h·°F/BTU shown in Figure 8c) were 25 and 86% of that with no convection (7.57 ft2·h·°F/BTU, Figure 3). Similarly, at E = 0.05 for double airspaces with an upward and downward heat flow, respectively, the R values with convection (3.62 ft2·h·°F/BTU shown in Figure 8f and 10.95 ft2·h·°F/BTU shown in Figure 8d) were 32 and 97% of that with no convection (11.29 ft2·h·°F/BTU, Figure 3).
For a 16-inch-long single airspace, Figure 8e compares the present R values with and without end effect with the ISO 6946 and HRP 32 R values. The contribution of heat transfer by convection inside the enclosed airspace for the case of an upward heat flow is significant in relation with, for example, a downward heat flow. The different methodologies that were used in both methods of ISO 6946 [9] and HRP 32 [4] in determining the convection–conduction heat flux have resulted in obtaining different R values with these methods (see Figure 8e and Figure 14 in Section 4.3.3). For example, at an E value of 0.03, 0.05, 0.1 and 0.35, respectively, the HRP-32 R values were 15.3, 14.7, 13.3 and 8.9% higher than ISO 6946, whereas the HRP-32 R values agree with the present R values to within 4.6, 3.8, 1.9 and −3.4%, respectively. For the full range of E, Figure 14 shows that the HRP 32 R values were in closest agreement with the present R values for the 42-inch-long single airspaces (AR = 12.0), whereas the ISO 6946 R values are less than the present R values for all the E values and aspect ratios considered in this study. Figure 8f compares the present R values and HRP 32 R values for the 16-inch-long double airspaces. As shown in this figure, both the present and HRP 32 R values were in good agreement for E ≥ 0.5. At an E of 0.03, 0.05, 0.1 and 0.35, respectively, the HRP 32 R values were 23.1, 21.8, 18.7 and 9.6% higher than the present R value. However, for double airspaces of 32 inches long at which the HRP 32 correlations were obtained, the HRP 32 R values are in reasonable agreement with the present R values (see Figure 2b). Additionally, Figure 15 shows that the HRP 32 R values and the present R values are in good agreement for the 66-inch-long double airspaces of (AR = 37.7). The greatest deviation between the HRP 32 and the present R values (5.1%) occurred at E = 0.03.
Similar to airspaces with a horizontal (θ = 90°) and downward heat flow (θ = 0°), neglecting the end effect in airspaces with upward heat flow (θ = 0°) has resulted in a higher R value than that with end effect for E < 0.3. Figure 8e shows that the R value without end effect (2.11 ft2·h·°F/BTU) for a single airspace at E = 0.05 exceeds the R value calculated with end effect (1.95 ft2·h·°F/BTU) by 8%. Additionally, Figure 8f shows that at E = 0.05 for double airspaces, the R value without end effect (3.77 ft2·h·°F/BTU) exceeds the case with end effect (3.62 ft2·h·°F/BTU) by 4%.
Finally, at E = 0.05 for a single airspace with an upward heat flow (θ = 0°), convection reduces the R value (1.95 ft2·h·°F/BTU, Figure 8e) by 5.62 ft2·h·°F/BTU in comparison to only 0.87 ft2·h·°F/BTU for a downward heat flow (θ = 0°) and 5.22 ft2·h·°F/BTU for a horizontal heat flow (θ = 90°) (7.57 ft2·h·°F/BTU, Figure 3). Likewise, at this E value for double airspaces with an upward heat flow (θ = 0°), convection reduces the R value (3.62 ft2·h·°F/BTU, Figure 8e) by 7.67 ft2·h·°F/BTU compared to only 0.34 ft2·h·°F/BTU for a downward heat flow (θ = 0°) and 6.35 ft2·h·°F/BTU for a horizontal heat flow (θ = 90°) in relation to the case of no convection cases (11.29 ft2·h·°F/BTU, Figure 3).
4.2.4. Sloped Airspaces (θ = 45°) with Downward Heat Flow
For a 45° single airspace of 16 inches long at an E value of 0.05 and subjected to a downward heat flow, Figure 4(av), Figure 5(av), Figure 6(av) and Figure 7(av) show T, Vx, Vy and Vres distributions. The corresponding results for double airspaces are shown in Figure 4(bv), Figure 5(bv), Figure 6(bv) and Figure 7(bv). These figures show the buoyancy results in a mono-cellular airflow in each airspace. Additionally, the air velocity in the single airspace is greater than that in the double airspaces. For example, the highest Vres in the single airspace (97.1 mm/s, Figure 7(av) and Table 1) is 50% higher than in the double airspaces (64.9 mm/s, Figure 7(bv) and Table 1). Thus, the reduction in the R value due to convection in the single airspace would be greater than in double airspaces. Additionally, for the same E value without convection, the reduction in the R value due to radiation in the single airspace is greater than in the double airspaces (see Figure 3). At a fixed E, the combined effect of convection and radiation results in lower R values for the single airspace than that for the double airspaces, as shown in Figure 9a (single airspace) and Figure 9b (double airspaces). For example, at E = 0.05, the predicted R value for the single airspace is 2.74 ft2·h·°F/BTU (Figure 9a), which is 49% of that for the double airspaces (5.59 ft2·h·°F/BTU, Figure 9b). Thus, installing a low-e thin sheet in the middle of the airspace results in doubling the R value.
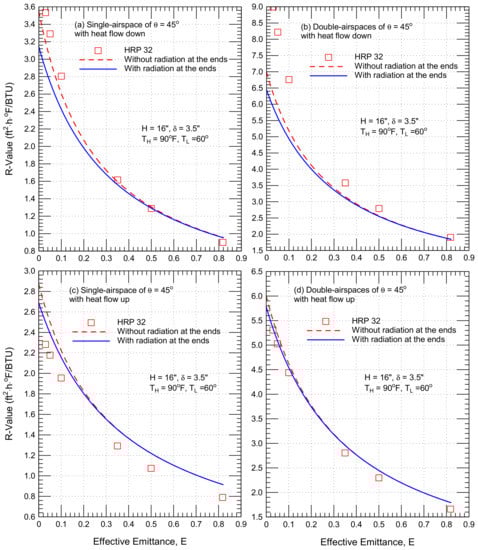
Figure 9.
Effect of effective emittance on the thermal resistances of a sloped single airspace and double airspaces with end effect (i.e., ε3 = 0.9) and without end effect (i.e., ε3 = 0.0) of θ = 45° at H = 16 inches and total δ = 3.5 inches for a downward heat flow (a,b) and an upward heat flow (c,d).
As indicated earlier, the use of ISO 6946 [9] for calculating R values is limited to vertical and horizontal single airspaces. As a result, the present R values are compared with HRP 32 R values for a 45° single airspace and 45° double airspaces of 16 inches long, as shown in Figure 9a,b, respectively. For the single airspace, Figure 9a shows that the present and HRP 32 R values are in good agreement for E > 0.35. For E < 0.35, the HRP 32 R values are 23% at E = 0.03, 20% at E = 0.05 and 16% at E = 0.1 greater than the present R values. However, the HRP 32 R values are approximately the same as the present R values for the 48-inch-long single airspaces (i.e., AR = 13.7, see Figure 16 in Section 4.3.5 for more details). Figure 9a also shows that neglecting the end effect has resulted in obtaining R values that are greater than those with end effect for E < 0.3. For E = 0.03, 0.05 and 0.1, respectively, the R values without end effect (3.19, 3.00 and 2.60 ft2·h·°F/BTU) exceed the R values with end effect (2.88, 2.74 and 2.42 ft2·h·°F/BTU) by 11, 9 and 7%. In addition, at E = 0.03, 0.05 and 0.1, convection reduces the R values (2.88, 2.74 and 2.42 ft2·h·°F/BTU, Figure 9a) by 5.97, 4.83 and 3.12 ft2·h·°F/BTU compared with the case without convection (8.85, 7.57 and 3.12 ft2·h·°F/BTU, Figure 3).
The present and HRP 32 R values for the 16-inch-long double airspaces are contained in Figure 9a. As shown in this figure, the present R values agree closely with R values based on HRP 32 for E ≥ 0.5. For E = 0.03, 0.05 and 0.10, the R values based on HRP 32 are 53, 47 and 37%, respectively, greater than the present R values. However, the HRP 32 R value (independent of the aspect ratio as indicated earlier) are closer to the present R values for the case of larger aspect ratios. As will be shown later in Section 4.3.5 in Figure 17, the present and HRP 32 R values are in closest agreement for all the E values of the 93- or 96-inch-long double airspaces (AR = 53.1 or 54.9). For the 16-inch-long double airspaces at E = 0.03, 0.05 and 0.1, the R values (5.89, 5.59 and 4.93 ft2·h·°F/BTU, Figure 9b) were reduced by 6.85, 5.70 and 3.92 ft2·h·°F/BTU in comparison with no convection values (12.74, 12.29 and 8.85 ft2·h·°F/BTU, Figure 3), respectively.
4.2.5. Sloped Airspaces (θ = 45°) with Upward Heat Flow
At E = 0.05, Figure 4(aiv), 5(aiv), 6(aiv) and 7(aiv) show the temperature, Vx, Vy and Vres distributions for the 16-inch-long, 45° single airspaces with an upward heat flow. The corresponding results for the double airspaces are shown in Figure 4(biv), Figure 5(biv), Figure 6(biv) and Figure 7(biv). As with the 45° airspace with a downward heat flow, these figures show that a mono-cellular airflow is developed in each airspace. However, the air velocity in the 45° airspace with an upward heat flow is greater than that in the 45° airspace with a downward heat flow. For example, the highest resultant velocity in the 45° single airspace with an upward heat flow (123 mm/s, Figure 7(aiv) and Table 1) is 27% higher than that in the 45° single airspace with a downward heat flow (97.1 mm/s, Figure 7(av) and Table 1). In addition, the highest resultant velocity in the 45° double airspaces with an upward heat flow (78.3 mm/s, Figure 7(biv) and Table 1) is 21% higher than that in the 45° double airspaces with a downward heat flow (64.9 mm/s, Figure 7(bv) and Table 1). Consequently, the reduction in the R value due to convection in the 45° airspace with an upward heat flow is greater than that in the 45° airspace with a downward heat flow. In addition, for a specific E, the R value reduction due to radiation in the absence of convection for airspaces with an upward and downward heat flow is the same.
As shown in Figure 9, the combined effect of both convention and radiation has resulted in that the overall thermal resistance of 45° airspaces with an upward heat flow is less than that with 45° airspaces with a downward heat flow. For example, at E = 0.05, the R value for the 45° single airspace with an upward heat flow (2.39 ft2·h·°F/BTU, Figure 9c) is 13% lower than that for the 45° single airspace with a downward heat flow (2.74 ft2·h·°F/BTU, Figure 9a). Additionally, at E = 0.05, the R value for the 45° double airspaces with an upward heat flow (5.09 ft2·h·°F/BTU, Figure 9d) is 9% lower than that for the 45° double airspaces with a downward heat flow (5.59 ft2·h·°F/BTU, Figure 9b). At E = 0.05, the R values of the 45° airspaces with an upward and downward heat flow were more than doubled as result of installing a low-e foil to divide the airspace into two equal regions.
For the 16-inch-long, 45° single airspace with an upward heat flow, Figure 9c shows that the present R values are greater than the HRP 32 R value for the whole range of E values. For example, at E = 0.05 and 0.82, respectively, the present R values are 10 and 16% greater than the HRP 32 R values. However, Figure 18 shows that the HRP 32 R values, which were obtained from HRP 32 correlations (independent of the aspect ratio), agree best with the present R values for the 8- or 12-inch-long single airspaces (AR = 2.3 or 3.4). Finally, Figure 9d shows a comparison between the present R values and the HRP 32 R values [4] for the 45° double airspaces of 16 inches long with an upward heat flow. As shown in this figure, the present R values agree with HRP 32 R values for E < 0.3, while the present R values are greater than the HRP 32 R values for E > 0.3. However, as provided in Section 4.3.5 in Figure 19, both the present and HRP 32 R values for all the E values are approximately the same for 96-inch-long double airspaces (AR = 54.9).
4.3. Effect of Aspect Ratio on the R Values
At an average temperature (Tavg) of 23.9 °C (75 °F) and temperature difference (ΔT) of 16.6 °C (30 °F) (i.e., TH = 32.2 °C (90 °F) and TL = 15.6 °C (60 °F)), numerical simulations were conducted for single airspaces (89 mm (3.5 inches) thick) and double airspaces (44.5 mm (1.75 inches) thick each) with an horizontal heat flow for an inclination angle of θ = 90°, a downward heat flow for θ = 0° and 45°, and an upward heat flow for θ = 0° and 45° in order to observe the impact of the aspect ratio on the thermal resistance. As indicated earlier, reflective insulation assemblies use thin foil or coatings with low emittances. The emittance can increase due to corrosion, dust accumulation or water vapor condensation on the low-e surfaces. Consequently, the R value calculations were made for E values from 0 to 0.82. For single airspaces, these calculations included the height or width values from 102 mm (4 inches) to 2438 mm (96 inches), which represent aspect ratios from 1.1 to 27.4. Additionally, for the double airspaces, the simulations were conducted for height/width values from 102 mm (4 inches) to 2438 mm (96 inches) representing aspect ratios from 2.3 to 54.9 for each region. The case of an airspace height/width (H) of 16 inches can represent furred airspace assemblies with 16-inch o.c. constructions. For these constructions, the distributions of T, Vx, Vy and Vres at E = 0.05 are shown in Figure 4(ai–v) to Figure 7(ai–v) for single airspaces and Figure 4(bi–v) to Figure 7(bi–v) for double airspaces.
4.3.1. Vertical Airspaces (θ = 90°) with Horizontal Heat Flow
For the E value range from 0 to 0.82, Figure 10 shows how the aspect ratio (AR) impacts the R values of a vertical single airspace (θ = 90°) with a horizontal heat flow. The corresponding results for the double airspaces are provided in Figure 11. Note that the effect of the aspect ratio is not included in the methods that are commonly used to calculate the R values of reflective airspaces (ISO 6946 [9] and ASHRAE [5,6]). The R value contained in these figures increases significantly with an increasing AR for all the E values. For high E values, however, the R value increases insignificantly with an AR increase. The R value lines for different aspect ratios tend to converge as the E value tends to 0.82 at which the emissivities of all the enclosed-airspace surfaces are 0.9. For example, for single airspaces at low E values of 0.03, 0.05 and 0.1, respectively, the R value increased by 99, 90 and 71% with an increasing AR from 1.1 (H = 4 inches at which R = 1.86, 1.81 and 1.71 ft2·h·°F/BTU) to 27.4 (H = 96 inches at which R = 3.70, 3.44 and 2.93 ft2·h·°F/BTU). At these E values (0.03, 0.05 and 0.1, respectively), the HRP 32 (R = 2.67, 2.53 and 2.32 ft2·h·°F/BTU [4]) overestimated the R values by 44, 40 and 36% at an AR of 1.1, and underestimated the R values by 28, 26 and 21% at an AR of 27.4 (Figure 10). At E values of 0.03, 0.05 and 0.1, ISO 6946 overestimated the R values at an AR of 1.1 by 49, 45 and 35%, and underestimated the R values at an AR of 27.4 by 25, 24 and 21%, respectively.
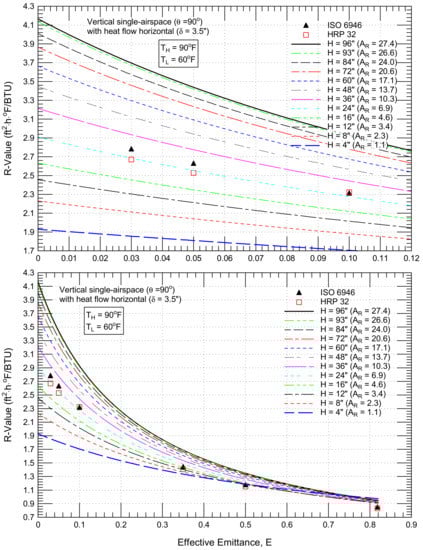
Figure 10.
Comparisons of R values of HRP 32 [4], ISO 6946 [9] with present model predictions of various AR for a single airspace subjected to a horizontal heat flow (θ = 90°, total δ = 3.5 inches, TH = 90 °F, TL = 60 °F).
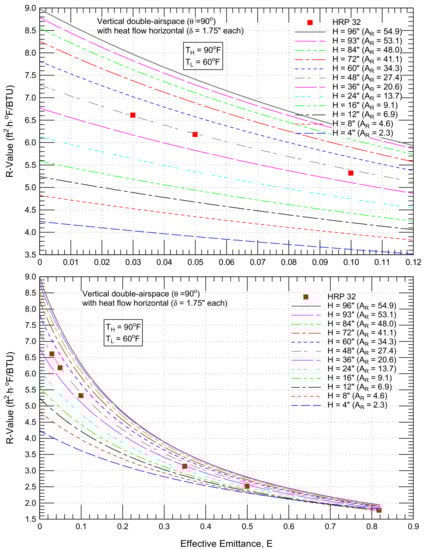
Figure 11.
Comparisons of R values of HRP 32 [4] with present model predictions of various AR for double airspaces subjected to a horizontal heat flow (θ = 90°, total δ = 3.5 inches, TH = 90 °F, TL = 60 °F).
For double airspaces at E = 0.03, 0.05 and 0.1, Figure 11 shows that the R values increased by 98, 90 and 74%, respectively, by increasing AR from 2.3 (H = 4 inches at which R = 4.03, 3.91 and 3.62 ft2·h·°F/BTU) to 54.9 (H = 96 inches at which R = 7.97, 7.42 and 6.30 ft2·h·°F/BTU). At these E values (0.03, 0.05 and 0.1, respectively), the HRP 32 (R = 6.61, 6.18 and 5.32 ft2·h·°F/BTU [4]) overestimated the R values by 64, 58 and 47% at an AR of 2.3, and underestimated the R values by 17, 17 and 16% at an AR of 54.9, respectively.
4.3.2. Horizontal Airspaces (θ = 0°) with Downward Heat Flow
With a downward heat flow, Figure 12 and Figure 13 show the effect of the aspect ratio on the R values of a single airspace and double airspaces, respectively. These figures show that the R value increases significantly when increasing the aspect ratio for the range of low effective emittance (E < ~0.2). However, for the range of high effective emittance (E > ~0.3), unlike the case of a horizontal heat flow (θ = 90°), the aspect ratio has approximately no effect on the R values for the case of a downward heat flow, where all the R value lines of different aspect ratios tend to converge as the effective emittance tends to ~0.3. Figure 12 shows that for single airspaces at low E values of 0.03, 0.05 and 0.1, respectively, the R value increased by 124, 96 and 58% when increasing the AR from 1.1 (H = 4 inches at which R = 4.84, 4.52 and 3.88 ft2·h·°F/BTU) to 27.4 (H = 96 inches at which R = 10.86, 8.88 and 6.12 ft2·h·°F/BTU). At these E values (0.03, 0.05 and 0.1), both ISO 6946 [9] and HRP 32 [4] overestimated the R values by 90, 71 and 41% at an AR of 1.1, and underestimated the R values by 16, 14 and 10% at an AR of 27.4, respectively. For double airspaces at E values of 0.03, 0.05 and 0.1, respectively, Figure 13 shows that the R value increased by 65, 54 and 36% with increasing an AR from 2.3 (H = 4 inches at which R = 8.66, 8.09 and 6.93 ft2·h·°F/BTU) to 54.9 (H = 96 inches at which R = 14.31, 12.48 and 9.44 ft2·h·°F/BTU). At these E values (0.03, 0.05 and 0.1, respectively), the HRP 32 (R = 13.69, 11.97 and 9.11 ft2·h·°F/BTU [4]) overestimated the R values by 58, 48 and 31% at an AR of 2.3, and underestimated the R value by only 4, 4 and 3% at an AR of 54.9, respectively.
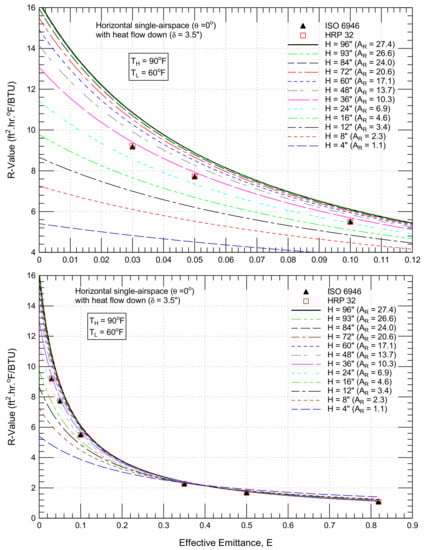
Figure 12.
Comparisons of R values of HRP 32 [4], ISO 6946 [9] with present model predictions of various AR for a single airspace subjected to downward heat flow (θ = 0°, total δ = 3.5 inches, TH = 90 °F, TL = 60 °F).
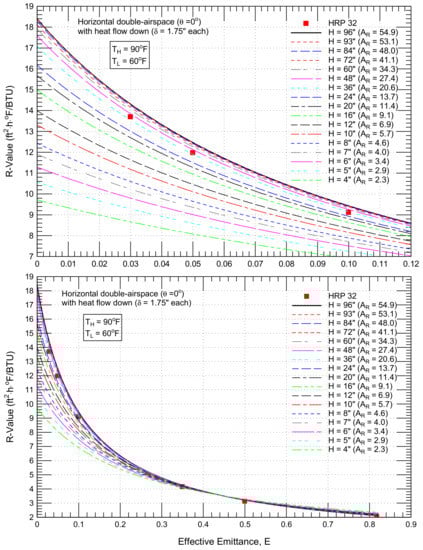
Figure 13.
Comparisons of R values of HRP 32 [4] with present model predictions of various AR for double airspaces subjected to a downward heat flow (θ = 0°, total δ = 3.5 inches, TH = 90 °F, TL = 60 °F).
4.3.3. Horizontal Airspaces (θ = 0°) with Upward Heat Flow
For vertical airspaces with a horizontal heat flow (θ = 90°) and horizontal airspaces with a downward heat flow (θ = 0°), the number of convection loops is the same for different aspect ratios: one convection loop for the case of a horizontal heat flow (e.g., see Figure 4(ai,bi) through Figure 7(ai,bi) for an airspace of 16 inches long), and two convection loops for the case of a downward heat flow (e.g., see Figure 4(aiii,biii) through Figure 7(aiii,biii)) for an airspace of 16 inches long). In these two cases, the R value increases with an increasing aspect ratio, as discussed above. Conversely, for horizontal airspaces with an upward heat flow, the number of convection loops changes with the changing aspect ratio. For example, the number of convection loops in a single airspace of 16 inches long (AR = 4.6) and 60 inches long (AR = 17.1), respectively, are four (see Figure 4(aii) through Figure 7(aii) for H = 16 inches) and ten. For horizontal double airspaces (44.5 mm (1.75 inches) thick each), however, the number of convection loops in the airspaces of 16 inches long (AR = 9.1) and 60 inches long (AR = 34.3), respectively, are 12 in the top airspace and 14 in the bottom airspace (see Figure 4(bii) through Figure 7(bii) for H = 16 inches), and 24 in the top airspace and 42 in the bottom airspace. Note that the number of convection loops in horizontal airspaces with an upward and downward heat flow must be an even number due the symmetry at the vertical plane located at the mid-width of the airspace. For given values for H, δ, E, Tavg and ΔT, a greater number of convection loops inside the airspace per unit width, called “γ”, would enhance its thermal conductance, resulting in obtaining a lower R value than that for a smaller value of γ. This phenomenon was addressed in more detail in previous publications (e.g., see [20,21,22]). As such, depending on the value of γ for a given operating condition, increasing AR can result in either an increase in the R value (for small value of γ) or a decrease in the R value (for large value of γ).
With an upward heat flow, Figure 14 and Figure 15 show the effect of the aspect ratio on the R values of horizontal single- and double airspaces, respectively. For 15 aspect ratio values for a single airspace, Figure 14 shows that the R value changes significantly with the changing aspect ratio for the full range of the effective emittance (0–0.82). For a given E value within the range of low effective emittance (E ≤ 0.1), the highest R value occurred for an AR of 17.1 (H = 60 inches), and the lowest R value occurred for an AR of 1.7 (H = 6 inches). At an E value of 0.05, the R value for AR of 1.7 (1.86 ft2·h·°F/BTU) was 20% lower than that for an AR of 17.1 (2.24 ft2·h·°F/BTU) at which the HRP 32 overestimated the R value by 9% for an AR of 1.7 and underestimated the R value by 9% for an AR of 17.1. At this E value (0.05), the ISO 6946 underestimated the R value by 5 and 21%, respectively, for an AR of 1.7 and 17.1. On the other hand, for a given E value within the range of high effective emittance (E > 0.2), the highest R value occurred for an AR of 1.1 (H = 4 inches), whereas the lowest R value occurred for an AR of 10.3 (H = 36 inches). At an E value of 0.82, the R value for an AR of 10.3 (0.80 ft2·h·°F/BTU) was 48% lower than that for an AR of 1.1 (1.53 ft2·h·°F/BTU). At this E value (0.82) for an AR of 10.3 and 1.1, the HRP 32 and ISO 6946, respectively, underestimated the R value by 4 and 50%, and by 9 and 52% that for an AR of 17.1 (2.24 ft2·h·°F/BTU), at which the HRP 32 overestimated the R value by 9% for an AR of 1.7 and underestimated the R value by 9% for an AR of 17.1. At this E value (0.05), the ISO 6946 underestimated the R value by 5 and 21%, respectively, for an AR of 1.7 and 17.1. On the other hand, for a given E value within the range of high effective emittance (E > 0.2), the highest R value occurred for an AR of 1.1 (H = 4 inches), whereas the lowest R value occurred for an AR of 10.3 (H = 36 inches). At an E value of 0.82, the R value for an AR of 10.3 (0.80 ft2·h·°F/BTU) was 48% lower than that for an AR of 1.1 (1.53 ft2·h·°F/BTU). At this E value (0.82) for an AR of 10.3 and 1.1, the HRP 32 and ISO 6946, respectively, underestimated the R value by 4 and 50%, and by 9 and 52%.
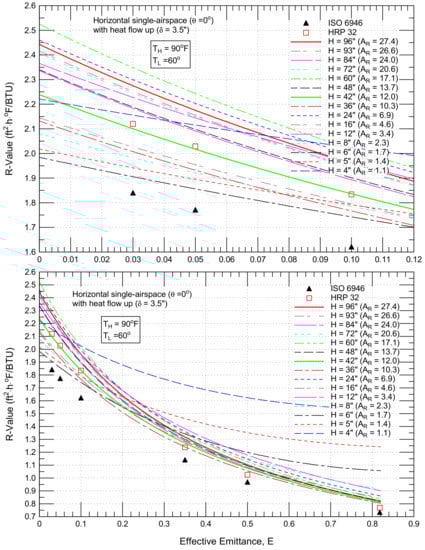
Figure 14.
Comparisons of R values of HRP 32 [4], ISO 6946 [9] with present model predictions of various AR for a single airspace subjected to an upward heat flow (θ = 0°, total δ = 3.5 inches, TH = 90 °F, TL = 60 °F).
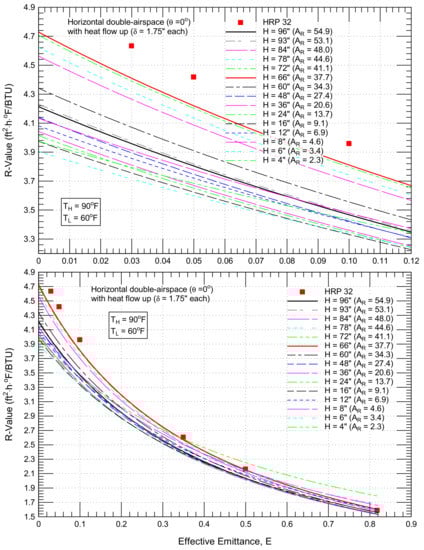
Figure 15.
Comparisons of R values of HRP 32 [4] with present model predictions of various AR for double airspaces subjected to an upward heat flow (θ = 0°, total δ = 3.5 inches, TH = 90 °F, TL = 60 °F).
For the 15 values of the aspect ratio for the horizontal double airspaces with an upward heat flow, Figure 15 shows that the R value changes to some extent with a changing AR within the full range of the effective emittance. Within the range of high effective emittance (E > ~0.35), the highest R value occurred for an AR of 2.3 (H = 4 inches), whereas the lowest R value occurred for the AR of 20.6 (H = 36 inches). However, within the range of low effective emittance (E < 0.1), the highest R value occurred for an AR of 37.7 (H = 66 inches), whereas the lowest R value occurred for an AR of 3.4 (H = 6 inches). At an E value of 0.05, the R value for an AR of 37.7 (4.22 ft2·h·°F/BTU) was 17% higher than that for an AR of 3.4 (3.60 ft2·h·°F/BTU). At this E value (0.05), the HRP 32 overestimated the R value by 5 and 23%, respectively, for an AR of 37.7 and 3.4.
4.3.4. Sloped Airspaces (θ = 45°) with Downward Heat Flow
For a sloped airspace of θ = 45° subjected to a downward heat flow, Figure 16 and Figure 17 show the effect of the aspect ratio on the R values of a single airspace and double airspaces, respectively. Similar to airspaces of θ = 90° with a horizontal heat flow and airspaces of θ = 0° with a downward heat flow, these figures show that the R value increases significantly with an increasing AR for the range of low effective emittance; and for the range of high effective emittance, the R value increases insignificantly with an increasing AR. Figure 16 shows that for single airspaces at low E values of 0.03, 0.05 and 0.1, respectively, the R value increased by 55, 48 and 38% with an increasing AR from 2.0 (H = 7 inches at which R = 2.66, 2.56 and 2.31 ft2·h·°F/BTU) to 27.4 (H = 96 inches at which R = 4.11, 3.80 and 3.18 ft2·h·°F/BTU [4]). At these E values (0.03, 0.05 and 0.1), HRP 32 (R = 3.53, 3.29 and 2.81 ft2·h·°F/BTU) overestimated the R values by 33, 29 and 22% at an AR of 2.0, and underestimated the R values by 14, 13 and 12% at an AR of 27.4, respectively. Similarly, for double airspaces at E values of 0.03, 0.05 and 0.1, respectively, Figure 17 shows that the R value increased by 78, 71 and 57% with an increasing AR from 2.3 (H = 4 inches at which R = 5.02, 4.81 and 4.38 ft2·h·°F/BTU) to 54.9 (H = 96 inches at which R = 8.95, 8.24 and 6.86 ft2·h·°F/BTU). At these E values (0.03, 0.05 and 0.1, respectively), the HRP 32 (R = 8.99, 8.22 and 6.76 ft2·h·°F/BTU [4]) overestimated the R values by 79, 71 and 54% at an AR of 2.3, whereas both the present and HRP 32 R values are approximately the same at an AR of 54.9.
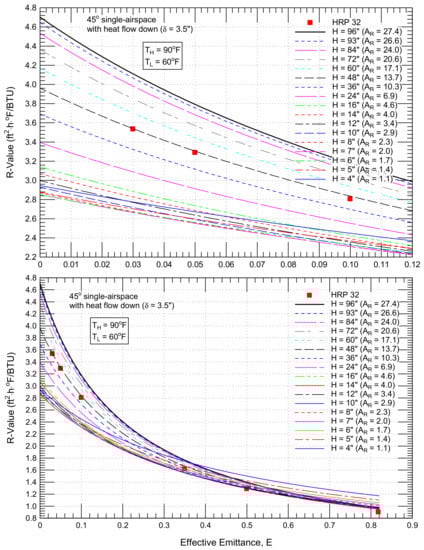
Figure 16.
Comparisons of R values of HRP 32 [4] with present model predictions of various AR for a sloped single airspace subjected to a downward heat flow (θ = 45°, total δ = 3.5 inches, TH = 90 °F, TL = 60 °F).
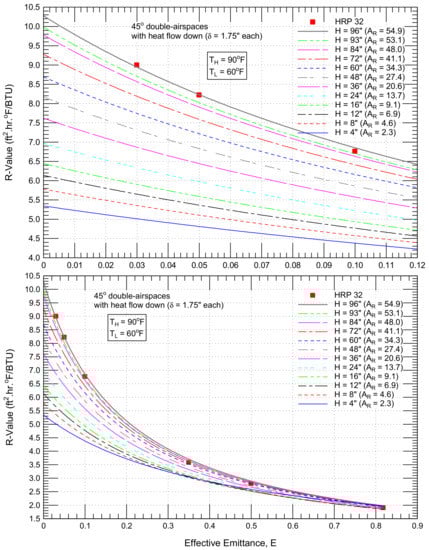
Figure 17.
Comparisons of R values of HRP 32 [4] with present model predictions of various AR for sloped double airspaces subjected to a downward heat flow (θ = 45°, total δ = 3.5 inches, TH = 90 °F, TL = 60 °F).
4.3.5. Sloped Airspaces (θ = 45°) with Upward Heat Flow
Similar to horizontal airspaces (θ = 0°) with an upward heat flow, a different number of convection loops was developed in each airspace for sloped airspaces (θ = 45°). For the 45° single airspaces of H ≤ 36 inches (AR ≤ 10.3, see Figure 4(aiv) through Figure 7(aiv) for single airspace of 16 inches long) and the 45° double airspaces of H ≤ 20 inches (AR ≤ 11.4, see Figure 4(biv) through Figure 7(biv) for double airspaces of 16 inches long), only one convection loop was developed in each airspace. However, for the 45° single airspaces of H > 36 inches (AR > 10.3) and the 45° double airspaces of H > 20 inches (AR > 11.4), more convection loops of different sizes were developed in each airspace, where their number increased by increasing AR. As indicated earlier, the greater number of convection loops per unit airspace width (γ) would enhance its thermal conductance, resulting in obtaining a lower R value [20,21,22].
Figure 18 shows the effect of the aspect ratio on the R values of the 45° single airspace with an upward heat flow. As shown in this figure for a 17 aspect ratio values for the 45° single airspace, the R value changes significantly with changing the aspect ratio within the range of low effective emittance (E < 0.4). However, within the range of high effective emittance (E > 0.4), the R value changes slightly with the changing aspect ratio. For a given E value within the range of low effective emittance, the highest R value occurred for an AR of 10.3 (H = 36 inches), whereas the lowest R value occurred for an AR of 1.1 (H = 4 inches). At E values of 0.03, 0.05, 0.1, respectively, the R values for an AR of 1.1 (1.93, 1.88 and 1.77 ft2·h·°F/BTU) were 56, 52 and 42% lower than that for AR of 10.3 (3.02, 2.86 and 2.51 ft2·h·°F/BTU), respectively. At these E values (0.03, 0.05 and 0.1, respectively), the HRP 32 overestimated the R values by 18, 16 and 11% for the AR of 1.1, and underestimated the R values by 25, 24 and 22% for an AR of 10.3, respectively.
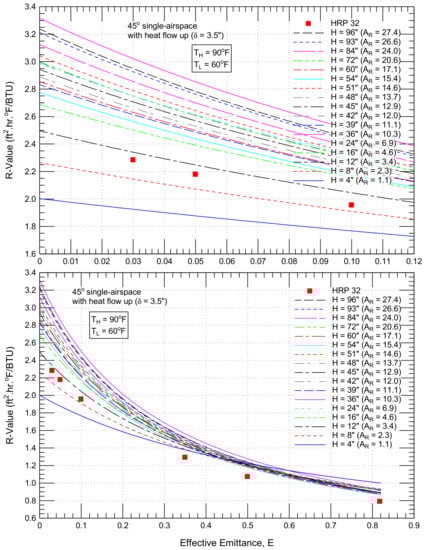
Figure 18.
Comparisons of R values of HRP 32 [4] with present model predictions of various AR for a sloped single airspace subjected to an upward heat flow (θ = 45°, total δ = 3.5 inches, TH = 90 °F, TL = 60 °F).
Similar to the 45° single airspaces with a upward heat flow (Figure 18), for 20 values of the aspect ratio for the 45° double airspaces with upward heat flow, Figure 19 shows that changing the aspect ratio resulted in a significant change in the R value within the range of low effective emittance (E < 0.4), and insignificant change in the R value within the range of high effective emittance (E > 0.4). Within the range of low effective emittance (E < 0.4), the highest R value occurred for an AR of 53.1 (H = 93 inches), whereas the lowest R value occurred for the AR of 2.3 (H = 4 inches). At E values of 0.03, 0.05 and 0.1, respectively, the lowest R values (R = 3.99, 3.87 and 3.59 ft2·h·°F/BTU at an AR = 2.3, which are about twice of that for single airspace) were 44, 40 and 33% lower than the highest R values (R = 5.73, 5.42 and 4.76 ft2·h·°F/BTU AR = 53.1, which are also about twice of that for single airspace). At these E values (0.03, 0.05 and 0.1, respectively), the HRP 32 overestimated the R values by 33, 30 and 24%, respectively for an AR of 2.3 and underestimated the R values by about 7.3, 7.2 and 6.7%, respectively, at an AR of 53.1.
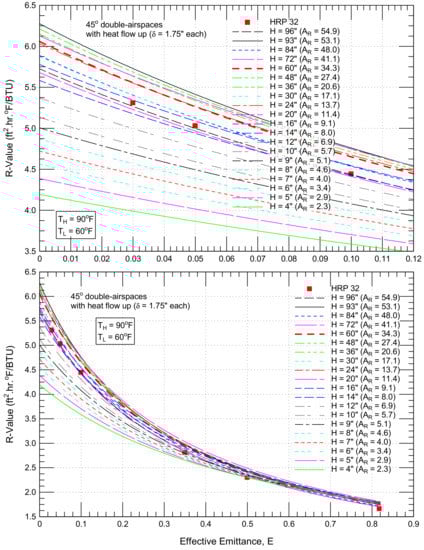
Figure 19.
Comparisons of R values of HRP 32 [4] with present model predictions of various AR for sloped double airspaces subjected to an upward heat flow (θ = 45°, total δ = 3.5 inches, TH = 90 °F, TL = 60 °F).
In closing, the aspect ratio has a significant effect on the R values of single and double airspaces within the low range of effective emittance. For example, for all the values of AR considered in this study (1.1–27.4 for single airspace and 2.3–54.9 for double airspaces), the effect of the aspect ratio at an E value of 0.03 has resulted in increasing the R values by the following:
- 99% (from 1.86 to 3.70 ft2·h·°F/BTU for a vertical single airspace with a horizontal heat flow, Figure 10),
- 98% (from 4.03 to 7.97 ft2·h·°F/BTU for vertical double airspaces with a horizontal heat flow, Figure 11),
- 125% (from 4.84 to 10.87 ft2·h·°F/BTU for a horizontal single airspace with a downward heat flow, Figure 12),
- 65% (from 8.66 to 14.31 ft2·h·°F/BTU for horizontal double airspaces with a downward heat flow, Figure 13),
- 23% (from 1.91 to 2.35 ft2·h·°F/BTU for a horizontal single airspace with an upward heat flow, Figure 14),
- 19% (from 3.72 to 4.41 ft2·h·°F/BTU for horizontal double airspaces with an upward heat flow, Figure 15),
- 54% (from 2.66 to 4.11 ft2·h·°F/BTU for a 45° single airspace with a downward heat flow, Figure 16),
- 78% (from 5.02 to 8.95 ft2·h·°F/BTU for 45° double airspaces with a downward heat flow, Figure 17),
- 57% (from 1.93 to 3.02 ft2·h·°F/BTU for a 45° single airspace with an upward heat flow, Figure 18) and
- 44% (from 3.99 to 5.73 ft2·h·°F/BTU for 45° double airspaces with an upward heat flow, Figure 19).
5. Summary and Conclusions
In this research study, a validated numerical model was used to determine the effective thermal resistance (R value) of vertical (θ = 90°), horizontal (θ = 0°) and sloped (θ = 45°) single and double airspaces of different aspect ratios (AR) when these airspaces were subjected to horizontal, upward and downward heat flows. As the emittance of reflective insulation products such as foils and coatings can increase due to corrosion, dust accumulation and/or moisture condensation on the low emittance surfaces, the numerical simulations were conducted for the full range of effective emittance (E) (0–0.82). Consideration was given to the effect of heat transfer by radiation at the two ends that represent the surfaces of the framing (e.g., furring or spacers) of the airspaces on the R value. The predicted thermal resistances were compared with the available methods for calculating the thermal resistances of enclosed airspaces based on ISO 6946 and HRP 32, whereas these methods do not account for (a) the heat transfer by radiation at the two ends of the airspace, and (b) the effect of the airspace AR. For the given airspace orientation and direction of the heat flow, the results showed that the ISO 6946 and HRP 32 R values were in good agreement with the present R values for a specified AR. However, ISO 6946 and HRP 32 overstated or underestimated the R values for other AR values.
The results of this study showed that the AR of the enclosed airspace can have a significant effect on its thermal resistance. For single and double airspaces subjected to horizontal and downward heat flows, the results showed that increasing the AR has resulted in a significant increase in the R value for the range of low E values, whereas for the range of high E values, the R value increased insignificantly with an increasing AR. However, for single and double airspaces subjected to an upward heat flow, the results showed that the effective thermal resistance changed significantly with a changing AR for the full range of E. Additionally, for a given E value in the case of single and double airspaces with an upward heat flow, the results showed that the highest R value corresponded to the case of AR having the lowest value of the number of convection loops per unit airspace width (called, in this study, “γ”). Finally, this study showed that depending on the E value, the R value could be doubled by incorporating a thin sheet/layer of low-e on its both sides in the middle of the enclosed-airspace. Last but not the least, at a low E value, the results showed that the effect of AR can result in doubling the R value of single and double airspaces.
Author Contributions
Conceptualization, H.H.S. and D.W.Y.; methodology, H.H.S. and D.W.Y.; software, H.H.S.; validation, H.H.S. and D.W.Y.; formal analysis, H.H.S. and D.W.Y.; investigation, H.H.S. and D.W.Y.; resources, D.W.Y.; data curation, H.H.S. and D.W.Y.; writing—original draft preparation, H.H.S. and D.W.Y.; writing—review and editing, H.H.S. and D.W.Y.; visualization, H.H.S. and D.W.Y.; supervision, H.H.S. and D.W.Y.; project administration, H.H.S.; funding acquisition, D.W.Y. All authors have read and agreed to the published version of the manuscript.
Funding
This research received no external funding.
Institutional Review Board Statement
Not applicable.
Informed Consent Statement
Not applicable.
Data Availability Statement
Not applicable.
Conflicts of Interest
The authors declare no conflict of interest.
Appendix A
This section briefly presents the theoretical background of the governing equations that were solved using the present model and the boundary conditions and simulation parameters for this research as well.
Appendix A.1. Governing Equations
In an enclosed airspace, the contribution of heat transfer by convection is obtained by solving the continuity and momentum equations (Navier–Stokes equation) for the air velocity field . These equations are as follows [34]:
where I is the unit matrix, µa is air the dynamic viscosity (Pa.s), is the vector of gravitational acceleration (m2/s), is the air density (kg/m3), is the air pressure (Pa) and is the time (s).
The energy equation for the airspace layers is given as follows [34]:
where is the air thermal conductivity (W/(m.K)) and is the air specific heat capacity at a constant pressure (J/(kg.K)). The term in Equation (A3) represents the volumetric heat source/sink, for example, due to moisture condensation/evaporation, which is neglected, since no moisture transport is considered in this study. However, for solid layers (e.g., low-emittance foil), the energy equation is the heat conduction equation, which is given as follows [34]:
where is the solid density (kg/m3), is the solid specific heat capacity (J/(kg.K)) and is solid thermal conductivity (W/(m.K)).
To account for heat transfer by radiation inside enclosed or open airspaces, the surface-to-surface heat radiation equation is solved simultaneously with the energy equation listed above. At every point on a radiative surface, the contribution of the net inward radiative heat source (qRAD) is added, which is given as follows [15]:
In Equation (A5), qirr is the total irradiation (W/m2), Famb is the ambient view factor, Tamb is the ambient temperature (K), σ is the Stefan–Boltzmann constant (5.67 × 10⁻⁸ W/(m2.K4)) and ε is the surface emissivity. As an example of enclosure, ε is equal to εa, εb, εc and εd, respectively, for all the points on surfaces a, b, c and d shown in Figure A1. The parameter Gm in Equation (A5) represents the mutual irradiation coming from other radiative surfaces, which is a function of the radiosity qradi.
The general expression for the radiosity qradi was derived in a previous publication [15]. For every point on the surface boundaries (3D geometry) or every point on the line boundaries (2D geometry) that participate in the surface-to-surface radiation, the final expression for the radiosity qradi is given as follows [15]:
To avoid repetition, the detailed expressions for Gm and Famb and their associated kernel functions for both 3D geometry and 2D geometry are available in [15]. Equation (A6) is applicable to all the points on the surface/line boundaries that participate in surface-to-surface radiation, which forms a system of equations in radiosity qradi. This system of equations is solved simultaneously with the energy equation (Equations (A3) and (A4)) for the temperature T and radiosity qradi.
Appendix A.2. Boundary Conditions and Simulation Parameters
In this study, for single and double enclosed airspaces, the ambient view factor (Famb) in Equation (A6) is zero. The finite element method was used to solve simultaneously the two-dimensional versions of the momentum equation (Equation (A2)), energy equation (Equations (A3) and (A4)) and surface-to-surface radiation equation (Equation (A6)) in a steady-state condition. As shown in Figure A1, the boundary conditions that are needed to solve the energy equation are (a) isothermal conditions on both the right surface, with a low temperature (TL), and the left surface, with a high temperature (TH), and (b) adiabatic condition (i.e., no heat transport) on the top and bottom surfaces of the enclosed airspaces. Applying the adiabatic condition on the top and bottom surfaces permits calculating the R values of the enclosed airspaces. The boundary conditions that are needed to solve the momentum equation are no-slip condition on all surfaces of the enclosed airspaces. The surface-to-surface radiation equation is subjected to different emissivity values for the airspace surfaces, as shown in Figure A1.
It is important to point out that the dependences of the physical properties of the air that filled the enclosed airspaces (density, dynamic viscosity, specific heat capacity at a constant pressure and thermal conductivity) on the temperature are included. For single- and double airspaces, the numerical simulations were conducted for vertical airspaces with a horizontal heat flow, horizontal airspaces with an upward and downward heat flow and 45° sloped, enclosed airspaces with an upward and downward heat flow. For the high surface temperature (TH) of 32.2 °C (90 °F), the low surface temperature (TL) of 15.6 °C (60 °F) and the total airspace thickness (δ) of 89 mm (3.5 inches), the numerical simulations were conducted for a wide range of effective emittance (E = 0.0−0.82) and a wide range of airspace aspect ratio, AR (AR = H/δ).

Figure A1.
Schematic showing the boundary conditions for single- airspace (a) and double airspaces (b) involving surfaces of various emissivities.
Figure A1.
Schematic showing the boundary conditions for single- airspace (a) and double airspaces (b) involving surfaces of various emissivities.

The ultimate goal of this research study was to investigate the effect of the aspect ratio on the R values of single and double airspaces of different orientations and subjected to various heat-flow directions. Thus, for each numerical simulation, the R value is calculated as follows:
In Equation (A7), qavg is the normal average heat flux on the high-temperature surface (qavg,H), which is the same as that on the low-temperature surface (qavg,L) due to energy balance since the two ends of the airspace are adiabatic. The average normal heat flux on the high temperature surface (SH) and the average normal heat flux on the low temperature surface (SL) are calculated by conducting the following numerical integrations (Figure A1):
References
- Goss, W.P.; Miller, R.G. Literature Review of Measurements and Predictions of Reflective Building Insulation Systems Performance: 1900–1986. ASHRAE Trans. 1989, 95, 651–664. [Google Scholar]
- Stephan, K.; Laesecke, A. The Thermal Conductivity of Fluid Air. J. Phys. Chem. Ref. Data 1985, 14, 227–234. [Google Scholar] [CrossRef]
- Pratt, A.W. Heat Transmission in Buildings; John Wiley and Sons: New York, NY, USA, 1981; pp. 31–40. [Google Scholar]
- Robinson, H.E.; Powell, F.J. The Thermal Insulation Value of Air Spaces, Housing Research Paper 32; National Bureau of Standards (now N.I.S.T), Project ME-12; U.S. Department of Commerce, U.S. Government Printing Office: Washington, DC, USA, 1956.
- American Society of Heating, Refrigerating and Air-Conditioning Engineers (ASHRAE). Design Heat Transmission Coefficients. In ASHRAE Handbook of Fundamentals; ASHRAE: Peachtree Corners, GA, USA, 1972; Chapter 20. [Google Scholar]
- American Society of Heating, Refrigerating and Air-Conditioning Engineers (ASHRAE). Heat, Air, and Moisture Control in Building Assemblies-Material Properties. In ASHRAE Handbook of Fundamentals; Table 3; ASHRAE: Peachtree Corners, GA, USA, 2017; Chapter 26. [Google Scholar]
- Desjarlais, A.O.; Tye, R.P. Research and Development Data to Define the Thermal performance of Reflective Materials Used to Conserve Energy in Building Applications. In Oak Ridge National Laboratory Report ORNL/Sub/88-SA825/1; Oak Ridge National Laboratory: Oak Ridge, TN, USA, 1990. [Google Scholar]
- Desjarlais, A.O.; Yarbrough, D.W. Prediction of the Thermal Performance of Simple and Multi-Airspaces Reflective insulation Materials. In Insulation Materials: Testing and Applications; Graves, R.S., Wysoci, D.C., Eds.; ASTM STP 1116; ASTM International: West Conshohocken, PA, USA, 1991; Volume 2, pp. 24–43. [Google Scholar]
- ISO 6946:2017. Building Components and Building Elements-Thermal Resistance and Thermal Transmittance-Calculation Methods-Annex D-Thermal Resistance of Airspaces; European Committee for Standardization, CEN-CENELEC Management Centre: Avenue Marnix, Belgium, 2017. [Google Scholar]
- Seigel, R.; Howell, J.R. Thermal Radiation Heat Transfer; McGraw-Hill Book Company: New York, NY, USA, 1972; pp. 240–241. [Google Scholar]
- Yam, K.W.; Teh, K.S.; Loi, P.; Yarbrough, D.W. Reflective insulation assemblies for above-ceiling applications. J. Build. Phys. 2020, 44, 272–283. [Google Scholar] [CrossRef]
- Saber, H.H.; Maref, W.; Elmahdy, A.H.; Swinton, M.C.; Glazer, R. 3D thermal model for predicting the thermal resistances of spray polyurethane foam wall assemblies. In Proceedings of the Building XI Conference, Clearwater, FL, USA, 5–9 December 2010. [Google Scholar]
- Saber, H.H.; Maref, W.; Lacasse, M.A.; Swinton, M.C.; Kumaran, M.K. Benchmarking of hygrothermal model against measurements of drying of full-scale wall assemblies. In Proceedings of the 2010 International Conference on Building Envelope Systems and Technologies, ICBEST 2010, Vancouver, BC, Canada, 27–30 June 2010; pp. 369–377. [Google Scholar]
- Saber, H.H.; Maref, W.; Elmahdy, H.; Swinton, M.C.; Glazer, R. 3D heat and air transport model for predicting the thermal resistances of insulated wall assemblies. J. Build. Perform. Simul. 2012, 5, 75–91. [Google Scholar] [CrossRef]
- Saber, H.H.; Maref, W.; Swinton, M.C.; St-Onge, C. Thermal analysis of above-grade wall assembly with low emissivity materials and furred airspace. Build. Environ. 2011, 46, 1403–1414. [Google Scholar] [CrossRef]
- Saber, H.H. Investigation of thermal performance of reflective insulations for different applications. Build. Environ. 2011, 52, 32–44. [Google Scholar] [CrossRef]
- Saber, H.H.; Maref, W.; Hajiah, A.E. Effective R-value of enclosed reflective air spaces for different building applications. J. Build. Phys. 2020, 43, 398–427. [Google Scholar] [CrossRef]
- Saber, H.H.; Maref, W.; Hajiah, A.E. Hygrothermal Performance of Cool Roofs Subjected to Saudi Climates. Front. Energy Res. 2019, 7. [Google Scholar] [CrossRef]
- Saber, H.H. Practical correlations for the thermal resistance of vertical enclosed airspaces for building applications. Build. Environ. 2013, 59, 379–396. [Google Scholar] [CrossRef][Green Version]
- Saber, H.H. Practical correlations for thermal resistance of horizontal enclosed airspaces with upward heat flow for building applications. Build. Environ. 2013, 61, 169–187. [Google Scholar] [CrossRef]
- Saber, H.H. Practical correlation for thermal resistance of horizontal enclosed airspaces with downward heat flow for building applications. J. Build. Phys. 2013, 37, 403–435. [Google Scholar] [CrossRef]
- Saber, H.H. Practical correlation for thermal resistance of 45° sloped-enclosed airspaces with upward heat flow for building applications. J. Build. Phys. 2021. [Google Scholar] [CrossRef]
- Saber, H.H. Practical correlation for thermal resistance of 45o sloped enclosed airspaces with downward heat flow for building applications. Build. Environ. 2013, 65, 154–169. [Google Scholar] [CrossRef]
- Saber, H.H. Practical correlation for thermal resistance of low-sloped enclosed airspaces with downward heat flow for building applications. HVAC&R Res. 2014, 20, 92–112. [Google Scholar] [CrossRef]
- Saber, H.H.; Yarbrough, D.W. Advancements in the Evaluation of Reflective Insulation Assemblies. Constr. Specif. 2021, in press. [Google Scholar]
- RIMA International. Be Our Zoom Guest November 5th for Dr. Hamed Saber. September 2020. Available online: https://rimainternational.org/news/press-room/09-20-be-our-zoom-guest-for-dr-hamed-saber-november-5th/ (accessed on 13 May 2021).
- ASTM C1363. Standard Test Method for the Thermal Performance of Building Assemblies by Means of a Hot Box Apparatus; ASTM: Philadelphia, PA, USA, 2006; pp. 717–759. [Google Scholar]
- ASTM C518. Standard Test Method for Steady-State Heat Flux Measurements and Thermal Transmission Properties by Means of the Heat Flow Meter Apparatus; ASTM: Philadelphia, PA, USA, 2003; pp. 153–164. [Google Scholar]
- Saber, H.H.; Maref, W.; Sherrer, G.; Swinton, M.C. Numerical modeling and experimental investigations of thermal performance of reflective insulations. J. Build. Phys. 2012, 36, 163–177. [Google Scholar] [CrossRef]
- Saber, H.H.; Maref, W.; Swinton, M.C. Thermal response of basement wall systems with low-emissivity material and furred airspace. J. Build. Phys. 2011, 35, 353–371. [Google Scholar] [CrossRef]
- Saber, H.H. Thermal performance of wall assemblies with low emissivity. J. Build. Phys. 2012, 36, 308–329. [Google Scholar] [CrossRef]
- Cook, J.C.; Yarbrough, D.W.; Wilkes, K.E. Contamination of reflective foils in horizontal applications and the effect on thermal performance. ASHRAE Trans. 1989, 95, 677–681. [Google Scholar]
- Lee, S.W.; Lim, C.H.; Bin Salleh, E.I. Reflective thermal insulation systems in building: A review on radiant barrier and reflective insulation. Renew. Sustain. Energy Rev. 2016, 65, 643–661. [Google Scholar] [CrossRef]
- Bird, R.B.; Stewart, W.E.; Lightfoot, E.N. Transport Phenomena; John Wiley & Sons, Inc.: Hoboken, NJ, USA, 1960. [Google Scholar]


Publisher’s Note: MDPI stays neutral with regard to jurisdictional claims in published maps and institutional affiliations. |
© 2021 by the authors. Licensee MDPI, Basel, Switzerland. This article is an open access article distributed under the terms and conditions of the Creative Commons Attribution (CC BY) license (https://creativecommons.org/licenses/by/4.0/).