
Economic Analysis of Replacing HPS Lamp with LED Lamp and Cost Estimation to Set Up PV/Battery System for Street Lighting in Oman


Abstract
:1. Introduction
2. Literature Review on LED Lamps
- Although studies consider the techno-economic analysis of converting energy-inefficient lamps with energy-efficient LED lamps, to the best of authors’ knowledge, the replacement of lamps in existing streetlight system with methodology from square one using actual measurements of roads, poles, etc. has not been addressed in any work.
- Replacement of HPS lamps with customized discrete LED lamps for additional energy savings with basic design and calculation is never considered.
- The payback period with reference to the topic is high, which is available in literature, provides an inaccurate assessment for readers, resulting in the withdrawal from projects that actually require replacement of energy-inefficient lamps with energy-efficient LED lamps for cost savings as well as minimizing CO2 emissions. The authors considered real data for accurate and practicable results.
- Optimal sizing of renewable energy system for street lighting is considered in countable number of papers, but optimal sizing of PV/battery system for street lighting with design methodology for street lighting considering a new area deprived of streetlight and the related life cycle cost is never investigated.
- This study is the first of its kind conducted in Oman.
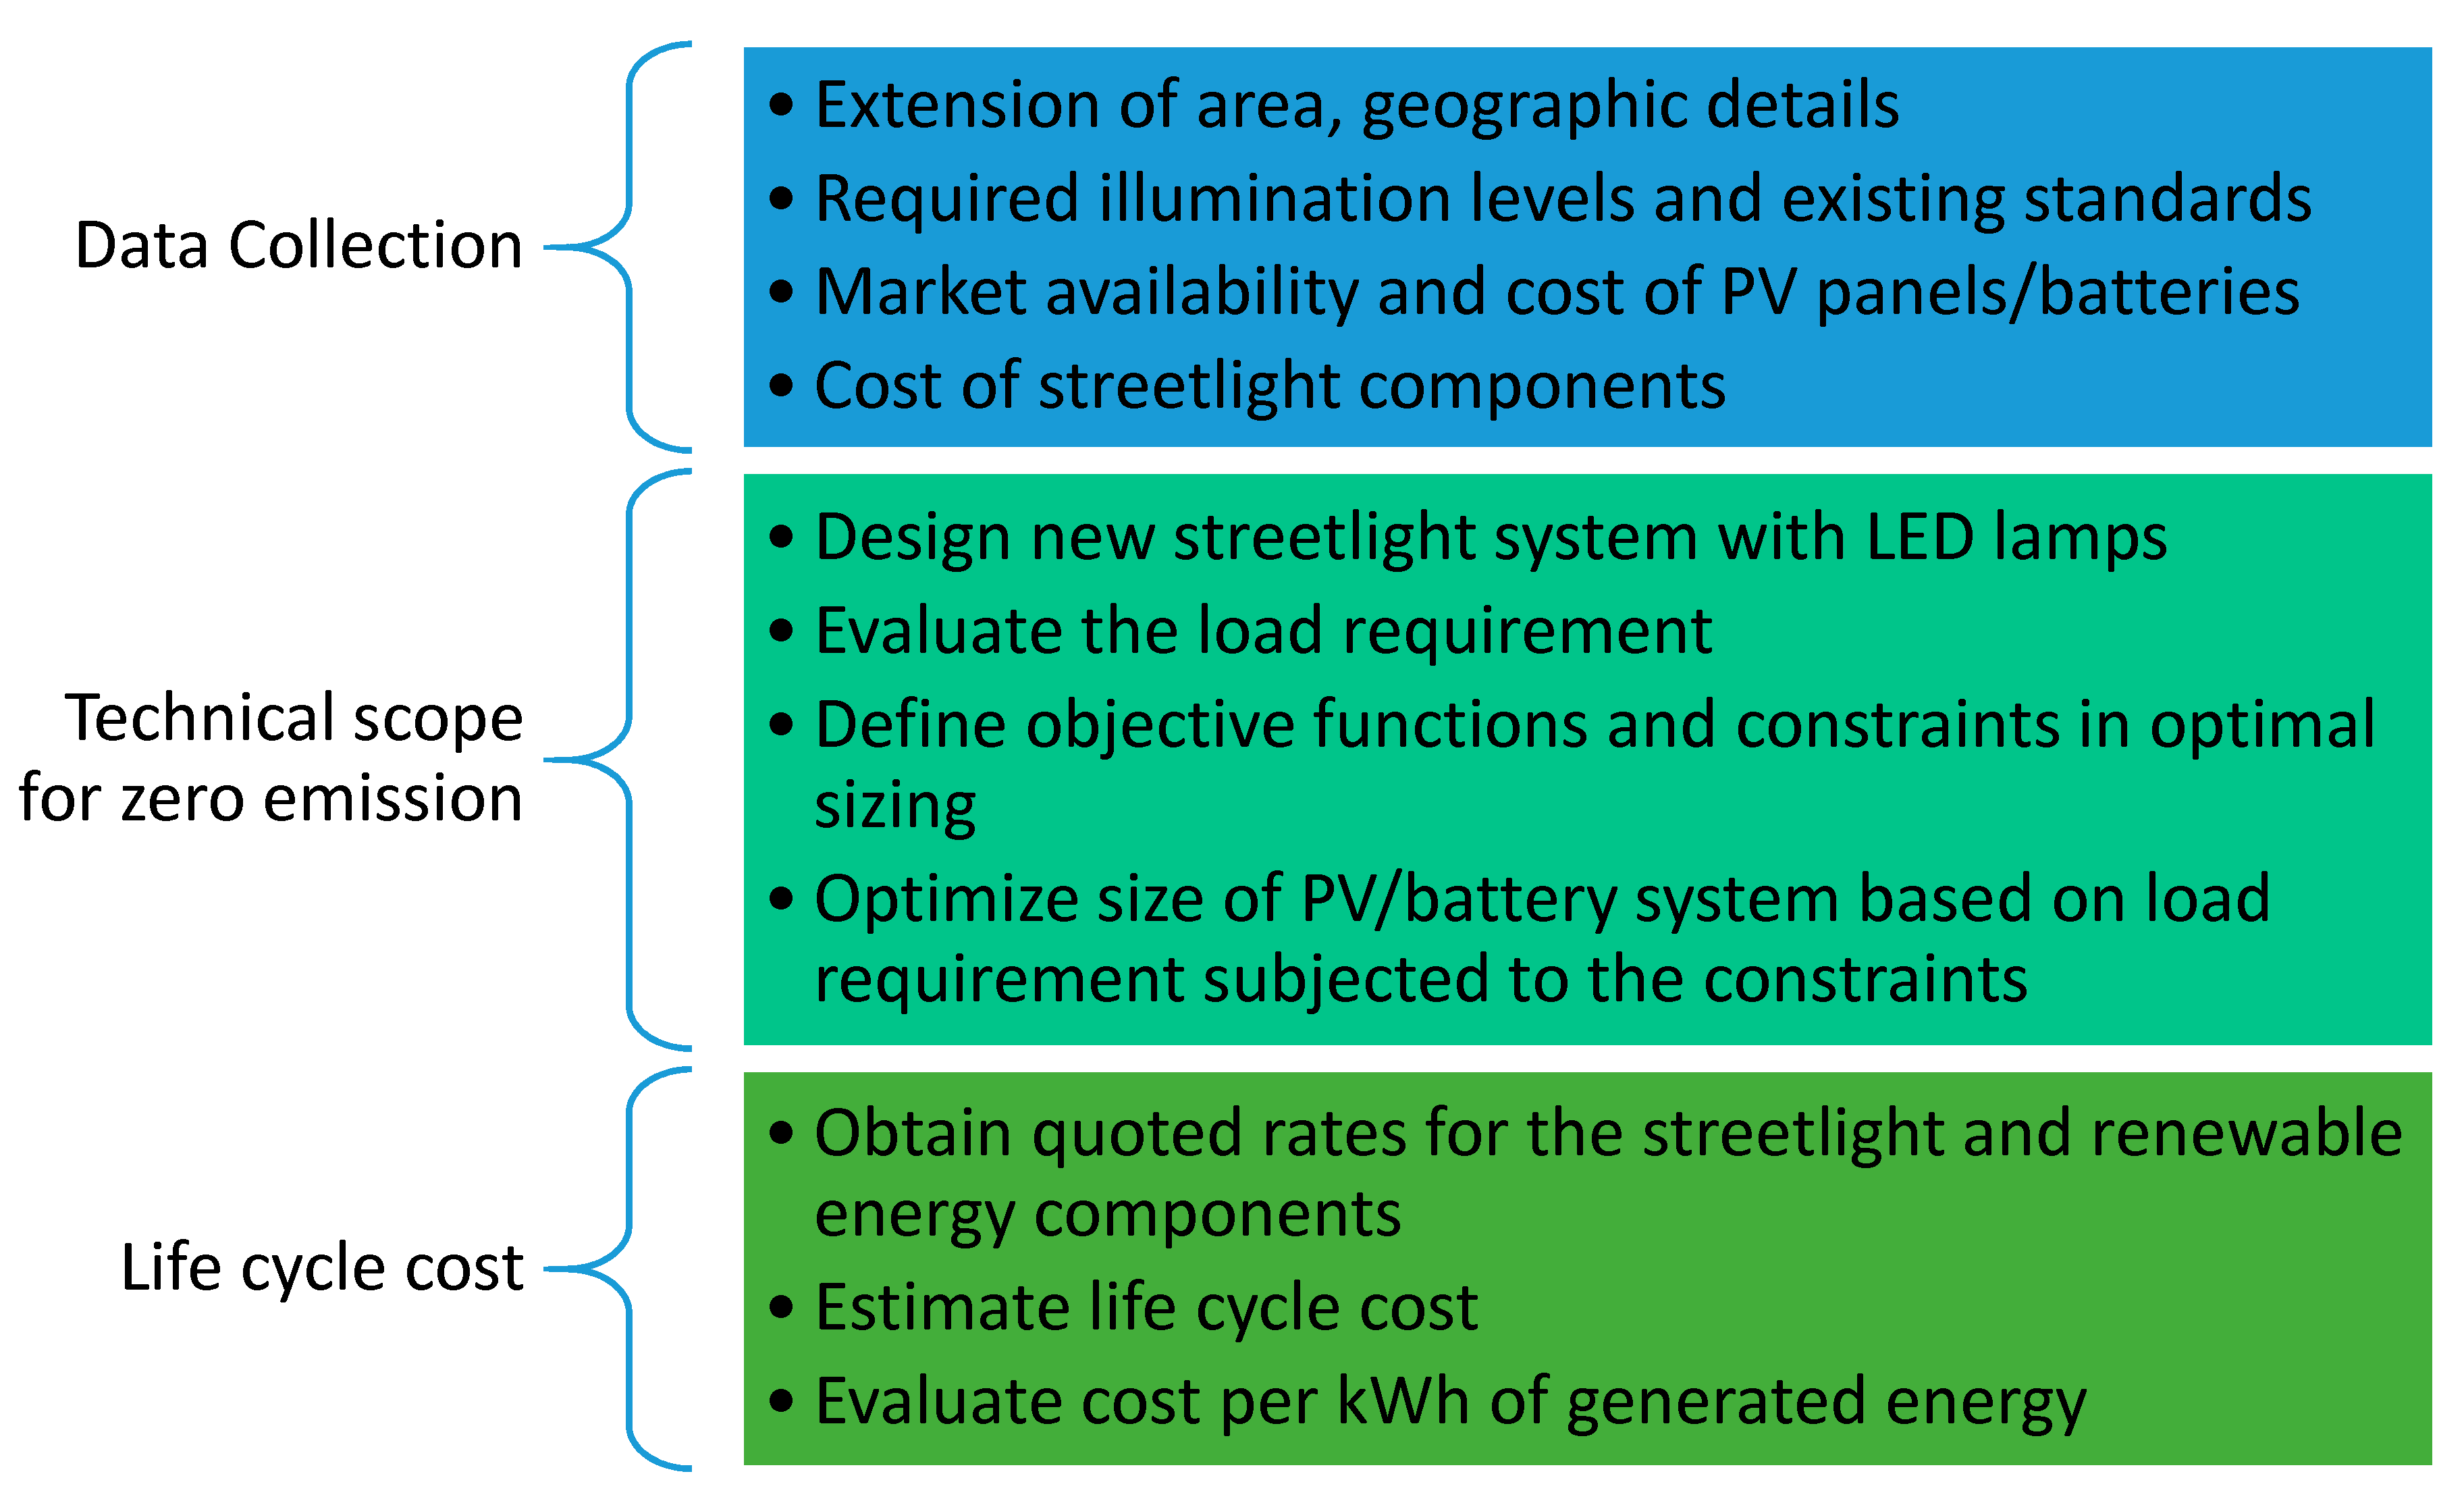
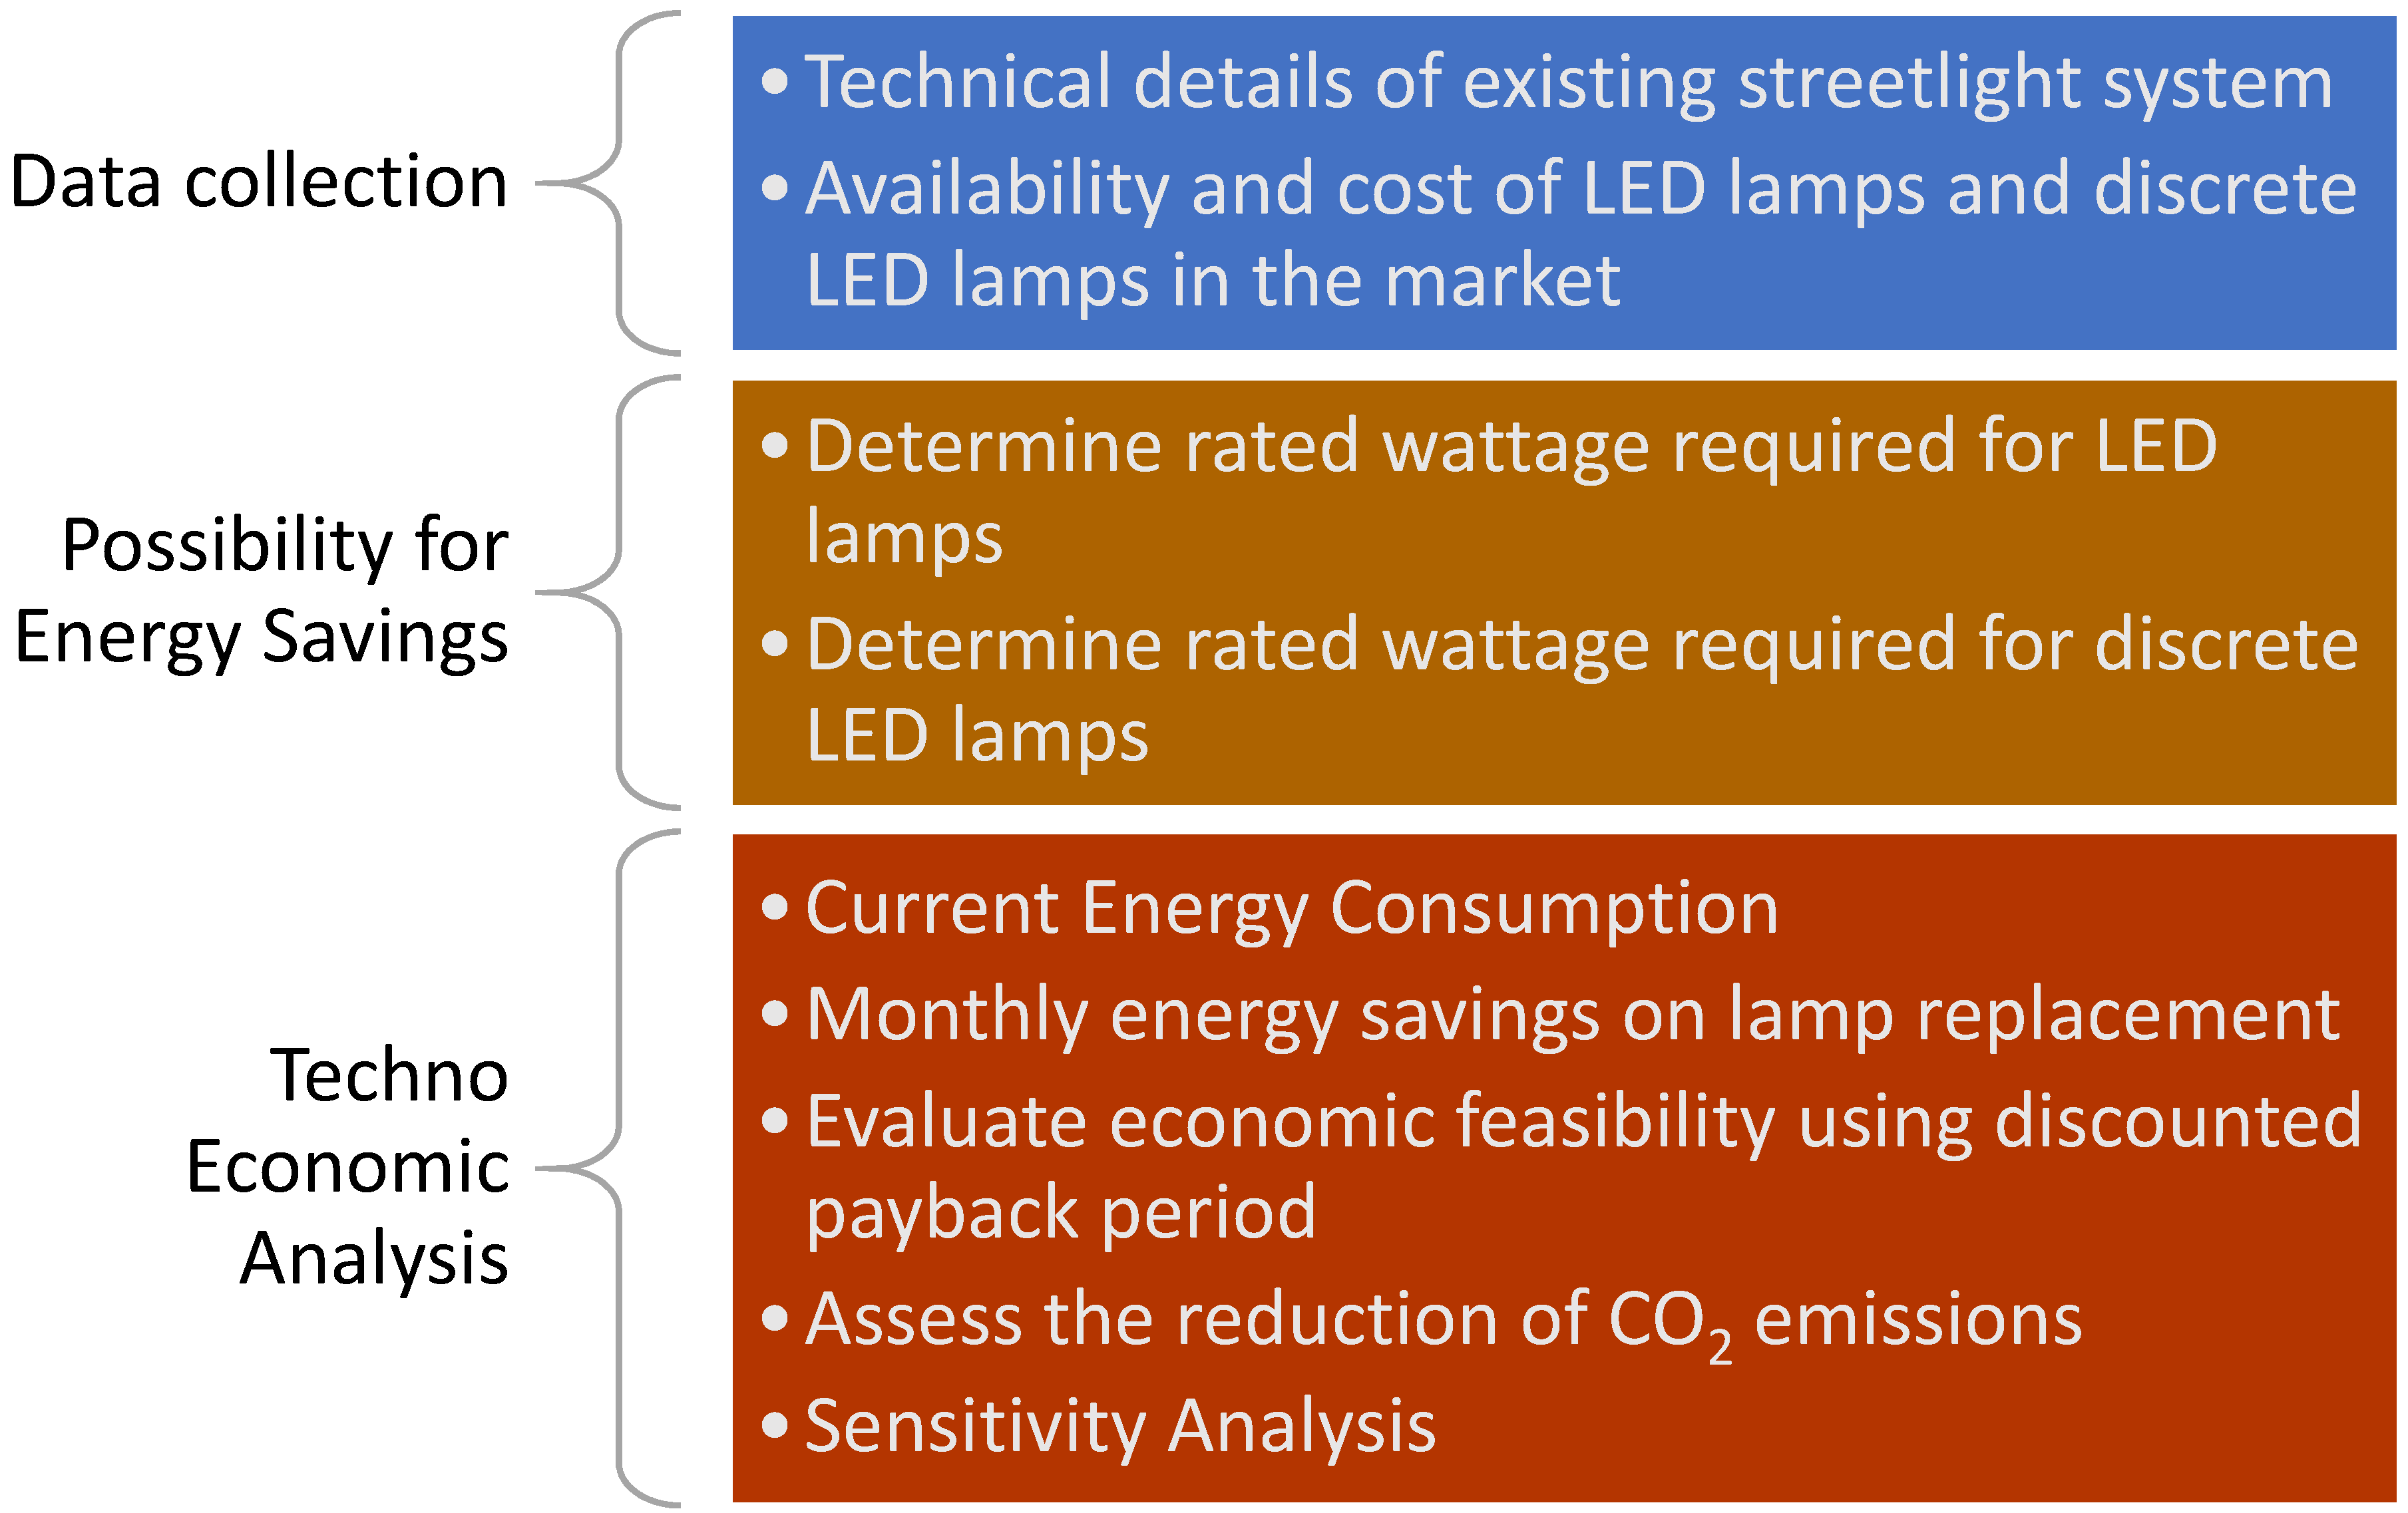
Materials and Methods
3. Design of Street Light System with LED Lamps
3.1. Technical Details of Street Light System in Sultan Qaboos University
3.2. Methodology to Calculate Rated Wattage for LED Lamps
3.3. Design of Street Lighting Using Discrete LED Lamps
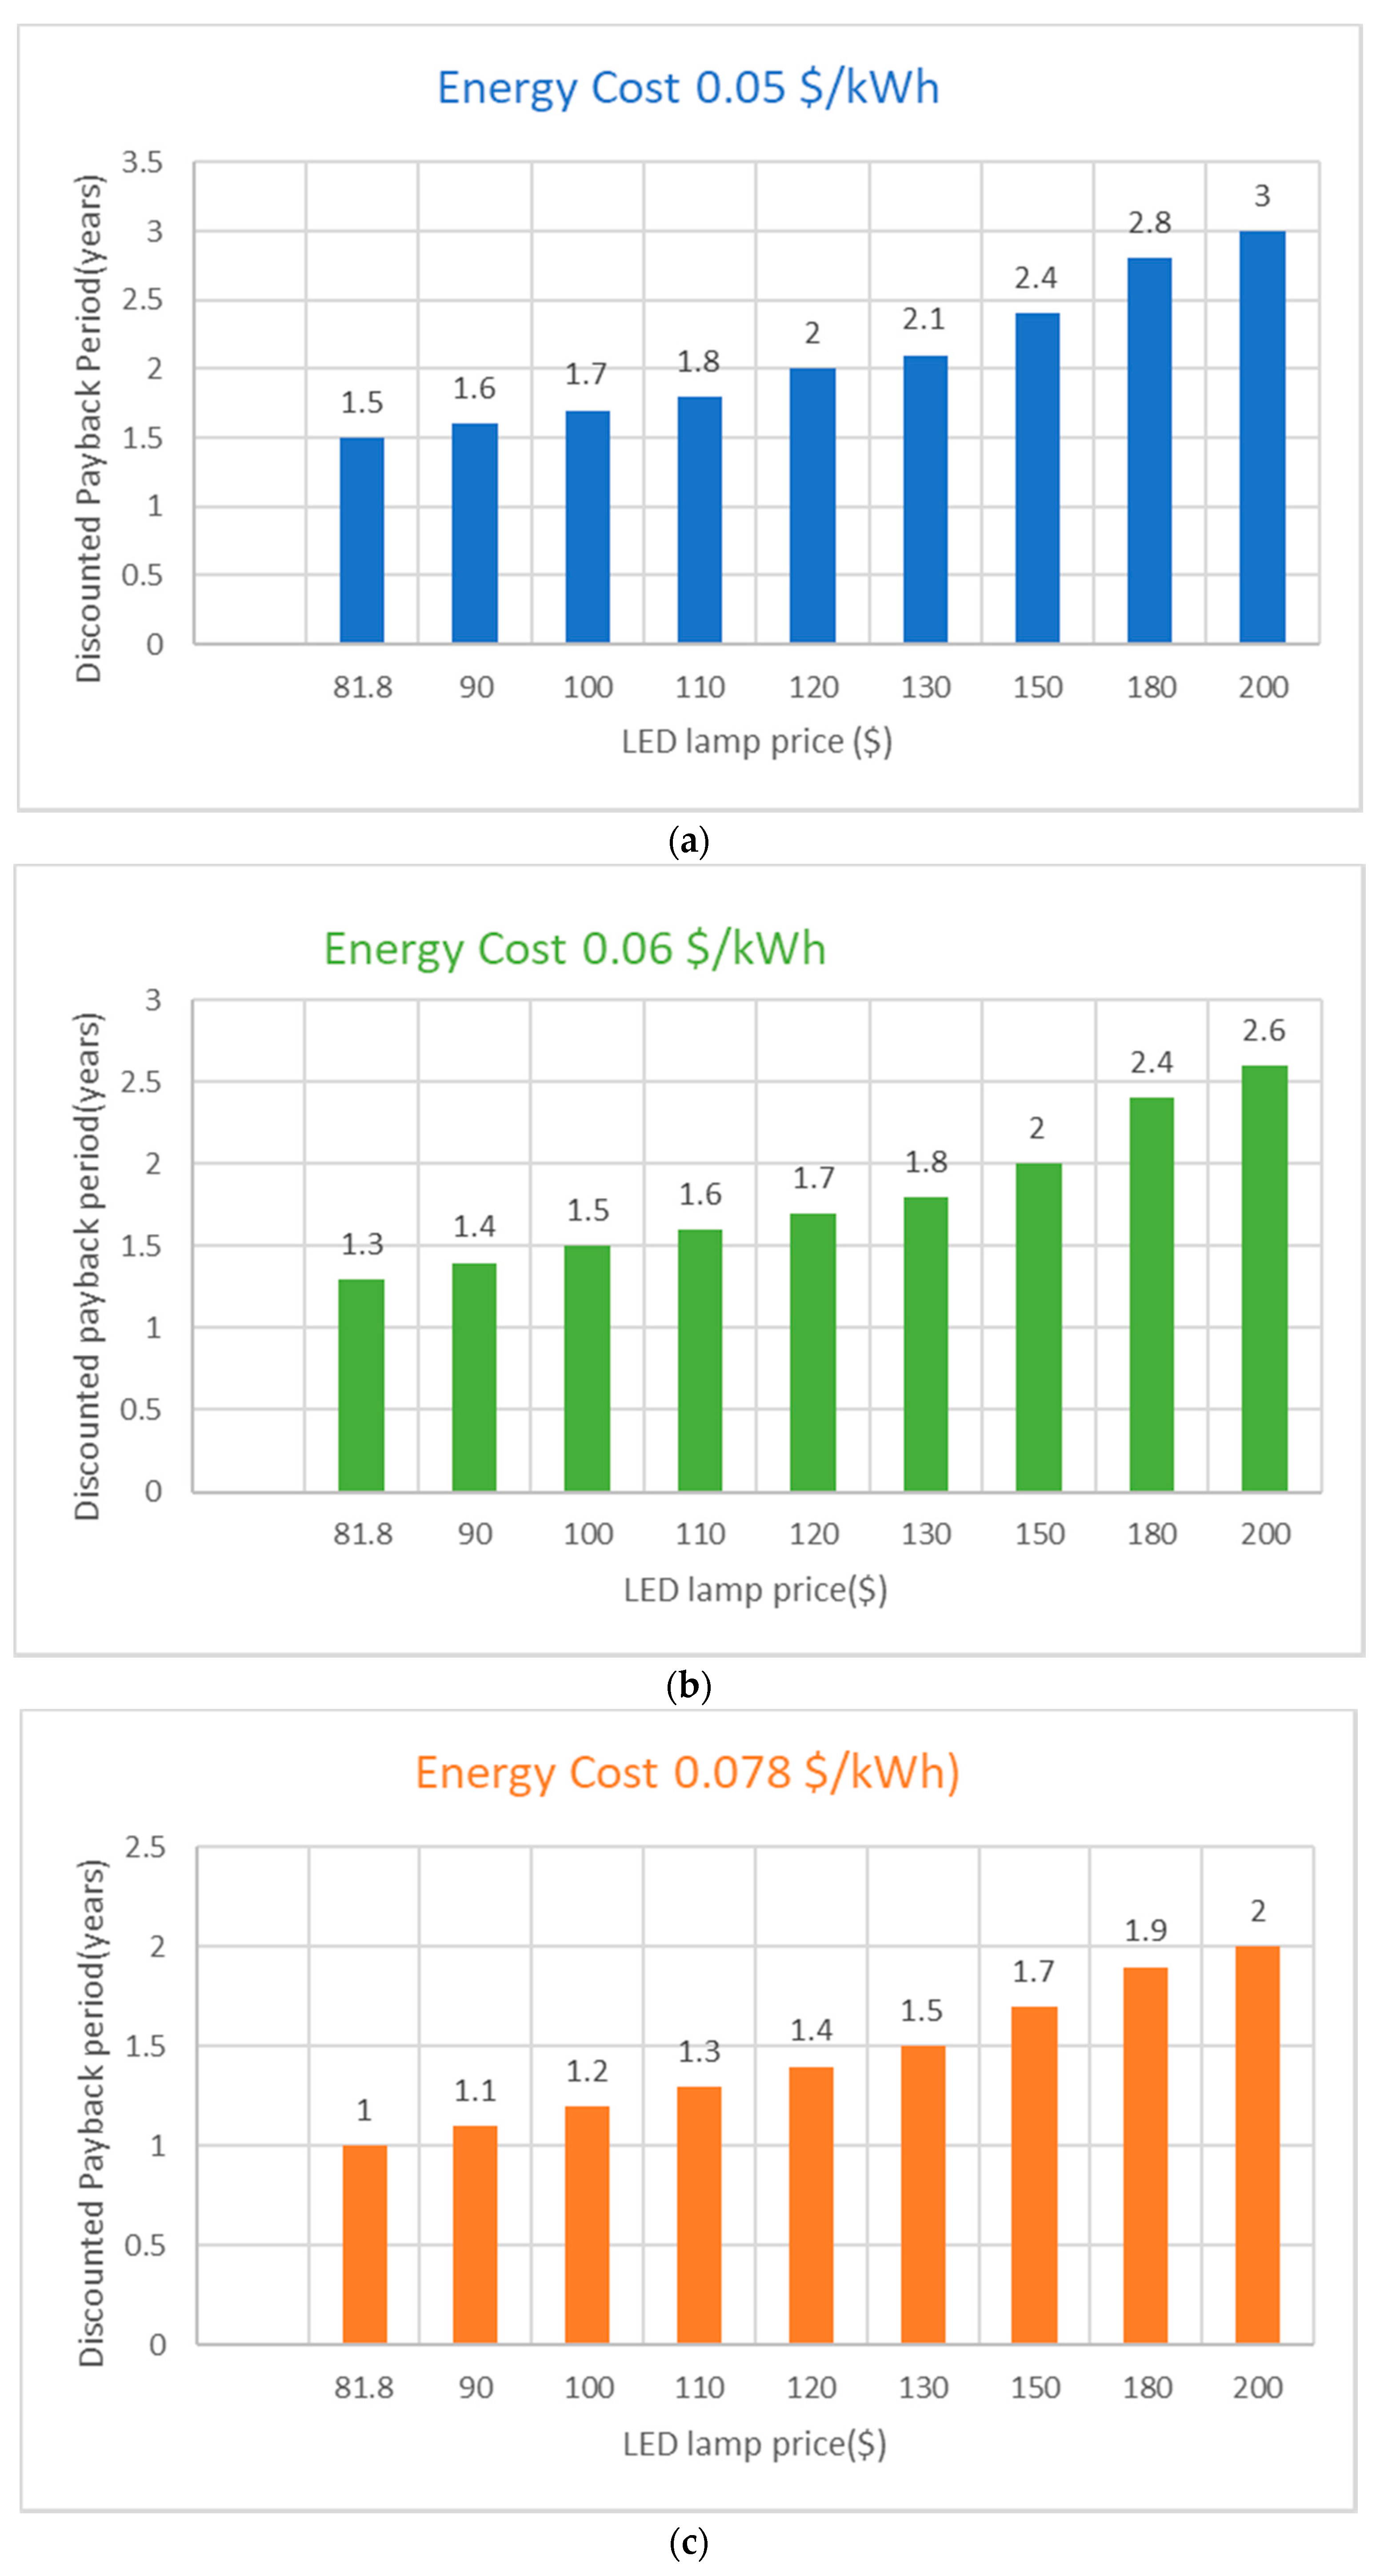
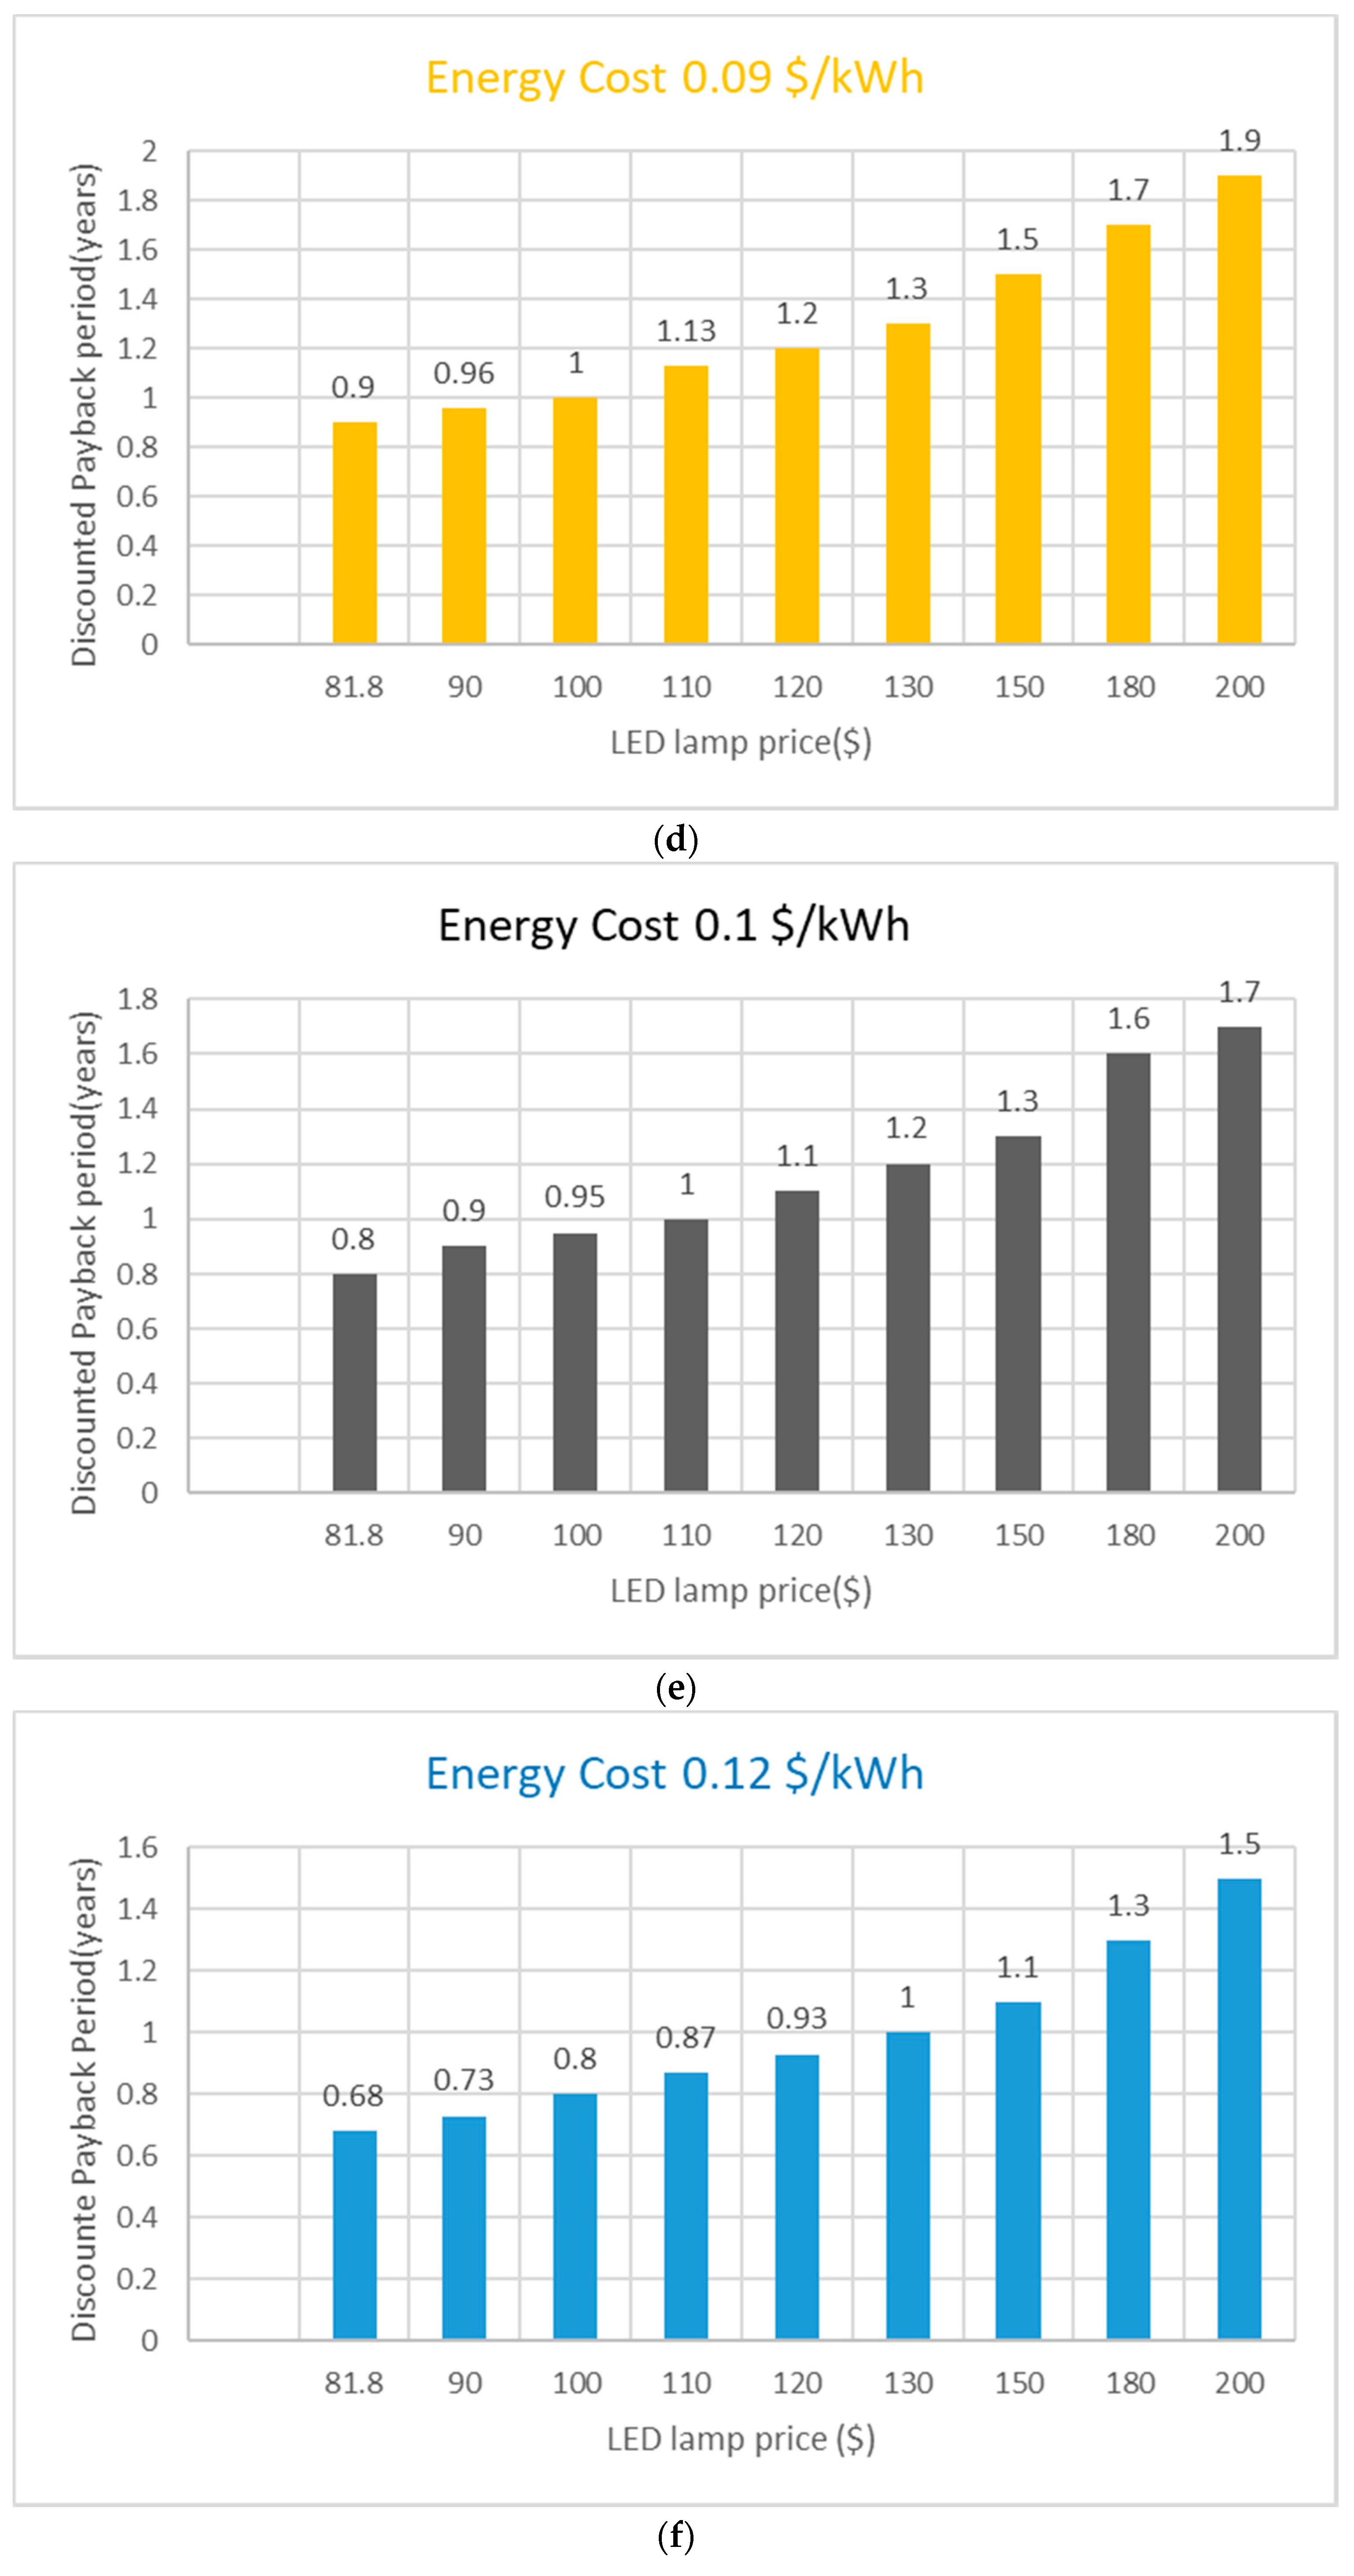
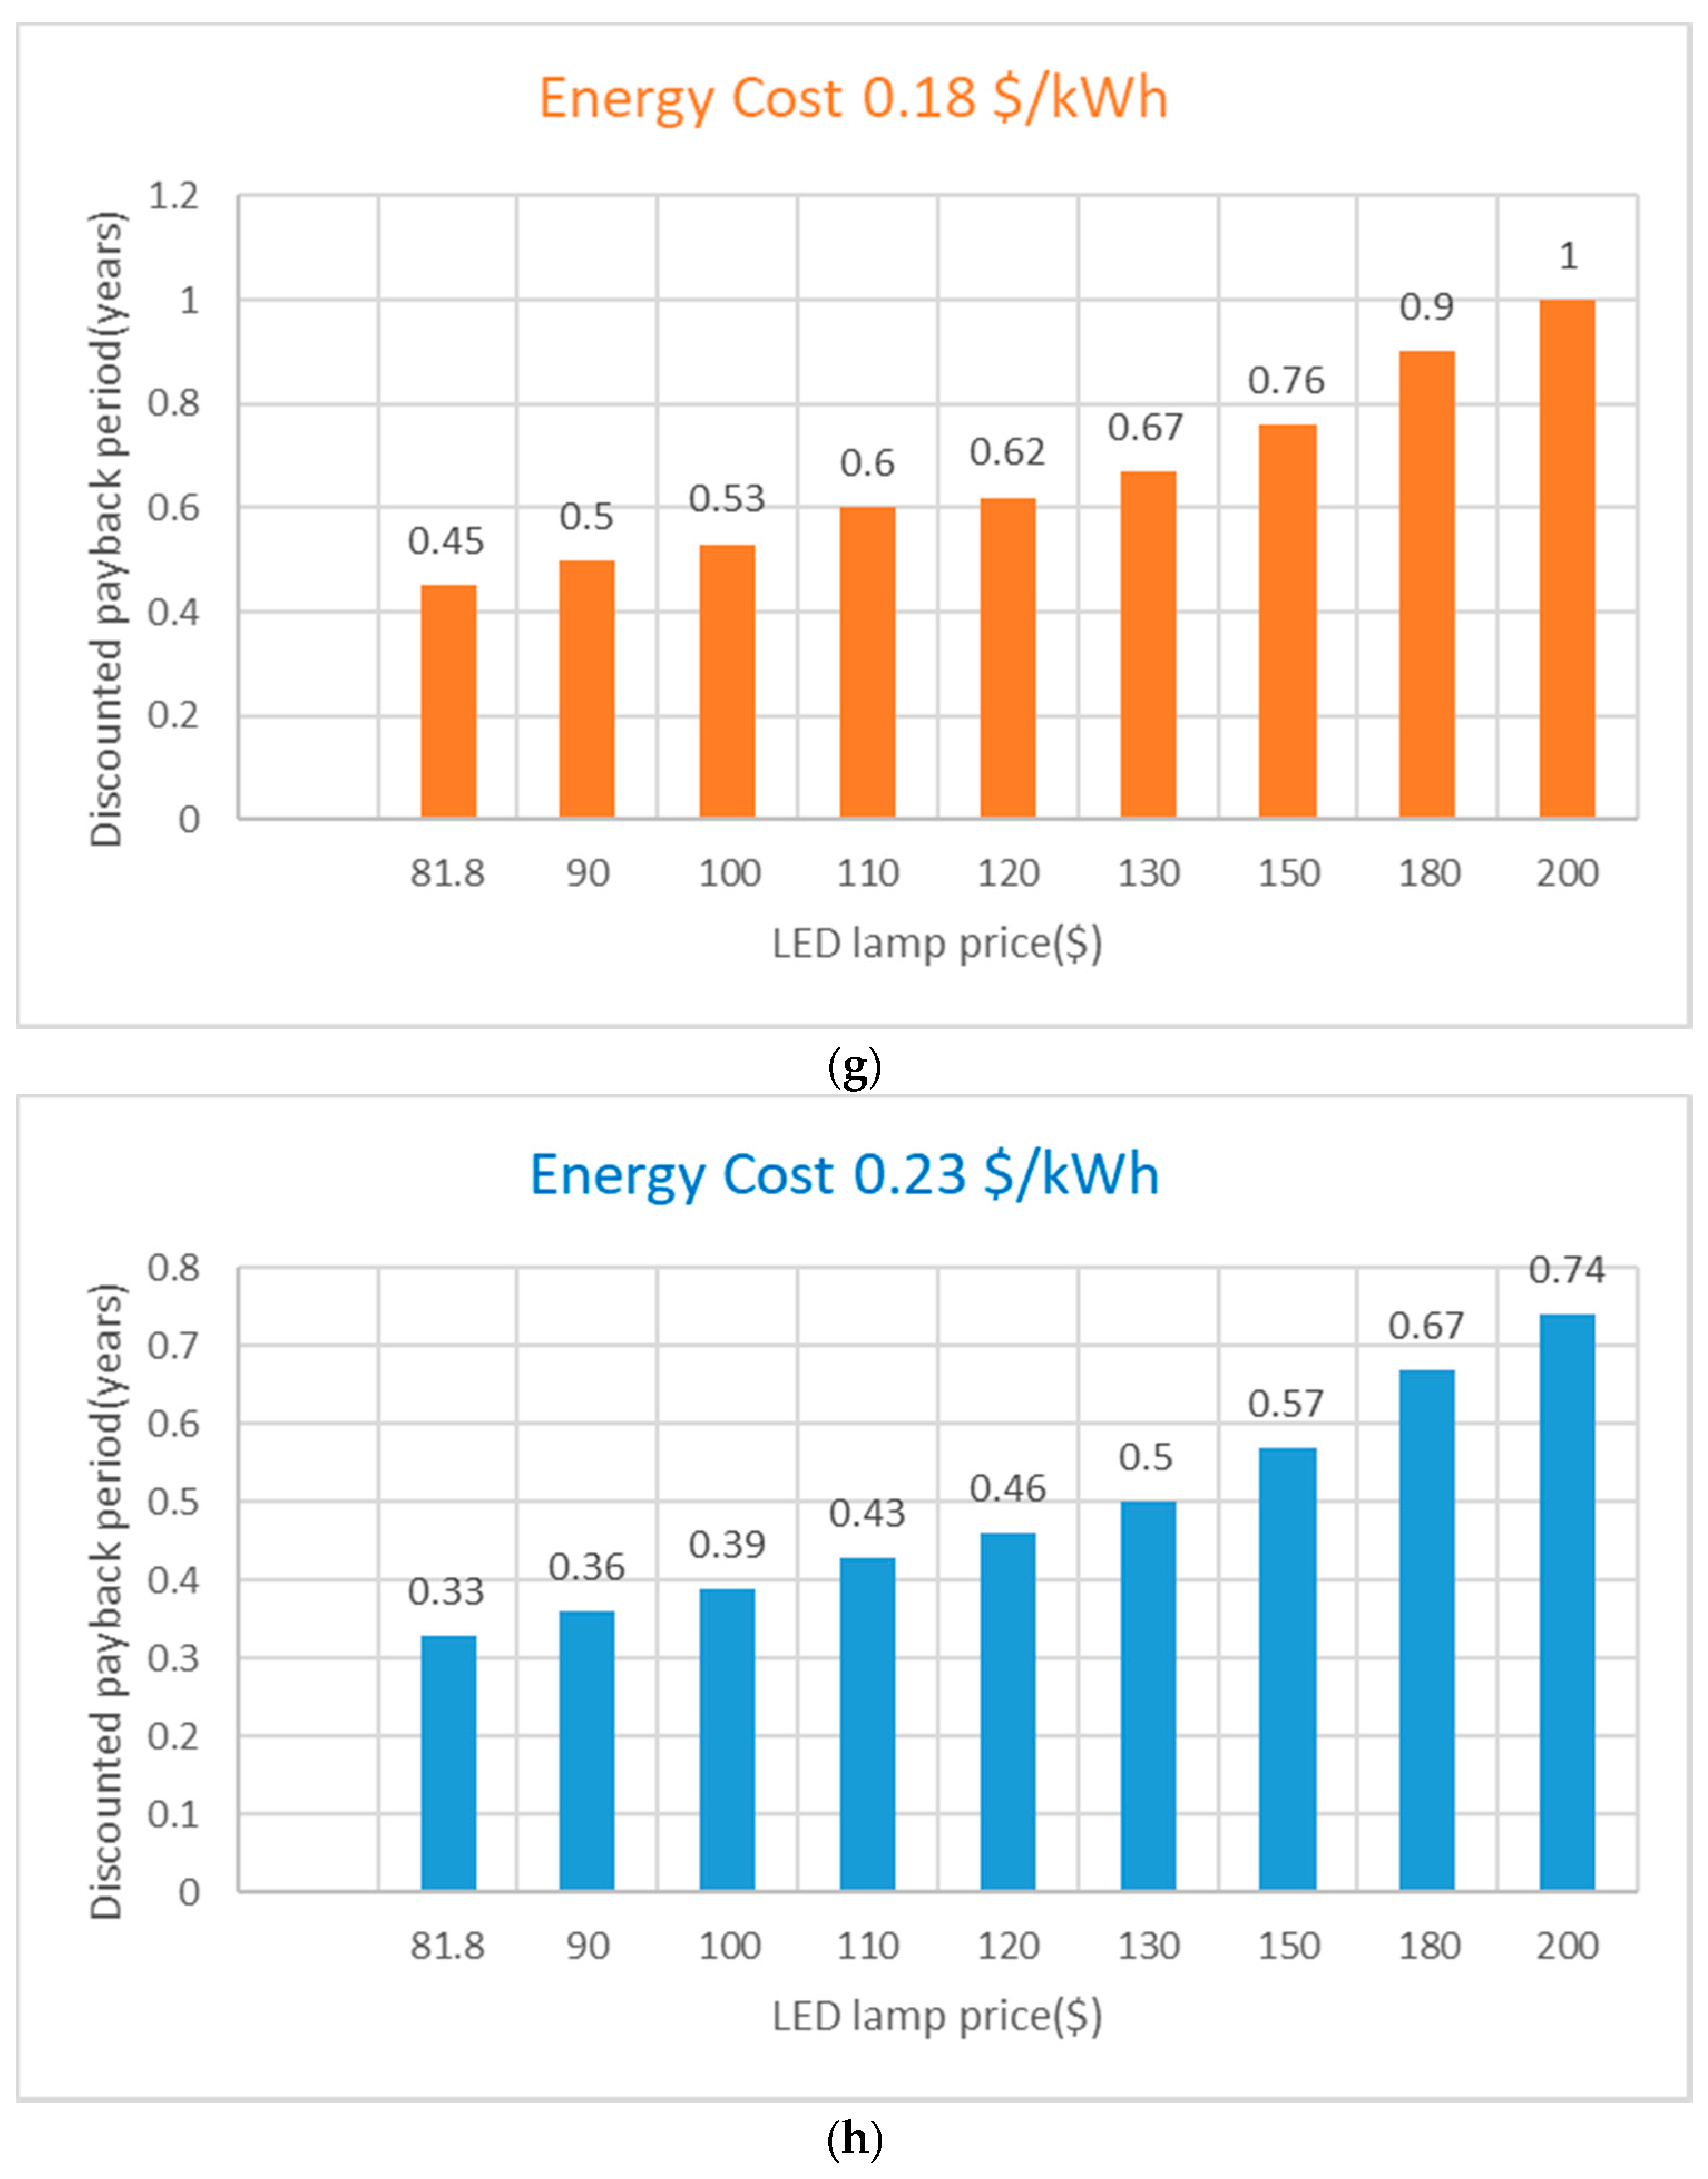
4. Economic Analysis Using Discounted Payback Period
5. Reduction in CO2 Emissions When the HPS Lamp Is Replaced with the LED Lamp
6. Optimization of PV/Battery System for the New Street Light System
6.1. Design of New Street Light System with PV/Battery System and LED Lamps
- Pole height = 12.5 m
- Spacing between poles = 35 m
- Space/height ratio <3
- No. of poles required for a distance of 8.55 km = 8550/35 ≈ 245 poles
- Assume that the load during summer is 10 hrs and that during winter is 12 h.
- Summer load = 80 W × 245 × 10 hrs/day = 196 kWh/day
- Winter load = 80 × 245 × 12 = 235.2 kWh/day
6.2. System Modelling
6.2.1. Model for Panel
6.2.2. Model for Battery
6.2.3. Specifications of Panel and Battery
- Battery Specifications: 12 V, 200 Ah
- DOD max: 80%.
6.2.4. Meteorological Data
7. Objective Functions, Constraints, and PV/Battery System Configuration
8. Life Cycle Cost Analysis
9. Conclusions
Author Contributions
Funding
Institutional Review Board Statement
Informed Consent Statement
Acknowledgments
Conflicts of Interest
Nomenclature
| SSL | Solid-State Lamp |
| HPS | High Pressure Sodium |
| LED | Light emitting diode |
| PCB | Printed circuit board |
| PV | Photovoltaic |
| CFL | Compact Fluorescent lamp |
| ROI | Return on investment |
| NPV | Net present value |
| TR | Total return |
| S | Distance between poles |
| E | Required lux level |
| W | Width of road |
| CoU | Coefficient of utilization |
| Mf | Maintenance factor |
| LLD | Lamp lumen depreciation factor |
| LDD | Luminaire Dirt depreciation factor |
| ηoptical | Optical efficiency |
| ηthermal | Thermal efficiency |
| T | Daily ON-time of the lamp in hours |
| D | Total no: of days in a month |
| i | Discount rate |
| N | Period to which cash inflow relates |
| OCGT | Open cycle gas turbine |
| CCGT | Combined cycle gas turbine |
| GA | Genetic Algorithm |
| LPS | Loss of power supply |
| Etotal | Energy generated by the PV system |
| EPV(t) | Energy generated by the PV system during the time interval [(t−1), t] |
| Eb(t−1) | Initial stored energy in a single battery [(t−1), t] |
| WBmin | Minimum permissible battery energy level (kW) |
| No: of PV modules | |
| No: of batteries | |
| ηinv | Inverter efficiency |
| Emodule | Instantaneous generated PV energy (kW) |
| APV | Area of solar panel (m2) |
| Esun | Daily solar irradiation (Wh/m2) |
| ηPV | PV panel efficiency |
| ηwire | wiring efficiency |
| ηPV, ref | Reference value for efficiency of the PV module |
| Tc, ref | Reference value for efficiency of cell temperature |
| β | Temperature coefficient for efficiency |
| Tc(t) | Cell temperature |
| TA(t), Ta | Ambient temperature(°C) |
| G(t) | Solar radiation (W/m2) |
| NOCT | Nominal operating cell temperature |
| Eb | Energy stored in the battery |
| Ebmin | Minimum permissible battery energy level |
| Ebmax | Maximum permissible battery energy level |
| Ampere-hour | |
| Eb (t−1) | Initial energy stored in the battery |
| l | Maximum depth of discharge |
| DOD | Depth of discharge |
| Emodule | Energy generated by PV module(kW) |
| LCC | Life Cycle Cost |
| RE | Renewable Energy |
| CRF | Capital recovery factor |
| PW | Present Worth |
| P | Lifetime of PV system |
References
- International Energy Agency. “Light’s Labour’s Lost”: Policies for Energy-efficient Lighting. In Support of the G8 Plan of Action: Organisation for Economic Co-Operation and Development; International Energy Agency: Paris, France, 2006. [Google Scholar]
- Popa, M.; Cepişcă, C. Energy consumption saving solutions based on intelligent street lighting control system. UPB Sci. Bull. Ser. C 2011, 73, 297–308. [Google Scholar]
- Griffiths, H. The Future of Street Lighting: The Potential for New Service Development; Future Cities Catapult: London, UK, 2017. [Google Scholar]
- Reese, S.; Horowitz, K.; Mann, M.; Remo, T. Research note: LED lighting–A global enterprise. Lighting Res. Technol. 2020, 52, 849–855. [Google Scholar] [CrossRef]
- Boyce, P.R. Lighting for Driving: Roads, Vehicles, Signs, and Signals; CRC Press: Boca Raton, FL, USA, 2008. [Google Scholar]
- Balsky, M.; Terrich, T. Light Trespass in Street LED Lighting Systems. In Proceedings of the 21st International Scientific Conference on Electric Power Engineering (EPE), Prague, Czech Republic, 19–21 October 2020; pp. 1–4. [Google Scholar]
- Mukish, P.; Virey, E. LED Packaging Technology and Market Trends 2014; Yole Development: Villeurbanne, France, 2014. [Google Scholar]
- Mehr, M.Y.; Bahrami, A.; van Driel, W.D.; Fan, X.; Davis, J.L.; Zhang, G. Degradation of optical materials in solid-state lighting systems. Int. Mater. Rev. 2020, 65, 102–128. [Google Scholar] [CrossRef] [Green Version]
- Grandjean, N. LED light sources (light for the future). J. Phys. D Appl. Phys. 2010, 43, 350301. [Google Scholar] [CrossRef]
- LED Lights Last Longer. Lower Maintenance with LED Lights. 2008. Available online: https://www.usailighting.com/stuff/contentmgr/files/1/163dea09576c4e1aa56f2385ca1dae96/misc/lowermaintenancewithled.pdf (accessed on 2 November 2021).
- Bakin, N.N.; Tuyev, V.I.; Yauk, E.F. LED lighting. In Proceedings of the 2011 International Conference and Seminar on Micro/Nanotechnologies and Electron Devices Proceedings, Erlagol, Russia, 30 June–4 July 2011; pp. 346–348. [Google Scholar]
- Ylinen, A.-M.; Tähkämö, L.; Puolakka, M.; Halonen, L. Road lighting quality, energy efficiency, and mesopic design–LED street lighting case study. Leukos 2011, 8, 9–24. [Google Scholar] [CrossRef]
- Narukawa, Y.; Ichikawa, M.; Sanga, D.; Sano, M.; Mukai, T. White light emitting diodes with super-high luminous efficacy. J. Phys. D Appl. Phys. 2010, 43, 354002. [Google Scholar] [CrossRef]
- Uddin, S.; Shareef, H.; Mohamed, A.; Hannan, M.; Mohamed, K. LEDs as energy efficient lighting systems: A detail review. In Proceedings of the 2011 IEEE Student Conference on Research and Development, Putrajaya, Malaysia, 19–20 December 2011; pp. 468–472. [Google Scholar]
- U.S. Department of Energy. Life-Cycle Assessment of Energy and Environmental Impacts of LED Lighting Products Part 1: Review of the Life-Cycle Energy Consumption of Incandescent. Compact Fluorescent, and LED Lamps; U.S. Department of Energy: Washington, DC, USA, 2012.
- Scholand, M.; Dillon, H.E. Life-Cycle Assessment of Energy and Environmental Impacts of LED Lighting Products Part 2: LED Manufacturing and Performance; Pacific Northwest National Lab (PNNL): Richland, WA, USA, 2012.
- Tuenge, R.; Hollomon, B.; Dillon, H.E.; Snowden-Swan, L.J. Life-Cycle Assessment of Energy and Environmental Impacts of LED Lighting Products, Part 3: LED Environmental Testing; Pacific Northwest National Lab (PNNL): Richland, WA, USA, 2013.
- Li, Y.; Zhang, S.; Kang, R.; Pecht, M. Return on Investment of a LED lighting system. In Proceedings of the 2011 Prognostics and System Health Managment Conference, Montreal, QC, Canada, 25–29 September 2011; pp. 1–5. [Google Scholar]
- Yu, L.; Yang, J. The topologies of white LED lamps’ power drivers. In Proceedings of the 2009 3rd International Conference on Power Electronics Systems and Applications (PESA), Hong Kong, China, 20–22 May 2009; pp. 1–6. [Google Scholar]
- Alonso, J.M.; Viña, J.; Vaquero, D.G.; Martínez, G.; Osorio, R. Analysis and design of the integrated double buck–boost converter as a high-power-factor driver for power-LED lamps. IEEE Trans. Ind. Electron. 2011, 59, 1689–1697. [Google Scholar] [CrossRef]
- Katzin, D.; Marcelis, L.F.; van Mourik, S. Energy savings in greenhouses by transition from high-pressure sodium to LED lighting. Appl. Energy 2021, 281, 116019. [Google Scholar] [CrossRef]
- Patella, S.M.; Sportiello, S.; Carrese, S.; Bella, F.; Asdrubali, F. The effect of a LED lighting crosswalk on pedestrian safety: Some experimental results. Safety 2020, 6, 20. [Google Scholar] [CrossRef] [Green Version]
- Peña-García, A.; Sędziwy, A. Optimizing lighting of rural roads and protected areas with white light: A compromise among light pollution, energy savings, and visibility. Leukos 2020, 16, 147–156. [Google Scholar] [CrossRef]
- Pagden, M.; Ngahane, K.; Amin, M.S.R. Changing the colour of night on urban streets-LED vs. part-night lighting system. Socio-Econ. Plan. Sci. 2020, 69, 100692. [Google Scholar] [CrossRef]
- Gorgulu, S.; Kocabey, S. An energy saving potential analysis of lighting retrofit scenarios in outdoor lighting systems: A case study for a university campus. J. Clean. Prod. 2020, 260, 121060. [Google Scholar] [CrossRef]
- Mahmoud, M. Economic Model for Calculating the Global Saving Norm of Replacement High-Intensity Discharge Lamps with LED Lamp in Oil and Gas Plant. In Proceedings of the 2020 IEEE 61st International Scientific Conference on Power and Electrical Engineering of Riga Technical University (RTUCON), Riga, Latvia, 5–7 November 2020; pp. 1–5. [Google Scholar]
- Ikuzwe, A.; Ye, X.; Xia, X. Energy-maintenance optimization for retrofitted lighting system incorporating luminous flux degradation to enhance visual comfort. Appl. Energy 2020, 261, 114379. [Google Scholar] [CrossRef]
- Bonomolo, M.; Baglivo, C.; Bianco, G.; Congedo, P.M.; Beccali, M. Cost optimal analysis of lighting retrofit scenarios in educational buildings in Italy. Energy Procedia 2017, 126, 171–178. [Google Scholar] [CrossRef]
- Carli, R.; Dotoli, M.; Cianci, E. An optimization tool for energy efficiency of street lighting systems in smart cities. IFAC-Pap. 2017, 50, 14460–14464. [Google Scholar] [CrossRef]
- Carli, R.; Dotoli, M. A dynamic programming approach for the decentralized control of energy retrofit in large-scale street lighting systems. IEEE Trans. Autom. Sci. Eng. 2020, 17, 1140–1157. [Google Scholar] [CrossRef]
- Beccali, M.; Bonomolo, M.; Brano, V.L.; Ciulla, G.; di Dio, V.; Massaro, F.; Favuzza, S. Energy saving and user satisfaction for a new advanced public lighting system. Energy Convers. Manag. 2019, 195, 943–957. [Google Scholar] [CrossRef]
- Gordic, D.; Vukasinovic, V.; Kovacevic, Z.; Josijevic, M.; Zivkovic, D. Assessing the Techno-Economic Effects of Replacing Energy-Inefficient Street Lighting with LED Corn Bulbs. Energies 2021, 14, 3755. [Google Scholar] [CrossRef]
- Fontoynont, M. LED lighting, ultra-low-power lighting schemes for new lighting applications. Comptes Rendus Phys. 2018, 19, 159–168. [Google Scholar] [CrossRef]
- Kennaugh, E.D. Roadway Lighting Design; CED Engineering: New York, NY, USA; Available online: https://www.cedengineering.com/userfiles/Roadway%20Lighting%20Design-R1.pdf (accessed on 2 November 2021).
- LED Luminaire Design Guide; CREE, Inc.: Durham, NC, USA, 2016.
- Pattison, M.; Hansen, M.; Tsao, J.Y. LED lighting efficacy: Status and directions. Comptes Rendus Phys. 2018, 19, 134–145. [Google Scholar] [CrossRef]
- C. Lighting. 2021. Available online: https://cree-led.com/products/xlamp-leds-discrete (accessed on 20 January 2021).
- Authority for Electricity Regulation. Annual Report; Authority for Public Services Regulation: Khuwair, Oman, 2008. [Google Scholar]
- Sultanate of Oman—Renewables Readiness Assessment; International Renewable Energy Agency (IRENA): Abu Dhabi, United Arab Emirates, 2014.
- World CO2 Emissions from Fuel Combustion; International Energy Agency: Paris, France, 2017.
- Alramlawi, M.; Li, P. Design optimization of a residential PV-battery microgrid with a detailed battery lifetime estimation model. IEEE Trans. Ind. Appl. 2020, 56, 2020–2030. [Google Scholar] [CrossRef]
- Cho, D.; Valenzuela, J. Optimization of residential off-grid PV-battery systems. Sol. Energy 2020, 208, 766–777. [Google Scholar] [CrossRef]
- Aghamohamadi, M.; Mahmoudi, A.; Haque, M.H. Two-Stage Robust Sizing and Operation Co-Optimization for Residential PV–Battery Systems Considering the Uncertainty of PV Generation and Load. IEEE Trans. Ind. Inform. 2020, 17, 1005–1017. [Google Scholar] [CrossRef]
- Bandyopadhyay, S.; Mouli, G.C.; Qin, Z.; Elizondo, L.R.; Bauer, P. Techno-economical model based optimal sizing of pv-battery systems for microgrids. IEEE Trans. Sustain. Energy 2019, 3, 1657–1668. [Google Scholar] [CrossRef]
- Cai, W.; Li, X.; Maleki, A.; Pourfayaz, F.; Rosen, M.A.; Nazari, M.A.; Bui, D.T. Optimal sizing and location based on economic parameters for an off-grid application of a hybrid system with photovoltaic, battery and diesel technology. Energy 2020, 201, 117480. [Google Scholar] [CrossRef]
- Bagul, A.D.; Salameh, Z.M.; Borowy, B. Sizing of a stand-alone hybrid wind-photovoltaic system using a three-event probability density approximation. Sol. Energy 1996, 56, 323–335. [Google Scholar] [CrossRef]
- Ramadhani, F.; Bakar, K.A.; Shafer, M.G. Optimization of standalone street light system with consideration of lighting control. In Proceedings of the 2013 The International Conference on Technological Advances in Electrical, Electronics and Computer Engineering (TAEECE), Konya, Turkey, 9–11 May 2013; pp. 583–588. [Google Scholar]
- Yang, H.; Lu, L.; Zhou, W. A novel optimization sizing model for hybrid solar-wind power generation system. Sol. Energy 2007, 81, 76–84. [Google Scholar] [CrossRef]
- Mulleriyawage, U.; Shen, W. Optimally sizing of battery energy storage capacity by operational optimization of residential PV-Battery systems: An Australian household case study. Renew. Energy 2020, 160, 852–864. [Google Scholar] [CrossRef]
- Maleki, A.; Nazari, M.A.; Pourfayaz, F. Harmony search optimization for optimum sizing of hybrid solar schemes based on battery storage unit. Energy Rep. 2020, 6, 102–111. [Google Scholar] [CrossRef]
- Ridha, H.M.; Gomes, C.; Hazim, H.; Ahmadipour, M. Sizing and implementing off-grid stand-alone photovoltaic/battery systems based on multi-objective optimization and techno-economic (MADE) analysis. Energy 2020, 207, 118163. [Google Scholar] [CrossRef]
- Ashtiani, M.N.; Toopshekan, A.; Yousefi, H.; Maleki, A. Techno-economic analysis of a grid-connected PV/battery system using the teaching-learning-based optimization algorithm. Sol. Energy 2020, 203, 69–82. [Google Scholar] [CrossRef]
- Kaushika, N.; Gautam, N.K.; Kaushik, K. Simulation model for sizing of stand-alone solar PV system with interconnected array. Sol. Energy Mater. Sol. Cells 2005, 85, 499–519. [Google Scholar] [CrossRef]
- Ai, B.; Yang, H.; Shen, H.; Liao, X. Computer-aided design of PV/wind hybrid system. Renew. Energy 2003, 28, 1491–1512. [Google Scholar] [CrossRef]
- Ibrahim, A.; Khatib, T.; Mohamed, A. Impact of Battery’s Model Accuracy on Size Optimization Process of a Standalone Photovoltaic System. Sustainability 2016, 8, 894. [Google Scholar] [CrossRef] [Green Version]
- Bharti, R.; Kuitche, J.; TamizhMani, M.G. Nominal Operating Cell Temperature (NOCT): Effects of module size, loading and solar spectrum. In Proceedings of the 2009 34th IEEE Photovoltaic Specialists Conference (PVSC), Philadelphia, PA, USA, 7–12 June 2009; pp. 001657–001662. [Google Scholar]
- Al-Rawahi, N.; Zurigat, Y.; Al-Azri, N. Prediction of hourly solar radiation on horizontal and inclined surfaces for Muscat/Oman. J. Eng. Res. 2011, 8, 19–31. [Google Scholar] [CrossRef] [Green Version]
- Kaabeche, A.; Belhamel, M.; Ibtiouen, R. Optimal sizing method for stand-alone hybrid PV/wind power generation system. Rev. Des Energ. Renouvelables (SMEE’10) Bou Ismail Tipaza 2010, 31, 205–213. [Google Scholar]
- Akinsipe, O.C.; Moya, D.; Kaparaju, P. Design and economic analysis of off-grid solar PV system in Jos-Nigeria. J. Clean. Prod. 2021, 287, 125055. [Google Scholar] [CrossRef]
- Dakkak, M.; Hirata, A.; Muhida, R.; Kawasaki, Z. Operation strategy of residential centralized photovoltaic system in remote areas. Renew. Energy 2003, 28, 997–1012. [Google Scholar] [CrossRef]
- Ahmad, G. Photovoltaic-powered rural zone family house in Egypt. Renew. Energy 2002, 26, 379–390. [Google Scholar] [CrossRef]
- Celik, A.N.; Muneer, T.; Clarke, P. Optimal sizing and life cycle assessment of residential photovoltaic energy systems with battery storage. Prog. Photovolt. Res. Appl. 2008, 16, 69–85. [Google Scholar] [CrossRef]
- Duffie, J.; Beckman, W.A. Solar Engineering of Thermal Processes, 4th ed.; John Wiley & Sons: Hoboken, NJ, USA, 2013. [Google Scholar]
- Guney, I.; Onat, N. Cost calculation algorithm for photovoltaic systems. Paths Sustain. Energy 2010, 6, 211. [Google Scholar]


| No. of Lamps | Type of Lamps | Wattage Rating | Width of Road | Required Lux Level | Spacing between Poles |
|---|---|---|---|---|---|
| 285 | HPS | 400 W | 6 m | 60 lux | 30 m |
| Sl. No: | Max.Rated Power (W) | Max.Light Output (lumens) | No: of LEDs | Total Wattage (W) | Difference in Wattage | Monthly Energy Savings (kWh) (Approx) |
|---|---|---|---|---|---|---|
| 1 | 3 | 283 | 36 | 108 | 292 | 108,624 |
| 2 | 6 | 777 | 13 | 78 | 322 | 119,784 |
| 3 | 10 | 1175 | 9 | 90 | 310 | 115,320 |
| 4 | 5 | 629 | 16 | 80 | 320 | 119,040 |
| Month | No: of Days | Load (kWh) HPS Lamp | Load (kWh) LED Lamp |
|---|---|---|---|
| Jan | 31 | 42,408 | 8481.6 |
| Feb | 28 | 38,304 | 7660.8 |
| Mar | 31 | 42,408 | 8481.6 |
| Apr | 30 | 34,200 | 6840 |
| May | 31 | 35,340 | 7068 |
| Jun | 30 | 34,200 | 6840 |
| Jul | 31 | 35,340 | 7068 |
| Aug | 31 | 35,340 | 7068 |
| Sep | 30 | 34,200 | 6840 |
| Oct | 31 | 42,408 | 8481.6 |
| Nov | 30 | 41,040 | 8208 |
| Dec | 31 | 42,408 | 8481.6 |
| Annual kWh= | 457,596 | 91,519.2 |
| Parameter Considered | Value | |
|---|---|---|
| Annual Energy Savings | Electricity Cost | $0.078 per kWh |
| Annual energy cost with HPS lamp | Total kWh consumed per year × cost per kWh = 457,596 × 0.078 = $35,692.488 | |
| No. of HPS lamps replaced per year | 100 | |
| Replacement/maintenance cost of 1 HPS lamp | $65.80 | |
| Annual maintenance cost of the HPS lamps | = 100 × 65.80 = $6580 | |
| Annual energy consumed by LED lamp | 91,519.2 kWh | |
| Annual energy cost with LED lamp | = 91,519.2 × 0.078 = $7138.5 | |
| Annual savings in energy cost possible by the replacements of HPS lamps with the LED lamps | = 35,692.488 − 7138.5 = $28,554 | |
| Maintenance cost of the LED lamps | 0 | |
| Annual savings in the maintenance cost on lamp replacement | $ 6580 | |
| Total saving in the energy and maintenance cost | = 28,554 + 6580 = $35,134 | |
| Initial Investment | Cost of LED lamp with 80 watts (120 lm/watt) | $81.8 |
| Cost of 285 LED lamps | $23,313 | |
| Shipping charges from China to Oman | $300 | |
| Labour cost for replacement per lamp | $32.51 | |
| Labour cost for replacing 285 lamps | $9265.35 | |
| Initial investment | = Cost of lamp + shipping cost + labour cost = $32,878.35 |
| Year | Amount | Discounted Cash Flow | Cum.Sum |
|---|---|---|---|
| 0 | −32,878.35 | −32,878.35 | −32,878.35 |
| 1 | 35,134 | 32,531.48148 | −346.8685185 |
| 2 | 35,134 | 30,121.74211 | 29,774.87359 |
| 3 | 35,134 | 27,890.50196 | 57,665.37555 |
| 4 | 35,134 | 25,824.53885 | 83,489.9144 |
| 5 | 35,134 | 23,911.61004 | 107,401.5244 |
| 6 | |||
| 7 | Payback= | 1.011515553 |
| Parameter Considered | Value |
|---|---|
| CO2 emission per kWh from CCGT | = 0.30/0.45 × 400 g =267 g/kWh |
| Total MW generated | 10,335 MW |
| OCGT contribution | 18.8% |
| CCGT contribution | 81.18% |
| Annual energy consumption for the HPS lamp | 457,596 kWh |
| Annual energy consumption for LED lamp | 91,519.2 kWh |
| Difference in kWh when HPS lamp is replaced with LED lamp | 366,076.8 kWh |
| CO2 emissions reduced | = 106,876,341.4 g |
| NOCT (°C) | Tc ref (°C) | β (%/K) | ηpv ref (%) | Area PV (m2) | ηinv (%) | ηwire (%) |
|---|---|---|---|---|---|---|
| 45 | 25 | 0.38 | 20.1 | 2.162 | 95 | 98 |
| Month | Esun (Wh/m2/day) | Ta (°C) | Sunshine hrs |
|---|---|---|---|
| Jan | 6210 | 20.6 | 10.8 |
| Feb | 6630 | 21.3 | 11.4 |
| Mar | 6290 | 24.3 | 12 |
| Apr | 6500 | 28.3 | 12.7 |
| May | 6370 | 32.1 | 13.2 |
| June | 7310 | 33.9 | 13.5 |
| July | 6370 | 33.8 | 13.4 |
| Aug | 6120 | 32.9 | 12.9 |
| Sep | 6440 | 30.8 | 12.3 |
| Oct | 6700 | 28.2 | 11.6 |
| Nov | 6970 | 24.9 | 11 |
| Dec | 6320 | 22.2 | 10.7 |
| Month | G(t) (W/m2) | Tc(t) (°C) | ηpv | Emod (KW) |
|---|---|---|---|---|
| Jan | 575 | 34.975 | 0.193381095 | 2.54441168 |
| Feb | 581.5789 | 39.47434 | 0.189944498 | 2.457214931 |
| Mar | 524.1667 | 40.68021 | 0.189023457 | 2.319899904 |
| Apr | 511.811 | 44.29409 | 0.186263171 | 2.362344594 |
| May | 482.5758 | 47.18049 | 0.18405854 | 2.287695959 |
| June | 541.4815 | 50.8213 | 0.181277694 | 2.585619681 |
| July | 475.3731 | 48.65541 | 0.182931998 | 2.273693966 |
| Aug | 474.4186 | 47.72558 | 0.183642201 | 2.192940314 |
| Sep | 523.5772 | 47.16179 | 0.184072826 | 2.313014989 |
| Oct | 577.5862 | 46.24957 | 0.184769579 | 2.41550629 |
| Nov | 633.6364 | 44.70114 | 0.185952272 | 2.528932091 |
| Dec | 590.6542 | 40.65794 | 0.189040462 | 2.331174316 |
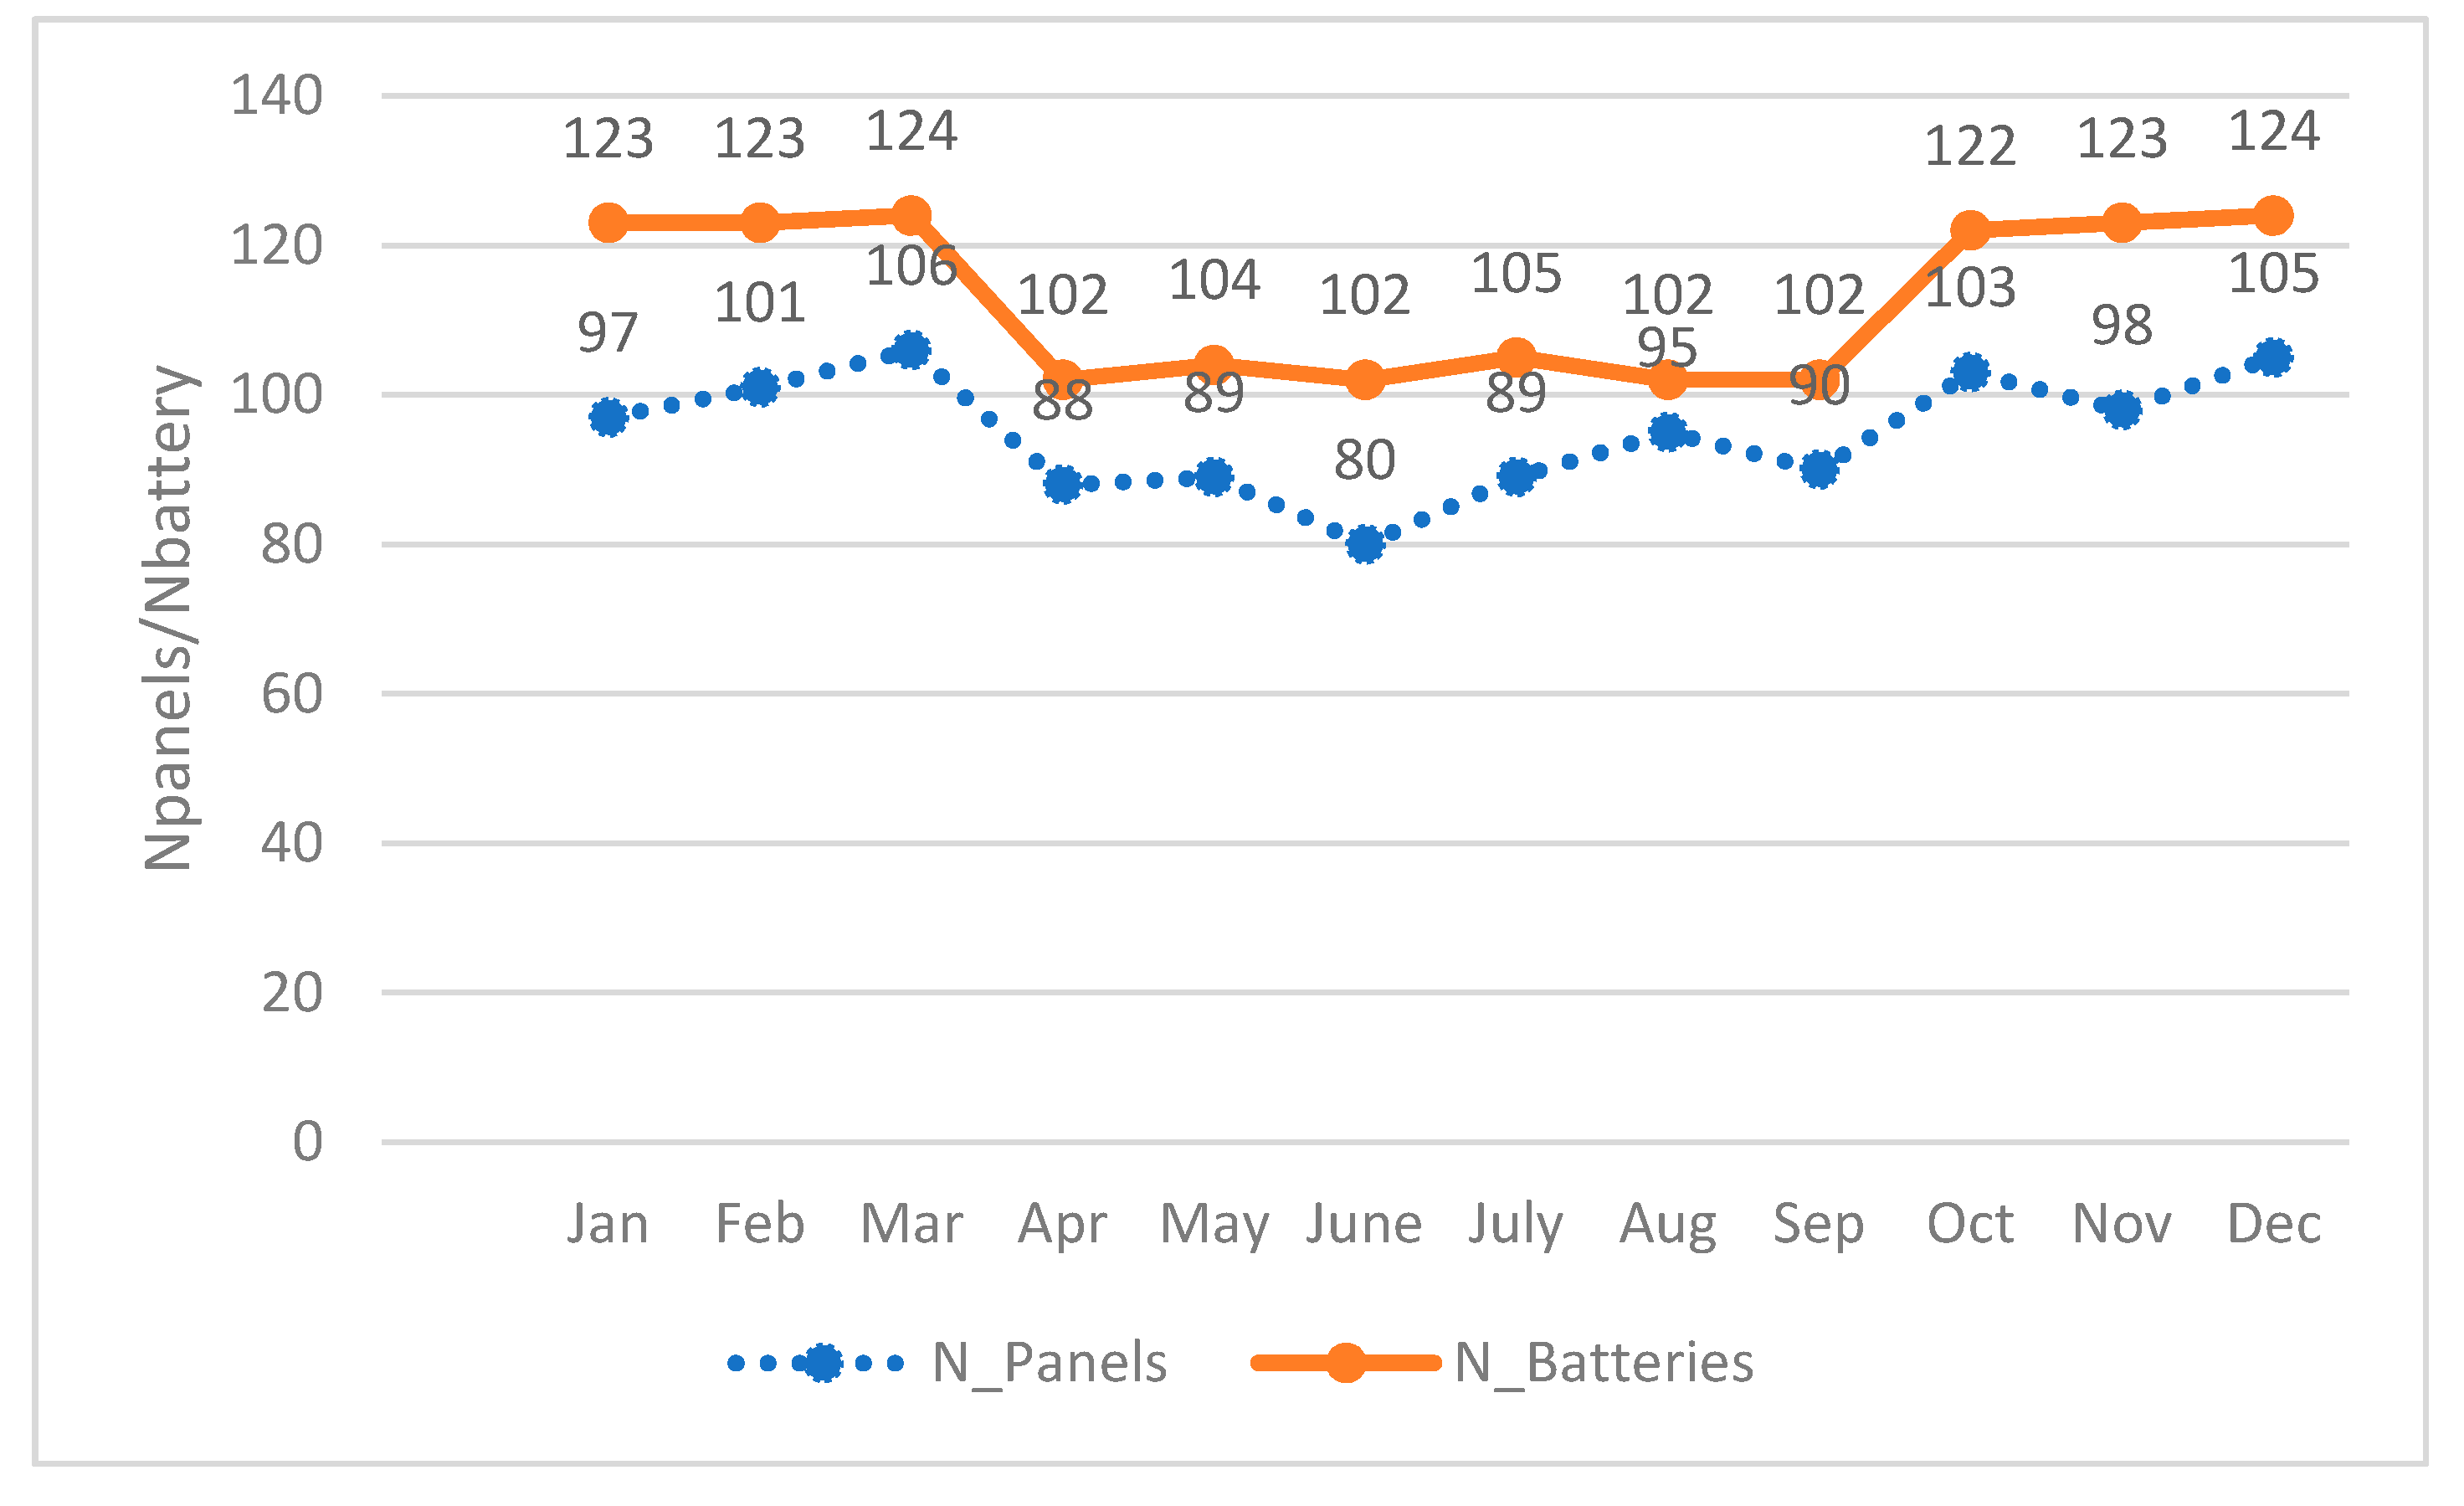
| Month | Npanel | Nbattery |
|---|---|---|
| Jan | 97 | 123 |
| Feb | 101 | 123 |
| Mar | 106 | 124 |
| Apr | 88 | 102 |
| May | 89 | 104 |
| June | 80 | 102 |
| July | 89 | 105 |
| Aug | 95 | 102 |
| Sep | 90 | 102 |
| Oct | 103 | 122 |
| Nov | 98 | 123 |
| Dec | 105 | 124 |
| Parameter Considered | Value |
|---|---|
| Maximum number of panels from the optimized results | 106 |
| Cost per panel, quoted ($0.268 per watt) | $ 117.92 |
| Cost for 106 panels, including shipping | $ 13,050 |
| Optimized no. of batteries | 124 |
| Cost per battery, quoted | $ 160 |
| Cost for 124 batteries, including shipping | $ 20,440 |
| Inverter rating | 1.2 × 80 × 245 = 23,520 W |
| Inverter cost, quoted | $ 2170.5 |
| Inverter cost, including shipping | $ 2320.5 |
| Battery charge controller cost, quoted | $ 1123 |
| Battery charge controller cost, including shipping | $ 1373 |
| Auxiliaries cost | $ 7488.6 |
| Total cost of PV system | $ 44,072 |
Publisher’s Note: MDPI stays neutral with regard to jurisdictional claims in published maps and institutional affiliations. |
© 2021 by the authors. Licensee MDPI, Basel, Switzerland. This article is an open access article distributed under the terms and conditions of the Creative Commons Attribution (CC BY) license (https://creativecommons.org/licenses/by/4.0/).
Share and Cite
George Allwyn, R.; Al Abri, R.; Malik, A.; Al-Hinai, A. Economic Analysis of Replacing HPS Lamp with LED Lamp and Cost Estimation to Set Up PV/Battery System for Street Lighting in Oman. Energies 2021, 14, 7697. https://doi.org/10.3390/en14227697
George Allwyn R, Al Abri R, Malik A, Al-Hinai A. Economic Analysis of Replacing HPS Lamp with LED Lamp and Cost Estimation to Set Up PV/Battery System for Street Lighting in Oman. Energies. 2021; 14(22):7697. https://doi.org/10.3390/en14227697
Chicago/Turabian StyleGeorge Allwyn, Rona, Rashid Al Abri, Arif Malik, and Amer Al-Hinai. 2021. "Economic Analysis of Replacing HPS Lamp with LED Lamp and Cost Estimation to Set Up PV/Battery System for Street Lighting in Oman" Energies 14, no. 22: 7697. https://doi.org/10.3390/en14227697
APA StyleGeorge Allwyn, R., Al Abri, R., Malik, A., & Al-Hinai, A. (2021). Economic Analysis of Replacing HPS Lamp with LED Lamp and Cost Estimation to Set Up PV/Battery System for Street Lighting in Oman. Energies, 14(22), 7697. https://doi.org/10.3390/en14227697