Article

Geochemical Investigation of CO2 Injection in Oil and Gas Reservoirs of Middle East to Estimate the Formation Damage and Related Oil Recovery

1
Department of Mechanical Engineering, College of Engineering, Khalifa University, Abu Dhabi P.O. Box 12277, United Arab Emirates
2
Department of MACE, School of Engineering, The University of Manchester, Manchester M13 9PL, UK
*
Author to whom correspondence should be addressed.
Energies 2021, 14(22), 7676; https://doi.org/10.3390/en14227676
Submission received: 4 October 2021 / Revised: 23 October 2021 / Accepted: 29 October 2021 / Published: 16 November 2021

Abstract

:
The injection performance of carbon dioxide (CO2) for oil recovery depends upon its injection capability and the actual injection rate. The CO2–rock–water interaction could cause severe formation damage by plugging the reservoir pores and reducing the permeability of the reservoir. In this study, a simulator was developed to model the reactivity of injected CO2 at various reservoir depths, under different temperature and pressure conditions. Through the estimation of location and magnitude of the chemical reactions, the simulator is able to predict the effects of change in the reservoir porosity, permeability (due to the formation/dissolution) and transport/deposition of dissoluted particles. The paper also presents the effect of asphaltene on the shift of relative permeability curve and the related oil recovery. Finally, the effect of CO2 injection rate is analyzed to demonstrate the effect of CO2 miscibility on oil recovery from a reservoir. The developed model is validated against the experimental data. The predicted results show that the reservoir temperature, its depth, concentration of asphaltene and rock properties have a significant effect on formation/dissolution and precipitation during CO2 injection. Results showed that deep oil and gas reservoirs are good candidates for CO2 sequestration compared to shallow reservoirs, due to increased temperatures that reduce the dissolution rate and lower the solid precipitation. However, asphaltene deposition reduced the oil recovery by 10%. Moreover, the sensitivity analysis of CO2 injection rates was performed to identify the effect of CO2 injection rate on reduced permeability in deep and high-temperature formations. It was found that increased CO2 injection rates and pressures enable us to reach miscibility pressure. Once this pressure is reached, there are less benefits of injecting CO2 at a higher rate for better pressure maintenance and no further diminution of residual oil.

1. Introduction

The emission of carbon dioxide (CO2) can be reduced by injecting CO2 in the subsurface geological structures, such as oil and gas reservoirs, coal seams, organic rich shale and saline aquifers. The technology to sequester and store CO2 in these structures has the potential to reduce carbon dioxide emissions [1,2]. Additionally, the sequestration of CO2 in depleted oil and gas reservoirs could assist in environmental protection with a surplus benefit of additional oil recovery. However, it is crucial to analyze that the injected CO2 is stored in a safe and sustainable way. Furthermore, if system conditions are not properly taken into consideration, then CO2 injection could actually reduce the gas productivity. Thus, in the current analysis, the integrity of over- and underlying rocks, conditions and reliability of the wellbore casing, as well as the cement that bonds the casing with the rock, were taken into consideration. It is also important to examine the compatibility of the CO2 injection with the host reservoir rock and fluid; if incompatible, this could lead to formation damage. Formation damage is the impairment of the reservoir permeability and porosity that is irreversible. This damage occurs when the injected CO2 reacts with the rock and/or with the reservoir fluid, leading to formation dissolution and precipitation of dissoluted rock particles and dissolved ions. Other possible causes of formation damage could be operational conditions, formation of gases, deposition of insoluble organic solids, etc. Thus, it is important to determine the causes and reasons that lead to the formation damage due to geochemical, physiochemical, hydrodynamic, thermal and mechanical processes [3,4].
CO2 can be injected in the reservoir at either miscible or immiscible conditions. At miscible conditions, the CO2 is at supercritical conditions with a temperature of 31.1 °C and at a pressure 1078 psi. At these conditions, CO2 has the most desirable properties, as it mixes the way a gas does, but its density is that of a liquid. Thus, CO2 displaces the trapped oil from the pores of the reservoir rock, leading to an enhanced oil recovery (EOR). Although a number of gases are tested in several experimental studies, CO2 remains the most potential candidate with the capability to reduce residual oil saturation with significant amount of oil recovery [5]. The returns of CO2 injection are quite encouraging; however, the storage and sequestration of CO2 in depleted oil and gas reservoirs poses a number of challenges related to reservoir engineering, such as high mobility and geochemical reactions that lead to formation damage. The geochemical interaction of CO2 with the reservoir rock and fluids could cause severe formation damage and could adversely affect the reservoir structural injectivity.
Wang et al. [6] showed that certain impurities in CO2 that are condensable can increase its storage. However, non-condensable impurities could enhance the buoyancy of CO2. The impact of high-temperature supercritical CO2 was studied by André et al. [7], and they determined its geochemical reactivity in a carbonate reservoir containing high saline brine. The precipitation of salt during CO2 injection was modeled by Zeidouni et al. [8] in a saline aquifer, and they estimated the effect of salt deposition. The dynamics and precipitation of solid particles in porous media were examined by Sbai and Azaroual [9], and they found that the solid particulates could cause pore plugging. The various geochemical reactions and reactive modeling of CO2 injection were modeled by Gaus et al. [10], and they reported that the injection of CO2 could lead to the dissolution of carbonate formation, as the injection of CO2 causes the brine to become acidized. This acidized brine could cause formation dissolution, leading to an increase in the reservoir porosity in the near wellbore regions. It can also lead to precipitation of the dissoluted carbonate mineral particles in the regions away from the injection well [11,12,13,14]. Overall, the injection of CO2 into a depleted oil and gas reservoir could cause the following issues:
  • Dissolution of carbonate rock by carbonic acid resulting in carbonate precipitation or fingering aggravating;
  • Dissolution of calcium sulfate or barium sulfate;
  • Attack by carbonic acid on feldspar forming clay minerals or on the rock cementing materials;
  • Formation of insoluble organic particulates mainly asphaltenes and the formation of immobile gas that may reduce the effective permeability to oil and water.
Therefore, in this study, the mentioned factors were coupled with each other, and we investigated the various consequences of CO2 injection. It is important to mention that these factors could reduce the oil and gas productivity and CO2 injectivity in the reservoir. Additionally, the carbonates are more prone to formation damage than sandstones. As the reservoirs in the Middle East are usually carbonate reservoirs, the injection of CO2 in Middle Eastern reservoirs needs a detailed analysis not only to reduce formation damage but also to adopt practices, which could enhance the recovery of oil and increase the sequestration, storage and capture of CO2. Therefore, in this research, we developed a simulator that solves the governing equations of fluid flow, geochemical reactivity, particle transport and particles deposition to determine the recovery of oil considering the modified relative permeability curve due to the deposition of asphaltene. This approach helps to estimate the net magnitude of formation damage caused by the injection of CO2 in carbonates, especially the ones found in the Middle Eastern region. Moreover, with the developed simulator, we also modeled the reactivity of injected gas in a reservoir at both low and high CO2 temperatures, with varying reservoir conditions, such as depth, temperature and pressure. The simulation not only estimates the location and magnitude of the chemical reactions but also determines the total change in reservoir porosity and permeability due to the formation dissolution, transport of dissoluted particles and their deposition on deposited asphaltene. The paper also presents the effects of asphaltene on the shift of relative permeability curve on oil recovery. At the end of the paper, the analysis of the CO2 injection rate is presented to show the effect of CO2 miscibility on oil recovery from a reservoir.
The layout of the current paper is as follows. The model development and its details, model validation/justification is provided in Section 2. This is followed by results and discussions in Section 3. Then the paper is concluded in Section 4.

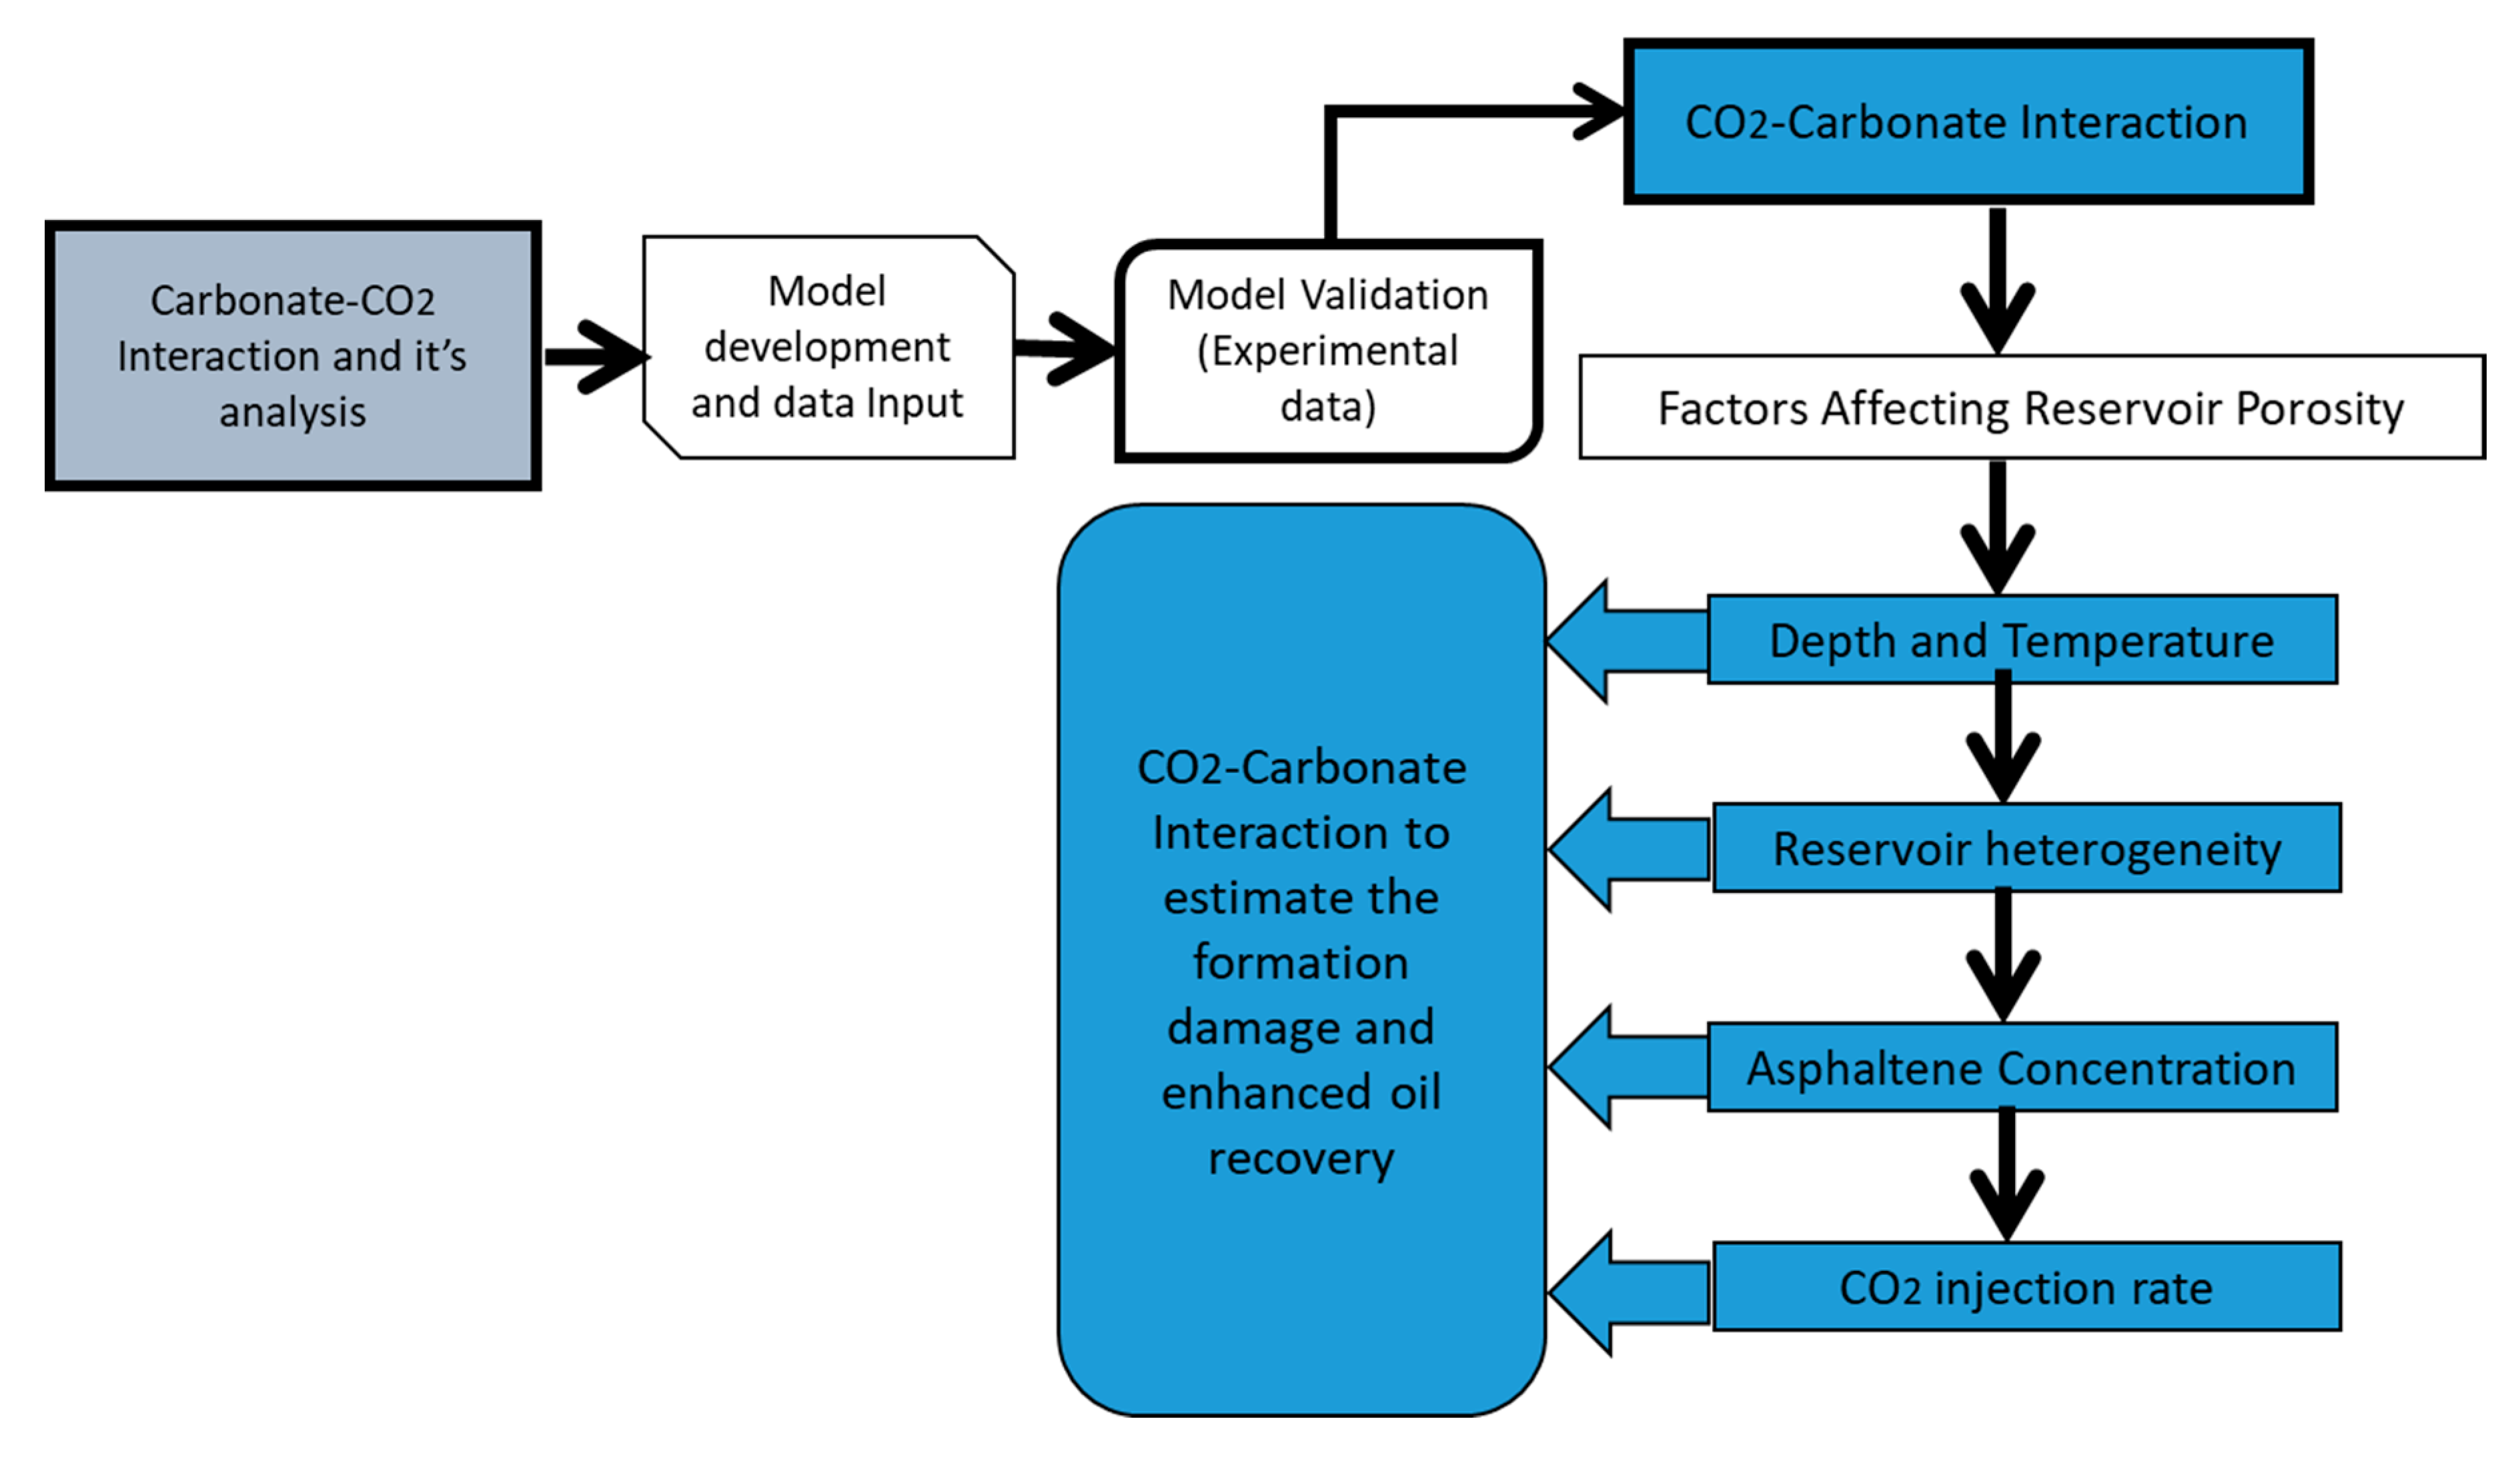
2. Model Description

To model the injection of CO2 in a depleted oil reservoir and to the increase the oil recovery of oil, we considered a model with radial coordinates at the center of a substantially large hydrocarbon reservoir. The CO2 is injected through a wellbore in the reservoir with the arrangement shown in the Figure 1. The figure describes various CO2-rock dissolution reactions in respective zones.
Zone 1: Away from the injection well in the reservoir, where the reservoir fluids have not interacted with the CO2, only the in situ reservoir fluid exists in Zone 1.
Zone 2: Behind Zone 1 of reservoir fluid region exists Zone 2, where various components are found. At a certain point in Zone 2 (region of dissolution), the CO2/carbonated water moves slowly and dissoluted particles might precipitate depending on the time needed by the particle to attain terminal velocity.
Zone 3: Further, in the direction of the injection well, the concentration of CO2 increases and injected CO2 comes in contact with formation brine. The chemical interaction between brine and CO2 leads to the formation of carbonic acid (acidic carbonic water). This reactive fluid reacts with formation leading to formation dissolution.
The flow of CO2 in the reservoir is governed by the various continuity equations for oil, gas and aqueous phases that read respectively as follows:
( ρ o u o w o ) r + ( A ϕ ρ o S o w o ) t = 0
( ρ g u g w g ) r + ( A ϕ ρ g S g w g ) t = 0
( ρ a u a w a ) r + ( A ϕ ρ a S a w a ) t = 0
The summation of Equations (1)–(3) gives the following:
r ( ρ o u o w o + ρ g u g w g + ρ a u a w a ) = t ( A ϕ ρ o S o w o + A ϕ ρ g S g w g + A ϕ ρ a S a w a )    
After neglecting diffusion, the equation for all the phases can be written as follows:
r ( ρ o ω C O 2 , o u o w o + ρ g ω C O 2 , g u g w g + ρ a ω C O 2 , a u a w a ) = t ( A ϕ ρ o ω C O 2 , o S o w o + A ϕ ρ g ω C O 2 , g S g w g + A ϕ ρ a ω C O 2 , a S a w a )    
While considering constant rock porosity and injection rate, Equation (5) can be rewritten as follows:
q i n j A ϕ r ( ρ o ω C O 2 , o u o w o + ρ g ω C O 2 , g u g w g + ρ a ω C O 2 , a u a w a )   = t ( ρ o ω C O 2 , o S o w o + ρ g ω C O 2 , g S g w g + ρ a ω C O 2 , a S a w a )
Thus, the equation of mass balance during production is given as follows:
t ( S l ρ a s X a s ϕ + S l ρ l w a s ϕ ) = ( ρ a s V a s t + t ( ρ l w a s p v l + ρ l w a s v l ) )
where S is the saturation fraction, ρ is the density in g/cm3, X is the concentration of asphaltene, ϕ the porosity in fraction, v the fluid flow in m/s, w the mole concentration, V the deposited concentration and t the time in seconds. The subscripts o, l, g, aq, as and asp refer to oil, liquid, gas, aqueous, asphaltene and suspended asphaltene, respectively. To model the reactions that might take place in the reservoir after continuous CO2 injection, it is important to define the physics of the reactions process correctly. The injected CO2 reacts with the reservoir water and forms carbonic water (acid). This acidic fluid reacts with the carbonate rock, and after dissolution of carbonate, it disintegrates the solid carbonate rock into fine particulates. Simultaneously, the carbonic acid formed with the geochemical reactions of CO2 and brine dissociates and creates bicarbonate ions. These ions, after dissociation, form carbonate ion; these continuous reactions could lead to the creation and precipitation of scales/particulates. The relationships between injected CO2, brine, calcium ions, carbonate ions, bicarbonate ions and carbonate particles are given in Table 1. The list of reactions shown in Table 1 shows the solubility product and the equilibrium constant for different chemical reactions. We assumed that the considered rock is pure calcite. It is important to mention that the values of these equilibrium constants for the independent fluid species are assumed equal to unity. The utilized equilibrium constants/solubility products are as follows.

2.1. Effect of Temperature and Pressure

The analytical Van’t Hoff equation could be used to calculate the equilibrium constants and its dependency on temperature [15] and reads as follows:
L o g K T = L o g K 298 Δ H s   298 0 2.3025 R [ 1 T 1 298.15 ]
where ΔHs is the standard change in enthalpy of the geochemical reaction. The analytical formula to determine the temperature dependence ( L o g K ) for a certain reaction is given as follows:
L o g 10 K = A 1 + A 2 T + A 3 T + A 4 L o g 10 T + A 5 T 2 + A 6 T 2
where T is the temperature in kelvin, and A 1 , A 2 , A 3 , A 4 , A 5 and A 6 are all constants. The solubility products of minerals and reaction constant for different species are described as a function of pressure, P , by the following relationship:
L o g K P = L o g K P = 1 Δ V e 2.303 R T ( P 1 ) .  
where V e . is the volume change in cm3/mol. However, the Van’t Hoff equation has some limitations; for instance, it is not applicable for very slow reactions, very fast reactions and reactions that occurs at high-temperature reactions. Thus, for such conditions, the temperature dependency could be calculated by the Arrhenius equation, which is given as follows:
k = k o e E a R T
where R is the universal gas constant, and E a   . is the activation energy and it could be empirically determined by the following equation:
E a = 2.3 ln ( k T 2 k T 1 ) R T 1 T 2 T 2 T 1 .  
where k T 1 and k T 2 are the empirically determined reaction rate coefficients for the different temperature, such as T1 and T2, respectively. For reversible reactions, the rate for these reactions depends on the concentration of reactants and products. Moreover, for geochemical reactions during CO2 injection, as depicted in Table 1, the concentration of products in these reactions depends on velocity of CO2 injected in the reservoir, and it can be calculated by the Peclet and Damkohler numbers. The Peclet number is the ratio of fluid transport by convection to transport by dissolution, and the Damkohler number is the ratio of net rate of formation dissolution by acid to the rate of convective transport by acid injection. Therefore, the numerical models with kinetic laws are used to access the impact of these geochemical reactions. As a result, we utilized the Arrhenius equation for the forward and the back reactions, as given by the following equation [4].
Y t = K f v e E / R T K b e E / R T v
where Y is the reaction rate per unit time that would occur in the reservoir, ν is the CO2 injection rate and the subscripts f and b present the forward and the backward geochemical reactions, respectively. The negative sign represents the precipitation. Table 2 provides the values of these reaction coefficients.
It is assumed that the clay/carbonate particles after disintegration are transported to the point of deposition by advection rather than diffusion as reported by Robinson and Gluyas [16]; advection transports particles along large distances rather than diffusion. Schneider [17] observed that the dissolution process depends on various factors, including pressure, temperature and the pH value. The process of dissolution or formed carbonate particle deposition requires certain activation energy, where the motion of these particles is defined by the following equation given by Sharma et al. [18]:
C s t x [ C s D c ( x ) E p x + F ( x ) C s x ] = 0
Here C s is the concentration of particles in suspension, E p is the potential energy, D c is the drag coefficient, and F ( x ) is the diffusion coefficient. As mentioned earlier after dissolution, the dissolved calcium is assumed to be transported by advection only. It is important to mention here that diffusion also takes place during this process; however, it is generally ignored, as the scale is negligible (see Canals and Meunier [19]). The CO2 entering the reservoir has a constant flow rate, v, which means that the fluid is forced in the system. In order to estimate the rate of particle deposition, potential energy can be assumed as either attractive or repulsive. Hence, the surface of the reservoir could serve as a sink or a source, respectively. The rate of dissoluted particle deposition per unit time is combined with the rate of clay/carbonate deposition (which is present before the injection of CO2), where the growth rate is defined as follows:
C d t = 2 π d 2 / 3 l 2 / 3 C s   ( r 2 v ) 1 3 f ( r ) d r .  
where C d . is the deposition rate per unit volume, d . is the diffusivity in the pore length l , C s . is the concentration of particles in suspension, r is the pore radius, v the fluid velocity and f(r) the pore size distribution function. This equation considers the concentration of particles in the pores, which makes it different from the particle deposition and release relationship derived by Sharma et al. [18]. Figure 2 shows the flowchart for formation damage analysis for the common carbonates found in the Middle Eastern region. For the presented analysis, the values of different parameters were kept within a certain range that is representative of natural reservoir conditions, as shown in Table 2. When CO2 is injected into the well, it reacts with the oil present in the reservoir, disturbing the phase equilibrium of the reservoir oil, and thus leading to phase separation and eventually deposition of asphaltene (due to chemical interactions of CO2 and oil). Therefore, this study utilized the model developed by Khurshid and Choe [20] to analyze the influence of asphaltene deposition and its consequences during CO2 injection. The phenomenon of asphaltene deposition is given by the following equation:
                            d a s t = K C a s e E / R T J
where d a s is the rate of asphaltene deposition per unit time, K is the CO2–asphaltene reaction rate coefficient, C a s . is the concentration of asphaltene given as a fraction, E is the activation energy in J/mol, R . is the universal gas constant in J/mol·K, T is the temperature in kelvin and J   is the injection in kg/h. Here, the tuning parameters’ were concentration of asphaltene, reservoir porosity, permeability and the flow rate of CO2. These parameters were adjusted to represent typical reservoir conditions.

2.2. Porosity and Permeability Variation
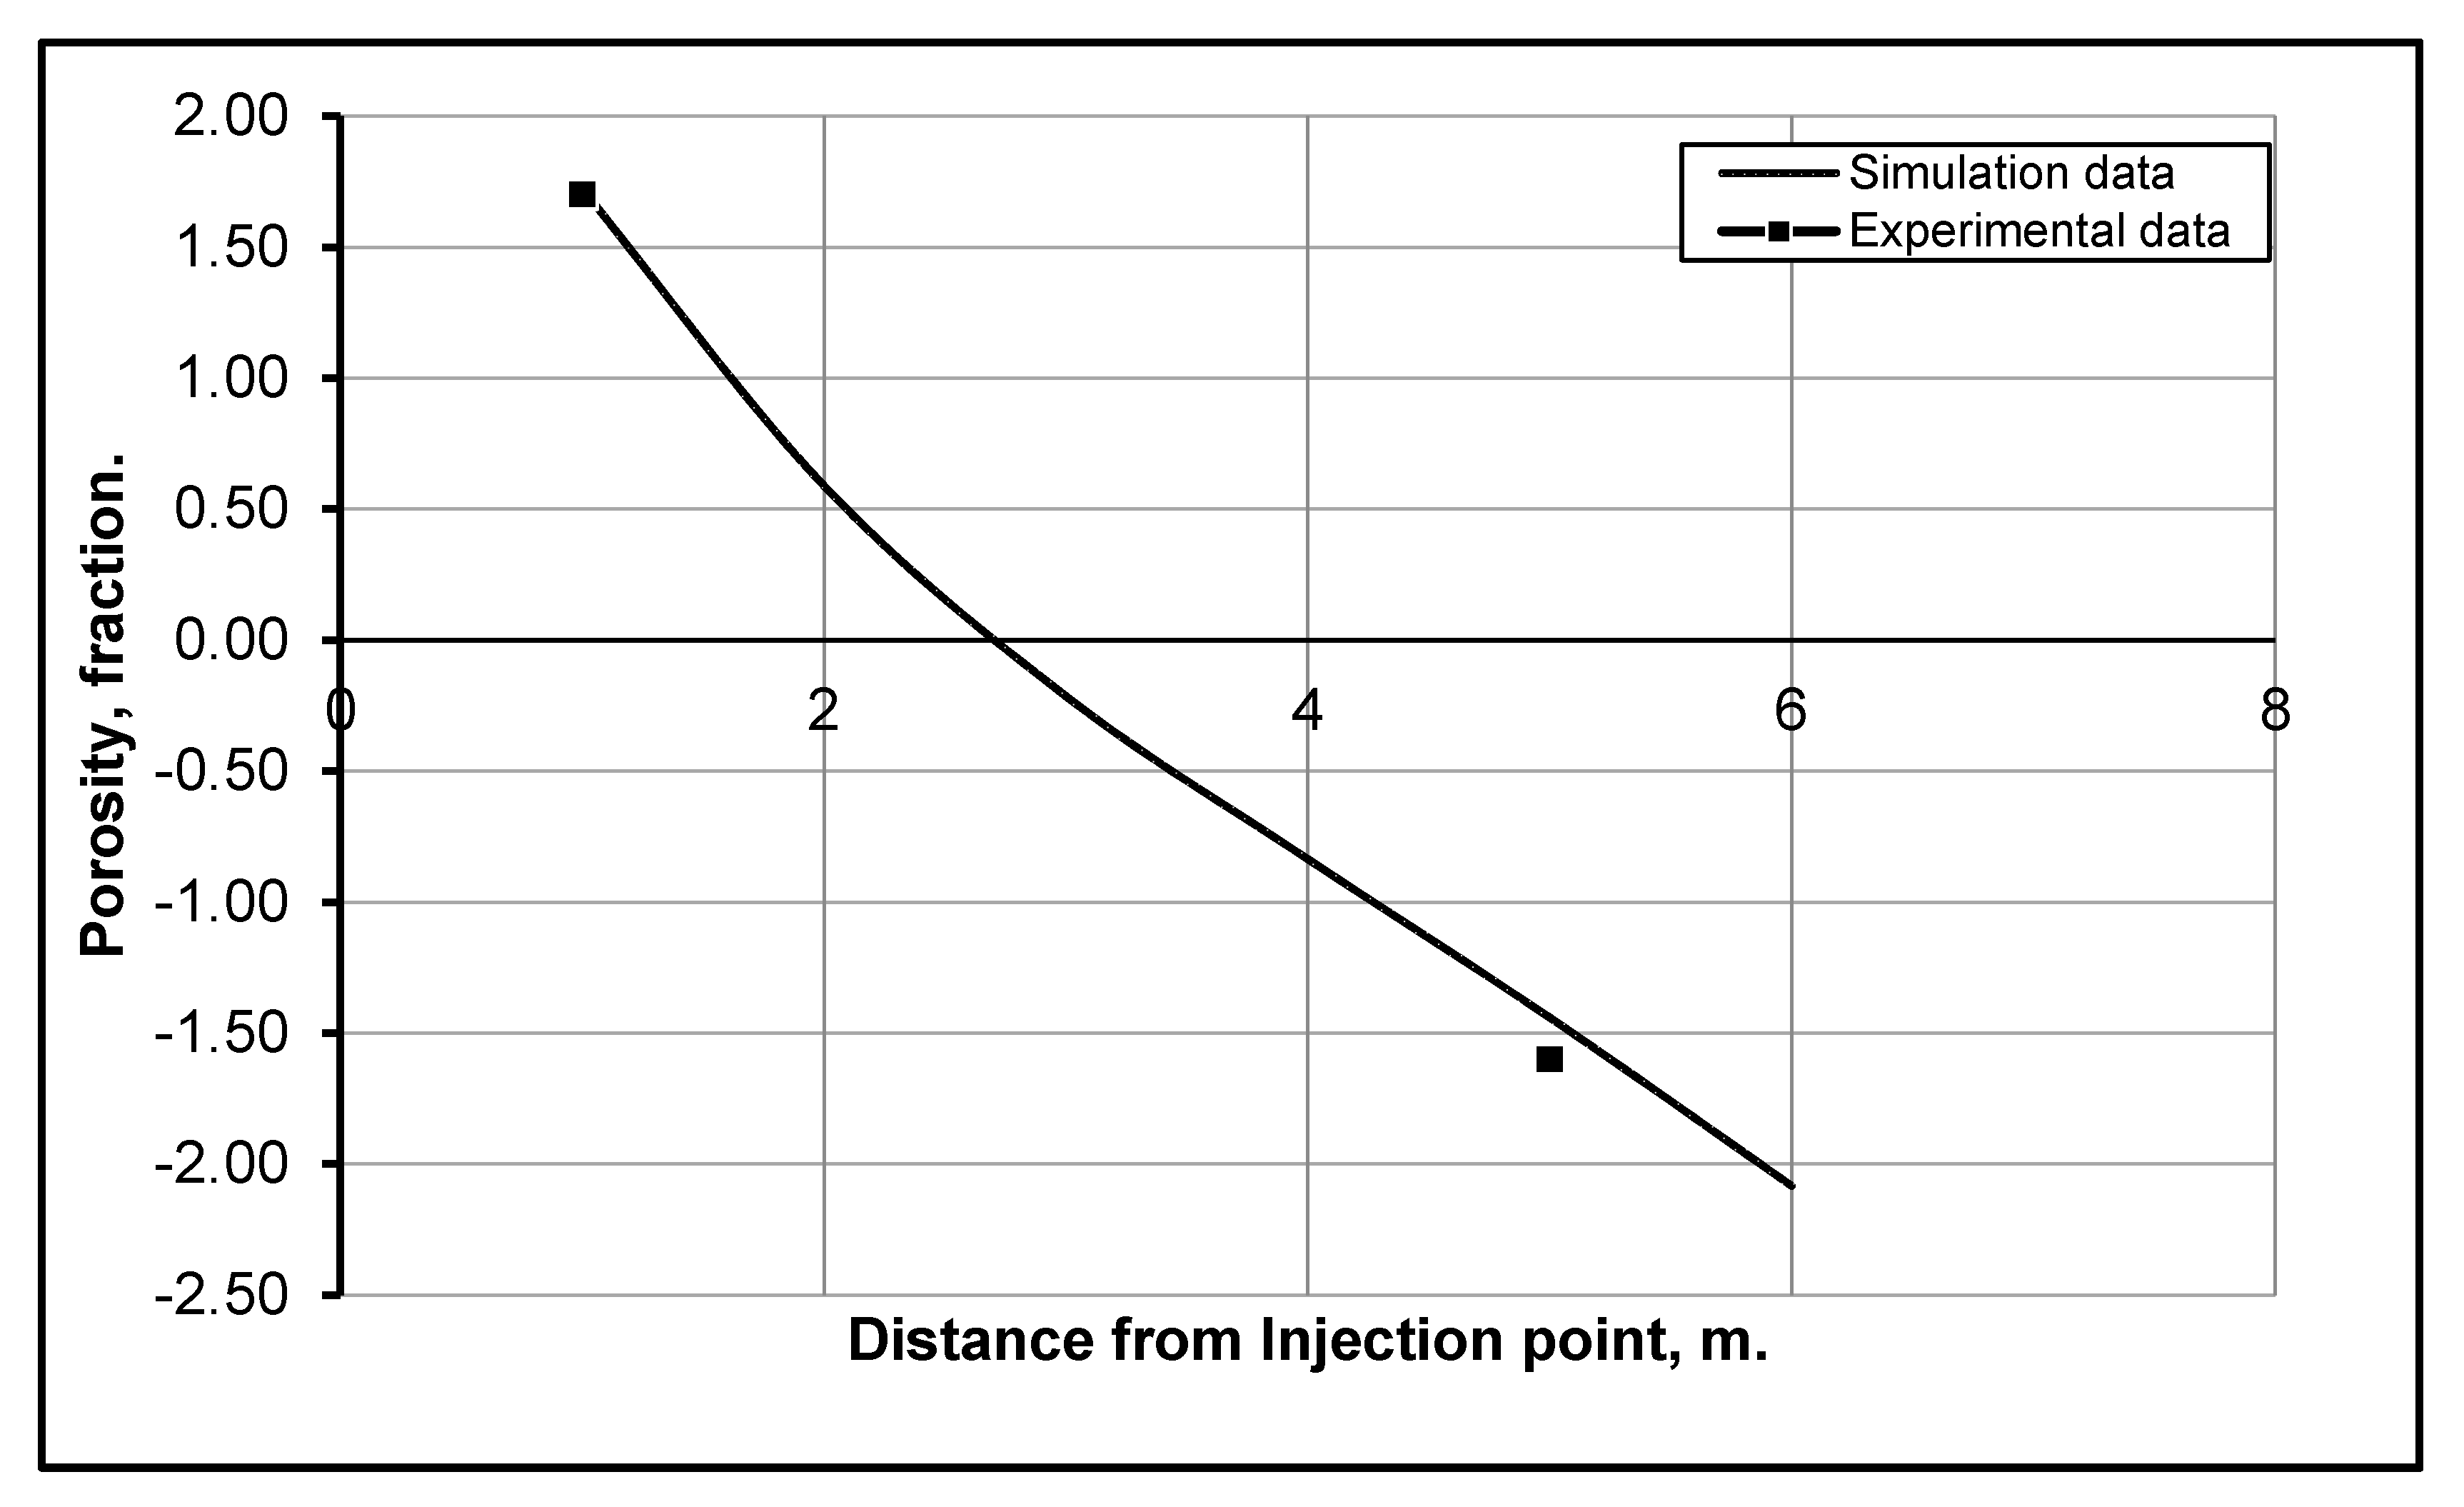
The deposition of dissoluted carbonates particles is estimated by summing up the dissolution and precipitation of all mineral particles. Equation (17) is utilized to calculate the reservoir porosity at each time step:
ϕ n + 1 = ϕ n k n k M w k ρ k V B i = ϕ n k Δ ϕ k .  
where ϕ n + 1 . is the updated porosity, ϕ n   . the initial porosity, n k the change of concentration for solid κ in moles,   M w k the solid molecular weight, ρ k . the density of the κth solid, V B i   . the bulk volume of the ith cell and Δ ϕ k . the change in porosity for the κth solid in fraction.
The dissolution and precipitation of carbonate particles and their scales in the reservoir could affect the porosity and permeability of the carbonate reservoir. This decrease in reservoir permeability is controlled by the location of particle/scale deposition (pores body or pore throats). Therefore, the ratio of permeability change ( k d ) to original permeability ( k i n ) is calculated through the Kozeny–Carman equation given by Reference [21] and reads as follows:
k d k i n = ( ϕ n + 1 ϕ i n ) c ( 1 ϕ i n 1 ϕ n + 1 ) 2
where c is an exponent which could have different values (3, 5 or 12) depending upon the permeability–porosity relationship. For example, an exponent of 3 is used for formations with smooth grains, 5 is used for precipitation of anhydrite in deep aquifers and 12 is usually utilized for coreflood that presents the timescale with dissolved and precipitated particles [21]. In the current analysis, a c value of 3 is chosen as per the original assumption of smooth grains.

2.3. Validation

The sequestration and storage of CO2 is a complex process, as it is influenced by the properties of reservoir rock, reservoir fluid composition, reservoir thermodynamic conditions and the injection rate of CO2. Most of the CO2 flooding experiments in the literature are based on a single core that presents only the near wellbore region. However, in the current paper, we choose the Bacci et al. [22] experimental study to validate the results, as it uses two cores to perform the flooding experiment, which is more representative of the actual reservoir conditions. The first core represents the near wellbore region, and the second core is for the distant wellbore region. The comparison of experimental data with simulation results is shown in Figure 3, where the first three cells of the model correspond to the first core of the experiments, and the remaining cells of the model represent the second core. For a consistent comparison, the numerical pore volume of the injected CO2 was kept the same as that used in the experiments. It can be observed from Figure 3 that the numerical predictions are in close agreement with the experimental measurements, almost the same close to the injection point (at a 1 m distance) and close to each other at a 5 m distance.

3. Results and Discussions

As the developed simulator is used to determine the extent of the formation damage, we therefore used different sets of depths, temperatures, particle sizes and CO2 injection rates; all of them were still within a representative range of naturally occurring conditions. It is presumed that the initial porosity of the reservoir is uniform throughout the reservoir; hence, the reservoir porosity is shown as a horizontal line in all the figures. For a given set of conditions, the simulations were performed for specific time periods and were then monitored for porosity and permeability changes at the end of each simulation. These results are shown and discussed in terms of porosity versus distance from the point of CO2 injection into the reservoir in the next subsections.

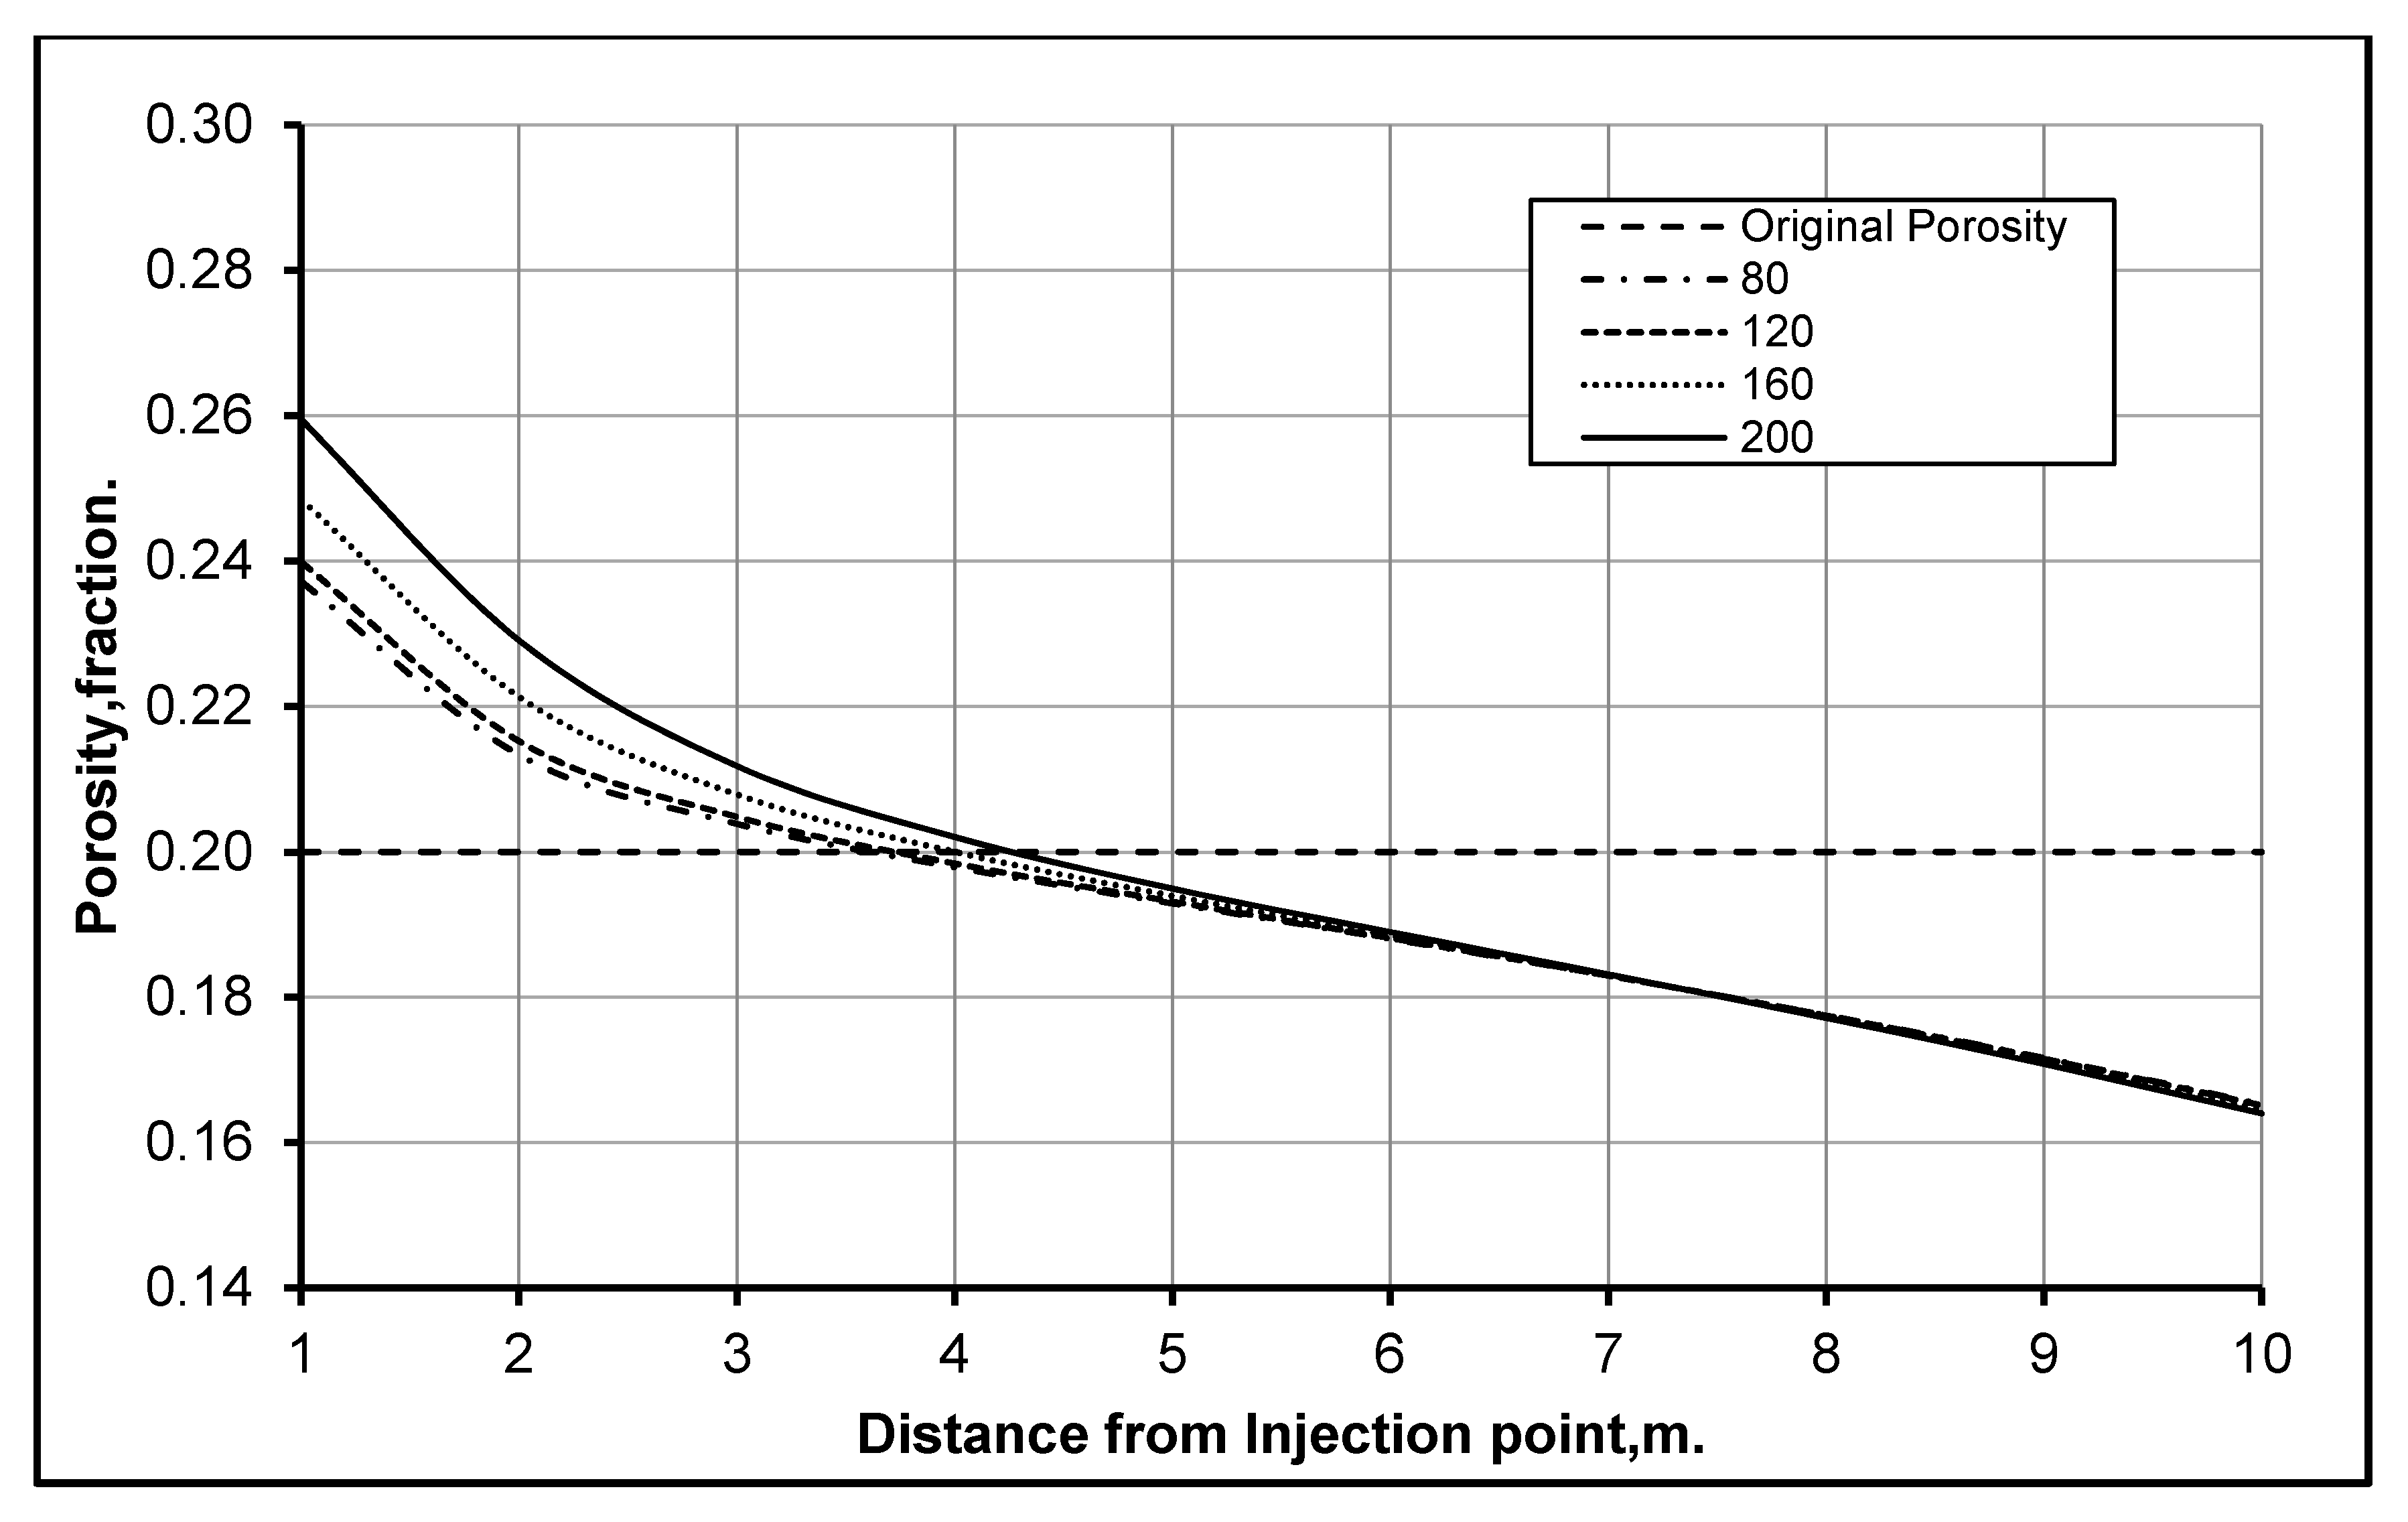
3.1. Effect of Reservoir Depth and Temperature

In CO2 sequestration and EOR, the depth of a reservoir plays a very important role, as both the temperature and pressure are directly dependent upon it. Furthermore, the rates of dissolution and precipitation of particles have different effects on the change in reservoir properties. Therefore, a number of simulations were performed to determine different process/reactions and their intensities to establish a combination of reservoir depths and temperatures where minimum reservoir damage should occur. The reservoir temperature was varied from 40 to 120 °C, in increments of 20 °C, corresponding to depths of 1000, 1800, 2600, 3400 and 4200 m, respectively; this represents a standard geothermal gradient of 0.025 °C/m.
The detailed analysis revealed that both the dissolution rate and the precipitation decrease with an increase in reservoir depth and temperature—highest at a depth of 1000 m at 40 °C (see Figure 4). This finding is consistent with the established understanding that shallow reservoirs show more formation damage than deep ones. The obvious explanation for this is that the chemical reaction taking place in a reservoir depends upon the CO2 solubility in water. As the dissolution reaction for carbonates minerals is an exothermic reaction, they are more soluble in low-temperature conditions; consistent with the conditions of low depth reservoirs. On the other hand, higher temperatures favor the solid phases over dissolved phases; thus, at high temperatures, the process of dissolution slows down due to the exothermic reaction. Furthermore, at low temperatures, the precipitation of clay/carbonate increases after dissolution because solids are less soluble at low temperatures. Increasing the temperature increases the solubility of calcium carbonate in CO2 and vice versa [23,24,25,26,27,28,29]. Khurshid et al. [30] performed geomechanical analysis of formation deformation due to low-temperature CO2 injection in depleted oil reservoirs. They found that the injection of low-temperature CO2 could reduce reservoir thermal stress and initiates reservoir fracturing that could enhance reservoir permeability and oil recovery. However, this low-temperature CO2 injection could compromise the sustainable storage of CO2.
It is therefore concluded that a thorough investigation should be conducted before CO2 injection in shallow reservoirs, as the injection could increase the carbonate dissolution region around the wellbore, leading to the creation of cavities/vugs around the well. These phenomena could increase the geomechanical induced stresses on the wellbore, its casing and tubing, leading to a compromise of the stability of the wellbore or even a complete failure of the casing in the worst-case scenario.

3.2. Effect of Particles Size Heterogeneity

Detrital and diagenetic clay particles in porous media form part of the rock that supports overburden formation loads. The diagenetic clay particles are attached to the walls of the surface of pores and are distributed in the porous media [18]. In order to determine the influence of these particles and the effect of their distribution on formation properties, a normal distribution of homogeneity and heterogeneity of the particles is assumed. The homogeneity and heterogeneity were represented through the standard deviation; a high standard deviation shows heterogeneity, while low values of standard deviation represent homogeneity of the particle size distribution. A total of four cases were simulated with constant mean at 500 but the standard deviations is changed step by step to 80, 120, 160 and 200 to determine the effect of particle size heterogeneity. It is important to mention that all the other variables and boundary conditions were kept constant. Figure 5 shows that the rate of formation dissolution is higher in heterogeneous particles compared to the homogenous particles. The reason behind this high dissolution is that the formation with heterogeneous particles is less porous and has a greater surface area for reaction. Hence, the injected fluid makes contact with the large surface area of the particles and reacts; this leads to high rates of dissolution, as can be observed in the case with the standard deviation of 200 shown in Figure 5.

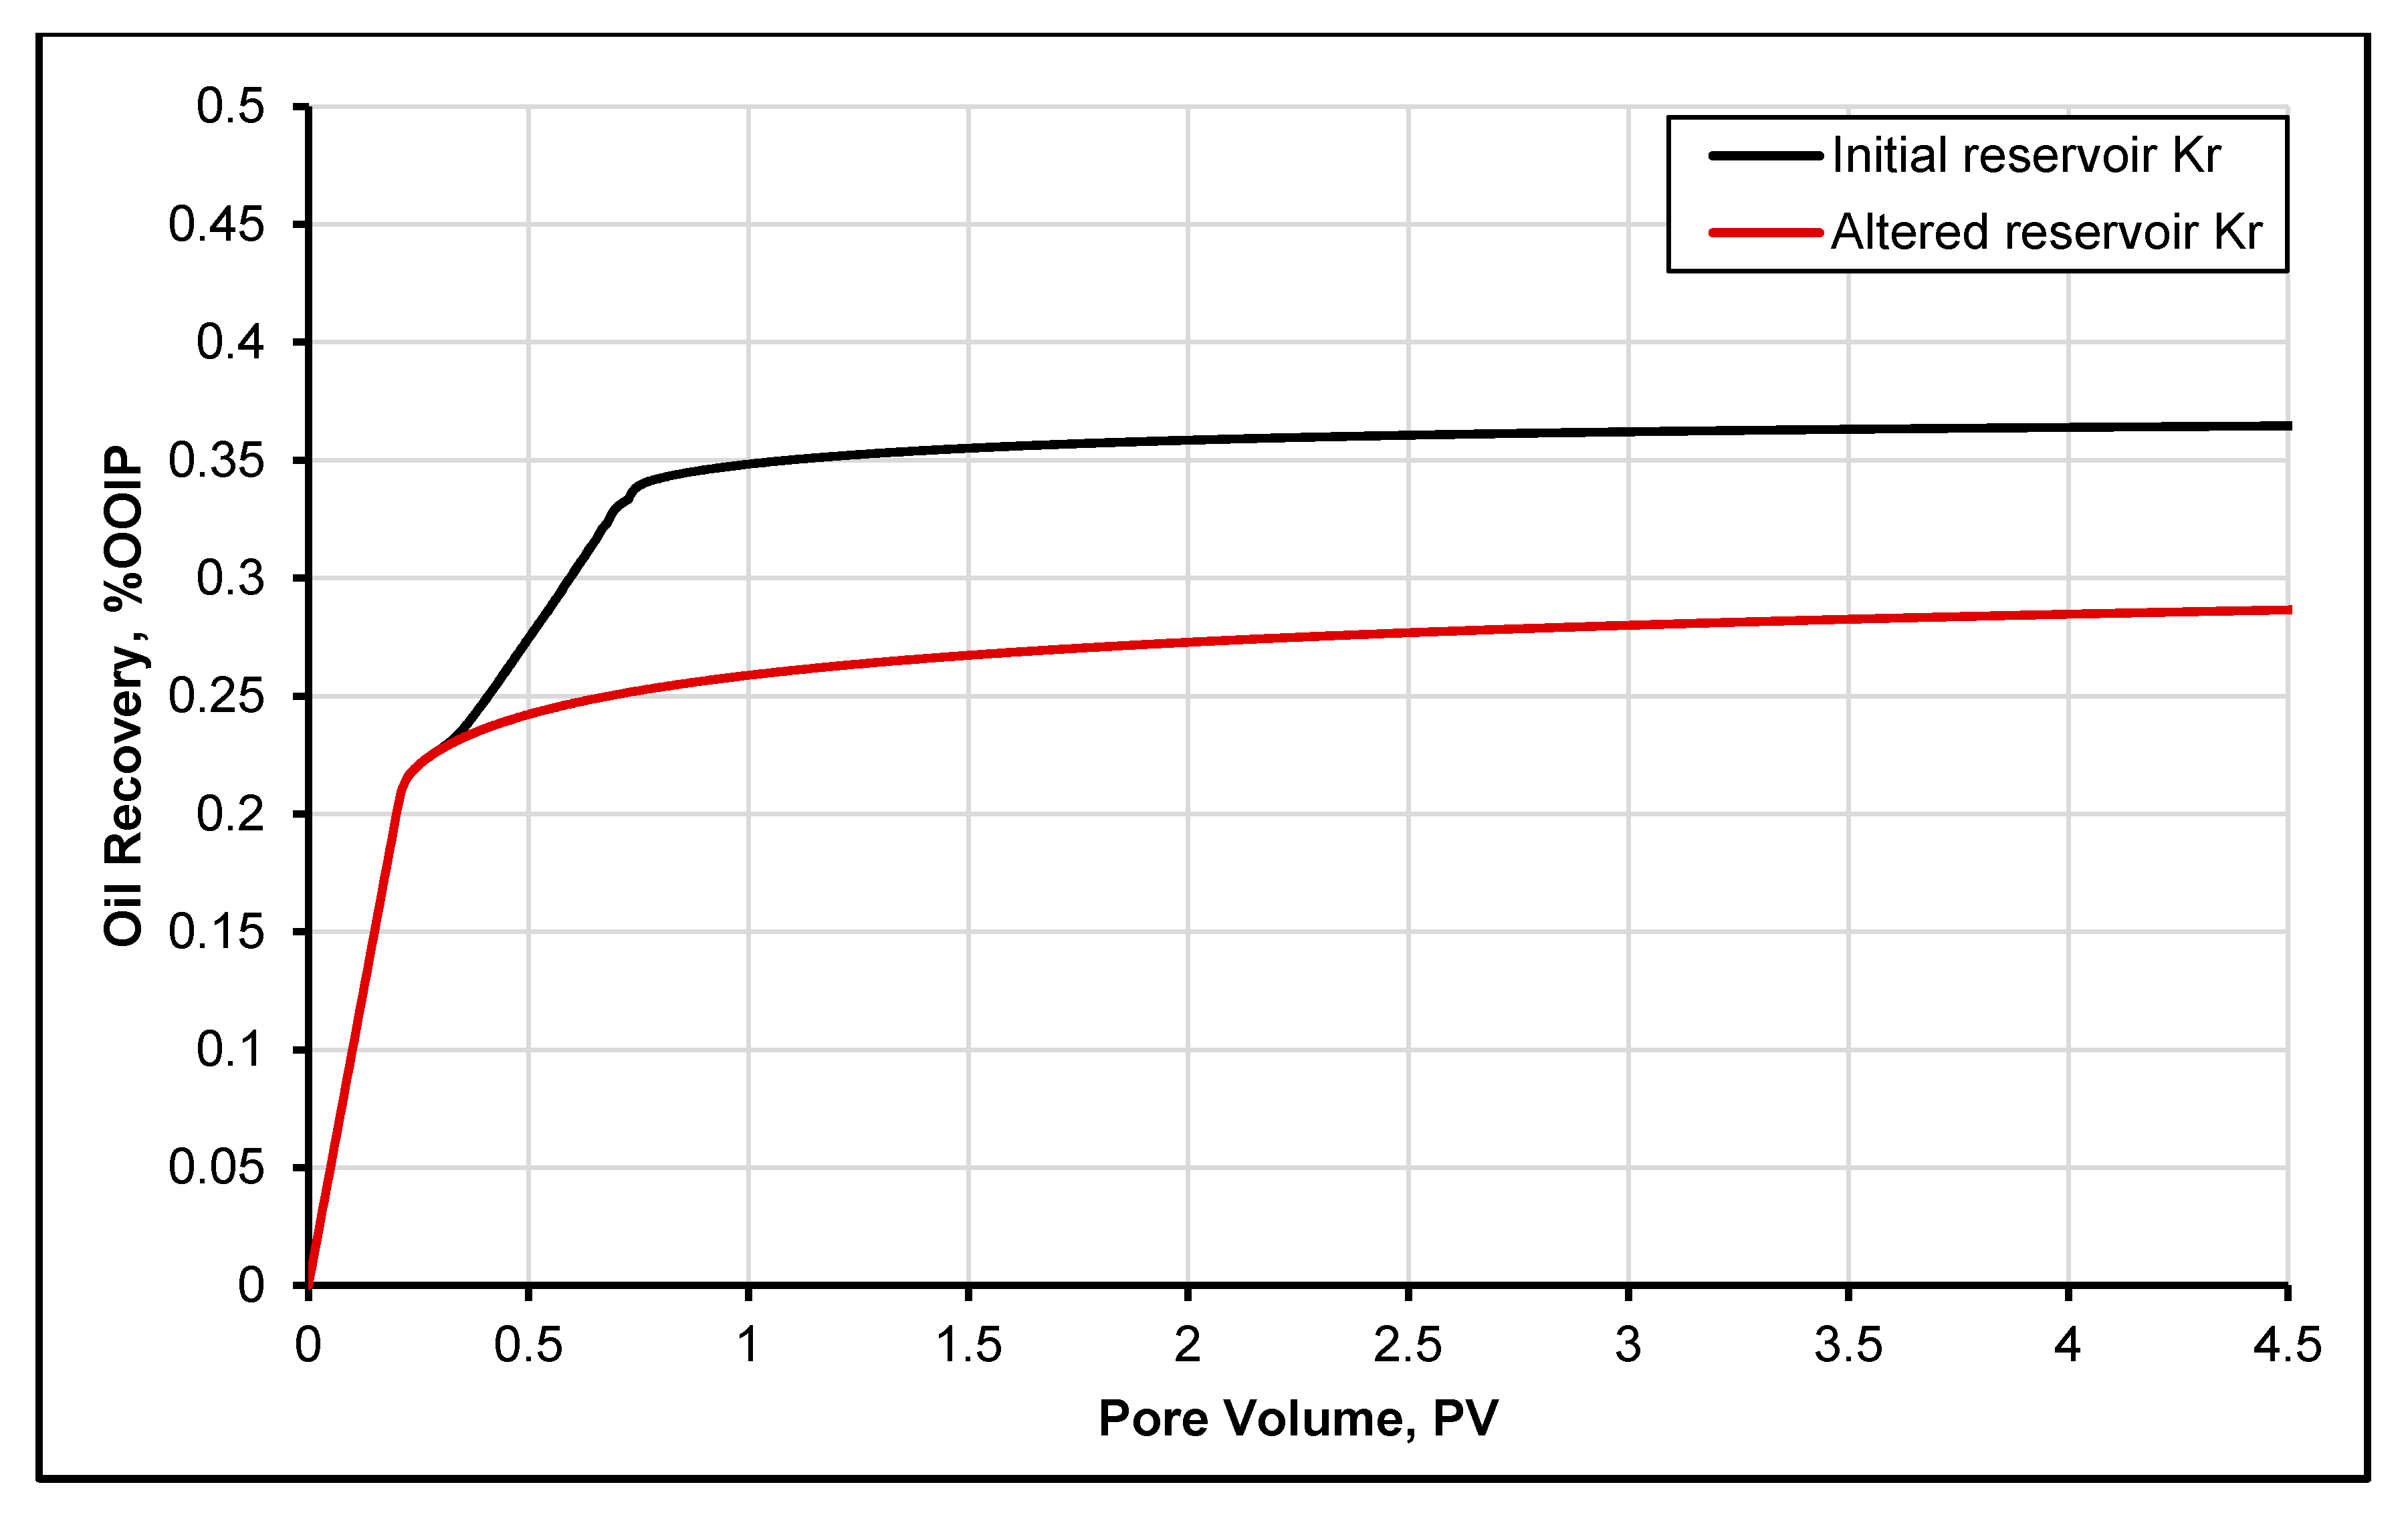
3.3. Permeability Impairment and Proposed Oil Recovery

The injection of CO2 will cause a shift in reservoir wettability, as the CO2 reacts with oil and causes the deposition of asphaltene. The surface complexation studies performed by References [24,31,32,33,34] help better understand the rock–oil–brine interface. However, it is important to consider the effect of asphaltene deposition at rock–oil–brine interface that is not considered in surface complexation modeling; the deposition of asphaltene could even choke the reservoirs by decreasing the productivity [35]. This deposition of asphaltene will change the relative permeability from the initial reservoir conditions to altered (damaged) relative permeability. Thus, to investigate the effect of asphaltene deposition and related oil recovery, different cases are investigated in the previous section. The study of Mehana et al. [36] was considered where the impact of asphaltene deposition on fluid flow was investigated. To depict the shift in reservoir wettability, the original and altered relative permeability data is presented in Table 3. It is important to mention that this experimental data was acquired from Reference [36], where the effect of asphaltene deposition was studied in detail. It is apparent from the table that the deposition of asphaltene impaired the flow behavior of the reservoir fluids. It is worth mentioning that the asphaltene deposition decreased the endpoint of oil relative permeability from 0.25 to 0.2. This decrease is also noticeable because it is associated with the relative permeability of water and its endpoint, which decreased from 0.65 to 0.45. These findings show that the deposition of asphaltene is more detrimental on oil flow than water. These outcomes are in agreement with Reference [36] for asphaltene deposition and oil recovery.
The various relative permeability input data comprising water and oil Corey’s exponents are shown in Table 3. The model developed in this study is used to calculate the effects of asphaltene deposition on reservoir permeability and oil recovery. The following two cases were considered in this study:
  • Case 1—without asphaltene deposition;
  • Case 2—with asphaltene deposition.
Figure 6 presents the oil recovery obtained with and without the deposition of asphaltene mode. It is evident from the results that the deposition of asphaltene causes a 10% decrease in oil production. This enormous amount of lost oil production is due to the formation damage [37] during CO2 injection caused due to asphaltene deposition. Moreover, it is observed that the effect of asphaltene and its deposition during CO2 injection could vary from case to case because it is influenced by brine/rock/crude oil compositions, pore distribution and reservoir thermodynamic conditions. Thus, these results should be further investigated based on the CO2 injection rates.

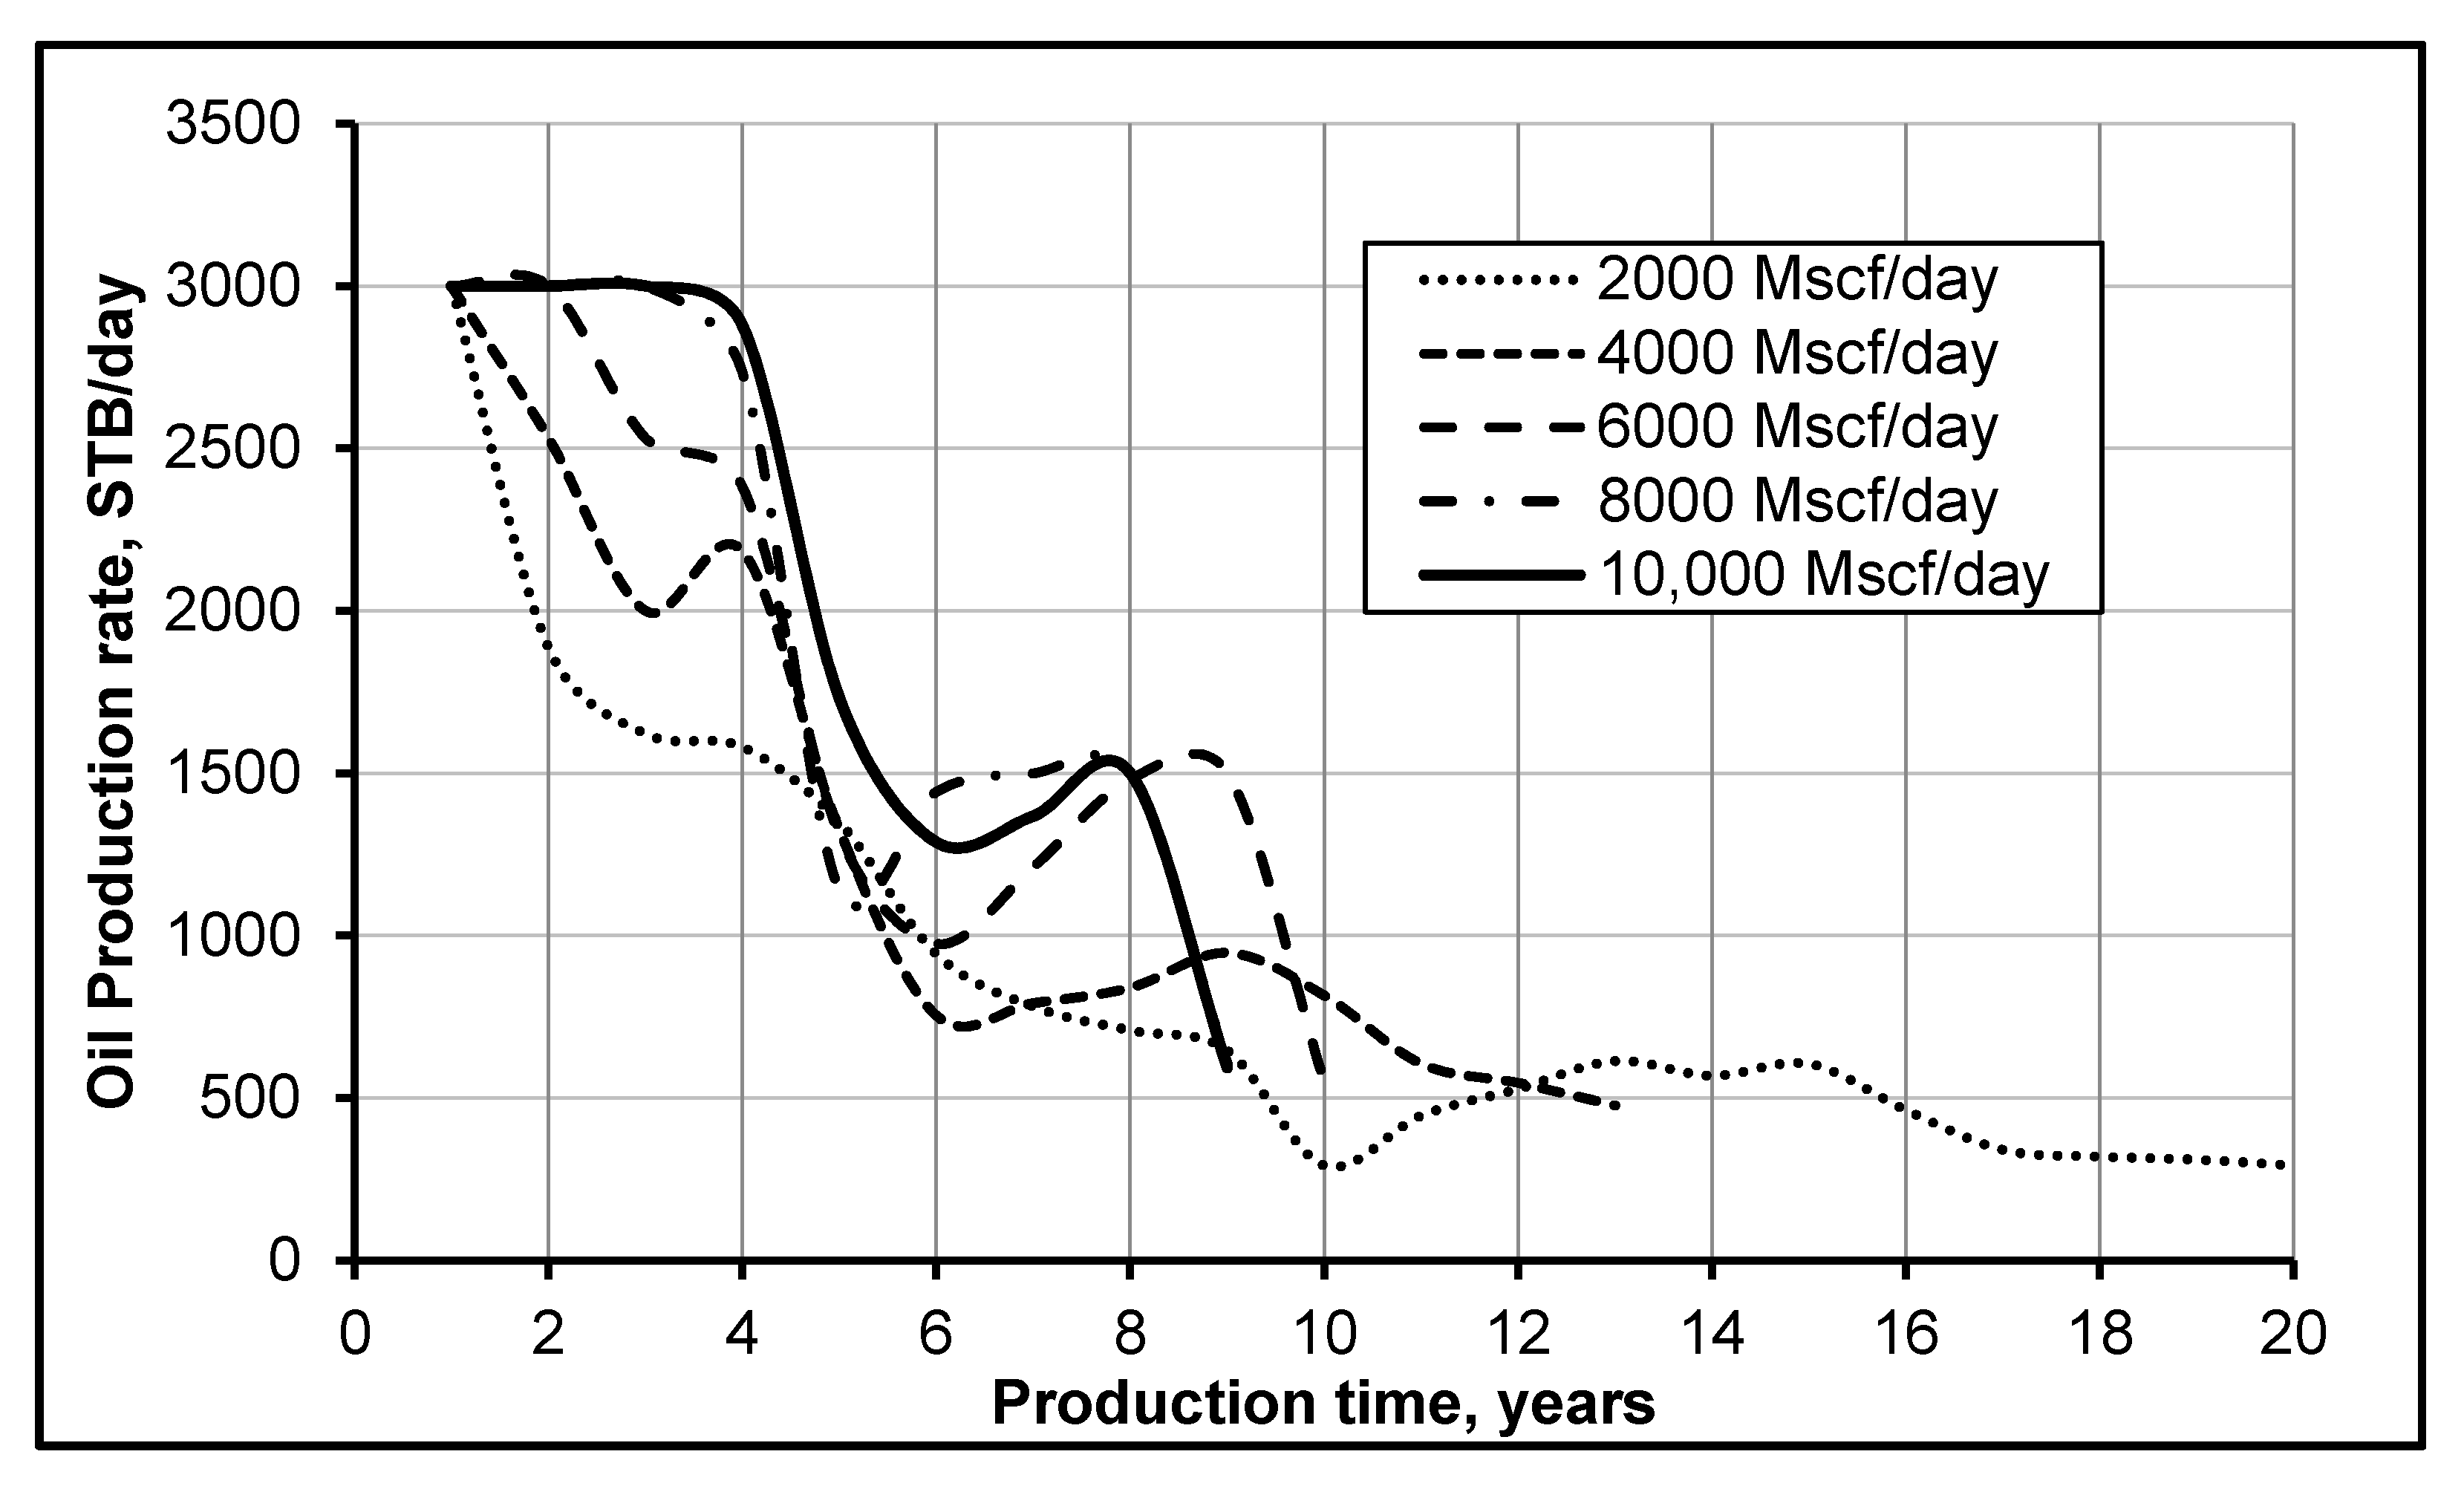
3.4. CO2 Injection Rate and Oil Production

A sensitivity analysis of CO2 injection rate, using a reservoir simulator (Eclipse-300), was performed to determine the effect of oil production and oil recovery. Figure 7 shows the oil production against production time at different CO2 injection rates: 2000, 4000, 6000, 8000 and 10,000 Mscf/day. The resulting longer plateau of oil production during the initial years of recovery (2 to 4 years) demonstrates that miscibility pressure has been attained in the reservoir, where the miscibility pressure is defined as the pressure at which the injected gas (CO2) and the residual oil become miscible after the multi-contact process. It is thus evident from Figure 7 that only the high CO2 injection rates help retain the miscibility pressure, as is evident from the cases of 10,000 and 8000 Mscf/day. It is thus important to inject CO2 at increased injection rates to achieve miscibility, which results in high oil recovery. Figure 7 also presents a second peak in the case of 10,000; 8000 and 6000 Mscf/day, and this is speculated to be because of the gas production breakthrough. There are two opposing factors for this behavior: at high CO2 injection rates, CO2 is able to attain miscibility pressure, but once miscibility pressure is attained, there are diminishing returns for further injection of CO2 at a higher rate (better pressure maintenance; no more diminution of residual oil). Therefore, the higher the injection rate, the faster CO2 gas will break through at producer wells. This is because when the pressure difference between the injector and producer is high, the gas moves faster towards the producer and less oil is recovered. Thus, when breakthrough occurs, injecting more gas will not help much, as the gas will go directly from the injector to the producer (fastest) path. Hence, it is concluded that injecting more CO2 will not increase the cumulative oil production after an early breakthrough.
Figure 7 shows a very important finding regarding the performance of CO2 flooding. The performance of CO2 flooding is better for CO2 miscible flooding than immiscible flooding, because, at miscible conditions, the CO2 can easily reduce the viscosity of oil, dissolve it and improves its displacement and recovery. It is evident from the cases shown in Figure 7 that we achieved miscibility for 10,000, 8000 and 6000 Mscf/day of CO2 injection. However, high miscibility pressure (10,000 Mscf/day) is not effective because of high rate of injection, high cost and difficult-to-achieve miscible displacement. Thus, reducing the miscibility pressure is a common method [38] that helps to decrease the injection rate and cost but, at the same time, results in better oil recovery factor, as shown in Figure 8a. Moreover, the results shown in Figure 8b,c depict the time period of oil recovery in years and days and demonstrate the economic importance of a high CO2 injection rate. Hence, more oil would be recovered from the reservoir with an optimum high injection rate, which, in this specific case, is 8000 Mscf/day, where 46% extra oil is recovered, which is the highest recovery factor, and the CO2 injection rate is successfully decreased by 2000 Mscf/day, thus making the project more economical and efficient.

4. Conclusions

In this study, a comprehensive numerical simulator was developed for modeling CO2–rock–water chemical reactivity, particle transport and particle deposition during carbon dioxide sequestration. The foremost findings of this work can be summarized as follows:
  • The simulator developed in this study can be used as an efficient tool to predict the amount of formation damage during CO2 injection.
  • During CO2 injection, the dissolution of rock near the wellbore is the main problem, and the precipitation of dissoluted rock particles causes pore plugging, which results in permanent formation damage.
  • From the numerical simulations on the effect of reservoir depth and temperature, we found that deep oil and gas reservoirs are better candidates for CO2 sequestration than shallow reservoirs. When reservoirs are deep, reservoir temperature is high, and it decreases the CO2 rate of dissolution and also lowers the solid precipitation. This results in low formation damage during CO2 injection.
  • From the sensitivity analysis of CO2 injection rate on reduced permeability in high-temperature formations, we find that the increased CO2 injection rates and pressures help reach miscibility pressure. Once this pressure is reached, there are less benefits of continuing injection at higher rates.
  • The higher the injection rate, the faster CO2 gas will breakthrough at producer wells and the gas will go directly from the injector to the producer (fastest) path. As a result, for maximum oil recovery from the reservoir, CO2 should be injected to attain miscibility pressure.
  • The depiction of asphaltene with the injection of CO2 showed that asphaltene deposition reduced the oil recovery by 10%. The deposition and precipitation of solids during CO2 injection could vary from case to case.

Author Contributions

Conceptualization, I.K. and I.A.; methodology, I.K.; software, I.K.; validation, I.K.; formal analysis, I.K. and I.A.; investigation, I.K.; resources, I.A.; data curation, I.K.; writing—original draft preparation, I.K.; writing—review and editing, I.K. and I.A.; visualization, I.A.; supervision, I.A.; project administration, I.A.; funding acquisition, I.A. All authors have read and agreed to the published version of the manuscript.

Funding

This research and APC were funded by Khalifa University, grant number FSU8474000240.

Institutional Review Board Statement

Not applicable.

Informed Consent Statement

Not applicable.

Data Availability Statement

Not applicable.

Acknowledgments

The authors wish to acknowledge Khalifa University of Science and Technology for funding this research.

Conflicts of Interest

The authors declare no conflict of interest.

Nomenclature

Symbols
Atemperature-dependent constant
Cconcentration of particles
Ddrag coefficient
ddiffusivity in pores
Eenergy of activation (J/mol)
Fdiffusion coefficient
Henthalpy (Joule)
Iionic strength
Jinjection rate (kg/h)
Kequilibrium constant
kreservoir permeability (mD)
nspecie concentration (moles)
msolution molality (mol/kgw)
Ppressure of reservoir (psi)
Rgas constant (J/mol·K)
Ssaturation (%)
Ttemperature of reservoir (K)
Vvolume (m3)
Xconcentration of asphaltene (%)
zcharge of fluid species
Greek Letters
μviscosity of reservoir fluid (cP)
ρdensity (g/cm3)
φreservoir porosity (%)
δreactive surface
λmobility of fluid phase
γcoefficient of ionic activity
v viscosity of the fluid (m2/s)
wmole concentration
Subscripts/Superscripts
aaqueous
asasphaltene
cexponent for Kozeny–Carman equation
inoriginal/initial
ksolid
lliquid
ooil
Abbreviations
EORenhanced oil recovery
PVpore volume

References

  1. Metz, B.; Davidson, O.R.; Bosch, P.R.; Dave, R.; Meyer, L.A. Intergovernmental Panel on Climate Change (IPCC): 2007: Mitigation, Contribution of Working Group III to the Fourth Assessment Report of the Intergovernmental Panel on Climate Change; Cambridge University Press: Cambridge, UK; New York, NY, USA, 2007. [Google Scholar]
  2. Khurshid, I.; Fujii, Y.; Choe, J. Analytical Model to Determine CO2 Injection Time in a Reservoir for Optimizing its Storage and Oil Recovery: A Reservoir Compaction Approach. J. Pet. Sci. Eng. 2015, 135, 240–245. [Google Scholar] [CrossRef]
  3. Civan, F. Reservoir Formation Damage Fundamentals, Modeling, Assessment, and Mitigation, 3rd ed.; Gulf Publishing Company: Houston, TX, USA, 2016. [Google Scholar]
  4. Khurshid, I.; Choe, J. Analysis of asphaltene deposition, carbonate precipitation, and their cementation in depleted reservoirs during CO2 injection. Greenh. Gases Sci. Technol. 2015, 5, 657–667. [Google Scholar] [CrossRef]
  5. Lake, W.L. Enhanced Oil Recovery; Prentice Hall Inc.: Hoboken, NJ, USA, 1989. [Google Scholar]
  6. Wang, J.; Ryan, D.; Anthony, E.J.; Wildgust, N.; Aiken, T. Effects of impurities on CO2 transport, injection and storage. Energy Procedia 2011, 4, 3071–3078. [Google Scholar] [CrossRef] [Green Version]
  7. André, L.; Azaroual, M.; Menjoz, A. Numerical simulations of the thermal impact of supercritical CO2 injection on chemical reactivity in a carbonate saline reservoir. Trans. Porous Media 2009, 82, 247–274. [Google Scholar] [CrossRef] [Green Version]
  8. Zeidouni, M.; Pooladi-Darvish, M.; Keith, D. Analytical solution to evaluate salt precipitation during CO2 injection in saline aquifers. Int. J. Greenh. Gas Control 2009, 3, 600–611. [Google Scholar] [CrossRef]
  9. Sbai, M.A.; Azaroual, M. Numerical modeling of formation damage by two-phase particulate transport processes during CO2 injection in deep heterogeneous porous media. Adv. Water Resour. 2011, 34, 62–82. [Google Scholar] [CrossRef] [Green Version]
  10. Gaus, I.; Audigane, P.; André, L.; Lions, J.; Jacquemet, N.; Durst, P.; Czernichowski-Lauriol, I.; Azaroual, M. Geochemical and solute transport modelling for CO2 storage, what to expect from it? Int. J. Greenh. Gas Control 2008, 2, 605–625. [Google Scholar] [CrossRef] [Green Version]
  11. Smith, G.H.; Patton, J.T. Formation damage potential from carbon dioxide-crude oil. Paper SPE 11337. In Proceedings of the SPE Production Technology Symposium, Hobbs, NM, USA, 8–9 November 1982. [Google Scholar]
  12. André, L.; Audigane, P.; Azaroual, M.; Menjoz, A. Numerical modeling of fluid rock chemical interactions at the supercritical CO2-Liquid interface during CO2 injection into a carbonate reservoir, The Dogger Aquifer (Paris Basin, France). Energy Convers. Manag. 2007, 48, 1782–1797. [Google Scholar] [CrossRef]
  13. Khurshid, I.; Choe, J. Analyses of thermal disturbance and formation damages during carbon dioxide injection in shallow and deep reservoirs. Int. J. Oil Gas Coal Technol. 2016, 11, 141–153. [Google Scholar] [CrossRef]
  14. Gaus, I. Role and Impact of CO2-rock interactions during CO2 storage in sedimentary rocks. Int. J. Greenh. Gas Control. 2010, 4, 73–89. [Google Scholar] [CrossRef]
  15. Khurshid, I.; Al-Shalabi, E.W.; Al-Ameri, W. Influence of water composition on formation damage and related oil recovery in carbonates: A geochemical study. J. Pet. Sci. Eng. 2020, 195, 107715. [Google Scholar] [CrossRef]
  16. Robinson, A.; Gluyas, J. Model calculations of loss of porosity in sandstones as a result of compaction and quartz cementation. Mar. Pet. Geol. 1991, 9, 319–323. [Google Scholar] [CrossRef]
  17. Schneider, G.W. A Geochemical Model of the Solution-Mineral Equilibria within a Sandstone Reservoir. Master’s Thesis, University of Oklahoma, Norman, OK, USA, 1997. [Google Scholar]
  18. Sharma, M.M.; Yortsos, Y.C.; Handy, L.L. Release and deposition of clays in sandstone. Paper SPE 13562. In Proceedings of the International Symposium on Oilfield and Geothermal Chemistry, Phoenix, AZ, USA, 9–11 April 1985. [Google Scholar]
  19. Canals, M.; Meunier, D. A model for porosity reduction in quartzite reservoirs by quartz cementation. Geochim. Cosmochim. Acta 1995, 59, 699–709. [Google Scholar] [CrossRef]
  20. Khurshid, I.; Choe, J. An analytical model for dissolution of deposited asphaltene in porous media during CO2 injection. Int. J. Oil Gas Coal Technol. 2018, 18, 338–352. [Google Scholar] [CrossRef]
  21. Khurshid, I.; Al-Attar, H.; Alraeesi, A. Modeling cementation in porous media during waterflooding: Asphaltene deposition, formation dissolution and their cementation. J. Pet. Sci. Eng. 2018, 161, 359–367. [Google Scholar] [CrossRef]
  22. Bacci, G.; Korre, A.; Durucan, S. An experimental and numerical investigation into the impact of dissolution/precipitation mechanisms on CO2 injectivity in the wellbore and far field regions. Int. J. Greenh. Gas Control. 2011, 5, 579–588. [Google Scholar] [CrossRef]
  23. Krauskopf, K.B.; Dennis, K.B. Introduction to Geochemistry, 3rd ed.; McGraw-Hill Inc.: New York, NY, USA, 1995. [Google Scholar]
  24. Khurshid, I.; Al-Shalabi, E.W. New insights into modeling disjoining pressure and wettability alteration by engineered water: Surface complexation based rock composition study. J. Pet. Sci. Eng. 2022, 208, 109584. [Google Scholar] [CrossRef]
  25. Langmuir, D. Aqueous Environmental Geochemistry; Prentice-Hall Inc.: Hoboken, NJ, USA, 1997. [Google Scholar]
  26. Khurshid, I.; Al-Shalabi, E.W.; Afgan, I.; Al-Attar, H. A numerical approach to investigate the impact of acid-asphaltene sludge formation on wormholing during carbonate acidizing. J. Energy Resour. Technol. 2022, 144, 063001. [Google Scholar] [CrossRef]
  27. Matter, J.M.; Kelemen, P.B. Permanent storage of carbon dioxide in geological reservoirs by mineral carbonation. Nat. Geosci. 2009, 2, 837–841. [Google Scholar] [CrossRef]
  28. Khurshid, I.; Lee, K.J.; Choe, J. Analyses of thermal disturbance in drilling deep and high temperature formations. Energy. Sources Part A Recovery Util. Environ. Eff. 2013, 35, 1487–1497. [Google Scholar] [CrossRef]
  29. Ejeh, C.; Afgan, I.; AlMansob, H.; Brantson, E.; Fekala, J.; Odiator, M.; Stanley, P.; Anumah, P.; Onyekperem, C.; Boah, E. Computational fluid dynamics for ameliorating oil recovery using silicon-based nanofluids and ethanol in oil-wet reservoirs. Energy Rep. 2020, 6, 3023–3035. [Google Scholar] [CrossRef]
  30. Khurshid, I.; Fujii, Y. Geomechanical analysis of formation deformation and permeability enhancement due to low temperature CO2 injection in subsurface oil reservoirs. J. Pet. Explor. Prod. Technol. 2021, 11, 1915–1923. [Google Scholar] [CrossRef]
  31. Tetteh, J.T.; Pham, A.; Peltier, E.; Hutchison, J.M.; Ghahfarokhi, R.B. Predicting the electrokinetic properties on an outcrop and reservoir composite carbonate surfaces in modified salinity brines using extended surface complexation models. Fuel 2022, 309, 122078. [Google Scholar] [CrossRef]
  32. Tetteh, J.T.; Brady, P.V.; Ghahfarokhi, R.B. Review of low salinity waterflooding in carbonate rocks: Mechanisms, investigation techniques, and future directions. Adv. Colloid Interface Sci. 2020, 284, 102253. [Google Scholar] [CrossRef] [PubMed]
  33. Chen, Y.; Sari, A.; Xie, Q.; Saeedi, A. Insights into the wettability alteration of CO2-assisted EOR in carbonate reservoirs. J. Mol. Liq. 2019, 279, 420–426. [Google Scholar] [CrossRef]
  34. Chen, Y.; Sari, A.; Xie, Q.; Brady, P.V.; Hossain, M.M.; Saeedi, A. Electrostatic origins of CO2-increased hydrophilicity in carbonate reservoirs. Sci. Rep. 2018, 8, 17691. [Google Scholar] [CrossRef] [Green Version]
  35. Khurshid, I.; Al-Shalabi, E.W.; Al-Attar, H.; Al-Neaimi, A.K. Analysis of formation damage and fracture choking in hydraulically induced fractured reservoirs due to asphaltene deposition. J. Pet. Explor. Prod. Technol. 2020, 10, 3377–3387. [Google Scholar] [CrossRef]
  36. Mehana, M.; Abraham, J.; Fahes, M. The impact of asphaltene deposition on fluid flow in sandstone. J. Pet. Sci. Eng. 2019, 174, 676–681. [Google Scholar] [CrossRef]
  37. Khurshid, I.; Afgan, I. Investigation of water composition on formation damage and related energy recovery from geothermal reservoirs: Geochemical and geomechanics insights. Energies 2021, 14, 7415. [Google Scholar] [CrossRef]
  38. Zhang, K.; Jia, N.; Zeng, F.; Li, S.; Liu, L. A review of experimental methods for determining the oil-gas minimum miscibility pressures. J. Pet. Sci. Eng. 2019, 183, 106366. [Google Scholar] [CrossRef]
Figure 1. Schematic of CO2, brine and reservoir rock interactions with CO2 injection.
Energies 14 07676 g001
Figure 2. Flowchart for porosity and permeability impairment in carbonates with the injection of CO2.
Energies 14 07676 g002
Figure 3. Comparison of developed model results with Bacci et al. [22] experimental data.
Energies 14 07676 g003
Figure 4. Changes in reservoir porosity at various reservoir temperature after 1 year of CO2 injection.
Energies 14 07676 g004
Figure 5. Changes in reservoir porosity due to part size heterogeneity (1-year injection).
Energies 14 07676 g005
Figure 6. Oil recovery with Case 1, initial relative permeability (without asphaltene deposition), and Case 2, altered relative permeability (with asphaltene CO2 injection).
Energies 14 07676 g006
Figure 7. Oil production at different injection rates of CO2.
Energies 14 07676 g007
Figure 8. Oil-production performances at different injection rates of CO2: (a) recovery efficiency, (b) total years of oil production and (c) total days of oil production.
Energies 14 07676 g008
Table 1. List of reactions used in the study at 25 °C [15].
Solid Name: Dissolution/Precipitation ReactionSolubility Product
Calcite: CaCO 3 CO 3 2 + Ca 2 + K s p = [ C a 2 + ] [ C O 3 2 ] = 10−8.48
Aqueous ReactionsEquilibrium Constant
H2O ⇌ OH + H+ K e q = [ H + ] [ O H ] = 10−14
CO32− + 2H+ ⇌ CO2 + H2O K e q =   [ C O 2 ]   [ C O 3 2 ] [ H + ]   = 1016.681
CO32− + H+ ⇌ HCO3 K e q =   [ H C O 3 ]   [ C O 3 2 ] [ H + ]   = 1010.329
Ca2+ + H2O ⇌ CaOH+ + H+ K e q =   [ C a O H + ]   [ H + ] [ C a 2 + ] = 10−12.78
Ca2+ + CO32− + H+ ⇌ CaHCO3+ K e q =   [ C a H C O 3 + ]   [ C a 2 + ] [ C O 3 2 ] [ H + ]   = 1011.435
Ca2+ + CO32− ⇌ CaCO3 K e q =   [ C a C O 3 ]   [ C a 2 + ] [ C O 3 2 ] = 103.224
Table 2. Simulation input parameters and data used for CO2 related formation damage.
ParameterValue
Length of the model, cm1000
Supercritical CO2 viscosity, cp0.002
Supercritical CO2 density, g/cm30.45
CaCO3 density, g/cm32.7
Reservoir porosity, %21.5
Reservoir permeability, m2450 × 10−15
Universal Gas Constant, J/mol·K8.31
Model inlet radius, cm6
Concentration of asphaltene in oil, %5.3
Forward reaction coefficient3 × 10−9
Backward reaction coefficient1 × 10−10
Asphaltene coefficient of deposition4.65 × 10−5
Table 3. Simulation input relative permeability data.
VariablesValues
Viscosity of Water (cP)1
Viscosity of Oil (cP)2
Original/Initial Relative Permeability ParametersCorey’s Exponent—Water (nw)2.0
Corey’s Exponent—Oil (no)3.5
Saturation of Oil—Residual (Sor)0.08
Endpoint Relative Permeability—Oil (kro)0.25
Endpoint Relative Permeability—Water (krw)0.65
Water Saturation—Irreducible (Swirr)0.19
Altered Relative Permeability ParametersCorey’s Exponent—Water (nw)2.0
Corey’s Exponent—Oil (no)3.5
Saturation of Oil—Residual (Sor)0.6
Endpoint Relative Permeability—Oil (kro)0.2
Endpoint Relative Permeability—Water (krw)0.45
Water Saturation—Irreducible (Swirr)0.16
Publisher’s Note: MDPI stays neutral with regard to jurisdictional claims in published maps and institutional affiliations.

