Abstract
One of the principal indicators of the methane hazard in coal mines is gas pressure. This parameter directly affects the methane content in the seam as well as the rate of its release resulting from mining operations. Because of limitations in the existing methods for methane seam pressure measuring, primarily technical difficulties associated with direct measurement and the time-consuming nature of indirect measurement, this parameter is often disregarded in the coal and gas outburst forecasts. To overcome the above-mentioned difficulties, an attempt was made to estimate the methane seam pressure with the use of artificial neural networks. Two MLP-based models were developed to estimate the average and maximum methane seam pressure values, respectively. The analyses demonstrated high correlation between the values indicated by the neural models and the reference values determined on the basis of sorption isotherms. According to the adopted fit criterion, the prediction errors for the best fit were 2.59% and 3.04% for the average and maximum seam pressure values, respectively. The obtained determination coefficients (exceeding the value of 0.99) confirmed the very good predictive abilities of the models. These results imply a great potential for practical application of the proposed method.
1. Introduction
Mining operations interfere with the original structure of the rock mass, affecting the state of stresses as well as the methane seam pressure distribution [1,2]. This is the main cause of the existing mining hazards, including the risk of gas and rock outbursts in underground coal mines [3,4,5]. In the countries involved in coal mining, specific mining parameters have been introduced along with their criterion values, on the basis of which coal seams or their parts are classified in individual groups of outburst hazard [6]. The basic parameter used to assess the risk of coal and methane outbursts is the methane-bearing capacity [3]; however, there are also important parameters that help prevent outbursts [7].
One of the key indicators of the outburst hazard used currently for the forecasts is the methane seam pressure [2,8,9,10,11,12]. This corresponds to the pressure generated by free methane contained in macropores and fractures of coal. In the processes leading to the initiation of outburst, both the value of the methane pressure in the coal seam as well as the pressure gradient between the coal face and the excavation are of vital importance [2,9,13]. The methane seam pressure determines the quantity of methane contained in the seam and affects the rate of methane release from the seam as a result of mining operations [14]. It has been found many times that the precise determination and control of methane pressure in coal seams are essential for the safety of underground work [3,9,15,16,17]. Despite the fact that the mining regulations do not provide for the requirement to determine the methane seam pressure as often as for the obligatory measurement of methane content, there are countries, such as China, where the outburst risk assessment is based solely on the methane pressure in the seam [18].
The methane seam pressure is determined using two methods, namely the direct method [12,19] and the indirect method [11,20]. The direct measurement of the methane seam pressure is carried out at the excavation coal face. To perform the measurement, the pressure probe is placed in the test hole, which is then sealed, and the pressure value is recorded [9,12,21]. The greatest challenge associated with the direct measurement, and at the same time a significant disadvantage of the method, is to achieve sufficient tightness between the test hole and the pressure probe placed therein. A number of unfavourable factors in the seam, such as cracks in layers, high coal humidity and low seam permeability, contribute to underestimation of the methane pressure readings recorded in the seam [12].
Due to the above problems associated with direct measurement of methane seam pressure, indirect methods are used. In one of the methods, methane seam pressure was retrieved by comparing the results of in situ desorbometric measurements with the results of the methane desorption tests performed under laboratory conditions [20]. Another method proposed was based on the results of methane-bearing capacity determinations, where the methane adsorption isotherm determined at the in situ temperature made it possible to retrieve the values of the seam pressure of methane [7]. Nevertheless, due to the time-consuming nature of indirect methods, they have not found practical application.
Bearing in mind the aforementioned difficulties associated with the methane seam pressure measurements, it was decided to test the possibility of estimating the value of the methane seam pressure with the use of artificial neural networks.
Artificial neural networks (ANN) form a family of mathematical models the functioning of which is inspired by the structure and operation of the nervous systems of living organisms, in particular the human brain [22]. They fall within the category of artificial intelligence tools that are highly effective in practical applications. They are used when there is a high complexity of the issue and it is difficult to define formal criteria for development of a computer program.
Artificial neural networks are increasingly used as statistical tools for regression analysis [23,24,25]. They are widely used to solve a variety of engineering problems [26]. These include, but are not limited to, the following issues: prognostication of permeability [27,28], gas properties [29,30], wind power prediction [31], building cooling load prediction [32], application to economic issues [33] or issues related to air and land transport [34,35]. The nonlinear characteristics of network neurons have proved very successful in transforming the input data (explanatory variables) to approximate the output value (the dependent variable), which makes them highly effective compared to traditional regression analysis methods, e.g., [36,37,38]. Regression problems can be solved using a multilayer perceptron (MLP), radial basis networks (RBN), general regression neural networks (GRNN), and linear networks [39,40]. When choosing a neural model, the extrapolation behaviour of particular networks should be taken into account. Networks using radial neurons (RBF and GRNN) behave quite differently from MLP networks and require separate treatment. Without proper scaling of the training data, the networks are devoid of extrapolation capabilities, which makes it difficult to use them in solving regression problems.
In addition to the methods of artificial neural networks, other techniques used currently in similar industry issues should also be mentioned. The most important ones include: fractal geometry theory [41], nuclear magnetic resonance [42,43], geomechanical studies [44], and digital rock technology or deep learning neural networks [45].
The works described in this article continue the research on the use of artificial neural networks to estimate the values of selected sorption parameters of the coal-methane system. The research done so far allowed development of neural models used to estimate the effective diffusion coefficient and the maximum sorption capacity using the MLP network [46].
2. Materials and Methods
The coal material used in the research was derived from coal seams located in the Upper Silesian Coal Basin in Poland. The 21 samples were selected from those used in the studies on the estimation of the effective diffusion coefficient and the maximum sorption capacity using the MLP network [46]. The cited work contains detailed information on the methodology of the measurements carried out, aimed at determining the input parameters for the neural models constituting the subject of the work described. In the framework of the research, the following were carried out: densitometric analyses performed on pieces with dimensions of 10–20 mm; microscopic petrographic analyses on samples with a grain size of 0.50–1.00 mm; and sorption tests on samples with a grain size of 0.125–0.160 mm [46,47].
Densitometric analyses were carried out using helium pycnometry and quasi-liquid pycnometry, with AccuPyc II 1340 and GeoPyc 1360 analysers from Micromeritics (Atlanta, GA, USA), respectively. The porosity of the tested coal samples was determined on the basis of the measurements of their real and apparent density.
The microscopic tests provided for the measurements of the mean reflectance (light reflectance ability) of vitrinite (or more precisely colotelinite), denoted as Ro. Measurements were carried out in accordance with the procedure described in the paper [48].
The research also used the values of the maximum sorption capacity (am), determined using the developed methodology based on regression neural network, as described in more detail in work of [46].
In summary, the following input parameters were used in the presented research:
parameters obtained as a result of the petrographic analysis:
- reflectance—Ro [%] (parameter 1);
parameters obtained as a result of the densitometric analysis:
- real density—ρr [g/cm3] (parameter 2);
- porosity—ε [%] (parameter 3);
sorption parameters determined using the MLP network:
- maximum sorption capacity—am [m3CH4/Mg] (parameter 4).
The temperature at which the sorption measurements were carried out—T [°C] (parameter 5); the depth of the seam deposition—H [m] (parameter 6); and the methane bearing capacity—Mn [m3CH4/Mg] (parameter 7). The determined parameters were normalized in the interval [0, 1]. In this way, each of the coal samples was described by means of 7-dimensional feature vector, which was then used to develop neural models for the prediction of the average and maximum seam pressure values. The research used a multilayer perceptron (MLP)—a network in which information flows in one direction only. In addition to the input and output layers, it has at least one hidden layer of neurons. The process of training a multilayer perceptron is supervised by a teacher. The training set is included in two matrices: one contains the sets of inputs for consecutive learning examples, and the other has the output values that correspond to these examples and that should be returned by the network as a response [49,50,51].
In order to obtain reference values of the methane seam pressure for the neural models developed, appropriate analyses were carried out to determine the values of the parameter under consideration using an indirect method consisting of balancing the methane in the coal seam [7]. In this method, the methane seam pressure corresponds to the equilibrium pressure of free methane, determined for a given total methane content of coal at the deposit temperature. The method assumes that the total methane content of the seam is an equivalent to the methane bearing capacity Mn and is the sum of the sorbed methane and free methane :
From the balance Equation (1), after taking into account the model of sorption isotherm and the coal pore volume Vp, one can calculate the methane pressure in the seam p [11]:
where:
, —parameters of the Langmuir isotherm at the deposit temperature Tz, k—coefficient.
In the framework of the works presented, the values of the average (pave) and the maximum seam pressure (pmax) of methane were determined by using the values of the average methane-bearing capacity and the maximum methane-bearing capacity of the seam in Formula (2), respectively.
For each of the 21 coal samples, sorption measurements were carried out at 4 temperatures: 25 °C, 35 °C, 45 °C and 55 °C. In this way, 84 elements of the training sequence (84 sets of sample network input values and corresponding output values) were obtained, which were then used for training, validation and testing of the neural models used in the research.
3. Selection of Parameters for the Prediction Model
Analyses concerning the development of an optimal neural model for the task of predicting the value of methane seam pressure were carried out using MATLAB software version 8.5 (MathWorks, Natick, MA, USA), featuring the Neural Network Toolbox.
The objective of the study was to develop two neural models. One was used to predict the value of the average seam pressure, while the other was used to determine the maximum seam pressure. In each case, a single hidden layer neural network was developed. Optimal parameters for each of the models were selected independently.
In the case of data division into training, testing and validation set, it is recommended to use approx. 70–80% of the available examples for training of the network, while the remaining 20–30% are used to assess the performance of the neural network and possible symptoms of its overtraining and final evaluation of performance of a given neural model. Therefore, in the presented work, of the available 84-element dataset, 58 elements (70%) were randomly selected to be used in the process of training the neural network. The remaining elements (30%) were arranged in two balanced datasets: validation and test one (each consisting of 13 elements). The process of selection of the elements of the learning set was repeated 100 times, each time in a random fashion. The result was given after 100 repetitions of learning set sampling and network training. The selection of parameters for the MLP network started with the selection of the optimal number of neurons in the hidden layer, which is a key issue when designing the neural network architecture. The size of the remaining two network layers was determined by the number of features used to describe each of the samples (input layer) and the purpose of the designed MLP network for regression analysis, where a single neuron at the network output is used to estimate the value of the dependent variable under consideration. In the research discussed, the network’s output layer featured a linear neuron, which allows the network to reach an unlimited range of values of the estimated parameter.
According to one of the commonly used methods for selection of the initial number of neurons in the hidden layer, which says that this number is determined as the geometric mean of the number of inputs and outputs of the neural network, the research began with three neurons in the hidden layer. Next, subsequent neurons were added, each time observing the effectiveness of the neural network for 100 draws of the training set and the error value achieved by the network for the training, validation and test sets. In addition to the optimal number of neurons in the network’s hidden layer, the selection of their activation functions is also important. As part of the research, two activation functions were considered: logistic and hyperbolic tangent, which are often used in the case of regression analysis problems. The neural network was trained using the Levenberg–Marquardt error backpropagation algorithm.
In order to determine the quality of the fit of the proposed neural model to the experimental data, an appropriate criterion was used, expressed as the mean percentage error of the neural model prediction [31]:
where:
—prediction value,
—measured value,
Xi—element of the test set,
n—number of elements in the test set.
The obtained results of the analyses concerning the selection of the optimal number of neurons in the hidden layer and their activation function for the prediction of the average methane seam pressure are shown in Figure 1 (results for 100 draws of the training set).
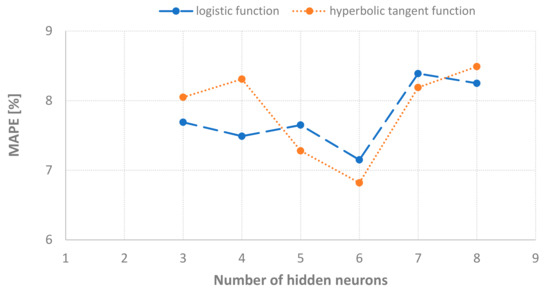
Figure 1.
Selection of neural network parameters for prediction of the average methane seam pressure, based on the mean prediction error of the neural model.
When analysing the results presented in Figure 1, it can be seen that the optimal results of the average pressure estimation (the lowest value of the fit criterion) were obtained using a neural model with six hyperbolic tangent neurons in the hidden layer (MLP 7-6-1).
Likewise, the analyses aimed at the selection of the parameters of the neural model for prediction of the maximum methane seam pressure were carried out. The results obtained for the selection of the number of neurons in the hidden layer and their activation functions are presented in Figure 2. The results are shown as the mean values obtained for 100 draws of the training set.
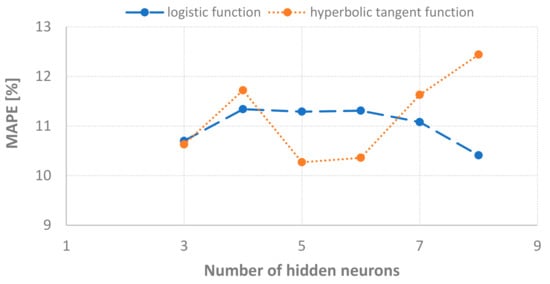
Figure 2.
Selection of neural network parameters for prediction of the maximum methane seam pressure, based on the mean prediction error of the neural model.
Based on the results presented in Figure 2, the use of five neurons (MLP 7-5-1) with a hyperbolic tangent activation function in the hidden layer was considered optimal for estimating the maximum methane seam pressure.
4. Results and Discussion
The final decision on the effectiveness of the considered neural model was made on the basis of examples of the test set consisting of 13 elements. The said examples have not been used before for the neural network training, so the results obtained on their basis could be considered reliable in the context of the network performance assessment. In the case of estimating the average methane seam pressure, the neural network prediction error in relation to the actual values determined using the sorption isotherms was at the level of 6.8% for 100 draws of the training set. For the best fit of the MLP model, an error of 2.6% was obtained in relation to the observed values of the average seam pressure. Detailed results obtained with the use of this model and the corresponding reference values of the considered parameter for examples from the test set are presented in Figure 3.
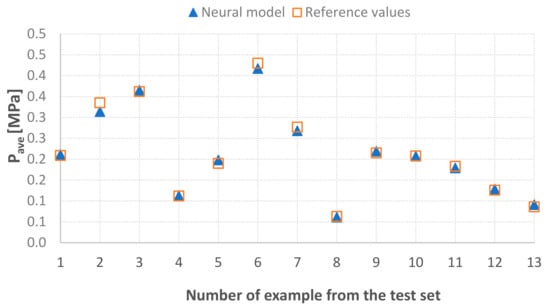
Figure 3.
Summary of the determined values of the average methane seam pressure (pave) and the values returned by the neural network.
Table 1 presents the values of the prediction errors for this model in relation to the reference values of the average methane seam pressure, determined for the subsequent examples of the test set.

Table 1.
Summary of the prediction errors of the developed neural model for the subsequent examples of the test set, determined for the average methane seam pressure (see Figure 3).
For the considered fit, the correlations between the values returned by the neural network and the reference values for the training, validation and test sets were also determined. The obtained dependencies are presented in Figure 4.
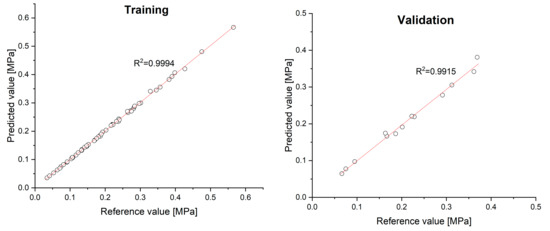
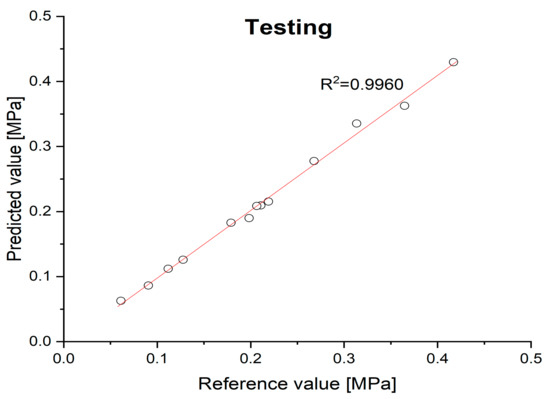
Figure 4.
Dependencies between the values of the average methane seam pressure predicted by the neural network and the reference values determined for the training, validation and test sets.
The analysis of the charts in Figure 4 shows that in each of the three stages, i.e., training, validation and testing of the network, strong dependencies between the values determined by the neural network and the designated reference values of the average seam pressure were achieved. In each case, the value of the determination coefficient exceeded 0.99, which is evidence of very good predictive abilities of the neural model developed.
The analysis of the sensitivity of the neural network showed (Table 2) the greatest sensitivity to changes in the mean value of methane-bearing capacity, and the lowest to changes in the depth of the seam deposition.
Table 2.
Analysis of the neural network sensitivity for prediction of the average methane seam pressure.
A similar procedure was carried out to assess the effectiveness of the neural model designed to predict the maximum methane seam pressure. In this case, the mean value of the neural network matching criterion, determined for 100 draws of the training set, was 10.3%, while the lowest value of the criterion (corresponding to the best fit of the neural model) was 3.04% in relation to the actual values of the maximum seam pressure. Detailed prediction results obtained for the model with the best fit and the corresponding reference values of the parameter under consideration, determined for the test set, are presented in Figure 5.
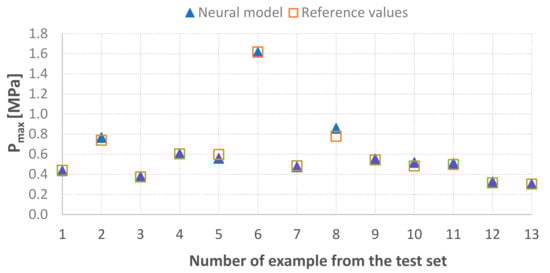
Figure 5.
Summary of the determined values of the maximum methane seam pressure (pmax) and the values returned by the neural network.
Table 3 presents the values of the prediction errors for this model in relation to the actual values of the maximum methane seam pressure, determined for the subsequent examples of the test set.
Table 3.
Summary of the prediction errors of the developed neural model for the subsequent elements of the test set, determined for the maximum methane seam pressure (see Figure 5).
For the neural model in question, the correlations between the output values returned and the reference values of the maximum seam pressure were determined. These correlations were determined for the training, validation and test sets (Figure 6).
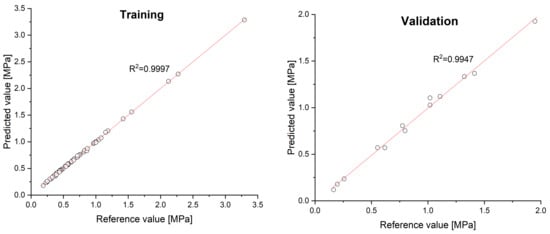
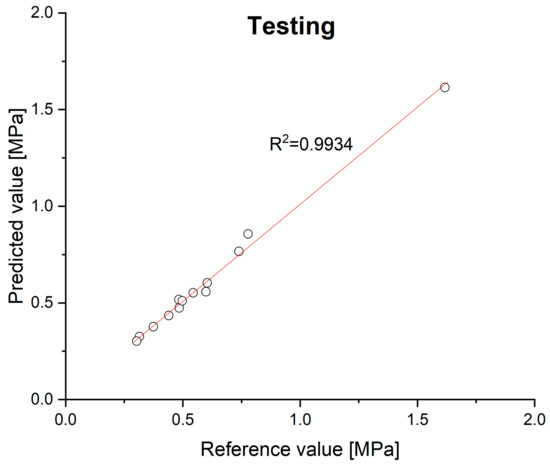
Figure 6.
Dependencies between the values of the maximum methane seam pressure predicted by the neural network and the values determined for the training, validation and test sets.
In the case of the prediction of the maximum seam pressure of methane, strong dependencies were observed between the results obtained by the neural model and the determined values of the estimated parameter. For each of the extracted data sets, the obtained determination coefficients were close to the value of 1 (Figure 6), which in combination with the previous results (Figure 5 and Table 3) allows a conclusion of very good predictive abilities of the neural model developed.
The analysis of the sensitivity of the neural network showed (Table 4) the greatest sensitivity to changes in the mean value of methane bearing capacity, and the lowest to changes in the real density and porosity.
Table 4.
Analysis of the neural network sensitivity for prediction of the maximum methane seam pressure.
5. Conclusions
The presented research focused on the development of neural models for prediction of the methane seam pressure values. This parameter is considered to be of particular importance in terms of the potential risk of coal and gas outbursts in coal mines. Within the framework of the research works, two neural models based on MLP networks were developed. One was used to predict the average value of methane seam pressure, while the other determined its maximum value. The conducted analyses showed that the optimal solution for both models was the use of hidden neurons with a hyperbolic tangent activation function. The size of the hidden layer was determined experimentally, and it was 6 and 5 neurons for the prediction of the average and maximum methane seam pressures, respectively. For both considered parameters, high correlation between the values indicated by the neural network and the reference values determined on the basis of sorption isotherms was demonstrated. The fit of the developed neural models with the actual data was each time assessed on the basis of the adopted criterion. In line therewith, the prediction error of the average methane seam pressure for 100 draws of the training set was 6.8%, while the best fit was burdened with an error of 2.59%. For the maximum seam pressure, the mean prediction error was 10.27%, while the best fit differed by 3.04% from the reference values of the parameter. The correlations between the values predicted by the neural network and the values observed for the training, validation and test sets were also determined. The obtained values of the determination coefficients (in each case exceeding the value of 0.99) confirmed the very good predictive abilities of the models developed. The obtained results indicate a high potential for the application of the proposed methodology in practice, thus eliminating the difficulties associated with determination of the seam pressure using the traditional methods. This mainly concerns technical difficulties associated with direct measurement and the time-consuming nature of indirect measurement. In this way, the proposed method can contribute to the improvement of work safety in underground coal mines.
Some limitation of the presented study is the number of tested coal samples. At that point, the time-consuming nature of sorption measurements, determined primarily by the size of the grains of the investigated coal material, should be indicated. In the presented study, for the 0.125–0.160 mm grain fraction, this translates into some 10 months of work for all conducted sorption measurements. Therefore, it is considered important to continue the research with a larger number of samples with different sorption properties.
Author Contributions
Conceptualization, M.S., M.M. and B.D.; methodology, M.S. and M.M.; software, M.S.; validation, M.S.; formal analysis, M.S., B.D. and M.M.; investigation, M.S. and M.M.; resources, B.D.; writing—original draft preparation, M.S. and B.D.; writing—review and editing, M.M.; visualization, M.S.; supervision, M.M. All authors have read and agreed to the published version of the manuscript.
Funding
This research received no external funding.
Data Availability Statement
The data used to support the findings of this study are available from the corresponding author upon request.
Acknowledgments
The research was funded in the framework of the statutory works of the Strata Mechanics Research Institute of the Polish Academy of Sciences and by a subsidy from the Faculty of Geology, Geophysics and Environmental Protection of AGH University of Science and Technology in Krakow.
Conflicts of Interest
The authors declare no conflict of interest.
References
- Xie, J.L.; Xu, J.L. Effect of key stratum on the mining abutment pressure of a coal seam. Geosci. J. 2017, 21, 267–276. [Google Scholar] [CrossRef]
- Wang, L.; Cheng, Y.; Wang, L.; Guo, P.; Li, W. Safety line method for the prediction of deep coal-seam gas pressure and its application in coal mines. Saf. Sci. 2012, 50, 523–529. [Google Scholar] [CrossRef]
- Lama, R.D.; Bodziony, J. Outbursts of Gas, Coal and Rock in Underground Coal Mines; Australia R.D. Lama & Associates: Wollongong, Australia, 1996. [Google Scholar]
- Yin, W.; Fu, G.; Yang, C.; Jiang, Z.; Zhu, K.; Gao, Y. Fatal gas explosion accidents on Chinese coal mines and the characteristics of unsafe behaviors: 2000–2014. Saf. Sci. 2017, 92, 173–179. [Google Scholar] [CrossRef]
- Xie, J.; Xu, J.; Wang, F. Mining-induced stress distribution of the working face in a kilometer-deep coal mine—A case study in Tangshan coal mine. J. Geophys. Eng. 2018, 15, 2060–2070. [Google Scholar] [CrossRef]
- Skoczylas, N.; Wierzbicki, M. Evaluation and management of the gas and rock outburst hazard in the light of international legal regulations. Arch. Min. Sci. 2014, 59, 1119–1129. [Google Scholar] [CrossRef]
- Dutka, B. Effect of depth on the sorption capacity of coals affected by outburst hazard. Fuel 2021, 306, 121611. [Google Scholar] [CrossRef]
- Shi, X.; Song, D.; Qian, Z. Classification of coal seam outburst hazards and evaluation of the importance of influencing factors. Open Geosci. 2017, 9, 295–301. [Google Scholar] [CrossRef]
- Skoczylas, N. Coal seam methane pressure as a parameter determining the level of the outburst risk—Laboratory and in situ research. Arch. Min. Sci 2012, 57, 861–869. [Google Scholar] [CrossRef]
- Skoczylas, N. Estimating gas and rock outburst risk on the basis of knowledge and experience—The expert system based on fuzzy logic. Arch. Min. Sci. 2014, 59, 41–52. [Google Scholar] [CrossRef]
- Dutka, B.; Godyń, K. Predicting variability of methane pressure with depth of coal seam. Przem. Chem. 2018, 97, 1344–1348. [Google Scholar] [CrossRef]
- Cui, X.; Zhang, J.; Guo, L.; Gong, X. A New Method for the Measurement of Gas Pressure in Water-Bearing Coal Seams and Its Application. Geofluids 2020, 2020, 8881063. [Google Scholar] [CrossRef]
- Skoczylas, N.; Pajdak, A.; Kudasik, M.; Braga, L. CH4 and CO2 sorption and diffusion carried out in various temperatures on hard coal samples of various degrees of coalification. J. Nat. Gas Sci. Eng. 2020, 81, 103449. [Google Scholar] [CrossRef]
- Wierzbicki, M. Changes in the sorption/diffusion kinetics of a coal-methane system caused by different temperatures and pressures. Miner. Resour. Manag. (Gospod. Surowcami Miner.) 2013, 29, 155–168. [Google Scholar] [CrossRef][Green Version]
- Cheng, Y.P.; Wang, L.; Zhang, X.L. Environmental impact of coal mine methane emissions and responding strategies in China. Int. J. Greenh. Gas Control 2011, 5, 157–166. [Google Scholar] [CrossRef]
- Wang, H.; Wang, E.; Li, Z.; Shen, R.; Liu, X.; Zhang, Q.; Li, B. Study and application of dynamic inversion model of coal seam gas pressure with drilling. Fuel 2020, 280, 118653. [Google Scholar] [CrossRef]
- Zhou, A.; Zhang, M.; Wang, K.; Elsworth, D.; Wang, J.; Fan, L. Airflow disturbance induced by coal mine outburst shock waves: A case study of a gas outburst disaster in China. Int. J. Rock Mech. Min. Sci. 2020, 128, 104262. [Google Scholar] [CrossRef]
- The Law of the People’s, Republic of China on Safety in Mines. Available online: http://www.npc.gov.cn/zgrdw/englishnpc/Law/2007-12/12/content_1383872.htm (accessed on 21 September 2021).
- Konopko, W. (Ed.) Work Safety in Hard Coal Mines; Natural Hazards; Central Mining Institute: Katowice, Poland, 2013; Volume 2. (In Polish) [Google Scholar]
- Sporysz, G. Assessment of the Methane Hazard in the South-Eastern Part of the Upper Silesian Coal Basin. Ph.D. Thesis, AGH University of Science and Technology, Cracow, Poland, 2009. (In Polish). [Google Scholar]
- State Administration of Work Safety. The Direct Measuring Method of the Coal Seam Gas Pressure in Mine; State Administration of Work Safety: Beijing, China, 2007. [Google Scholar]
- Hawkins, J.; Blakeslee, S. On Intelligence: How a New Understanding of the Brain Will Lead to the Creation of Truly Intelligent Machines; St. Martin’s Publishing Group: New York, NY, USA, 2005. [Google Scholar]
- Jiang, C.; Jiang, M.; Xu, Q.; Huang, X. Expectile regression neural network model with applications. Neurocomputing 2017, 247, 73–86. [Google Scholar] [CrossRef]
- Wen, J.; Han, P.F.; Zhou, Z.; Wang, X.S. Lake level dynamics exploration using deep learning, artificial neural network, and multiple linear regression techniques. Environ. Earth Sci. 2019, 78, 222. [Google Scholar] [CrossRef]
- Jeon, J.H.; Yang, S.S.; Kang, Y.J. Estimation of sound absorption coefficient of layered fibrous material using artificial neural networks. Appl. Acoust. 2020, 169, 107476. [Google Scholar] [CrossRef]
- Ghorbani, B.; Arulrajah, A.; Narsilio, G.; Horpibulsuk, S.; Bo, M.W. Dynamic characterization of recycled glass-recycled concrete blends using experimental analysis and artificial neural network modeling. Soil Dyn. Earthq. Eng. 2021, 142, 106544. [Google Scholar] [CrossRef]
- Rostami, A.; Baghban, A.; Mohammadi, A.H.; Hemmati-Sarapardeh, A.; Habibzadeh, S. Rigorous prognostication of permeability of heterogeneous carbonate oil reservoirs: Smart modeling and correlation development. Fuel 2019, 236, 110–123. [Google Scholar] [CrossRef]
- Mahdaviara, M.; Menad, N.A.; Ghazanfari, M.H.; Hemmati-Sarapaedeh, A. Modeling relative permeability of gas condensate reservoirs: Advanced computational frameworks. J. Pet. Sci. Eng. 2020, 189, 106929. [Google Scholar] [CrossRef]
- Chu, J.; Liu, X.; Zhang, Z.; Zhang, Y.; He, M. A novel method overcoming overfitting of artificial neural network for accurate prediction: Application on thermophysical property of natural gas. Case Stud. Therm. Eng. 2021, 28, 101406. [Google Scholar] [CrossRef]
- Li, J.; Yao, X.; Xu, K. A comprehensive model integrating BP neural network and RSM for the prediction and optimization of syngas quality. Biomass Bioenergy 2021, 155, 106278. [Google Scholar] [CrossRef]
- Hu, J.; Zhao, W.; Tang, J.; Luo, Q. Integrating a softened multi-interval loss function into neural networks for wind power prediction. Appl. Soft Comput. 2021, 113, 108009. [Google Scholar] [CrossRef]
- Li, A.; Xiao, F.; Zhang, C.; Fan, C. Attention-based interpretable neural network for building cooling load prediction. Appl. Energy 2021, 299, 117238. [Google Scholar] [CrossRef]
- Li, M.; Yan, C.; Liu, W. The network loan risk prediction model based on Convolutional neural network and Stacking fusion model. Appl. Soft Comput. 2021, 113, 107961. [Google Scholar] [CrossRef]
- Choi, S.; Kim, Y.J. Artificial neural network models for airport capacity prediction. J. Air Transp. Manag. 2021, 97, 102146. [Google Scholar] [CrossRef]
- Zhai, L.; Yang, Y.; Song, S.; Ma, S.; Zhu, X.; Yang, F. Self-supervision Spatiotemporal Part-Whole Convolutional Neural Network for Traffic Prediction. Phys. A 2021, 579, 126141. [Google Scholar] [CrossRef]
- Vachik, S.D.; Dutta, K. Comparison of Regression model, Feed-forward NeuralNetwork and Radial Basis Neural Network for Software Development Effort Estimation. ACM SIGSOFT Softw. Eng. Notes 2011, 36, 1–5. [Google Scholar] [CrossRef]
- Mohebbi, A.; Kaydani, H. Permeability estimation in petroleum reservoir by metaheuristics: An overview. In Artificial Intelligent Approaches in Petroleum Geosciences; Springer: Berlin/Heidelberg, Germany, 2015; pp. 269–285. [Google Scholar]
- Niazian, M.; Sadat Noori, S.A.; Abdipour, M. Modeling the seed yield of Ajowan (Trachyspermum ammi L.) using artificial neural network and multiple linear regression models. Ind. Crops Prod. 2018, 117, 224–234. [Google Scholar] [CrossRef]
- Specht, D.F. A general regression neural network. IEEE Trans. Neural Netw. 1991, 2, 568. [Google Scholar] [CrossRef] [PubMed]
- Bianchini, M.; Frasconi, P.; Gori, M. Learning without local minima in radial basis function networks. IEEE Trans. Neural Netw. 1995, 6, 749. [Google Scholar] [CrossRef]
- Zhao, Y.; Wang, C.; Ning, L.; Zhao, H.; Bi, J. Pore and fracture development in coal under stress conditions based on nuclear magnetic resonance and fractal theory. Fuel 2022, 309, 122112. [Google Scholar] [CrossRef]
- Golsanami, N.; Zhang, X.; Yan, W.; Yu, L.; Dong, H.; Dong, X.; Cui, L.; Jayasuriya, M.N.; Fernando, S.G.; Barzgar, E. NMR-Based Study of the Pore Types’ Contribution to the Elastic Response of the Reservoir Rock. Energies 2021, 14, 1513. [Google Scholar] [CrossRef]
- Liu, W.; Wang, G.; Han, D.; Xu, H.; Chu, X. Accurate characterization of coal pore and fissure structure based on CT 3D reconstruction and NMR. J. Nat. Gas Sci. Eng. 2021, 96, 104242. [Google Scholar] [CrossRef]
- Golsanami, N.; Bakhshi, E.; Yan, W.; Dong, H.; Barzgar, E.; Zhang, G.; Mahbaz, B. Relationships between the geomechanical parameters and Archie’s coefficients of fractured carbonate reservoirs: A new insight. Energy Sources Part A 2020, 1–25. [Google Scholar] [CrossRef]
- Karimpouli, S.; Tahmasebi, P. Segmentation of digital rock images using deep convolutional autoencoder networks. Comput. Geosci. 2019, 126, 142–150. [Google Scholar] [CrossRef]
- Skiba, M.; Młynarczuk, M. Estimation of Coal’s Sorption Parameters Using Artificial Neural Networks. Materials 2020, 13, 5422. [Google Scholar] [CrossRef] [PubMed]
- Godyń, K.; Dutka, B.; Chuchro, M.; Młynarczuk, M. Synergy of Parameters Determining the Optimal Properties of Coal as a Natural Sorbent. Energies 2020, 13, 1967. [Google Scholar] [CrossRef]
- Dutka, B.; Godyń, K. Coalification as a Process Determining the Methane Adsorption Ability of Coal Seams. Arch. Min. Sci. 2021, 66, 181–195. [Google Scholar] [CrossRef]
- Cybenko, G. Approximation by superpositions of a sigmoidal function. Math. Control Signal. 1989, 2, 303–314. [Google Scholar] [CrossRef]
- Hornik, K.; Stinchcombe, M.; White, H. Multilayer feedforward networks are universal approximators. Neural Netw. 1989, 2, 359–366. [Google Scholar] [CrossRef]
- Ghorbani, B.; Arulrajah, A.; Narsilio, G.; Horpibulsuk, S.; Bo, M.W. Shakedown analysis of PET blends with demolition waste as pavement base/subbase materials using experimental and neural network methods. Transp. Geotech. 2021, 27, 100481. [Google Scholar] [CrossRef]
Publisher’s Note: MDPI stays neutral with regard to jurisdictional claims in published maps and institutional affiliations. |
© 2021 by the authors. Licensee MDPI, Basel, Switzerland. This article is an open access article distributed under the terms and conditions of the Creative Commons Attribution (CC BY) license (https://creativecommons.org/licenses/by/4.0/).