Abstract
Regulating the frequencies of power grids by controlling electric vehicle charging and discharging, known as vehicle-to-grid (V2G) ancillary services, is a promising and profitable means of providing flexibility that integrates variable renewable energy (VRE) into traditional power systems. However, the ancillary services market is a niche, and the scale, saturation, and time-dependency are unclear when assuming future changes in the power system structure. We studied the marginal value of V2G ancillary services as a balancing capacity of the power system operation on the load-frequency control (LFC) timescale and evaluated the reasonable maximum capacity of the LFC provided by V2G. As a case study, we assumed that the Japanese power system would be used under various VRE penetration scenarios and considered the limited availability time of V2G, based on the daily commuter cycle. The power system operation was modeled by considering pumped storage, interconnection lines, and thermal power–partial load operations. The results show that the marginal value of V2G was greater during the daytime than overnight, and the maximum cost saving (USD 705.6/EV/year) occurred during the daytime under the high-VRE scenario. Improving the value and size of V2G ancillary services required coordination with energy storage and excess VRE generation.
1. Introduction
The destabilization of power systems due to the uncertainties in variable renewable energy (VRE) impedes the further deployment of VRE and the realization of a more sustainable society. To address this issue, it is necessary to enhance power system flexibility by integrating both supply- and demand-side resources []. A technology that allows bidirectional power flow from electric vehicles (EVs) to the grid by controlling the charging and discharging of EVs offers demand-side flexibility. This technology is known as vehicle-to-grid (V2G) technology []. Aggregated EV fleets are expected to provide energy and ancillary services for the system-wide (transmission level) or local network (low-voltage and medium-voltage distribution grids) level by taking advantage of their high responsiveness []. However, stakeholders need to better understand and appreciate the benefits of V2G when promoting and supporting its adoption.
Economic analysis has shown that revenue from V2G ancillary services to system-wide level (e.g., frequency regulation and spinning reserves) can offset the high capital cost of EVs, and previous findings have shown that this is a major motivation for introducing V2G []. Furthermore, a previous study was conducted to analyze the economics of V2G ancillary services to spinning reserves with an EV fleet that could connect to the Electricity Reliability Council of Texas electric power system for 2 h, using a unit commitment model []. Researchers have also proposed the dual use of V2G for frequency regulation and peak-load reduction, finding that the revenue from frequency regulation was much larger, but that the two functionalities could be provided together, yielding higher combined revenue []. The simulation results estimate annual benefits ranging between EUR 100 and EUR 1100 per vehicle, which demonstrates that EV owners can obtain significant benefits by providing frequency-controlled normal operation reserves in the Nord Pool market []. A recent review [] explains that ancillary services such as spinning reserves or frequency regulation are argued to be the best cases for V2G and frequency regulation is especially considered the most valuable service that V2G can participate in. The generally accepted practice of participating in the ancillary services market is the assumption that aggregators combine EV fleet clusters to ensure a minimum bid volume []. A previous study employed stochastic travel models to consider the availability of EV fleets and determined that the V2G aggregative communication architecture can improve the reliability of ancillary services []. Because the efficient aggregation of a highly available fleet is important for increasing revenues, statistical estimates have been generated regarding the availability of ancillary services for private EVs for daily home–work commuting []. The results showed that bidding at work was more reliable than bidding at home because of the lower uncertainty. To demonstrate commercial viability of V2G ancillary services, many V2G demonstration projects have focused on frequency regulation []. V2G ancillary service demonstrations have participated in the actual regulation market in the Pennsylvania–New Jersey–Maryland Interconnection in the eastern part of the United States of America [] and in Denmark [].
Motivating V2G penetration is currently limited due to concerns that the market is a niche one and that its value will decrease due to saturation [,,,,,]. However, these studies used prices and marginal costs based on the market at the time and did not account for future changes in the power system structure. In the future, the value of flexibility and the size of the power market may differ due to the historical structure, VRE penetration, network evolution, and the availability of technology options. For example, the flexibility demand of a power system was found to increase with VRE penetration in Europe and Germany []. Furthermore, investigators have reviewed several technology options and market designs that provide flexibility for power system management, and V2G represents only a single demand-side option [,], although it is one of the most cost-effective options []. Therefore, to assess the value of V2G in future power systems, a supply and demand analysis model that explicitly analyzes power system operations specific to each country is needed. The availability of the EV fleet should also be considered.
A Spanish case study [] was conducted to investigate various scenarios of combined VRE and EV penetration levels in the Spanish electricity system using a medium-term operational model that calculated the power generation dispatch and optimized the charging/discharging of EVs, based on five different driving patterns and hourly power system operations. The authors of that study highlighted the benefits of combining high levels of VRE and EV penetration to reduce power system operating costs. Another study [] was performed to investigate the value of V2G focused on spinning reserves in future power scenarios in the UK, by modeling power system operations that considered primary, secondary, and tertiary reserve services using mixed-integer linear programming (MILP). The authors found that when wind power became prevalent, the value of secondary reserve provision by V2G was high with inflexible systems, but low with flexible systems where pumped storage hydroelectricity plants (PSHPs) were utilized. Furthermore, a case study of the German power system [], including interconnection lines to neighboring countries, employed a unit commitment model to analyze the impact of V2G flexibility on the decarbonized power system in 2030.
Although the value of future V2G has been assessed in accordance with national power system scenarios, there is currently a lack of discussion regarding the trends of saturated value relative to the number of EVs participating in the market. Motivating market participation with an aggregated EV fleet requires analysis of the marginal value (revenue in relation to the number of incrementally added EVs), which is the value derived from the niche market. Strbac et al. [] focused on distributed-energy storage systems (ESSs) and analyzed the marginal values of ESSs in terms of ancillary services and market saturation, using an assumed power system model for the UK in 2030. However, evaluation of the marginal value of V2G was not considered. Because EVs are used for mobility purposes, the time period during which they can be connected to the power system to provide flexibility is more limited than that of ESSs. Zhou et al. [] analyzed the value of flexibility of demand-side resources (e.g., EV charging, heat pumps, etc.) and suggested that the marginal value tends to saturate as more resources are added. If the value of flexibility depends on the time of day during which VRE penetration increases, then it is important for stakeholders who utilize V2G to consider when to aggregate vehicles and provide flexibility through V2G.
In this study, we evaluated the marginal value of V2G ancillary service on a load-frequency control (LFC) timescale. The LFC timescale is an ancillary service that corresponds to a secondary frequency-control reserve []. We analyzed the electricity supply and demand using a production-cost model [] that endogenously optimizes the operation of the power system, including generators, hydropumped storage, interconnection lines, and the balancing capacity provided by V2G power control on the LFC timescale (V2G LFC). The operational cost savings of the power system attributable to the V2G LFC were determined considering VRE penetration and EV fleet availability in each interconnected area. As a case study, the Japanese power system in 2030 (with increased VRE penetration and grid-side flexibility) was assumed. The Japanese power supply system is divided into 10 areas joined by grid-interconnector lines in the longitudinal direction and is classified as a “longitudinal transmission system”. The use of interconnected lines has been uncommon to date; however, this is expected to change with the indirect auctioning of power transactions, which started in 2020. Furthermore, the Japanese power system is equipped with several PSHPs []; hence, our study is of interest to other power systems aimed at introducing interconnections and energy storage systems (e.g., batteries and PSHPs) as flexibility measures. We assume that the aggregated EV fleet for V2G consists of private EVs on daily work–home commutes. An analysis of Japanese vehicle driving patterns [] showed that private commuter cars had high switching potential from conventional vehicles to EVs, due to small driving distances, and the fleet behavior was predictable because most activities were between the home and office before and after working hours.
The contributions of this paper are threefold: (a) we evaluated the dependence of the marginal value of LFC timescale flexibility on the hours of the day under various VRE penetration scenarios; (b) the reasonable maximum capacity of the V2G LFC to be provided for the power system was determined by considering the limited availability time based on the duty cycle of commuter EVs; (c) studying changes in the operation of the power system due to V2G LFC revealed that improving the value of the V2G LFC required coordination with storage and excess VRE generation.
This paper is structured as follows: Section 2 describes the production cost model including VRE operations, PSHPs, interconnection power flows, LFC capacity provided by V2G, and a definition of the marginal value of V2G; Section 3 describes scenarios for the Japanese power system in 2030; Section 4 presents the marginal value in power system operations as a result of the V2G LFC; Section 5 discusses our results in relation to previous studies; and our conclusions are presented in Section 6.
2. Materials and Methods
2.1. Production-Cost Model Incorporating V2G on LFC Timescale
This study employed an electric-production cost model formulated in an MILP framework, referred to as ESPRIT-multi-regulation (MR) analysis [], to conduct power supply and demand simulations. ESPRIT-MR analysis can perform power supply and demand analysis for a given area demand, EV fleet load, power plant unit capacity, interconnection capacity, and VRE penetration, including photovoltaic (PV) and wind turbines (WTs). The model can minimize power generation costs with power unit outputs, PSHP operations, VRE curtailment, interconnecting line flows, and supply and demand adjustment flexibility as variables. The constraints that must be satisfied during each hour include the balance between energy demand and supply, the upper and lower output limits of each power unit, the thermal efficiency during partial-load operation, the capacity of the PSHP reservoir, the capacity of the grid-interconnection lines, a sufficient state of charge (SOC) to ensure the required EV fleet load, and the balancing capacity on the LFC timescale (LFC capacity). The required LFC capacity for demand and VRE fluctuations in the power system was approximated and assumed to be the sum of the capacity that is proportional to the hourly power demand and VRE power generation. Based on a previous study [], the available capacity in excess of the required LFC capacity must be ensured by operating thermal, hydro, and PSHPs.
In this study, the available V2G LFC capacity was added to the conventional ESPRIT-MR model to evaluate the value of the V2G LFC. The ensured V2G LFC capacity is optimized with the need for flexibility in each area during each time slot. The limit of available V2G LFC capacity was considered an exogenous variable using the power of the bidirectional charger, the aggregated fleet size, and the existence ratio at home or workplace for each hour, while considering the duty cycle.
This formula is shown below, based on an objective function defined by the minimization of the total annual costs of the power system:
Constraints:
- (1)
- Supply and demand balance: generation and load are balanced considering the power flow of the interconnection lines, at time t, in grid id;
- (2)
- Upper and lower limits of the generator output: the power output of generator i is in the range of upper and lower limits with ensured LFC capacity;
- (3)
- Restriction of the upper and lower limits of the VRE: VRE curtailment is no more than the output;
- (4)
- Interconnection power-flow limits: the power flow of an interconnection line considers the upper and lower limits of the current flow with a margin for the LFC capacity;
- (5)
- Capacity constraints on the PSHPs: the amount of water storage in PSHP is determined by the amount of energy input and output from the previous time, and it must be within the upper and lower storage limits;
- (6)
- Upper and lower limit constraints for the input and output of the PSHPs: the binary variables and , which indicate the operating state, are considered for the upper and lower limits;
- (7)
- Simultaneous constraints on pumping and power generation in the PSHPs: and are binary variables to inhibit simultaneous pumping and generating operation with each unit;
- (8)
- Pumped storage balance constraints: the amount of water storage must be the same at the beginning and end of the day;
- (9)
- Must-run unit constraints;
- (10)
- Maintenance constraints: the generator unit i in maintenance period cannot be operated;
- (11)
- LFC capability restrictions: LFC supply capacity considering generators, interconnection lines operation, and V2G is equal to the LFC demand capacity or more;
- (12)
- Upper and lower limits of the available LFC capacity: LFC supply capacity is less than or equal to the margin capacity of a unit in operation;
- (13)
- Interconnected LFC capacity limits: LFC capacity wheeled on an interconnection line is equal to or less than the margin capacity of the interconnection line, and sum of sending and receiving of the whole system must be balanced;
- (14)
- Available V2G LFC capacity limits: the upper limit of available V2G LFC capacity is proportional to the margin capacity of bidirectional chargers and the number of parked EVs;
- (15)
- EV battery balance: the SOC of the EV battery is determined by the amount of charge and consumption from the SOC of the previous time;
- (16)
- EV charging constraint: EV charging amount is proportional to the number of parked EVs and the rated capacity of the charger excluding the margin capacity for LFC;
- (17)
- EV SOC constraints: the SOC of the EV battery must be within the upper and lower limits, and the same at the beginning and end of the day.
Our model has limitations that merit future research. The power generation cost does not refer to the investment and maintenance costs of the generators. Therefore, the cost savings of power systems through the V2G LFC are evaluated to be lower than those when considering the decommissioning power generation facilities. This model also ignores the impact of the distinction between upward and downward reserves, the C-rate, the SOC, and battery degradation on the ability to provide V2G LFC capacity.
2.2. Defining Marginal Value of V2G LFC
According to previous study [], the marginal value of a variable is the value brought to the system when one additional unit of the variable is added. In our study, this variable corresponded to V2G LFC capacity. Because the value of the whole system refers to the total annual cost savings of the system, it corresponds to the power generation cost savings, excluding the investment costs for the existing facilities. Hence, the marginal value of the V2G LFC can be defined as the derivative of the power generation cost savings with the available V2G LFC capacity. Calculating the marginal value helps determine the maximum size of available V2G LFC capacity in the system. The addition of available V2G LFC capacity was considered reasonable if the cost of one additional unit was lower than the marginal value. Therefore, the marginal value of the maximum available V2G LFC capacity is consistent with the cost of V2G.
3. Case Study
3.1. Japanese Power System
In this study, we simulated the supply and demand of the Japanese electrical power system for one year (8760 h) in 2030, based on scenarios presented in a Japanese government report []. The Japanese electricity supply system is divided into 10 longitudinal areas and is connected by interconnection lines. The annual demand for each area was determined by comparing the total national electricity demand in the energy conversion case of the Japanese government’s report [] with the actual electricity generation of each area in 2013. The average daily electricity demand profile for each area is shown in Figure 1. The power demand of the EV fleet is discussed in Section 3.2. Interconnection lines between the regional grids were provided (except for Okinawa), and their capacities are shown in Table 1. The capacities of the interconnection lines differed according to the direction, and the energy loss due to transmission was assumed to be 0.2~4.1%. LFC adjustments based on the margins of the interconnection lines have yet to be realized, as they are currently under institutional discussion in Organization for Cross-regional Coordination of Transmission Operators (OCCTO) []. Therefore, following previous study [], we assumed that 10% of the interconnection capacity could be used for LFC adjustment.
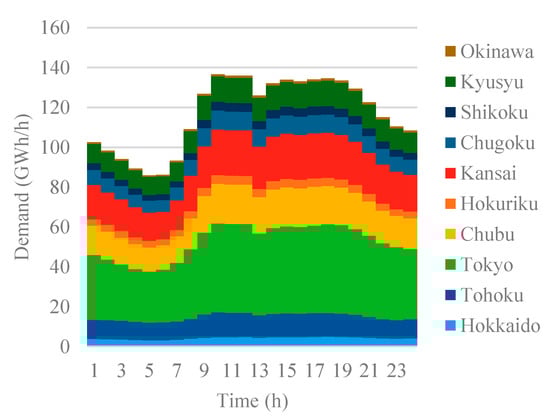
Figure 1.
Average daily power demand in each indicated area.

Table 1.
Interconnection capacities.
The available generation capacity and peak annual electricity demands are shown in Figure 2. VRE capacities were assumed for the three scenarios, as shown in Table 2. The low-capacity scenario was established based on a report by the Japanese government [], and the middle-capacity scenario was based on the resource potential, scale of each area, past implementation results, and industry outlook, with reference to the literature []. The high-capacity scenario was based on regional heterogeneity, and the total national VRE capacity was set to be approximately 1.5 times higher than that of the middle-capacity scenario. The hourly PV power generation output was estimated based on solar radiation, temperature, and wind speed data for each area in 2013. The hourly WT power generation was based on wind farm data recorded in 2013; specifically, those of coal, liquefied natural gas (LNG), and oil thermal generators were set at 106, 200, and 86 units, respectively. The rated capacity, minimum power output, thermal efficiency in partial-load operations, and fuel costs were established for each thermal unit. The fuel cost for partial-load operations was approximated using a piecewise linear cost curve between the rated and minimum power. In Japan, oil, LNG, and coal have the highest fuel costs (in that order), as shown by a typical thermal power generation unit in Table 3. PSHPs are located in areas with high peak demands, such as Tokyo, Kansai, Chubu, and Kyushu. Constant- and variable-speed PSHP generation values were set at 103 and 15 units, respectively. The rated capacity and minimum power output were each fixed, based on these unit values. For all PSHP units, the storage capacity was 8 h, and the efficiency was 0.7. In Figure 2, the other power sources included hydroelectric, nuclear, geothermal, biomass generation, and demand-side cogeneration. These power sources were non-flexible, and their hourly generation values were obtained exogenously and excluded from the optimization target.
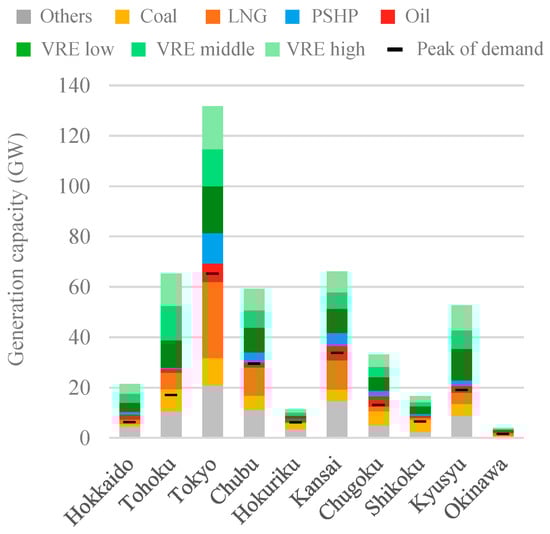
Figure 2.
Generation capacity and peak demand in each area under high-, medium-, and low-VRE penetration scenarios. Abbreviations: LNG, liquefied natural gas; PSHP, pumped storage hydroelectricity plant; VRE, variable renewable energy.
Table 2.
Scenarios of VRE penetration capacities (in GW).
Table 3.
Output and fuel costs of typical thermal power plants.
The balancing capacity on the LFC timescale was modeled as the flexibility of the power system operation in response to VRE and demand fluctuations. In this study, the balancing capacity was assumed to be the same for the upward and downward reserves. The available LFC capacity of the generators was set to ±5% of the rated capacity for thermal power (oil, coal, and LNG), ±20% for hydroelectric power, ±20% for PSHP in generating mode, and ±20% for variable-speed pumping in both generation and pumping modes. It was assumed that coal-fired power plants, which currently have a low LFC supply, could be used in this study. The unit that provided the LFC was optimized using the production-cost model. The available V2G LFC capacity is described in Section 3.2. The required LFC capacity due to VRE was affected by both PV and WT smoothing effects of installations in the corresponding area and the development of regulation technology built into the VRE itself. Measurements and analysis with respect to the required LFC capacity have commenced, but remain unclear. OCCTO is still in the process of understanding the actual operation of flexibility and examining the requirement of upward and downward reserves []. Consequently, the required LFC capacity was assumed as ±2% of the hourly demand fluctuation, ± 5% of the PV output, and ±5% of the WT output. For more specific settings, it is important to reflect the analysis of variability with actual measured data of LFC capacity required for upward and downward reserves.
3.2. EVs
In this study, we modeled a private EV fleet that can be connected to the grid at home and at the workplace, and assumed the power capacity and time available for V2G. The EV stock in Japan was predicted to be 8.96 million by 2030 [], as shown in Table 4, equivalent to approximately 16% of the total number of private passenger cars in 2016. Parking hours on weekdays and holidays were estimated based on a nationwide survey of road traffic in Japan [], as shown in Figure 3. Assuming that the power of the bidirectional charger connected to the EV is ± 6 kW [] and that the available LFC capacity of the charger is 50% of the rated capacity (i.e., the available LFC capacity of V2G is ±3.0 kW/EV), the nationwide potential of the available V2G LFC capacity was approximately calculated to be ±8000 MW at the workplace from 9:00 to 17:00 on weekdays (if 30% of EVs could be aggregated) and approximately ±24,000 MW at the home overnight (if 90% of EVs could be aggregated). The available V2G LFC capacity in each area was assumed to be allocated by the EV stock.
Table 4.
Electric vehicle (EV) stock in each area (in millions).
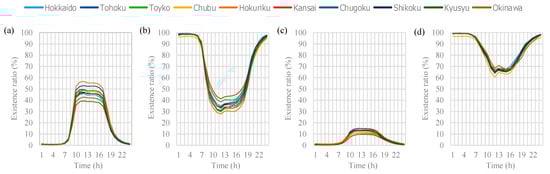
Figure 3.
Hourly existence ratio of EVs in each area: (a) weekdays at the workplace, (b) weekdays at home, (c) holidays at the workplace, and (d) holidays at home.
The electricity demand of the private EV fleet was assumed as follows. Based on a nationwide survey, the annual average mileage of private cars was approximately 5326.5 km/year/vehicle []. Assuming an EV efficiency of 7.0 km/kWh, the annual electricity demand was approximately 894.7 kWh/year/EV. Assuming that each EV starts charging at 3.0 kW immediately after returning home to recover its SOC, the total charging pattern of the EVs was calculated, as shown in Figure 4. Although peak demand occurred in the evening, it was small compared to the demand shown in Figure 1 and therefore had a minor impact on the power system. It was assumed that sufficient chargers exist and that all EVs could be connected to a charger. A method to control the timing and amount of electricity demand is known as smart charging, but this study did not consider smart charging because it focused on evaluating the value of controlling the power flow from EVs to the grid in terms of available LFC capacity.
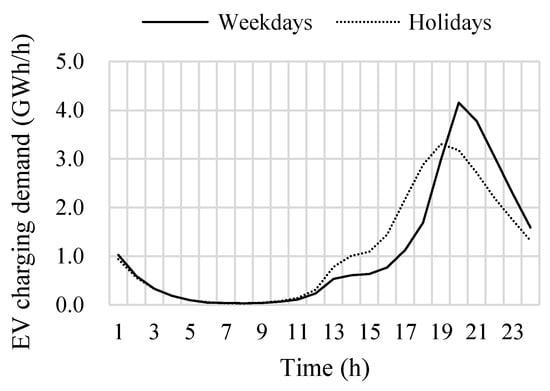
Figure 4.
Total electricity demands for EV charging in all areas.
3.3. Simulations
Six scenarios were investigated by combining three scenarios of VRE penetration and two scenarios of the available hours for V2G LFC (shown below in this section). The available V2G LFC capacity was set in steps, with the upper limit being 8000 MW in both V2G scenarios, based on the nationwide potential at the workplace from 9:00 to 17:00 on weekdays (see Section 3.2. The provision of available V2G LFC capacity was assumed to be superimposed on the EV charging pattern in Figure 4, and time shifting of electricity demands or arbitrage by charging/discharging control was not considered.
- ●
- VRE penetration scenario:
- (1)
- Low: PV, 64.3 GW; WT, 10.7 GW;
- (2)
- Middle: PV, 103.4 GW; WT, 32.2 GW;
- (3)
- High: PV, 155.1 GW; WT, 50.3 GW.
- ●
- V2G scenario:
- (1)
- DT: available at the workplace from 9:00 to 17:00 on weekdays;
- (2)
- NT: available at home from 23:00 to 5:00 on weekdays and holidays.
4. Results
4.1. Saturation Analysis
Figure 5 shows the impact of providing LFC capacity by V2G on the annual power generation cost and the marginal value of the V2G LFC capacity, calculated using the production cost model. In all scenarios, power generation cost reductions were saturated with an available V2G LFC capacity of less than 8000 MW. The solid lines represent the power generation cost approximation curves and were created as a quartic function that coincided with the point without V2G and had a slope of zero at the point where the available LFC capacity of the power system became saturated. The marginal values of the V2G LFC capacity, indicated by the dotted lines, were obtained by differentiating the approximate curves of the solid lines. The power generation cost savings attributed to V2G were greater during the daytime than during overnight periods, and the savings increased with higher VRE penetration. Comparing the low and high scenarios, the maximum marginal value increased by approximately 3.2-fold during the daytime (from USD 125 to USD 400/kW/year) and by approximately 2.1-fold overnight (from USD 85 to USD 175/kW/year). The saturated LFC capacity (the available V2G LFC capacity with zero marginal value) increased during both the daytime and overnight with increased VRE penetration. Comparing low and high penetration scenarios showed that the saturated LFC capacity increased from 4950 to 6710 MW during the daytime, and from 2590 to 4740 MW overnight.
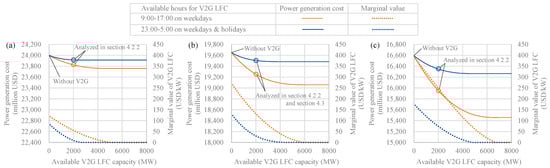
Figure 5.
Annual power generation cost and marginal value of vehicle-to-grid (V2G) load-frequency control (LFC) capacity for each VRE penetration scenario: (a) low, (b) middle, and (c) high.
The reasonable maximum size of the V2G LFC capacity is determined where the marginal value curve crosses a horizontal line corresponding with the assumed V2G cost. In a previous study [], it was predicted that the annual V2G cost in the UK by 2030 will be approximately GBP 450/year, which includes the hardware (7 kW bidirectional charger), battery degradation, aggregator operation, and energy costs. The cost per kW was equivalent to GBP 64.3/kW/year. Considering the current exchange rate (GBP 1.40 = USD 1.00), the annual V2G cost was assumed to be USD 90.0/kW/year in this study.
Table 5 shows the maximum size of V2G LFC capacity, where the V2G cost is consistent with the marginal value shown in Figure 5. In the high-VRE scenario, the daytime V2G LFC had the largest capacity at approximately 4450 MW, and there was no capacity at night in the low-VRE scenario. The EV fleet size, assumed to be 3 kW per EV, is also shown in Table 5. Comparing the low and high cases, the fleet size increased from approximately 0.292 million to 1.483 million vehicles in the daytime and from 0 to approximately 0.542 million vehicles overnight. The power generation cost saving per EV was calculated by dividing the integral of the marginal value by the fleet size, and the maximum saving was USD 705.6/EV per year during the daytime in the high-VRE scenario.
Table 5.
Characteristics of market saturation by V2G LFC.
4.2. Power System Operation
In this section, we examine changes in the power system operations to determine the mechanisms of power generation cost savings through the V2G LFC.
4.2.1. Power System Operation without V2G
Several cases without V2G were investigated to understand basic power system operations. Figure 6 shows the average daily patterns of the annual nationwide supply and demand balance in the different VRE scenarios without V2G. Thermal power generation from LNG and coal peaked at approximately 17:00 to 21:00. Fuel costs are higher during these hours because the thermal generators start up in order from the lowest-cost unit. To save fuel, PSHPs were mainly discharged between 17:00 and 21:00. In the low-VRE scenario, VRE curtailment was rare. Conversely, VRE curtailment increased during the daytime when PV generation was greater under the middle- and high-VRE scenarios, although PSHP charging and discharging were more active. The high-VRE penetration scenario resulted in a more marked decline in LNG capacity compared to coal; however, power generation from LNG after 17:00 was still greater than that at other times.
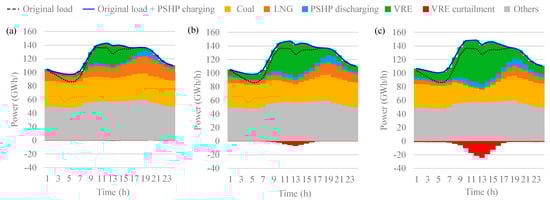
Figure 6.
Average daily energy balance of the national grid under different VRE penetration scenarios without V2G: (a) low, (b) middle, and (c) high.
Figure 7 shows the balancing capacity on the LFC timescale for the different VRE scenarios without V2G. In this study, the required LFC capacity was assumed to be the same in both the up and down directions; therefore, only the upward directional data are shown here. The LFC capacity was mainly ensured by the PSHPs, followed by thermal generators (coal and LNG) in all VRE scenarios. The dotted and solid lines in the figure represent the required LFC capacities before and after VRE curtailment, respectively. Under the middle- and high-VRE scenarios, the difference between the lines was pronounced from 9:00 to 17:00, indicating that the available LFC capacity was insufficient during these hours.
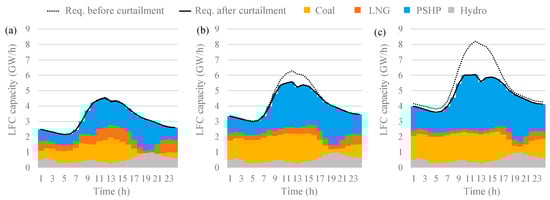
Figure 7.
Average daily LFC capacity balance for the national grid under different VRE penetration scenarios without V2G: (a) low, (b) middle, and (c) high.
4.2.2. Power System Operation Changes by V2G LFC
This section presents an analysis of the changes in power system operations, focusing on the case in which the available V2G LFC capacity was 2016 MW, indicated by circle symbols in Figure 5. The average daily patterns of the changes in annual power generation between the case without V2G (Figure 6) and the case with V2G LFC during the daytime are shown in Figure 8. Here, the change in total power generation, indicated by solid lines, is synonymous with changes in PSHP charging. Characteristic changes in power system operations across three time periods (0:00–9:00, 9:00–17:00, and 17:00–24:00) were observed. Under the middle- and high-VRE scenarios, VRE power generation from 9:00 to 17:00 increased markedly, and curtailment was reduced. Part of the VRE power generation was stored in PSHPs from 9:00 to 17:00, and PSHP discharge reduced LNG and coal generation after 17:00. LNG and coal power generation for PSHP charging decreased from 0:00 to 9:00 because PSHP discharge was reduced from 9:00 to 17:00. Thus, providing daytime V2G LFC capacity not only increased VRE generation, but also reduced thermal power generation by causing changes in the PSHP operations. The changes in PSHP operations were more pronounced in situations where VRE generation was more curtailed. In other words, improving the value of V2G LFC required coordination with storage and excess VRE generation.
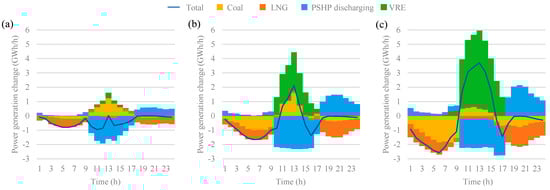
Figure 8.
Average daily power generation change by daytime V2G (the available V2G LFC capacity is 2016 MW) under different VRE penetration scenarios: (a) low, (b) middle, and (c) high.
The change in the average daily pattern of the ensured LFC capacity caused by daytime V2G is shown in Figure 9. Under the low-VRE scenario, V2G replaced the thermal power and the PSHP. Under the middle- and high-VRE scenarios, the total LFC capacity increased, indicating that V2G LFC capacity helped to reduce the curtailment of VRE. The ensured LFC capacity of the PSHP decreased from 9:00 to 17:00 and replaced thermal power after 17:00.
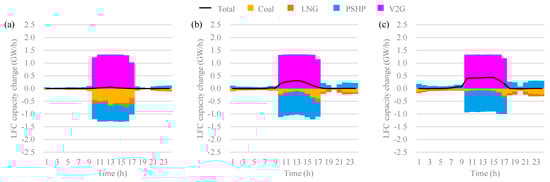
Figure 9.
Average daily change of ensured LFC capacity by daytime V2G (the available V2G LFC capacity is 2016 MW) under different VRE penetration scenarios: (a) low, (b) middle, and (c) high.
The changes in the average power generation caused by the overnight V2G LFC are shown in Figure 10. Under the low-VRE scenario, LNG replaced coal from 23:00 to 5:00 when V2G provided the LFC capacity. Under the middle-VRE scenario, the PSHP discharge markedly decreased from 23:00 to 5:00 and shifted to reduce expensive LNG from 17:00 to 22:00. Under the high-VRE scenario, VRE increased (WT avoided curtailment) from 23:00 to 5:00, and PSHP discharge further decreased the LNG capacity from 17:00 to 22:00. These results indicate that overnight V2G LFC produced fuel-cost savings during those hours and that, under higher VRE scenarios, the thermal power was reduced by shifting the PSHP discharge from 17:00 to 22:00. The change in the ensured LFC capacity caused by the overnight V2G LFC is shown in Figure 11. The V2G LFC capacity replaced other resources during providing hours, and the total ensured LFC capacity increased under the high-VRE scenario.
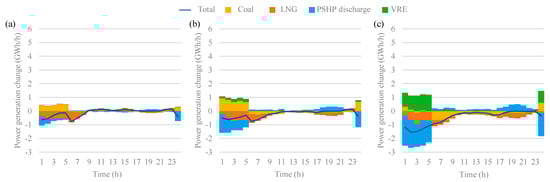
Figure 10.
Average daily power generation changes by overnight V2G (available V2G LFC capacity: 2016 MW) under different VRE penetration scenarios: (a) low, (b) middle, and (c) high.
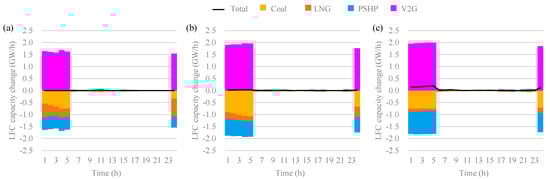
Figure 11.
Average daily changes of ensured LFC capacity by overnight V2G (available V2G LFC capacity: 2016 MW) under different VRE penetration scenarios: (a) low, (b) middle, and (c) high.
Table 6 shows the annual fuel-cost reductions for LNG and coal and the reduction cost per unit of electricity generation. Under the low-VRE scenario, VRE curtailment was minimal and coal generation increased (shown as negative cost-reduction values). The increased cost per unit of coal generation was approximately USD 2.3–12.9/MWh, which is markedly lower than the fuel cost shown in Table 3. This is because the number of generators in partial-load operation was reduced, and other generators operated more efficiently, thereby minimizing the increased total fuel cost associated with increased power generation. In other cases, the reduced unit costs of coal and LNG were equivalent to the fuel costs of electricity generation in Table 3; hence, it was assumed that coal and LNG were simply reduced or replaced with VRE and PSHPs.
Table 6.
Characteristics of cost reduction by V2G LFC.
4.3. Local Power Systems and Interconnection Operations
In this section, we present changes in interconnection line operations and the internal energy balance of each area, due to V2G. The middle-VRE scenario without V2G is shown in Figure 12 to illustrate the basic power system operations supporting the annual total power generation and the ensured LFC capacity. Power generated and consumed in the local area is referred to as “self,” power procured externally through the interconnection line is referred to as “receive,” and power supplied externally is referred to as “send.” Self-generation predominated in all areas, and the power supply through the interconnection lines was the largest from Tohoku to Tokyo. In terms of the LFC capacity, the LFC was supplied in the opposite direction to the energy supplied between Tokyo and Tohoku. Because flexibility for VRE generation was insufficient in Tohoku, Tohoku received LFC capacity from Tokyo. Consequently, VRE curtailment in Tohoku decreased, and VRE power from Tohoku was consumed in Tokyo. Transfers of LFC capacity also occurred between other areas. For example, LFC capacity was supplied eastward from Chubu to Tokyo, from Kansai to Chubu, and from Shikoku and Chugoku to Kansai.
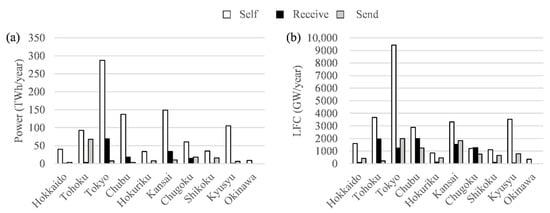
Figure 12.
Annual power system operation in each area and interconnection under the middle-VRE scenario without V2G: (a) power generation and (b) LFC capacity.
Figure 13 shows total annual changes from the basic operations caused by daytime V2G. Reductions in PSHP discharges and thermal power generation (Figure 8b) markedly reduced self-consumption in areas where these sources were abundant, such as Tokyo, Chubu, and Kansai. Energy transfer through interconnected lines increased from areas with abundant VRE and low demand (Tohoku, Kyusyu, and Chugoku) to high-demand areas (Tokyo, Chubu, and Kansai). This is because areas with low demand were unable to consume the increased VRE power generation attributed to V2G. Self-consumption of LFC capacity increased due to the ease of procurement by V2G, as shown in Figure 13b. Conversely, the transfer of the available LFC capacity through interconnected lines decreased.
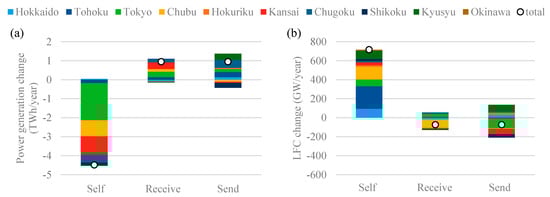
Figure 13.
Annual changes of power system operation for each area and interconnection with daytime V2G under the middle-VRE scenario (the available V2G LFC capacity is 2016 MW), in terms of (a) power generation and (b) LFC capacity.
Figure 14 shows total annual changes in power system operations caused by overnight V2G. The self-consumption and energy transfer from Tohoku to Tokyo through the interconnected lines decreased. Although VRE penetration in Tohoku was higher, overnight curtailment remained low; hence, the emphasis was on mitigating transmission losses. In terms of the LFC capacity, self-consumption increased and transmission decreased because of the ease of procurement in each area attributed to V2G.
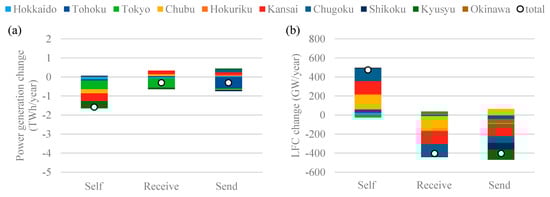
Figure 14.
Annual changes in power system operations for each area and interconnection by overnight V2G under the middle-VRE scenario (the available V2G LFC capacity is 2016 MW), in terms of (a) power generation and (b) LFC capacity.
5. Discussion
In this section, we discuss the relationship between the results of this report and previous studies from two perspectives.
- (1)
- Marginal value of V2G LFC
Figure 5 showed that the marginal value tends to saturate as the available V2G LFC capacity increases. This result quantitatively supports the finding by Sovacool et al. [] that the more participants there are in V2G, the less viable its business case becomes at an individual or an aggregator level, assuming there is more than one V2G aggregator on the market. Furthermore, this paper clarified the dependence of the marginal value of V2G LFC on the hours of the day through the two different scenarios, daytime and overnight. The value of V2G LFC may become clearer in future studies when the analysis considers the availability of competing resources such as ESS and heat pumps. However, individual EV owners’ decision-making in controlling their EVs should be kept in mind: incentives from other services may affect the availability of V2G, such as vehicle-to-home [] and other behind-the-meter services or services for local network [].
- (2)
- Cooperation with energy storage system
In Section 4.2.2, we explained the result that the value of V2G LFC during daytime, which is provided at similar hours as PV generation, is enhanced by PSHP operations under high PV penetration scenario. This result also means that the PSHPs contributed to PV generation that avoided curtailment by V2G with sufficient LFC capacity. Peters et al. [] explored a simplified model to understand basic features of PV storage systems and showed the mechanism to improve the simultaneity between the PV generation and a certain load by ability of storage. Our simulation quantitatively showed that the mechanism can be obtained by the system-wide level production-cost model.
6. Conclusions
In this study, we examined the marginal value of the balancing capacity of V2G on the LFC timescale by considering the market size and saturation trends of ancillary services for future structural changes in the Japanese power system. Production cost simulations were performed under various VRE penetration scenarios with grid-side flexibility, including PSHPs, interconnected lines, and LFC, via the partial-load operation of coal-fired power plants. The aggregated EV fleet used for providing the V2G LFC capacity was assumed to be the private commuter duty cycle, which demonstrated predictable behaviors and was able to connect at both the workplace and home. The marginal value of the V2G LFC capacity was obtained by differentiating the annual power generation cost savings. Based on the marginal value of V2G LFC capacity, the reasonable maximum size of the EV fleet that could be deployed in the ancillary service market was evaluated. Our results quantitatively support the findings of several literatures. The results are as follows.
- The marginal value of the V2G LFC capacity increased with higher VRE penetration. Comparing the low- and high-VRE scenarios showed that the maximum marginal value increased by approximately 3.2-fold during the daytime (from USD 125 to USD 400/kW/year) and by approximately 2.1-fold overnight (from USD 85 to USD 175/kW/year). The reasonable EV fleet size for the power system increased from approximately 292,000 to 1,483,000 vehicles during the day and from 0 to approximately 542,000 vehicles overnight. The maximum cost saving (USD 705.6/EV/year) occurred during the daytime under the high-VRE scenario. Note that this value might be underestimated because it does not reflect the investment and maintenance costs of generators.
- Daytime V2G LFC not only increased daytime VRE generation, but it also reduced thermal power generation by causing changes in the PSHP operations before and after V2G. Under higher VRE penetration scenarios, the VRE that avoided curtailment during the day due to V2G was temporarily stored in the PSHPs, and the discharging of PSHPs in the evening further reduced LNG and coal generation with higher fuel costs. Overnight V2G LFC resulted in cost savings by substituting coal for LNG. Under higher VRE scenarios, VRE that avoided curtailment overnight was stored in PSHPs, and PSHP discharge reduced the evening thermal-generation peak. Improving the value of V2G LFC required coordination with storage and excess VRE generation.
- The transactions of LFC capacity through the interconnected lines decreased because the daytime V2G LFC increased the power system flexibility in each area. Conversely, energy transactions increased from areas with abundant VRE and low demand to areas with high demand. Overnight V2G reduced both the LFC capacity and energy transmission, while mitigating transmission losses.
Our model has limitations that merit future research. First, the impact of the EV battery C-rate and SOC on the available LFC capacity was not considered. In addition, detailed modeling is required based on the distinction between the upward and downward ancillary services. Second, we did not factor in the decision-making of individual EV users. An analytical model that reflects the benefits of demand-side energy management is desirable. Finally, there was a lack of assumptions regarding integration with other newly distributed resources. Future work will incorporate market-saturation trends due to the deployment of stationary battery-storage systems, which serve as a decentralized power source capable of a fast response. It includes some sensitivity analysis and the more specific setting of LFC capacity required for upward and downward reserves. In evaluating multi-use in combination with other timescale electricity markets, it is important to consider demand-response technologies such as heat pumps.
Author Contributions
Conceptualization, R.K; methodology, R.K., K.O. and Y.I.; software, K.O. and Y.I.; validation, R.K.; formal analysis, R.K.; investigation, R.K.; resources, K.O. and Y.I.; data curation, R.K.; writing—original draft preparation, R.K.; writing—review and editing, K.O. and Y.I.; visualization, R.K.; supervision, K.O.; project administration, K.O. All authors have read and agreed to the published version of the manuscript.
Funding
This research received no external funding.
Institutional Review Board Statement
Not applicable.
Informed Consent Statement
Not applicable.
Data Availability Statement
Due to the nature of this research, participants of this study did not agree for their data to be shared publicly, so supporting data are not available.
Acknowledgments
We would like to thank the staff that provided their valuable advice at J-POWER Business Service Corporation.
Conflicts of Interest
The authors declare no conflict of interest.
Nomenclature
| Index | |
| Time slot | |
| Generator unit | |
| Grid | |
| Interconnection line | |
| Index of must-run generator units | |
| Index of must-stop generator units | |
| Index of generator units under maintenance | |
| Parameters | |
| Coefficients | |
| Number of grids | |
| Number of interconnection lines | |
| EV battery efficiency | |
| Variables | |
| (0, offline; 1, online) | |
| (0, offline; 1, online) | |
| (0, offline; 1, online) | |
| LFC capacity to raise at time t | |
References
- International Energy Agency, System Integration of Renewables: An update on Best Practice; IEA: Paris, France, 2018.
- Technology Collaboration Programme on Hybrid and Electric Vehicles (HEV TCP), Hybrid and Electric Vehicles—The Electric Drive Hauls; IEA: Paris, France, 2019; pp. 67–73.
- Venegas, F.G.; Petit, M.; Perez, Y. Active integration of electric vehicles into distribution grids: Barriers and frameworks for flexibility services. Renew. Sustain. Energy Rev. 2021, 145, 111060. [Google Scholar] [CrossRef]
- Kempton, W.; Tomic, J. Vehicle-to-grid power implementation: From stabilizing the grid to supporting large-scale renewable energy. J. Power Sources 2005, 144, 280–294. [Google Scholar] [CrossRef]
- Sioshansi, R.; Denholm, P. The value of plug-in hybrid electric vehicles as grid resources. Energy J. 2010, 31, 1–23. [Google Scholar] [CrossRef] [Green Version]
- White, C.D.; Zhang, K.M. Using vehicle-to-grid technology for frequency regulation and peak-load reduction. J. Power Sources 2011, 196, 3972–3980. [Google Scholar] [CrossRef]
- Arias, N.B.; Hashemi, S.; Andersen, P.B.; Træholt, C.; Romero, R. Assessment of economic benefits for EV owners participating in the primary frequency regulation markets. Int. J. Electr. Power Energy Syst. 2020, 120, 105985. [Google Scholar] [CrossRef]
- Sovacool, B.K.; Kester, J.; Noel, L.; de Rubens, G.Z. Actors, business models, and innovation activity systems for vehicle-to-grid (V2G) technology: A comprehensive review. Renew. Sustain. Energy Rev. 2020, 131, 109963. [Google Scholar] [CrossRef]
- Han, S.; Han, S.; Sezaki, K. Development of an optimal vehicle-to-grid aggregator for frequency regulation. IEEE Trans. Smart Grid 2010, 1, 65–72. [Google Scholar] [CrossRef]
- Quinn, C.; Zimmerle, D.; Bradley, T.H. The effect of communication architecture on the availability, reliability, and economics of plug-in hybrid electric vehicle-to-grid ancillary services. J. Power Sources 2010, 195, 1500–1509. [Google Scholar] [CrossRef]
- Sarabi, S.; Davigny, A.; Courtecuisse, V.; Riffonneau, Y.; Robyns, B. Potential of vehicle-to-grid ancillary services considering the uncertainties in plug-in electric vehicle availability and service/localization limitations in distribution grids. Appl. Energy 2016, 171, 523–540. [Google Scholar] [CrossRef]
- Edwards, T.; Landi, M. “V2G Global Roadtrip: Around the World in 50 Projects” in UK Power Networks and Innovate UK. London, UK. 2018. Available online: http://everoze.com/app/uploads/2018/10/UKPN001-S-01-H-V2G-global-review-compressed.pdf (accessed on 16 September 2021).
- Kempton, W.; Udo, V.; Huber, K.; Komara, K.; Letendre, S.; Baker, S.; Brunner, D.; Pearre, N. A test of vehicle-to-grid (V2G) for energy storage and frequency regulation in the PJM System. In Results from an Industry–University Research Partnership; University of Delawere: Newark, DE, USA, 2009. [Google Scholar]
- Andersen, P.B.; Hashemi, T.S.; Sorensen, T.M.; Christensen, B.E.; Hoj, J.C.M.L.; Zecchino, A. The Parker Project: Final Report; Technical University of Denmark: Bygning, Denmark, 2019. [Google Scholar]
- Kondziella, H.; Bruckner, T. Flexibility requirements of renewable energy based electricity systems– a review of research results and methodologies. Renew. Sustain. Energy Rev. 2016, 53, 10–22. [Google Scholar] [CrossRef]
- Lund, P.D.; Lindgren, J.; Mikkola, J.; Salpakari, J. Review of energy system flexibility measures to enable high levels of variable renewable electricity. Renew. Sustain. Energy Rev. 2015, 45, 785–807. [Google Scholar] [CrossRef] [Green Version]
- Villar, J.; Bessa, R.; Matos, M. Flexibility products and markets: Literature review. Electr. Power Syst. Res. 2018, 154, 329–340. [Google Scholar] [CrossRef]
- Noel, L.; Brodie, J.F.; Kempton, W.; Archer, C.; Budischak, C. Cost minimization of generation, storage, and new loads, comparing costs with and without externalities. Appl. Energy 2017, 189, 110–121. [Google Scholar] [CrossRef] [Green Version]
- Fernandes, C.; Frias, P.; Latorre, J.M. Impact of vehicle-to-grid on power system operation costs: The Spanish case study. Appl. Energy 2012, 96, 194–202. [Google Scholar] [CrossRef]
- Pavic, I.; Capuder, T.; Kuzle, I. Value of flexible electric vehicles in providing spinning reserve services. Appl. Energy 2015, 157, 60–74. [Google Scholar] [CrossRef]
- Hanemann, P.; Behnert, M.; Bruckner, T. Effects of electric vehicle charging strategies on the German power system. Appl. Energy 2017, 203, 608–622. [Google Scholar] [CrossRef]
- Strbac, G.; Aunedi, M.; Pudjianto, D.; Djapic, P.; Teng, F.; Sturt, A.; Jackravut, D.; Sansom, R.; Yufit, V.; Brandon, N. Strategic assessment of the Role and Value of Energy Storage Systems in the UK Low Carbon Energy Future. Technical Report; Energy Futures Lab, Imperial College London for Carbon Trust. 2012. Available online: http://www.efn-uk.org/l-street/politics-lib/gov-agents/index_files/ICLenergy-storage2012.pdf (accessed on 16 September 2021).
- Zhou, E.; Mai, T. Electrification Futures Study: Operational Analysis of US Power Systems with Increased Electrification and Demand-Side Flexibility (No. NREL/TP-6A20-79094); National Renewable Energy Lab. (NREL): Golden, CO, USA, 2021.
- Rebours, Y.G.; Kirschen, D.S.; Trotignon, M.; Rossignoi, S. A survey of frequency and voltage control ancillary services—Part I: Technical features. IEEE Trans. Power Syst. 2007, 22, 350–357. [Google Scholar] [CrossRef]
- Iwafune, Y.; Ogimoto, K.; Azuma, H. Integration of electric vehicles into the electric power system based on results of road traffic census. Energies 2019, 12, 1849. [Google Scholar] [CrossRef] [Green Version]
- International Hydropower Association. 2018 Hydropower Status Report Sector Trends and Insights; IHA: London, UK, 2018. [Google Scholar]
- Ministry of Economy, Trade, and Industry. Long-Term Energy Supply and Demand Outlook. 2015. Available online: https://www.meti.go.jp/english/press/2015/pdf/0716_01a.pdf (accessed on 16 September 2021).
- Organization for Cross-regional Coordination of Transmission Operators. 18th Subcommittee of Balancing Market, Distributed Materials No. 4. 2020. Available online: https://www.occto.or.jp/iinkai/chouseiryoku/jukyuchousei/2020/files/jukyu_shijyo_18_04.pdf (accessed on 5 November 2021). (In Japanese)
- Organization for Cross-Regional Coordination of Transmission Operators. 19th Subcommittee of Balancing Market, Distributed Materials No. 2-2. 2020. Available online: https://www.occto.or.jp/iinkai/chouseiryoku/jukyuchousei/2020/files/jukyu_shijyo_19_02_02.pdf (accessed on 5 November 2021). (In Japanese)
- The Ministry of Land, Infrastructure and Transport. Road Traffic Census Vehicle Origin and Destination Survey; MLIT: Tokyo, Japan. Available online: https://www.e-stat.go.jp/statistics/00600580 (accessed on 5 November 2021). (In Japanese)
- Nichicon Corp. EV Power Station. Available online: https://www.nichicon.co.jp/products/v2h/about (accessed on 16 September 2021). (In Japanese).
- Element Energy. V2GB Vehicle to Grid Britain Report. 2019. Available online: https://www.cenex.co.uk/app/uploads/2019/10/V2GB-Public-Report.pdf (accessed on 16 September 2021).
- Kataoka, R.; Shichi, A.; Yamada, H.; Iwafune, Y.; Ogimoto, K. Comparison of the economic and environmental performance of V2H and residential stationary battery: Development of a multi-objective optimization method for homes of EV owners. World Electr. Veh. J. 2019, 10, 78. [Google Scholar] [CrossRef] [Green Version]
- Peters, I.M.; Breyer, C.; Jaffer, S.A.; Kurtz, S.; Reindl, T.; Sinton, R.; Vetter, M. The role of batteries in meeting the PV terawatt challenge. Joule 2021, 5, 1353–1570. [Google Scholar] [CrossRef]
Publisher’s Note: MDPI stays neutral with regard to jurisdictional claims in published maps and institutional affiliations. |
© 2021 by the authors. Licensee MDPI, Basel, Switzerland. This article is an open access article distributed under the terms and conditions of the Creative Commons Attribution (CC BY) license (https://creativecommons.org/licenses/by/4.0/).