Article

Reducing the Dimensions of the Ship’s Main Switchboard—A Contribution to Energy Efficiency

Faculty of Maritime Studies, University of Split, Ul. Ruđera Boškovića 37, 21000 Split, Croatia
*
Author to whom correspondence should be addressed.
Energies 2021, 14(22), 7567; https://doi.org/10.3390/en14227567
Submission received: 15 October 2021 / Revised: 5 November 2021 / Accepted: 9 November 2021 / Published: 12 November 2021
(This article belongs to the Section F: Electrical Engineering)

Abstract

:
Energy efficiency generally implies the efficient use of energy in all sectors of final consumption—industry, services, agriculture, households and transport. Shipping accounts for nearly 3% of global greenhouse gas emissions, making it the sixth largest CO2 producer in the world. This is a result of inefficient ship design, lack of planning and optimal use of resources. As the transport sector expands, so does the pressure for a greener and cleaner maritime industry. Reducing fuel consumption is a major driver of the need for energy efficiency on ships. In this paper, due to the importance of maritime transport, we observed the impact of reducing the dimensions of the main switchboard as a contribution to energy efficiency. This contribution is not of great importance as is the case with the optimization of the navigation route, etc., but it certainly affects the weight and, thus, the fuel consumption, which contributes to energy efficiency in the designed system. The aim of this paper is to optimize the design of the main switchboard by using 2D simulations of possible bus topologies, in order to develop six different busbar models and find one that best meets the requirements. The simulation results indicate the optimal location and dimensions of the busbars in the main switchboard in accordance with the switchgear parameters. Apart from the change in layout and dimensions of the busbars, the replacement of conventional instrument transformers with new current/voltage sensors contributes to a significant reduction in the weight and size of the switchboard, which ultimately benefits energy efficiency.

1. Introduction

The continuous rise in global average temperatures has raised awareness of the need to reduce energy consumption in all production and transportation processes. The focus is on increasing the energy efficiency of the equipment used to produce, consume and distribute energy, also taking into account the many influences (reducing size and weight of equipment, reducing vibrations, etc.) that have an indirect impact on energy efficiency. Considering that today’s electrical energy production has reached its peak and equipment manufacturers have reduced energy consumption as much as possible, the improvement in electrical energy distribution systems (which can represent up to 15% of total electrical energy losses) is the latest trend to increase energy efficiency in electrical energy use. Engineering practice has shown that increasing the voltage level of the distribution system has reduced distribution losses and resulted in significant energy consumption savings for some types of equipment.
Awareness of energy efficiency has also affected the shipbuilding industry, which has and will have to cope with a higher demand for electrical energy [1]. The increased demands are most evident in large cruise ships. Increasing passenger demands and a growing number of implemented technologies are one of the biggest factors in predictions that energy efficiency must be increased, most viably through higher voltage levels of electrical power distribution. The suitable voltage level is 15/17.5 kV [2].
Bearing this in mind, it is necessary to find a high quality engineering and design solution for a medium voltage transmission/distribution system that will be applicable to ships. Large cruise ships have already implemented these systems, but the Croatian shipbuilding industry has no practice in the application of the improved systems and the existing electrical companies do not have the experience. The main component in the ship’s distribution system is the switchgear. Its design takes into account the fact that the installation location is in the control room, making the reduction of the overall dimensions and mass of the switchgear the main focus of the design process.
The design of an optimized medium voltage switchgear is the subject of the project “Competence Centre for Advanced Mobility (CEKOM)—Development and Construction of Compact Marine Medium Voltage Switch Block 15/17.5 (MMVSB 17.5)” in cooperation with the company “Končar-Electrical Equipment”. The design of the topology of the busbar system is the first step towards realizing the goal of a switchgear with reduced dimensions and mass. The analysis of the temperature rise and electrodynamic forces in the steady-state and short-circuit regime, as well as the analysis of an internal arc fault, dictate the limits of the busbar system design. The tools used to predict the behavior of busbar systems during faults are computer simulations. The lack of previously known experimental values has a major impact on the accuracy of the simulations, as described in [3]. The spatial distribution of the busbars [4] and the dimensions of the busbars with the distances between them [5] have a great influence on the magnitude of the electrodynamic forces. A comparative analysis of different topologies [6] can provide a significant aspect for the direction of busbar design. The importance of busbar supports to reduce the deformations of the busbars in case of a short circuit and the stress on the busbars [7,8,9] must be taken into account, as shown in [10]. Busbar designs without busbar supports [11] should also be considered with the aim of mass reduction if calculated appropriately. The number of rectangular busbars per phase and their orientation also have an influence on the temperature rise [12] and on the magnitude of the electrodynamic forces [13]. The investigations on irregular cross-sections of busbars [14] showed advantages, but the technical realization of these busbars was not considered. The temperature rise in the switchgear [15] is influenced to a certain extent by losses in the bolted joints [16,17], which can be reduced if necessary by slotting the busbar at the joint [18,19].
The main goal of this paper is the optimization of the design with aid from analyzed published works [20,21,22] on the various phenomena in busbar and similar systems. The optimization is based on altering the busbar configuration and component replacement (sensor implementation) that resulted in reducing the busbar (and, consequently, the switchgear) dimensions, weight and lowering losses.
This paper was preceded by the author’s research on six different models, different frequencies and different bus schedules, and in this paper three models are presented. The authors made the choice according to the topology that is harmonized with the equipment designer (in this case Končar) taking into account the magnetic flux density and electromagnetic losses as well as the analysis of operation in short-circuit mode. A 2D model was created in “COMSOL®” [23], an “extremely fine mesh” that resulted in acceptable accuracy with respect to calculation time.
A multi-criteria analysis (Visual PROMETHEE) was also performed as a verification of the selected most favorable model with respect to volume, weight and electromagnetic losses. The purpose is to contribute to energy efficiency by reducing dimensions and weight, while maintaining the functionality of the assembly.
In the second part, the authors explored the further possibility of modification by replacing conventional measuring technologies with new sensors for measuring currents and voltages. Thanks to advances in microprocessor technology that can use low-power signals from sensors, the authors observed the influence of a resistor divider voltage sensor [24] and a Rogowski coil current sensor [25].
The set hypotheses contribute to the overall reduction in the switchboard dimensions and mass while also resulting in a number of the benefits that ultimately contribute to energy efficiency.
Emissions of harmful gases from maritime transport must be limited as well as emissions from road, air and rail transport. The International Maritime Organization (IMO) has therefore made the notion of “energy efficiency” mandatory, so Annex VI of MARPOL has been amended to include Chapter IV on the energy efficiency of ships. Energy efficiency can be achieved in several ways. The concept of energy efficiency for ships refers to the energy efficiency design index (EEDI); ship energy efficiency management plan (SEEMP); energy efficiency operation index (EEOI); IMO Fuel oil consumption Data reporting. EEDI is the tool that is used during the design or construction stage of the vessel. If the ships need to be energy efficient as desired by the IMO, the IMO need to provide two things, the maximum value of EEDI required for the ship (Required EEDI) and the actual value of EEDI attained for the ship (Attained EEDI). Equation (1) [26] presents the EEDI formula.
EEDI = CO 2   emissions Transport   work = ( ME   emissions ) + ( AE   emissions ) + ( shaftgenerators motors   emissions ) ( Efficiency   technologies ) Transport   work
where
-
ME is short for main engine,
-
AE is short for auxiliary engine,
-
Transport work is the product of deadweight tonnage and speed of the ship.
This paper presents the contribution of the working hypothesis, which in fact represents one of the “CEKOM” project’s goals. The adequate choice of busbar dimensions and their configuration allows for the reduction in switchgear dimension, mass and energy losses while fully satisfying the technical requirements for proper operation.

2. Simulation Description

2.1. Electromagnetic Heating Losses Calculation

The busbars are loaded with symmetrical three-phase currents. The double busbar models are assumed to have uniform current distribution, and the currents of the double busbars are given in phasor notation for each conductor (2)–(4).
I a 1 = I 2                               I a 2 = I 2    
I b 1 = I 2 e ( j 2 π 3 )                           I b 2 = I 2 e ( j 2 π 3 )  
I c 1 = I 2 e ( j 4 π 3 )                           I c 2 = I 2 e ( j 4 π 3 )  
where I a 1 and I a 2 are the currents in the conductors of phase A, I b 1 and I b 2 are the currents in the conductors of phase B, I c 1 and I c 2 are the currents in the conductors of phase C and I is the rated current of the system.
In these models, the magnetic permeability in air is assumed to be constant because copper busbars are used in installations. The busbars can be considered to be of infinite length since the conductor spacing between busbars is much smaller than the conductor length, hence, the problem can be considered to be two-dimensional [27].
In these simulations the AC/DC module was used for the modelling of electromagnetic fields in the frequency domain. The used electric current and magnetic field solvers in the AC/DC module are based on the time-domain finite-element solution of the macroscopic electromagnetic analysis subject to certain boundary conditions [28].
The integral form of Maxwell’s equations is written as (5)
H · d l = s ( J + D t ) · d S      
The Lorentz force can be calculated as (6)
F L = I d l × B    
In these simulations, taken from [29,30], the electromagnetic heating multiphysics coupling node represents the electromagnetic losses, Q e , as a heat source in the used first law of thermodynamics, rewritten in terms of temperature and for a solid object (7).
ρ C p T t · ( k T ) = Q e  
The electromagnetic losses Q e are given in (8).
Q e = Q r h + Q m l      
The resistive losses are given in (9).
Q r h = 1 2 R e ( J · E )      
The magnetic losses are given in (10).
Q m l = 1 2 R e ( i ω B · H )
In addition, it maps the electromagnetic surface losses as a heat source on the boundary in the heat transfer part of the model.
Where H is magnetic field strength, D is electric flux density, J is total current density, B is magnetic flux density, I is the rated current, F L is the Lorentz force, ρ is volumetric mass density, C p is the specific heat capacity at constant pressure, T is absolute temperature and K is thermal conductivity.

2.2. Short-Circuit Electrodynamic Forces Calculation

The short-circuit currents [31], used later in the simulations, passing through each busbar are given in (11)–(13).
i a = I m [ s i n ( ω t α ) + s i n ( α ) e t T a ]  
i b = I m [ s i n ( ω t α 2 π 3 ) + s i n ( α + 2 π 3 ) e t T a ]  
    i c = I m [ s i n ( ω t α 4 π 3 ) + s i n ( α + 4 π 3 ) e t T a ]  
The peak value of the short-circuit current and parameter equations [32] are calculated as in (14)–(19).
i p = k 2 I k
2 I k = 2 I k = I m  
k = i p 2 I k = i p 2 I k      
k = 1.02 + 0.98 e 3 R X  
T a = 1 ω X R  
t g ( α ) = X R    
where I m is maximum phase current, ω = 2 π f is angular frequency, f is rated frequency, T a is time constant of the system, k is factor for peak current, I k is steady-state short-circuit current, I k is initial short-circuit current and α is the closing angle, which defines the voltage value at the moment of short-circuit occurrence.
Based on Equations (14)–(19), simulations were conducted with test values taken from [33] and parameters presented in Table 1.
The graphical representation of simulation currents as plotted in COMSOL® are shown in Figure 1a for 50 Hz and Figure 1b for 60 Hz.

3. Busbar Design

During the research, several design proposals were made based on the available literature and existing technological solutions. The proposed designs consisted of models with horizontally and vertically oriented busbars. The topologies with a displaced busbar were also considered. In all models, the variable was the number of busbars per phase and the profile of the busbars. In this paper, we consider the models that give the most optimal results, in terms of the dimensioning of the main busbars in the busbar compartment. The considerations consequently lead to an increase in energy efficiency. Based on the future predictions of ship energy efficiency (assuming increased voltage distribution levels) and the electrical characteristics of existing large cruise ships [34], the rated current capability of the busbar system was set to 1600 A. The analyzed cruise ships with their installed power are shown in Table 2.
Knowing the rated current, the dimensions of the considered busbars, derived from the data in [35,36], under the condition that all models have the same surface area, are given in Table 3.
Since the grid frequency in a ship’s power system is usually 60 Hz, only the simulations with the set frequency of 60 Hz are considered. The justification of the chosen frequency was visible in the negligible results variation depending on the chosen frequency as seen in the values of simulated losses.

3.1. Singular Busbar System with Rectangular Profile

Given the many possible geometric topologies of singular busbars, the analysis in this paper considers the two most reasonable ones with respect to the goal of an optimized AIS. The simulation parameters of the busbars are listed in Table 4 for models 1 and 2.
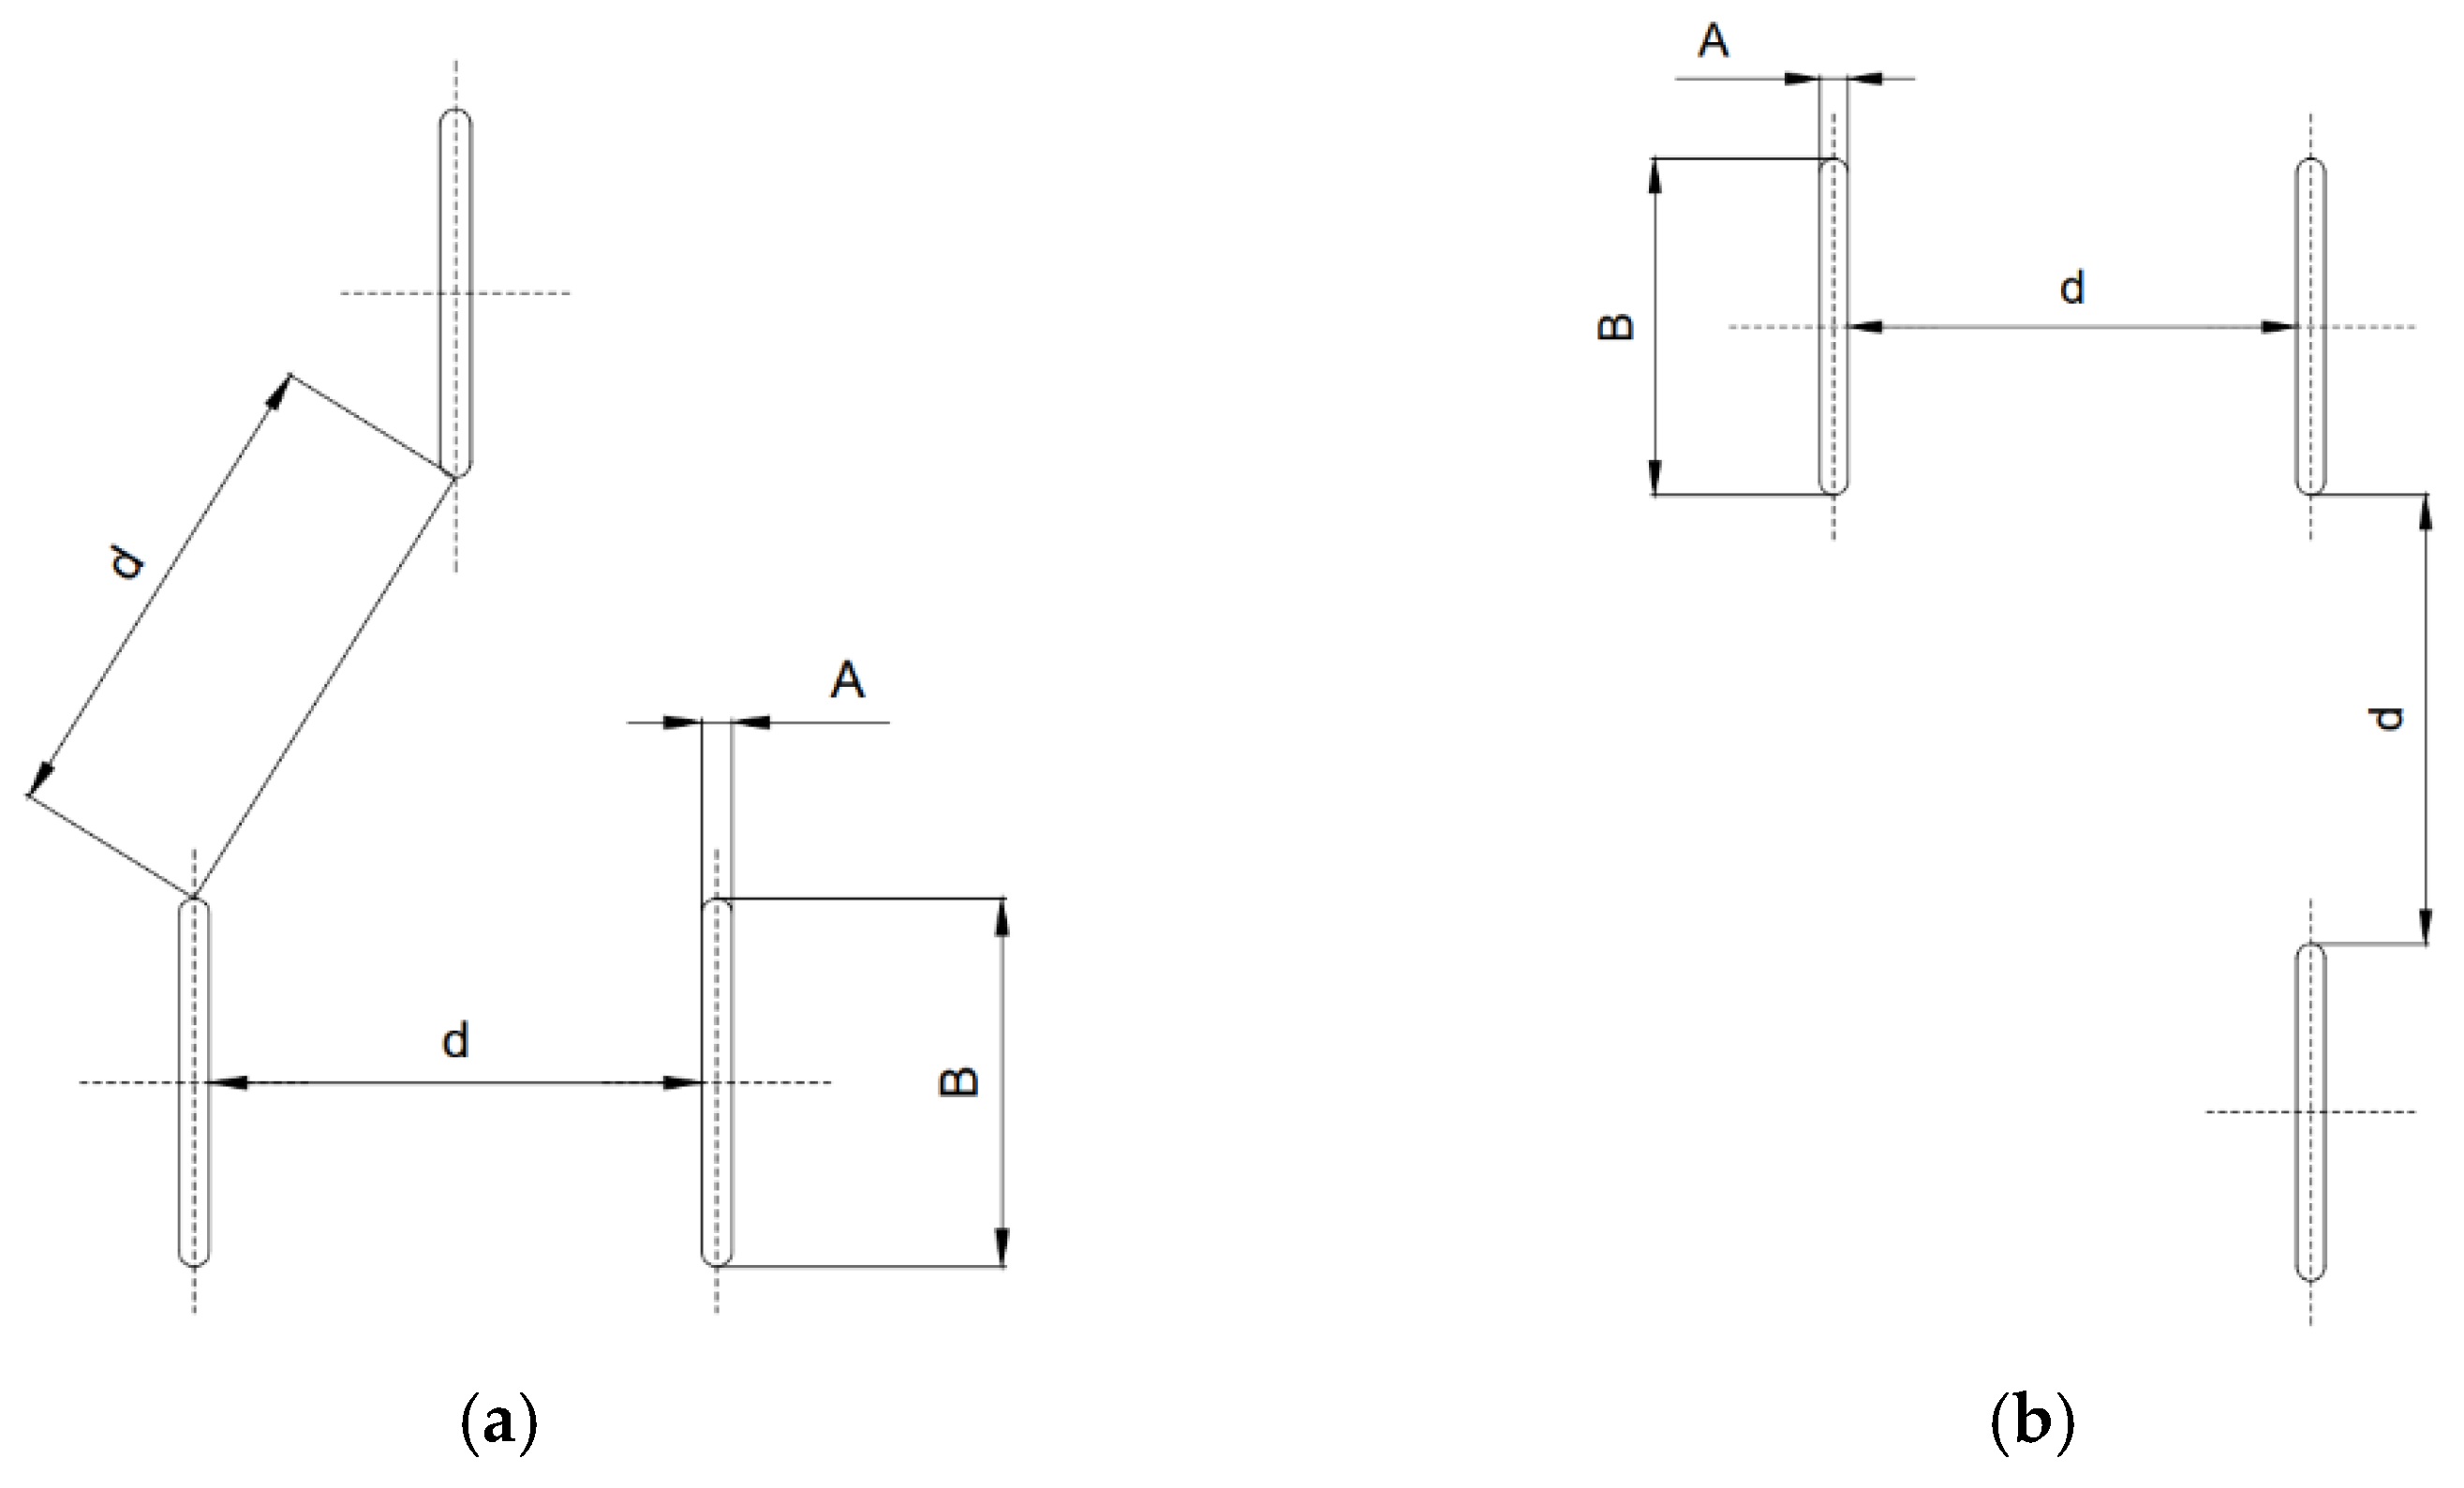
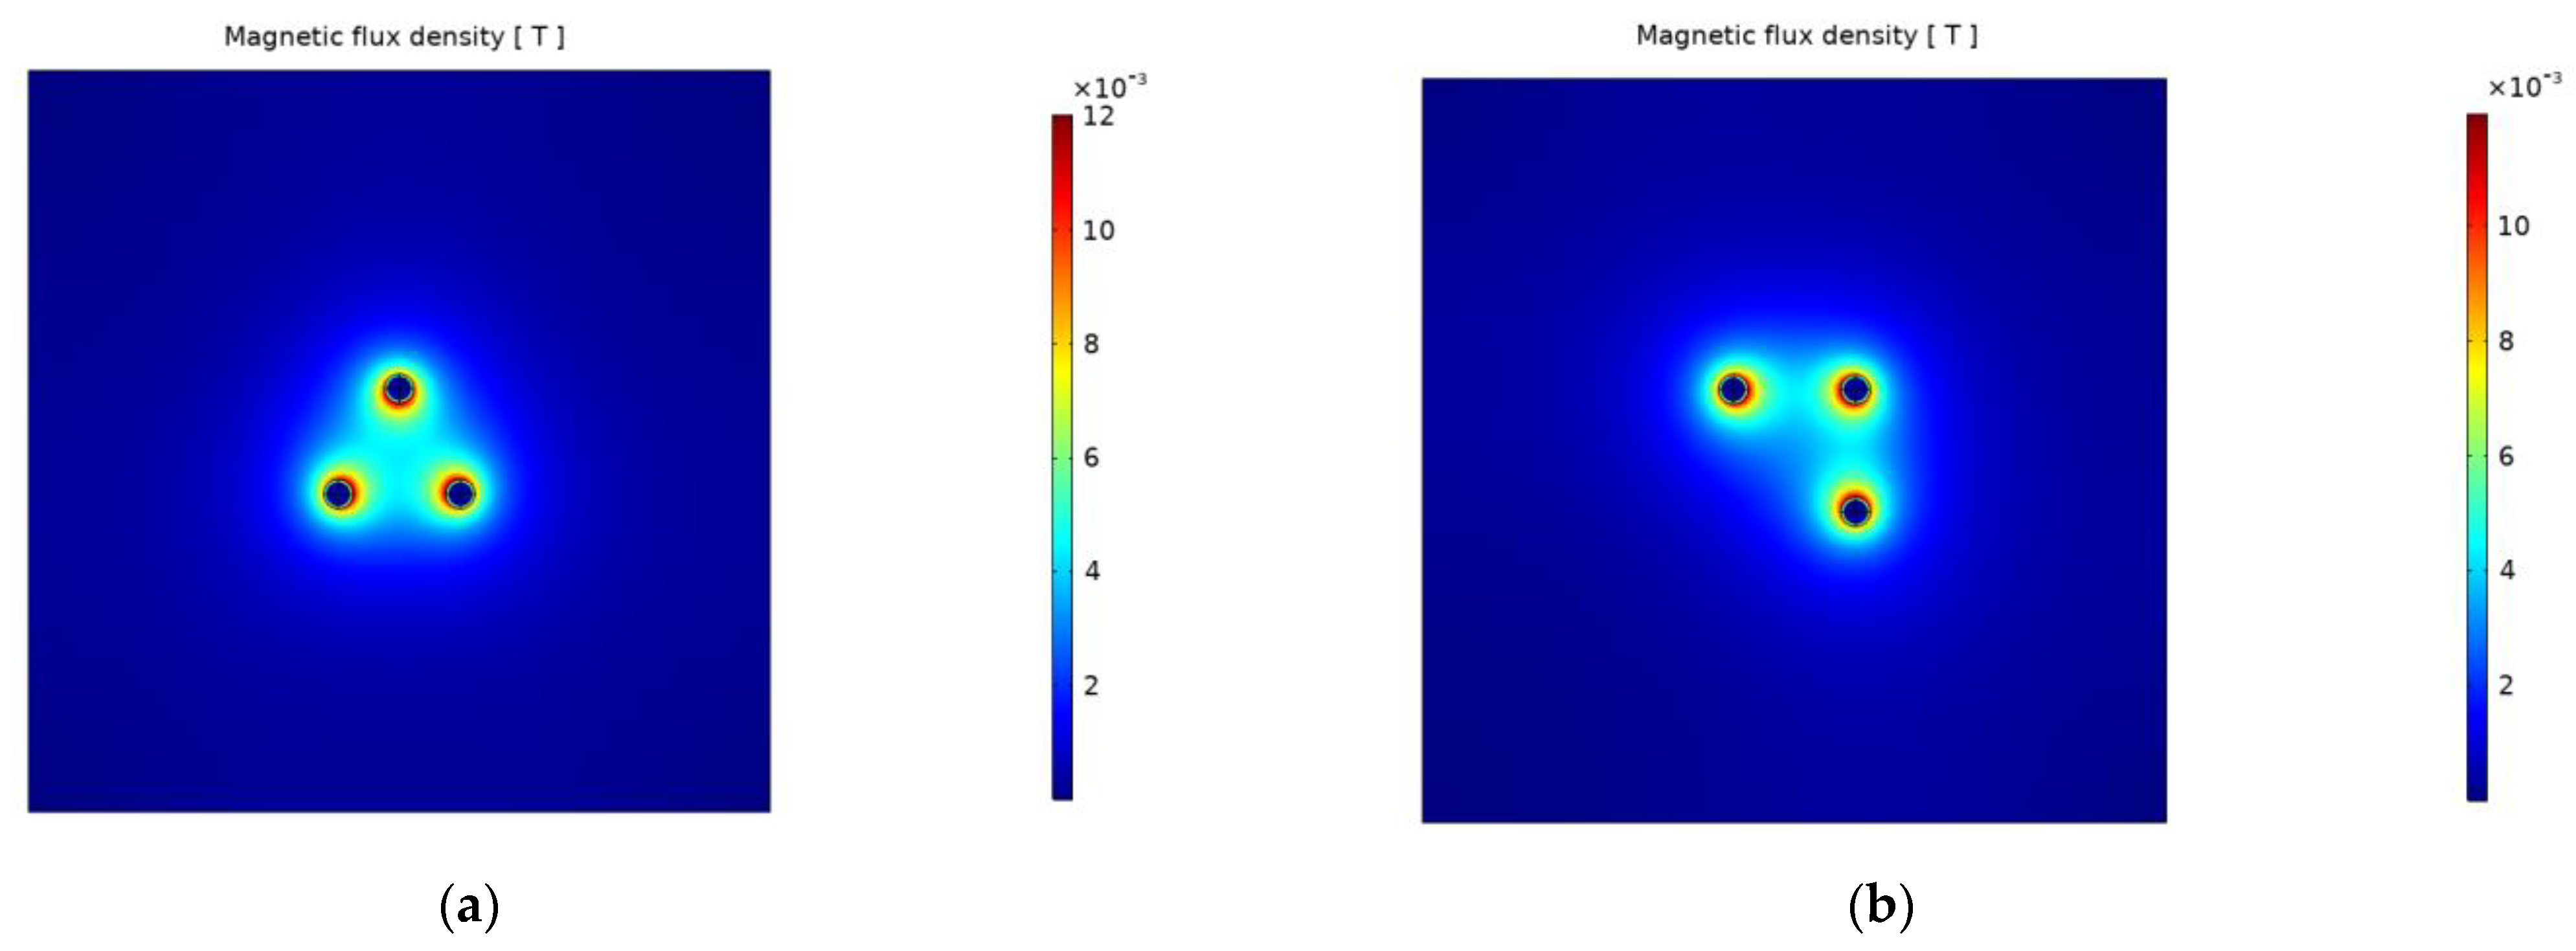
The geometrical layout for model 1 is shown in Figure 2a,b for model 2.
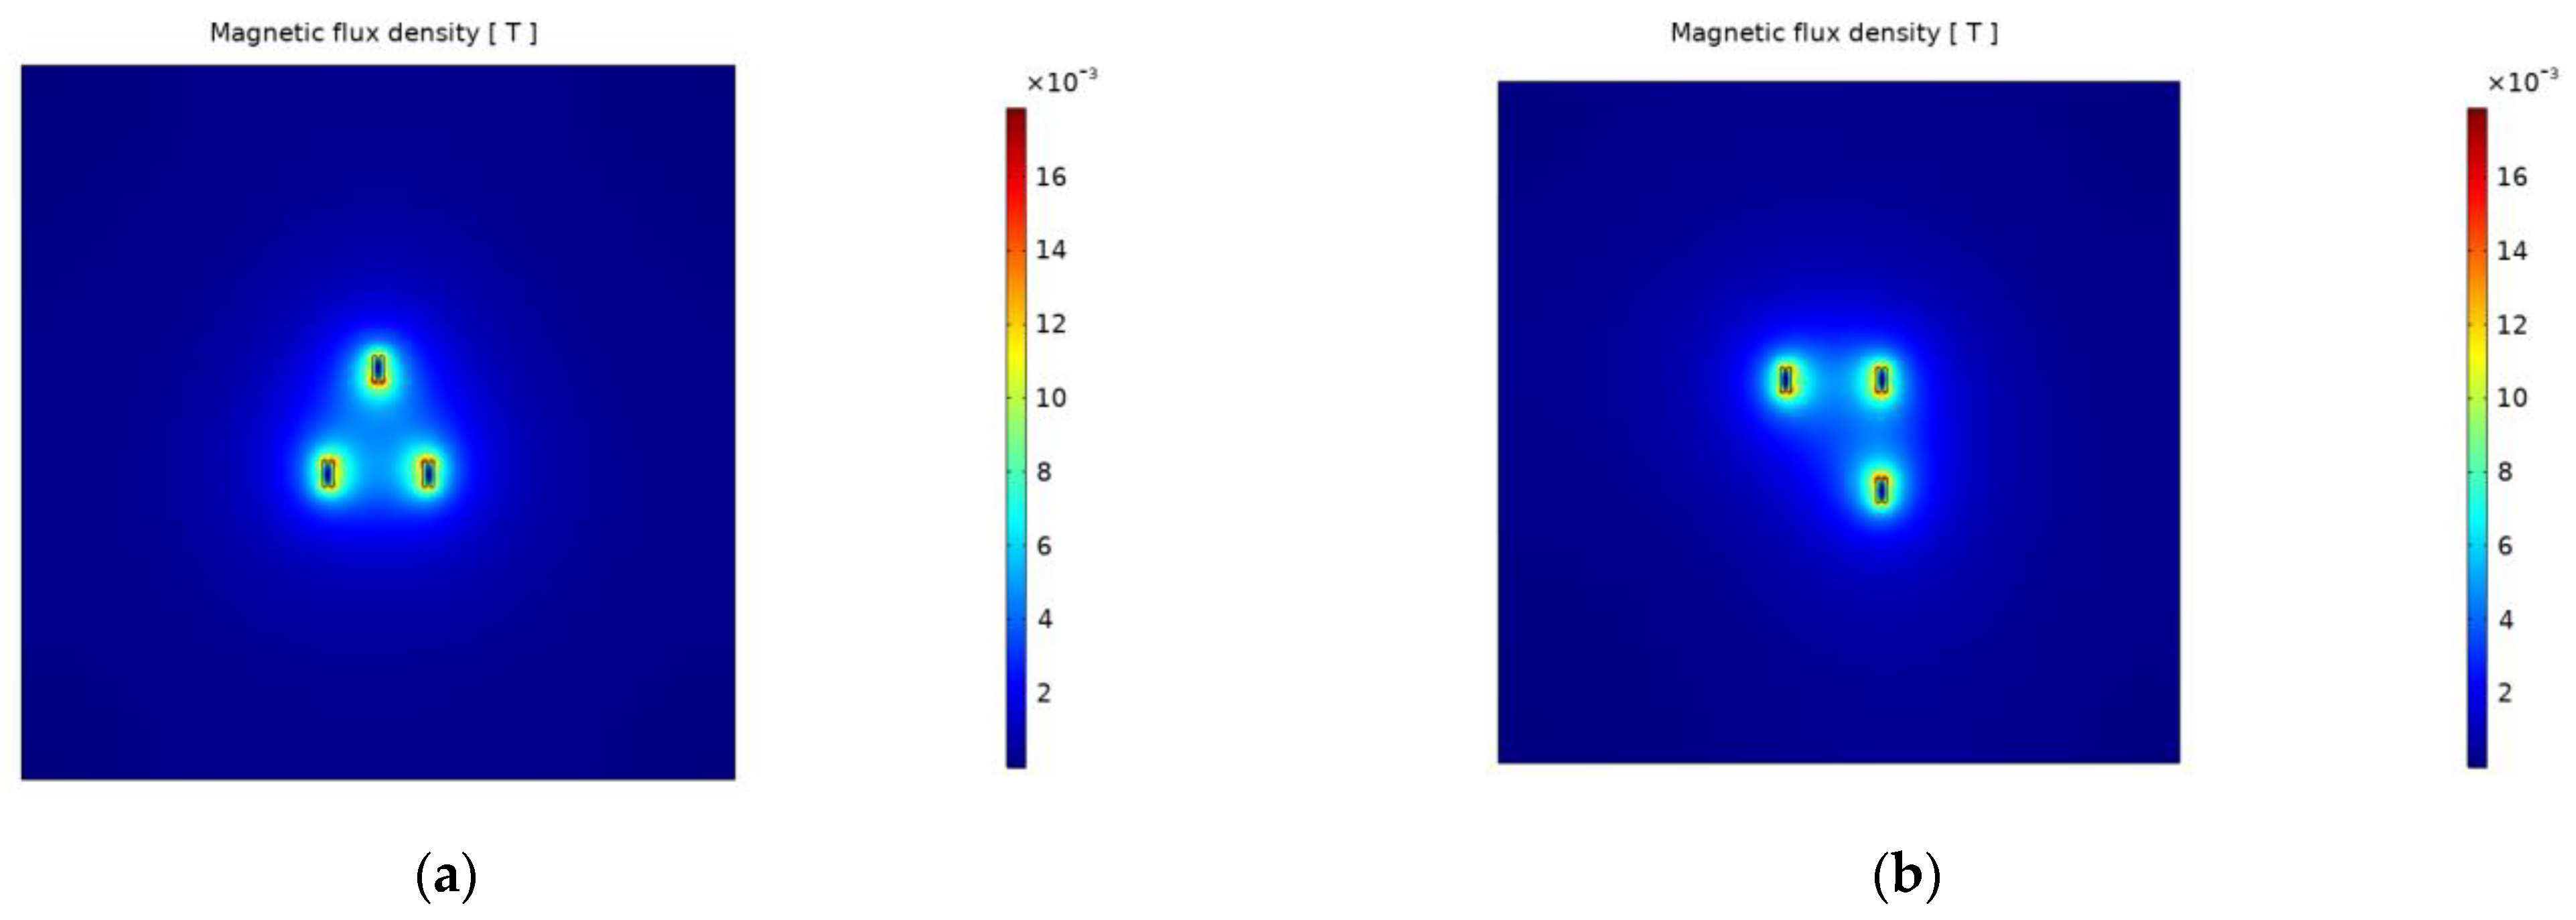
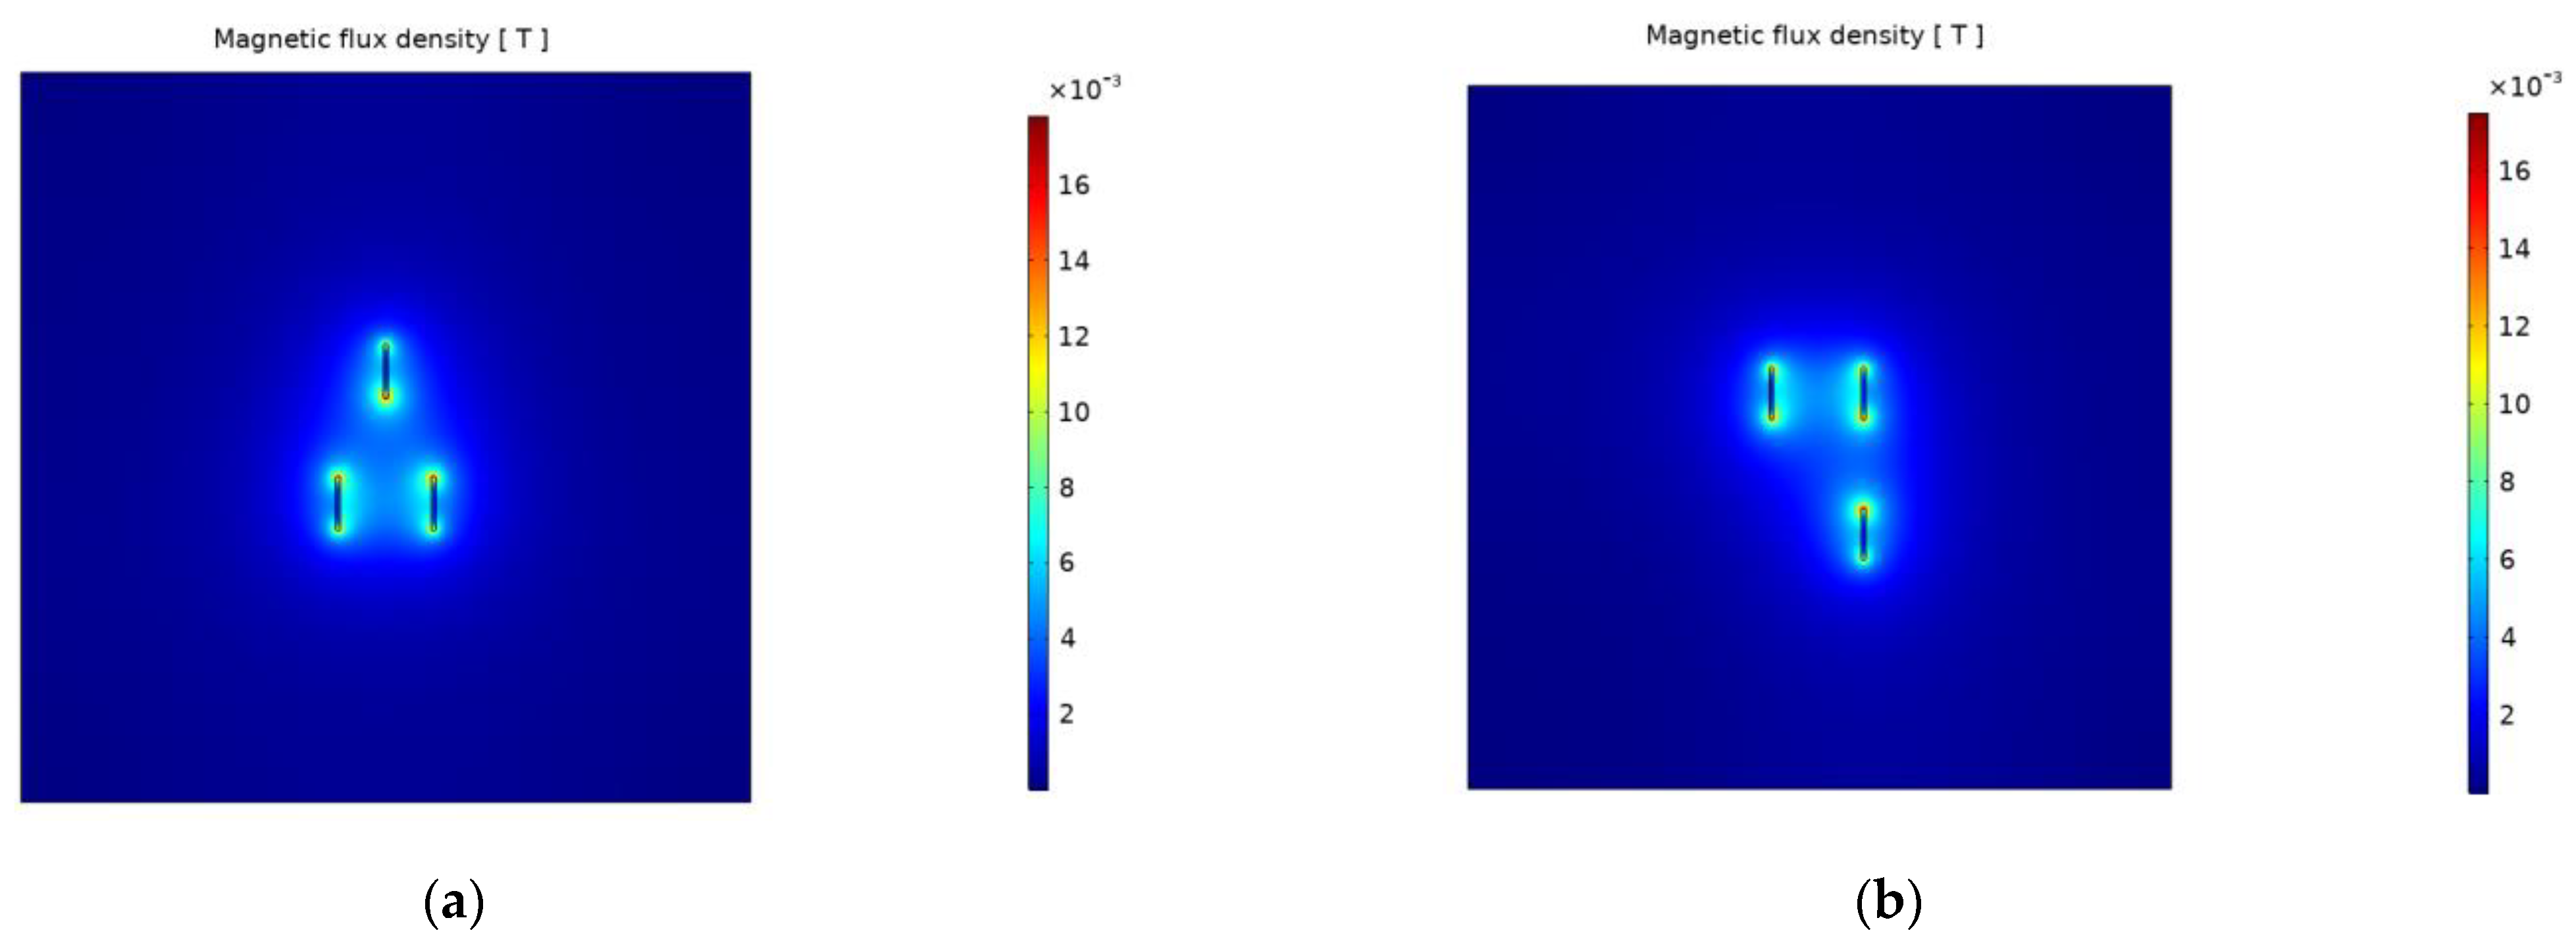
The 2D plots on Figure 3 show the magnetic flux density results of the simulation process for each model 60 Hz, respectively.
As can be seen in Figure 3 with respect to the magnetic flux density, the geometric distribution in model 2 gives more favorable results. The values of electromagnetic heating (losses) on all busbar surfaces derived from the simulation results are shown in Table 5.
The data in 
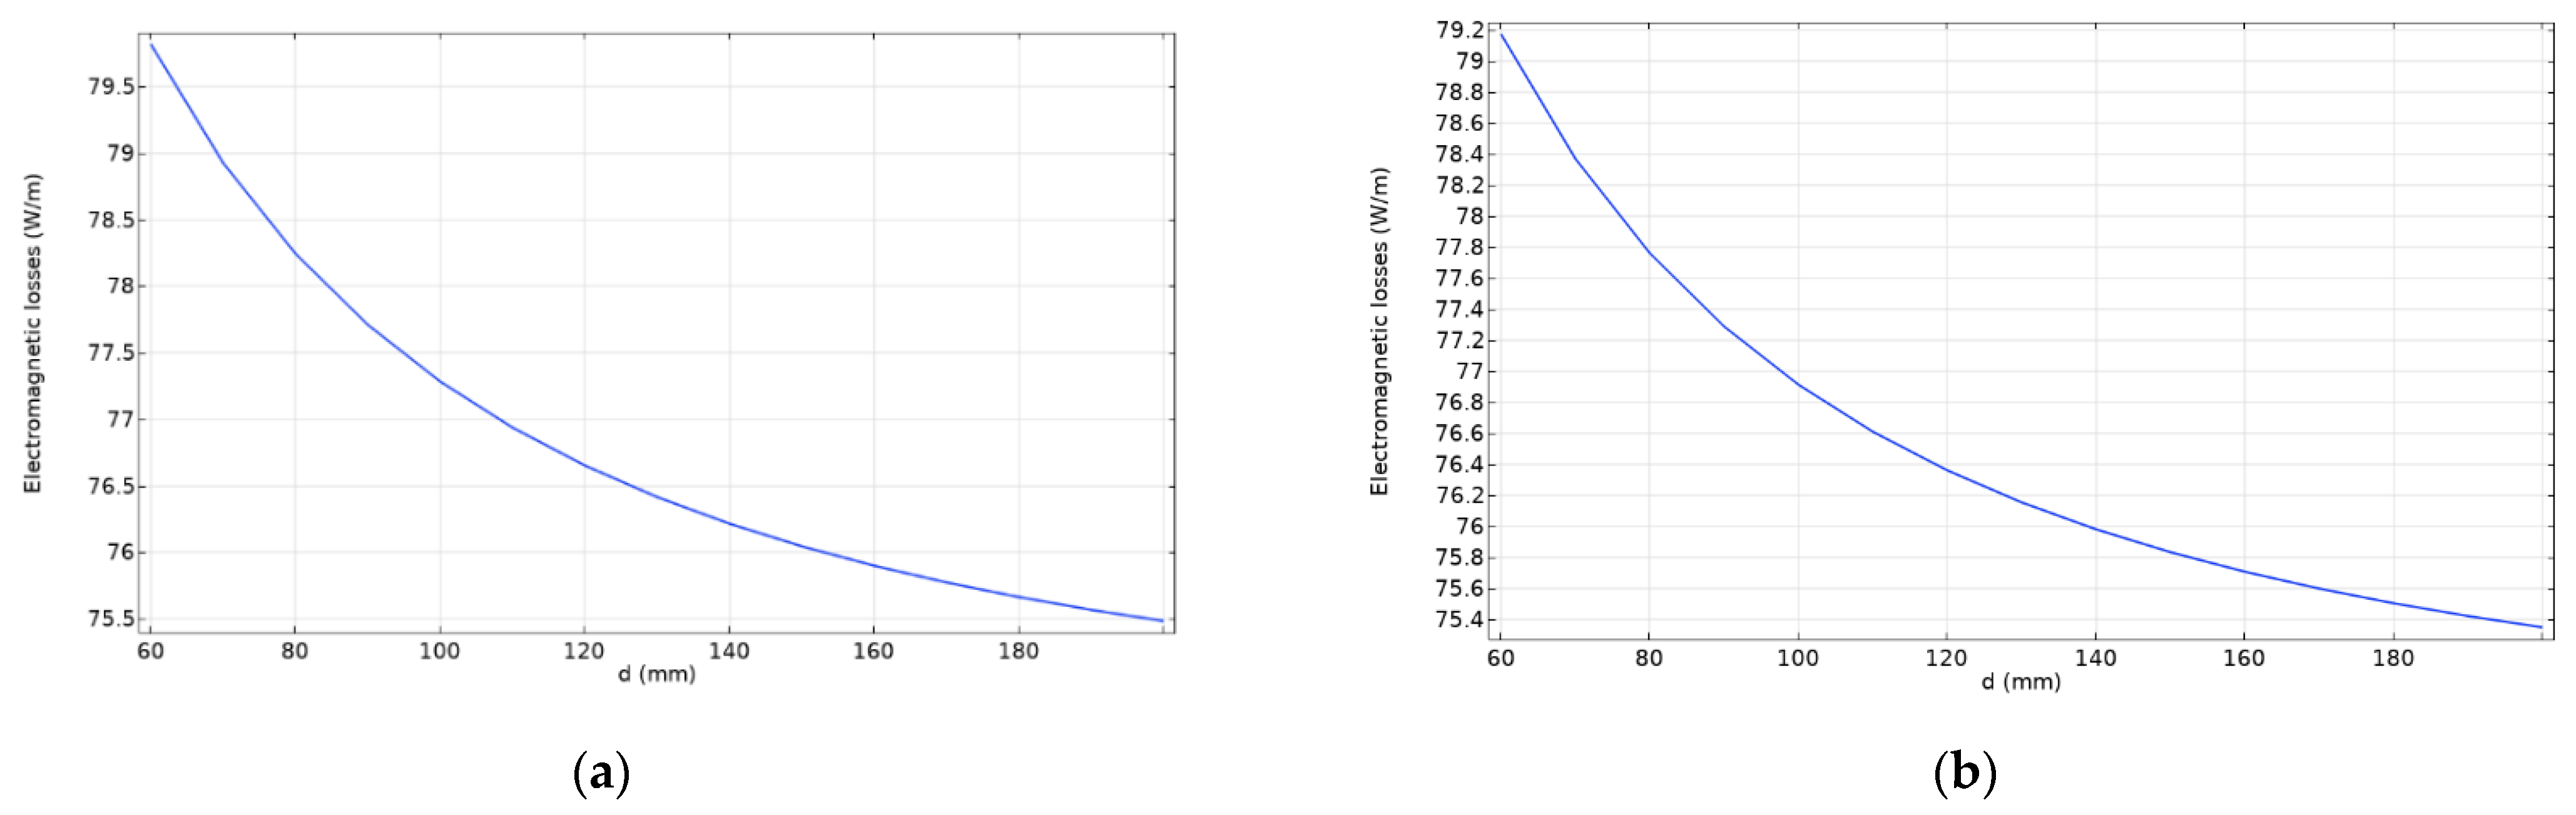
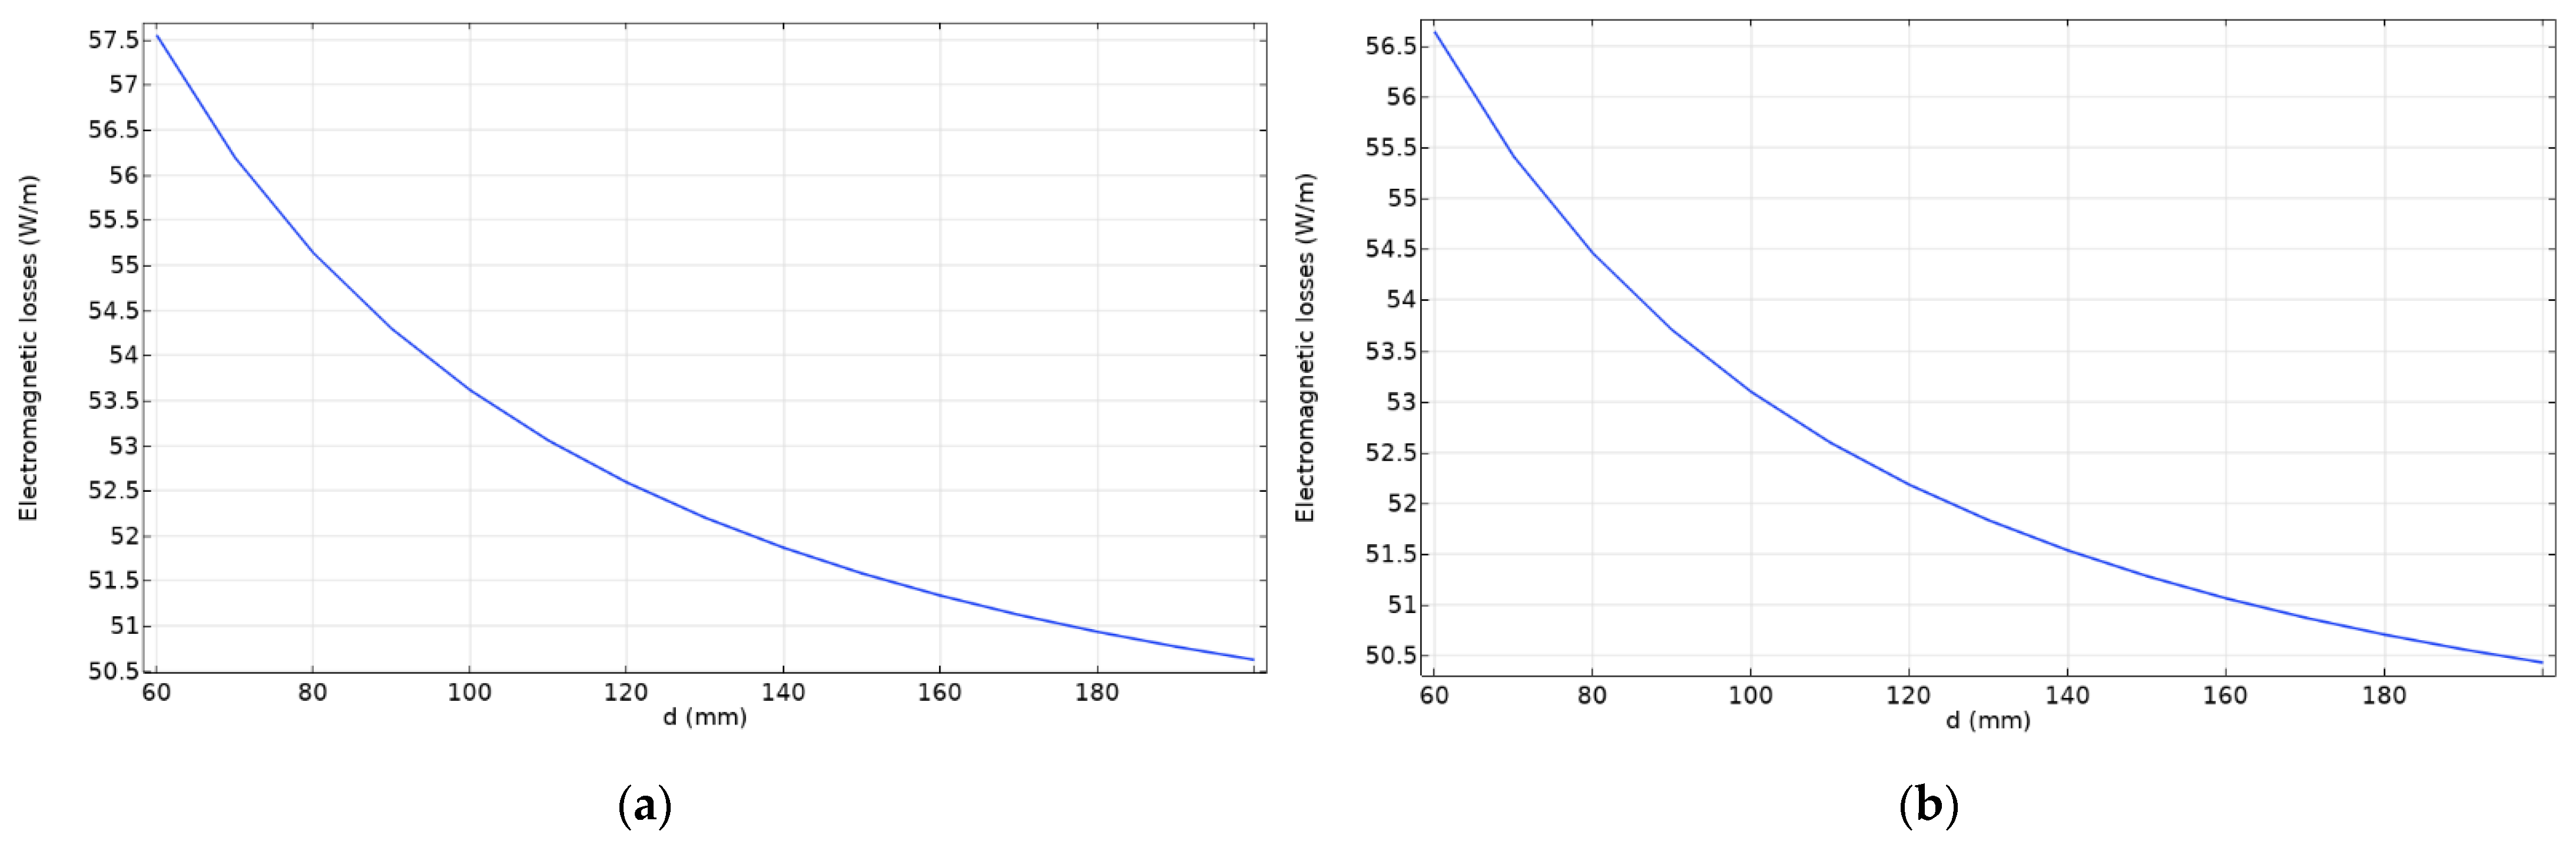
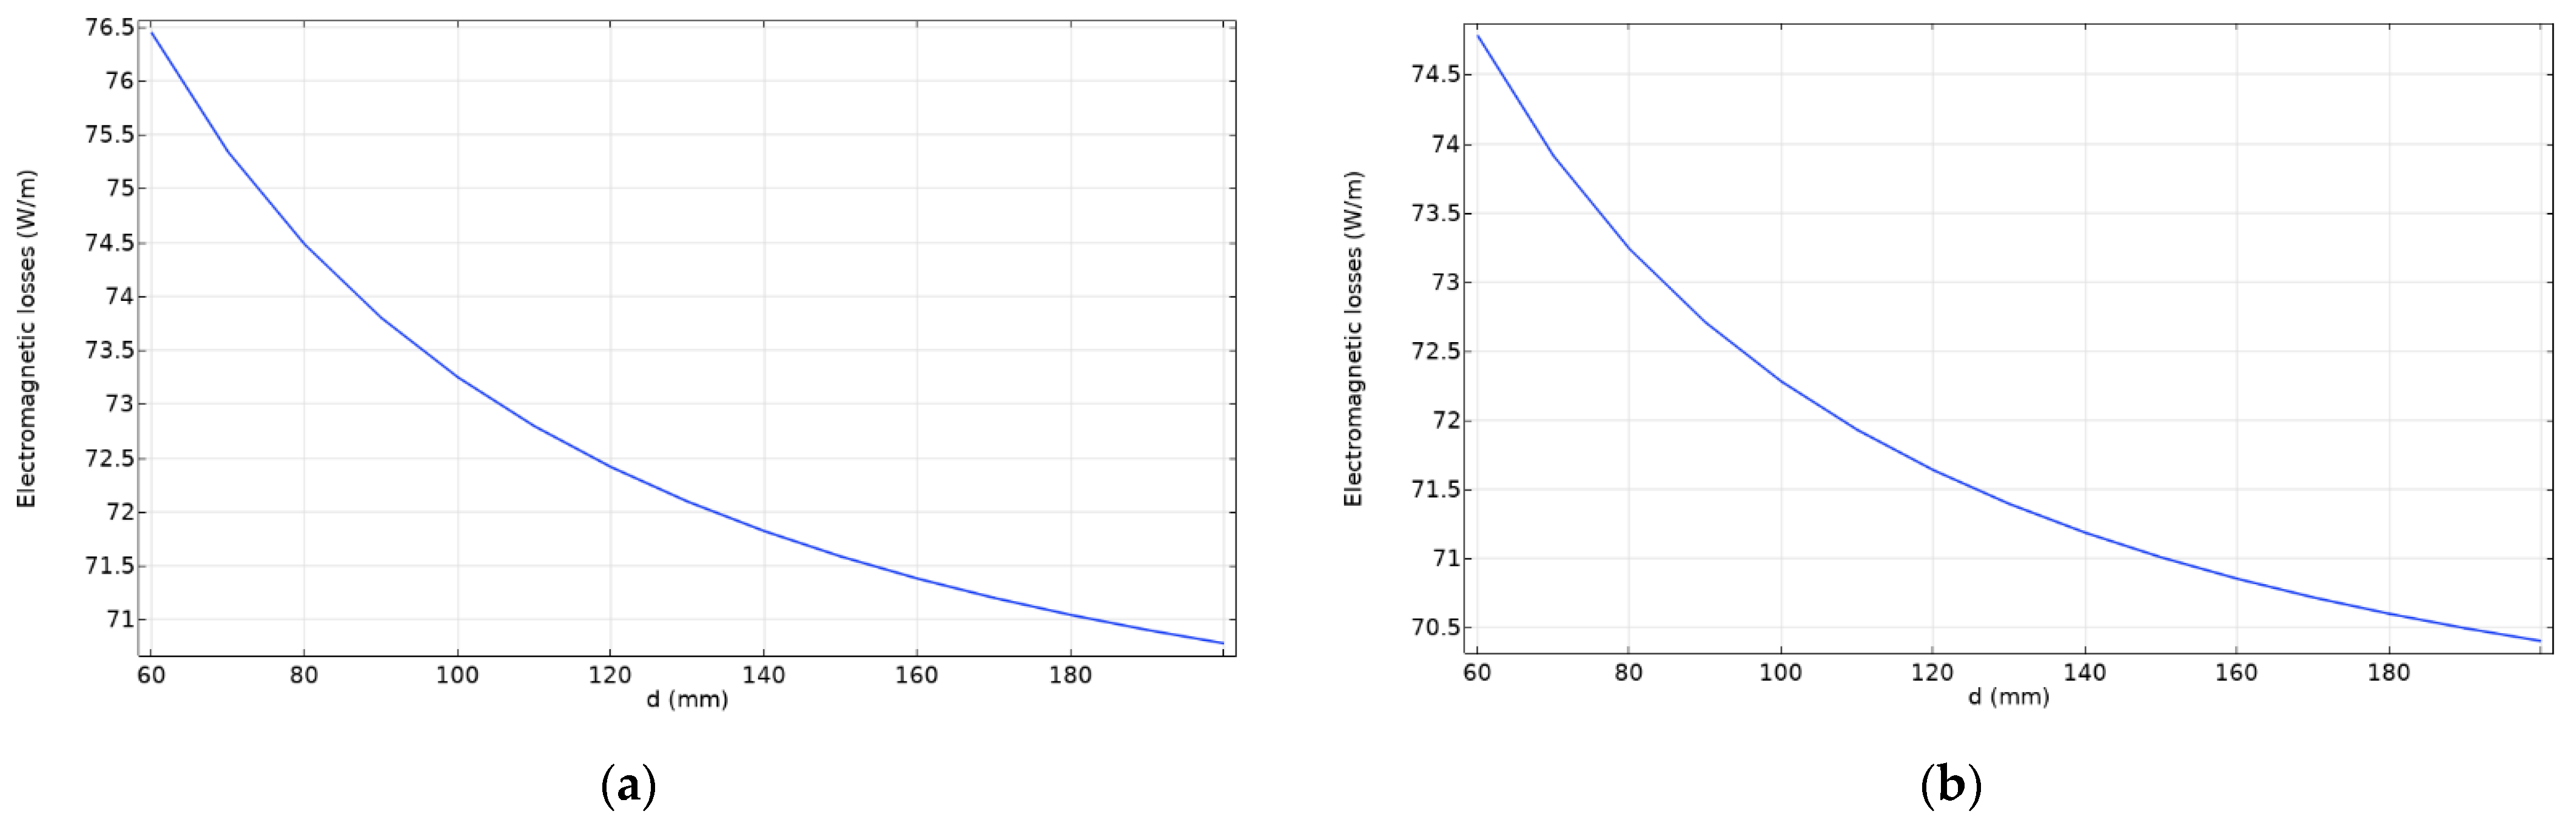
Table 5 confirm that the topology of model 2 is more advantageous than model 1 for further consideration. The following plots show the dependence of the electromagnetic heating on the distance between phases. The simulated phase-to-phase distance ranges from 60 mm to 200 mm with a 10 mm step slope.
As can be seen in Figure 4, the values of electromagnetic losses decrease as the distance between the phases increases.

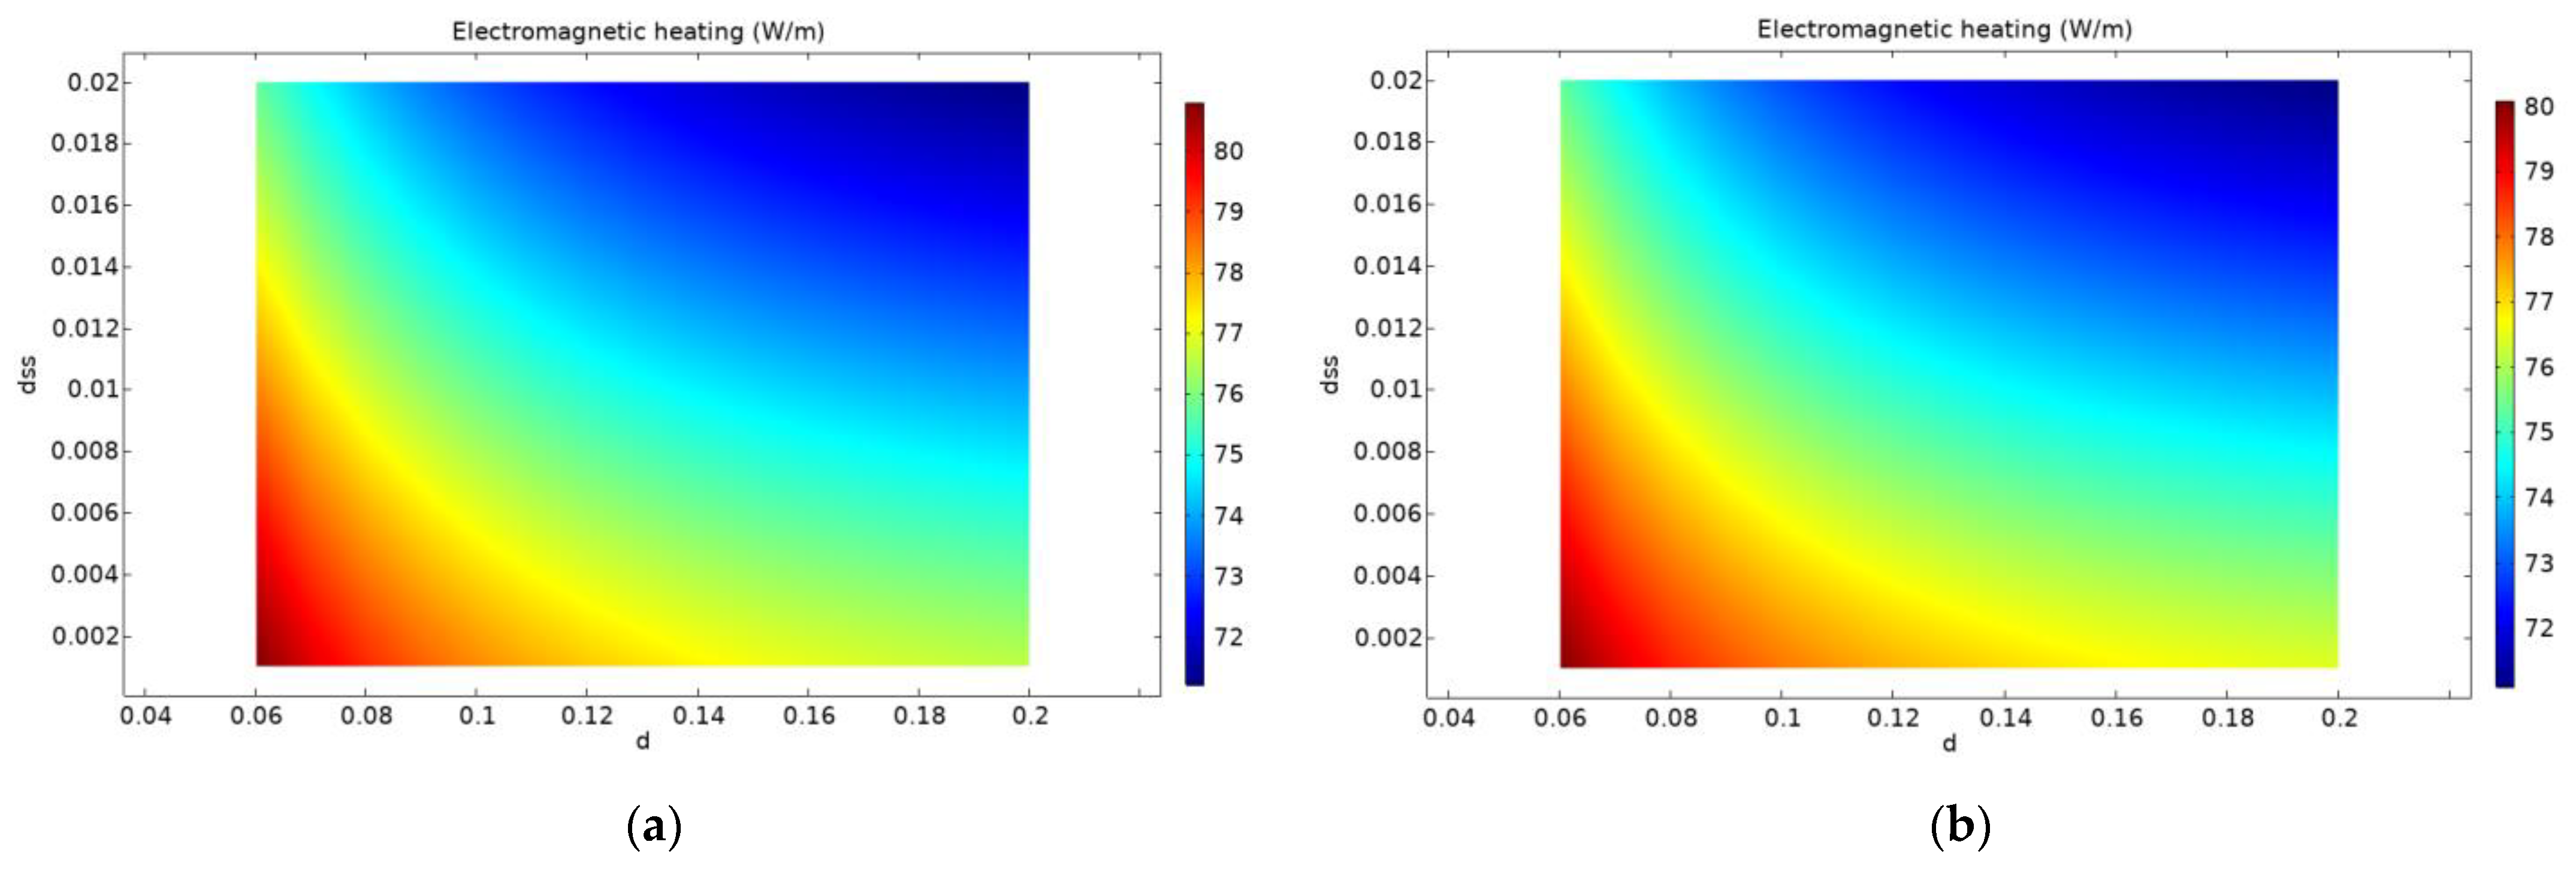
3.2. Double Busbar System with Rectangular Profile

The analysis of a double busbar system revealed a different choice of busbar topology to consider. The dimensions of the double busbar system are chosen so that the current carrying capacity is equal to the simulated single busbar models. The simulation parameters of the busbars are given in 
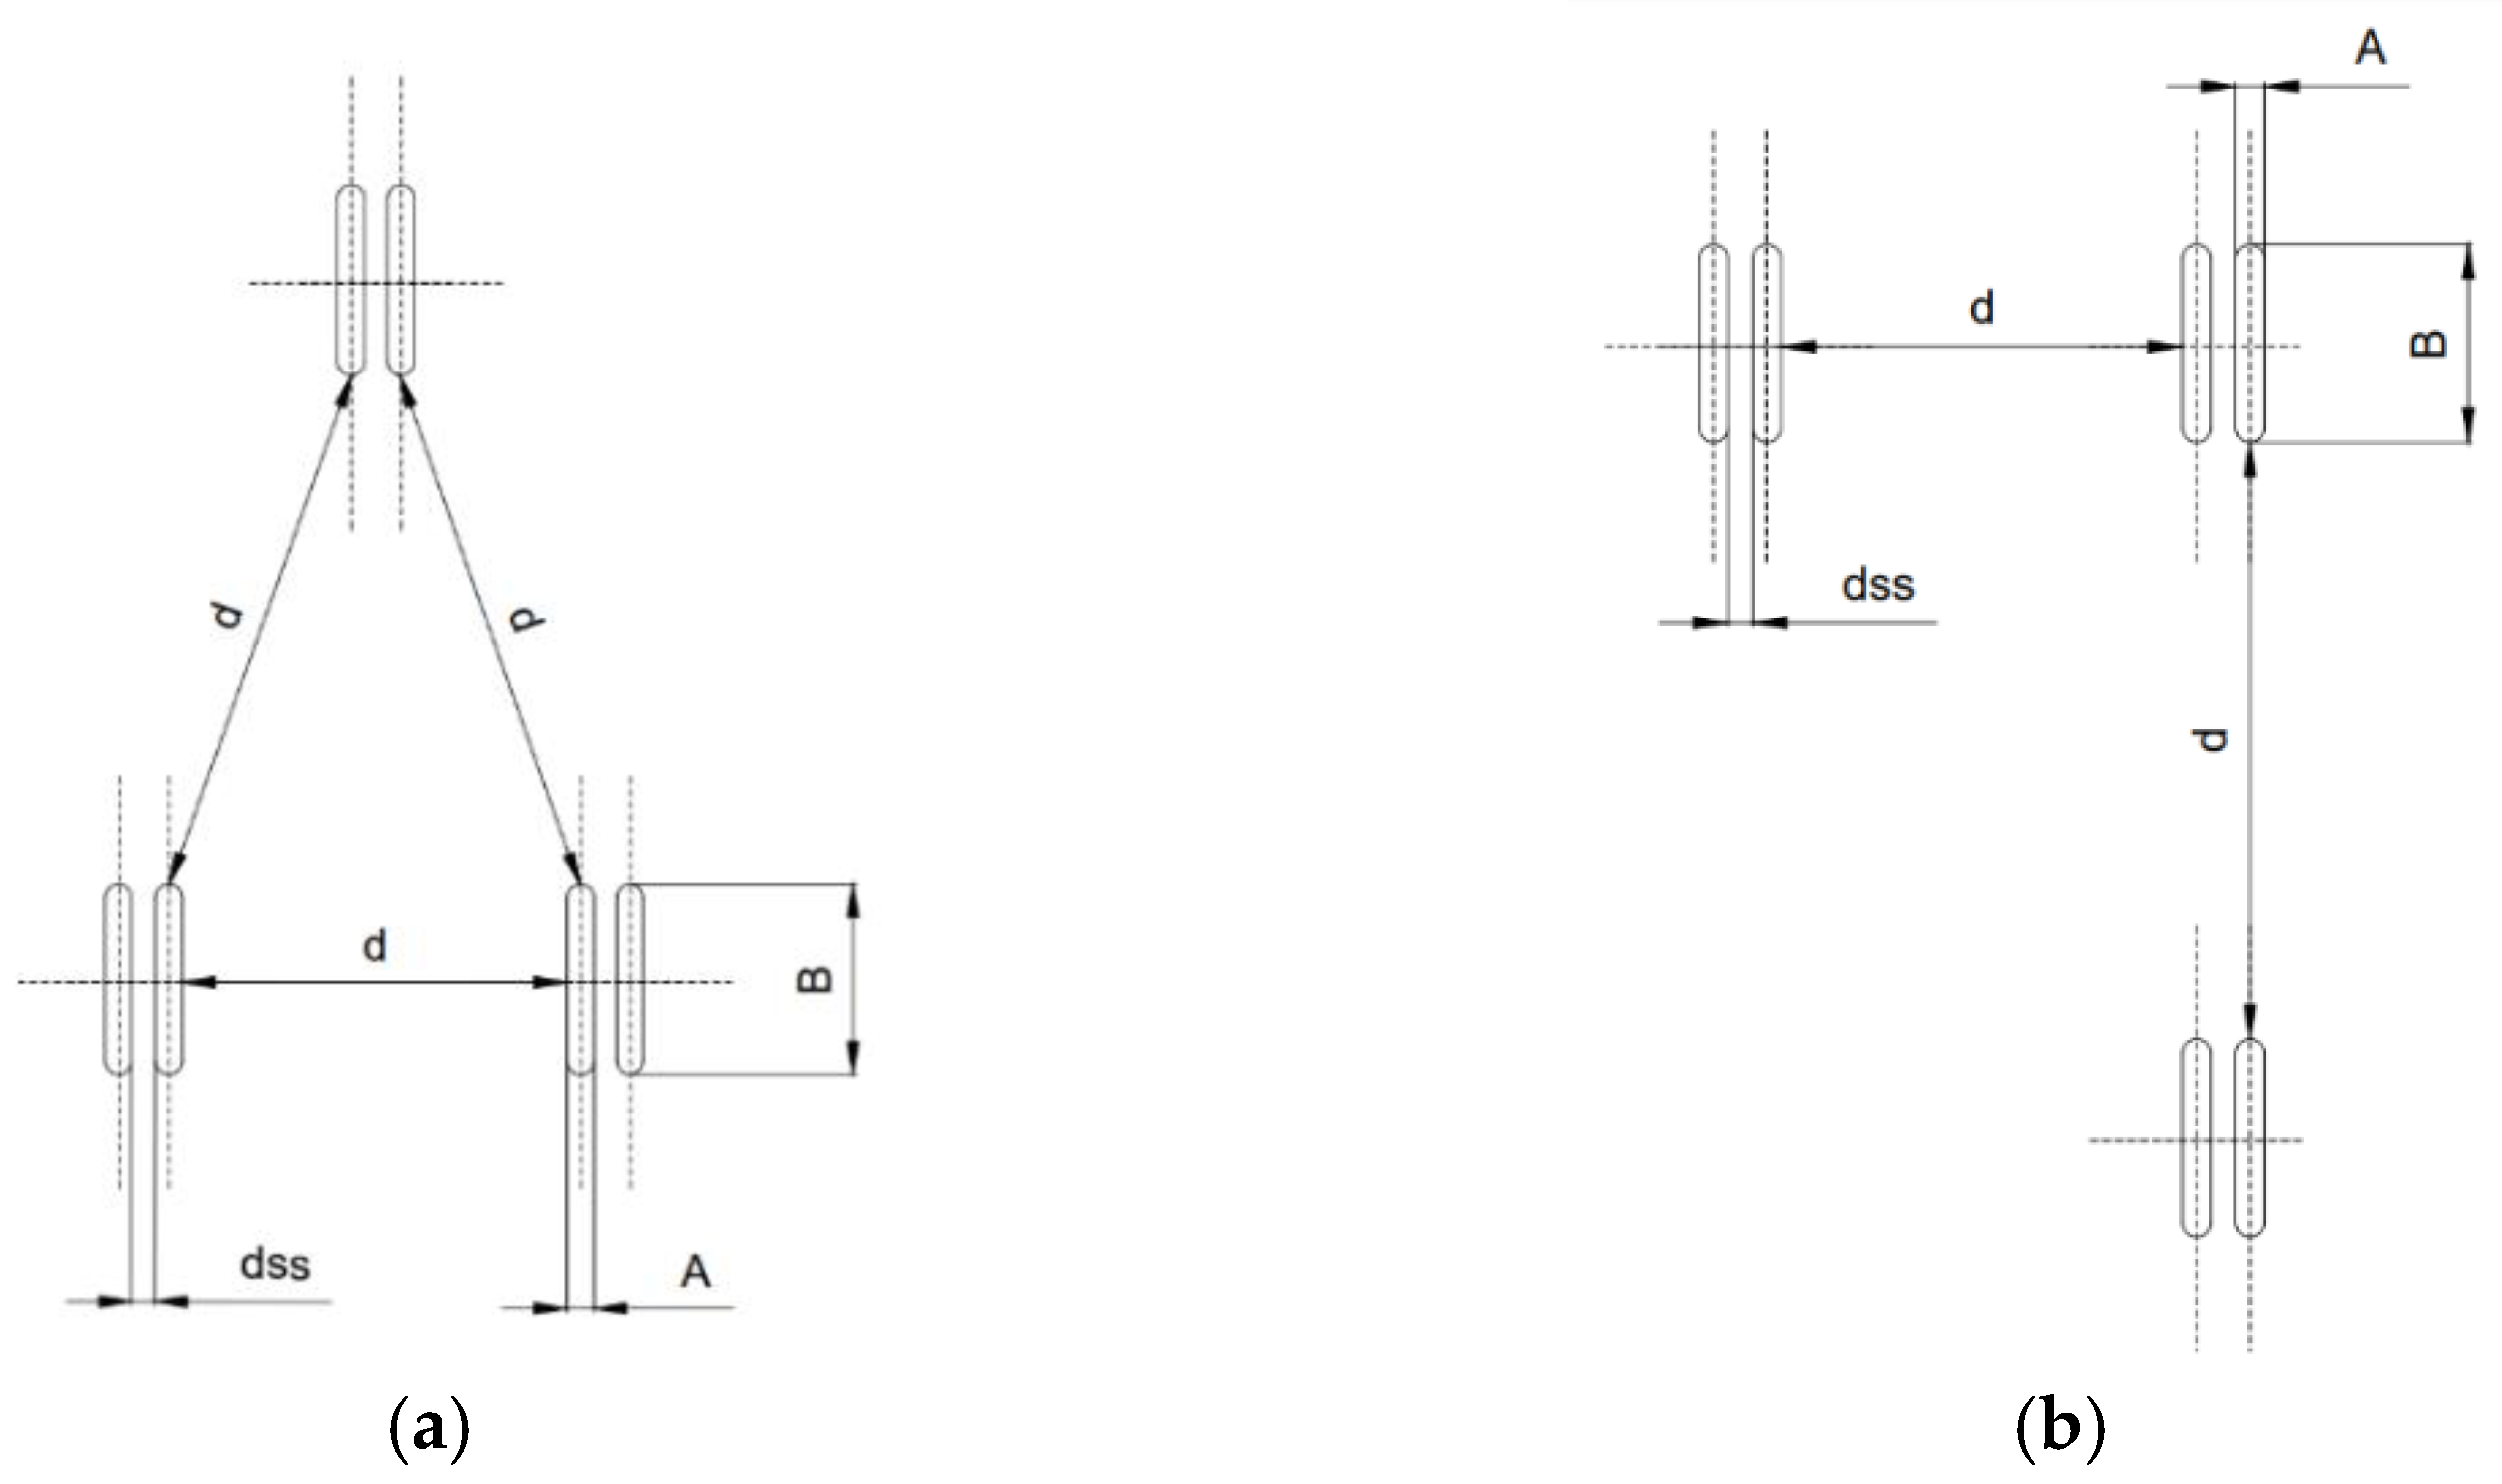
Table 6 for models 3 and 4. The geometrical arrangement is shown in Figure 5a for model 3 and Figure 5b for model 4.
The 2D plots on Figure 6 show the magnetic flux density results of the simulation process for each model at 60 Hz, respectively.
As can be seen in Figure 6 with respect to the magnetic flux density, the geometric distribution in model 4 gives more favorable results. The values of electromagnetic heating (losses) on all busbar surfaces derived from the simulation results are shown in Table 7.
The data in Table 7 confirm that the topology of model 4 is more appropriate for further consideration compared to model 3. The plots below show the dependence of the electromagnetic heating on the distance between phases. The simulated phase-to-phase distance is in the same range as the singular busbar system for comparison.
Figure 7 also confirms that the values of electromagnetic losses decrease as the distance between phases increases. The analysis of the results from Figure 7 and Table 7 in comparison with Figure 3 and Figure 4 and Table 5 shows that the singular busbar system is preferred.
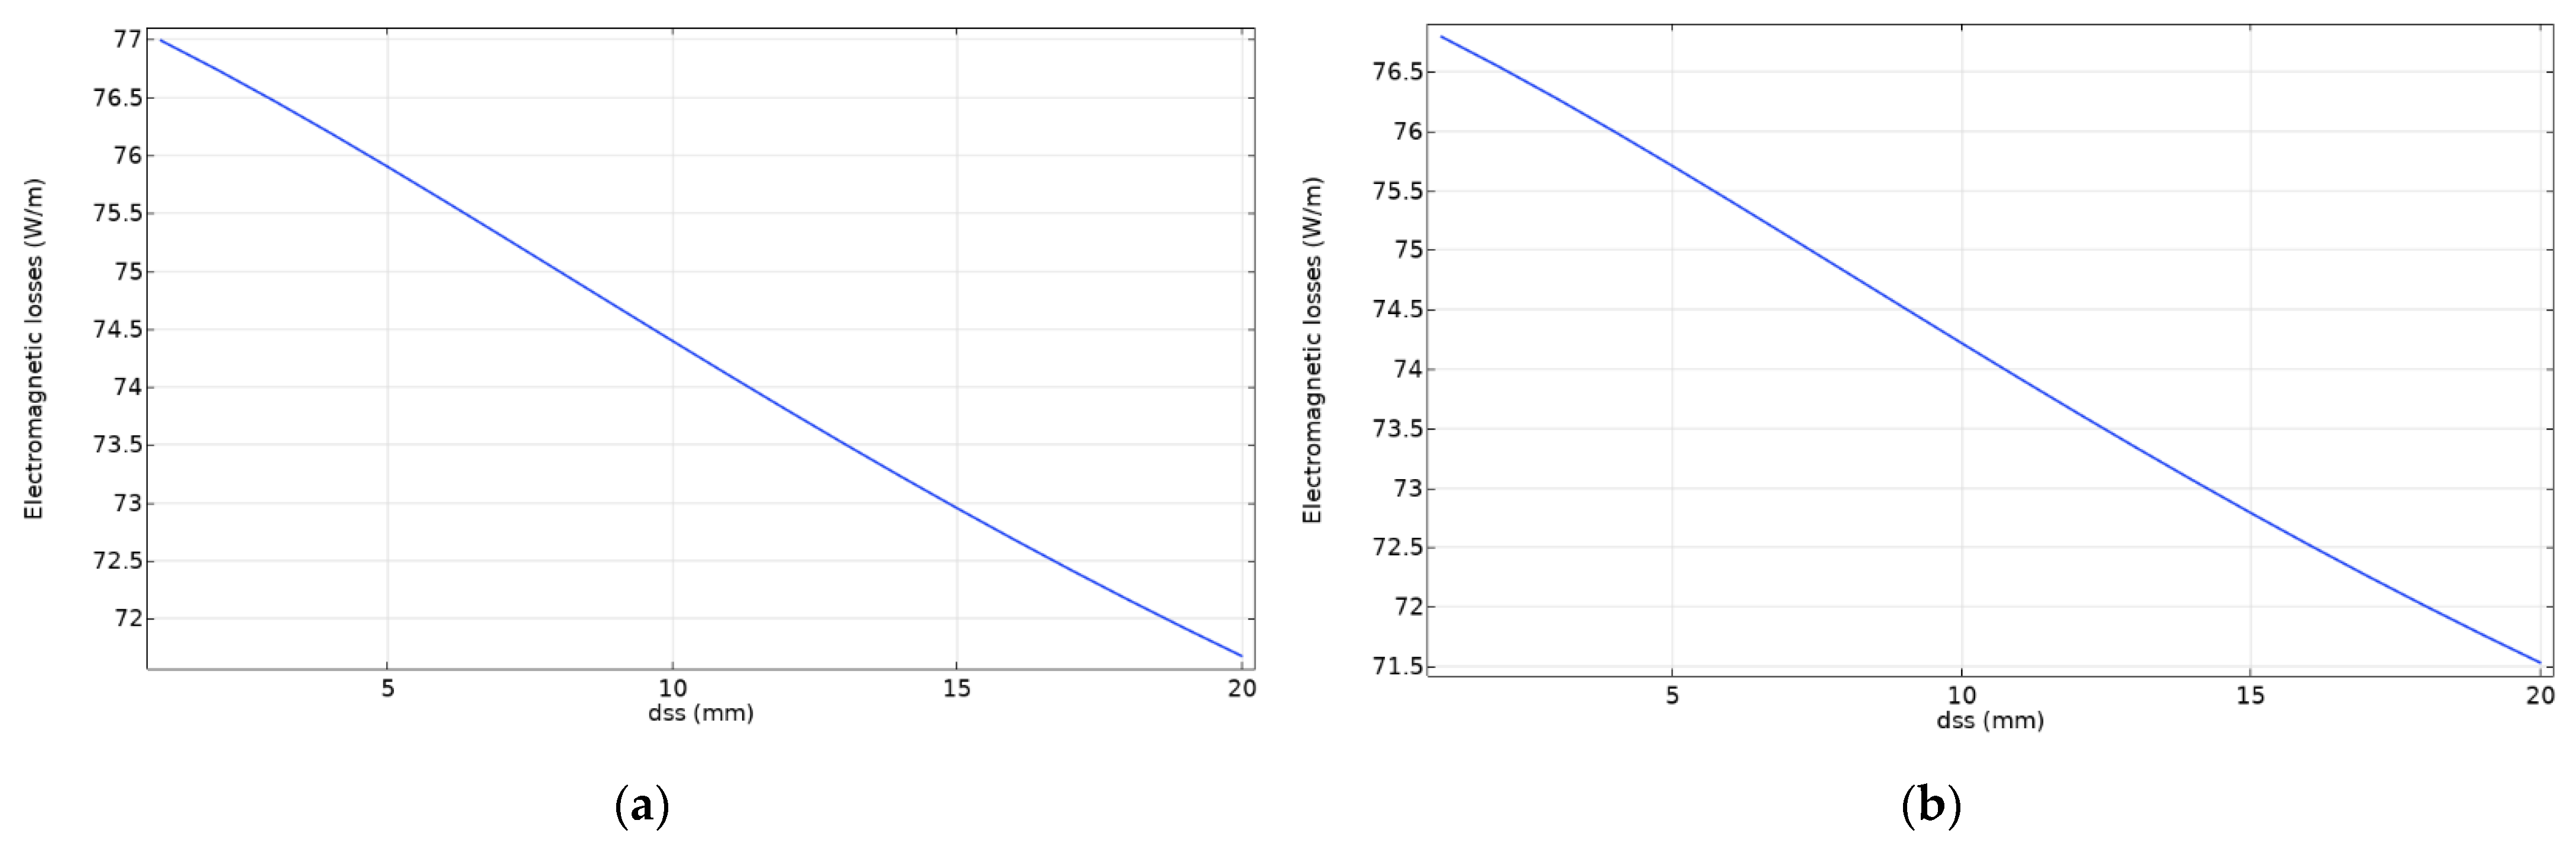
Considering the fact that the double busbar system introduces an additional parameter of the distance between busbars of the same phase, additional analysis is required. The following diagrams show the dependence of electromagnetic losses on the distance between busbars of the same phase and on all possible combinations of the two distance parameters. The simulated range of the distance between busbars of the same phase is from 1 mm to 20 mm with a step slope of 1 mm, where the range of the distance between phases is the same as for single busbar systems.
As can be seen in Figure 8, the electromagnetic losses decrease with the larger distance between busbars of the same phase, while the distance from phase-to-phase is constant.
The analysis of the results from Figure 9 confirms that the losses are inversely proportional to both busbar spacing parameters.

3.3. Singular Busbar System with Circular Profile

As an additional means of comparison, an analysis of a busbar system with a circular profile was performed, for the same parametric conditions as the systems with a rectangular profile. The simulation parameters of the circular busbars are given in Table 8 for models 5 and 6. The geometrical layout is shown in Figure 10a for model 5 and Figure 10b for model 6.
The 2D plots on Figure 11 show the magnetic flux density results of the simulation process for each model at 60 Hz, respectively.
As can be seen in Figure 11 with respect to the magnetic flux density, the geometric distribution in model 6 gives more favorable results. The values of electromagnetic heating (losses) on all busbar surfaces derived from the simulation results are shown in Table 9.
The data in Table 9 confirm that the topology of model 6 is more advantageous than model 5 for further consideration. The following plots show the dependence of the electromagnetic heating on the distance between phases. For comparison, the simulated phase-to-phase distance is in the same range as for the rectangular busbar systems.
As can be seen in Figure 12, the values of electromagnetic losses decrease as the distance between the phases increases. The analysis of the results from Table 9 shows that the change in the frequency range used (50, 60 Hz) in these simulations has an insignificant influence.

3.4. Discussion of Simulated Busbar Configurations

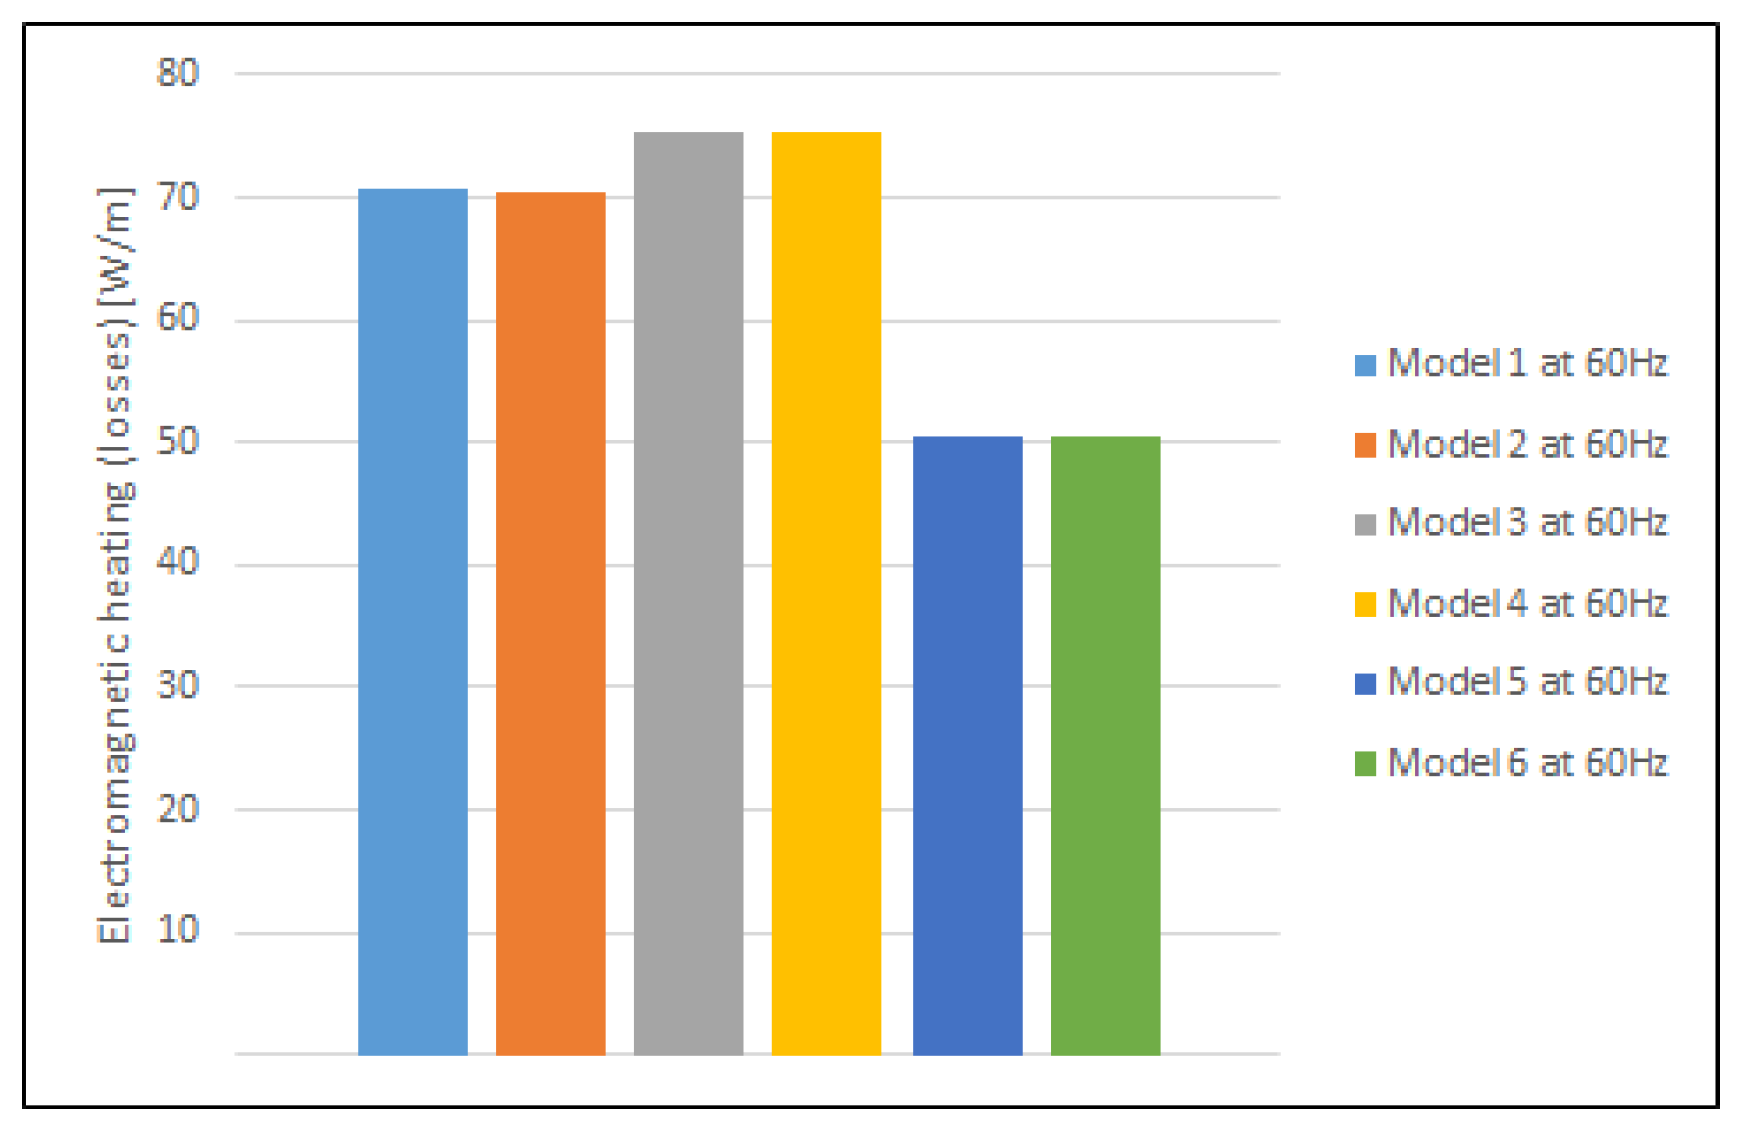
As seen in the tables above, the values of electromagnetic losses are higher, for an insignificant amount, in the 60 Hz-rated frequency for all models. The analysis of the results for rectangular busbars, in regard to losses, give the advantage to singular busbar topologies. Through all of the simulations, a pattern of lower losses is shown in the geometrical distributions in models 2, 4 and 6, whose similar topologies are already used by the company “Končar”. The topologies of these models, if used, will consequently ask for minimal changes in the established production process of the company. The data acquired from simulating the dependency of losses against the distance between phases and distance between busbars of the same phase for double busbar systems, show a trend of lower values for greater distances. The analysis shows that if the busbars are on the recommended minimal phase-to-phase distance of 160 mm [37], for the 95 kV lightning impulse withstand voltage, the value of electromagnetic losses is acceptable. The obtained data on loss dependency are also a reference point for optimizing the busbar topology when space is restricted, as in a busbar compartment. Overall comparison of the results from 2D simulations are in favor of the circular profiles of busbar systems. Regarding the sole value of the electromagnetic heating (losses), the overall favorable model is number 6 (for a small margin against model 5), as seen in Figure 13.
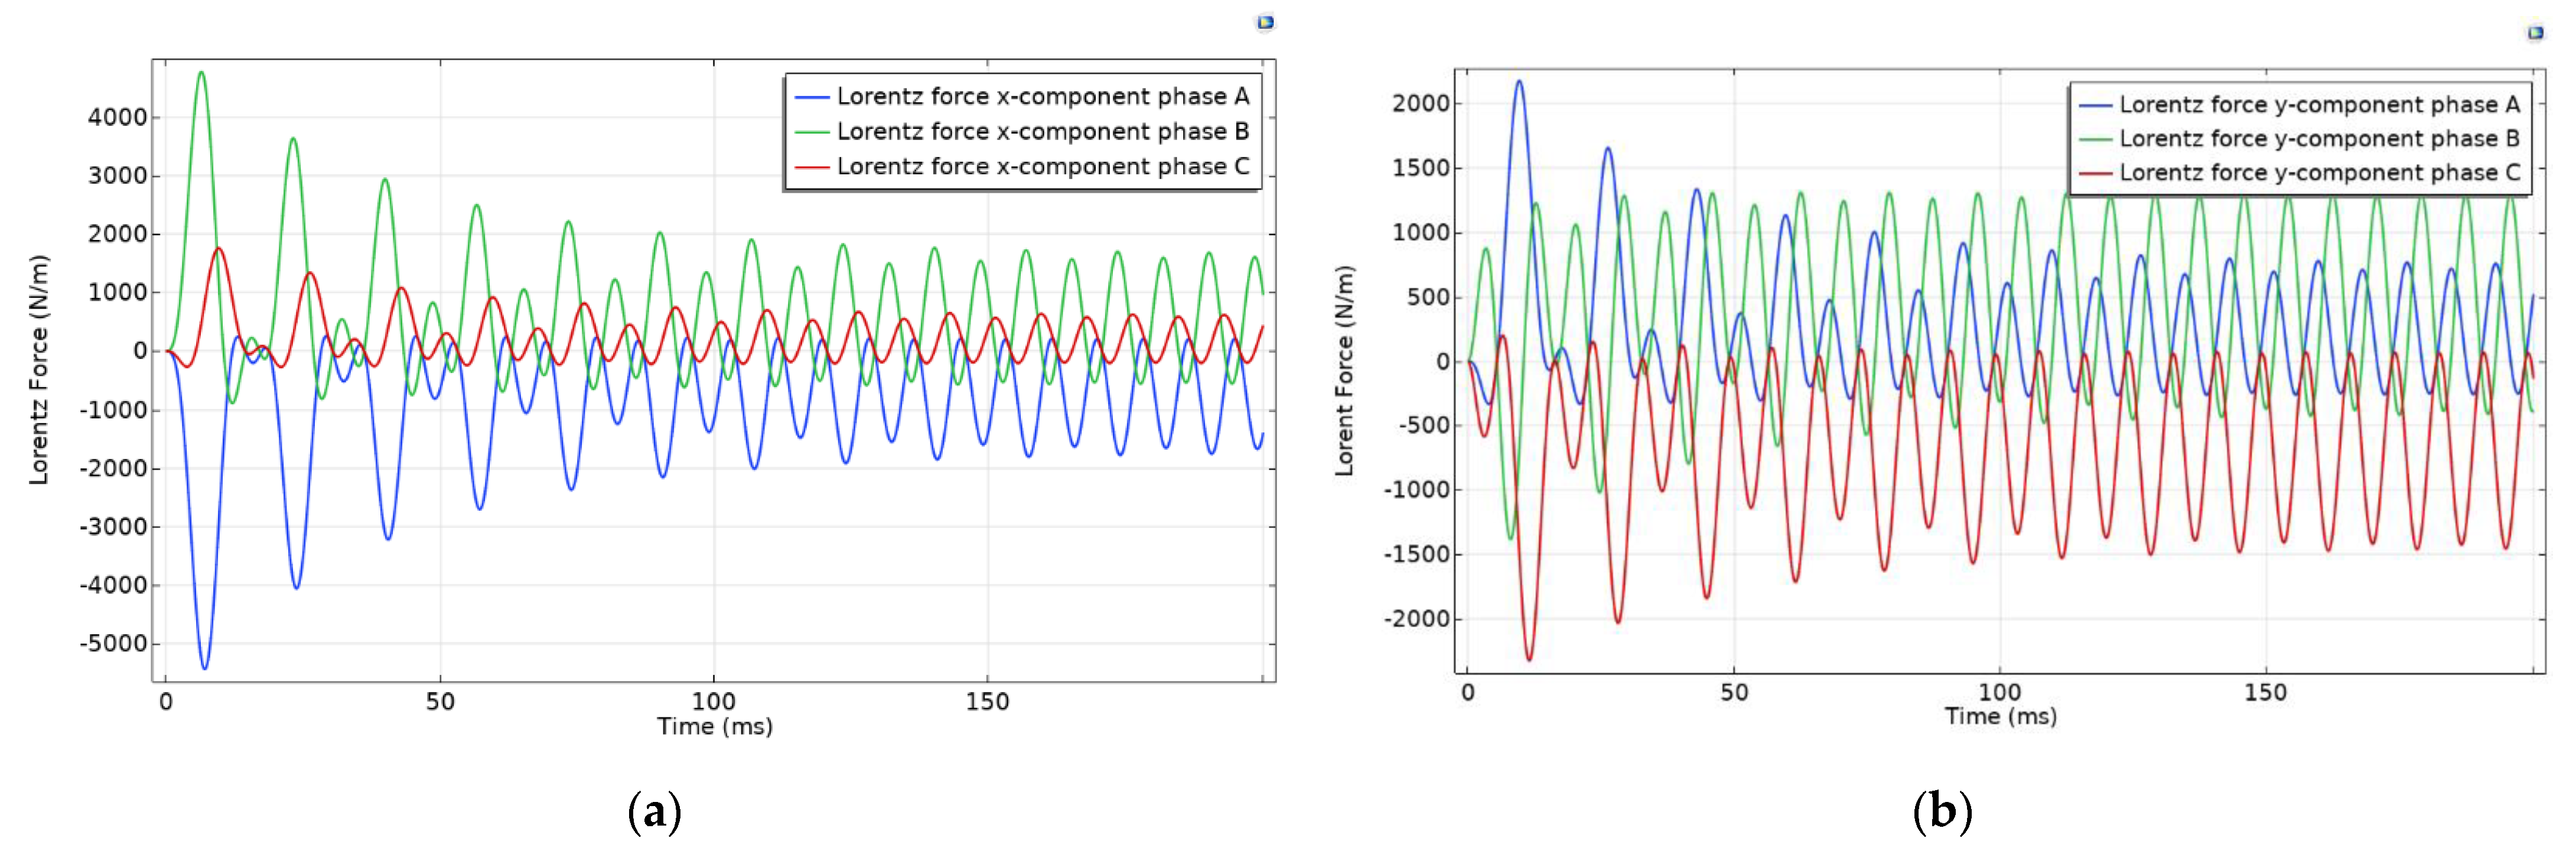
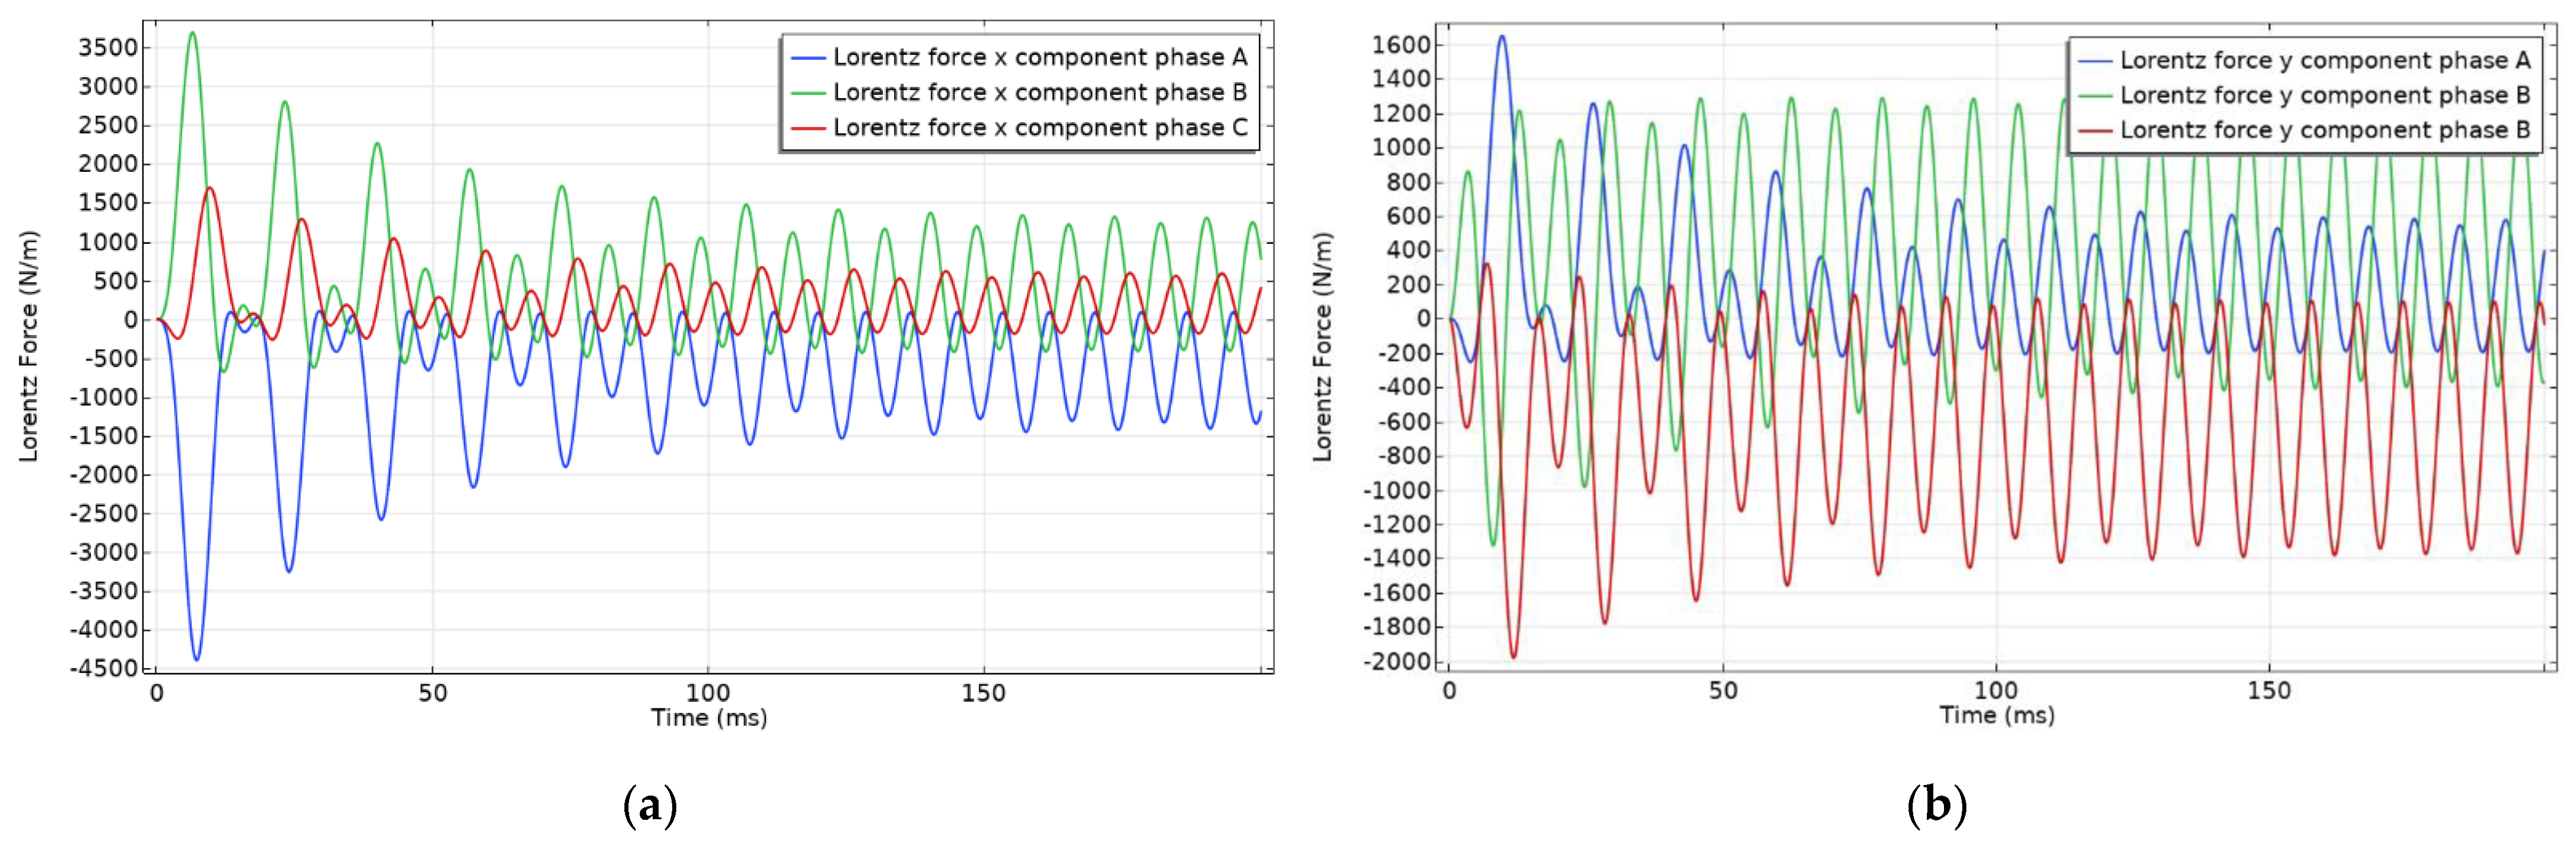
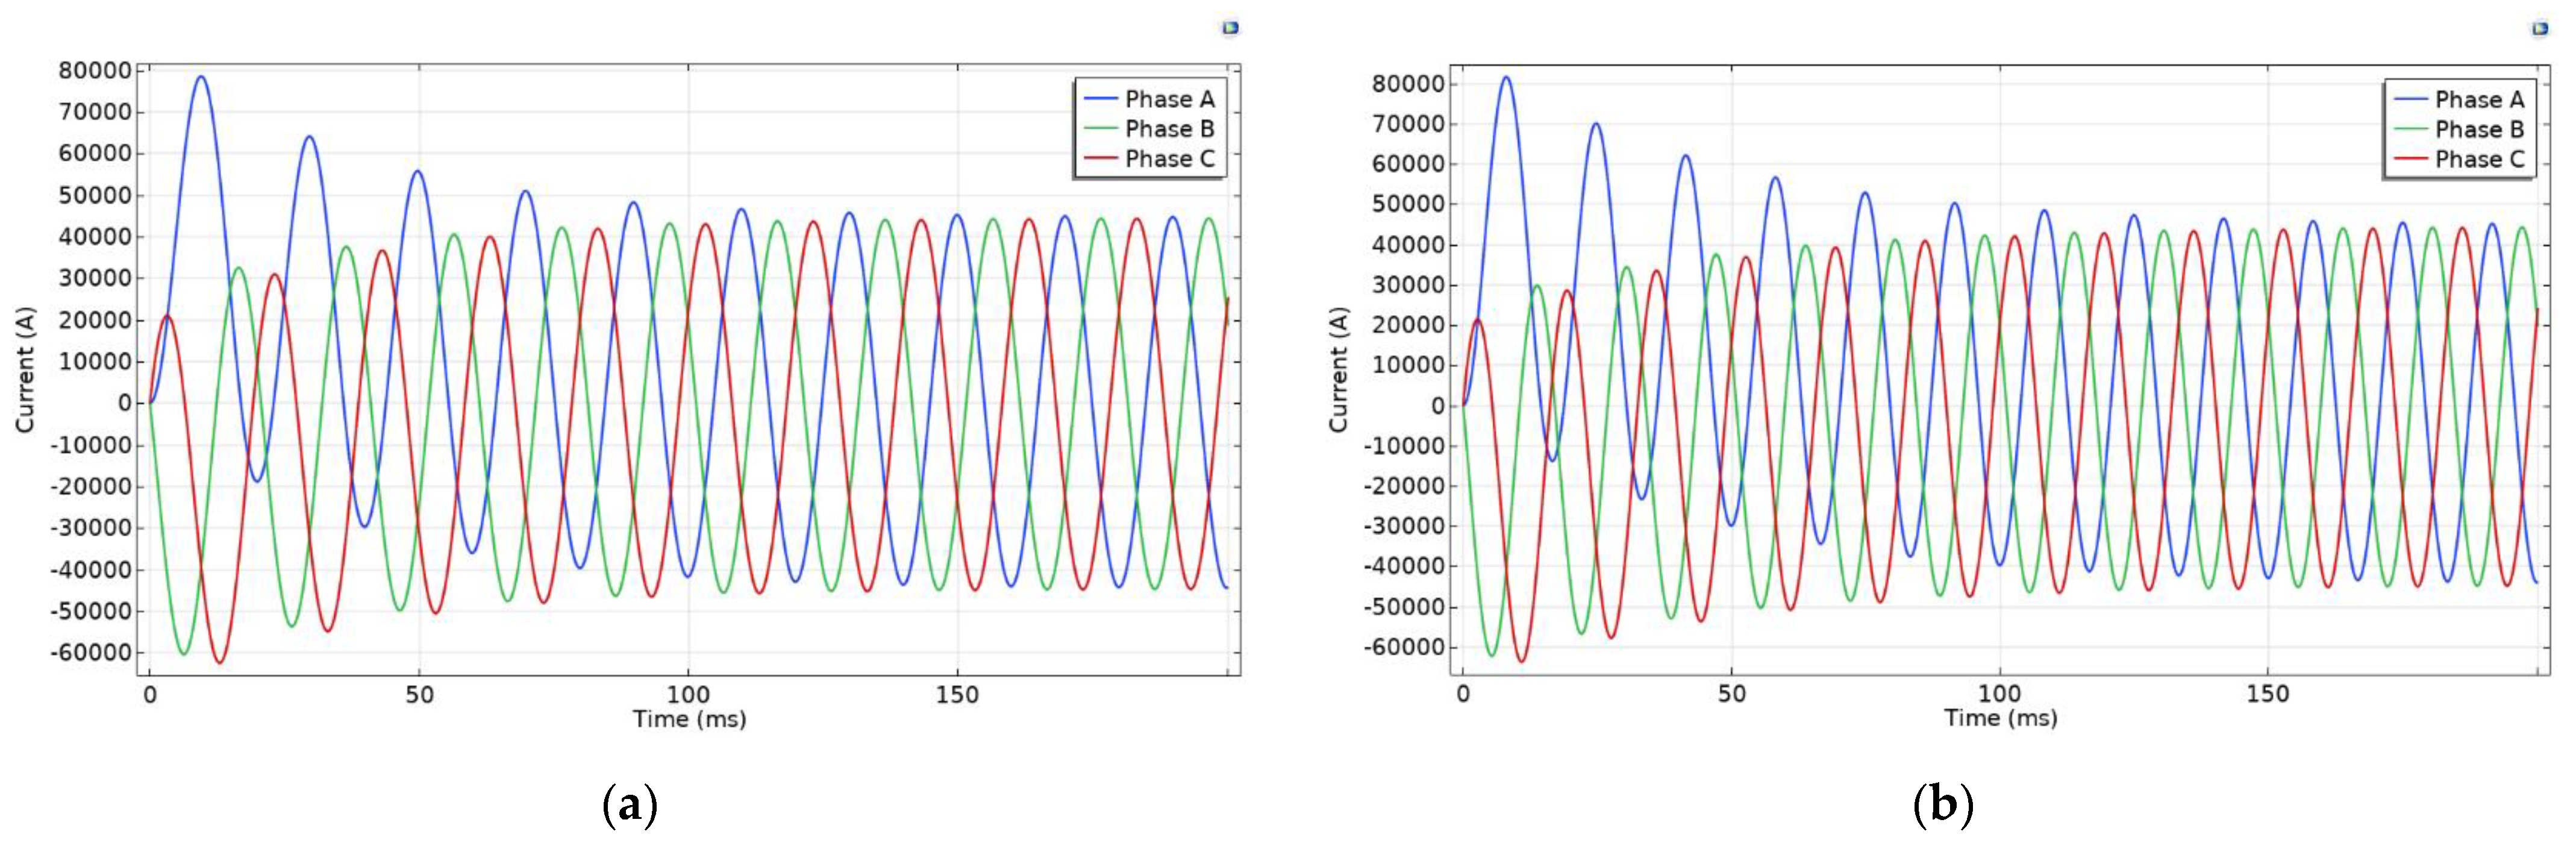
Further analysis was performed in the short-circuit regime to further distinguish the most feasible model. The analysis was performed on two selected models, model 2 for rectangular busbars and model 6 for circular profiles, whose topologies yielded the most acceptable electromagnetic losses. Since the previous results show an insignificant influence of the frequency used, only the results of the electrodynamic forces for 60 Hz are presented. The electrodynamic forces on the busbars of model 2 are shown in Figure 14.
The electrodynamic forces on the busbars of model 6 are shown in Figure 15.
As can be seen in Figure 14 and Figure 15, the electrodynamic forces acting in the x and y directions are lower for model 6 than for model 2. The data in Table 10, which contains the maximum absolute value of the forces per phase, confirms that the electrodynamic forces are lower for model 6.
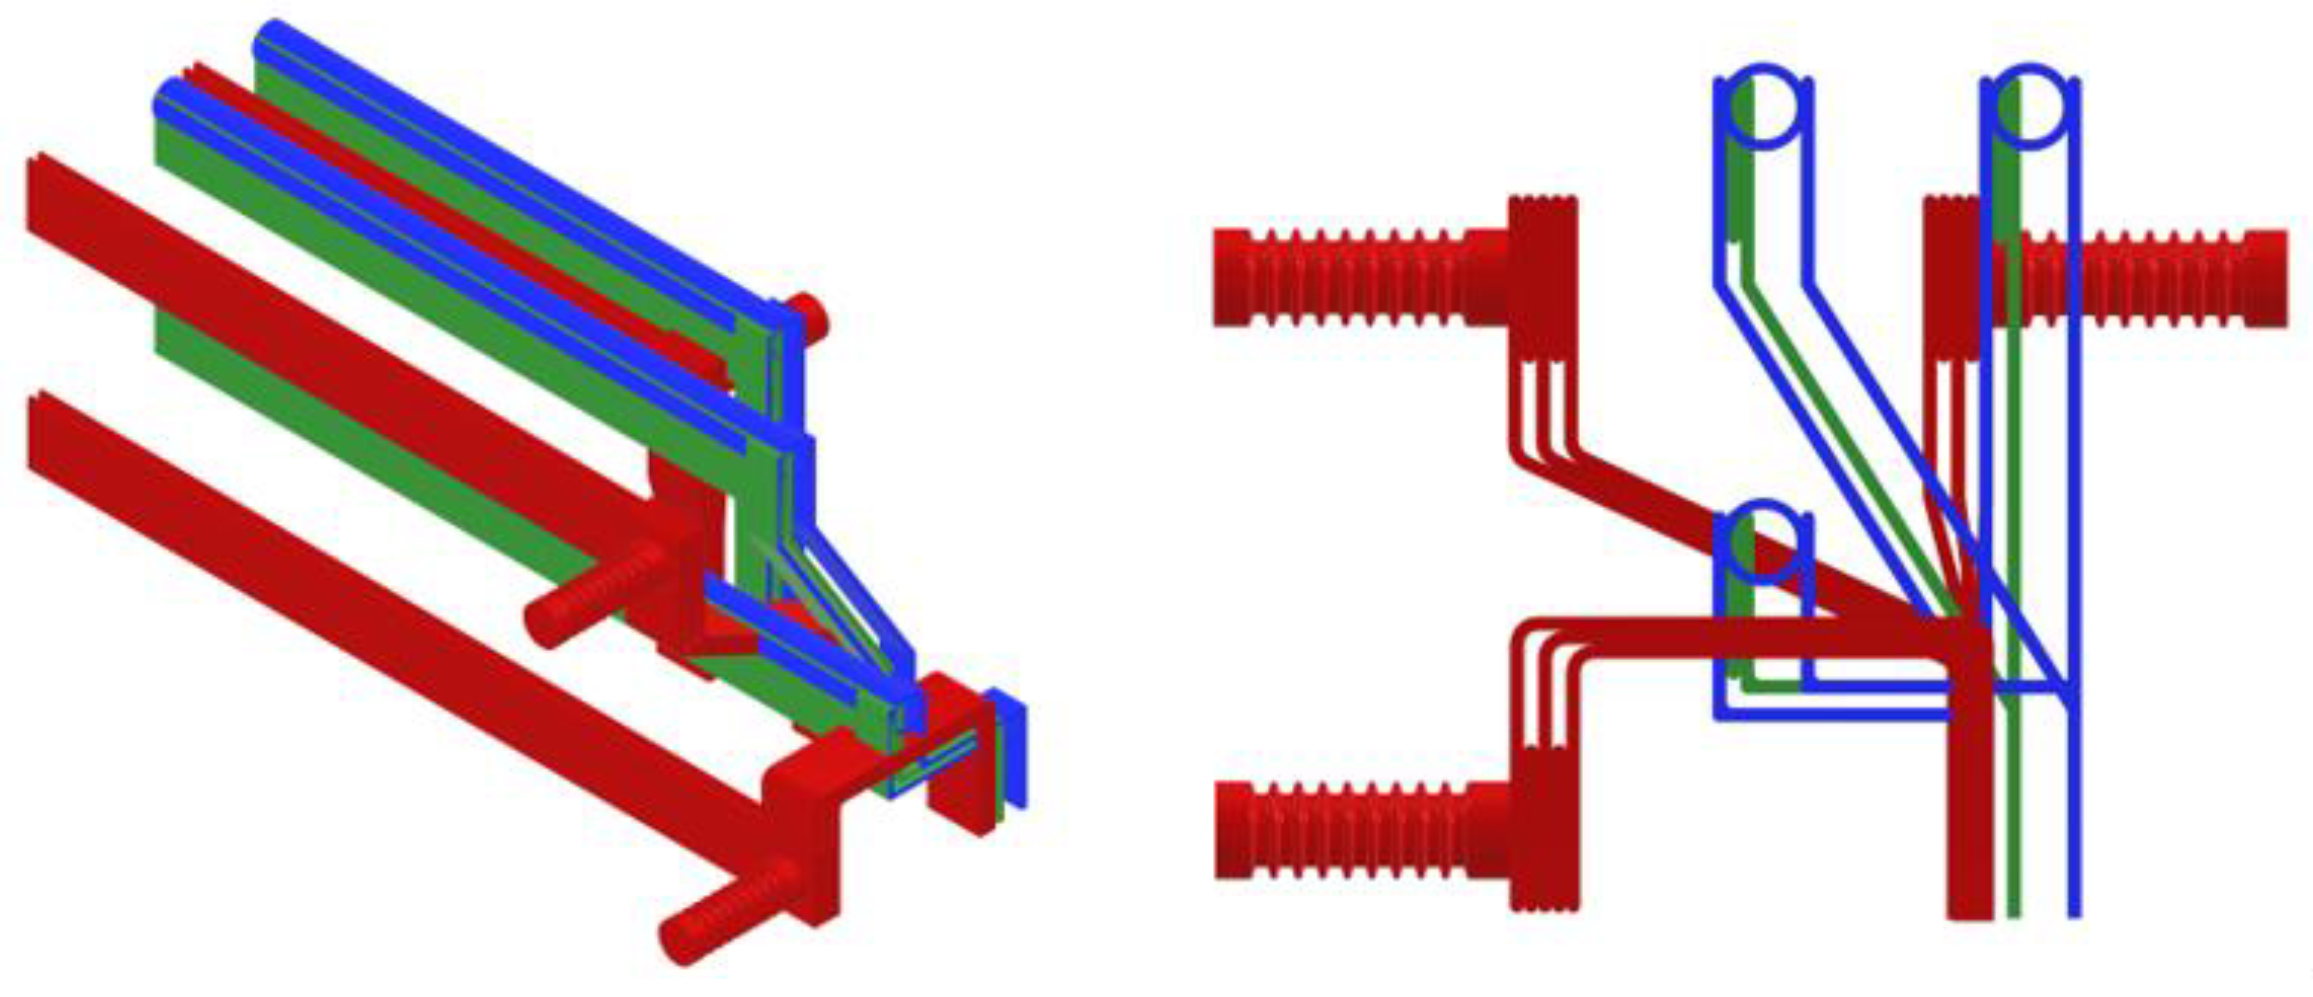
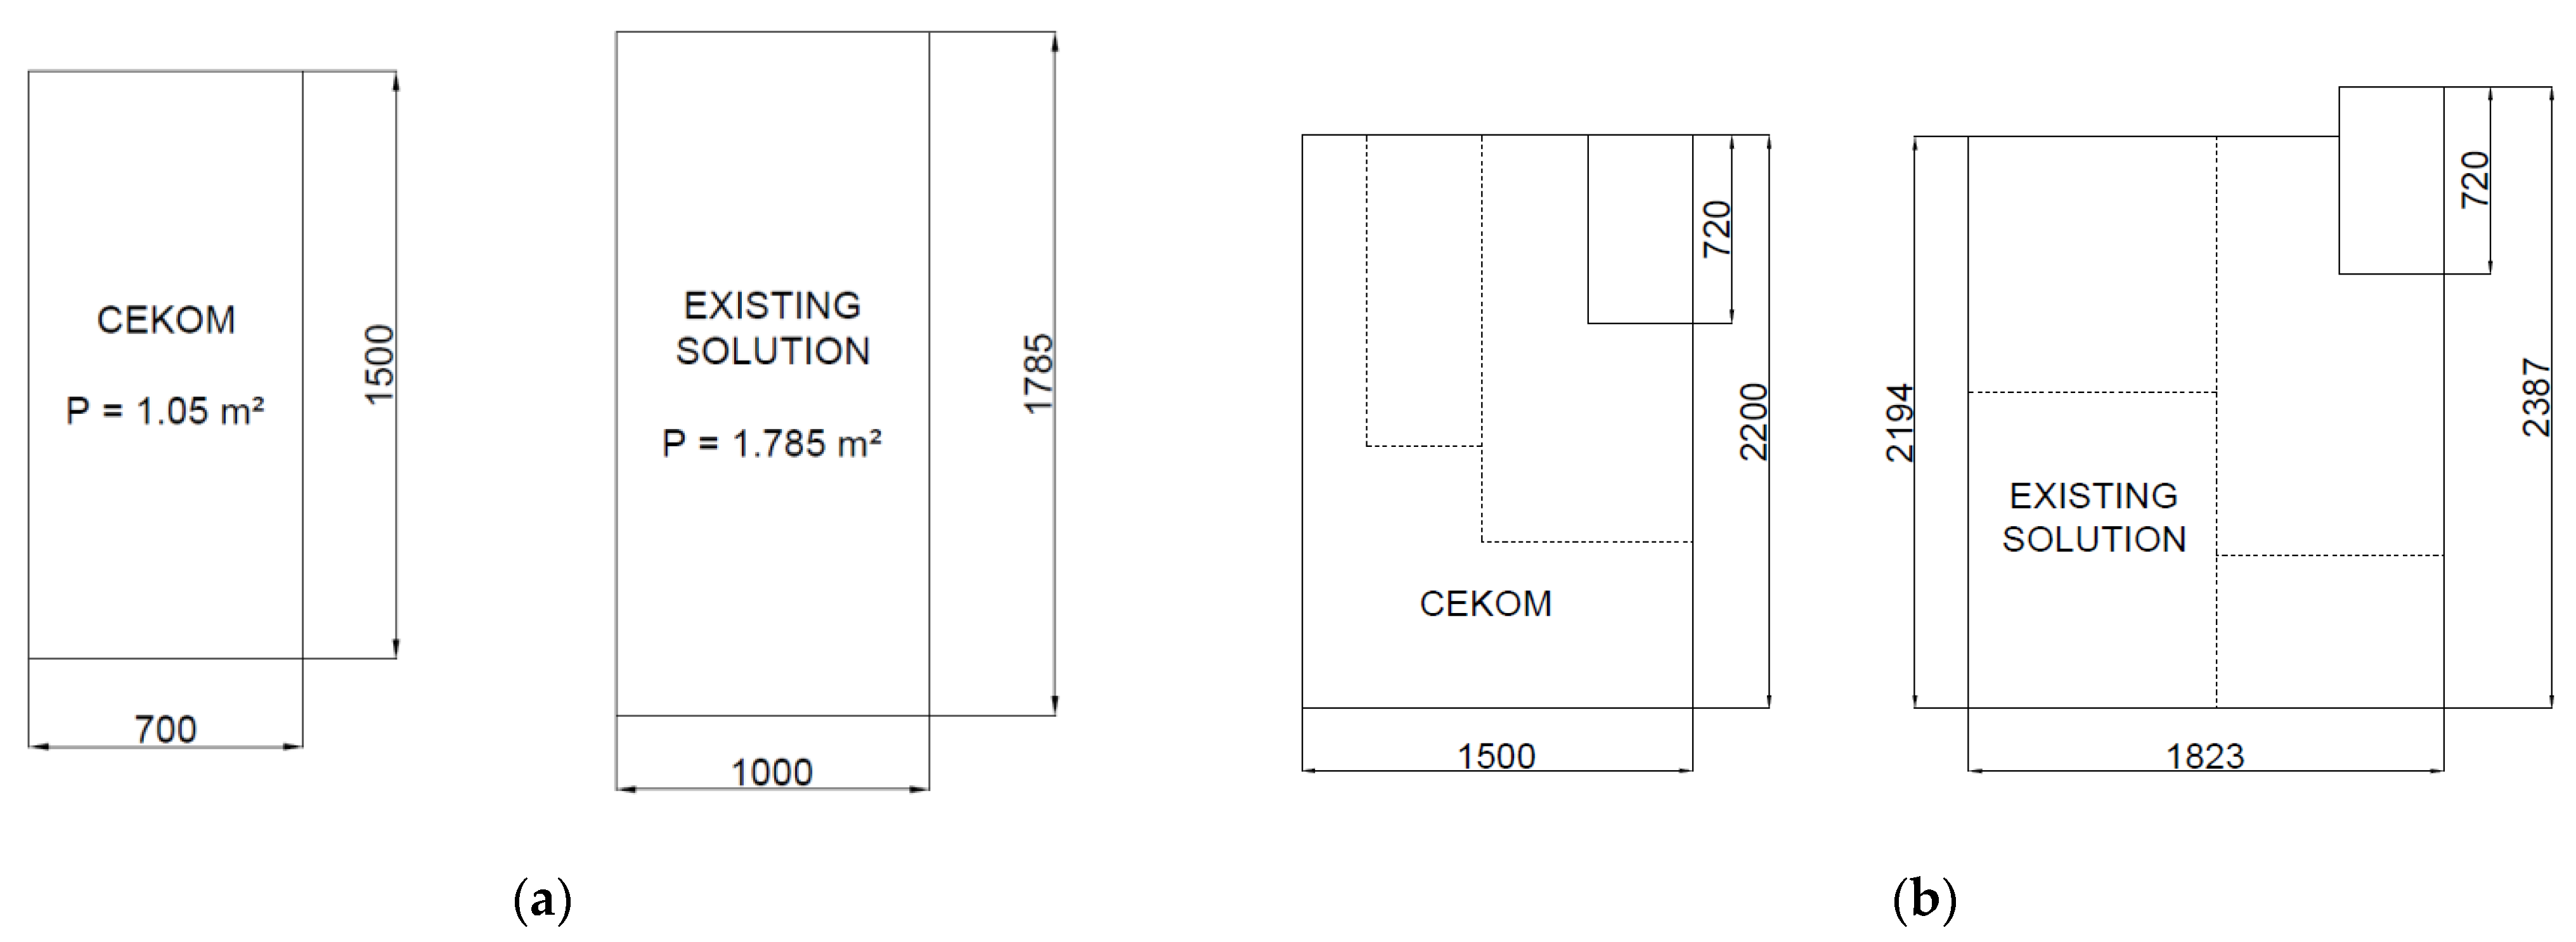
An existing solution from the project partners is used as a reference for the validation of the proposed design improvements. The comparison of the two design solutions is presented in Figure 16.
Figure 17 shows the space reduction of the busbar system in a 3D model compared to the existing switchgear busbar system (red). The proposed busbar system with a rectangular profile (model 2, green) and the proposed busbar system with circular profiles (model 6, blue) considerably reduce the space requirement. Consequently, the space reduction makes the reduction in the overall dimensions of the switchgear structure possible. The proposed busbar systems use double support sub-conductors without the use of insulating supports, which, if used, dictate the dimensions of the busbar compartment. The influence of the proposed support systems requires a more detailed and parameterized model [38] in future research.

3.5. Multi-Criteria Analysis

To provide a robust comparison between these various models in achieving a solution that is closest to the optimized one, a multi-criteria analysis was carried out. Additionally, two existing models (used in current systems) were added in comparison to indicate the contribution of our model.
The first existing model is the unmodified configuration already in use, and the second existing model is the existing model modified to the distances of the proposed models.
To select the most suitable model, the PROMETHEE (Preference Ranking Organization Method for Enrichment Evaluations) method was used through the Visual PROMETHEE software, version 1.4, Academic Edition. The method PROMETHEE belongs to the group of methods for multi-criteria decision making within the alternatives described with more attributes. More specifically, it is a family of methods that compresences sim methods PROMETHEE I, II, III, IV, V, VI.
The PROMETHEE is a ranking method that carries out a pairwise difference of the performance of alternatives over each criterion. The PROMETHEE I method provides a partial ranking of alternatives based on the positive (Phi+) and negative (Phi-) preference flows of the alternatives, while PROMETHEE II establishes a complete ranking of alternatives from best to worst based on net (Phi) preference flow.
Alternatives were evaluated according to six criteria, where two are static criteria (volume and weight), while the other four are dynamic criteria (EM losses at 50 Hz, EM losses at 60 Hz, EM losses at switchboard length, etc.). The objectives included:
  • Minimization of the model’s volume (m3);
  • Minimization of the model’s weight (kg);
  • Reduction in the heat at 50 Hz (W/m);
  • Reduction in the heat at 60 Hz (W/m);
  • Reduction in the total length heat loss at 50 Hz (W);
  • Reduction in the total length heat loss at 60 Hz (W).
The calculations of the total length and total heat losses are based on the dimensions of the existing and proposed design in the sense of an example switchboard consisting of 18 panels comprised of 4 incoming feeders and 14 outgoing feeders.
The PROMETHEE method uses three basic data inputs that allow ranking the models and proper decision making.
(a)
Input evaluation table: In this application, the evaluation table includes eight configurations, six criteria, and 8 × 6 preference measure evaluations. Table 11 shows the formulated input evaluations.
(b)
Weights of performance measures (criteria): In this study, all criteria are important, thus their weights are the same and set to 0.17.
(c)
Preference functions of performance measures (criteria): Usual preference function was used for this study that means if there is a very small difference in criterion value, a decision maker selects an alternative with a higher value.
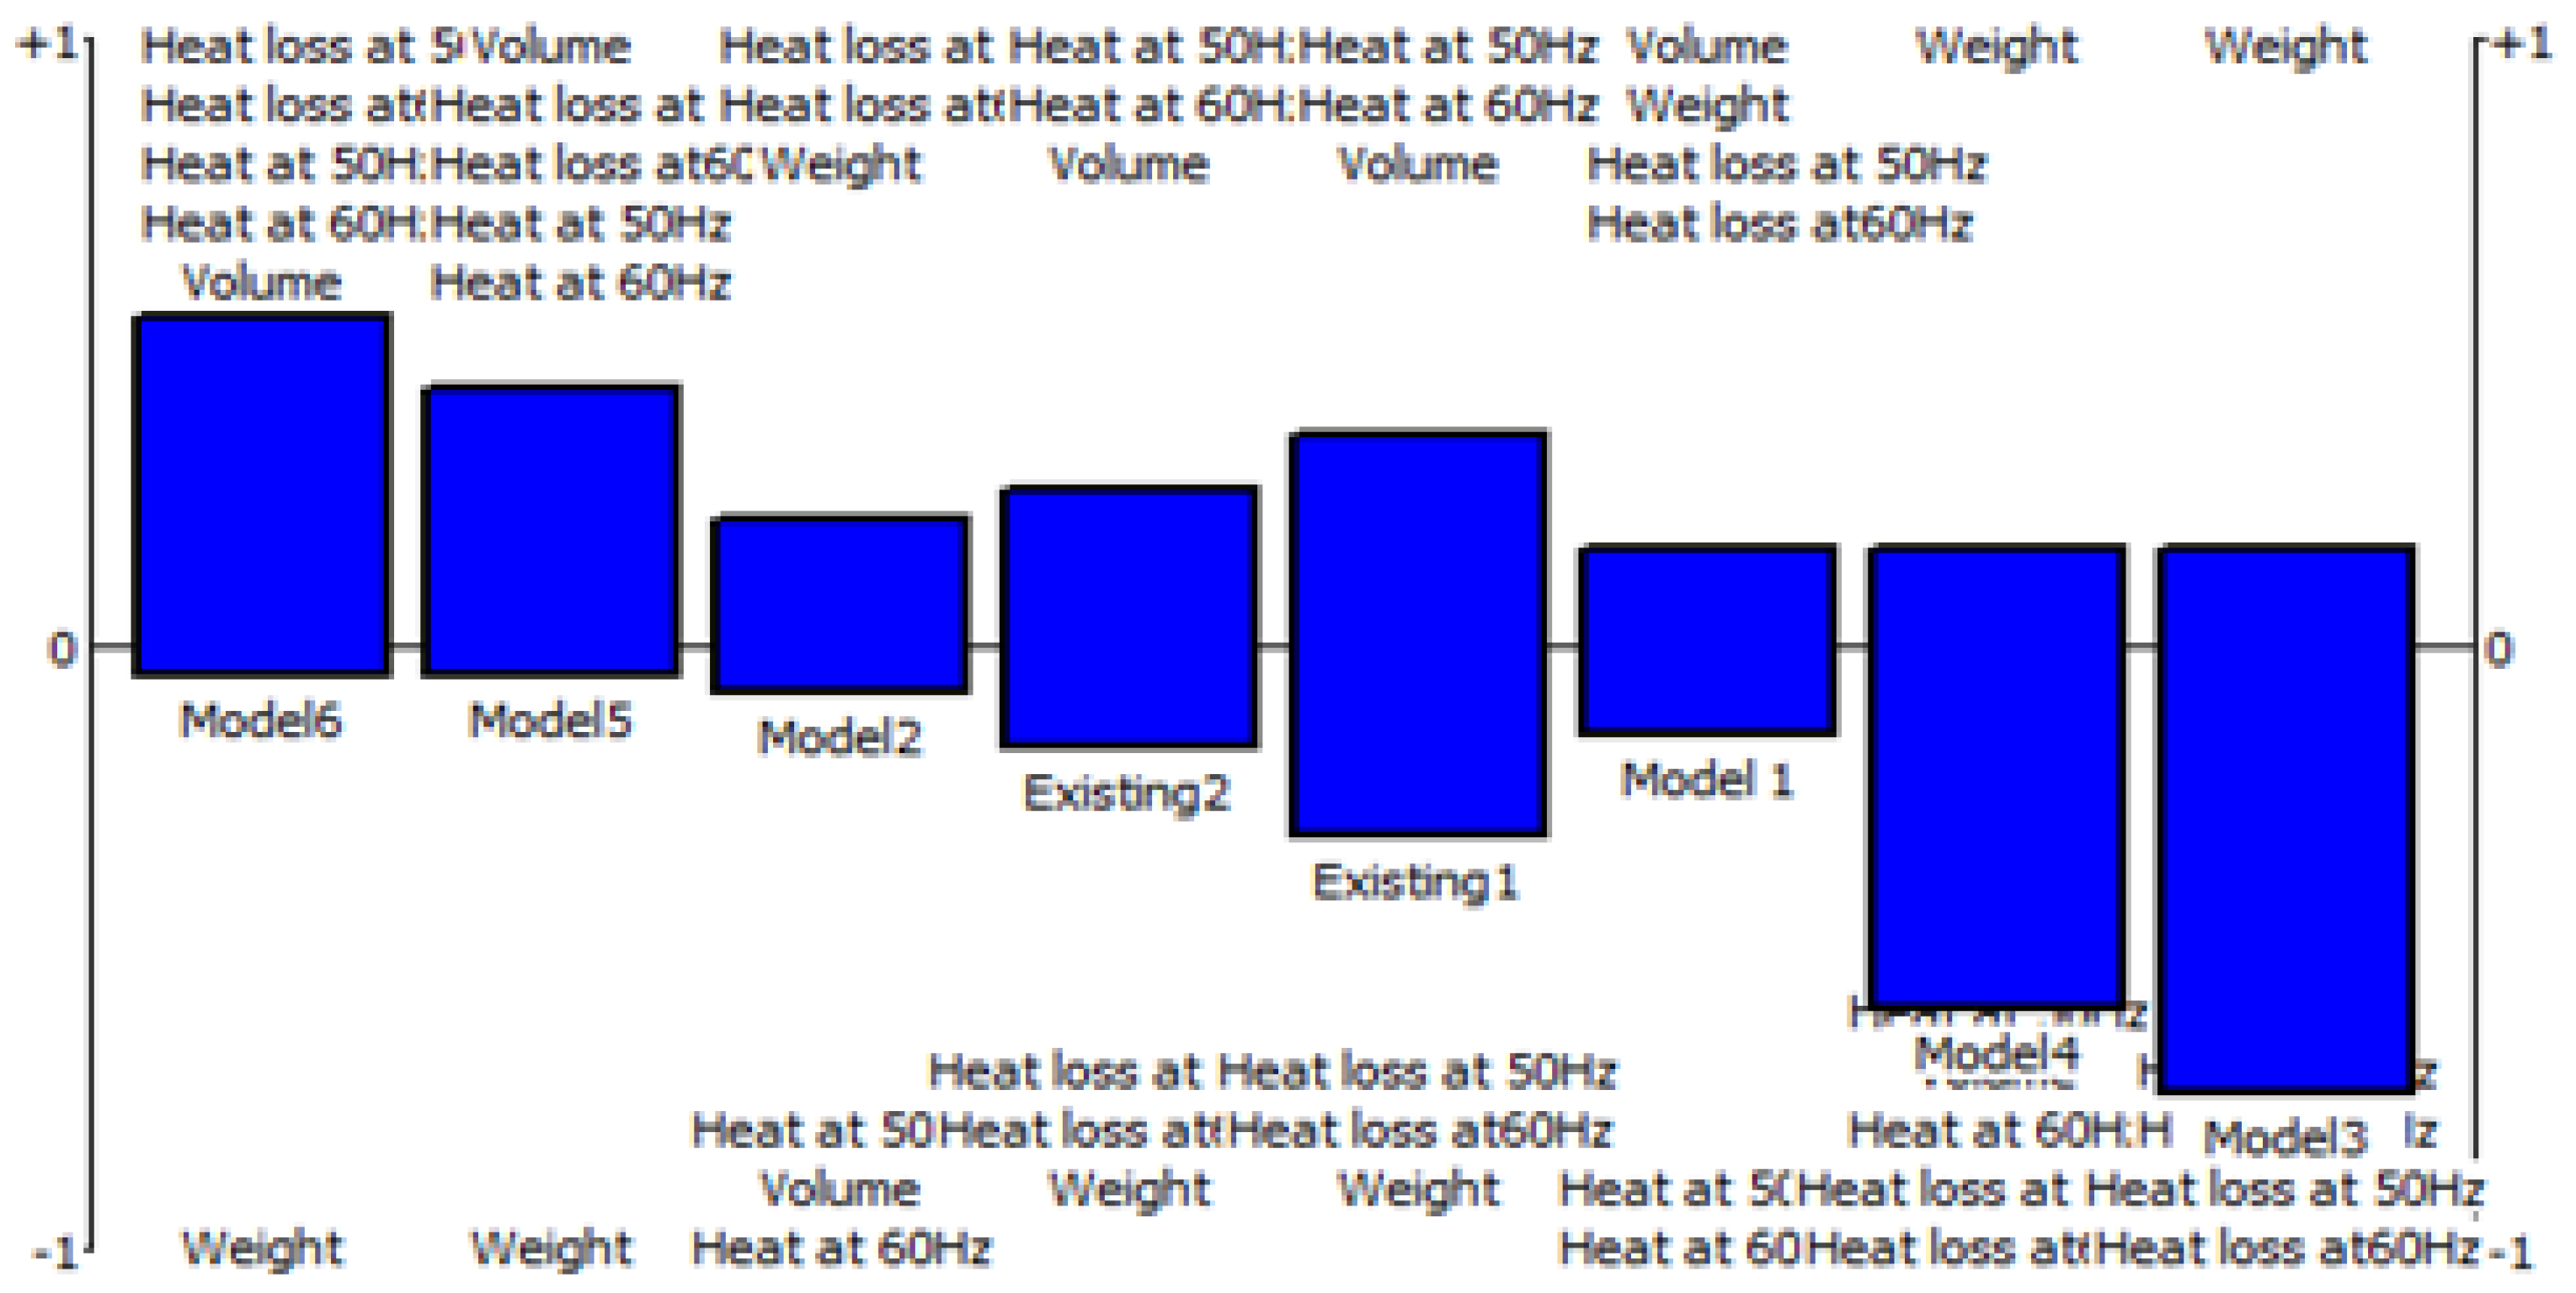
The results of Multi Criteria Decision Making (MCDM) are presented in Table 12.
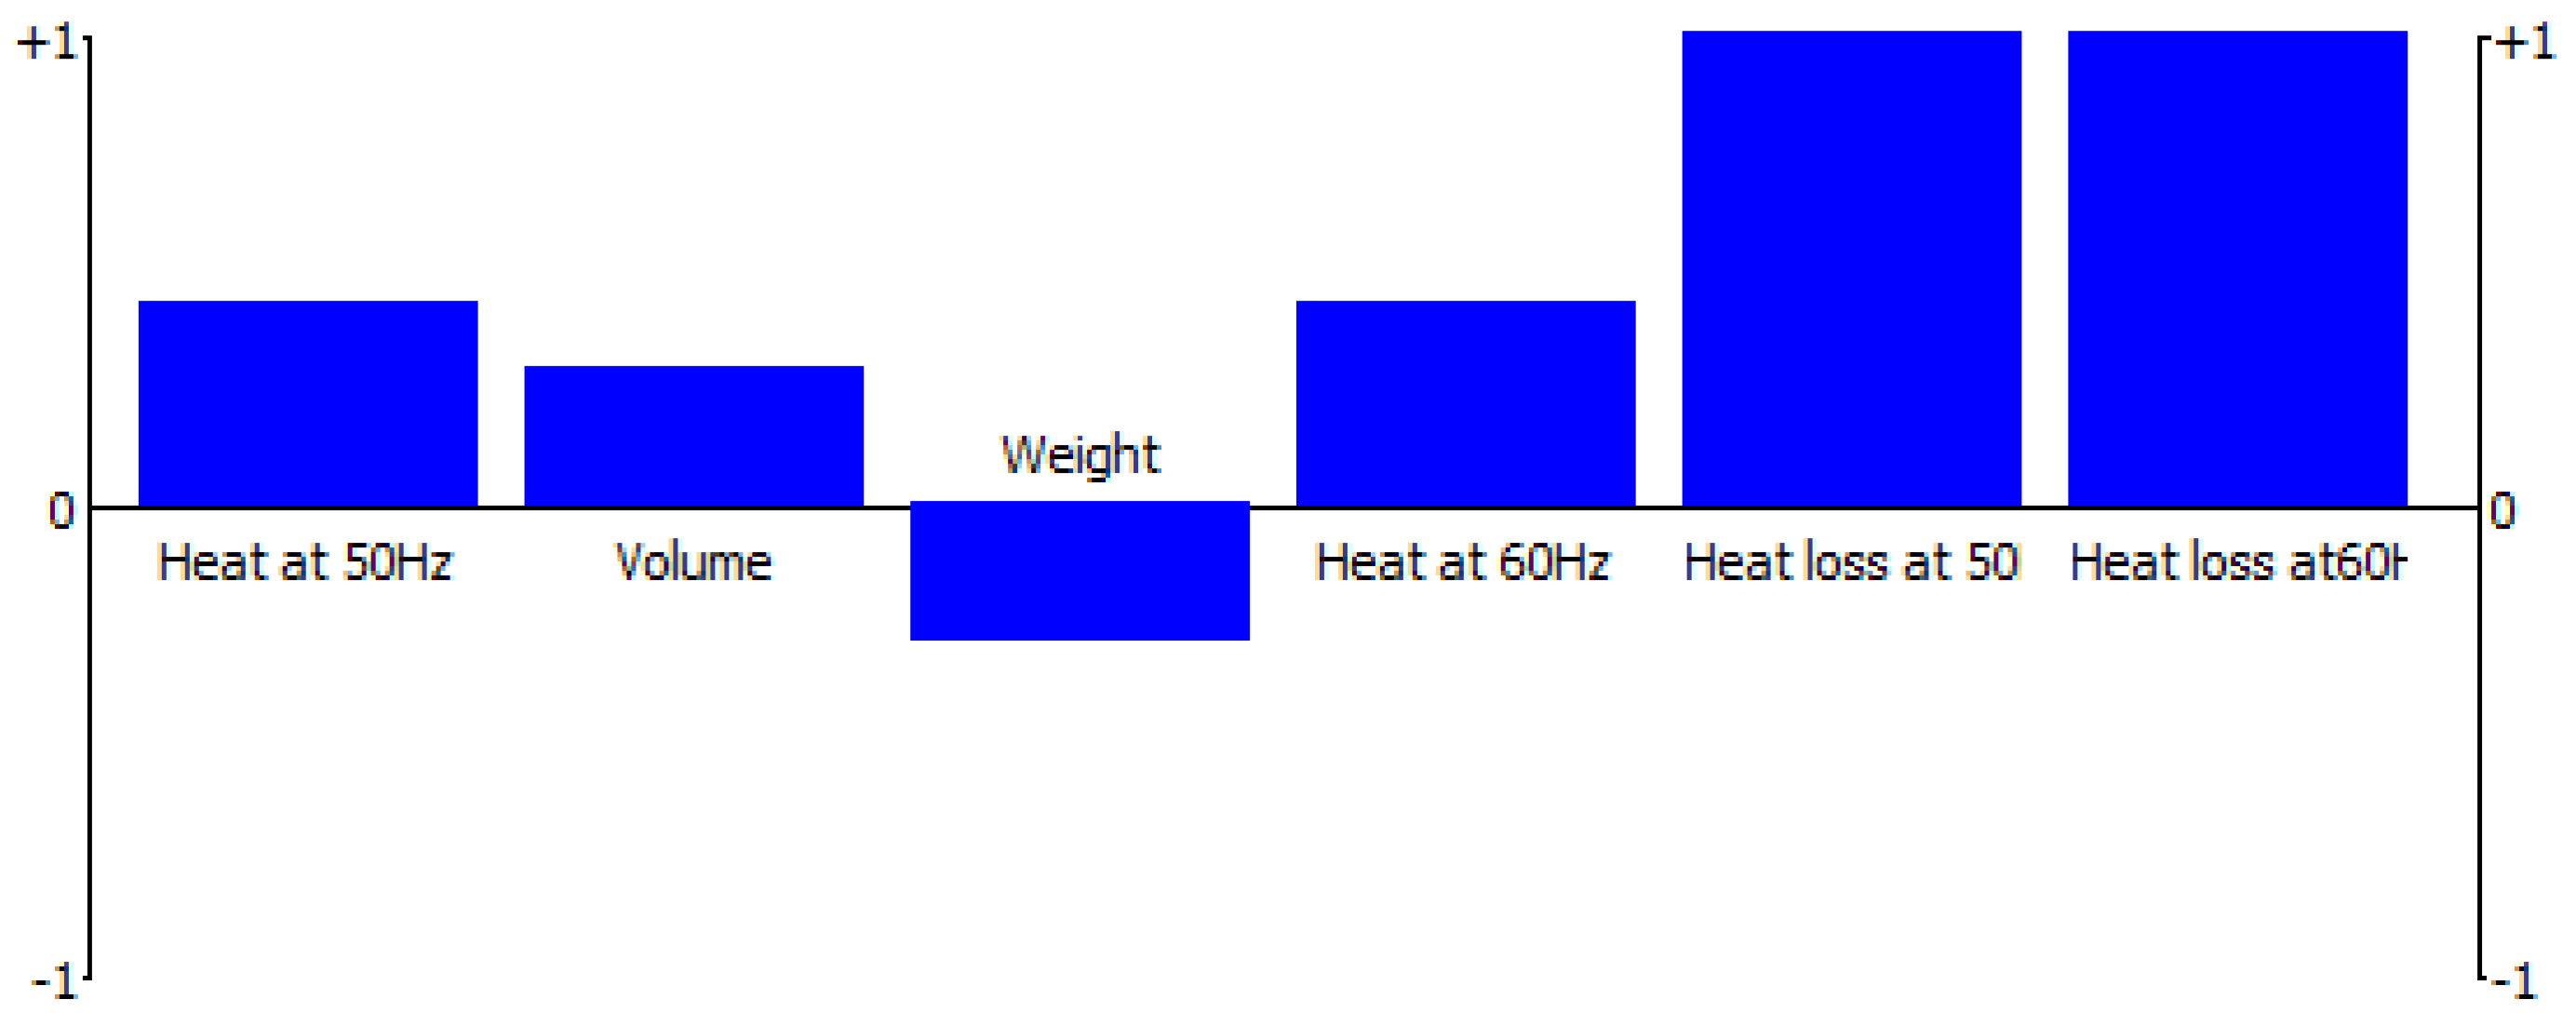
Model 6 achieved a high positive preference flow (Phi+) equal to 0.6905 and a negative flow (Phi−) equal to 0.22143. Two heat loss performances were classified as strong points for model 6 (Figure 18). This means that model 6 has the best performance only for these two criteria (Figure 19) and, thus, model 6 does not achieve a positive flow equal to 1.0. On the other hand, the weight performance is a weak point for model 6. For the existing two models, total EM losses for both 50 and 60 Hz, together with the weight criteria, were classified as their weak points.

4. Further Improvements to the Switchboard

The goal of reducing the dimensions of the switchgear and, consequently, the switchboard dimensions was contributed to by implementing novel technologies such as voltage and current sensors. The mentioned sensors are the Rogowski coil as the current sensor and resistive voltage divider as the voltage sensor, and are based on the following working principles:
(a)
Rogowski coil—consisting of an air-cored toroidal winding encircling the conductor whose current is measured. They work on the principle of Faraday’s Law of induction. The current passing through the conductor creates an alternating magnetic field that consequently induces a voltage on the terminals of the coil. The output voltage is proportional to the rate of changing current that is measured. The voltage waveform that accurately reproduces the current waveform is achieved with the implementation of an electronic integrator.
(b)
Resistive voltage divider—a passive device composed of resistive components connected in a voltage divider. The output voltage at the low voltage branch is at an adjusted voltage ratio in regard to the high input voltage.
These sensors offer several advantages compared to conventional instrument transformers [39]:
  • Non-saturable as no iron core is used;
  • High degree of accuracy;
  • Personnel safety (low secondary voltages);
  • Small size and weight;
  • Reduced losses;
  • Extensive dynamic range;
  • Environmental friendliness since less raw material is used;
  • Switchboard digitalization with the implementation of the IEC 61850-9-2 standard.
The contributions of sensor technology implementation to the switchboard will be analyzed on the afore-mentioned example with the total number of sensors:
  • 4 incoming feeders—12 voltage sensors/ITs and 12 current sensors/ITs
  • 14 outgoing feeders—42 current sensors/ITs
The analysis is based on the comparison of the implementation in the existing design with the implemented conventional ITs that are equal in the technical requirements for our voltage/current levels. After the market analysis of available sensors, the available sensor configurations are:
  • Separate current and voltage sensors [40,41];
  • Combined current and voltage sensor [42].
With the data of the ITs [43,44], the weight and volume differences of the single IT/sensor are presented in Table 13, with the assumption that the combined sensor replaces a voltage and current transformer.
Another significant contribution of sensor technology is the reduction in the energy consumption of the ITs [45]. The vast difference signifies the importance of analyzing all components that contribute to the overall energy efficiency.
Now, with the known optimal model of busbars (Model 6) and the implementation of novel sensor technology on the example switchboard, the overall improvements given in percentage compared to the existing solution are presented in Table 14. The sensor configurations are separated into two with one configuration consisting of the individual 54 current sensors and 12 voltage sensors, and the other with 12 combined sensors for the input feeders and 42 current sensors.
The energy consumption is considered an improvement of 100% since the sensors’ energy consumption can be considered as non-existent compared to the ITs.

5. Conclusions

The distribution and transmission of electricity make a significant contribution to energy efficiency on vessels. This research is based on optimizing the dimensions of the main switchboard by combining different parameters: short-circuit current, frequency, weight, distance and weight of busbars. The adequate choice of busbar dimensions and their configuration allows for switchgear dimension, weight and energy loss reduction, while fully satisfying the technical requirements for proper operation.
Furthermore, considering the study case and the test performed, the most acceptable bus model has been selected to be placed in the main switchboard, thereby reducing the space of the bus field of the high-voltage switchboard. This choice, other than making it easier to install and reducing the mass of the assembly, also affects the total carrying capacity of the vessel, which certainly contributes to reducing fuel consumption and emissions and, therefore, energy efficiency.
The replacement of the conventional instrument transformers (ITs) with sensors allows the reduction in switchgear dimensions and overall mass of the main switchboard with the energy losses being lower.

Author Contributions

Conceptualization, M.K., M.Z. and N.K.; validation, A.G. and M.K.; formal analysis M.K., M.Z., N.K. and A.G., writing—original draft preparation, M.K., M.Z., N.K. and A.G.; visualization, M.K., M.Z., N.K. and A.G. All authors have read and agreed to the published version of the manuscript.

Funding

This research received no external funding.

Institutional Review Board Statement

Not applicable.

Informed Consent Statement

Not applicable.

Acknowledgments

The research on this paper is part of the research carried out on the project IRA CEKOM (Advanced Mobility Competitive Center KK.01.2.2.03.0022)—Development and manufacture of compact marine medium voltage switching block 15/17.5 kV.

Conflicts of Interest

The authors declare no conflict of interest.

References

  1. Skjong, E.; Volden, R.; Rodskar, E.; Molinas, M.; Johansen, T.A.; Cunningham, J. Past, Present, and Future Challenges of the Marine Vessel’s Electrical Power System. IEEE Trans. Transp. Electrif. 2016, 2, 522–537. [Google Scholar] [CrossRef] [Green Version]
  2. DNVGL-OS-D201.Pdf. Available online: https://rules.dnv.com/docs/pdf/DNV/OS/2017-01/DNVGL-OS-D201.pdf (accessed on 18 June 2021).
  3. Fjeld, E.; Pedersen, A.; Kriegel, M.; Singh, S.; Barrio, S.; Snajdr, J.; Li, Z. Limitations in the Application of Computer Simulations of Temperature Rise of Completely New Designs of MV Metal Enclosed Switchgear. IEEE Trans. Power Deliv. 2021, 36, 2740–2747. [Google Scholar] [CrossRef]
  4. Labridis, D.; Dokopoulos, P. Electromagnetic forces in three-phase rigid busbars with rectangular cross-sections. IEEE Trans. Power Deliv. 1996, 11, 793–800. [Google Scholar] [CrossRef]
  5. Yusop, F.M.; Jamil, M.K.M.; Ishak, D.; Husaini, M.; Masri, S. Investigation of electromagnetic force during short-circuit test in three-phase busbar system. In Proceedings of the 2011 IEEE Colloquium on Humanities, Science and Engineering, Penang, Malaysia, 5–6 December 2011; pp. 340–344. [Google Scholar]
  6. Sroubova, L.; Kropik, P.; Hamar, R.; Dolezel, I. Minimization of force and thermal effects in bus bars. In Proceedings of the 2016 ELEKTRO, Strbske Pleso, Slovakia, 16–18 May 2016; 2016; pp. 383–386. [Google Scholar] [CrossRef]
  7. Szulborski, M.; Łapczyński, S.; Kolimas, Ł.; Kozarek, Ł.; Rasolomampionona, D.D. Calculations of Electrodynamic Forces in Three-Phase Asymmetric Busbar System with the Use of FEM. Energies 2020, 13, 5477. [Google Scholar] [CrossRef]
  8. Abd-El-Aziz, M.; Nashed, M.N.F.; Adly, A.; Abou-El-Zahab, E. Electromagnetic Forces Densities for 3 Phase Busbar Parallel Connected to Rectifier Load. In Proceedings of the 2011 International Conference on Advanced Power System Automation and Protection, Beijing, China, 16–20 October 2011; pp. 484–488. [Google Scholar]
  9. Kadkhodaei, G.; Sheshyekani, K.; Hamzeh, M.; Tavakoli, S.D. Multiphysics analysis of busbars with various arrangements under short-circuit condition. IET Electr. Syst. Transp. 2016, 6, 237–245. [Google Scholar] [CrossRef]
  10. Otero, A.F.; Vilacha, C.; Moreira, J.C.; Miguez, E. Electrodynamics Simulation of Overhead Power Lines. IEEE Trans. Power Deliv. 2012, 27, 560–567. [Google Scholar] [CrossRef]
  11. Zubcic, M.; Krcum, M. Power Frequency Withstand Voltage Type Testing and FEM Analysis of the Medium-Voltage Switchgear Busbar Compartment. In Proceedings of the 2018 17th International Symposium INFOTEH-JAHORINA (INFOTEH), East Sarajevo, Bosnia and Herzegovina, 21–23 March 2018; pp. 1–5. [Google Scholar]
  12. Popa, I.C.; Dolan, A.-I. Numerical modeling of three-phase busbar systems: Calculation of the thermal field and electrodynamic forces. In Proceedings of the 2016 International Conference on Applied and Theoretical Electricity (ICATE), Craiova, Romania, 6–8 October 2016; pp. 1–9. [Google Scholar]
  13. Yusop, F.M.; Jamil, M.K.M.; Ishak, D.; Masri, S. Study on the electromagnetic force affected by short-circuit current in vertical and horizontal arrangement of busbar system. In Proceedings of the International Conference on Electrical, Control and Computer Engineering 2011 (InECCE), Kuantan, Malaysia, 21–22 June 2011; pp. 196–200. [Google Scholar]
  14. Li, S.; Han, Y.; Liu, C. Coupled Multiphysics Field Analysis of High-Current Irregular-Shaped Busbar. IEEE Trans. Compon. Packag. Manuf. Technol. 2019, 9, 1805–1814. [Google Scholar] [CrossRef]
  15. Muhammood, M.; Kamarol, M.; Ishak, D.; Masri, S. Temperature rise prediction in 3-phase busbar system at 20 °C ambient temperature. In Proceedings of the 2012 IEEE International Conference on Power and Energy (PECon), Kota Kinabalu, Malaysia, 2–5 December 2012; pp. 736–740. [Google Scholar]
  16. Slavtchev, Y.; Mateev, V.; Tzeneva, R. 3D Coupled Electric-Thermal-Fluid Analysis of Bolted Busbar Connection. In Proceedings of the 2019 16th Conference on Electrical Machines, Drives and Power Systems (ELMA), Varna, Bulgaria, 6–8 June 2019; pp. 1–4. [Google Scholar]
  17. Park, S.W.; Cho, H. A practical study on electrical contact resistance and temperature rise at at the connections of the copper busbars in switchgears. In Proceedings of the 2014 IEEE 60th Holm Conference on Electrical Contacts (Holm), New Orleans, LA, USA, 12–15 October 2014; pp. 1–7. [Google Scholar] [CrossRef]
  18. Tzeneva, R.; Mateev, V.; Slavtchev, Y. 3D Coupled Electric-Thermal Analyis of Bolted Busbar Connections. In Proceedings of the 2018 20th International Symposium on Electrical Apparatus and Technologies (SIELA), Bourgas, Bulgaria, 3–6 June 2018; pp. 1–4. [Google Scholar]
  19. Lotiya, J. Thermal Analysis and Optimization of Temperature Rise in Busbar Joints Configuration by FEM. In Proceedings of the 2014 6th IEEE Power India International Conference (PIICON), Delhi, India, 5–7 December 2014; pp. 1–5. [Google Scholar]
  20. Ranvier, S.; Paquay, S.; Requier, S.; Lamy, H.; Rochus, V.; Francis, L.A.; Rochus, P. Influence of multiphysics couplings on the performance of a MEMS magnetometer. In Proceedings of the 2010 11th International Thermal, Mechanical & Multi-Physics Simulation, and Experiments in Microelectronics and Microsystems (EuroSimE), Linz, Austria, 26–28 April 2010; pp. 1/6–6/6. [Google Scholar]
  21. Shah, M.; Bedrosian, G.; Joseph, J. Steady-state loss and short-circuit force analysis of a three-phase bus using a coupled finite element+circuit approach. IEEE Trans. Energy Convers. 1999, 14, 1485–1489. [Google Scholar] [CrossRef]
  22. Abd-El-Aziz, M.; AdIy, A.; Abou-Ei-Zahab, E.-E.-D. Assessment of electromagnetic forces resulting from arbitrary geometrical busbar configurations. In Proceedings of the International Conference on Electrical, Electronic and Computer Engineering, 2004, ICEEC’04, Cairo, Egypt, 5–7 September 2004; pp. 774–777. [Google Scholar]
  23. COMSOL Multiphysics Software Package. Available online: http://www.comsol.com (accessed on 21 April 2021).
  24. Fluri, R.; Schmid, J.; Braun, P. Applications of Low Power Current and Voltage Sensors. In Proceedings of the 21st International Conference on Electricity Distribution, Frankfurt, Germany, 6–9 June 2011; p. 4. [Google Scholar]
  25. Shepard, D.E.; Yauch, D.W. An Overview of Rogowski Coil Current Sensing Technology. Available online: https://citeseerx.ist.psu.edu/viewdoc/download?doi=10.1.1.473.9903&rep=rep1&type=pdf (accessed on 6 September 2021).
  26. Energy Efficiency Technologies Information Portal: GreenVoyage2050. Available online: https://greenvoyage2050.imo.org/energy-efficiency-technologies-information-portal/ (accessed on 6 September 2021).
  27. Triantafyllidis, D.G.; Dokopoulos, P.S.; Labridis, D. Parametric short-circuit force analysis of three-phase busbars-a fully automated finite element approach. IEEE Trans. Power Deliv. 2003, 18, 531–537. [Google Scholar] [CrossRef]
  28. Kadkhodaei, G.; Sheshyekani, K.; Hamzeh, M. Coupled electric–magnetic–thermal–mechanical modelling of busbars under short-circuit conditions. IET Gener. Transm. Distrib. 2016, 10, 955–963. [Google Scholar] [CrossRef]
  29. COMSOL AB. AC/DC Module Users Guide; COMSOL AB: Stockholm, Sweden, 2018. [Google Scholar]
  30. COMSOL AB. COMSOL Multiphysics Reference Manual; COMSOL AB: Stockholm, Sweden, 2018. [Google Scholar]
  31. Krčum, M.; Zubčić, M.; Dlabač, T. Electromechanical Analysis of the Medium Voltage Earthing Switch due to Short-Time and Peak Withstand Current Test. Energies 2019, 12, 3189. [Google Scholar] [CrossRef] [Green Version]
  32. International Electrotechnical Commission. IEC 60909-0:2016: Short-Circuit Currents in Three-Phase a.c. Systems—Part 0: Calculation of Currents; IEC: Geneva, Switzerland, 2016. [Google Scholar]
  33. International Electrotechnical Commission. IEC 62271-1:2007: High-Voltage Switchgear and Controlgear—Part 1: Common Specifications; IEC: Geneva, Switzerland, 2007. [Google Scholar]
  34. DNV GL Vessel Register. Available online: https://vesselregister.dnvgl.com/vesselregister/vesselregister.html (accessed on 12 February 2021).
  35. Copper Development Association. Copper for Busbars-Guidance for Design and Installation; Copper Development Association: New York, NY, USA, 2014. [Google Scholar]
  36. Gremmel, H.; ABB-Calor-Emag-Schaltanlagen AG; ABB-Calor-Emag-Mittelspannung GmbH (Eds.) Switchgear Manual, 10th ed.; Asea Brown Boveri Pocket Book; Cornelsen: Berlin, Germany, 2001; ISBN 978-3-464-48236-0. [Google Scholar]
  37. Schneider Electric. Schneider Medium Voltage Technical Guide; Schneider Electric: Rueil-Malmaison, France, 2017. [Google Scholar]
  38. Xiaolei, L.; Kaichao, Y.; Pengqian, Y.; Xin, Z. Parametric Design Based on Inventor in the Application of Gas Insulated Switchgear. In Proceedings of the 2010 3rd International Conference on Information Management, Innovation Management and Industrial Engineering, Kunming, China, 26–28 November 2010; Volume 2, pp. 18–21. [Google Scholar]
  39. Proca, V.; Paduraru, N. Methods for non-conventional measuring sensor integration in the medium voltage electrical equipment. In Proceedings of the 2005 IEEE Russia Power Tech, St. Petersburg, Russia, 27–30 June 2005; pp. 1–6. [Google Scholar]
  40. Medium Voltage (MV) Indoor Current Sensors KECA 80 C104, KECA 80 C165. Available online: https://new.abb.com/medium-voltage/apparatus/instrument-transformers-and-sensors-id/products/sensors-new/indoor-current-sensors-keca-80-c104-keca-80-c165 (accessed on 21 April 2021).
  41. Medium Voltage (MV) Indoor Voltage Sensors KEVA B. Available online: https://new.abb.com/medium-voltage/apparatus/instrument-transformers-and-sensors-id/products/sensors-new/indoor-voltage-sensors-keva-b (accessed on 21 April 2021).
  42. MV Indoor Combined Sensors KEVCD. Available online: https://new.abb.com/medium-voltage/apparatus/instrument-transformers-and-sensors-id/products/sensors-new/indoor-combined-sensors-kevcd (accessed on 21 April 2021).
  43. Medium Voltage (MV) Indoor Supporting (Post) Current Transformer TPU. Available online: https://new.abb.com/medium-voltage/apparatus/instrument-transformers-and-sensors-id/products/indoor-current-transformers/support-(post)/indoor-supporting-current-transformer-tpu (accessed on 21 April 2021).
  44. Medium Voltage Indoor Voltage Transformer Single Ple with Fuse TJP. Available online: https://new.abb.com/medium-voltage/apparatus/instrument-transformers-and-sensors-id/products/iec-indoor-voltage-transformers/indoor-voltage-transformer-tjp (accessed on 21 April 2021).
  45. Stefanka, M.; Prokop, V.; Salge, G. Application of IEC 61850-9-2 in MV switchgear with sensors use. In Proceedings of the 22nd International Conference and Exhibition on Electricity Distribution (CIRED 2013), Stockholm, Sweden, 10–13 June 2013; p. 0103. [Google Scholar]
Figure 1. Simulation currents for each phase at: (a) 50 Hz; (b) 60 Hz.
Energies 14 07567 g001
Figure 2. Layout of: (a) Model 1; (b) Model 2.
Energies 14 07567 g002
Figure 3. Magnetic flux density at 60 Hz for: (a) Model 1; (b) Model 2.
Energies 14 07567 g003
Figure 4. Electromagnetic heating against the phase-to-phase distance at 60 Hz for: (a) Model 1; (b) Model 2.
Energies 14 07567 g004
Figure 5. Layout of: (a) Model 3; (b) Model 4.
Energies 14 07567 g005
Figure 6. Magnetic flux density for at 60 Hz for: (a) Model 3; (b) Model 4.
Energies 14 07567 g006
Figure 7. Electromagnetic heating against the phase-to-phase distance at 60 Hz for: (a) Model 3; (b) Model 4.
Energies 14 07567 g007
Figure 8. Electromagnetic heating against the distance between busbars of the same phase at 60 Hz for: (a) Model 3; (b) Model 4.
Energies 14 07567 g008
Figure 9. Electromagnetic heating against the distance between busbars of the same phase and phase-to-phase distance at 60 Hz for: (a) Model 3; (b) Model 4.
Energies 14 07567 g009
Figure 10. Layout of: (a) Model 5; (b) Model 6.
Energies 14 07567 g010
Figure 11. Magnetic flux density for at 60 Hz for: (a) Model 5; (b) Model 6.
Energies 14 07567 g011
Figure 12. Electromagnetic heating against the phase-to-phase distance at 60 Hz for: (a) Model 5; (b) Model 6.
Energies 14 07567 g012
Figure 13. Electromagnetic losses on all models at 60 Hz.
Energies 14 07567 g013
Figure 14. Electrodynamic forces on model 2 at 60 Hz: (a) in x direction; (b) in y direction.
Energies 14 07567 g014
Figure 15. Electrodynamic forces on model 6 at 60 Hz: (a) in x direction; (b) in y direction.
Energies 14 07567 g015
Figure 16. Proposed and existing design comparison: (a) footprint (b) sideview.
Energies 14 07567 g016
Figure 17. Comparison of the existing and proposed busbar systems.
Energies 14 07567 g017
Figure 18. Criteria panel for model 6.
Energies 14 07567 g018
Figure 19. Criteria panel for all models.
Energies 14 07567 g019
Table 1. Three-phase short-circuit current parameters.
Ik (kA)f (Hz)ip (kA)kR/XTa (s)α (rad)
31.560821.84070.059130.044861.5117
31.550791.77330.087690.036291.4833
Table 2. Analyzed cruise ships with installed equipment.
Vessel NameGenerator ModelInstalled Power (kW)Total Installed Power (MW)
Symphony of the seas12V46F4 × 14,40096
16V46F2 × 19,200
Oasis of the seas12V463 × 12,60084
16V463 × 16,800
Harmony of the seas12V46F4 × 14,40096
16V46F2 × 19,200
Table 3. Busbar dimensions.
ProfileDimensionsNo. of Conductors
RectangularWidth: 60 mm2
Thickness: 10 mm
RectangularWidth: 120 mm1
Thickness: 10 mm
CircularInner radius: 23.5 mm1
Outer radius: 31.5 mm
Table 4. Simulation properties for singular busbar system.
ParameterValueUnit
Busbar dimension A10mm
Busbar dimension B120mm
Phase-to-phase distance d160mm
Rated current I1600A
Frequency50/60Hz
Table 5. Electromagnetic heating (losses) for singular busbar system.
Value (W/m)
Model 1At 50 Hz68,334
At 60 Hz70,780
Model 2At 50 Hz67,991
At 60 Hz70,402
Table 6. Simulation properties for double busbar system.
ParameterValueUnit
Busbar dimension A10mm
Busbar dimension B60mm
Phase-to-phase distance d160mm
Distance between busbars of same phase dss5mm
Rated current I1600A
Frequency50/60Hz
Table 7. Electromagnetic heating (losses) for double busbar system.
--Value (W/m)
Model 3At 50 Hz71,415
At 60 Hz75,483
Model 4At 50 Hz71,297
At 60 Hz75,350
Table 8. Simulation properties for circular busbar system.
ParameterValueUnit
Outer busbar radius31.5mm
Inner busbar radius23.5mm
Phase-to-phase distance160mm
Rated current I1600A
Frequency50/60Hz
Table 9. Electromagnetic heating (losses) for circular busbar system.
--Value (W/m)
Model 5At 50 Hz49,686
At 60 Hz50,625
Model 6At 50 Hz49,501
At 60 Hz50,427
Table 10. Maximal absolute value of electrodynamic forces per phase at 60 Hz.
x Directiony Direction
Model 2Phase A5442.833 N/m2179.174 N/m
Phase B4782.865 N/m1384.546 N/m
Phase C1762.756 N/m2327.201 N/m
Model 6Phase A4392.885 N/m1654.191 N/m
Phase B3701.594 N/m1326.055 N/m
Phase C1700.34 N/m1982.404 N/m
Table 11. Data for conduction of numerical experiments.
ConfigurationsVolume (m3)Weight (kg)EM Losses at 50 Hz (W/m)EM Losses at 60 Hz (W/m)Total EM Losses at 50 Hz (W)Total EM Losses at 60 Hz (W)
Model 10.763385.268.33470.7802460.0242548.08
Model 20.864385.267.99170.4022447.6762534.472
Model 31.175383.7671.41575.4835141.885434.776
Model 41.4112383.7671.29775.3505133.3845425.2
Model 50.605442.849.68650.6251788.6961822.5
Model 60.765442.849.50150.4271782.0361815.372
Existing model 1-1091.441.53943.9764236.9784485.552
Existing model 2-770.442.48645.1123058.9923248.064
Parameters
Objectiveminminminminminmin
Weight111111
Preference functionUsualUsualUsualUsualUsualUsual
Table 12. MCDM results.
RankModelPhiPhi+Phi−
1Model 60.47620.69050.2143
2Model 50.35710.64290.2857
3Model 20.11900.52380.4048
4Existing model 20.07140.45240.3810
5Existing model 10.02380.42860.4048
6Model 10.00000.45240.4524
7Model 4−0.45240.23810.6905
8Model 3−0.59520.16670.7619
Table 13. IT and sensor weight and volume comparison.
Weight (kg)DifferenceVolume (m3)Difference
Current sensor0.6524.35–30.350.0012380.009762
Current IT25–310.011
Voltage sensor1.9622.040.001330.02167
Voltage IT240.023
Combined sensor2029–350.0130.021
Table 14. Overall switchboard improvements.
Sensors/ITs Weight (kg)Sensors/ITs Volume (m3)IT/Sensor Energy ConsumptionEM Losses at Total Length (W)Total EM Losses in 30 Years (MWh)Main Busbars Weight (kg)Footprint
(m2)
Length
(mm)
Volume
(m3)
Existing solution1638–19620.87100%4485.5521178.81091.431.4118,00072.864
Configuration 158.620.0821815.372477.08442.818.912,60041.58
Configuration 2267.30.208
Improvements configuration 196.42–97%90.57%59.53%59.53%59.43%39.83%30%42.93%
Improvements configuration 283.68–86.37%76.1%
Publisher’s Note: MDPI stays neutral with regard to jurisdictional claims in published maps and institutional affiliations.

