Article

3D CFD Simulation of Phase Resonance in a Pump Turbine with an Acoustic Model

1
Department of Mechanical and Power Engineering, Jingjiang College, Jiangsu University, Zhenjiang 212028, China
2
National Research Center of Pumps, Jiangsu University, Zhenjiang 212013, China
3
National Quality Inspection Center for Pump Products (Zhejiang), Wenling 317599, China
4
Dongfang Electric Machinery Co., Ltd., Deyang 618000, China
*
Author to whom correspondence should be addressed.
Energies 2021, 14(22), 7539; https://doi.org/10.3390/en14227539
Submission received: 27 September 2021 / Revised: 25 October 2021 / Accepted: 1 November 2021 / Published: 11 November 2021
(This article belongs to the Special Issue Advances in Pumped Storage Hydraulic System)

Abstract

:
In order to understand the complex nature of the system dynamic phenomena, such as the strong vibration and noise caused by blade passage in the pump turbine, a state-of-the-art three-dimensional (3D) compressible transient simulation would be desirable to study the problem in depth. This study investigated the phase resonance (PR) that occurred during a full-load operation in the turbine mode of a pump turbine on a prototype scale. As a first step, the wave reflection at the boundaries, and the influence of the timestep and sound speeds on the behavior of traveling pressure waves inside a spiral casing, were studied. It was found that nonreflective boundary conditions and an appropriately small timestep are critical to capturing the wave reflection and superposition process inside a spiral casing; a certain kind of direct PR risk was detected in its system design. The detected direct PR differed from the well-known PR with two features: firstly, it was almost independent of the sound speeds, and secondly, the pressure distribution over the spiral circumference varied among the amplitudes. The latter feature was caused by pressure waves at every stator channel induced by a rotor stator interaction (RSI). The 3D flow simulation with an acoustic model, which couples the RSI and PR phenomena, would predict better results for understanding the problem than the simplified one-dimensional (1D) method.

1. Introduction

Reversible pump turbines have been widely applied in the design and construction of pumped storage projects. In a few recently commissioned projects, strong vibrations and noise have been observed and drew the intense attention of China’s hydraulic communities. The vibration and noise problems are of a very complex nature, with several internal mechanisms such as a rotor stator interaction (RSI), phase resonance (PR) and processing vortex rope (PVR) involved, thus, are very challenging to understand and diagnose.
In the study of these mechanisms, several methods have been proposed and developed by various researchers. Nicolet proposed a one-dimensional (1D) hydroacoustic model based on the matrix transfer method developed by Haban et al. [1] and conducted a modeling of RSI for a Francis pump turbine on the model scale with a configuration of nine blades and 20 guide vanes [2]. Zobeiri conducted three-dimensional (3D) incompressible transient flow numerical simulations of RSI and PVR for a similar pump turbine configuration on the model scale [3]. Yan and Koutnik developed a partial 3D compressible simulation method to study RSI in pump turbines [4]. As explained by Yan and Koutnik [4], water compressibility does not play an important role and may therefore be neglected for many standard CFD applications, but in pump turbines, the acoustic wavelength in water may be in the range of the prototype component dimensions, and thus, it is important to consider the compressibility effects on the pressure fluctuations induced by RSI in hydraulic machinery. Zhang and Cheng proposed a method coupling the 1D pipeline MOC (Method of Characteristics) equations with a 3D pump turbine CFD model for the whole flow passage of the powerplant to study the S-shape characteristic during the load rejection operation [5]. Li and Wang conducted hydraulic loss analysis based on the entropy production theory for a pump turbine model with a focus on the pump hump zone [6]. Their research has proven the capability of numerical simulation in predicting the dynamic phenomenon of RSI. Generally speaking, the 3D CFD simulation with an acoustic model should predict better results than the 1D method and the incompressible CFD simulations, but the computation efforts would be higher.
The third mechanism PR was first studied by Chen on the oscillations of water pressure in a spiral casing for storage pumps [7]. Consequently, Doerfler investigated its role in vibrations caused by blade passage in radial hydraulic turbomachines with an analytic mathematic model proposed [8], but Doerfler’s model neglected the wave reflectiveness at the spiral casing end. Tanaka’s group studied the RSI and PR for very long time. For instance, Tanaka and Tsujimoto studied the PR experimentally in a centrifugal fan [9] and confirmed that there was wave reflection at the narrow end of the spiral casing, which was continued by Nishiyama and Suzuki through the one-dimensional theory of phase resonance and compressible CFD simulations [10]. Yuan and Fang published a review on the vibration problems of power units of commissioned pumped storage projects in China from one pump turbine with strong vibration and noise problems observed [11] in an attempt to study these phenomena. Based on the field measurements of the internal pressure fluctuations, Fang and Yuan further performed an evaluation of the hydraulic resonance in the turbine operation mode for a medium-head pump turbine [12].
RSI has already gained intensive attention from China’s hydraulic communities. For example, a considerable gap between the rotating impeller leading edge and the stationary trailing edge of guide vanes has been reserved in the hydraulic design, which will be used for study in this paper. However, the PR has not been well-understood and accepted so far. In 2015, Fang and Zhang translated Doerfler’s book on flow-induced pulsation and vibration in hydroelectric machinery published in 2013 [13] into Chinese, which drew the attention of one client and a unit supplier of the project with strong vibrations and noises observed at a turbine full load operation. Therefore, we were given the opportunity to conduct incompressible and compressible simulations to investigate the internal mechanisms of PR in depth.

2. Simulation Configuration

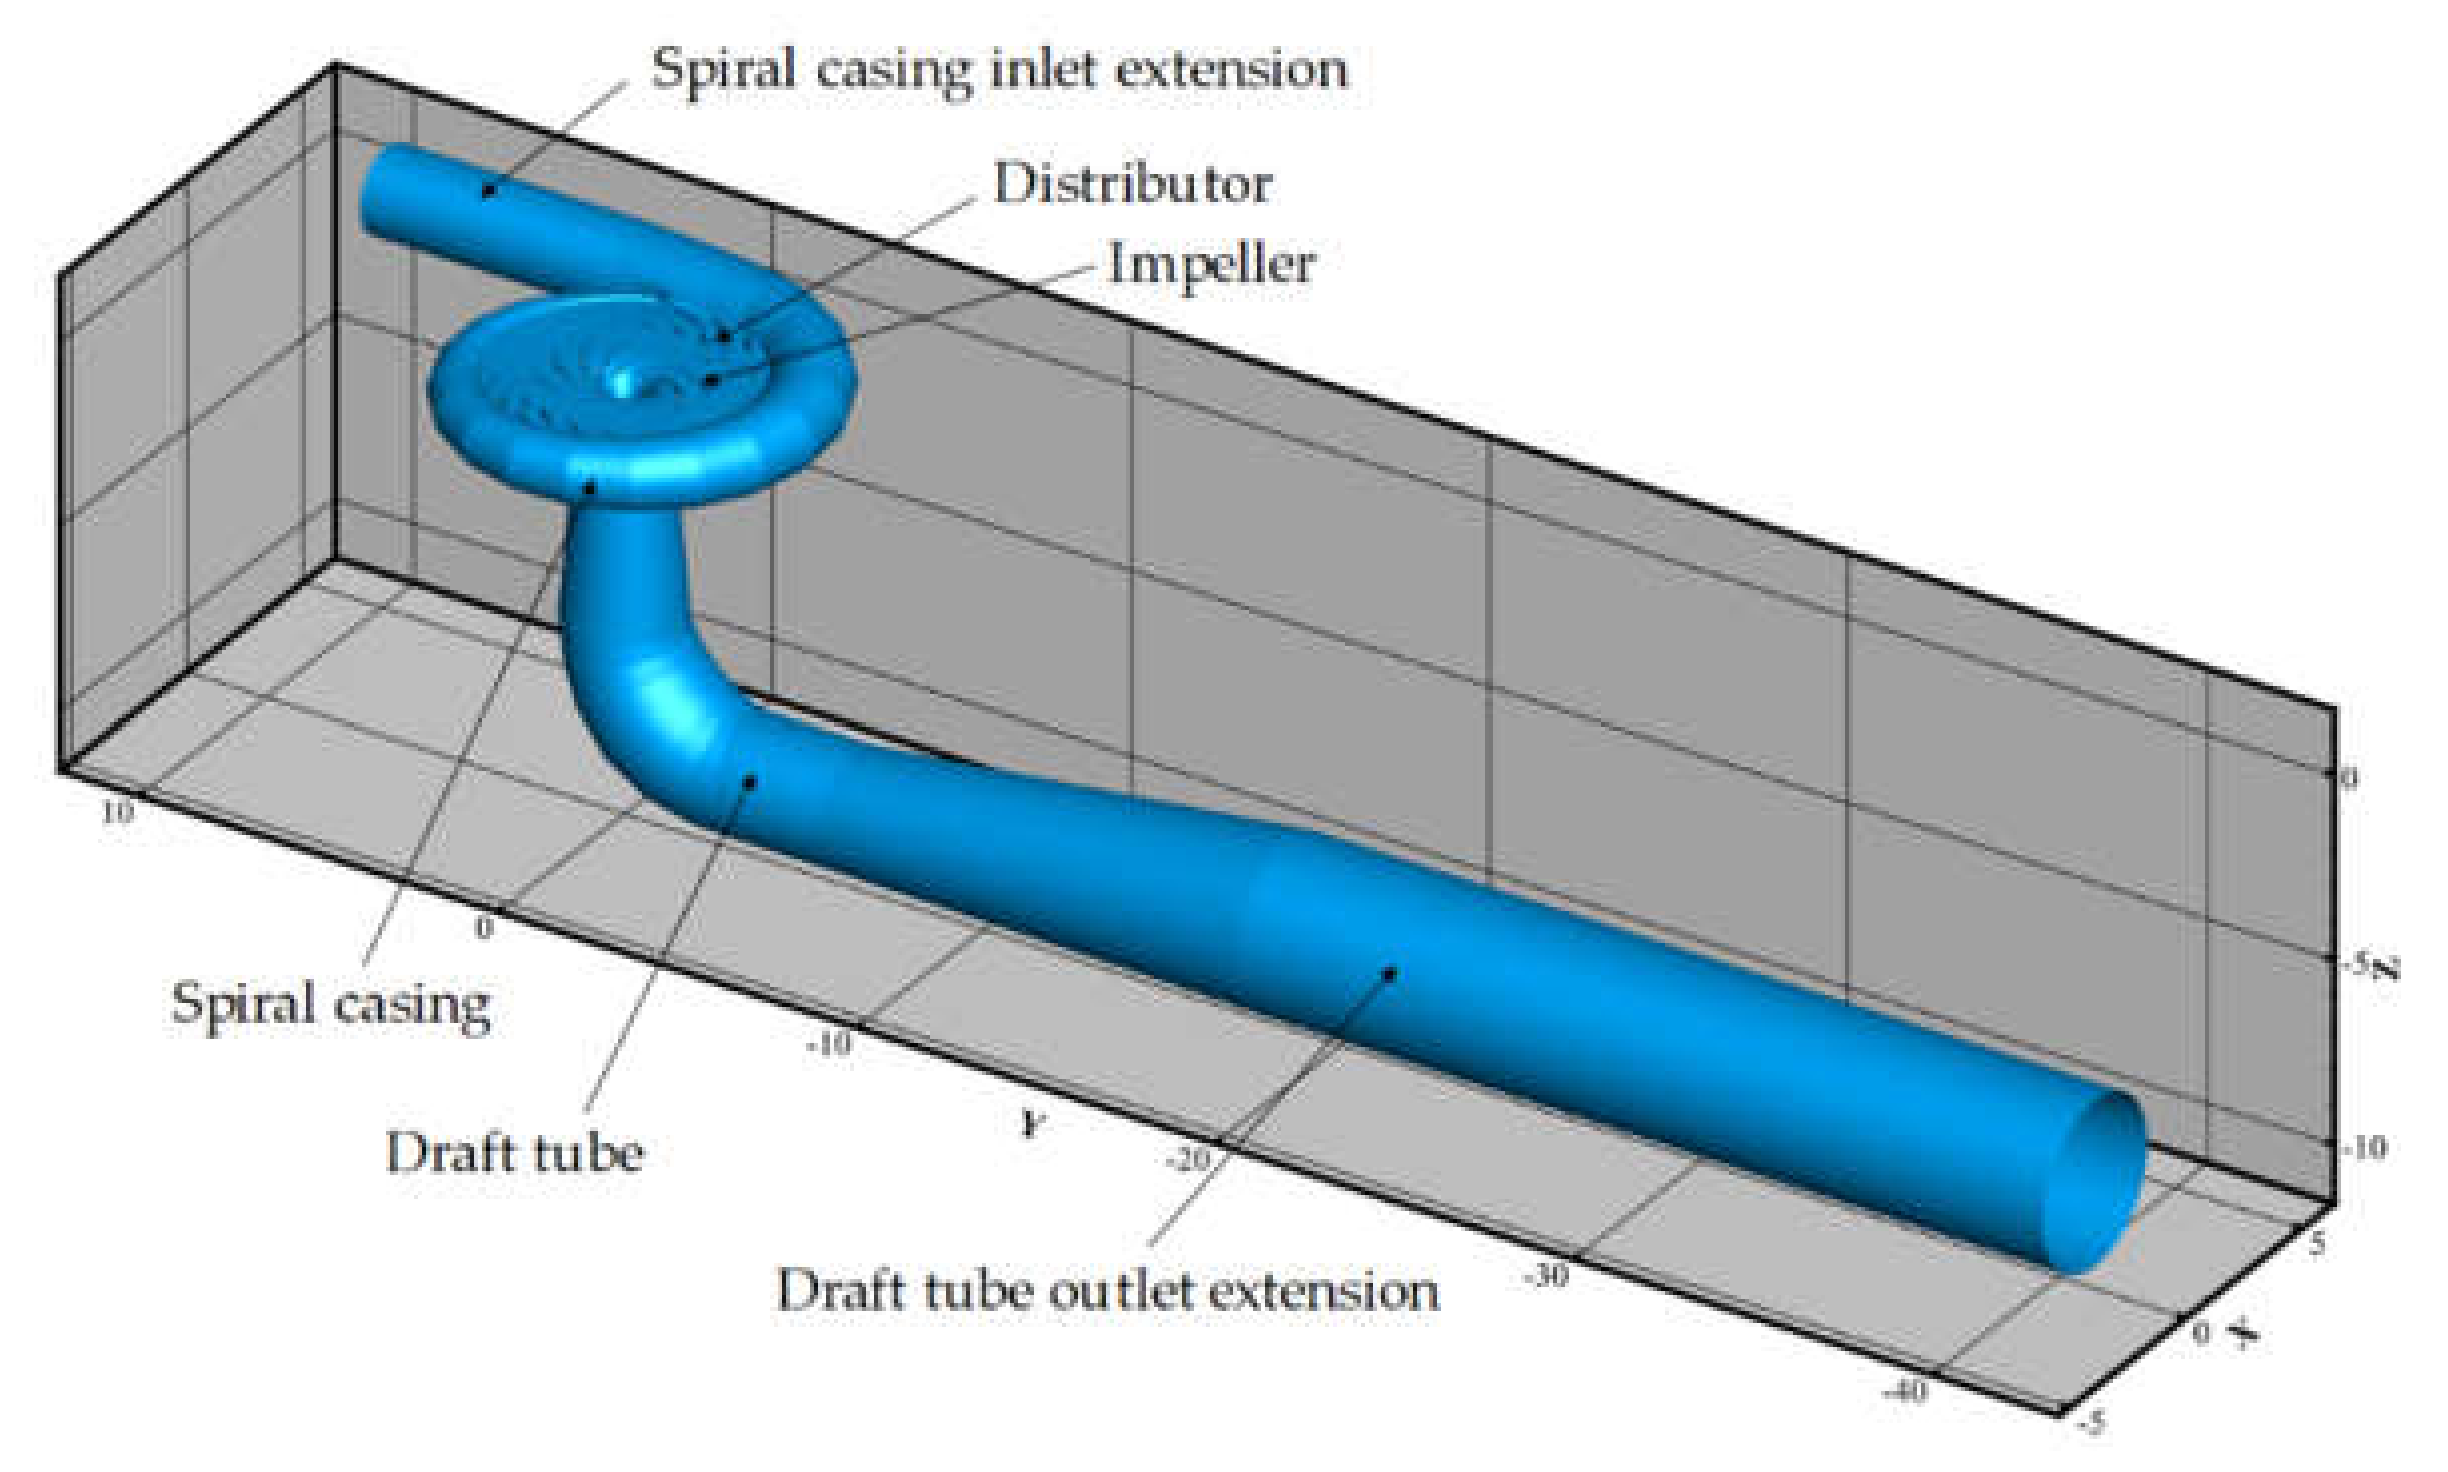
2.1. Computational Domain and Mesh

The computational domain corresponds to the full water passage of the pump turbine on a prototype scale, which consists of spiral casing inlet extension, spiral casing, stay vanes, guide vanes, impeller, draft tube and draft tube outlet extension (Figure 1). The basic parameters of the project and geometry are listed in Table 1. The guide vanes were set to the rated guide vane opening as indicated in Table 1.
A set of completely block-structured hexahedral meshes were applied to the whole computation domain. The inlet pipe and spiral casing, stay vane and draft tube were meshed, respectively, with ANSYS-ICEM as a whole. The mesh for the stay vane was generated with a topology similar to that for the guide vanes in ANSYS-TurboGrid. The meshes for the guide vanes and impeller were generated with ANSYS-TurboGrid and assembled as a whole. The previously mentioned components were connected together through the interfaces. Figure 2a,b shows the general view of the meshes, particularly for the distributor channels and impeller, respectively. A mesh convergence test was conducted, and it was found that the total amount of nodes of the final whole mesh was 11,437,464 due to the limit of the affordable computing source. The mesh statistics for each component are summarized in Table 2.

2.2. Compressibility Function

The hydraulic compressibility was introduced through a custom-defined expression in CFX as follows [4]:
ρ = ρ 0 + p p 0 / a 0 2
where the subscript 0 denotes a reference quantity, ρ is the density and p is the pressure. The sound speed a0 is assumed to be constant. Therefore, the influence of the compressibility effects can be investigated using different speeds of sound. In the present study, a0 was varied from 1082 m/s to 1450 m/s in order for a comparison analysis.

2.3. Boundary Conditions and Solver Control

The constant mass inflow and outlet pressure indicated in Table 1 were applied at the spiral case inlet and draft tube outlet, respectively. For the inlet and outlet boundary conditions, the option “nonreflective” was enabled in the acoustic reflectivity. To simulate wave propagation inside the system, the acoustic reflectivity at the boundaries played an important role in the results. Tanaka and Tsujimoto’s experiments in a centrifugal fan compared the results with and without a silencer at the model outlet and confirmed the existence of the reflection of waves at the boundary that should not be neglected [9].
Initially, the sound speed was assumed to be 1200 m/s, and the density of the water was defined by Equation (1). The high-resolution advection scheme of CFX, the second-order backward Euler method for time integration and the shear stress transport (SST) turbulence model with automatic wall functions were used. The root mean square (RMS) residual target was set to 1 × 10⁻⁴ for the convergence criteria. For unsteady simulations, the steady-state solution was taken as the initial condition. Figure 3 shows the contour of the absolute pressure at the centerline elevation at the end of the steady simulation for a0 = 1200 m/s. The computed physical time was 3.0 s, corresponding to 28.6 impeller revolutions. Several constant timestep Δt, including 1/20 of the blade passage time (bpt), 1/24 bpt, 1/32 bpt and 1/40 bpt, were tested first to find the appropriate value. For the domain interfaces between the guide vanes and impeller and that between the impeller and draft tube, the frozen rotor model and transient rotor stator model were adopted for the steady and transient simulations, respectively.

2.4. Simulated Load Case

As introduced in Section 2.1, the current study focuses on the unsteady characteristics of the pressure when the machine is under full load operation in the turbine mode—namely, at the rated discharge under the rated head, as indicated in Table 1. The steady characteristics were checked during the simulations but were not the focus of the current study. It should be noted that the simulated full load operating point in terms of the unit discharge Q1rat was about 45% more than the turbine best efficiency point (Q1BEP = 0.55 m3/s) [14].

2.5. Monitoring Points

In order to study the behavior of the pressure waves caused by blade passage inside the stationary components, 110 points in total, as shown in Figure 4a, were set to monitor the absolute pressure and density in the stationary components, such as spiral casing, distributor channels and draft tube. In spiral casing, the monitoring points were located along the centerline, starting from the end of the spiral casing (marked with SP00) and ending at the inlet of the spiral casing (marked with SP21). The accumulated length between monitoring points SP00 and SP21, which represent the circumferential length of the spiral casing for the geometry under investigation, was equal to 25.2 m. In the distributor channels, there were 4 sets of monitoring points located at its 4 quadrants (indicated with “E”,” N”, “W” and “S”, respectively) and starting from the impeller leading edge (marked with VL_*01) up to the inlet of the stay vanes (marked with VL_*14); see Figure 4b for the monitoring points located inside the distributor channel close to the nose vane. Except for the monitor location control of VL_*01, VL_*02 and VL_*03, which were inside the impeller rotating domain with the local frame type, all the other monitoring points were inside the stationary domain without specification of the monitor location control. Inside the draft tube, there were also 4 sets of monitoring points, where “I” indicated at the inner side of the elbow, “O” indicated the outer side, “L” indicated the left side and “R” indicated the right side. These 4 sets of points were all located at the wall along the centerline at 6 typical sections; among which, Section 4 was in the middle of the elbow with an angle of 45° against the horizontal line.

3. Simulation Results

In this section, all the pressure is presented with the dimensionless pressure coefficient. The pressure coefficient fluctuation is defined as below:
p = p p ¯ / 1 2 ρ U 2
where p denotes the transient pressure, p ¯ is the average pressure and U = ω r the blade peripheral velocity at its maximum radius r = 2.05 m, which equals 94.5 m/s in the current case.
The frequency of interest for the project under investigation was 128.6 Hz, which was equal to two times the blade passing frequency (BPF) observed from the prototype operation. The ratio of the circumferential length Lsp of the spiral casing to the corresponding wave length was checked first in order to define a range of sound speeds for the study, which are presented in Table 3.

3.1. Appropriate Timestep Δt to Capture the PR Phenomenon Inside the Spiral Casing

The pump turbine is equipped with stator vanes and guide vanes. In this case, the disturbances caused by runner blade passage at the individual distributor channels interfered with each other in the spiral case. This is a complex wave reflection and superposition process, and thus, it is not easy to capture with a large timestep Δt. In our study, a large amount of time was spent on the simulation with Δt = 1/20 bpt (or 0.0007777 s) at the beginning. However, later, we found that this timestep Δt was too coarse and not suitable to capture such complex processes.
If we consider a simple wave function of y = sin(x), for example, Δt = 1/20 bpt would correspond to the 10 segments marked with a square in Figure 5. Obviously, Δt = 1/20 was too large to account for the wave superposition process; thus, a higher time resolution with a smaller timestep was required for the simulation. In this section, various timesteps Δt that correspond to 10 segments, 12 segments, 16 segments and 20 segments are studied for the same constant sound speed of a0 = 1200 m/s, and results are compared in order to find a suitable value of Δt to capture the PR phenomenon inside the spiral casing.
Figure 6 presents the results of pressure waves within a period of one blade passage inside the spiral casing due to PR simulated with four different timesteps for the case of a0 = 1200 m/s. As explained before, the results for Δt = 1/20 and 1/24 bpt showed lower resolutions, and those for Δt = 1/32 and 1/40 bpt showed higher resolutions. Figure 7 presents a comparison of the amplitudes at 2BPF for Δt = 1/20 and 1/40 bpt obtained from the FFT analysis, from which it can be seen that the simulation with a smaller timestep of Δt = 1/40 bpt produced higher amplitudes around the circumferential direction of the spiral casing than that with a larger timestep of Δt = 1/20 bpt. Therefore, to capture the PR phenomenon inside the spiral casing due to blade passage, Δt = 1/32 or 1/40 bpt are recommended as the appropriate timestep.

3.2. The influence of the Sound Speed a0

In principle, there is uncertainty for the sound speed, especially for different prototype operations. In our study, the sound speed was first assumed to be 1200 m/s, and then, a range of ±10% and a0 = 1450 m/s were simulated to check its influence on the PR concerned.
Figure 8 presents the results of the pressure waves within a period of one blade passage inside the spiral casing due to PR simulated with (a) a 10% lower sound speed (a0 = 1082 m/s) and (b) a 10% higher sound speed (a0 = 1320 m/s). A higher sound speed leads to a smaller ratio Lsp/(2λ) of the characteristic length of the spiral casing Lsp to two times the wave length of interest. According to Table 3, the ratio Lsp/(2λ) was reduced from 1.5 to 1.2 when the sound speed a0 was increased from 1082 m/s to 1320 m/s. In one attempt, the sound speed was further increased up to 1450 m/s, at which the Lsp/(2λ) = 1.1, and 1650 m/s, at which the Lsp/(2λ) = 1.0. The simulation for a0 = 1450 m/s was successful but failed for the a0 =1650 m/s case due to an unrealistic pressure behavior observed. In fact, the limit of the speed of sound in water was 1482 m/s at 20 °C, with a bulk modulus of 2.2 × 10 9 N/m2. The case a0 = 1450 m/s was close to such a limit, but a0 = 1650 m/s exceeded the limit; thus, the pressure–density function could not behave properly, resulting in the failure of the simulation. Figure 9 presents the traveling pressure waves inside the spiral casing simulated with a0 = 1450 m/s.
The following is an attempt to explain the phase resonance according to the theory and the comment by Doerfler [8]. In the case of direct phase resonance, the amplitudes along the spiral case would increase if the cross-section of the casing is constant. If the cross-section increases from the nose vane to the spiral intake in a proportional manner, then, in the case of direct phase resonance, the amplitude would be about constant over the spiral circumference, because the increase in the cross-section would just be compensated by the addition of new primary waves. It was also partially inspired by his comment that smaller timestep should be checked first and a wide range of sound speeds simulated to check the influence of the sound speed.
Figure 10a presents a detailed comparison of the dimensionless pressure amplitudes at 2BPF for different sound speeds. Taking the initial phase of the pressure signal at 2BPF monitored at the spiral casing end as zero, Figure 10b presents the comparison of the initial phase of the pressure signals at 2BPF at all the monitors in the spiral casing under different sound speeds. The following findings could be observed:
(1)
By comparing a0 = 1082 m/s in Figure 8a with a0 = 1200 m/s in Figure 6d, it can be found that reducing the sound speed a0 leads to higher amplitudes somewhere inside the spiral but typically at its end due to more wave superposition and reflection processes under a larger ratio of Lsp/(2λ).
(2)
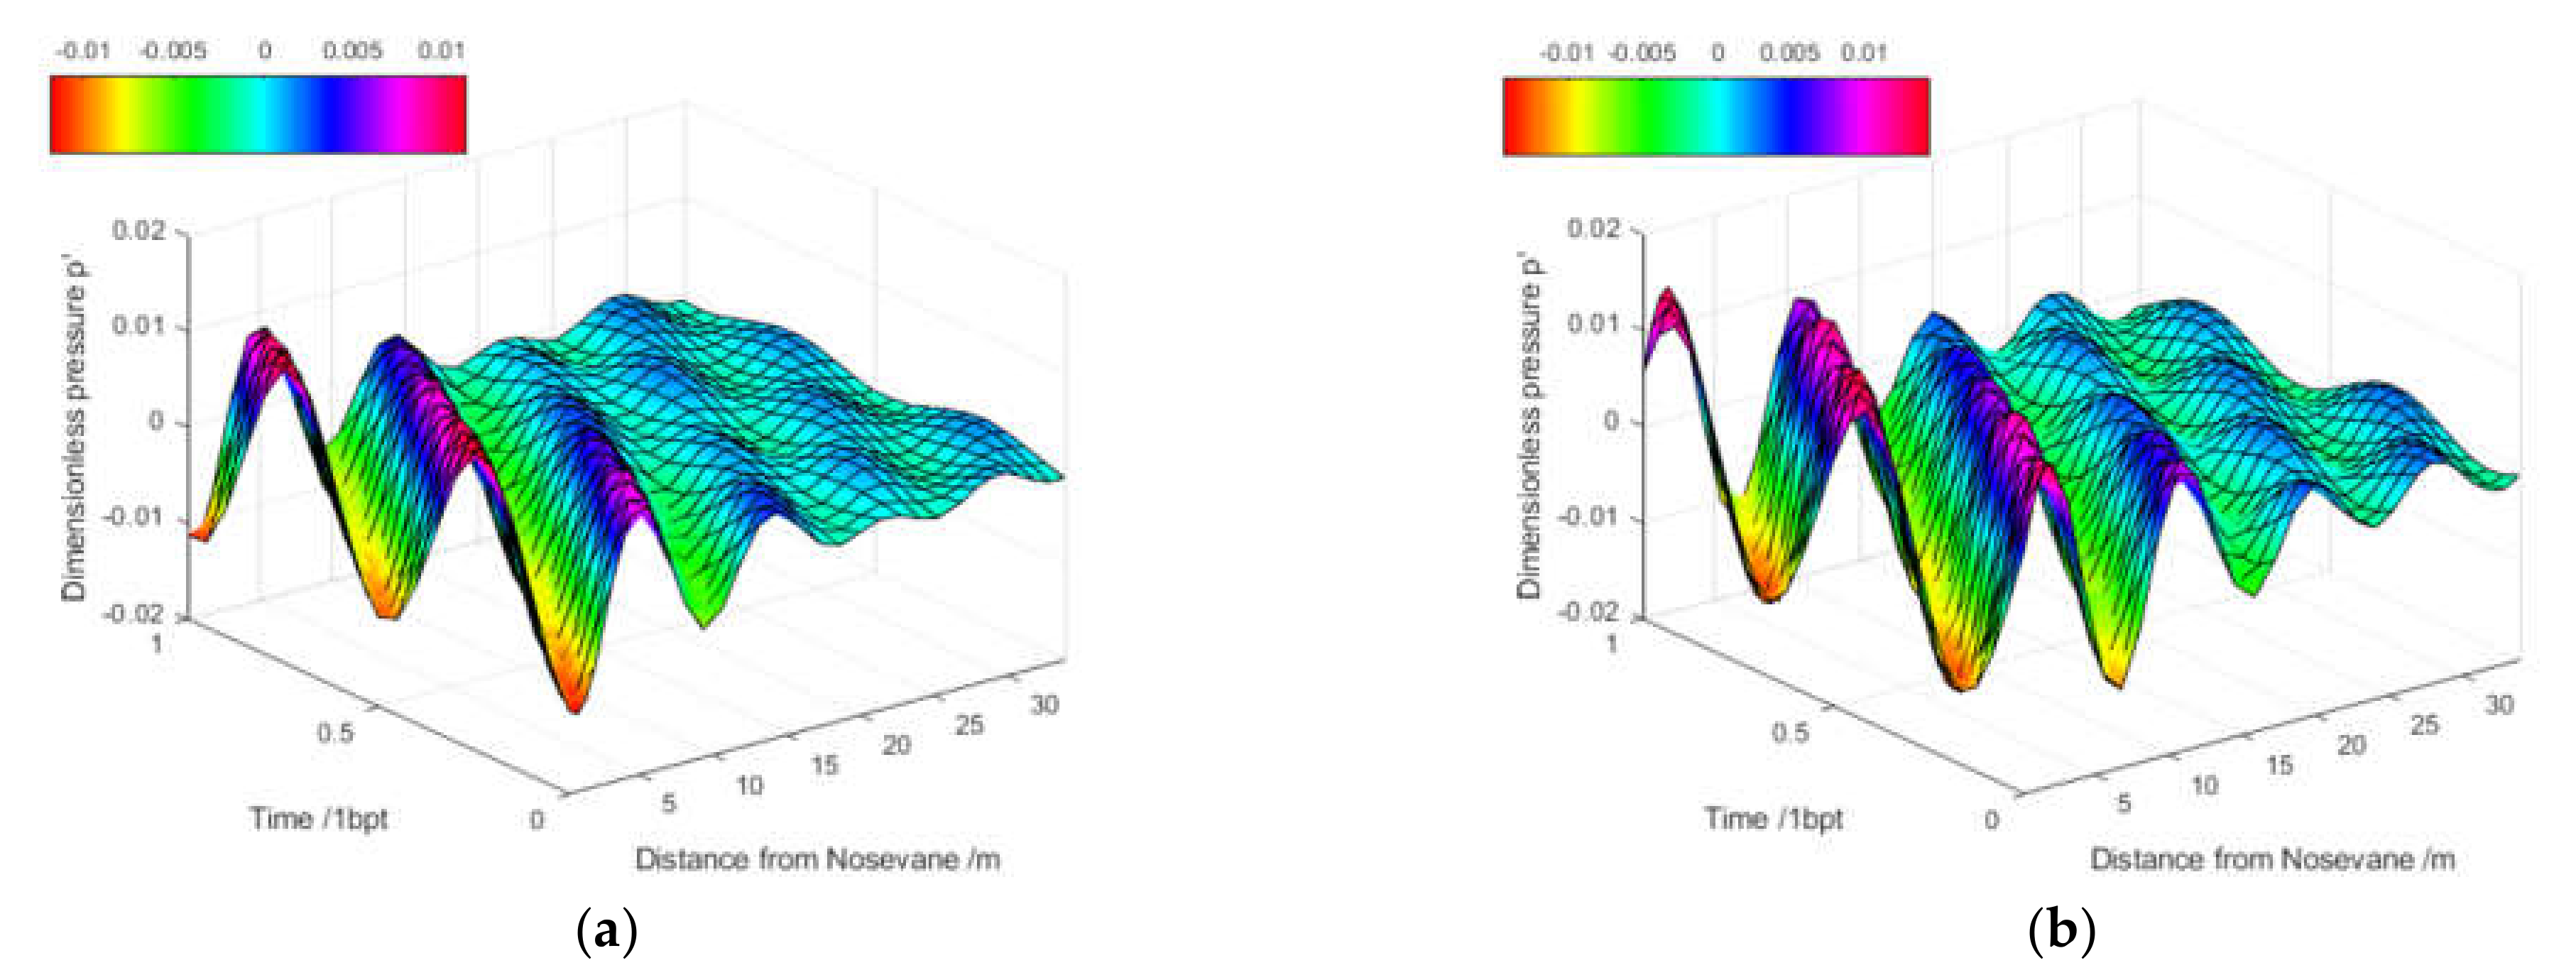
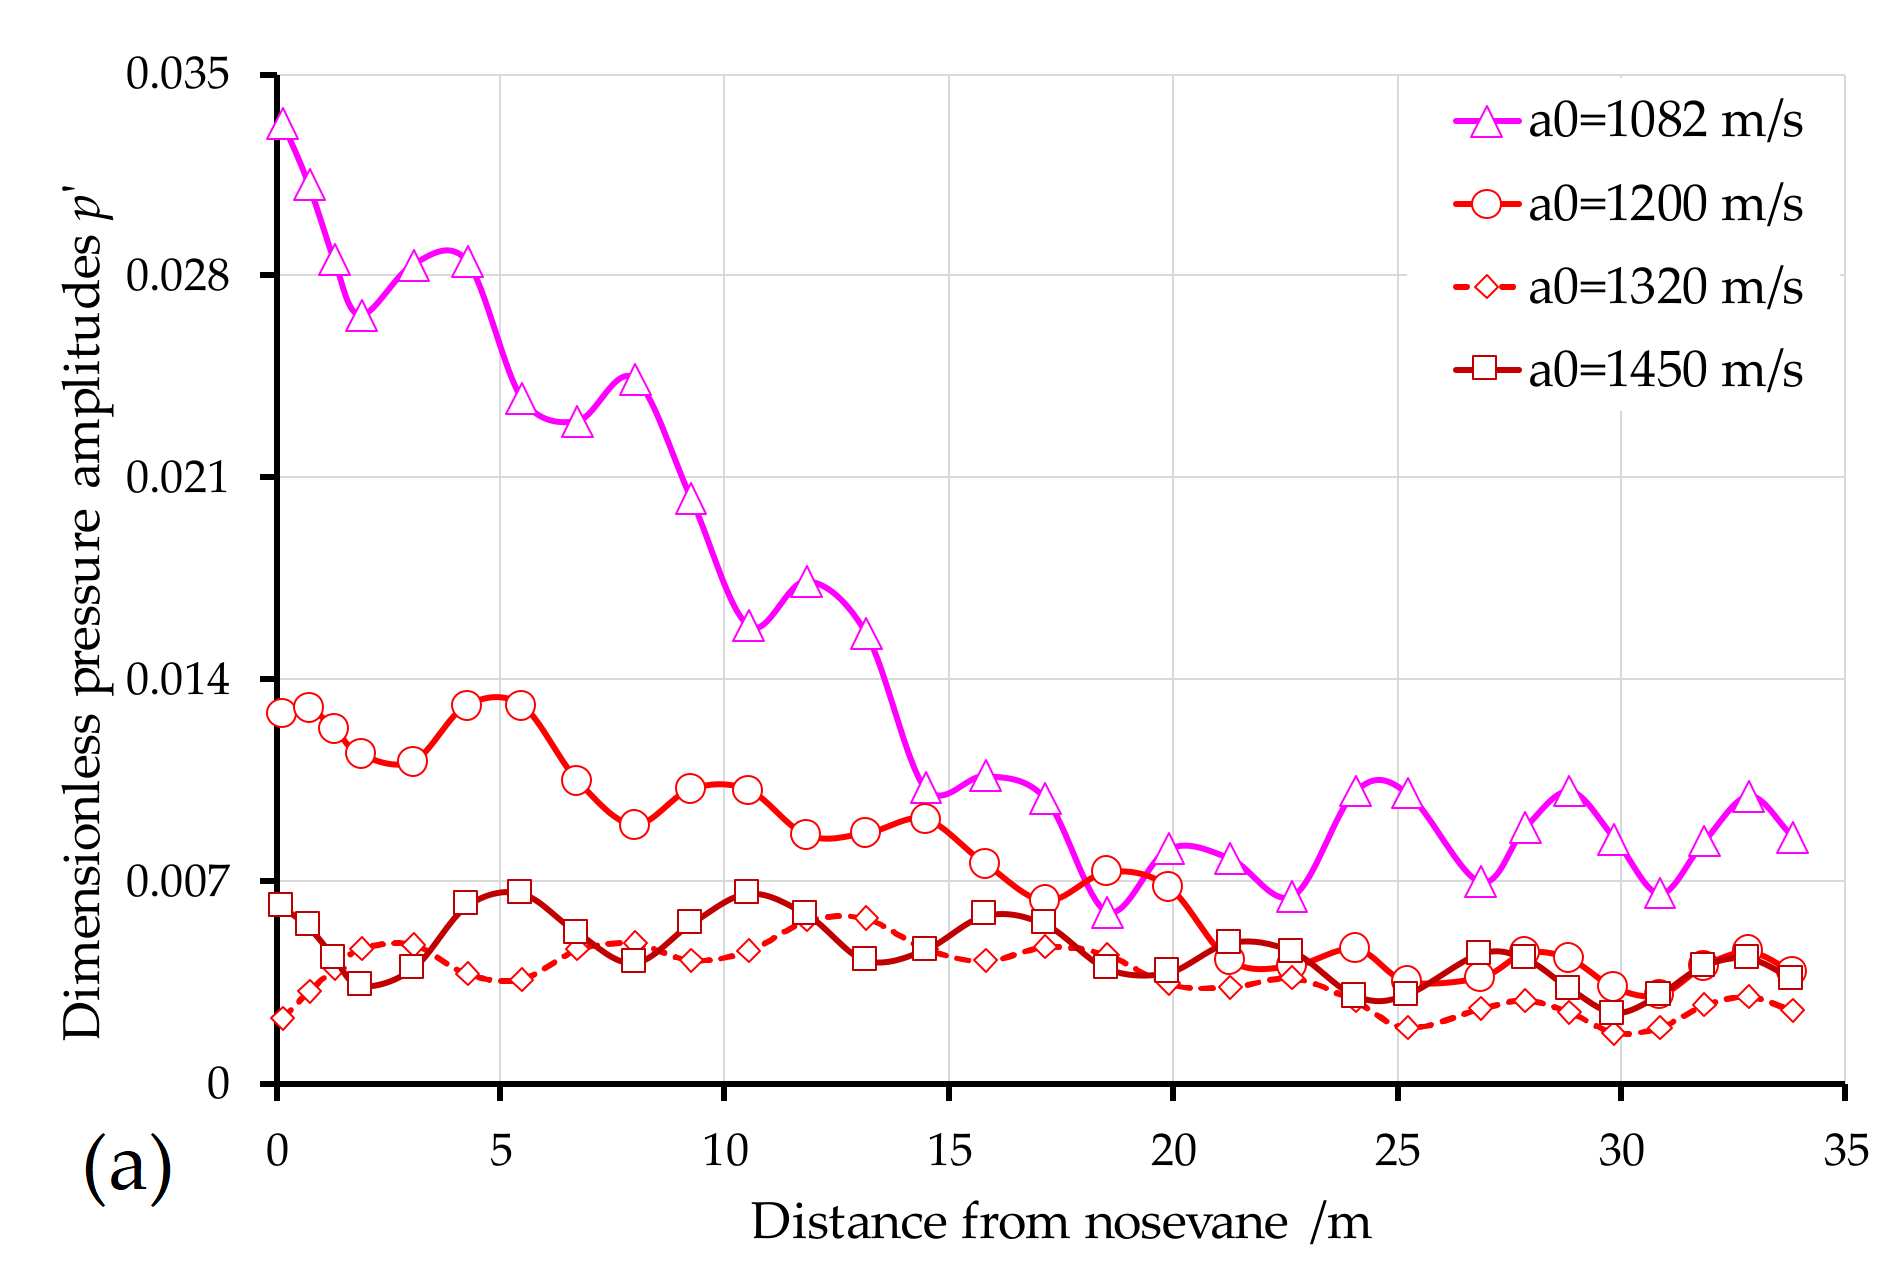
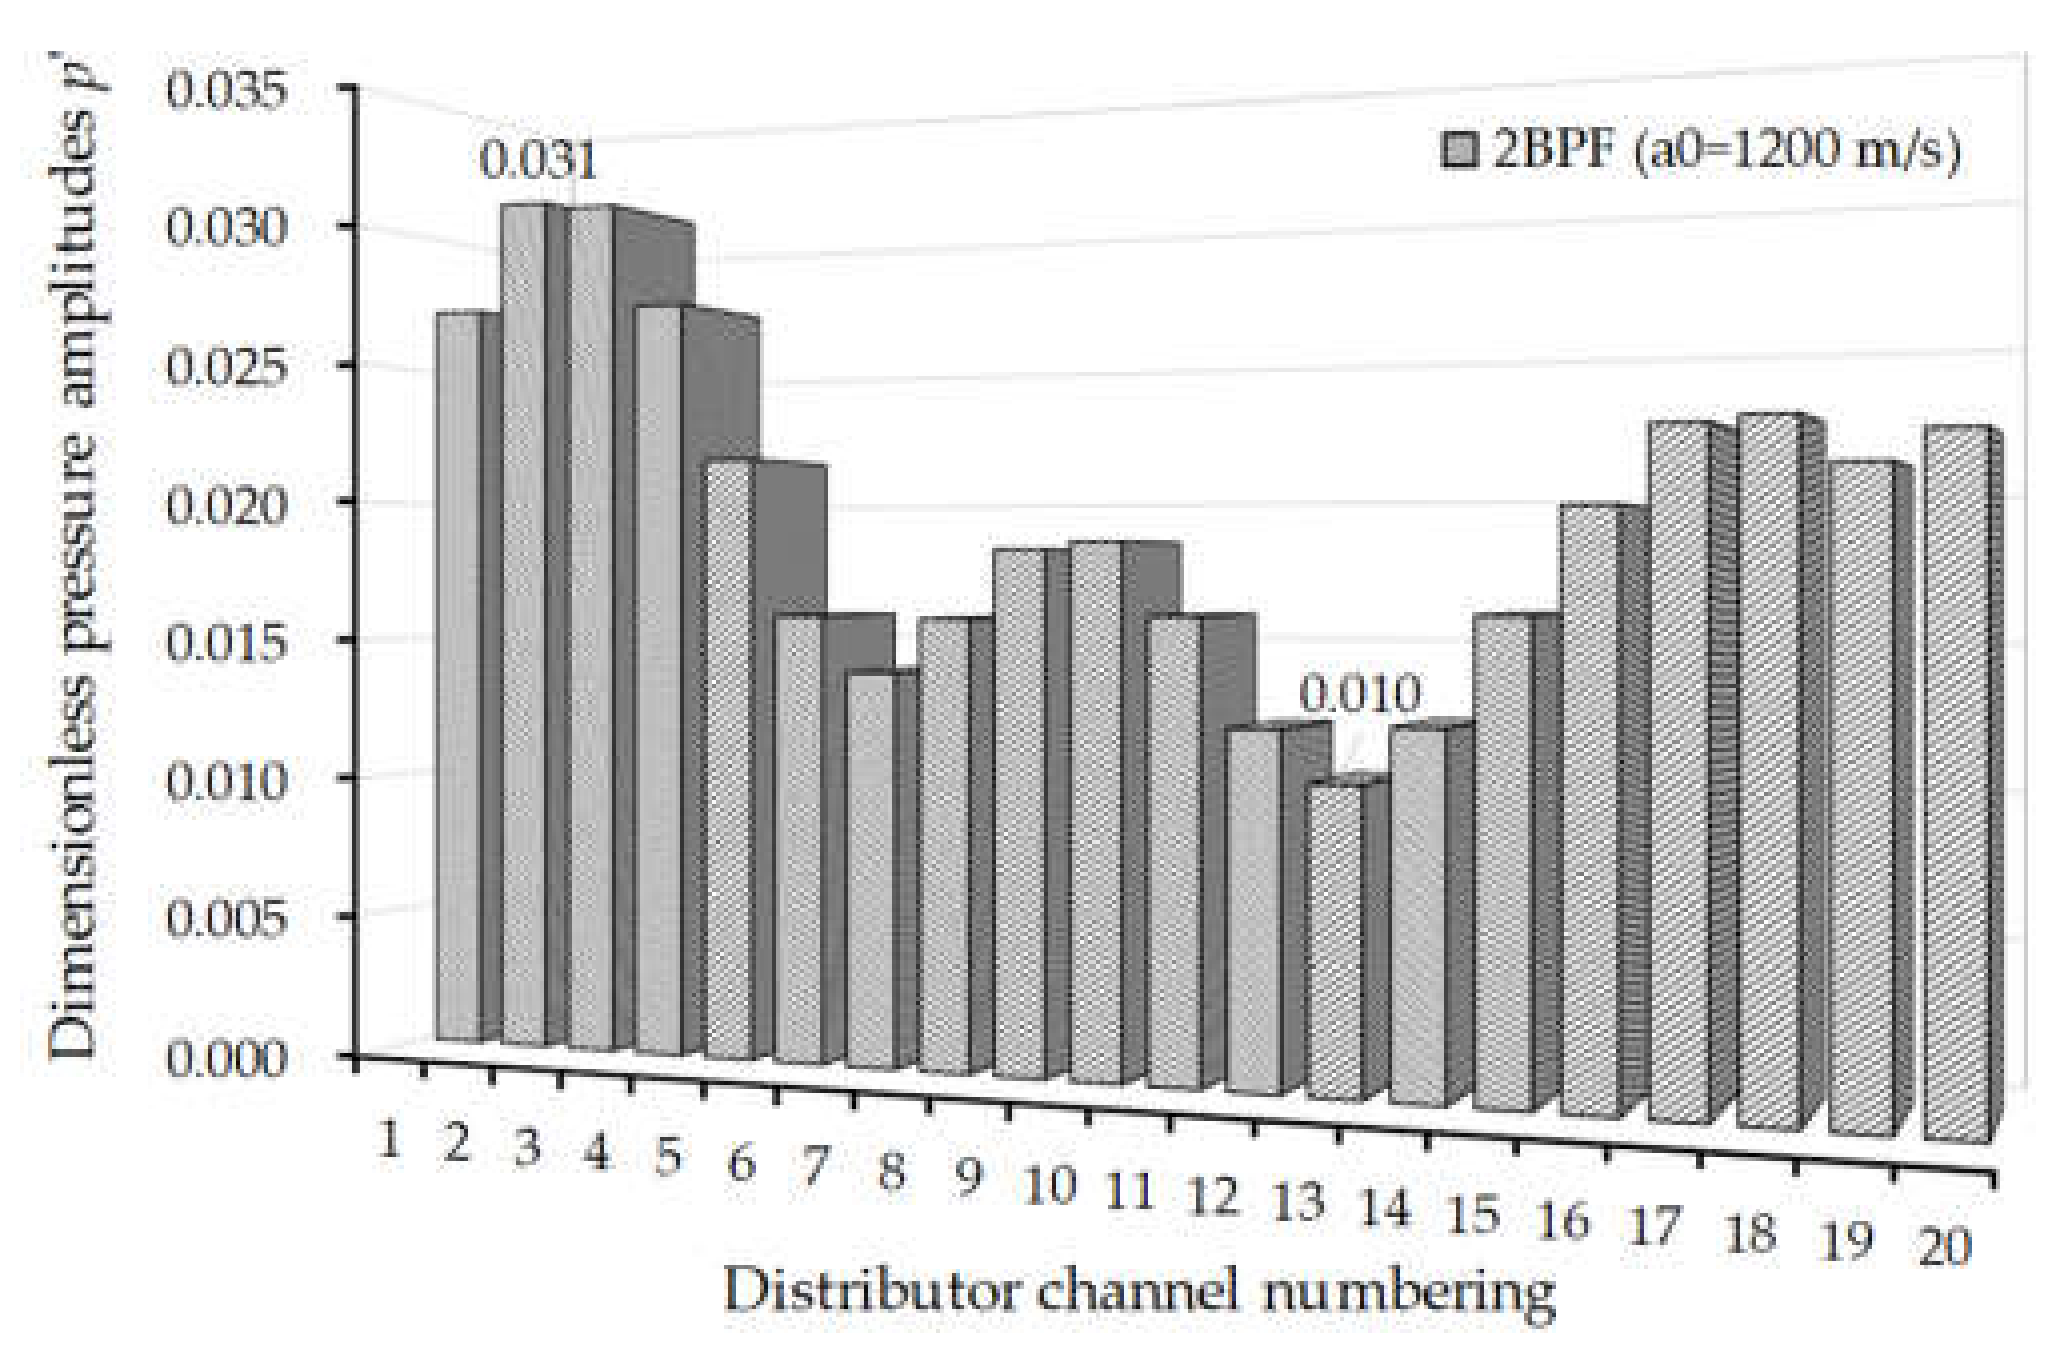
On the other hand, by comparing a0 = 1320 m/s in Figure 8b and a0 = 1450 m/s in Figure 9 with a0 = 1200 m/s in Figure 6d, we can observe that increasing the sound speed a0 leads to the pressure waves traveling out of the spiral case faster, so the amplitudes along the spiral case would increase or be about constant over the spiral circumference. When the sound speed was increased, in our case, the ratio Lsp/(2λ) was closer to 1.0.
(3)
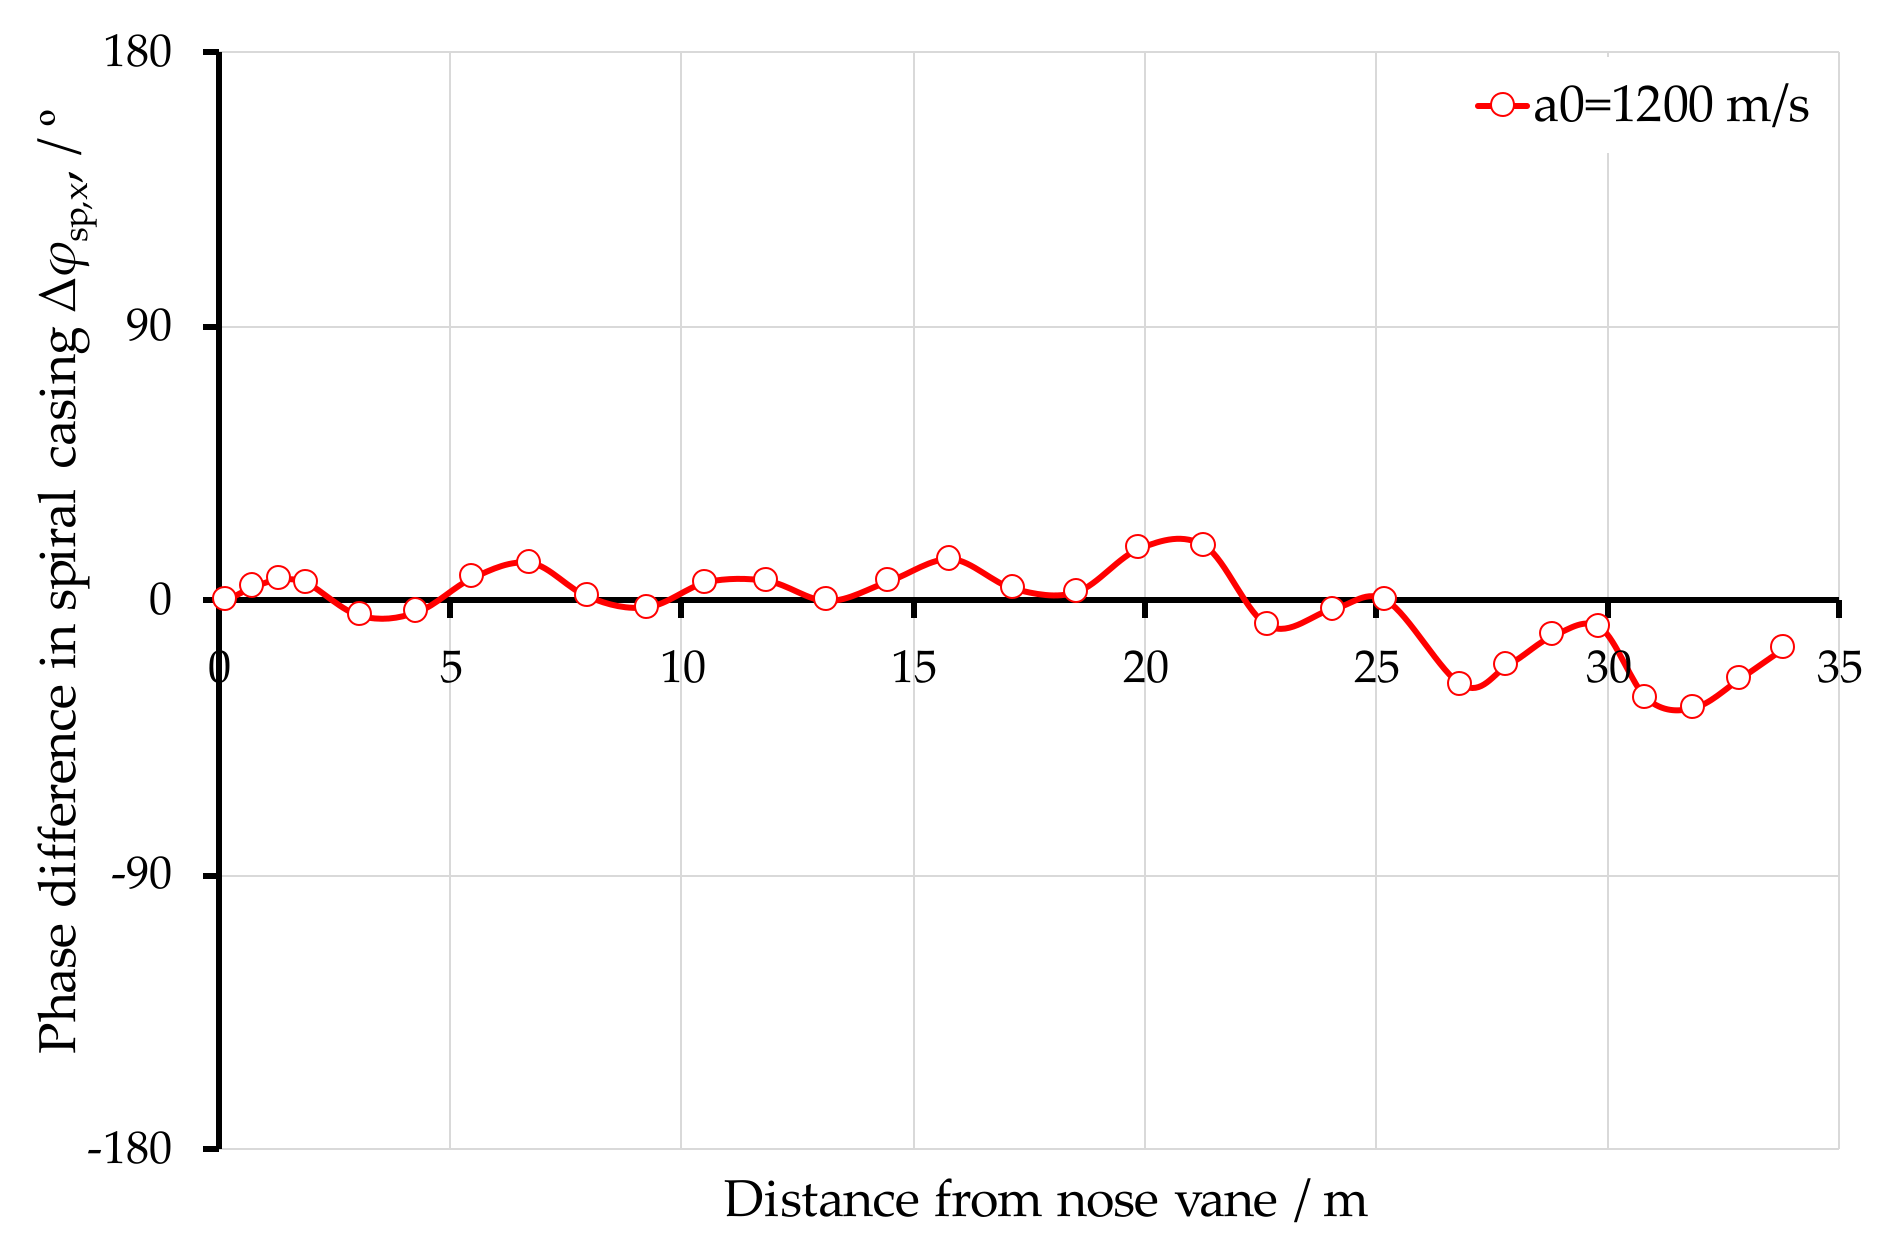
The comparison of the phases revealed that the phase differences between various monitoring points and SP_00 are all almost linear along the distance that pressure waves travel out of the spiral casing of all four sound speeds. In adding a phase lag due to the distance between monitoring points, Figure 11 presents the phase differences among all the monitoring points of the spiral circumferences for the case of a0 = 1200 m/s. It can be seen that the pressure fluctuations of all the monitoring points in the spiral casing have almost the same phase, and this is the so-called direct PR. In the Supplementary material, an animation of the PR phenomenon is provided from this study for the case of a0 = 1200 m/s.
The above observations differ from the theoretical explanation by Doerfler [8]. On the one hand, it can be seen that the observed phase resonance is a direct PR from the phase comparisons, regardless of the variation in sound speed. As pointed out already by previous researchers [7,8,9,10], the technical risk for direct phase resonance should be controlled and avoided during the project planning and design stage. On the other hand, why a higher amplitude was observed at the spiral casing end, which differs from the current theory, needs further study for a more convincing explanation.

4. Discussions

4.1. Direct PR and Indirect PR

Vibrations and noise are normally difficult to diagnose. When such problem appears, a lot of effort needs to be spent on searching and eliminating the source of the strong pressure fluctuation, such as impeller replacement, which is often very costly. However, the contribution of wave superposition (such as PR) on the resulting high amplitudes has been underestimated. In the explanation about the role of PR in the vibrations and noise in radial hydraulic turbomachines, Doerfler [8] wrote: “it is important to control the second mechanism: superposition of waves around the stator cascade. The pressure disturbances originating from the individual distributor channels, may in certain conditions give a resulting oscillation of high amplitude, because their phase is equal. This unfavourable condition is termed ‘phase resonance’.” From his explanation, PR is referred to as oscillating pressure waves with high amplitudes and travel in step or in a synchronous manner.
In the engineering world, engineers often confuse PR with RSI, and PR is often neglected or underestimated. Recent studies have revised PR, emphasizing the importance of boundary conditions and that PR can be further classified into direct PR and indirect PR from the presentation by Ruchonnet, Taruffi and Doerfler, together with Tsujimoto, on IAHR Lausanne in 2013. For China’s hydraulic communities, it is urgent to catch up with the research on this subject in order to foresee such technical risks during project planning and to provide possible measures for risk mitigation during the design stage, such as the possible selection of the number of guide vanes or impeller blades.
Regarding the traveling waves in a spiral casing, they can also travel in a synchronous manner, resulting in an oscillation of pressure with a high amplitude in certain conditions, which may cause direct PR or indirect PR and lead to strong vibrations and noises for the unit operation at the end. There must be certain other conditions so that they travel in an asynchronous manner, giving a resulting oscillation of low amplitude. Future research on such an internal mechanism and its conditions may provide a clever solution in solving this kind of problem.

4.2. Risk Factor RF

Several criteria were provided in Reference [8] to avoid PR. Such criteria are simple and very useful for risk assessments.
Assuming a0 = 1200 m/s, and with the data in Table 1, the so-called inverse Helmholtz number ( M = D · π · N a ) is equal to 0.15 (where D is the diameter of the spiral casing centerline and can be estimated with D = L s p / π ). Then, the estimated risk factor RF is 36.4%, which already exceeds the specified 25% limit.
If checked with the expanded CHEN’s criterion, k · Z R · 1 ± M m · Z s = 0.7 , it falls below the required 0.8. Therefore, a certain PR risk can be easily foreseen for the current case.

4.3. Influence of the RSI

In order to find out the reason why a higher amplitude occurs at the spiral case end, 20 monitoring points at the distributor channel outlet center were further added to monitor the pressure waves coming out from the RSI. For the case of a0 = 1200 m/s, the distribution of the dimensionless pressure amplitudes at 2BPF over the circumference, starting from the spiral casing inlet until the spiral casing end, is presented in Figure 12. It can be seen that higher amplitudes at 2BPF were observed at the inlet and the end regions, whereas lower amplitudes were at the opposite or the middle parts of the spiral casing. The amplitude at channel 2 reached the maximum, which was about three times that at the opposite channel 13. Thus, the uneven distribution of the pressure waves caused by RSI led to higher amplitudes at the spiral casing end. However, in theory, a number of considerable simplifications are normally made in the mathematical model for a 1D analysis, such as pressure waves of equal intensity generated at every stator channel [8]. This simplification could be reasonable if the gap between the rotating impeller’s leading edge and the stationary trailing edge of the guide vanes is considerably small. However, in the current geometry, where the gap is relatively large to weaken the pressure fluctuation induced by the RSI, the uneven distribution of the pressure waves at every stator channel could distort the pressure distribution over the spiral circumference, making the problem more complex and difficult to understand. As the RSI and PR are not independent, a 3D CFD simulation with an acoustic model, which couples the RSI and PR phenomena, could better predict the results to understand the problem than the standard 1D method.
In the Supplementary materials, an animation of the RSI phenomenon is provided from this study for the case of a0 = 1200 m/s.

4.4. Influence on the RSI

Although the RSI produces the source of PR, nevertheless, the pressure pulsation pattern over the circumference of the spiral formed by the mechanism of PR surrounds the rotating impeller through the distributor channels. Figure 13 presents the results of the amplitudes of the pressure fluctuations at the impeller upstream under several typical frequencies for a0 = 1200 m/s.
The black lines are for the monitoring points VL_*01, VL_*02 and VL_*03. Since these points are located in the rotating domain, their dominant frequency is the gate passing frequency (1GPF). Going inside the distributor channel, the pressure fluctuations at 2BPF (red lines) start to develop and prevail with higher amplitudes compared to those at 1BPF (blue lines). The amplitudes for the pressure pulsations at 1BPF are almost identical in all four channels and decay fast towards the spiral casing outlet. However, the amplitudes at 2BPF do not decay very much because of PR occurring in the spiral casing.

5. Conclusions

This study developed a state-of-the-art 3D CFD transient simulation method based on the acoustic model available in CFX to study the phase resonance that occurred during a full load operation in the turbine mode of a pump turbine on the prototype scale. The following conclusions could be drawn:
(1)
To capture the PR phenomenon inside the spiral casing due to blade passage, an appropriate timestep of Δt = 1/32 or 1/40 bpt is recommended.
(2)
A certain kind of direct PR risk was detected inside the pump turbine and studied through a 3D CFD simulation with an acoustic model.
(3)
The detected direct PR differed from the well-known PR with two features: firstly, it was almost independent of the sound speeds; secondly, the pressure distribution over the spiral circumference was not uniform and varied in amplitude.
(4)
The uneven pressure amplitude distribution resulted from the pressure waves at every stator channel induced by the RSI, which is normally neglected in the standard 1D analysis. As the RSI and PR are not independent, a 3D CFD simulation with an acoustic model, which couples the RSI and PR phenomena, could better predict the results to understand the problem compared to the 1D method.

Supplementary Materials

The following are available online at https://www.mdpi.com/article/10.3390/en14227539/s1, Video S1: direct PR for a0 = 1200 m/s, S2: RSI for a0 = 1200 m/s.

Author Contributions

Investigation, P.H.; Early inspection and data analysis, S.J.; writing, Y.F.; supervision, S.Y.; project administration, D.L.; funding acquisition, J.Z. All authors have read and agreed to the published version of the manuscript.

Funding

This study was financially supported by the Industrial Prospect and Key Core Technology project of Jiangsu Province, grant number BE2019009-01.

Institutional Review Board Statement

Not applicable.

Informed Consent Statement

Not applicable.

Data Availability Statement

Not applicable.

Acknowledgments

During this study, there were quite a lot of discussions with several experts, such as Doerfler and Cheng Yongguang, in this field. Wang Xikun from Jiangsu University helped us to improve the English grammar during the manuscript preparation and revision. Here, we express our sincere thanks to them.

Conflicts of Interest

The authors declare no conflict of interest.

References

  1. Haban, V.; Koutnik, J.; Pochyly, F. 1-D Mathematical model of high-frequency pressure oscillations induced by RSI including an influence of fluid second viscosity. In Proceedings of the 21st IAHR Symposium, Lausanne, Switzerland, 9–12 September 2002; pp. 735–740. [Google Scholar]
  2. Christophe, N. Hydroacoustic Modelling and Numerical Simulation of Unsteady Operation of Hydroelectric Systems [D]. EPFL Thesis No. 3751, Ph.D. Thesis, Ecole Polytechnique Fédérale, Lausanne, Switzerland, 2007. [Google Scholar]
  3. Alireza, Z. Investigations of Time Dependent Flow Phenomena in a Turbine and a Pump-Turbine of Francis Type: Rotor-Stator Interactions and Precessing Vortex Rope [D]. EPFL Thesis No. 4272, Ph.D. Thesis, Ecole Polytechnique Fédérale, Lausanne, Switzerland, 2009. [Google Scholar]
  4. Yan, J.; Koutnik, J.; Seidel, U.; Hübner, B. Compressible Simulation of Rotor-Stator Interaction in Pump-Turbines. Int. J. Fluid Mach. Syst. 2010, 3, 315–323. [Google Scholar] [CrossRef] [Green Version]
  5. Zhang, X.X.; Cheng, Y.G.; Xia, L.S.; Yang, J.D. Dynamic characteristics of a pump-turbine during hydraulic transients of a model pumped-storage system: 3D CFD simulation. In Proceedings of the IAHR Symposium on Hydraulic Machinery & Systems, Montreal, QC, Canada, 22–26 September 2014; p. 032030. [Google Scholar]
  6. Li, D.; Wang, H.; Qin, Y.; Han, L.; Wei, X.; Qin, D. Entropy production analysis of hysteresis characteristic of a pump-turbine model. Energy Convers. Manag. 2017, 149, 175–191. [Google Scholar] [CrossRef]
  7. Chen, Y.N. Oscillations of Water Pressure in Spiral Casings of Storage Pumps. In Technical Review Sulzer, Research Issue (Turbo-machinery); Sulzer Management Ltd: Winterthur, Switzerland, 1961; pp. 21–34. [Google Scholar]
  8. Doerfler, P. On the role of phase resonance in vibrations caused by blade passage in radial hydraulic turbomachines [C]. IAHR Section Hydraulic Machinery, Equipment, and Cavitation. In Proceedings of the 12th IAHR Symposium on Hydraulic Machinery and System, Stirling, UK, 27–30 August 1984. [Google Scholar]
  9. Tsujimoto, Y.; Tanaka, H.; Doerfler, P.; Yonezawa, K.; Suzuki, T.; Makikawa, K. Effects of Acoustic Resonance and Volute Geometry on Phase Resonance in a Centrifugal Fan. Int. J. Fluid Mach. Syst. 2013, 6, 725–734. [Google Scholar] [CrossRef] [Green Version]
  10. Nishiyama, Y.; Suzuki, T.; Yonezawa, K.; Tanaka, H.; Doerfler, P.; Tsujimoto, Y. Phase Resonance in a Centrifugal Compressor. Int. J. Fluid Mach. Syst. 2011, 4, 324–333. [Google Scholar] [CrossRef] [Green Version]
  11. Yuan, S.; Fang, Y.; Yuan, J.; Jinfeng, Z. Review on the vibration problems of power units of the commissioned pumped storage projects in China. J. Hydroelectr. Eng. 2015, 34, 1–15. (in Chinese). [Google Scholar]
  12. Yujian, F.; Shouqi, Y.; Jinwei, L.; Jixing, Y.; Jinfeng, Z.; Dörfler, P. Evaluation of the hydraulic resonance in turbine mode of a medium-head pump-turbine. J. Vib. Eng. Technol. 2017, 5, 451–466. [Google Scholar]
  13. Dörfler, P.; Sick, M.; Coutu, A. Flow-Induced Pulsation and Vibration in Hydroelectric Machinery; Springer: London, UK, 2013. [Google Scholar]
  14. Huang, P.; Fang, Y.J.; Chen, H.Y.; Jinfeng, Z.; Yuan, S. 2019 Discussion on the coupled hydraulic resonance for the reversible pump-turbine. In Proceedings of the 22nd Symposium on China’s Hydro Power Equipment, Haikou, China, 28–30 November 2019. (In Chinese). [Google Scholar]
Figure 1. Computational domain for the simulation (all units in m).
Energies 14 07539 g001
Figure 2. Mesh in the spiral casing, distributor channels, impeller and draft tube, (a) and a close view of the mesh in the distributor channels and impeller (b).
Energies 14 07539 g002
Figure 3. Contour of pressure at the unit centerline elevation of the pump turbine (a0 = 1200 m/s).
Energies 14 07539 g003
Figure 4. Locations of the monitoring points in the whole computational domain (a) and inside the distributor channel (b).
Energies 14 07539 g004
Figure 5. A simple wave function of y = sin(x) discretized with different schemes.
Energies 14 07539 g005
Figure 6. Typical pressure waves inside the spiral casing simulated with different timesteps Δt: (a) Δt = 1/20 bpt, (b) Δt = 1/24 bpt, (c) Δt = 1/32 bpt and (d) Δt = 1/40 bpt.
Energies 14 07539 g006aEnergies 14 07539 g006b
Figure 7. Comparison of the amplitudes at 2BPF for the results simulated with (Figure 6a) Δt = 1/20 bpt and (Figure 6d) Δt = 1/40 bpt.
Energies 14 07539 g007
Figure 8. Pressure waves inside the spiral casing simulated with different sound speeds: (a) a0 = 1082 m/s (Δt = 1/40 bpt) and (b) a0 = 1320 m/s (Δt = 1/32 bpt).
Energies 14 07539 g008
Figure 9. Pressure waves inside the spiral casing simulated with the sound speed a0 = 1450 m/s (Δt = 1/32 bpt) after a 2D interpolation.
Energies 14 07539 g009
Figure 10. Comparison of the pressure fluctuation at 2BPF for the results simulated with different sound speeds obtained from the FFT analysis: (a) amplitudes and (b) initial phase.
Energies 14 07539 g010aEnergies 14 07539 g010b
Figure 11. Phase differences of the pressure fluctuation at 2BPF among all the monitoring points in the spiral casing for a0 = 1200 m/s.
Energies 14 07539 g011
Figure 12. Amplitudes of the pressure fluctuations at 2BPF at the outlet of distributor channels.
Energies 14 07539 g012
Figure 13. Amplitudes of the pressure fluctuations at the typical frequencies for a0 = 1200 m/s obtained from the FFT analysis.
Energies 14 07539 g013
Table 1. Basic parameters of the geometry.
SymbolValueShort Description
Hr419 mRated head in turbine mode
Qr81.52 m3/sRated discharge
Hs70 mPlant suction head
D1a4.21 mImpeller inlet diameter in turbine mode
n428.6 rev/minRated speed
Dd2.3 mDiameter of spiral case inlet
Ds4.5 mDiameter of draft tube outlet
Z29Number of impeller blades
Z020Number of guide vanes
Lsp25.2 mCircumferential length of the spiral casing (centerline)
Δγrat29.65°Rated guide vane opening
Table 2. Mesh statistics of the computational domain.
ComponentsNumber of NodesMesh SoftwareMesh Topology
Spiral casing1,640,661ICEMStructured
Stay Vanes1,522,197
Guide Vanes1,059,480TurboGrid
Impeller2,432,646
Draft tube4,782,480ICEM
Table 3. Check of the ratio of characteristic length of the spiral casing to the wavelength.
Sound speed a0 (m/s)1082120013201450
Frequency of interest f (Hz)128.6
Wave length λ (m)8.419.3310.2711.28
Characteristic length of the spiral casing Lsp (m)25.2
Ratio Lsp/(2λ)1.51.41.21.1
Publisher’s Note: MDPI stays neutral with regard to jurisdictional claims in published maps and institutional affiliations.

