Article

The Effects of the Length and Conductivity of Artificial Fracture on Gas Production from a Class 3 Hydrate Reservoir

1
College of Engineering, Peking University, Beijing 100871, China
2
Beijing International Center for Gas Hydrate, School of Earth and Space Sciences, Peking University, Beijing 100871, China
*
Author to whom correspondence should be addressed.
Energies 2021, 14(22), 7513; https://doi.org/10.3390/en14227513
Submission received: 24 September 2021 / Revised: 28 October 2021 / Accepted: 8 November 2021 / Published: 10 November 2021

Abstract

:
Natural gas hydrate is considered as a potential energy resource. To develop technologies for the exploitation of natural gas hydrate, several field gas production tests have been carried out in permafrost and continental slope sediments. However, the gas production rates in these tests were still limited, and the low permeability of the hydrate-bearing sediments is identified as one of the crucial factors. Artificial fracturing is proposed to promote gas production rate by improving reservoir permeability. In this research, numerical studies about the effect of fracture length and fluid conductivity on production performance were carried out on an artificially fractured Class 3 hydrate reservoir (where the single hydrate zone is surrounded by an overlaying and underlying hydrate-free zone), in which the equivalent conductivity method was applied to depict the artificial fracture. The results show that artificial fracture can enhance gas production by offering an extra fluid flow channel for the migration of gas released from hydrate dissociation. The effect of fracture length on production is closely related to the time frame of production, and gas production improvement by enlarging the fracture length is observed after a certain production duration. Through the production process, secondary hydrate formation is absent in the fracture, and the high conductivity in the fracture is maintained. The results indicate that the increase in fracture conductivity has a limited effect on enhancing gas production.

1. Introduction

Natural gas hydrates, commonly occurring in offshore sediments and terrestrial permafrost with relatively low temperature and high pressure, are non-stoichiometric solid compounds in which small guest gas molecules (mainly methane) are captured in the water cages [1,2]. Although accurate resource estimation of the natural gas hydrate is still challenging, its considerable energy potential has been validated even based on the conservative evaluation results [3,4,5]. The research of natural gas hydrate has entered the stage of development in exploitation technology after several production trials in terrestrial and marine hydrate reservoirs, including Mallik in Canada [6], Alaskan North Slope in USA [7], Eastern Nankai Trough in Japan [8,9], and the South China Sea [10,11]. In the pilot production conducted in Eastern Nankai Trough of Japan in 2017, two production tests were carried out by depressurization method; however, due to the failure of sand management, the first production lasted for 12 days, with 41,000 m3 of methane gas produced, which is way lower than the requirement for commercial exploitation of natural gas hydrate [9]. From 10 May to 9 July 2017, China performed its first offshore natural gas hydrate production test in the South China Sea using the formation fluid extraction method, achieving the production duration of 60 days, with a total gas production volume of 3.09 × 10⁵ m3 [10] but at a relatively low production rate (~5000 m3/day). As to the rough estimation, about 0.5 million m3/day is a marginal value for a profitable production of methane gas from marine gas hydrate reservoir [1]. Obviously, the gas production levels reached in the previous production tests are all way lower than the marginal value. There are quite some factors that might be associated with the low production level. One of the main reasons is that the low efficiencies in both depressurization spreading in the hydrate reservoir and gas releasing from reservoir to production well are crucial, attributing to the presence of hydrate can result in a sharp decline in effective permeability of hydrate-bearing sediments [12,13]. Increasing the permeability of the hydrate-bearing sediments by reservoir stimulation techniques might also benefit promoting the gas production rate, as evinced by its effect in shale gas production.
In consideration of the significant effect of hydraulic fracturing in unconventional oil and gas productions for production enhancement [14], the technique of artificial fracture is proposed for gas hydrate exploitation [15], and its feasibility has been studied theoretically and experimentally [16,17,18]. Ito et al. [19] successfully created a hydraulic fracture in unconsolidated sediments for producing methane from hydrate in lab, and the developed fracture was found to occur along the interface between the sand and mud layers. Ito and Narita [20] demonstrated that the propagation behaviors of fractures in unconsolidated sand induced by tension were governed by the compressive stresses, which were quite different from those in hard rocks. In the experimental study carried out in a triaxial pressure cell, Konno et al. [21] found that the permeability of the methane hydrate-bearing sediments increased after fracturing and would be maintained even after fracture closed. Too et al. [16,17] identified the challenges of hydraulic fracturing in sandy sediments and artificially created fractures in the synthetic sediment made in the lab, illustrating the prospect of applying in the natural hydrate-bearing sediments. During the field trial of gas hydrate production in the South China Sea, micro-fractures were induced to increase the permeability of the reservoir sediments to enhance the production performance [10]. Therefore, creating an artificial fracture in a hydrate reservoir is feasible in terms of field engineering and could be a prospective method to increase the gas production rate in a natural gas hydrate reservoir.
Numerical simulations were carried out with the purpose of evaluating the efficiency of artificial fracture. Chen et al. [22] evaluated the effect of fracturing technology on the production efficiency of hydrate reservoir, showing the gas production rate was greatly enhanced with fracturing, but the effect of fracture length was not investigated. Recently, Feng et al. [23] considered the fractured zone around the production well as a high-permeability elliptic zone (e.g., the semi-major axis is 50 m, and the semi-mini axis is 20 m) and showed that it can enhance the gas production efficiently. However, a penny-shaped fracture is usually induced in the hydrate-bearing sediments for the vertical well [16,17,21], and it is commonly described by fracture length and conductivity [24]. Hence, it is necessary to find out how fracture length and conductivity affect gas production from a fractured hydrate reservoir. Since depressurization is regarded as the most promising way in field production [25,26], it was adopted as the production method in this study.
According to the classification of natural gas hydrate deposits [26,27], Class 3 hydrate deposit is characterized by the single hydrate zone that is surrounded by an overlaying and underlying hydrate-free zone. For Class 2 and Class 1 hydrate accumulations, the hydrate-bearing layer is underlain by the mobile seawater zone and the two-phase zone involving mobile gas, respectively.
In this work, the gas production from an artificially fractured Class 3 hydrate reservoir through depressurization was investigated. The effects of fracture length and conductivity on production performance were investigated by numerical simulations.

2. Methodology

2.1. Reservoir Specification

Based on the published geological information of hydrate reservoir in the Elbert area on the Alaska North Slope, a hypothetical fractured hydrate reservoir model was established, and numerical simulation experiments were conducted. In February 2007, four modular dynamic formation tester (MDT) tests were conducted at the methane hydrate-bearing units at the Mount Elbert Prospect on the Alaska North Slope. According to the classification of natural gas hydrate deposits [26,27], the hydrate deposits in Mount Elbert are examples of Class 3. With the highest likelihood of providing interpretable trends, the C2 MDT test was selected by the International Methane Hydrate Simulator Code Comparison Study for history matching simulation, and informative parameters were determined [28,29,30]. Hence, a conceptual 2D radial model was established based on the information of Mount Elbert C2 hydrate zone, as shown in Figure 1; the dimension of the model is 450 m in the radial direction and 152.5 m in the vertical direction.
In the radial direction, there are 82 grids in total, which include the innermost one of 0.11 m to represent the wellbore. Loosely speaking, the size of grids except the wellbore block increases logarithmically in the radial direction. In the vertical direction, three layers were considered in the numerical model, with 12.5 m of hydrate-bearing layer sandwiched by 70 m of impermeable hydrate-free layers divided into 10 nonuniform grids. To capture the features of dissociation and reformation of hydrate accurately, the hydrate layer has a finer discretization, divided into 110 grids, and most of the grids have a height of 0.1 m. Time-independent Dirichlet boundary conditions were applied at the top and bottom blocks of the model, while closed boundary conditions with no mass and heat flow were set in the radial direction.
The properties of the Mount Elbert hydrate reservoir in this work were referred to from the related literature, which is listed in Table 1 [29,30,31,32]. Though the reservoir is characterized by coarse-grained sand sediment with high intrinsic permeability of about 1000 mD (1 mD = 10−15 m2), it has a relatively cold temperature and low initial hydrate-bearing permeability of 0.12 mD, which brings forth a few challenges for gas production. Hence, employing artificial fracture can be an effective method to enhance production performance.

2.2. Numerical Model Establishment

2.2.1. Simulator

Numerical simulations were conducted with TOUGH + HYDRATE (T + H) reservoir simulator that was developed by Lawrence Berkeley National Laboratory, aiming to model the non-isothermal methane release, phase behavior, and fluids and heat flow under conditions typical of methane hydrate accumulations by solving the coupled equations of mass and heat balance [33]. The reliability of T + H has been validated in the two International Methane Hydrate Simulator Code Comparison Studies [29,34]. T + H can be used to fit the experimental results of methane hydrate formation and dissociation in the lab [35], and it can also be applied in large-scale simulation to evaluate the accumulation [36,37] and exploitation [38,39] of hydrate reservoirs. There are two models of hydrate dissociation and formation in T + H, i.e., the equilibrium model and kinetic model; the equilibrium model was recommended for field-scale hydrate production for the justified results and less computational demands [40], which was why it was adopted in the current simulations. The detailed theoretical background of T + H can be found in the user’s manual [33].

2.2.2. Artificial Fracture Model

As the depth of the natural gas hydrate reservoir of Mount Elbert is very shallow, approximately a little deeper than 600 m [28], the artificially induced fractures tend to propagate in the radial direction in the hydrate reservoir, originating in the vertical production well [41]. Ito et al. [19] also showed that fracture appeared at the interface between sand and mud layers in unconsolidated sands. In this paper, only the main fracture in the radial direction was considered, and the secondary fractures and fissures were ignored, as shown in Figure 1. Specifically, the artificial fracture plane was assumed located around the center of the hydrate-bearing layer and with a height of 0.1 m. Moreover, it was assumed that only an aqueous phase exists in the fracture because the hydrate will dissociate instantly during the fracturing operation by changing the temperature and pressure of the fracture. In addition, the flow in the fracture was considered to obey the Darcy’s Law during the whole simulation process, which was computed [33].
F = k k r ρ μ ( p ρ g )
where F is the mass flux; k is the intrinsic permeability; k r is the relative permeability; μ is the viscosity; p is the pressure; g is the gravitational acceleration vector.
Defined as the product of fracture permeability and fracture width, fracture conductivity plays an important role in evaluating fracture efficiency. Under the equivalent conductivity hypothesis [42,43], the conductivity of pseudo fracture grids is the same as the actual fracture that can be given as
F c d = k f × w f = k e × w g r i d
where F c d is the fracture conductivity; k f is the fracture permeability; w f is the fracture width; k e is the equivalent grid permeability; w g r i d is the equivalent grid width.
In the base case, the conductivity of fracture was set to be 10 D cm , and the width of fracture grids was 10 cm; as a result, the equivalent permeability was 1000 mD, which was equivalent to the intrinsic permeability of the reservoir.

2.2.3. Relative Permeability and Capillary Pressure

The relationship between the phase saturation and relative permeability of the fluid phase can be given as [33]
k r A = ( S A S i r A 1 S i r A ) n A ,   k r G = ( S G S i r G 1 S i r A ) n G
where k r A and k r G are the relative permeability indices of water and gas; S A and S G are the saturation values of water and gas; S i r A and S i r G are the irreducible saturation values of water and gas; n A and n G are the relative permeability indices for water and gas.
Capillary pressure is defined as [44]
P c a p = P 0 [ ( S ) 1 / λ 1 ] 1 λ ,   S = S A S i r A S m x A S i r A
where P c a p is the capillary pressure; P 0 is the gas entry pressure; λ is the capillary pressure index; S m x A is the maximum of water saturation.
Due to the high porosity and permeability of the fracture, it shows different hydraulic properties, compared with the hydrate-bearing sediments. As a result, different hydraulic parameters were employed for sediments and fracture, which are shown in Table 2 [30,45].

2.2.4. Initial Conditions

The temperature and pressure in the middle of the hydrate-bearing layer were 2.95 °C and 6.78 MPa, respectively. The geothermal gradient of this area was 0.0355 K/m, and the hydrostatic pressure gradient was set to be 0.0098 MPa/m [30]. Moreover, it was assumed the pressure and temperature were distributed evenly along each layer in the radial direction. After initialization processes, thermal and hydrostatical conditions achieved a steady state.

2.2.5. Production Strategy

In this study, a single vertical production well was assumed to penetrate into the whole hydrate layer. The target wellbore pressure was 2.7 MPa (the equilibrium temperature is about 0.48 °C) in the production process, which is slightly above the pressure of the quadruple point of methane hydrate (about 2.6 MPa and 0 °C) to prevent ice formation. The simulations were conducted for 5-year gas production with the depressurization method. Two simulation groups were designed to investigate the effect of the fracture length and fracture conductivity on hydrate production performance, as summarized in Table 3. In group A, all the artificial fractures had the same conductivity, although they were different in length. On the other hand, in group B, all the fractures had an identical length but with different conductivities.

3. Results and Discussion

3.1. Effect of Fracture Length on Production

To investigate the effect of fracture length on production, three cases of fractures with different lengths were investigated, and the results were compared. In all the cases, the fracture conductivity was identical, with the value of 10 D cm .

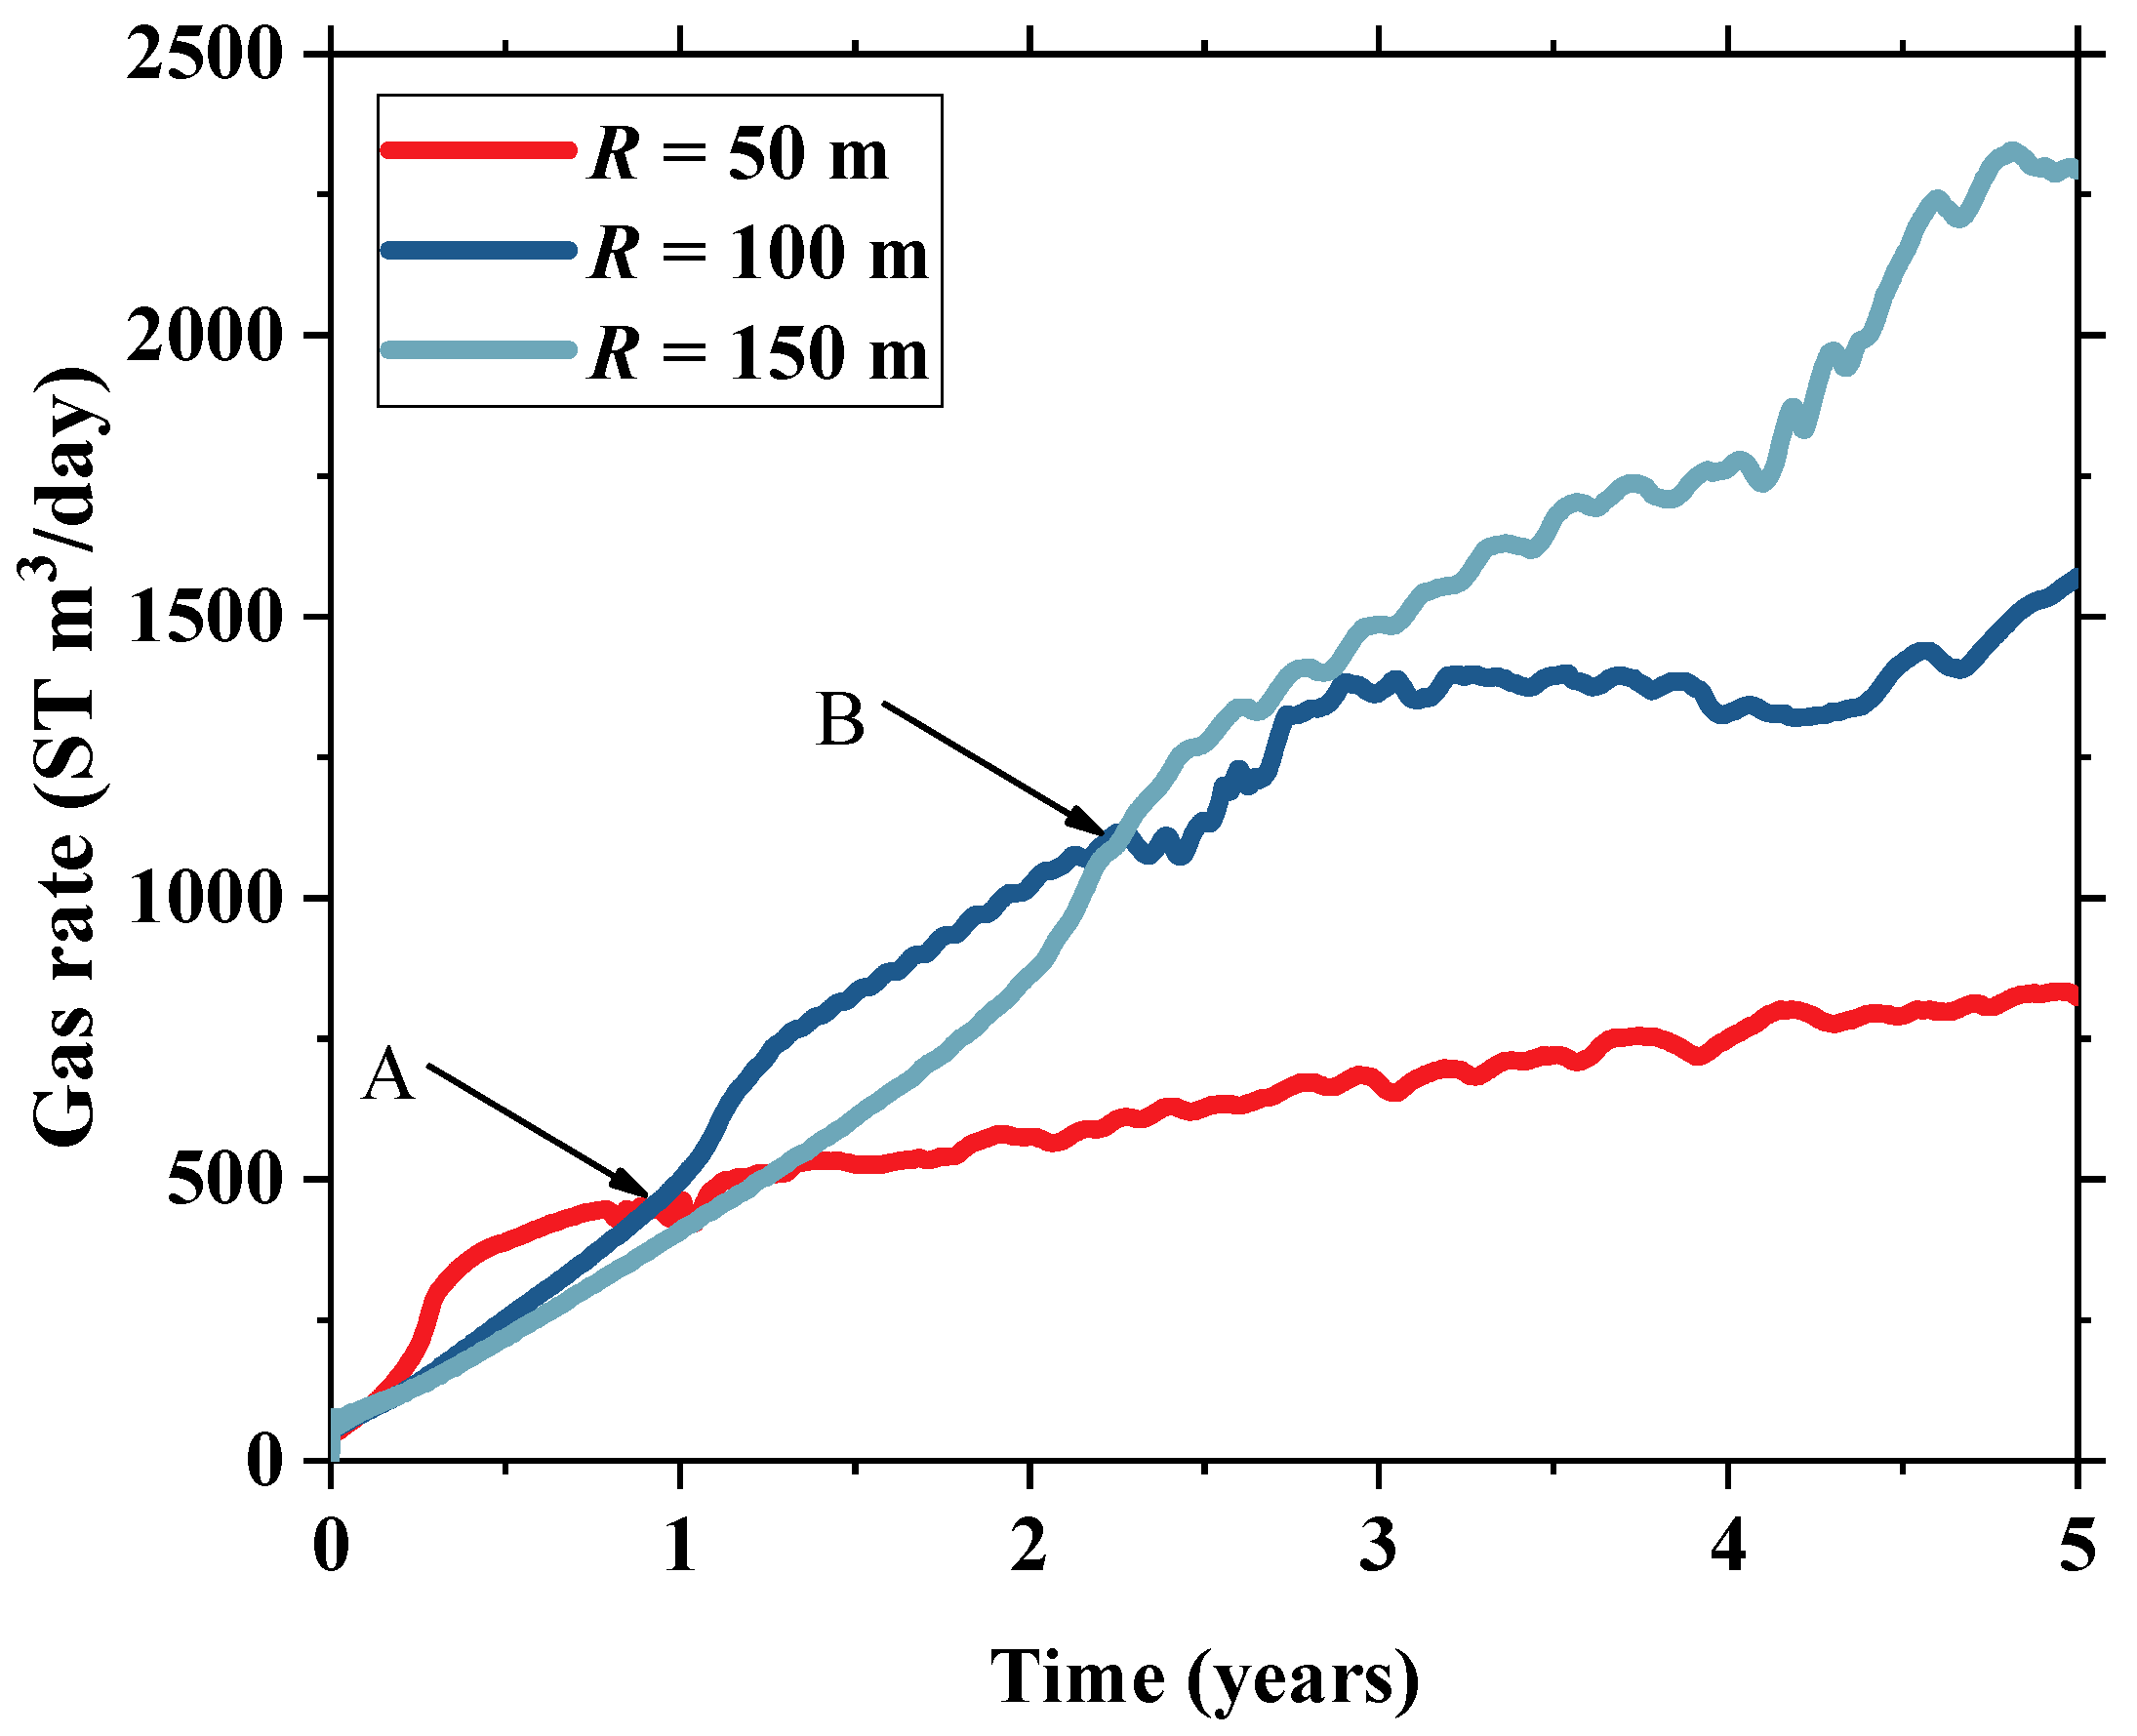
3.1.1. Gas Production

The gas production rate is a crucial parameter in gas hydrate production, and its variation with fracture length is shown in Figure 2. The gas production rate increases with time although with some fluctuations for all cases. Generally, the longer the fracture is, the higher is the gas production rate. However, a better return from a longer fracture is not presented at the early production stage, which is different from traditional oil and gas production in that the gas production rate increases with fracture length [46]. To be more specific, the gas production rate with a fracture length of 50 m is higher than that of 100 m and 150 m before the production reaches time point A. After that, the advantage of longer fracture of 100 m and 150 m over 50 m appears. Additionally, it is not until point B that the fracture with the maximum length yields the highest gas production rate. In other words, the artificial fracture can enhance gas production rate, but the advantage of longer fracture can only be observed after a sufficiently long production time. In conclusion, the effect of fracture length on production is closely related to the time frame of production, and the benefits from larger fracture length are not presented at the early production stage.
To find out the mechanism of fracture length on the gas production rate, the physical parameters of the grids that are located 50 m away from the production well in the radial direction and adjacent to the fracture plane were monitored (as depicted in Figure 1), and the evolution of pressure and hydrate saturation is shown in Figure 3. As depicted in Figure 3, the monitored grid in the R = 50 m case has the lowest pressure and the fastest hydrate saturation decreasing rate, and the hydrate dissociated completely before 1 year. During the early production stage, as fracture length increases, the influence range of pressure propagation extends due to the high conductivity of artificial fracture, while the pressure drop decreases, and the amount of gas released from hydrate dissociation also reduces. As a result, the gas production rate of R = 50 m case is higher than the other two cases in the early stage before point A. After that, the gas production rate in case of R = 100 m overpasses the fracture length of 50 m. The same mechanism also applies to the interpretation of the phenomenon that happens before point B.

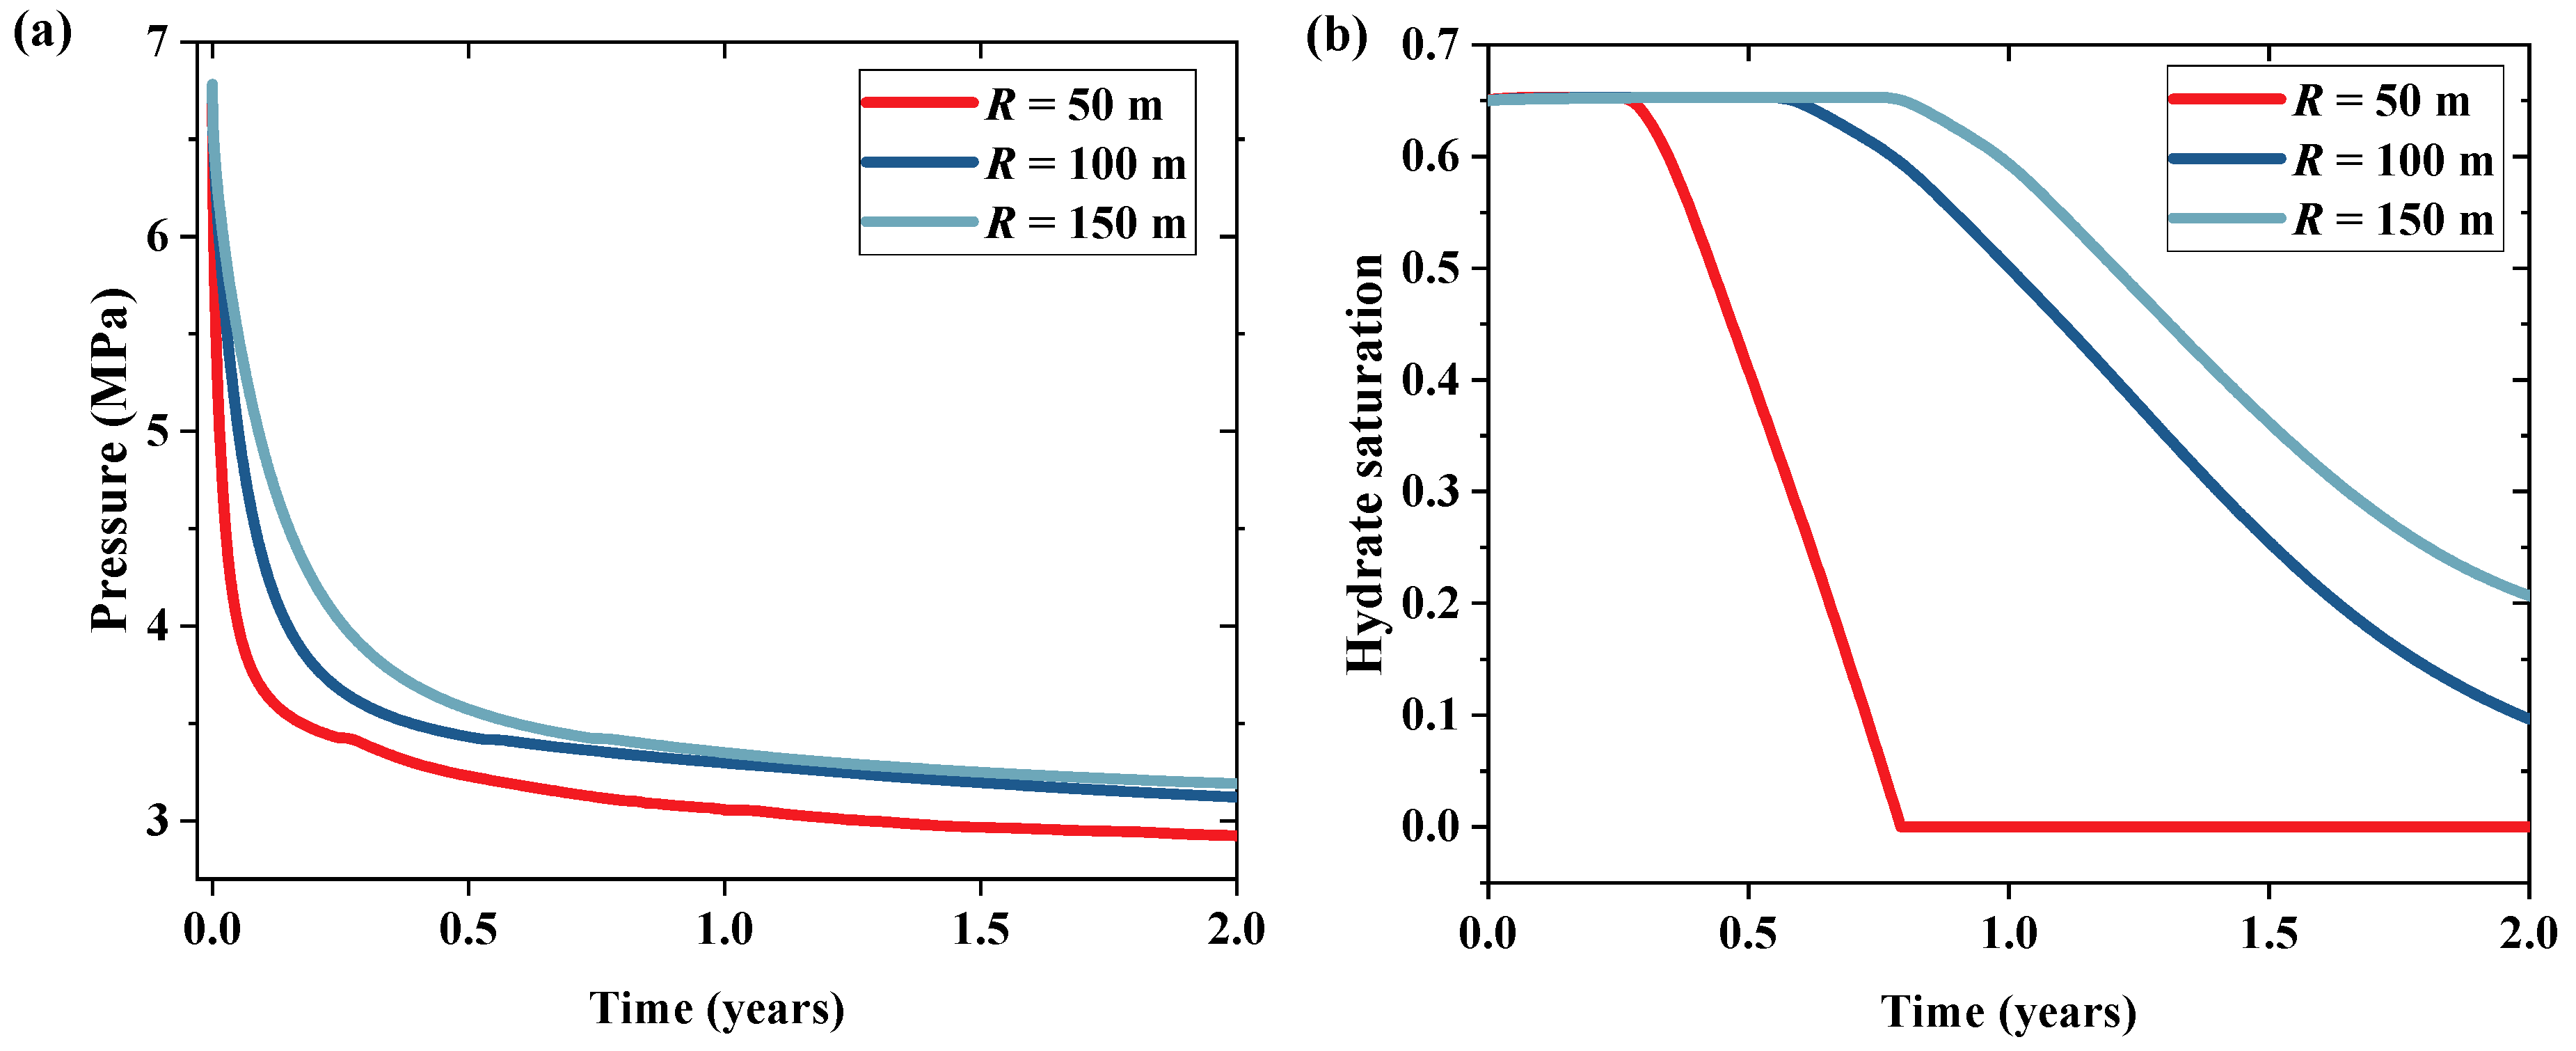
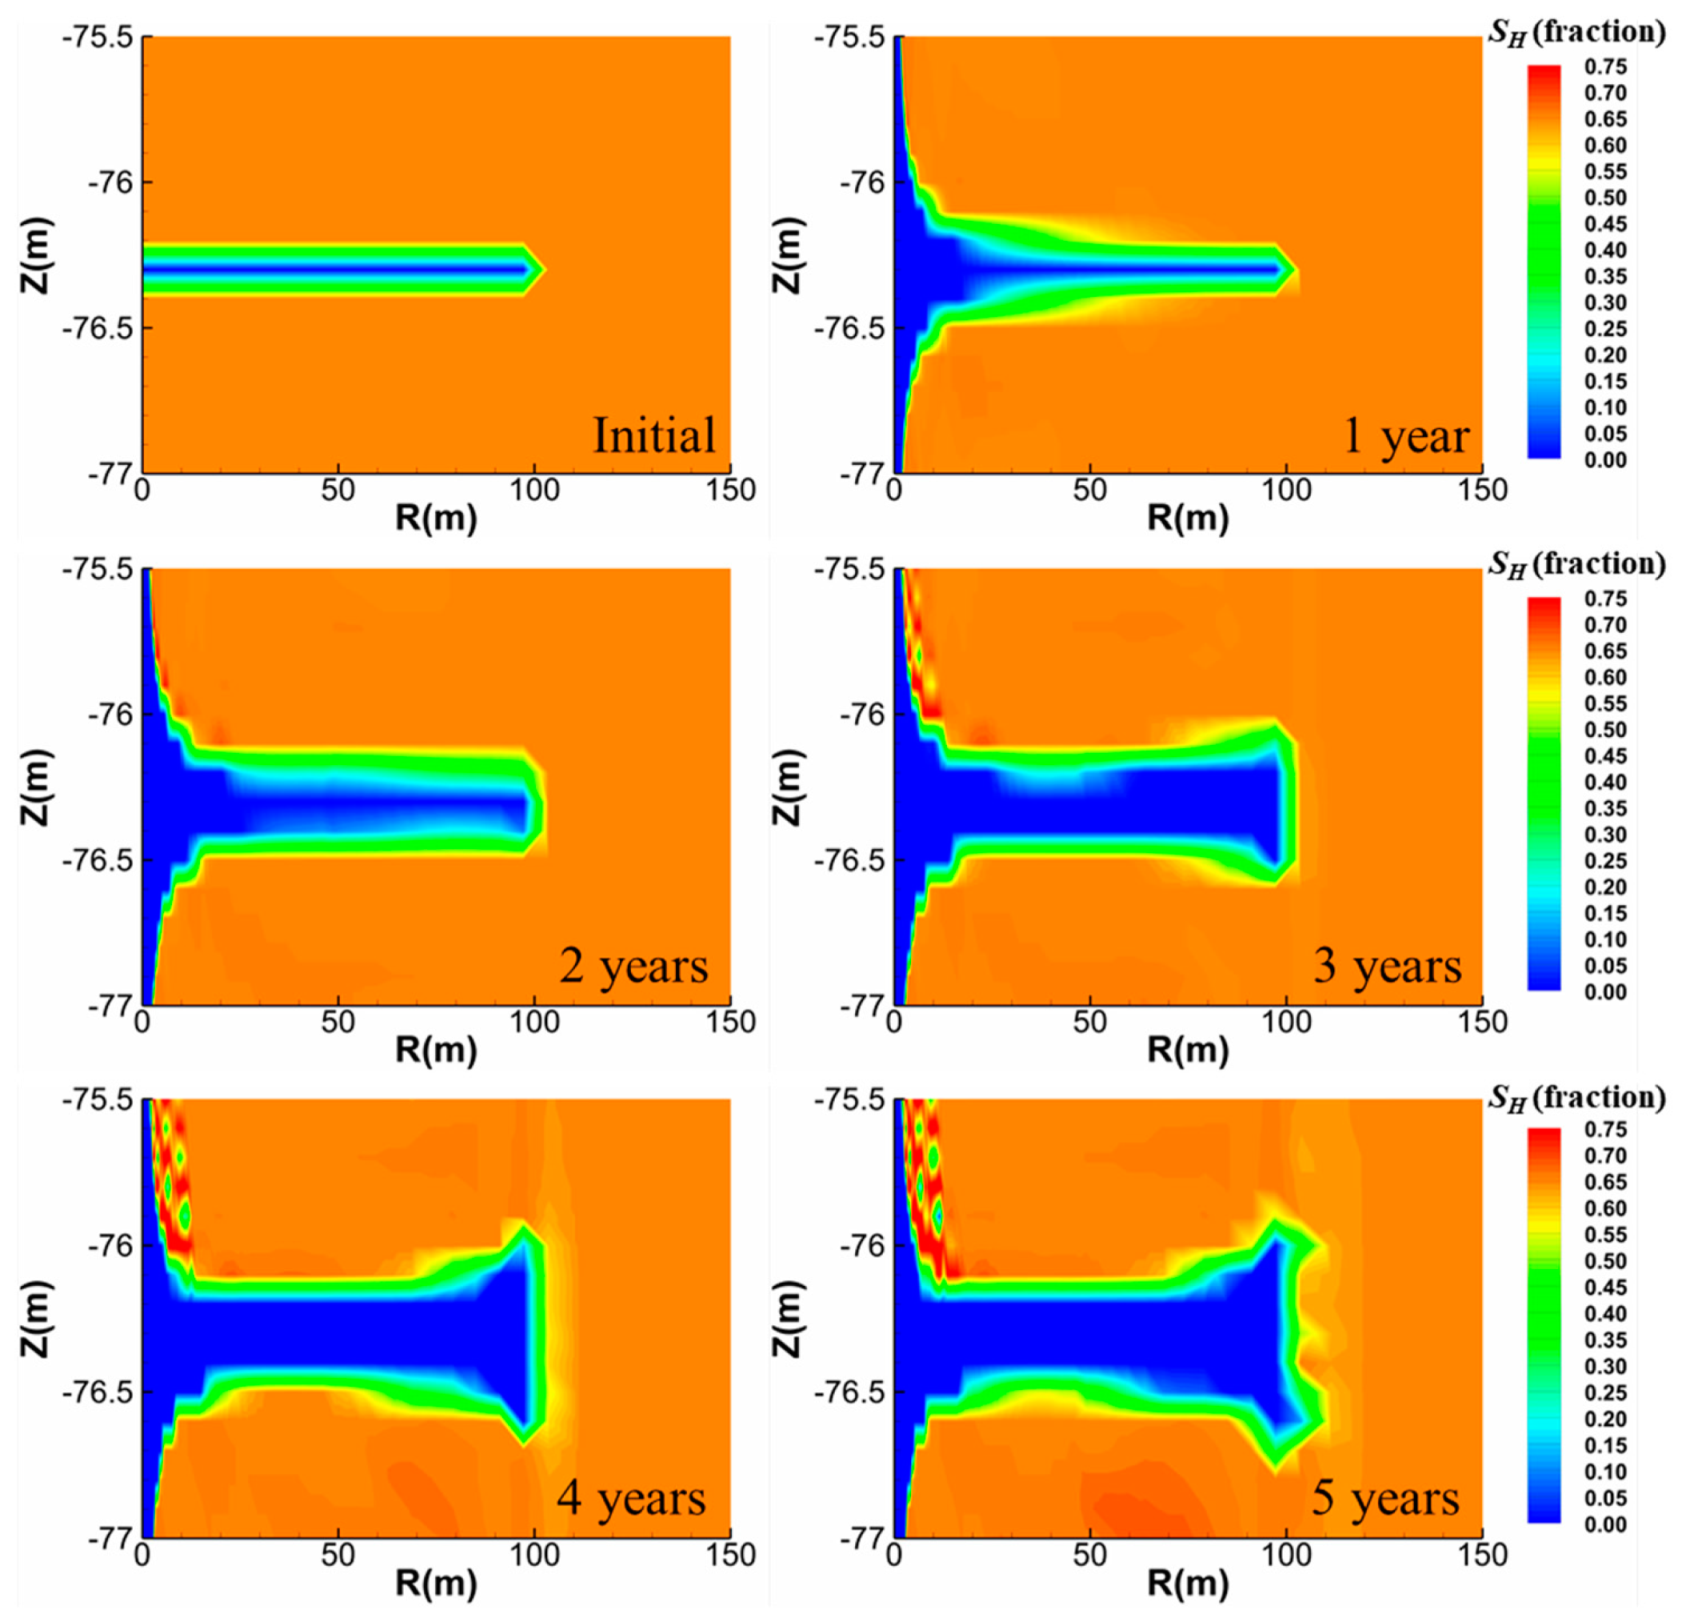
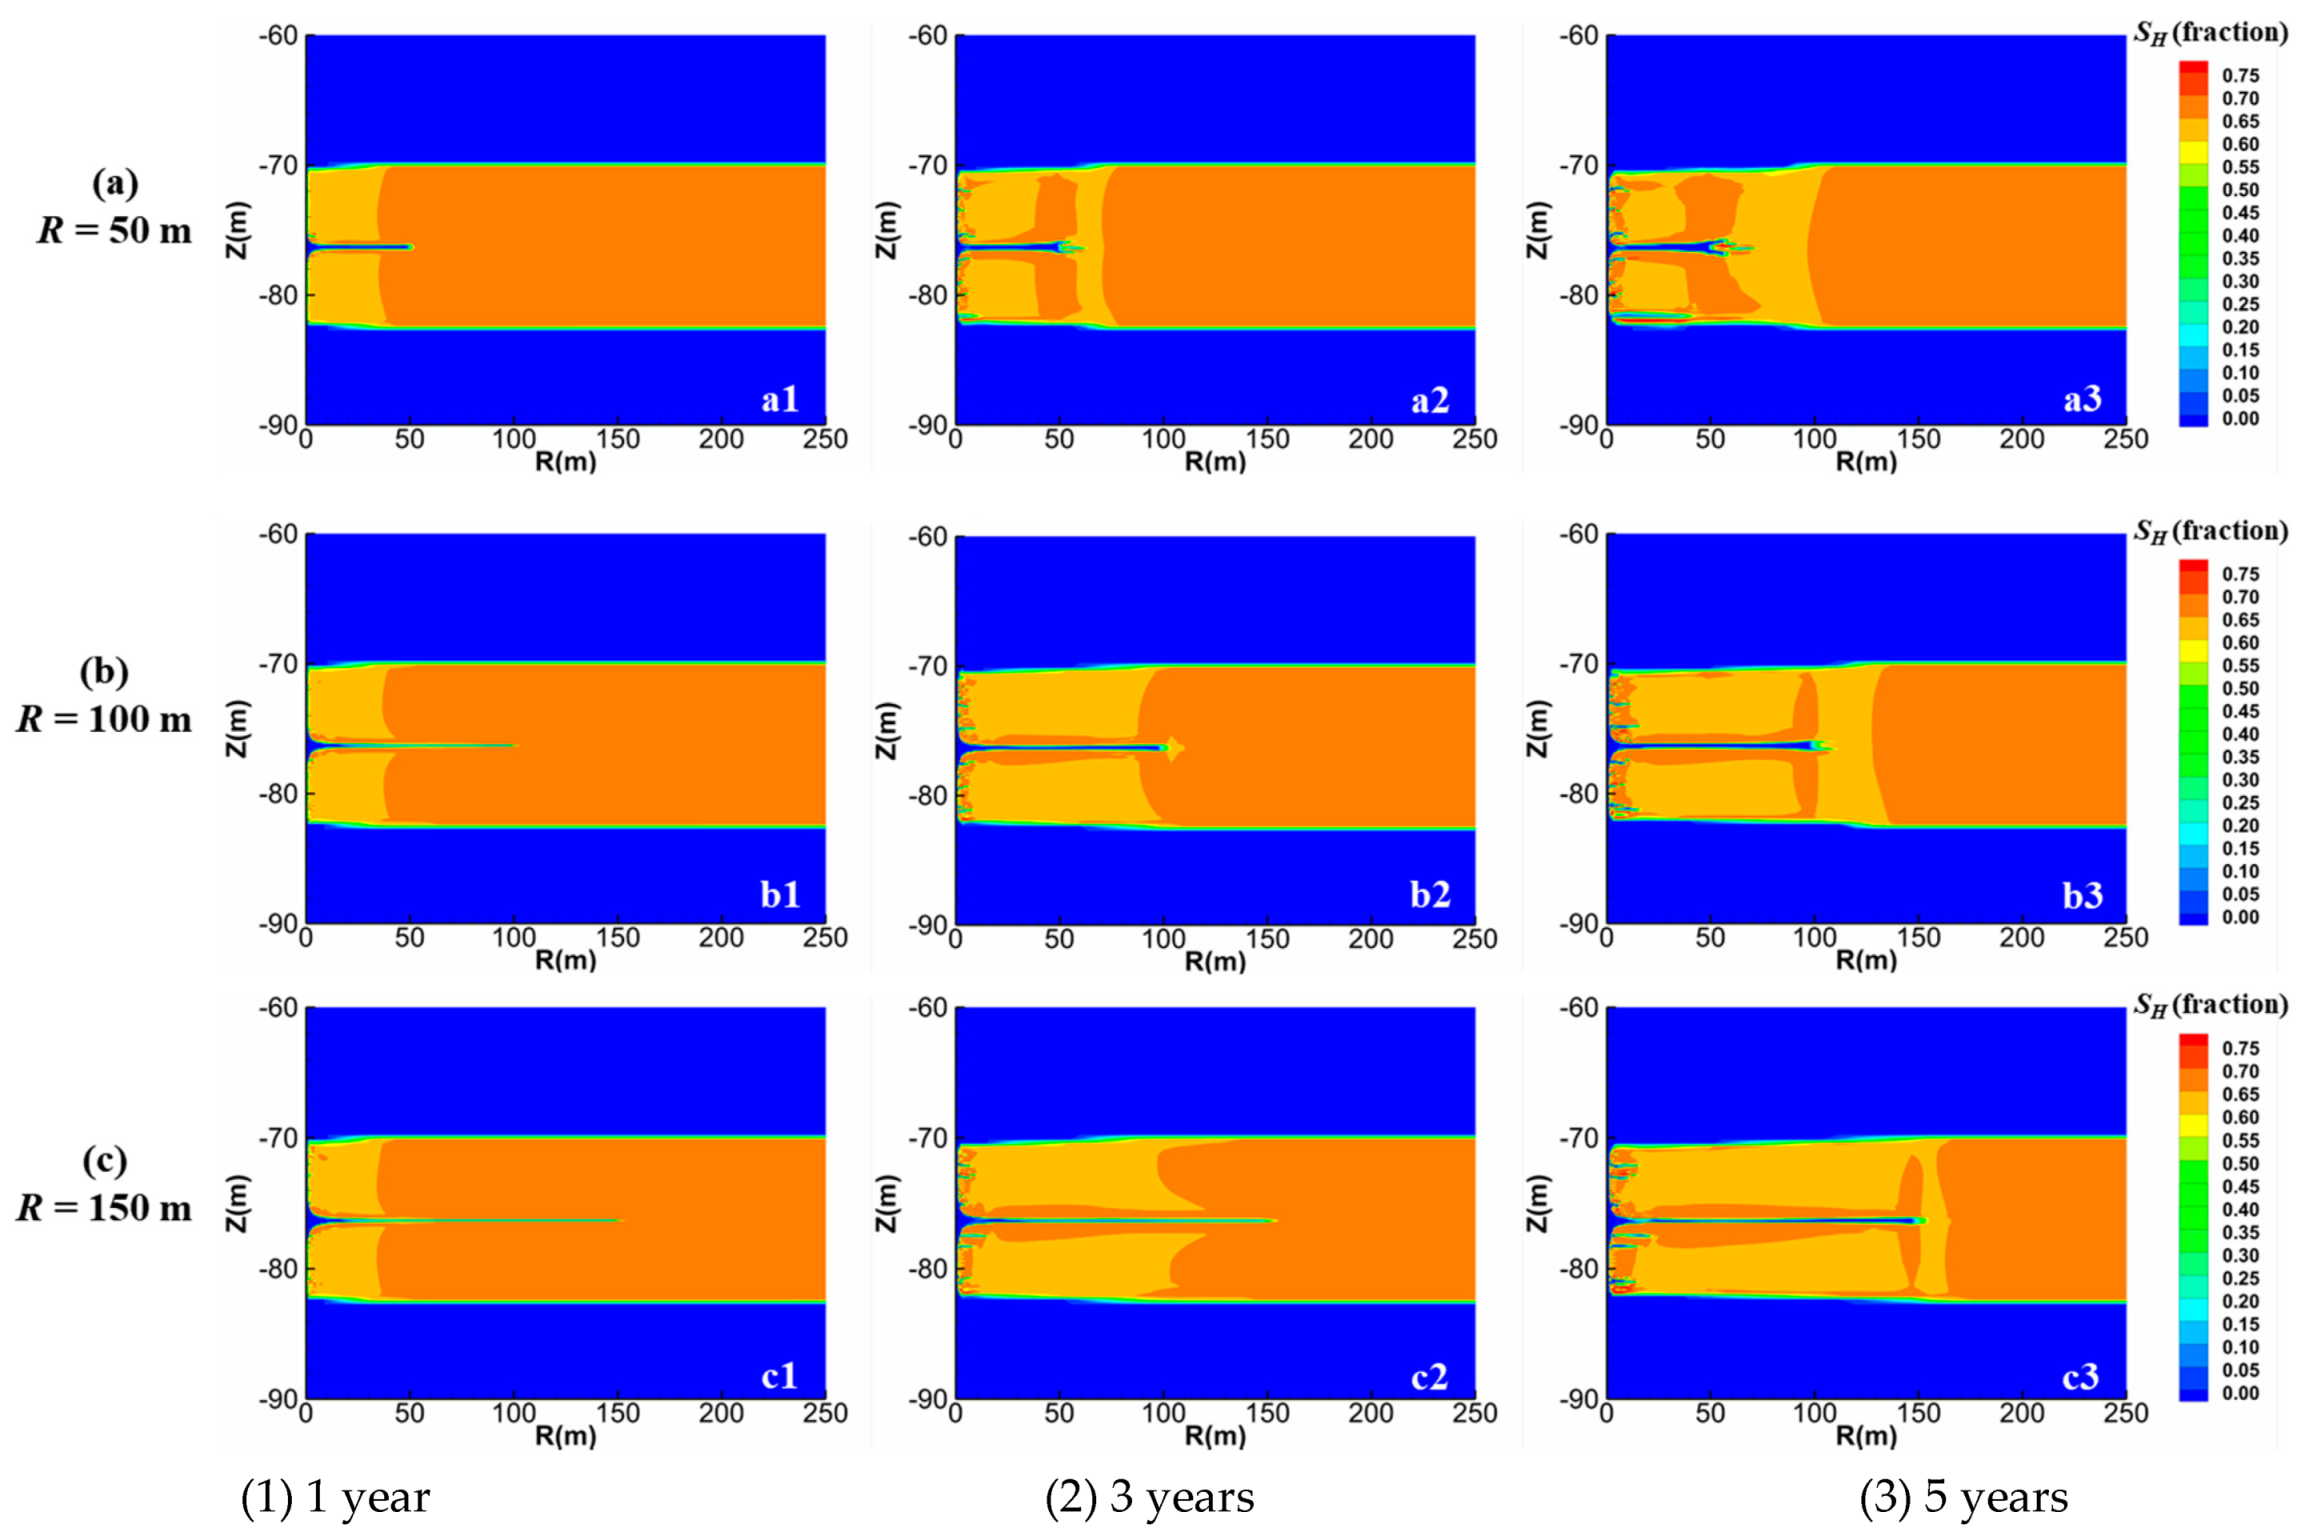
3.1.2. Evolution of Physical Property Distribution in Production Process

The evolution of the spatial distribution of hydrate saturation in the gas production process is shown in Figure 4, indicating that hydrate dissociation progresses over time. As illustrated in the first column of Figure 4, i.e., a1, b1, and c1, after gas production for 1 year, a similar dissociation front can be found for all cases due to limited hydrate dissociation. This is the case up to point A in Figure 2, gas production rates with different fracture lengths are similar at this stage. After production lasts 3 years, the hydrate dissociation front progresses beyond the fracture when the fracture length is 50 m, as depicted in a2 in Figure 4. In this case, flow channels for gas production are insufficient in the shortest length case, and the gas production rate is limited, compared with longer fracture cases. Therefore, after point A in Figure 2, the gas production rate in the case with a fracture length of 50 m lags behind the other two cases. Similarly, after 5-year gas production, 150 m long fracture can provide the most flow channels for gas migration and yield the highest gas production rate. Therefore, the effect of fracture length on production is closely related to the time frame of production. This finding implies that the fracture length should be designed properly according to the expected production time to better balance the production performance and the cost of artificially fracturing operations.
Detailed analyses of the spatial distributions of hydrate saturation evolution in the base case are depicted in Figure 5. As shown in the figure, hydrate dissociates around the fracture heterogeneously in the production process, and the hydrate dissociation area expands in both vertical and radial directions. This is because hydrate dissociation around the fracture will increase the permeability of hydrate-bearing layer; thus, new flow channels for gas and water migration are generated. As a result, the dissociation of hydrate is accelerated, and the gas production rate is enhanced. It is noteworthy that through the simulation, almost no secondary hydrate formation in the fracture is observed, and the fracture conductivity is kept high, good for long-term industrial production.
The distributions of physical properties of the hydrate-bearing sediments can offer detailed information to interpret the phenomenon of increase in gas production by artificial fracture. In our simulation, the evolutions of the spatial distributions of pressure, temperature, and gas saturation after 5 years of gas production were monitored, as shown in Figure 6. According to the pressure distributions, shown in all of the three cases in Figure 6a, the pressure decrease propagates laterally within the hydrate layer due to the impermeability of the hydrate-free layers. As the dissociation process of gas hydrate is endothermic, it can be inferred from Figure 6b that hydrate dissociation happens around the perforated interval with the largest temperature drop. Moreover, from the spatial distributions of gas saturation in Figure 6c, remarkable gas accumulation between the artificial fracture and boundary layers can be found. The results obtained from Figure 6 support the aforementioned findings that the highest gas production rate after 5 years of gas production appears when the fracture length is 150 m. As with the fracture, length increases, the scope of influence of pressure and temperature drop both increase, and maximum extra gas flow channels are generated by the artificial fracture in this case.

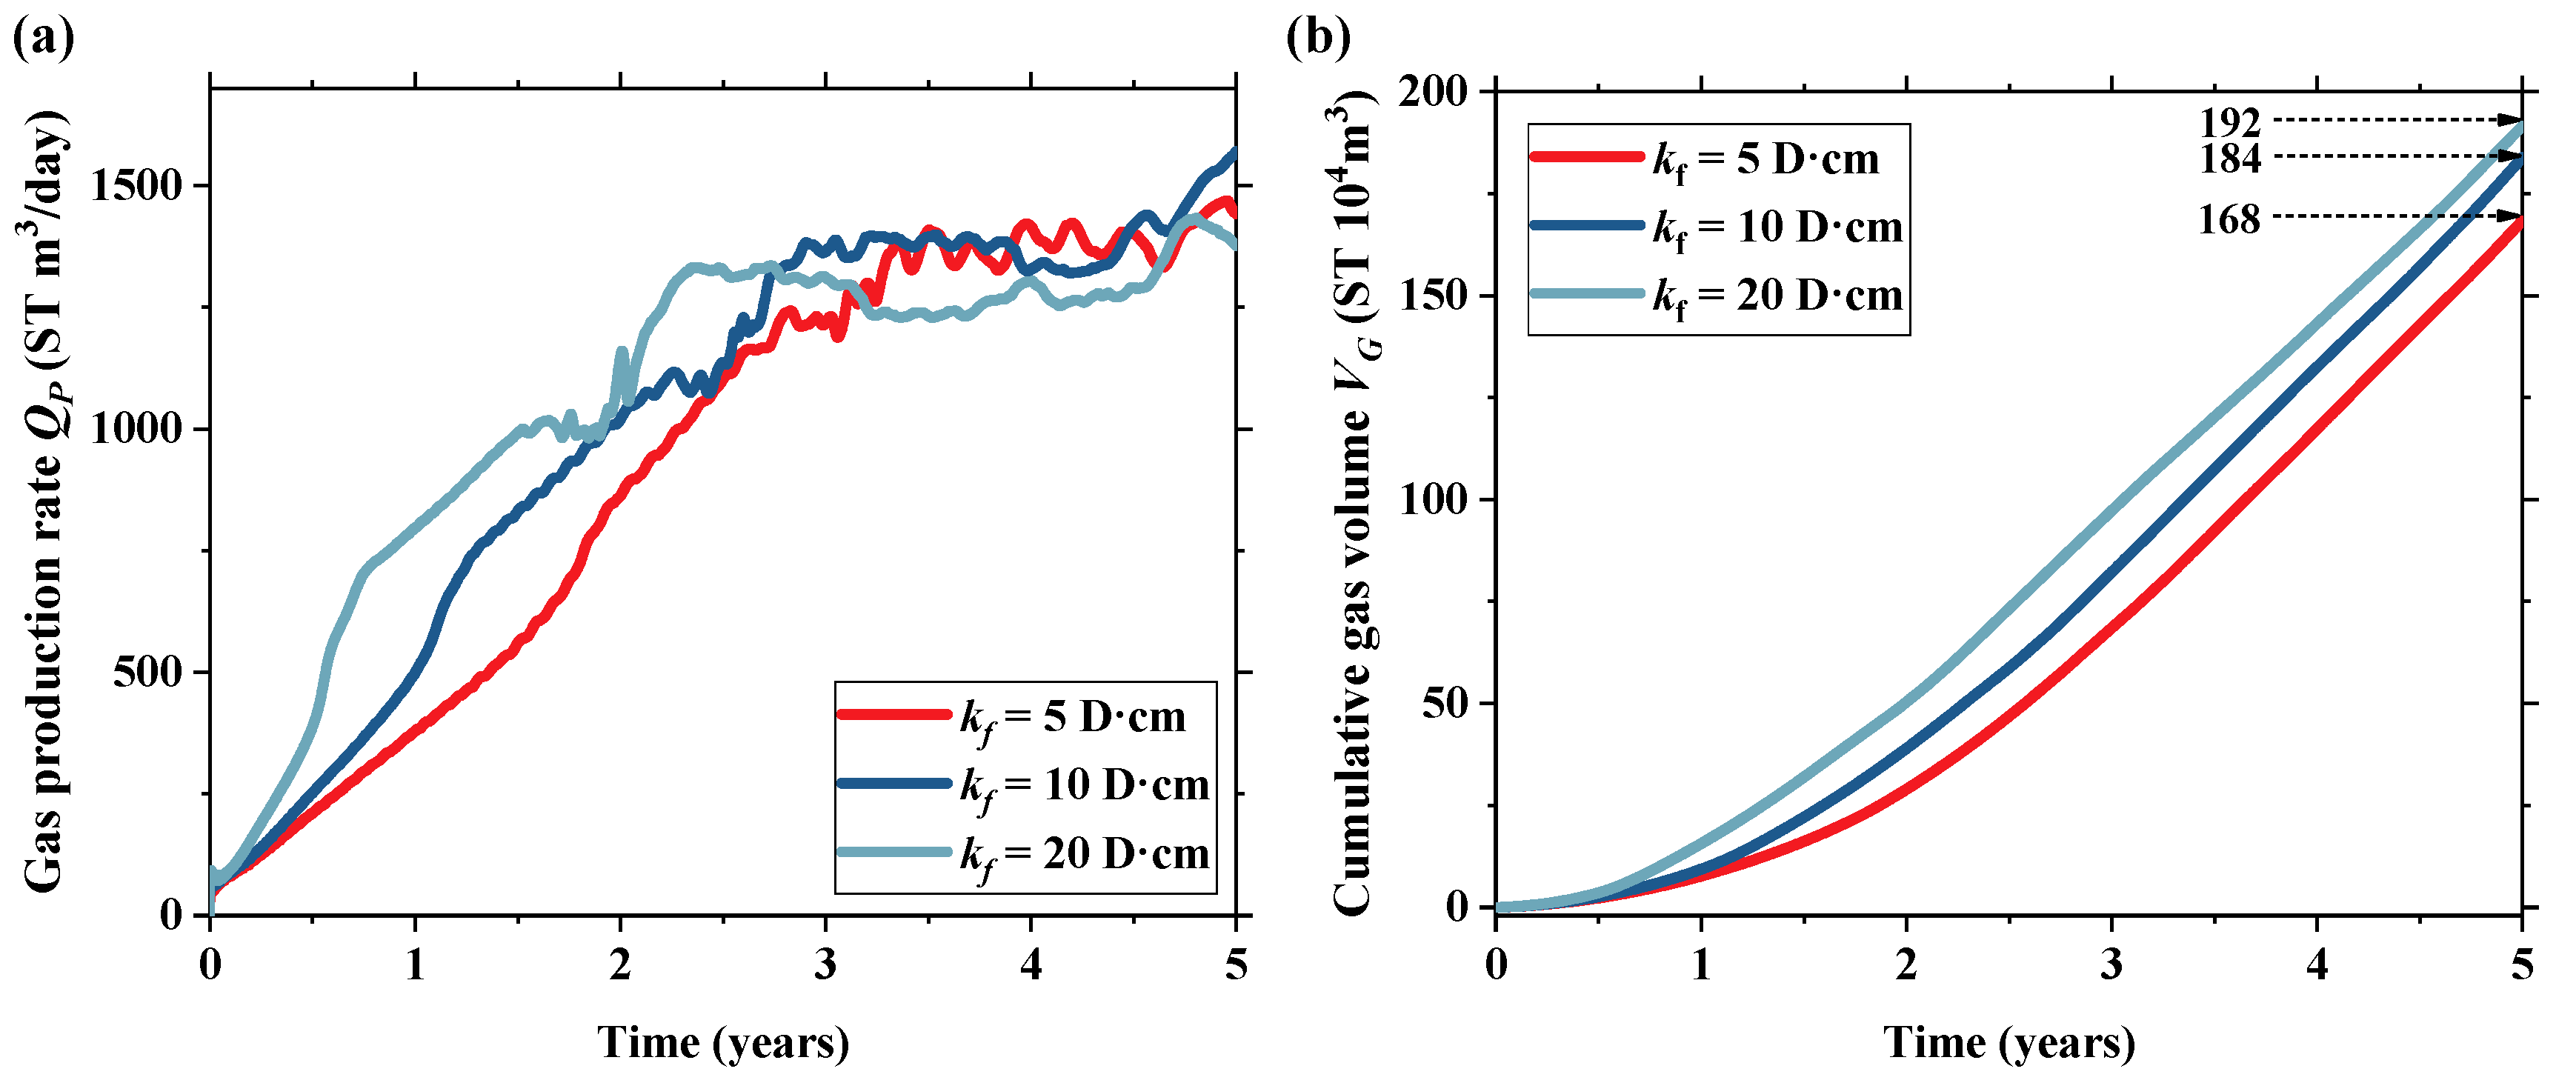
3.2. Effect of Fracture Conductivity on Production Performance

To investigate the effect of fracture conductivity on production behavior, the length of fracture was taken as the same value of 100 m. As indicated in group B of Table 3, the conditions of three fracture conductivities were investigated, and the gas production performances were compared accordingly.
The gas production rates and cumulative gas production volumes are shown in Figure 7 for different conductivity values at a fracture length of 100 m. As can be found, the gas production rate increases over time in all of the three cases, although the magnitude of enhancement is somewhat limited. After 5 years of production, the cumulative gas production volumes of three cases are 168 × 104 ST m3, 184 × 104 ST m3, and 192 × 104 ST m3, respectively. To make a quantitative comparison, the gas production volume increment from the conductivity of 5 D · cm to 10 D · cm is 16 × 104 ST m3, corresponding to 9.5% of enhancement. When the conductivity is doubled to 20 D · cm , the growth rate is only 4.3%, with 8 × 10⁴ ST m3 increased. In other words, the fracture with higher fracture conductivity can reduce the fluid flow resistance, then hydrate dissociation can be accelerated by lowering the pressure in fracture. However, this enhancement effect will be compromised because of the reservoir hydrate-bearing permeability improvement induced by hydrate dissociation around the fracture. Based on the simulation results, increasing the fracture conductivity may have limited influence on improving gas production performance. Therefore, in practical gas hydrate production, fracture conductivity should be designed to better balance the cost for increasing the fracture conductivity and the return from gas production increase.
Industrial exploitation of natural gas hydrate requires long-term and efficient production, some factors related to fracturing should be considered. For example, as the reservoir pressure drops with gas production, the effective pressure may increase to induce fracture closure [47]. Moreover, the deformation of sediment induced by hydrate dissociation [48] can result in a decrease in fracture conductivity. In such conditions, how to maintain fracture conductivity is challenging in long-term industrial production. As a result, further understanding of the interaction between the artificial fracture and the gas production process should be investigated through numerical and practical approaches. Furthermore, horizontal wells [49] and multi-well [50] configurations can be employed to enhance gas production rate to achieve commercial exploitation of hydrate reservoir.

4. Conclusions

To study the effect of fracture length and conductivity on gas production performances from an artificially fractured hydrate reservoir, a hypothetical model of fractured Class 3 hydrate reservoir was established, and numerical simulations were conducted. The following conclusions can be made from the simulation results obtained:
(1)
An artificial fracture can enhance the gas production rate, and the enhancement effect will be more pronounced with increasing fracture length. However, the effect of fracture length on production is closely related to the time frame of production, and the benefits from larger fracture length are not presented at the early production stage.
(2)
The enhancement effect of artificial fracture results from the extra flow channels provided by the fractures. The fracture acts as a flow channel, and the hydrate dissociation is accelerated with increased permeability of hydrate-bearing sediments in the dissociation area.
(3)
New flow channels for gas and water migration are generated in the area adjacent to artificial fracture, which helps gas migrate into the wellbore.
(4)
It is found that the secondary hydrate formation is absent in the artificial fracture, and its high conductivity will not be compromised during the entire simulation period.
(5)
The effect of the artificial fracture conductivity is limited in enhancing the gas production rate. As a result, fracture length and conductivity should be designed properly in practical production projects to balance cost and benefit.

Author Contributions

Conceptualization, S.S. and H.L.; methodology, S.S.; formal analysis, S.S. and L.G.; investigation, S.S.; data curation, S.S. and L.G.; writing—original draft preparation, S.S.; writing—review and editing, L.G. and H.L.; visualization, S.S.; supervision, H.L.; project administration, H.L.; funding acquisition, H.L. All authors have read and agreed to the published version of the manuscript.

Funding

This research was funded by the China Geological Survey, Grant Number DD20190234.

Conflicts of Interest

The authors declare no conflict of interest.

References

  1. Sloan, E.D. Fundamental principles and applications of natural gas hydrates. Nature 2003, 426, 353–359. [Google Scholar] [CrossRef]
  2. Koh, C.A. Towards a fundamental understanding of natural gas hydrates. Chem. Soc. Rev. 2002, 31, 157–167. [Google Scholar] [CrossRef]
  3. Decourt, B.; Alias, S.; Debarre, R.; Askew, P. Taking the heat out of the burning-ice debate: Potential and future of gas hydrates. In Proceedings of the SPE Asia Pacific Unconventional Resources Conference and Exhibition, Brisbane, Australia, 9–11 November 2015. [Google Scholar]
  4. Ruppel, C.D.; Kessler, J.D. The interaction of climate change and methane hydrates. Rev. Geophys. 2017, 55, 126–168. [Google Scholar] [CrossRef]
  5. Liu, L.P.; Sun, Z.L.; Zhang, L.; Wu, N.Y.; Qin, Y.C.; Jiang, Z.Z.; Geng, W.; Cao, H.; Zhang, X.L.; Zhai, B.; et al. Progress in Global Gas Hydrate Development and Production as a New Energy Resource. Acta Geol. Sin. 2019, 93, 731–755. [Google Scholar] [CrossRef]
  6. Kurihara, M.; Sato, A.; Funatsu, K.; Ouchi, H.; Yamamoto, K.; Numasawa, M.; Ebinuma, T.; Narita, H.; Masuda, Y.; Dallimore, S.R.; et al. Analysis of production data for 2007/2008 Mallik gas hydrate production tests in Canada. In Proceedings of the International Oil and Gas Conference and Exhibition in China, China, Beijing, 8–10 June 2010. [Google Scholar]
  7. Boswell, R.; Schoderbek, D.; Collett, T.S.; Ohtsuki, S.; White, M.; Anderson, B.J. The Iġnik Sikumi field experiment, Alaska North Slope: Design, operations, and implications for CO2-CH4 exchange in gas hydrate reservoirs. Energy Fuels 2017, 31, 140–153. [Google Scholar] [CrossRef]
  8. Konno, Y.; Fujii, T.; Sato, A.; Akamine, K.; Naiki, M.; Masuda, Y.; Yamamoto, K.; Nagao, J. Key findings of the world’s first offshore methane hydrate production test off the coast of Japan: Toward future commercial production. Energy Fuels 2017, 31, 2607–2616. [Google Scholar] [CrossRef]
  9. Yamamoto, K.; Wang, X.X.; Tamaki, M.; Suzuki, K. The second offshore production of methane hydrate in the Nankai Trough and gas production behavior from a heterogeneous methane hydrate reservoir. RSC Adv. 2019, 9, 25987–26013. [Google Scholar] [CrossRef] [Green Version]
  10. Li, J.; Ye, J.; Qin, X.; Qiu, H.; Wu, N.; Lu, H.; Xie, W.; Lu, J.; Peng, F.; Xu, Z.; et al. The first offshore natural gas hydrate production test in South China Sea. China Geol. 2018, 1, 5–16. [Google Scholar] [CrossRef]
  11. Ye, J.; Qin, X.; Xie, W.; Lu, H.; Ma, B.; Qiu, H.; Liang, J.; Lu, J.; Kuang, Z.; Lu, C.; et al. The second natural gas hydrate production test in the South China Sea. China Geol. 2020, 3, 197–209. [Google Scholar] [CrossRef]
  12. Wang, D.; Wang, C.; Li, C.; Liu, C.; Lu, H.; Wu, N.; Hu, G.; Liu, L.; Meng, Q. Effect of gas hydrate formation and decomposition on flow properties of fine-grained quartz sand sediments using X-ray CT based pore network model simulation. Fuel 2018, 226, 516–526. [Google Scholar] [CrossRef]
  13. Wang, L.; Gu, L.; Lu, H. Sediment permeability change on natural gas hydrate dissociation induced by depressurization. China Geol. 2020, 3, 221–229. [Google Scholar] [CrossRef]
  14. Mayerhofer, M.J.; Lolon, E.; Warpinski, N.R.; Cipolla, C.L.; Walser, D.W.; Rightmire, C.M. What Is Stimulated Reservoir Volume? SPE Prod. Oper. 2010, 25, 89–98. [Google Scholar] [CrossRef]
  15. Chen, L.; Yamada, H.; Kanda, Y.; Okajima, J.; Komiya, A.; Maruyama, S. Investigation on the dissociation flow of methane hydrate cores: Numerical modeling and experimental verification. Chem. Eng. Sci. 2017, 163, 31–43. [Google Scholar] [CrossRef]
  16. Too, J.L.; Cheng, A.; Khoo, B.C.; Palmer, A.; Linga, P. Hydraulic fracturing in a penny-shaped crack. Part I: Methodology and testing of frozen sand. J. Nat. Gas Sci. Eng. 2018, 52, 609–618. [Google Scholar] [CrossRef]
  17. Too, J.L.; Cheng, A.; Khoo, B.C.; Palmer, A.; Linga, P. Hydraulic fracturing in a penny-shaped crack. Part II: Testing the frackability of methane hydrate-bearing sand. J. Nat. Gas Sci. Eng. 2018, 52, 619–628. [Google Scholar] [CrossRef]
  18. Liu, X.; Sun, Y.; Guo, T.; Rabiei, M.; Qu, Z.; Hou, J. Numerical Simulations of Hydraulic Fracturing in Methane Hydrate Reservoirs Based on the Coupled Thermo-Hydrologic-Mechanical-Damage (THMD) Model. Energy 2021, 122054. [Google Scholar] [CrossRef]
  19. Ito, T.; Igarashi, A.; Suzuki, K.; Nagakubo, S.; Matsuzawa, M.; Yamamoto, K. Laboratory Study of Hydraulic Fracturing Behavior in Unconsolidated Sands for Methane Hydrate Production. In Proceedings of the Offshore Technology Conference, Houston, TX, USA, 5–8 May 2008. [Google Scholar]
  20. Ito, T.; Narita, H. Laboratory Study for Pore Water Effect on Hydraulically-induced Fracture Behavior in Unconsolidated Sands. In Proceedings of the 48th U.S. Rock Mechanics/Geomechanics Symposium, Minneapolis, MN, USA, 18 August 2014. [Google Scholar]
  21. Konno, Y.; Jin, Y.; Yoneda, J.; Uchiumi, T.; Shinjou, K.; Nagao, J. Hydraulic fracturing in methane-hydrate-bearing sand. RSC Adv. 2016, 6, 73148–73155. [Google Scholar] [CrossRef] [Green Version]
  22. Chen, C.; Yang, L.; Jia, R.; Sun, Y.; Guo, W.; Chen, Y.; Li, X. Simulation Study on the Effect of Fracturing Technology on the Production Efficiency of Natural Gas Hydrate. Energies 2017, 10, 1241. [Google Scholar] [CrossRef]
  23. Feng, Y.; Chen, L.; Suzuki, A.; Kogawa, T.; Okajima, J.; Komiya, A.; Maruyama, S. Enhancement of gas production from methane hydrate reservoirs by the combination of hydraulic fracturing and depressurization method. Energy Convers. Manage. 2019, 184, 194–204. [Google Scholar] [CrossRef]
  24. Adachi, J.; Siebrits, E.; Peirce, A.; Desroches, J. Computer simulation of hydraulic fractures. Int. J. Rock Mech. Min. Sci. 2007, 44, 739–757. [Google Scholar] [CrossRef]
  25. Konno, Y.; Masuda, Y.; Akamine, K.; Naiki, M.; Nagao, J. Sustainable gas production from methane hydrate reservoirs by the cyclic depressurization method. Energy Convers. Manag. 2016, 108, 439–445. [Google Scholar] [CrossRef]
  26. Moridis, G.J.; Collett, T.; Boswell, R.; Kurihara, M.; Reagan, M.T.; Koh, C.; Sloan, E.D. Toward Production From Gas Hydrates: Current Status, Assessment of Resources, and Simulation-Based Evaluationof Technology and Potential. SPE Reserv. Eval. Eng. 2009, 12, 745–771. [Google Scholar] [CrossRef] [Green Version]
  27. Moridis, G.J. Numerical Studies of Gas Production From Class 2 and Class 3 Hydrate Accumulations at the Mallik Site, Mackenzie Delta, Canada. SPE Reserv. Eval. Eng. 2004, 7, 175–183. [Google Scholar] [CrossRef]
  28. Anderson, B.; Hancock, S.; Wilson, S.; Enger, C.; Collett, T.; Boswell, R.; Hunter, R. Formation pressure testing at the Mount Elbert Gas Hydrate Stratigraphic Test Well, Alaska North Slope: Operational summary, history matching, and interpretations. Mar. Pet. Geol. 2011, 28, 478–492. [Google Scholar] [CrossRef]
  29. Anderson, B.J.; Kurihara, M.; White, M.D.; Moridis, G.J.; Wilson, S.J.; Pooladi-Darvish, M.; Gaddipati, M.; Masuda, Y.; Collett, T.S.; Hunter, R.B.; et al. Regional long-term production modeling from a single well test, Mount Elbert Gas Hydrate Stratigraphic Test Well, Alaska North Slope. Mar. Pet. Geol. 2011, 28, 493–501. [Google Scholar] [CrossRef]
  30. Kurihara, M.; Sato, A.; Funatsu, K.; Ouchi, H.; Masuda, Y.; Narita, H.; Collett, T.S. Analysis of formation pressure test results in the Mount Elbert methane hydrate reservoir through numerical simulation. Mar. Pet. Geol. 2011, 28, 502–516. [Google Scholar] [CrossRef]
  31. Winters, W.; Walker, M.; Hunter, R.; Collett, T.; Boswell, R.; Rose, K.; Waite, W.; Torres, M.; Patil, S.; Dandekar, A. Physical properties of sediment from the Mount Elbert Gas Hydrate Stratigraphic Test Well, Alaska North Slope. Mar. Pet. Geol. 2011, 28, 361–380. [Google Scholar] [CrossRef] [Green Version]
  32. Lu, H.; Lorenson, T.D.; Moudrakovski, I.L.; Ripmeester, J.A.; Collett, T.S.; Hunter, R.B.; Ratcliffe, C.I. The characteristics of gas hydrates recovered from the Mount Elbert Gas Hydrate Stratigraphic Test Well, Alaska North Slope. Mar. Pet. Geol. 2011, 28, 411–418. [Google Scholar] [CrossRef] [Green Version]
  33. Moridis, G.J.; Kowalsky, M.B.; Pruess, K. TOUGH+Hydrate v1.0 User’s Manual: A Code for the Simulation of System Behavior in Hydrate-Bearing Geologic Media; Lawrence Berkeley National Laboratory: Berkeley, CA, USA, 2008.
  34. White, M.D.; Kneafsey, T.J.; Seol, Y.; Waite, W.F.; Uchida, S.; Lin, J.S.; Myshakin, E.M.; Gai, X.; Gupta, S.; Reagan, M.T.; et al. An international code comparison study on coupled thermal, hydrologic and geomechanical processes of natural gas hydrate-bearing sediments. Mar. Pet. Geol. 2020, 120, 104566. [Google Scholar] [CrossRef]
  35. Yin, Z.; Moridis, G.; Tan, H.K.; Linga, P. Numerical analysis of experimental studies of methane hydrate formation in a sandy porous medium. Appl. Energy 2018, 220, 681–704. [Google Scholar] [CrossRef] [Green Version]
  36. Bei, K.; Xu, T.; Shang, S.; Wei, Z.; Yuan, Y.; Tian, H. Numerical Modeling of Gas Migration and Hydrate Formation in Heterogeneous Marine Sediments. J. Mar. Sci. Eng. 2019, 7, 348. [Google Scholar] [CrossRef] [Green Version]
  37. Zhu, H.; Xu, T.; Zhu, Z.; Yuan, Y.; Tian, H. Numerical modeling of methane hydrate accumulation with mixed sources in marine sediments: Case study of Shenhu Area, South China Sea. Mar. Geol. 2020, 423, 106142. [Google Scholar] [CrossRef]
  38. Sun, J.; Zhang, L.; Ning, F.; Lei, H.; Liu, T.; Hu, G.; Lu, H.; Lu, J.; Liu, C.; Jiang, G.; et al. Production potential and stability of hydrate-bearing sediments at the site GMGS3-W19 in the South China Sea: A preliminary feasibility study. Mar. Pet. Geol. 2017, 86, 447–473. [Google Scholar] [CrossRef]
  39. Reagan, M.T.; Queiruga, A.F.; Moridis, G.J. Simulation of Gas Production from Multilayered Hydrate-Bearing Media with Fully Coupled Flow, Thermal, Chemical and Geomechanical Processes Using TOUGH+Millstone. Part 3: Production Simulation Results. Transp. Porous Media 2019, 129, 179–202. [Google Scholar] [CrossRef] [Green Version]
  40. Kowalsky, M.B.; Moridis, G.J. Comparison of kinetic and equilibrium reaction models in simulating gas hydrate behavior in porous media. Energy Convers. Manag. 2007, 48, 1850–1863. [Google Scholar] [CrossRef] [Green Version]
  41. Zhang, Y.; Zhang, J.; Yuan, B.; Yin, S. In-situ stresses controlling hydraulic fracture propagation and fracture breakdown pressure. J. Pet. Sci. Eng. 2018, 164, 164–173. [Google Scholar] [CrossRef]
  42. Lin, M.; Chen, S.; Ding, W.; Chen, Z.; Xu, J. Effect of Fracture Geometry on Well Production in Hydraulic-Fractured Tight Oil Reservoirs. J. Can. Pet. Technol. 2015, 54, 183–194. [Google Scholar] [CrossRef]
  43. Rubin, B. Accurate Simulation of Non Darcy Flow in Stimulated Fractured Shale Reservoirs. In Proceedings of the SPE Western Regional Meeting, Anaheim, CA, USA, 1 January 2010. [Google Scholar]
  44. van Genuchten, M.T. A closed-form equation for predicting the hydraulic conductivity of unsaturated soils. Soil Sci. Soc. Am. J. 1980, 44, 892–898. [Google Scholar] [CrossRef] [Green Version]
  45. Wang, M.; Leung, J.Y. Numerical Investigation of Coupling Multiphase Flow and Geomechanical Effects on Water Loss during Hydraulic-Fracturing Flowback Operation. SPE Reserv. Eval. Eng. 2016, 19, 520–537. [Google Scholar] [CrossRef]
  46. Song, H.; Yu, M.; Zhu, W.; Wu, P.; Lou, Y.; Wang, Y.; Killough, J. Numerical investigation of gas flow rate in shale gas reservoirs with nanoporous media. Int. J. Heat Mass Transf. 2015, 80, 626–635. [Google Scholar] [CrossRef]
  47. Davies, D.R.; Kuiper, T.O.H. Fracture Conductivity in Hydraulic Fracture Stimulation. J. Pet. Technol. 1988, 40, 550–552. [Google Scholar] [CrossRef]
  48. Rutqvist, J.; Moridis, G.J. Numerical Studies on the Geomechanical Stability of Hydrate-Bearing Sediments. SPE J. 2009, 14, 267–282. [Google Scholar] [CrossRef]
  49. Shang, S.; Gu, L.; Lu, H. Numerical study of gas production from a methane hydrate reservoir by depressurization with multi-wells. Acta Geol. Sin. 2021, 95, 928–936. [Google Scholar] [CrossRef]
  50. Shang, S.; Gu, L.; Zhan, L.; Qiu, H.; Lu, H. Application of horizontal well to gas production from a hydrate reservoir with free gas and high irreducible water. J. Nat. Gas Sci. Eng. 2021, 94, 104102. [Google Scholar] [CrossRef]
Figure 1. Schematic model of a hypothetical fractured Class 3 hydrate reservoir (not to scale). A hypothetical artificial fracture is located in the middle of hydrate-bearing layer. The yellow square mark is the monitoring point, which is adjacent to the fracture plane and 50 m away from the production well.
Energies 14 07513 g001
Figure 2. The gas production rates at different fracture lengths. ST, standard temperature, and pressure.
Energies 14 07513 g002
Figure 3. In the production process the evolution of (a) pressure (MPa) and (b) hydrate saturation (fraction) at the monitoring points that are 50 m away from the production well in the radial direction and adjacent to the fracture plane.
Energies 14 07513 g003
Figure 4. Evolution of the spatial distribution of hydrate saturation (fraction) at different fracture lengths.
Energies 14 07513 g004
Figure 5. The spatial distributions of hydrate saturation (fraction) in and around fracture for the base case A2.
Energies 14 07513 g005
Figure 6. Spatial distributions of the physical properties of sediments after 5 years of production (a) pressure (MPa); (b) temperature (°C); (c) gas saturation (fraction), while the fracture length is 50 m, 100 m, and 150 m.
Energies 14 07513 g006
Figure 7. Evolution of (a) gas production rate and (b) cumulative gas volume with different fracture conductivity at fracture length of 100 m. ST, standard temperature, and pressure.
Energies 14 07513 g007
Table 1. Reservoir properties of Mount Elbert C2 hydrate zone.
Reservoir LocationAlaska North Slope, USA
Reservoir classificationClass 3 hydrate reservoir
Reservoir depth~650 m
LithologyCoarse-grained sand sediment
Initial pressure (MPa)6.78 at the middle of hydrate-bearing layer
Initial temperature (°C)2.95 at the middle of hydrate-bearing layer
Intrinsic permeability (mD)Hydrate-bearing layer:
1000 (radial direction), 100 (vertical direction);
Hydrate-free layer: 0 (both radial and vertical direction)
Hydrate-bearing permeability (mD)Hydrate-bearing layer:
0.12 (radial direction), 0.012 (vertical direction)
PorosityHydrate-free layer: 0.10, Hydrate-bearing layer: 0.35
Initial saturationHydrate-free layer: water saturation S A = 1.0;
Hydrate-bearing layer:
water saturation S A = 0.35,
hydrate saturation S H = 0.65
Gas componentPure methane
Table 2. Hydraulic parameters of sediments and fracture.
ParametersSymbolsSedimentsFracture
Irreducible water saturation S i r A 0.2480.000
Irreducible gas saturation S i r G 0.0000.000
Relative permeability index for water n A 4.521.00
Relative permeability index for gas n G 3.161.00
Gas entry pressure P 0 985.2 Pa0 Pa
Capillary pressure index λ 0.7744
Maximum of water saturation S m x A 1.0
Table 3. The parameters for the numerical simulations to assess the effects of fracture length and conductivity on hydrate exploitation.
GroupCaseFracture LengthFracture ConductivityPhase in FractureRemarks
AA150 m1 × 10−13 m3 (10 D · cm ) S A = 1.0Fracture length effects
A2 (base case)100 m1 × 10−13 m3 (10 D · cm ) S A = 1.0
A3150 m1 × 10−13 m3 (10 D · cm ) S A = 1.0
BB1100 m5 × 10−14 m3 (5 D · cm ) S A = 1.0Fracture conductivity effects
B2100 m1 × 10−13 m3 (10 D · cm ) S A = 1.0
B3100 m2 × 10−13 m3 (20 D · cm ) S A = 1.0
Publisher’s Note: MDPI stays neutral with regard to jurisdictional claims in published maps and institutional affiliations.

