Article

Experimental Study on the Insulation Layer Thickness of a Novel Ice Coring Device in Loose Sandstone-Type Uranium Deposits

1
College of Construction Engineering, Jilin University, Changchun 130026, China
2
No. 240 Research Institute of Nuclear, CNNC, Shenyang 110141, China
3
State Key Laboratory of Coal Mine Disaster Dynamics and Control, College of Resources and Safety Science, Chongqing University, Chongqing 400044, China
*
Authors to whom correspondence should be addressed.
Energies 2021, 14(21), 7448; https://doi.org/10.3390/en14217448
Submission received: 23 September 2021 / Revised: 5 November 2021 / Accepted: 5 November 2021 / Published: 8 November 2021

Abstract

:
The target strata of sandstone-type uranium deposits are usually located in the fragile and loose strata, which makes it difficult to obtain core samples; consequently, a novel ice coring device for loose sandstone-type uranium deposits is proposed to solve this problem. Experiments proved that the artificial sample can replace the natural sample, and the coring method has high reliability. Ensuring the allegro formation of an ice valve with a given cold source is critical for this coring system, and reducing the loss of cold energy with help of insulation layer is one of the methods to speed up the formation of ice valve. Since the diameter of the drill tool is limited by its working scenario, the thickness of insulation layer is limited to ensure the size of core. Therefore, this paper conducted laboratory experiments of the insulation layer with different thicknesses to study the effect of the insulation layer on the formation of the sand–ice valve. Results show that the insulation layer can reduce the loss of cold energy during the freezing process and significantly affect the formation time of the sand–ice valve. When the thickness of the aerogel insulation layer is 2 mm, the freezing time is 44% shorter than that without insulation layer. According to the tests, the novel ice coring device is expected to solve the coring problem in loose sandstone-type uranium deposits.

1. Introduction

1.1. Background

Uranium is a vital strategic resource, which plays a significant constructive role in military and civilian uses [1]. As the number of nuclear power plants is increasing, the nuclear power capacity of China is growing rapidly. Nuclear power has excellent development potential in China, and the demand for uranium resources will increase significantly in the future [2,3]. Obtaining the core samples of the target strata is especially important to develop uranium resources better. The obtained core can be used to reflect the parameters of the strata lithology, and the parameters can evaluate resource reserve and determine exploration value [4,5,6,7]. The primary uranium deposits in China are sandstone-type, granite type, and silicate type, of which 43% are sandstone-type. It is difficult to obtain cores in sandstone strata which is loose, fragile, poor, or has no cementation [8,9,10,11,12]. At present, there are many coring barrels for loose sandstone-type uranium deposits. Three common coring barrels are listed in Table 1 [13]. These coring barrels are mechanical coring methods. It is difficult to obtain core in loose sandstone-type uranium deposits with these mechanical coring barrels. Therefore, a novel ice coring device utilizing frozen the core to achieve high core recovery percent is proposed.
Many scholars have carried out relevant studies on frozen sampling. Kenneth first put forward freezing sampling technology and designed the California sampler, which provided a potential solution for sampling undisturbed cohesive soil and sampling sediments in shallow lakes, reservoirs, and other waters [14]. Li et al. proposed a freeze-sediments valve to provide a potential solution for deep-sea microorganism sampling [15]. Luo et al. proposed a pressure coring device based on an ice valve for pressure coring in permafrost natural gas hydrate strata [16]. Wu et al. proposed a freeze core valve-based sampler for pressure coring in submarine sediments. A series of experiments were carried out on the pressure retention and adaptability of freezing core valve [17]. Lian et al. studied the growth rate of the ice valve area under different porosity at the bottom of the ice valve tube through numerical simulation and laboratory experiments [18]. Dück et al. proposed a novel freeze coring technique to preserve in situ formation characteristics and evaluated the influence of coring disturbances on bubble characterization [19]. Most of the studies are about the mechanism, performance, and adaptability of ice valves. The strata conditions of these studies are loose and fragile, which fully proved that the ice valve has an advantage in coring loose sandstone-type uranium deposits. Until now, there is no research on the application of freezing sampling to sandstone-type uranium strata. In this study, the freezing sampling technology is applied to sandstone-type uranium strata, and the insulation layer of the ice valve tube is optimized to realize the rapid formation of the sand–ice valve.

1.2. Brief Description of the Novel Ice Coring Device

The schematics of the novel ice coring device based on the swivel type double tube core barrel structure is illustrated in Figure 1. It is composed of triggering mechanism, single rotary mechanism, hall switch, battery, micro refrigeration compressor, ice valve tube, etc. The arrow in Figure 1 shows that the annulus gap between the outer tube and the ice valve tube is very small, only 5 mm. The drilling fluid flows in the annulus gap during drilling. The coring process includes drilling and the bottom core freezing. When the core tube is filled with the core, the drilling process is stopped and pitching is performed after turning on the pump for the freezing process. In this process, the triggering mechanism moves down under the pressure of drilling fluid. When the magnetic iron in the triggering mechanism approaches the Hall switch, the micro refrigeration compressor starts to work and the freezing process begins. Then, the pump would be turned off. Thus, in the freezing process, the drilling fluid located in the annular gap between the ice valve tube and the outer tube does not flow, which is beneficial to the quick formation of the sand–ice valve. In the novel ice coring device, a sand–ice valve made of saturated samples is used to support the core in the core tube. Unlike the mechanical valves, the novel ice coring device utilizes a sand–ice valve made of saturated samples to support the core. The advantages are as follows: (1) There is no step between the core tube and the bit, so the core can enter the core barrel smoothly to avoid the phenomenon of blocking. (2) Local freezing of the core with a height of 40 mm at the bottom has no disturbance to the upper core. (3) Avoiding core loss caused by a poor valve seal. (4) The cold source phase change process is carried out in a closed system not affected by bottom hole pressure.
The formation of the sand–ice valve by freezing the bottom core is a crucial step during the coring process, which determines whether the core can be obtained and coring efficiency. It is necessary to select a micro refrigeration compressor for the narrow compressor room of the novel ice coring device. The refrigeration capacity of the micro refrigeration compressor is limited. The refrigerant has heat exchange with the core. In addition, the refrigerant also has heat exchange with the drilling fluid locating the annulus gap between the ice valve tube and the outer tube by the ice valve tube. Reducing the heat exchange between the refrigerant and the drilling fluid located in the annular gap is the key to accelerating the formation of the sand–ice valve. During the freezing process, the loss of cold energy and the temperature change trend of the inner wall are variants with different insulation thicknesses. In addition, freezing sand–ice valve with ice valve tube involves double-phase change processes: liquid–gas phase change of refrigerant and liquid–solid phase change of water in the saturated sample. The thermal conductivity of the core varies with temperature during freezing. It is necessary to conduct experiments to explore the influence of the insulation layer on the sand–ice valve.

2. Experimental Method

2.1. Materials

The special double protection drilling fluid for loose sandstone-type uranium deposits was prepared to simulate the drilling environment of loose and fragile strata in sandstone-type uranium deposits. The drilling fluid composition is shown in Table 2 [20].
Given that the core of the target strata is precious and limited, we selected and analyzed the natural sample of a loose sandstone-type uranium deposit in Dongsheng district and prepared the same component artificial sample. The composition is shown in Table 3 [21].
Considering that the target strata is saturated with water caused by the water in the target strata [22]. In addition, the borehole filled with drilling fluid will also make the sample in a saturated state during the process of drilling. Related studies show that the saturation of the sample has a great influence on the mechanical properties of the ice valve, so it is necessary to prepare the sample saturated with water [23]. The schematics of preparing the sample is shown in Figure 2. The sample was placed in a vacuum cylinder and covered with the cylinder head. Subsequently, a vacuum pump was connected to the vacuum cylinder, valve 2 was opened, and valve 1 was closed. After that, the air in the sample was sucked out, and when the pressure was -0.1 MPa, valve 1 was opened for slow water injection. During water injection, the pressure gauge should be kept as constant as possible. When the sample is submerged, close valve 1. Then, open the cylinder cover and leave the sample at atmospheric pressure and room temperature for a period of time. The artificial sample prepared by this method is similar to the natural sample of the target strata [15]. We also processed natural samples by the above method.

2.2. Experimental Setup and Steps

The schematics of the experimental setup is illustrated in Figure 3. It consists of a battery, micro refrigeration compressor, discharge pipe, drier-filter, capillary pipe, sand–ice valve tube, suction pipe, multi-channel temperature recorder, and thermal imager.
The setup adopts a fully enclosed rotary DC micro refrigeration compressor manufactured by Gensheng Technology (Shenzhen) Co., Ltd. It has the advantages of low energy consumption, small volume, lightweight, and so on. The technical parameters are shown in Table 4. The refrigerant used in this experimental device is R134a, which is an efficient and safe refrigerant with a boiling point of −26.1 °C [24,25,26]. The micro refrigeration compressor, suction pipe with insulation layer and exhaust pipe were immersed in the drilling fluid to simulate the working environment. The compressed high temperature gas in the exhaust pipe is cooled. The drilling fluid can realize the condensing function. In addition, the exhaust pipe is coiled into a spiral to increase the heat exchange area between the exhaust pipe and the drilling fluid. Temperature monitoring points A, B, C, and D are set to record the transient temperature during the freezing process and the location relationship is shown in Figure 3. Points A and C are located at the inner wall. The average temperature of point A and point C was defined as the inner wall temperature. Point B is located in the central point of the core. The central point temperature is used to monitor the temperature during the freezing process and whether the freezing is completed. Point D located in the drilling fluid outside the ice valve tube is used to monitor the loss of cold energy. The multi-channel temperature recorder collects the temperature information every 2 s.
Conventional drilling tools do not involve heat exchange when coring and have no insulation layer, so there is no insulation layer as the control group in this study. The narrow annular gap between the ice valve tube and the outer tube is only 5 mm, and the drilling fluid flows during the drilling process. Therefore, the maximum thickness of the insulation layer in this study is set as 3 mm with a gradient of 0.5 mm. The insulation layer is made of high-quality aerogel insulation coating, with thermal conductivity as low as 0.03 W/(m·K), which has good water resistance, moisture resistance, wear resistance, and adhesion. The aerogel insulation coating is evenly coated on the outer side of the ice valve tube and processed to the required thickness after derusting and cleaning the ice valve tube. After that, the waterproof and protective treatments are carried out because the thermal conductivity of the aerogel insulation coating is sensitive to humidity [27].
In view of the limited refrigeration capacity of the micro refrigeration compressor and the inevitable disturbance to the core caused by freezing the core, we hope that the freezing height should be as short as possible. Therefore, the sample height was set to 40 mm to minimize the core disturbance caused by freezing. An ice valve tube with a 40 mm height sample was placed in the drilling fluid for each test. The initial temperature of the sample and drilling fluid was 24 °C. The drilling fluid height is consistent with the sample height. After that, turn on the power supply for the freezing experiment. The compressed and condensed liquid refrigerant enters the evaporation chamber from the capillary. The temperature of the evaporation chamber drops sharply after the refrigerant vaporizes and absorbs a large amount of heat in the evaporation chamber for a sharp increase of volume. The refrigerant has heat exchange with the core through the inner wall and freezes to form a sand–ice valve. Then, the vaporized gaseous refrigerant in the evaporation chamber returns to the micro refrigeration compressor through the suction pipe for compression and circulation.

3. Results and Discussions

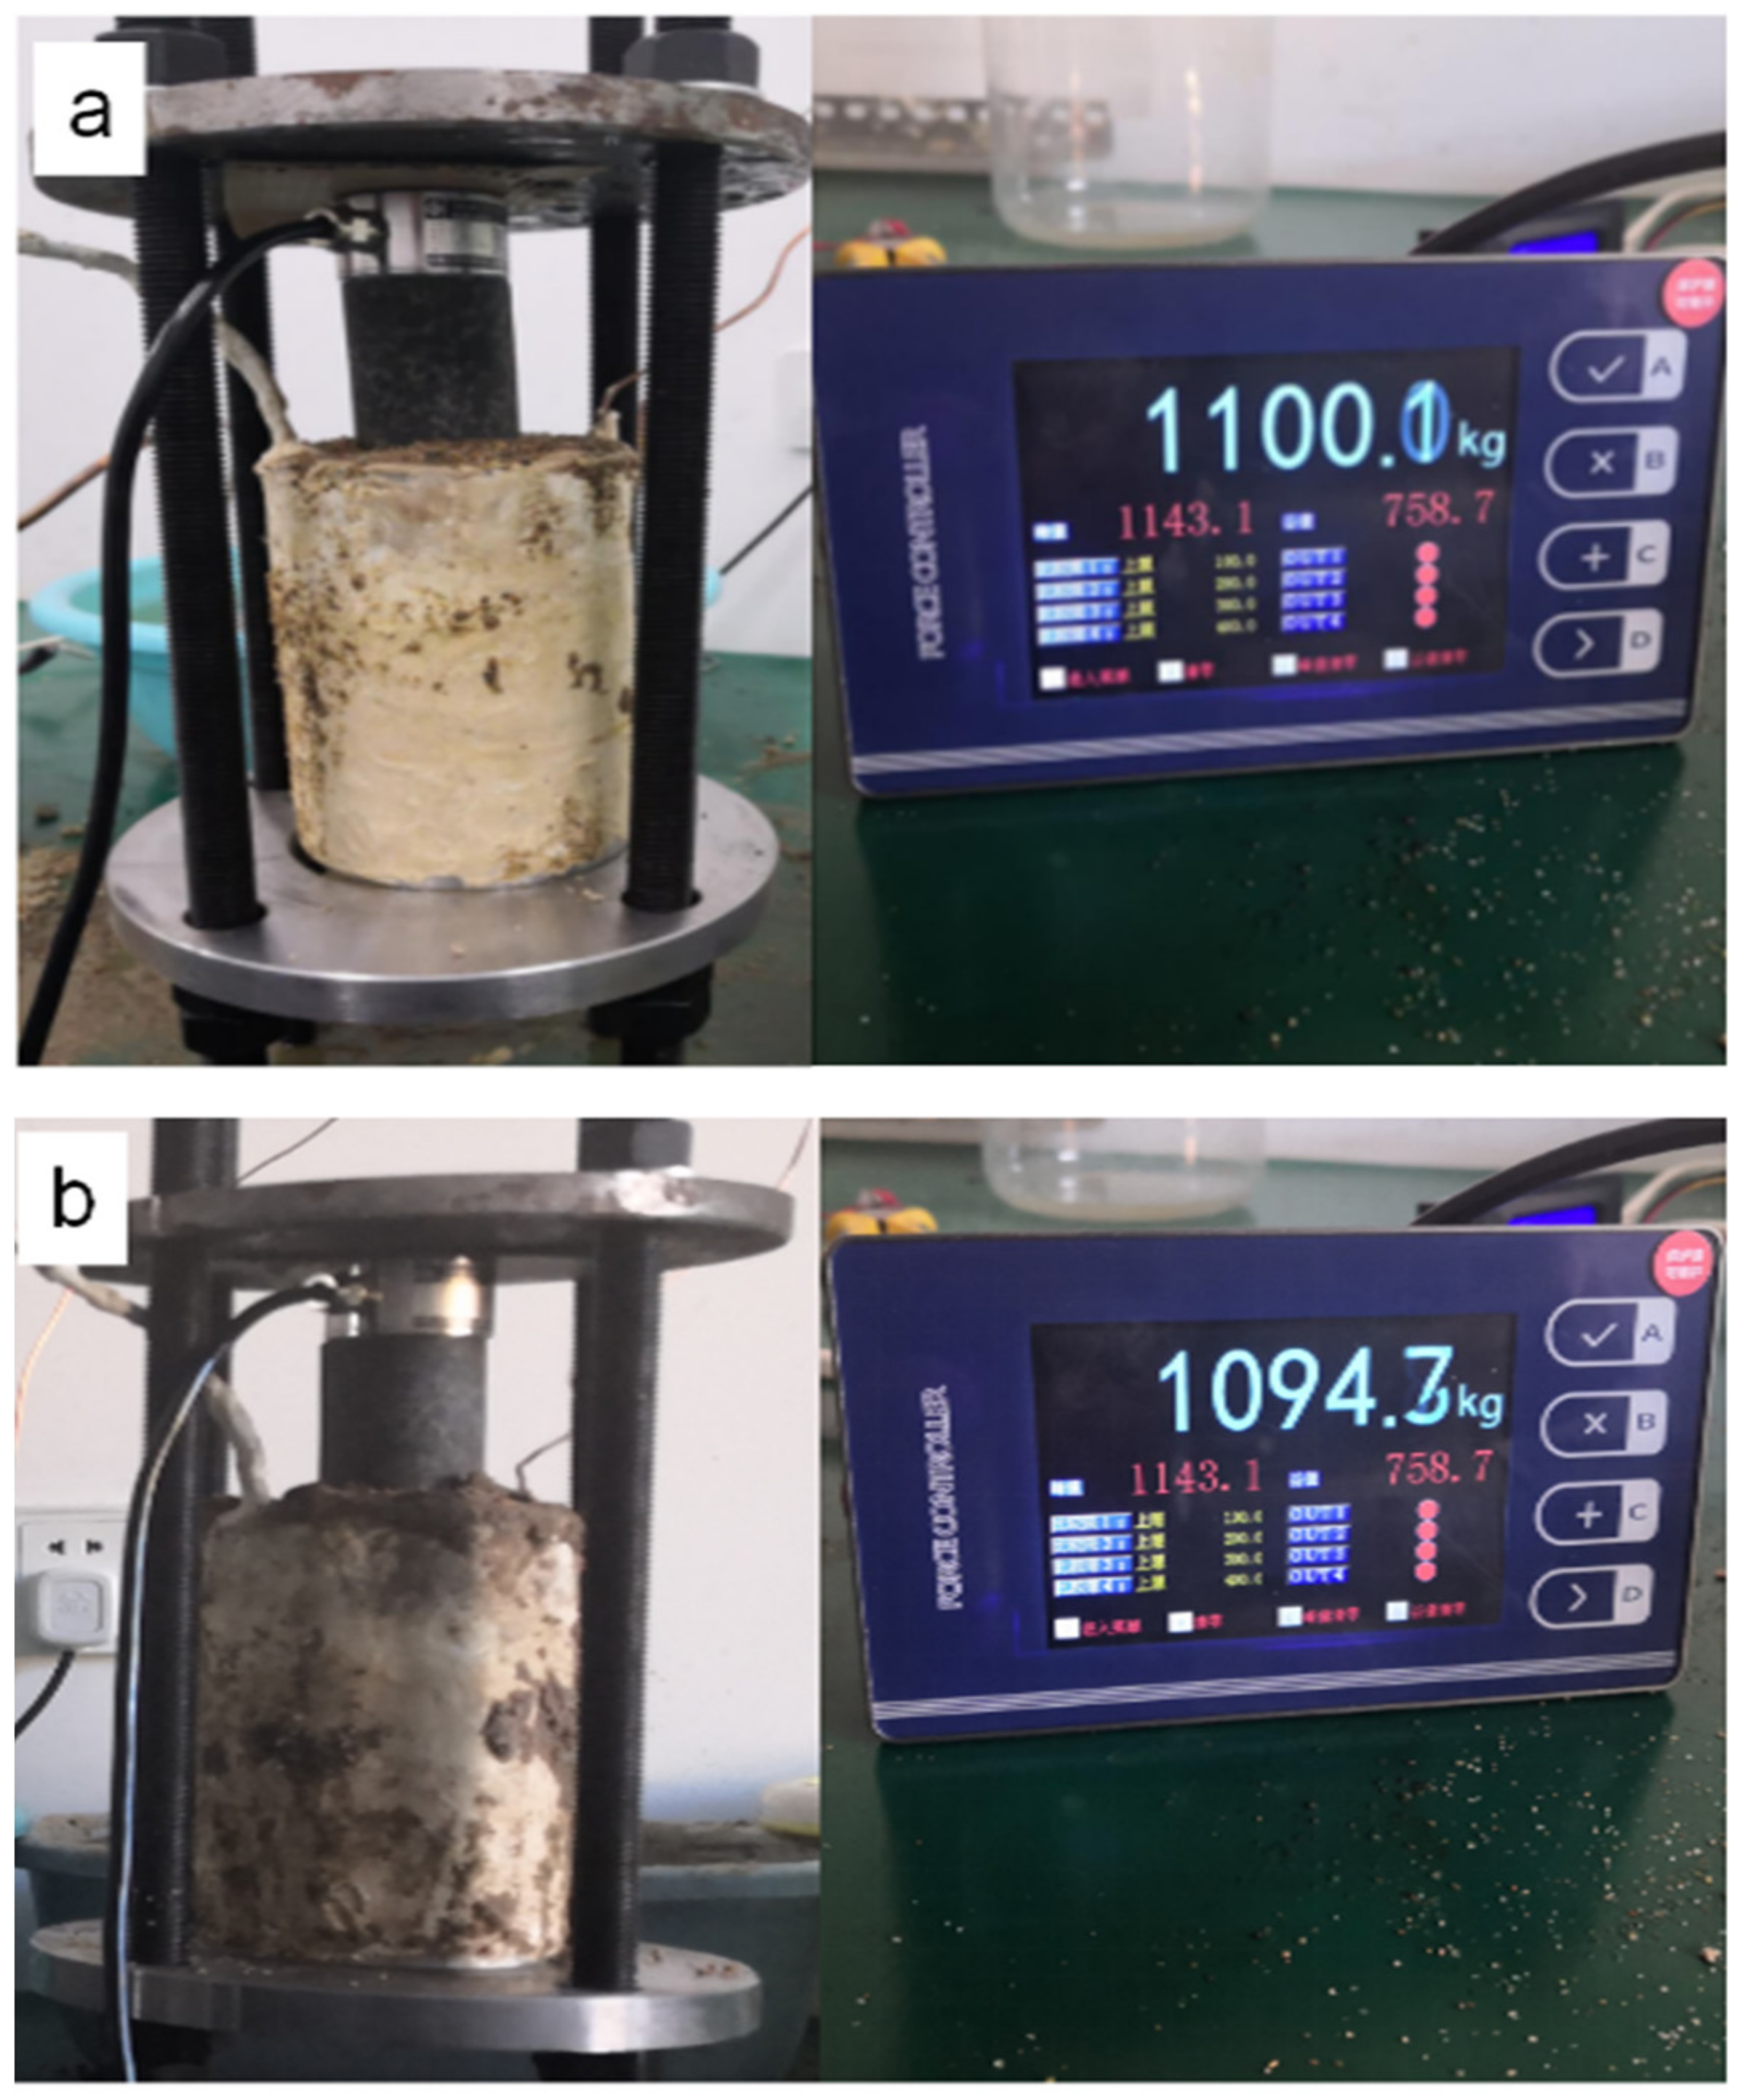
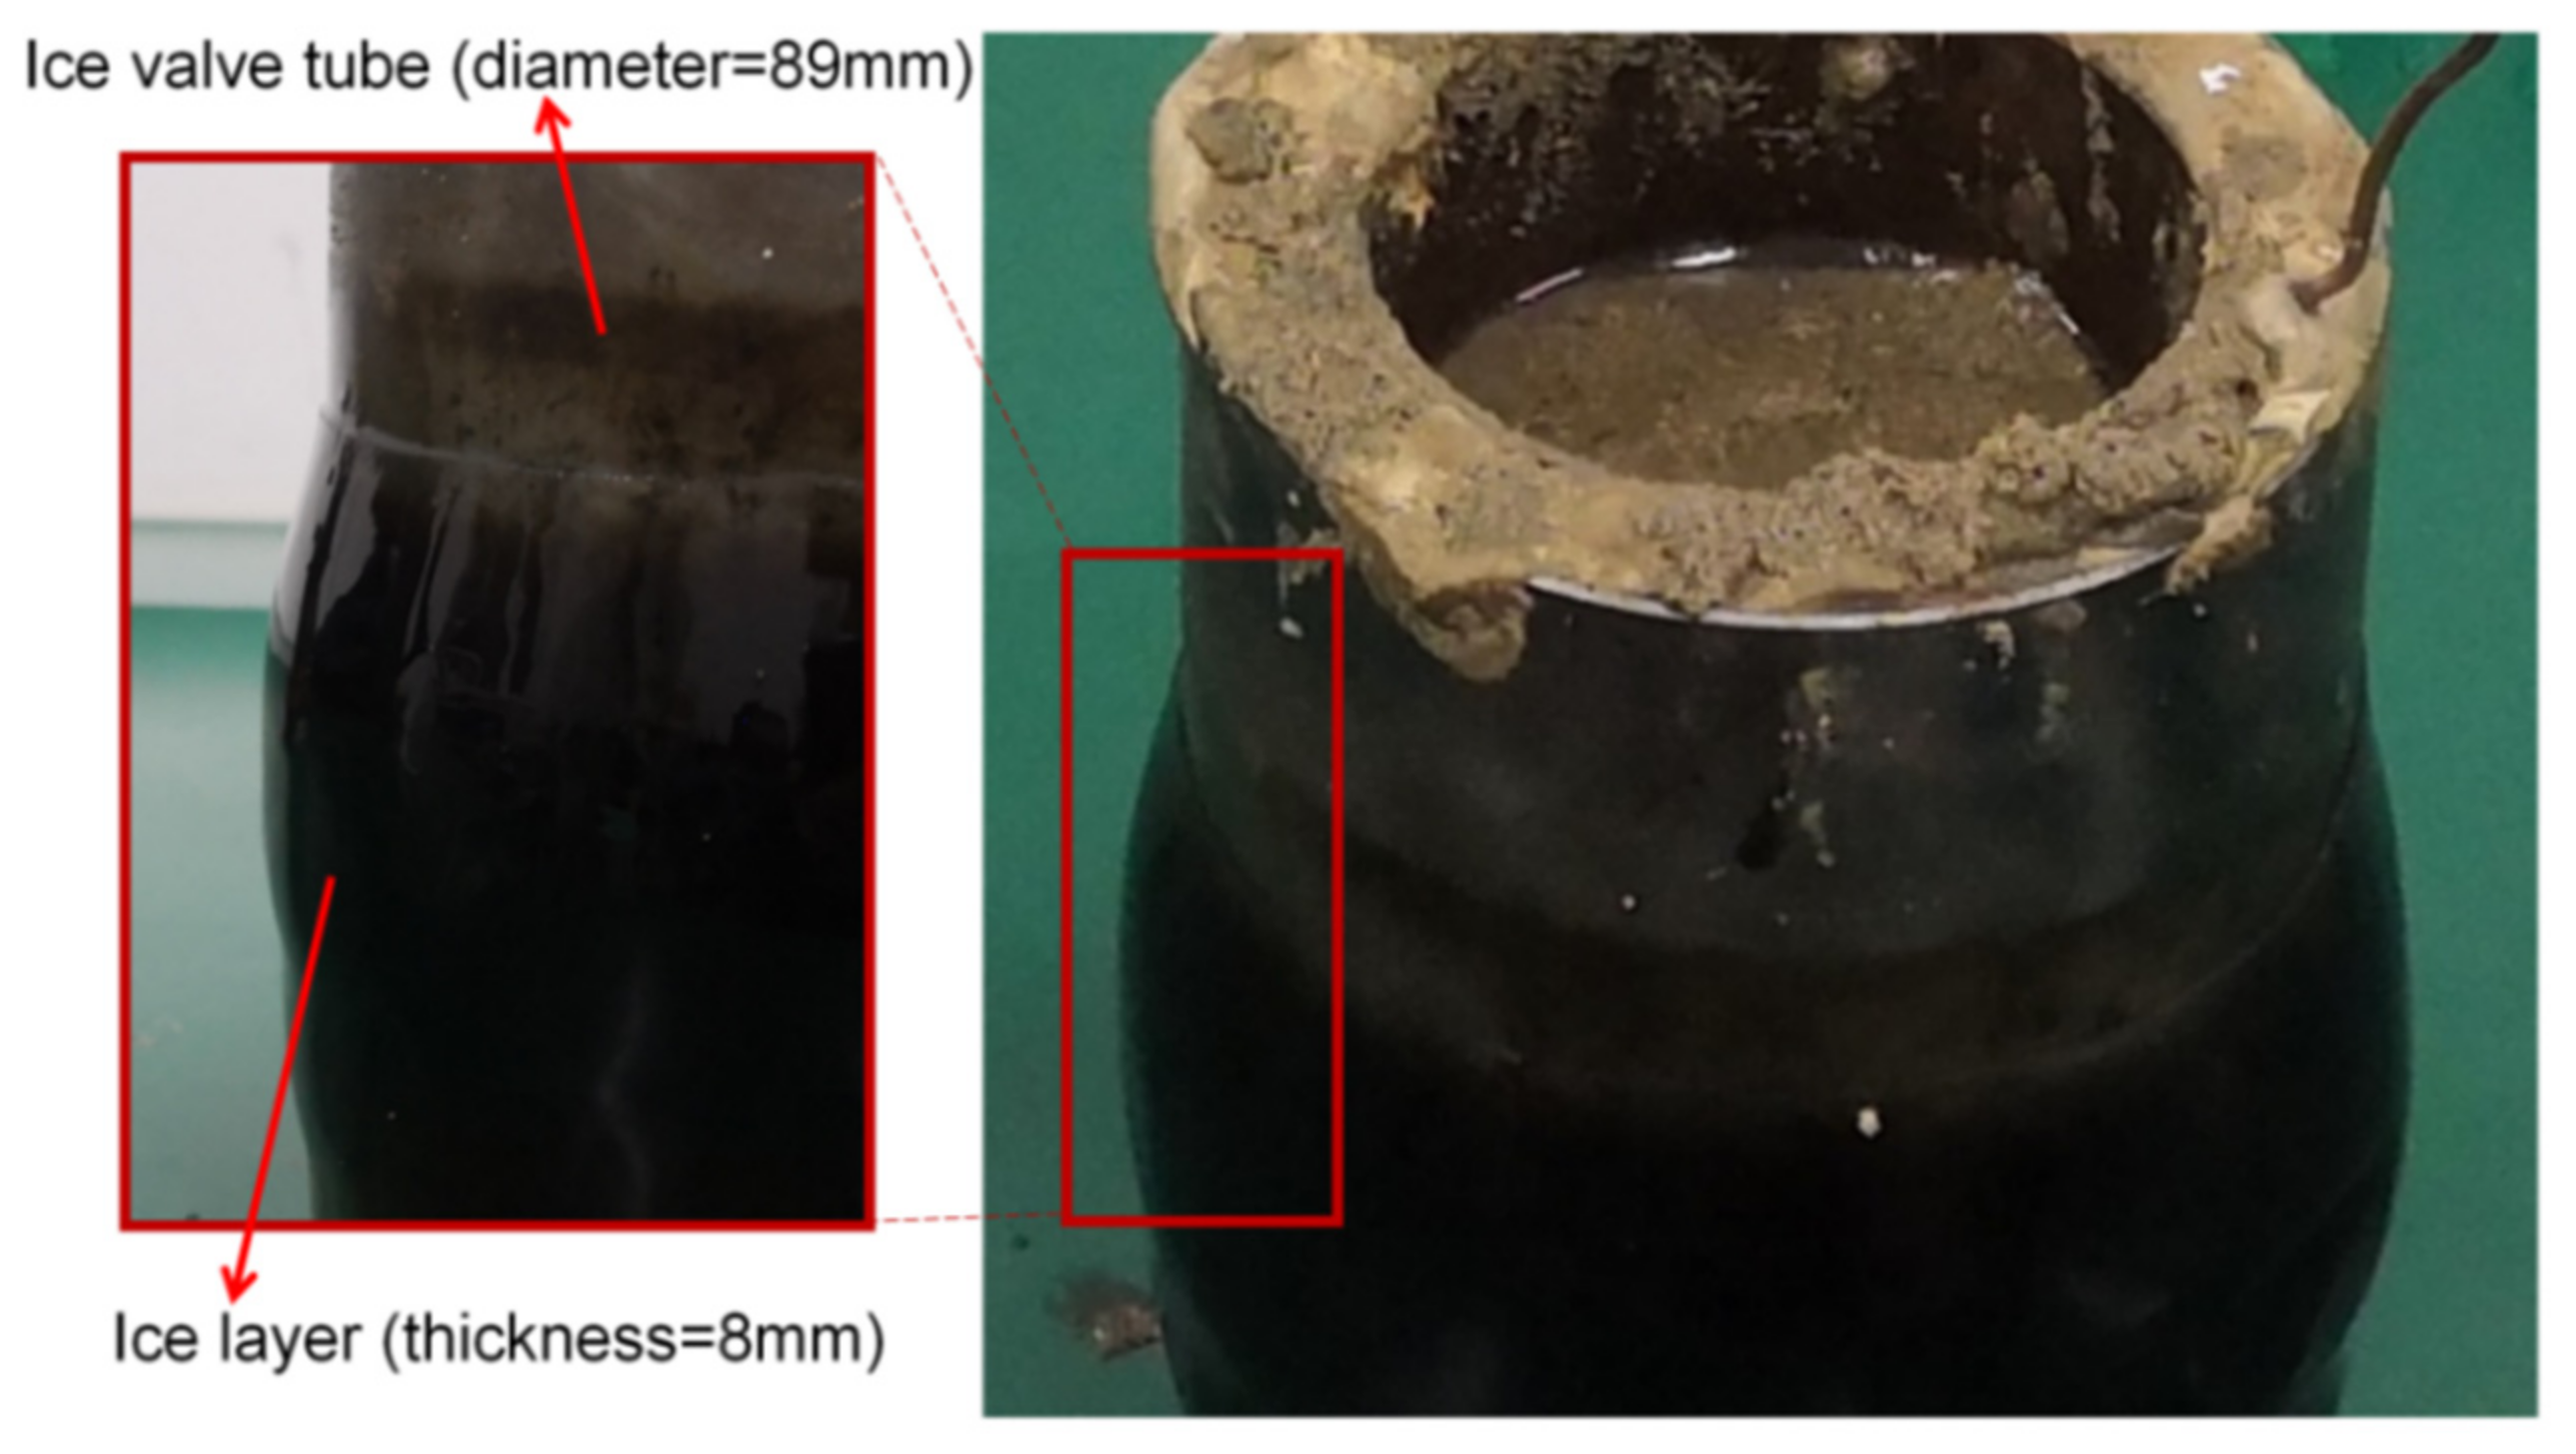
3.1. Feasibility Analysis of Artificial Samples

To verify whether the artificial sample can replace the natural sample, we carried out freezing experiments on the artificial sample and the natural sample. In this study, the bearing characteristics of the sand–ice valve were tested. Figure 4 shows that the freezing time of the artificial sample is in basic agreement with the natural sample. The results have shown that the core is entirely frozen to form a sand–ice valve when the center temperature reaches −5 °C. The photograph and thermal image of the sand–ice valve are shown in Figure 5. As shown in Figure 6, the bearing capacity of the sand–ice valve formed by the artificial sample and the natural sample reaches 1100 kg and 1094 kg. The bearing capacities are very close, and they are far greater than the core weight of 6 kg (coring height 2 m) inside the core tube. Thus, with the short freezing time and bearing capacity, the artificial sample can replace the natural sample. This method can accomplish the task of coring and has a high safety factor.

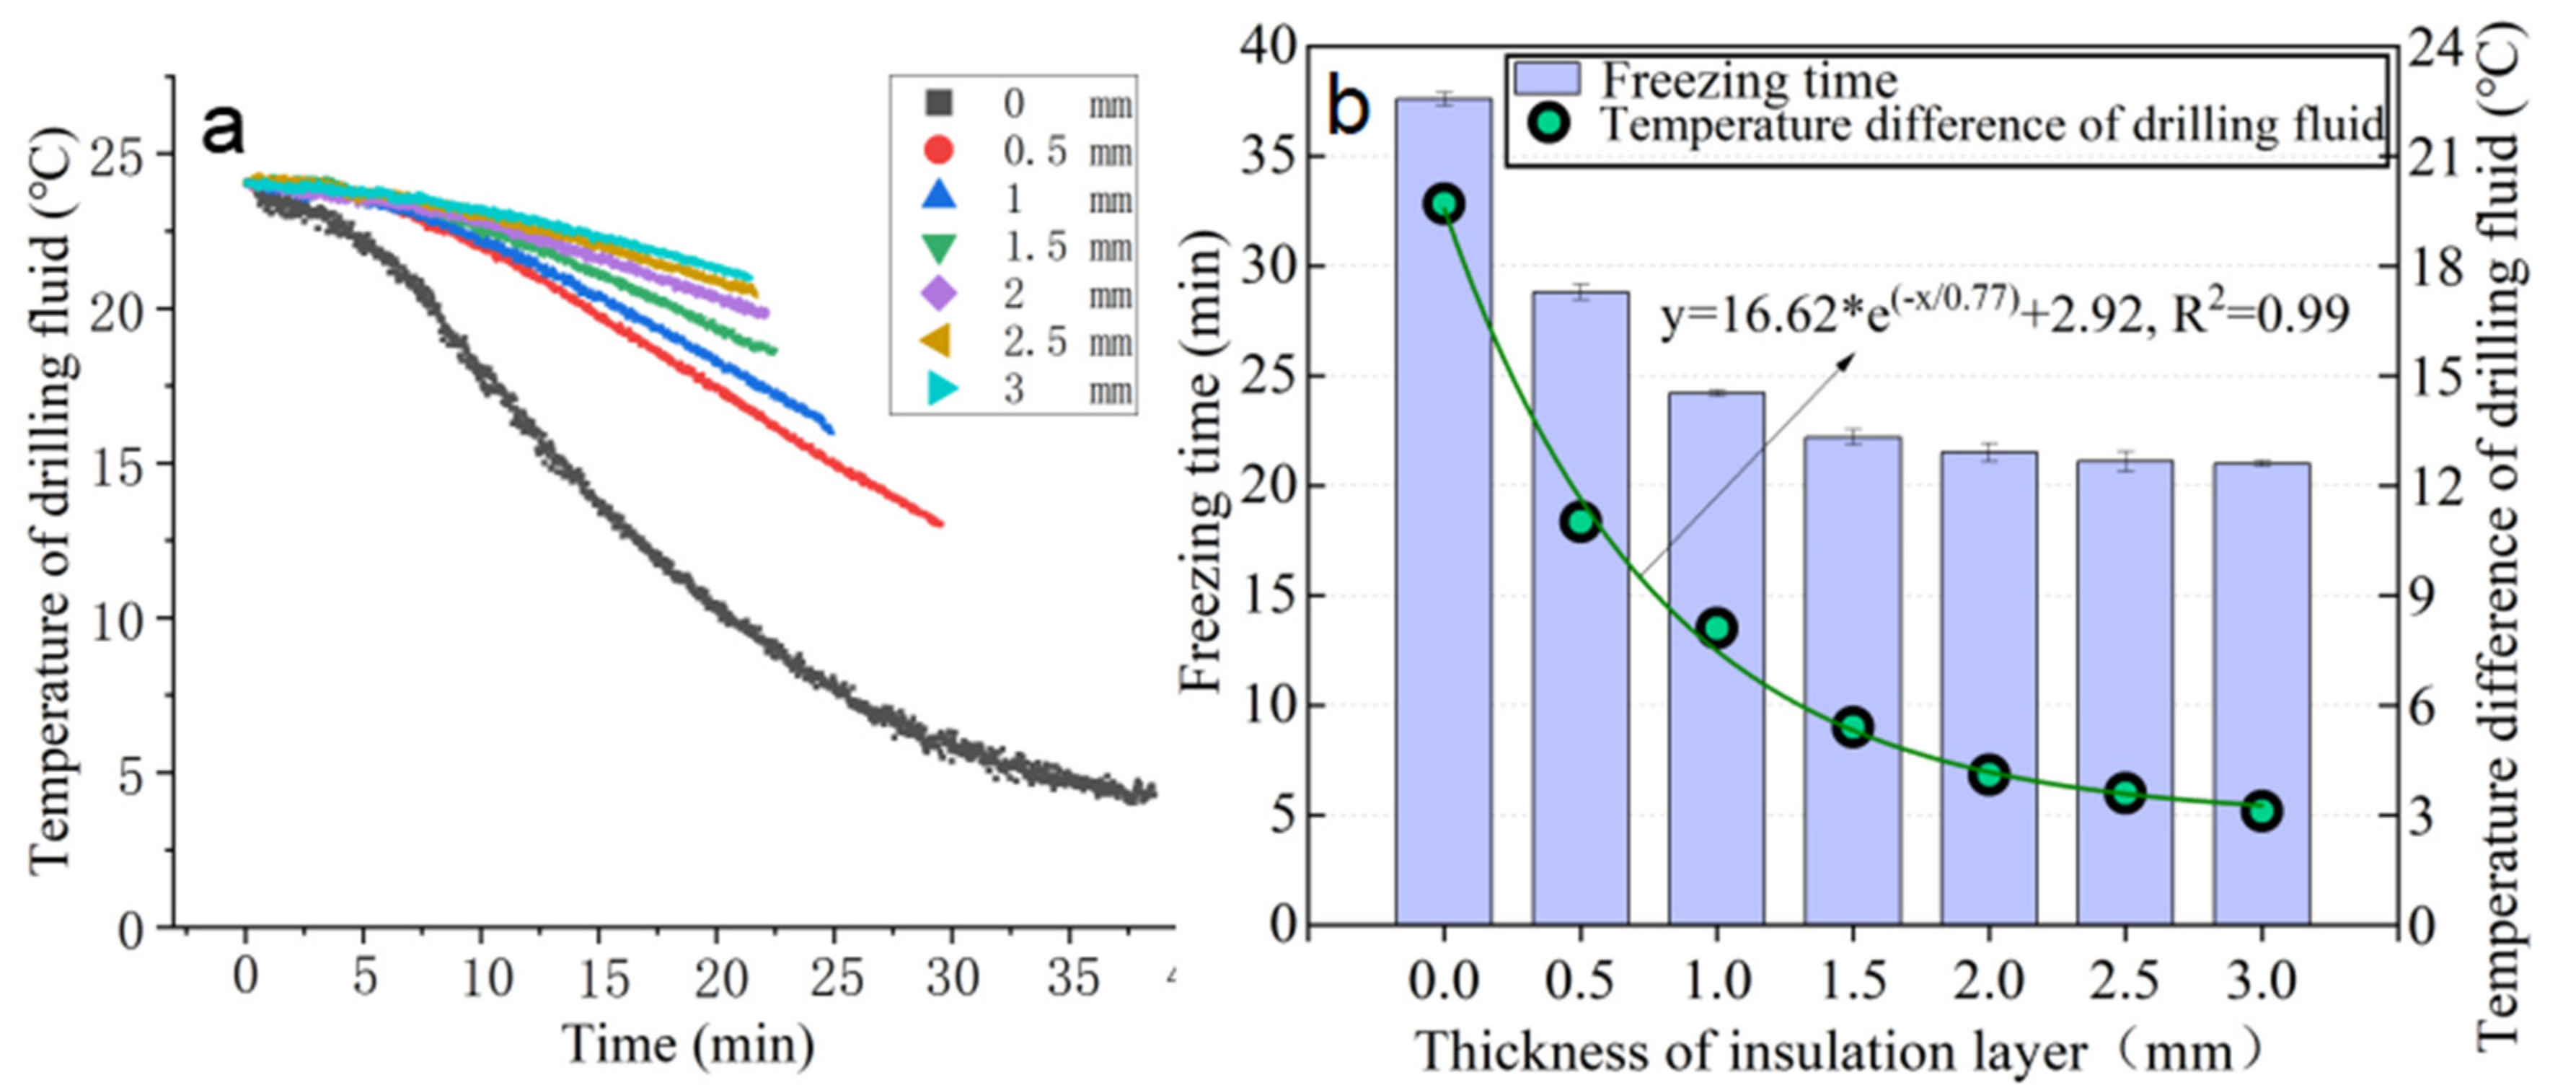
3.2. Effect of Insulation Layer Thickness on Freezing Time and the Temperature of Drilling Fluid

The freezing process of the sand–ice valve is a double-phase change process in the drilling fluid environment. The drilling fluid outside the ice valve tube always has heat exchange with the refrigerant through the outer wall, and the working condition is special. The existing adiabatic design method is not applicable to this study. The ultimate purpose of this study is to set the minimum thickness insulation layer in the annular gap of 5 mm between the ice valve tube and the outer tube to achieve the shortest freezing time. Drilling fluid temperature is an important parameter to measure the loss of cold energy. According to Figure 7a, the temperature of the drilling fluid drops with time. The drilling fluid temperature drops rapidly when there is no insulation layer, or the insulation layer is thin. The refrigerant also has heat exchange with the drilling fluid outside the ice valve tube through the outer wall during the freezing process, resulting in the obvious loss of cold energy. As a result, the drilling fluid temperature drops with the increase of time. The poor thermal insulation effect results in the serious loss of cold energy when the insulation layer thickness is small. Consequently, the temperature of the drilling fluid drops rapidly. Secondly, the temperature of the inner wall drops slowly when the insulation layer thickness is small. Correspondingly, the temperature of the evaporation chamber is relatively high compared with the thicker insulation layer. The difference between the temperature of the evaporation chamber and the evaporation temperature of the refrigerant is more considerable. Furthermore, the working efficiency of the refrigeration system is higher [28,29]. As a consequence, the temperature of the drilling fluid drops rapidly. With the increase of the insulation layer thickness, the loss of cold energy decreases with the increase of thermal resistance, and the corresponding drilling fluid temperature drops slowly.
The temperature difference of drilling fluid in Figure 7b refers to the temperature difference of drilling fluid before and after freezing. Figure 7b illustrates that the temperature difference of drilling fluid decreases sharply in the range of insulation layer between 0 and 1.5 mm, and then basically reaches to a constant value for insulation layer more than 2 mm. The variation in freezing time with insulation thickness is consistent with the variation in drilling fluid temperature difference. It has a strong correlation and decreases sharply first and then tends to be slight. When the insulation layer thickness is 0.5 mm, the temperature difference of the drilling fluid is reduced by about 9 °C. Moreover, the freezing time is shortened by 8.8 min compared with that without the insulation layer. Thus, the setting of the insulation layer dramatically reduces the loss of cold energy during the freezing process and shortens the freezing time. The freezing time and temperature difference of drilling fluid are basically the same and small when the insulation layer thickness is greater than 2 mm. However, there is still a drilling fluid temperature difference of 3~4 °C. This part of the loss of cold energy is unavoidable. Therefore, the insulation thickness is regarded as optimal and minimum when the difference of freezing time and drilling fluid temperature difference is negligible. The flow area of the drilling fluid can be calculated by the following equation.
Δ S = π R 1 2 π R 2 + d 2
where ∆S is the flow area of the drilling fluid. R1 is the radius of the outer tube, the value is 49.5 mm. R2 is the radius of the ice valve tube, the value is 44.5 mm. d is the thickness of the insulation layer. The calculation results show that the insulation layer with a thickness of 2 mm increases the flow area compared with the 3 mm thickness insulation layer. The flow area of drilling fluid can be improved by 48.5%, which can reduce the risk of erosion damage and prolong the service life of the insulation layer. At the same time, it can also achieve efficient freezing.
The freezing phenomenon appears outside the ice valve tube with no insulation layer exhibited in Figure 8, caused by the severe loss of cold energy during the freezing process. The thickness of the ice layer is 8 mm, larger than the annular gap between the ice valve tube and the outer tube. Therefore, there is a risk of freezing and sticking between the ice valve tube and the outer tube. The thermal conductivity of ice is about four times that of water, and the main component of drilling fluid is water. Once freezing and sticking occur, the thermal resistance decreases, and the loss of cold energy of the ice valve tube is more severe in the freezing process of the borehole bottom. When the insulation layer thickness is greater than or equal to 0.5 mm, there is no icing phenomenon outside the ice valve tube. The drilling fluid located in the annulus gap between the ice valve tube and the outer tube has a small thermal conductivity, a natural thermal barrier structure conducive to reducing the loss of cold energy in the freezing process of the bottom hole of the drilling hole.

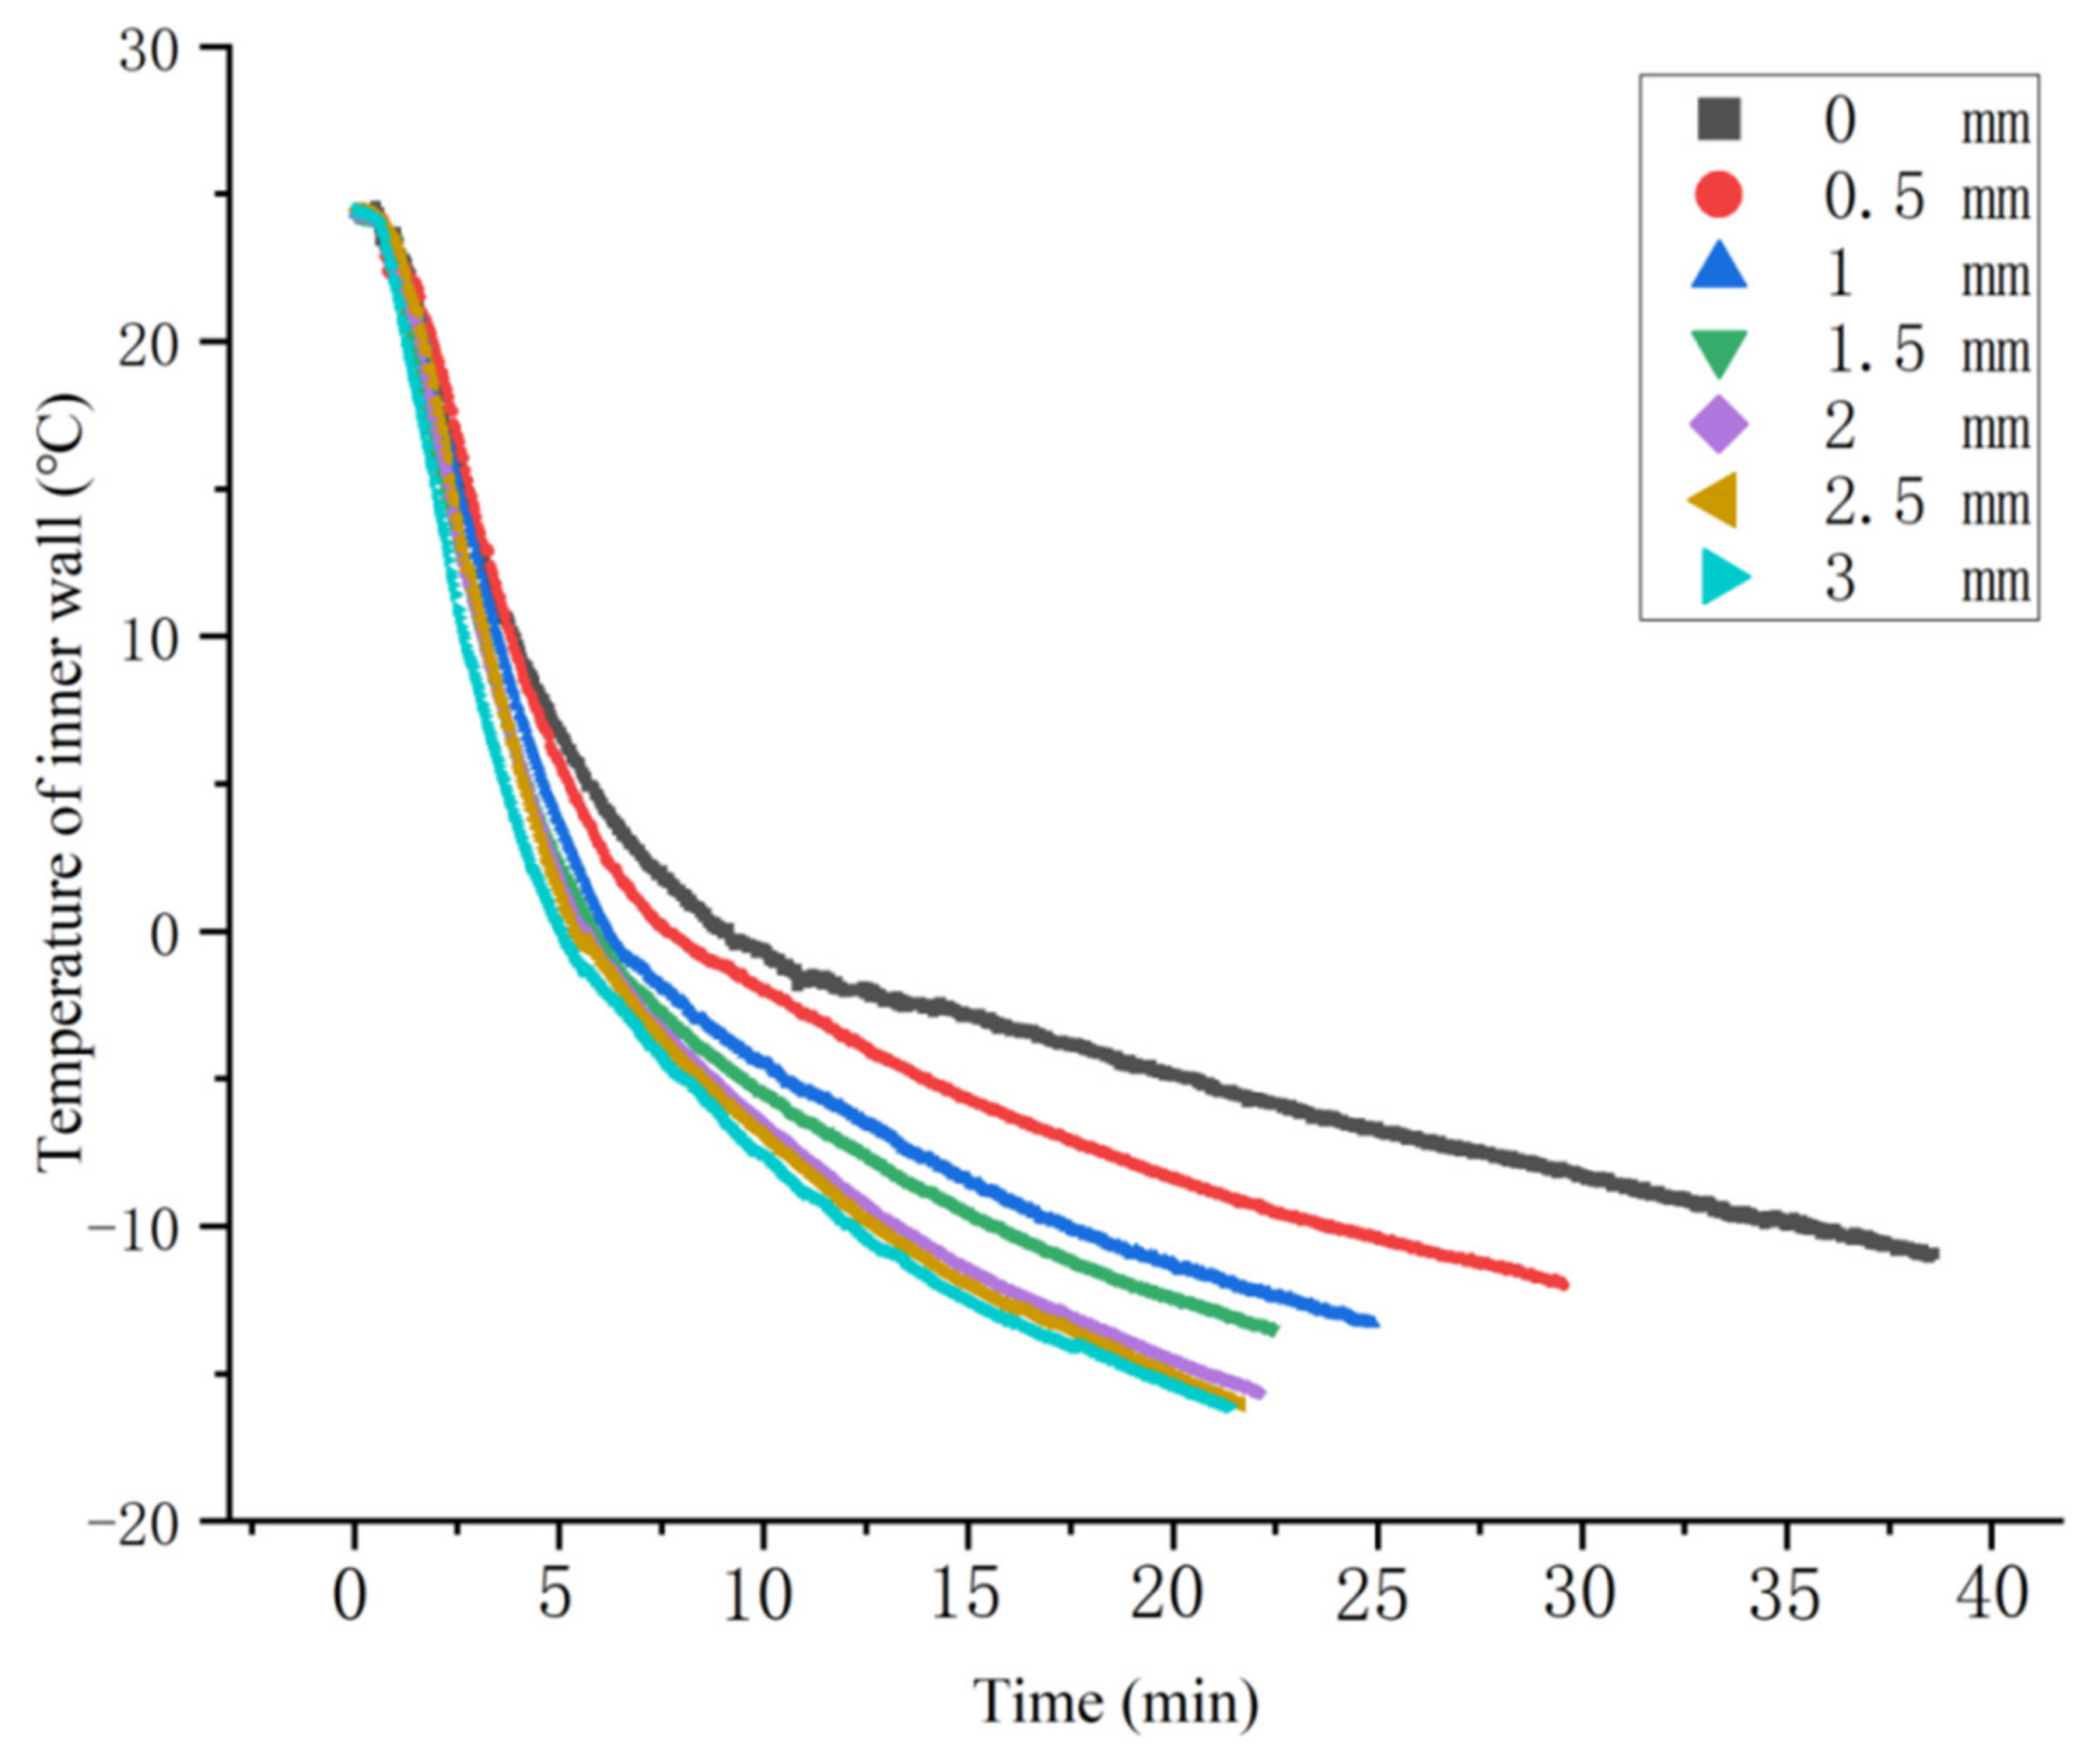
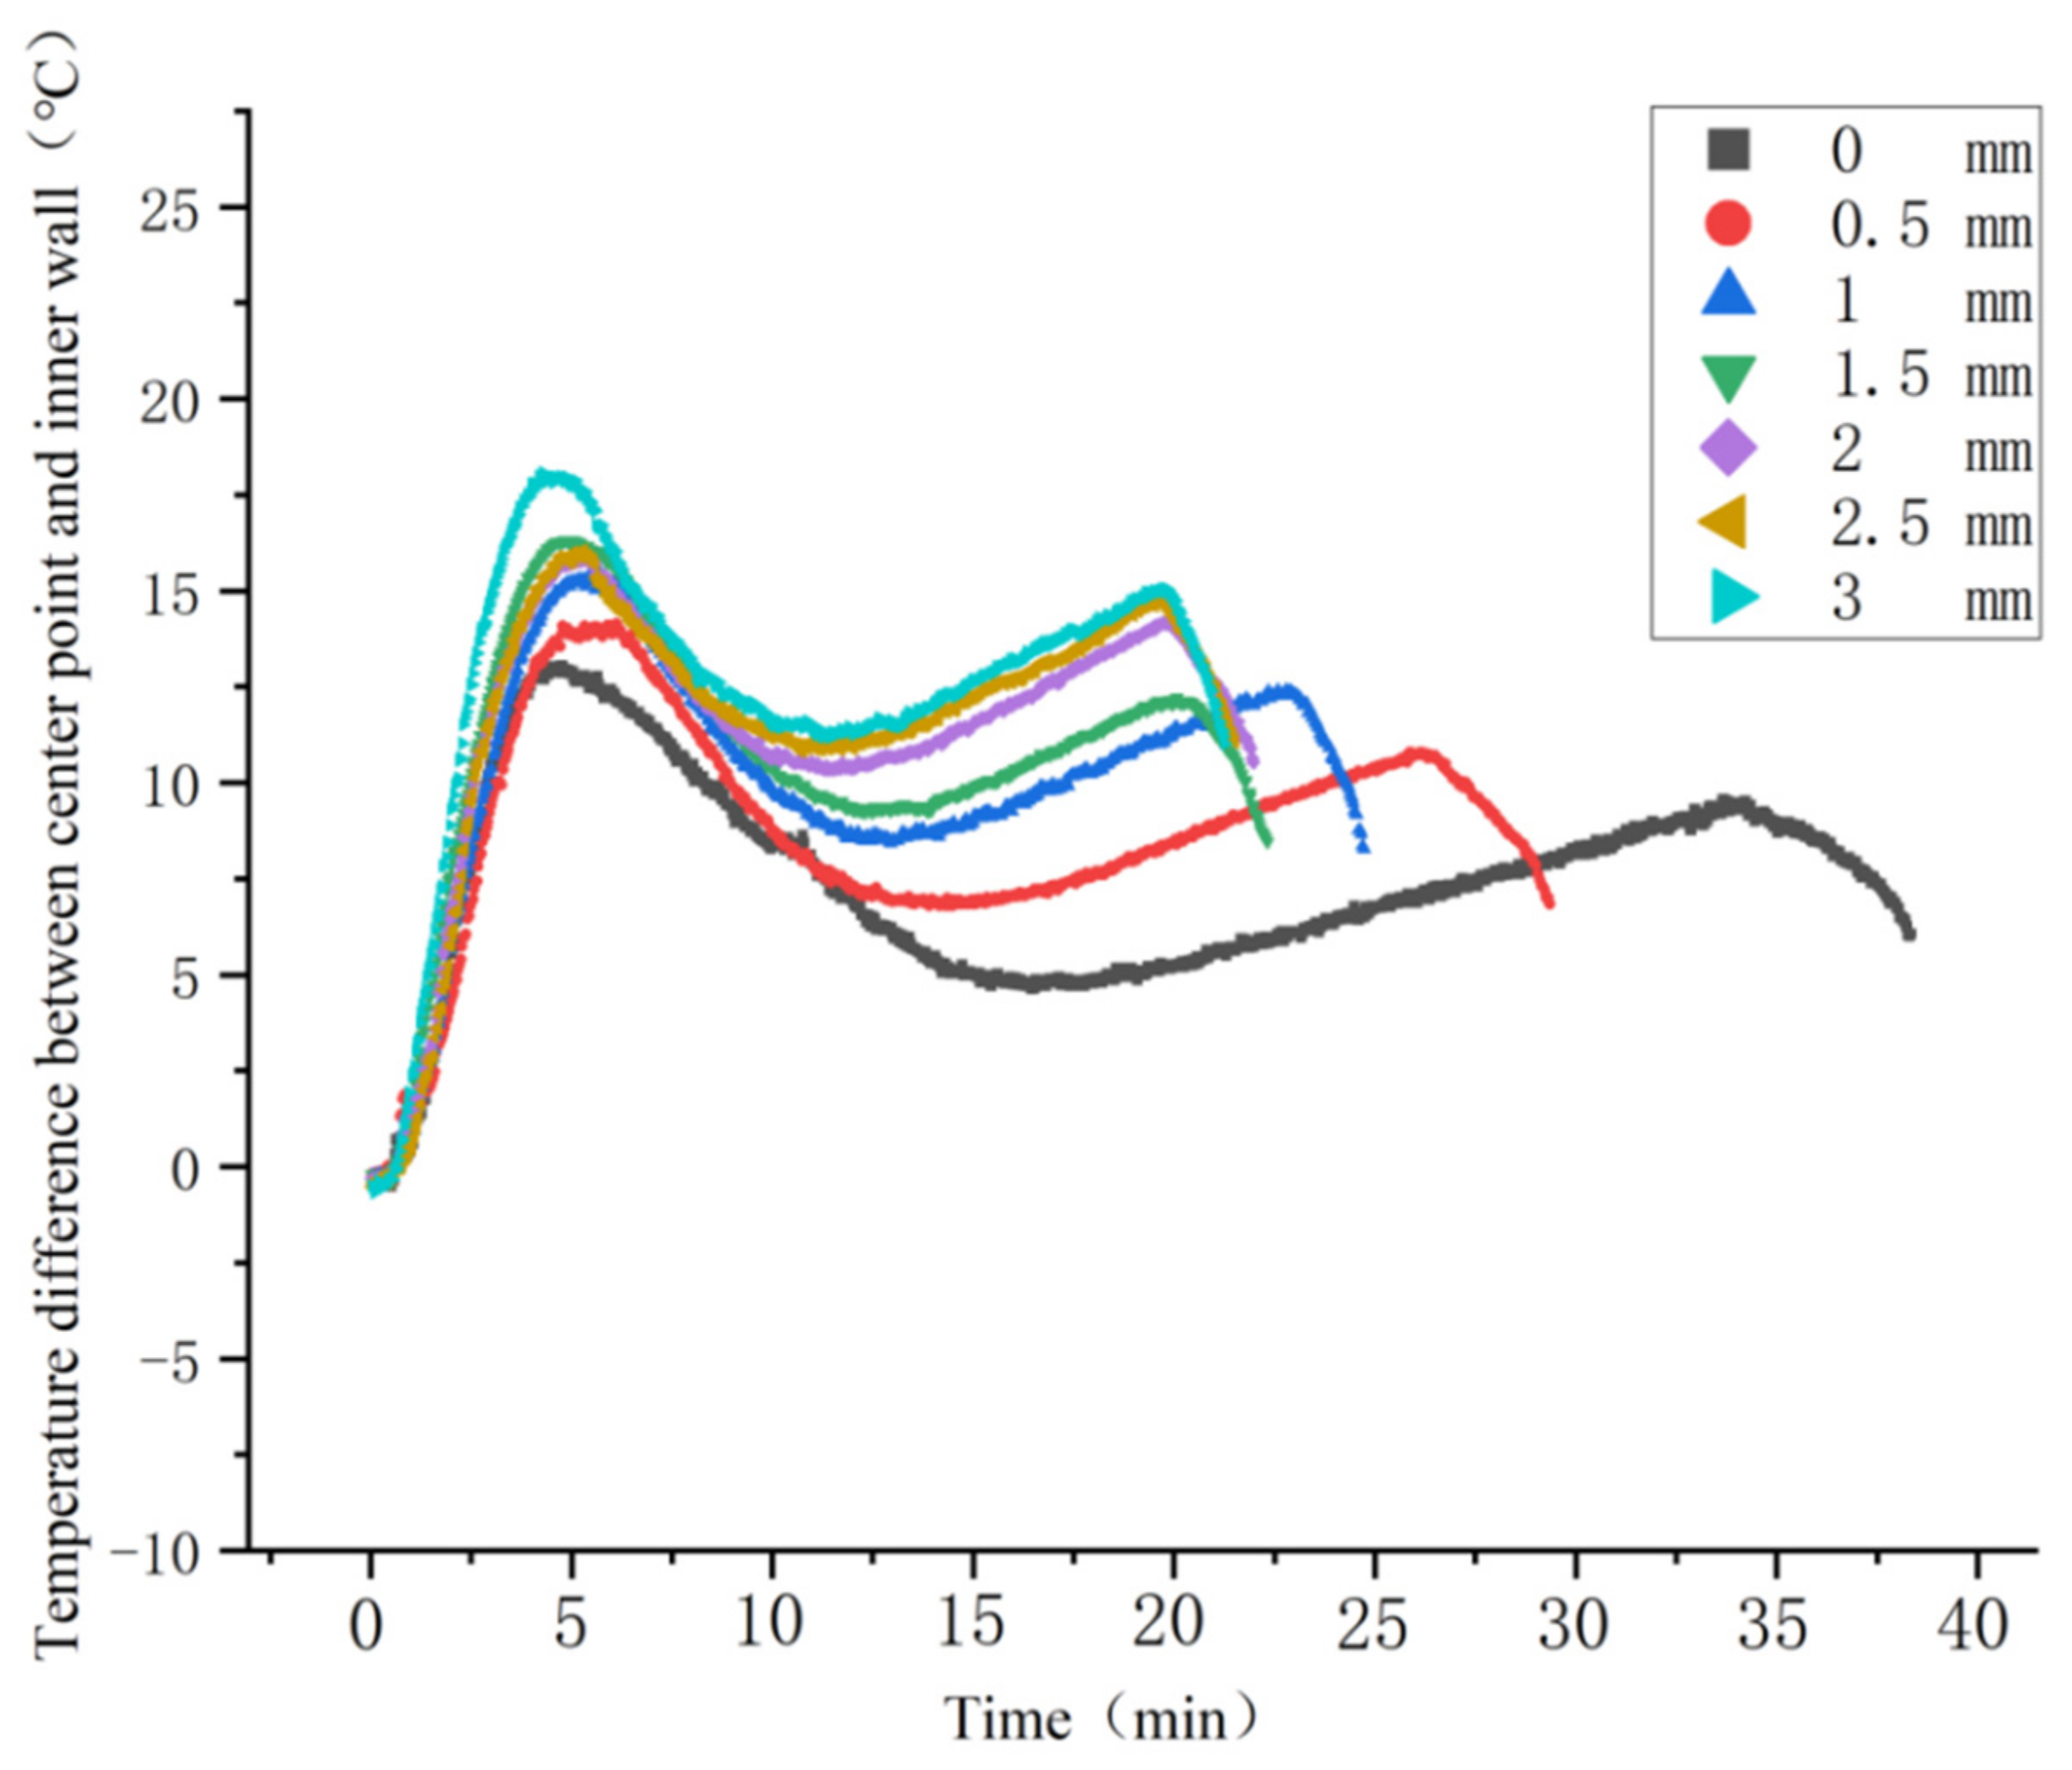
3.3. Relationship between the Inner Wall Temperature and Time

The formation of the sand–ice valve releases much heat, and the refrigerant has heat exchange with the core through the inner wall and freezes to form a sand–ice valve. The lower inner wall temperature plays a driving role in the whole freezing process. The average temperature of points A and C is regarded as the inner wall temperature. Figure 9 illustrates that the inner wall temperature drops with time, and the decreasing trend is fast and then slow. The thicker the insulation layer thickness is, the faster the inner wall temperature drops. The curve difference is minuscule when the insulation layer thickness is greater than 2 mm. The refrigeration efficiency is high in the initial freezing stage due to the higher temperature of the inner wall. Therefore, the temperature drops rapidly. The inner wall temperature drops with time, and the refrigeration efficiency decreases [28,29]. Consequently, the inner wall temperature drops slowly with the increase of time. The inner wall temperature drops rapidly when the insulation layer is thick. The temperature of the inner wall decreases obviously when the thickness of the insulation layer is from 0 to 0.5 mm. As shown in Figure 7a,b, when the insulation thickness is greater than 2 mm, the loss of cold energy decreases with the increase of insulation thickness, but the reduction is not obvious. Therefore, the difference of the inner wall temperature curve is slight.

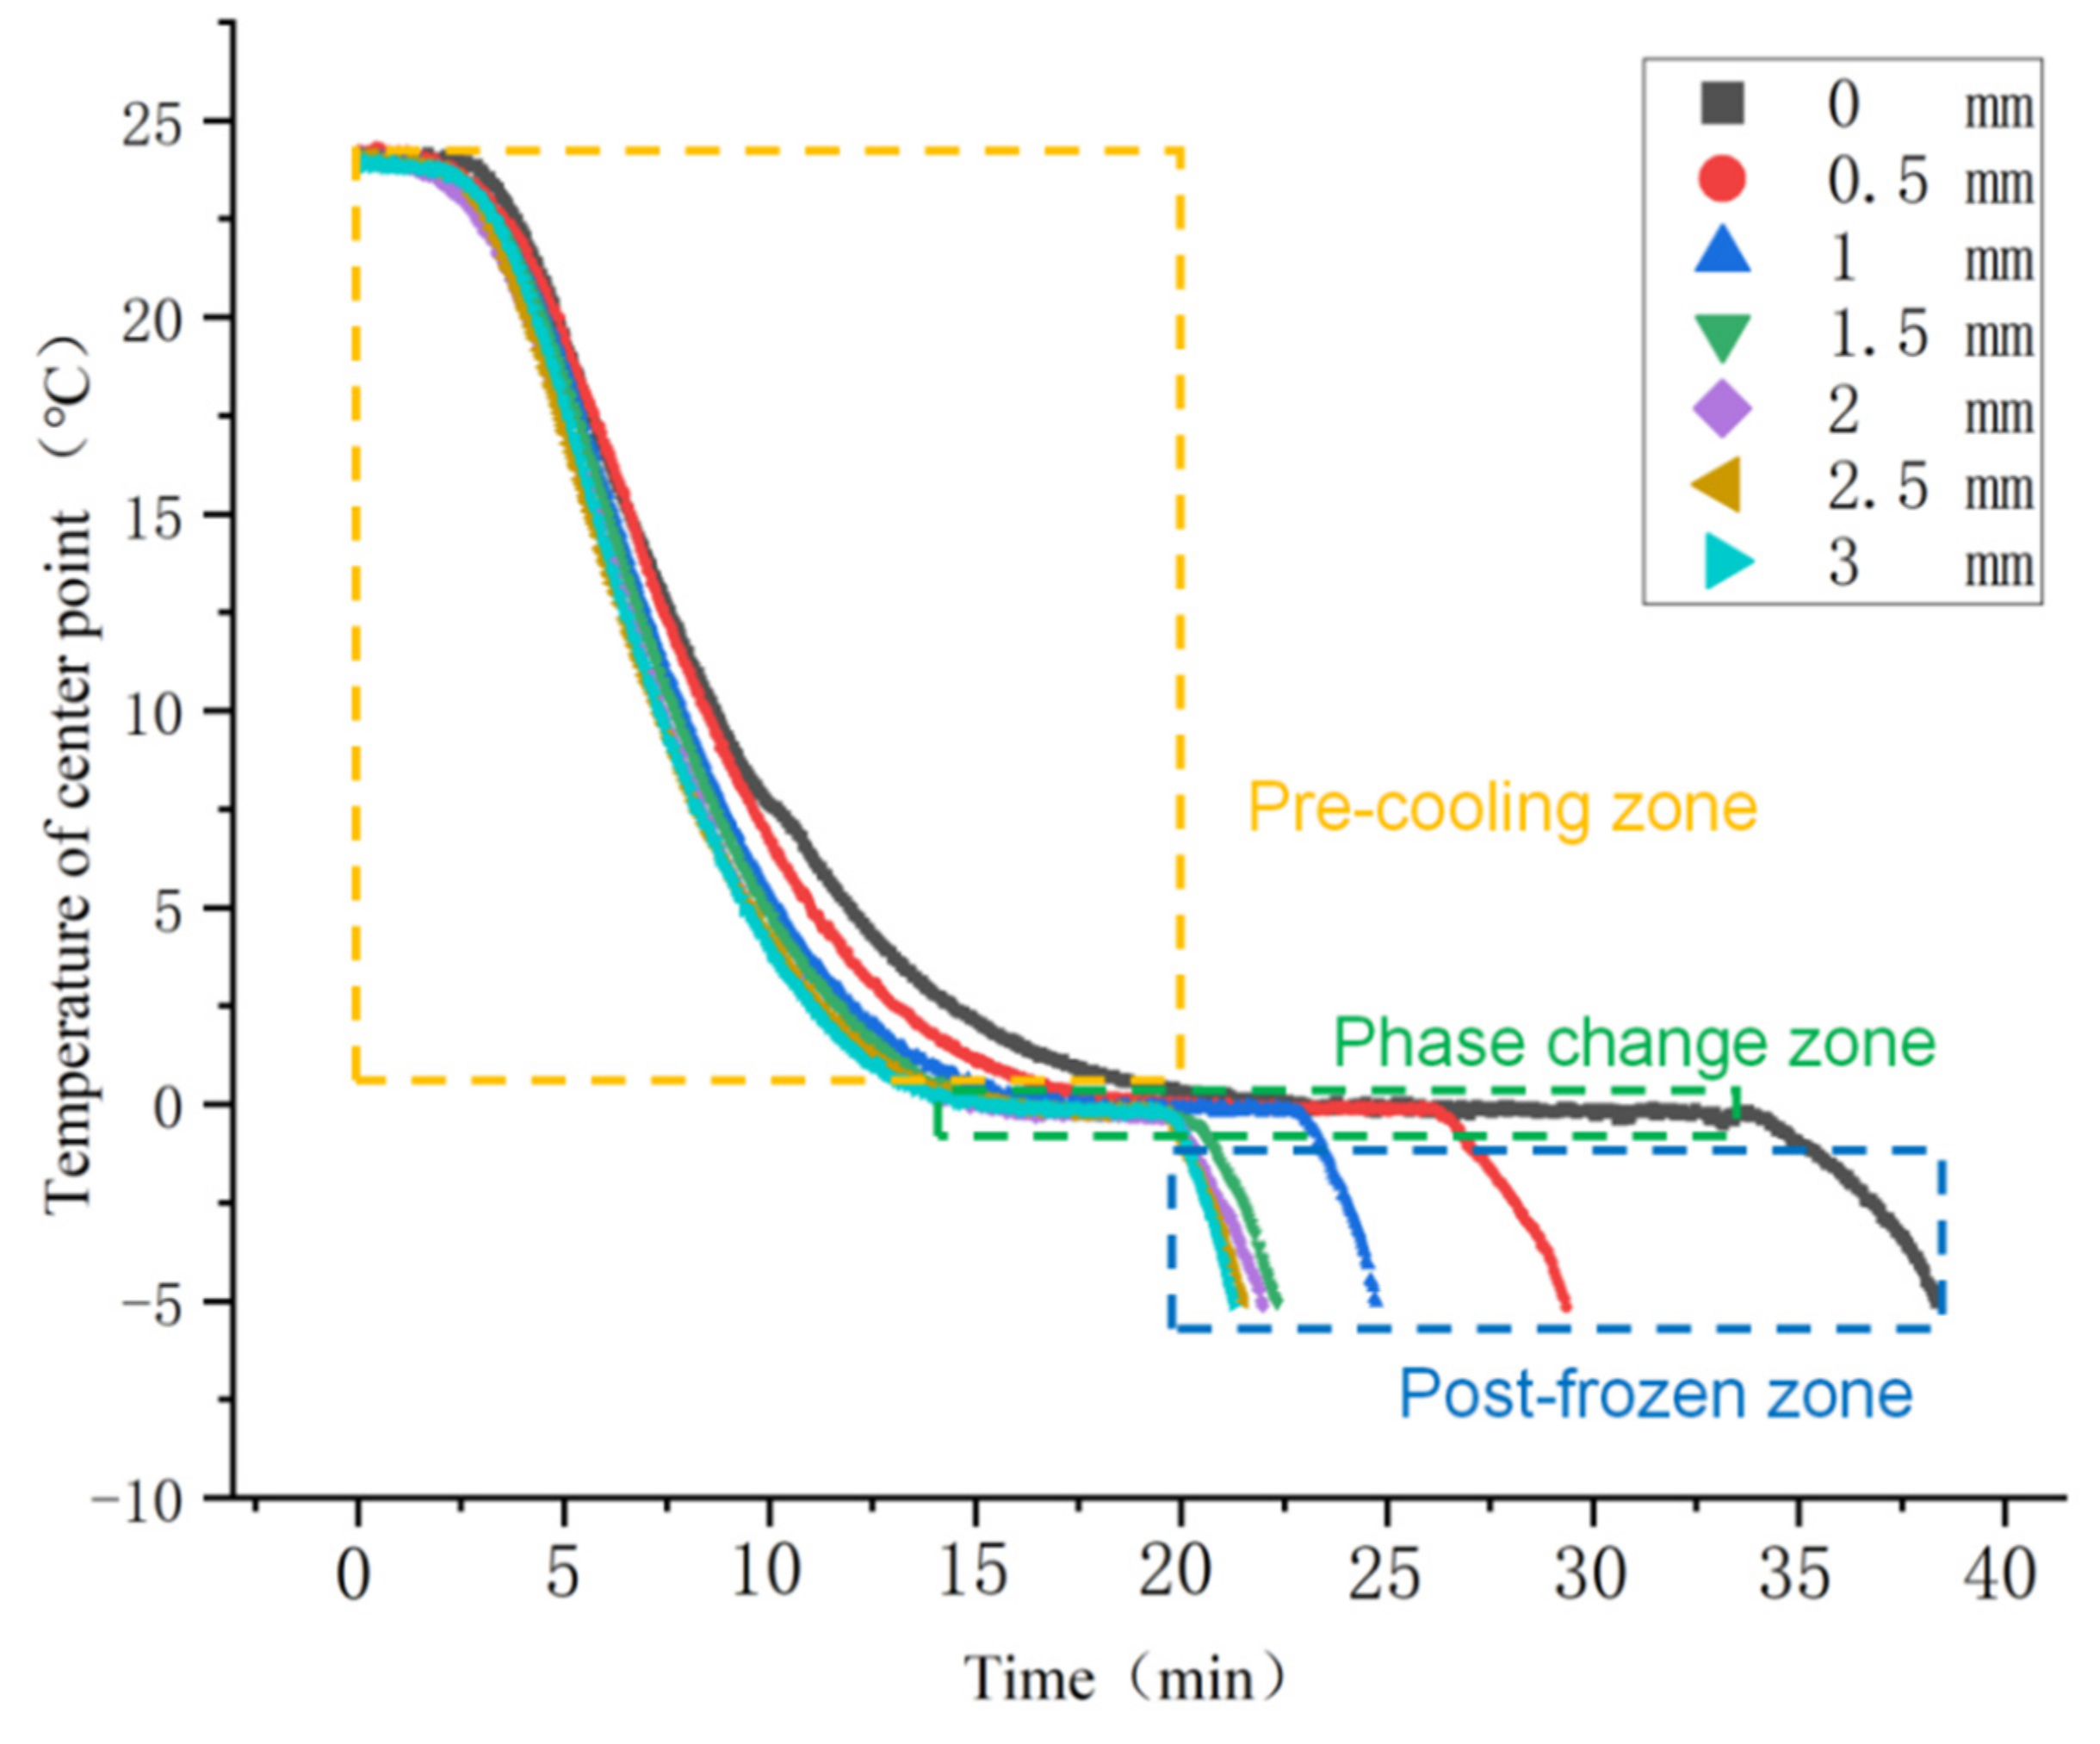
3.4. Relationship between Temperature of Center Point and Time

The temperature of the center point located in the core is an important parameter to describe the formation process of the sand–ice valve, and the trend of the center point temperature with time is mainly determined by the temperature difference between the inner wall and the center point. Figure 10 shows the relationship between temperature and time at the center point. Figure 11 illustrates a state in which the temperature difference between the center point and the inner wall changes with time. The temperature of the center point includes three stages during the formation of the sand–ice valve: (1) pre-cooling zone; (2) phase-change zone; (3) post-frozen zone.
The temperature range of the pre-cooling zone is 24–0.5 °C, and the temperature drops rapidly. The thicker the insulation layer thickness, the more the temperature difference between the center point and the inner wall, and the faster the center point temperature drops. The change of the temperature in the phase-change zone is not obvious, and the temperature range is from 0.5 °C to −0.5 °C. The temperature drops sharply from −0.5 °C to −5 °C in the post-frozen zone. The more the temperature difference between the center point and the inner wall, the faster the temperature of the center point drops. The pre-cooling zone is the most time-consuming stage in the freezing process. As the insulation layer thickness increases from 0 mm to 3 mm, the pre-cooling zone time decreases from 18.6 min to 13.2 min. Secondly, with the thickness of insulation layer increasing from 0 to 3 mm, the time of phase-change zone decreases from 15.1 min to 6.2 min.
According to Fourier’s law, conduction heat flux is proportional to the rate of temperature change and cross-section area [30]. The direction of heat transfer is opposite to the direction of the temperature increase. The noteworthy temperature difference between the center point and the inner wall leads to a large conduction heat flux in the pre-cooling zone, which is beneficial to the heat transfer between the center point and the refrigerant. Therefore, the center point temperature of the pre-cooling zone drops rapidly. The thicker the insulation layer, the faster the center point temperature drops. The center point temperature of the pre-cooling zone drops from 24 °C to 0.5 °C, which needs to release much heat to transfer heat with the refrigerant through the inner wall, leading to a long time in the pre-cooling zone. Phase-change zone is a process in which the water in the core changes from liquid to solid during the formation of the sand–ice valve, and it is also a process of latent heat of phase change. The amount of heat released by the core in the phase-change zone is constant. The greater the temperature difference between the inner wall and the center point, the greater the conduction heat flux, and the shorter the time required for the phase-change zone. The thermal conductivity of ice in the core is four times that of water. Moreover, the specific heat capacity of ice is 0.5 times that of water. As a consequence, the center point temperature of the post-freezing zone drops sharply. The more the temperature difference between the inner wall and the center point, the faster the temperature of the center point drops. However, the thermal insulation layer has no noteworthy influence due to the short time required for the post-frozen zone.

4. Conclusions

In this study, a novel ice coring device is put forward to solve the problem of coring in loose sandstone-type uranium deposits. The standard of sand–ice valve formation is determined when the temperature of the center point reaches −5 °C. The results show that the artificial sample can replace the natural sample. The bearing capacity of the sand–ice valve with a height of 40 mm can bear up to 1 ton, and its high safety is enough to cope with the influence of downhole drilling tool vibration on the sand–ice valve.
The standard of optimizing insulation layer is proposed using the variation law of drilling fluid temperature difference and freezing time in light of the special working conditions. When the temperature difference of drilling fluid outside the ice valve tube and the freezing time change slightly, the corresponding insulation thickness is regarded as the minimum and optimal thickness.
The loss of cold energy in the freezing process can be significantly reduced, and the lower temperature of the inner wall can be obtained by setting the insulation layer. The lower temperature of the inner wall can shorten the freezing time and improve freezing efficiency. In the pre-cooling zone and phase-change zone, the freezing time is obviously shortened because they consume a long time. However, the freezing time has not been significantly shortened due to the short time required in the post-freezing zone. The freezing time does not always decrease significantly with the increase of insulation layer thickness. The freezing time decreases obviously with the increase of the insulation layer thickness when the thickness is less than 1 mm. With the further increase of thickness, the freezing time decreases gradually, but the decrease is small. When the insulation thickness is greater than 2 mm, the freezing time is about the same and 44% shorter than the freezing time without insulation. The significant reduction of freezing time can reduce drilling costs and the possibility of downhole accidents. A better insulation effect can also be achieved when the insulation layer thickness is 2 mm. It is not necessary to set the thicker insulation layer for saving cost.

Author Contributions

Conceptualization, J.P. and C.H.; methodology, Y.L. (Yanliang Li); formal analysis, M.L. and C.H.; investigation, C.G. and Y.L. (Yongjiang Luo); writing—original draft preparation, C.H.; writing—review and editing, C.H. and K.B.; supervision, J.P.; funding acquisition, J.P. All authors have read and agreed to the published version of the manuscript.

Funding

This research was financially supported by the China National Nuclear Corporation (CNNC) Science Fund for Talented Young Scholars (project no.3R2205606424).

Data Availability Statement

Not applicable.

Conflicts of Interest

The authors declare no conflict of interest.

References

  1. Xing, W.L.; Wang, A.J.; Yan, Q.; Chen, S. A study of China’s uranium resources security issues: Based on analysis of China’s nuclear power development trend. Ann. Nucl. Energy 2017, 110, 1156–1164. [Google Scholar] [CrossRef]
  2. Chen, S.; Xing, W.L.; Du, X.M. Forecast of the demand and supply plan of China’s uranium resources till 2030. Int. J. Green Energy 2017, 14, 638–649. [Google Scholar] [CrossRef]
  3. Shang, D.L.; Geissler, B.; Mew, M.; Satalkina, L.; Zenk, L.; Tulsidas, H.; Barker, L.; El-Yahyaoui, A.; Hussein, A.; Taha, M.; et al. Unconventional uranium in China’s phosphate rock: Review and outlook. Renew. Sustain. Energy Rev. 2021, 140, 110740. [Google Scholar] [CrossRef]
  4. Tian, J.L.; Li, J.R.; Cheng, W.M.; Zhu, Z.; Yang, L.; Yang, Y.; Zhang, T.J. Working mechanism and rock-breaking characteristics of coring drill bit. J. Pet. Sci. Eng. 2018, 162, 348–357. [Google Scholar] [CrossRef]
  5. Belt, J.Q.; Rice, G.K. Application of statistical quality control measures for near-surface geochemical petroleum exploration. Comput. Geosci. 2002, 28, 243–260. [Google Scholar] [CrossRef]
  6. Xue, Q.L.; Wang, R.H.; Liu, B.L.; Huang, L.L. Dynamic Measurement of Spatial Attitude at Bottom Rotating Drillstring: Simulation, Experimental, and Field Test. J. Energy Resour. Technol. 2016, 138, 022903-1–022903-9. [Google Scholar] [CrossRef]
  7. Watton, T.J.; Wright, K.A.; Jerram, D.A.; Brown, R.J. The petrophysical and petrographical properties of hyaloclastite deposits: Implications for petroleum exploration. AAPG Bull. 2014, 98, 449–463. [Google Scholar] [CrossRef]
  8. Zhu, Q.; Yu, R.A.; Feng, X.X.; Li, J.G.; Sima, X.Z.; Tang, C.; Xu, Z.L.; Liu, X.X.; Si, Q.H.; Li, G.Y.; et al. Mineralogy, geochemistry, and fluid action process of uranium deposits in the Zhiluo Formation, Ordos Basin, China. Ore Geol. Rev. 2019, 111, 102984. [Google Scholar] [CrossRef]
  9. Cai, Y.; Zhang, J.; LI, Z.Y.; Guo, Q.; Song, J.; Fan, H.; Liu, W. Outline of Uranium Resources Characteristics and Metallogenetic Regularity in China. Acta Geol. Sin. 2015, 89, 918–937. [Google Scholar]
  10. Jin, R.S.; Feng, X.X.; Teng, X.M.; Nie, F.J.; Cao, H.Y.; Hou, H.Q.; Liu, H.X.; Miao, P.S.; Zhao, H.L.; Chen, L.L.; et al. Genesis of green sandstone/mudstone from Middle Jurassic Zhiluo Formation in the Dongsheng Uranium Orefield, Ordos Basin and its enlightenment for uranium mineralization. China Geol. 2020, 3, 52–66. [Google Scholar] [CrossRef]
  11. Al-Sammak, I.A.; Ahmed, K.; De, S.; Al-Bous, F.; Ahmad, F.; Abbas, F. Coring Unconsolidated Formation-Lower Fars: A Case Study. In Proceedings of the SPE Middle East Oil and Gas Show and Conference, Manama, Bahrain, 15–18 March 2009. [Google Scholar]
  12. Wang, G.Q.; Xu, H.G.; Wu, L.; Yang, Y. Preparation and Evaluation of Artificial Cores of Unconsolidated Sandstone Considering the Effect of Formation Water. Arab. J. Sci. Eng. 2021, 46, 6809–6815. [Google Scholar] [CrossRef]
  13. Yan, T.N.; Chen, B.Y.; Shi, Y.Q.; Peng, Z.B.; Wu, L. Geotechnical Drilling Technology; Central South University Press: Changsha, China, 2014. [Google Scholar]
  14. Kenneth, A.J.; Joseph, B.H. Simple modifications adapt undisturbed samples for sub-surface freezing and recorery of cohesionless soils. World Earthq. Eng. 1983, 3, 75–76. [Google Scholar]
  15. Li, Y.L.; Peng, J.M.; Huang, C.Y.; Wang, M.S. Experimental study on a sampling technique based on a freeze-sediments valve for deep-sea microorganism. Appl. Ocean. Res. 2019, 82, 470–477. [Google Scholar] [CrossRef]
  16. Luo, Y.J.; Peng, J.M.; Sun, M.Z.; Sun, Q.; Ji, T.K.; Bo, K. An ice-valve-based pressure-coring system for sampling natural hydrate-bearing sediments: Proof-of-concept laboratory studies. J. Nat. Gas Sci. Eng. 2015, 27, 1462–1469. [Google Scholar] [CrossRef]
  17. Wu, D.Y.; Peng, J.M.; Sun, M.Z.; Gao, Q.; Zhang, X.X.; Sun, Q.; Bo, K. Experimental study on a pressure-coring technology based on a freeze-core valve for marine hydrate-bearing sediment sampling. J. Nat. Gas Sci. Eng. 2016, 33, 135–142. [Google Scholar] [CrossRef]
  18. Lian, M.K.; Peng, J.M.; Huang, C.Y.; Li, Y.L.; Zhang, G. Effect of adding brush on the bottom of the ice-valve-sealed pressure-retaining device on ice formation speed. Appl. Therm. Eng. 2021, 184, 116269. [Google Scholar] [CrossRef]
  19. Dück, Y.; Lorke, A.; Jokiel, C.; Gierse, J. Laboratory and field investigations on freeze and gravity core sampling and assessment of coring disturbances with implications on gas bubble characterization. Limnol. Oceanogr. Methods 2019, 17, 585–606. [Google Scholar] [CrossRef]
  20. Hao, S.Q.; Kim, S.; Qin, Y.; Fu, X.H. Double protection drilling fluid: Optimization for sandstone-like uranium formation. Appl. Clay Sci. 2014, 88–89, 233–238. [Google Scholar] [CrossRef]
  21. Xiao, X.J. Study on Geochemistry of Low-Temperature Fluid Mineralization in Sandstone Uranium Deposits in Dongsheng Area; Beijing Research Institute of Uranium Geology: Beijing, China, 2004. [Google Scholar]
  22. Fischer, R.P.; Chen, Z.S. Prospecting marks of new uranium mining area and ore belt. World Nucl. Geosci. 1975, 4, 37–47. [Google Scholar]
  23. Jordan, P.; Heb, H. Use of artificial ground freezing in three sections of the Dusseld of subway Ground Freezing. In Proceedings of the Seventh International Symposium on Ground Freezing, Nancy, France, 24–28 October 1994. [Google Scholar]
  24. Hundy, G.H.; Trott, A.R.; Welch, T.C. Refrigeration and Air Conditioning; McGraw-Hill: New York, NY, USA, 1978. [Google Scholar]
  25. Heredia-Aricapa, Y.; Belman-Flores, J.M.; Mota-Babiloni, A.; Serrano-Arellano, J.; García-Pabón, J.J. Overview of low GWP mixtures for the replacement of HFC refrigerants: R134a, R404A and R410A. Int. J. Refrig. 2020, 111, 113–123. [Google Scholar] [CrossRef]
  26. Zhou, Z.F.; Yin, J.; Chen, B.; Liu, B.; Thrassos, P. Liquid phase model and its coupling interaction with the ambient gas for the droplet heating and evaporation of highly volatile R134a. Int. J. Heat Mass Transf. 2021, 166, 120740. [Google Scholar] [CrossRef]
  27. Yang, W.; Liu, J.P.; Wang, Y.Y.; Gao, S.J. Experimental study on the thermal conductivity of aerogel-enhanced insulating materials under various hygrothermal environments. Energy Build. 2020, 206, 109583. [Google Scholar] [CrossRef]
  28. Hu, T.F.; Liu, J.K.; Chang, J.; Hao, Z.H. Development of a novel Vapor Compression Refrigeration System (VCRS) for permafrost cooling. Cold Reg. Sci. Technol. 2021, 181, 103173. [Google Scholar] [CrossRef]
  29. Wang, Q.L.; Li, T.L.; Jia, Y.A.; Zhang, W.M. Thermodynamic performance comparison of series and parallel two-stage evaporation vapor compression refrigeration cycle. Energy Rep. 2021, 7, 1616–1626. [Google Scholar] [CrossRef]
  30. Incropera, F.P. Fundamentals of Heat and Mass Transfer, 4th ed.; John Wiley & Sons: Hoboken, NJ, USA, 1996. [Google Scholar]
Figure 1. Schematics of the novel ice coring device.
Energies 14 07448 g001
Figure 2. Schematics of preparing the sample for tests.
Energies 14 07448 g002
Figure 3. Schematics of the experimental setup.
Energies 14 07448 g003
Figure 4. Relationship between the temperature of center point and the freezing time.
Energies 14 07448 g004
Figure 5. (a) Photograph of the sand–ice valve. (b) Thermal image of the sand–ice valve.
Energies 14 07448 g005
Figure 6. Bearing capacity test of the sand–ice valve: (a) artificial sample; (b) natural sample.
Energies 14 07448 g006
Figure 7. (a) Relationship between drilling fluid temperature and time. (b) Relationship between temperature difference of drilling fluid before and after freezing, freezing time and thickness of the insulation layer.
Energies 14 07448 g007
Figure 8. Ice layer outside the ice valve tube.
Energies 14 07448 g008
Figure 9. Relationship between the inner wall temperature and time.
Energies 14 07448 g009
Figure 10. Relationship between center point temperature and time.
Energies 14 07448 g010
Figure 11. Temperature difference between the center point and the inner wall changes with time.
Energies 14 07448 g011
Table 1. Three common coring barrels for loose sandstone-type uranium deposits.
TypeFeaturesPicture of Bore Head
Single tube core barrelThe core can not keep the original shape due to the scour by drilling fluid and the wear between core tube and core.
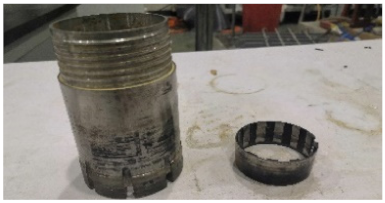
 Energies 14 07448 i001
Rigid type double tube core barrelRigid type double tube core barrel can prevent the scour of drilling fluid to the core, but it still can not avoid the wear between core tube and core. Energies 14 07448 i002
Swivel type double tube core barrelThe swivel type double tube core barrel can not only prevent the scour of drilling fluid to the core, but also avoid the wear between core tube and core. However, there are steps in the bottom of the core tube, which is easy to cause the core to be stuck and blocked. The bottom circlip can not be completely closed, and the core can easily fall off.
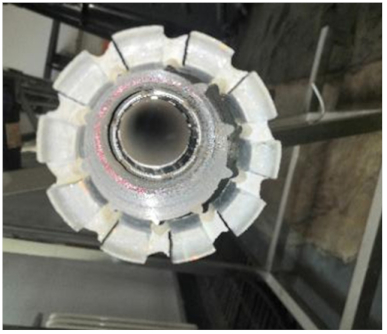
 Energies 14 07448 i003
Table 2. Composition of drilling fluid.
CompositionComponent (%)
Montmorillonite4
Na2CO31.6
KHM0.1
Na-CMC1.5
VG0.5
Water92.3
Table 3. Composition of the target strata.
COMPOSITIONPROPORTION (%)THE MAIN COMPONENT
CLASTIC80%Quartz (40~65%), Feldspar (15~35%)
CEMENT10%Silty and muddy
MISCELLANEOUS10%Clayey with pore type cement
Table 4. Technical parameters of the micro refrigeration compressor.
ModelIST BX25-DC24E
Compression typeFully enclosed rotary DC compressor
Gas displacement2.5 cc/rev
Rated refrigerating capacity175 w–500 w
Rated input power70 w–160 w
PowerDC 24 V
Rated current5.5 A
Compressor dimensionsHeight: 115 mm; diameter: 60 mm
Publisher’s Note: MDPI stays neutral with regard to jurisdictional claims in published maps and institutional affiliations.

