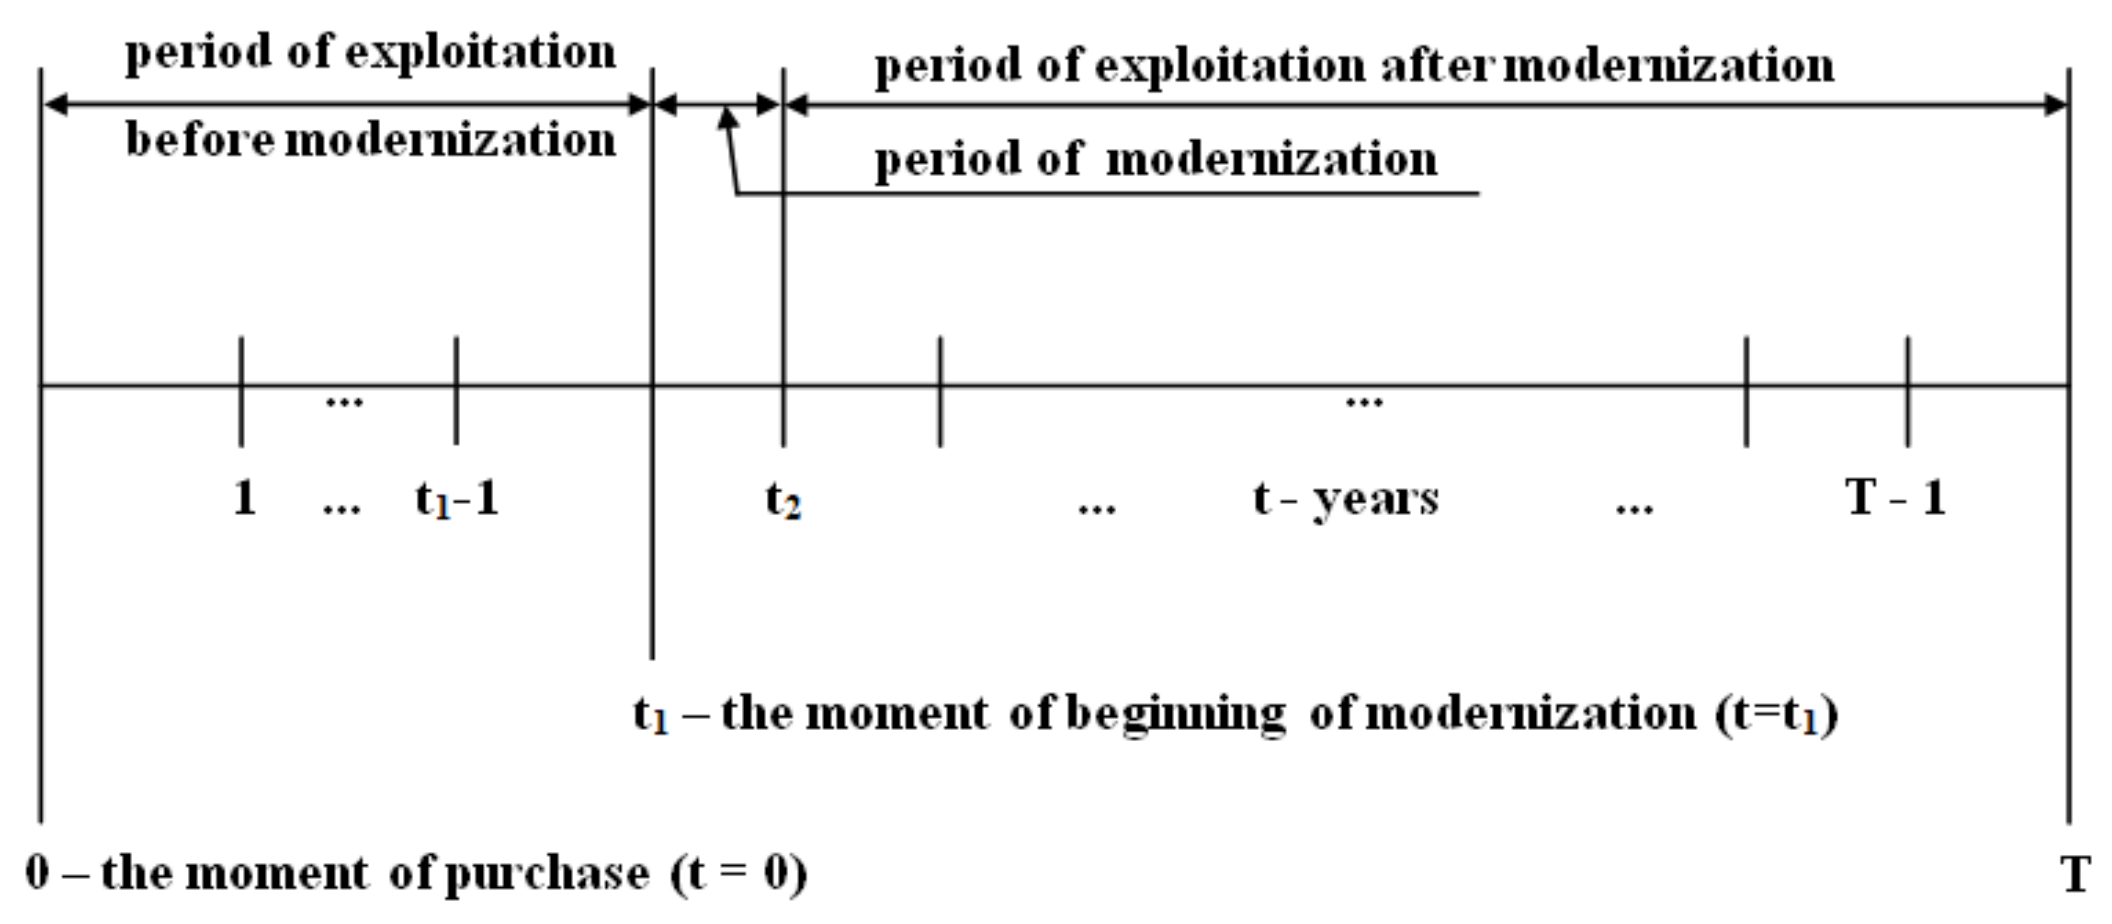
Figure 1.
Diagram of operation of repowered power plant, CHP plant and heating plant [
10].
Figure 1.
Diagram of operation of repowered power plant, CHP plant and heating plant [
10].
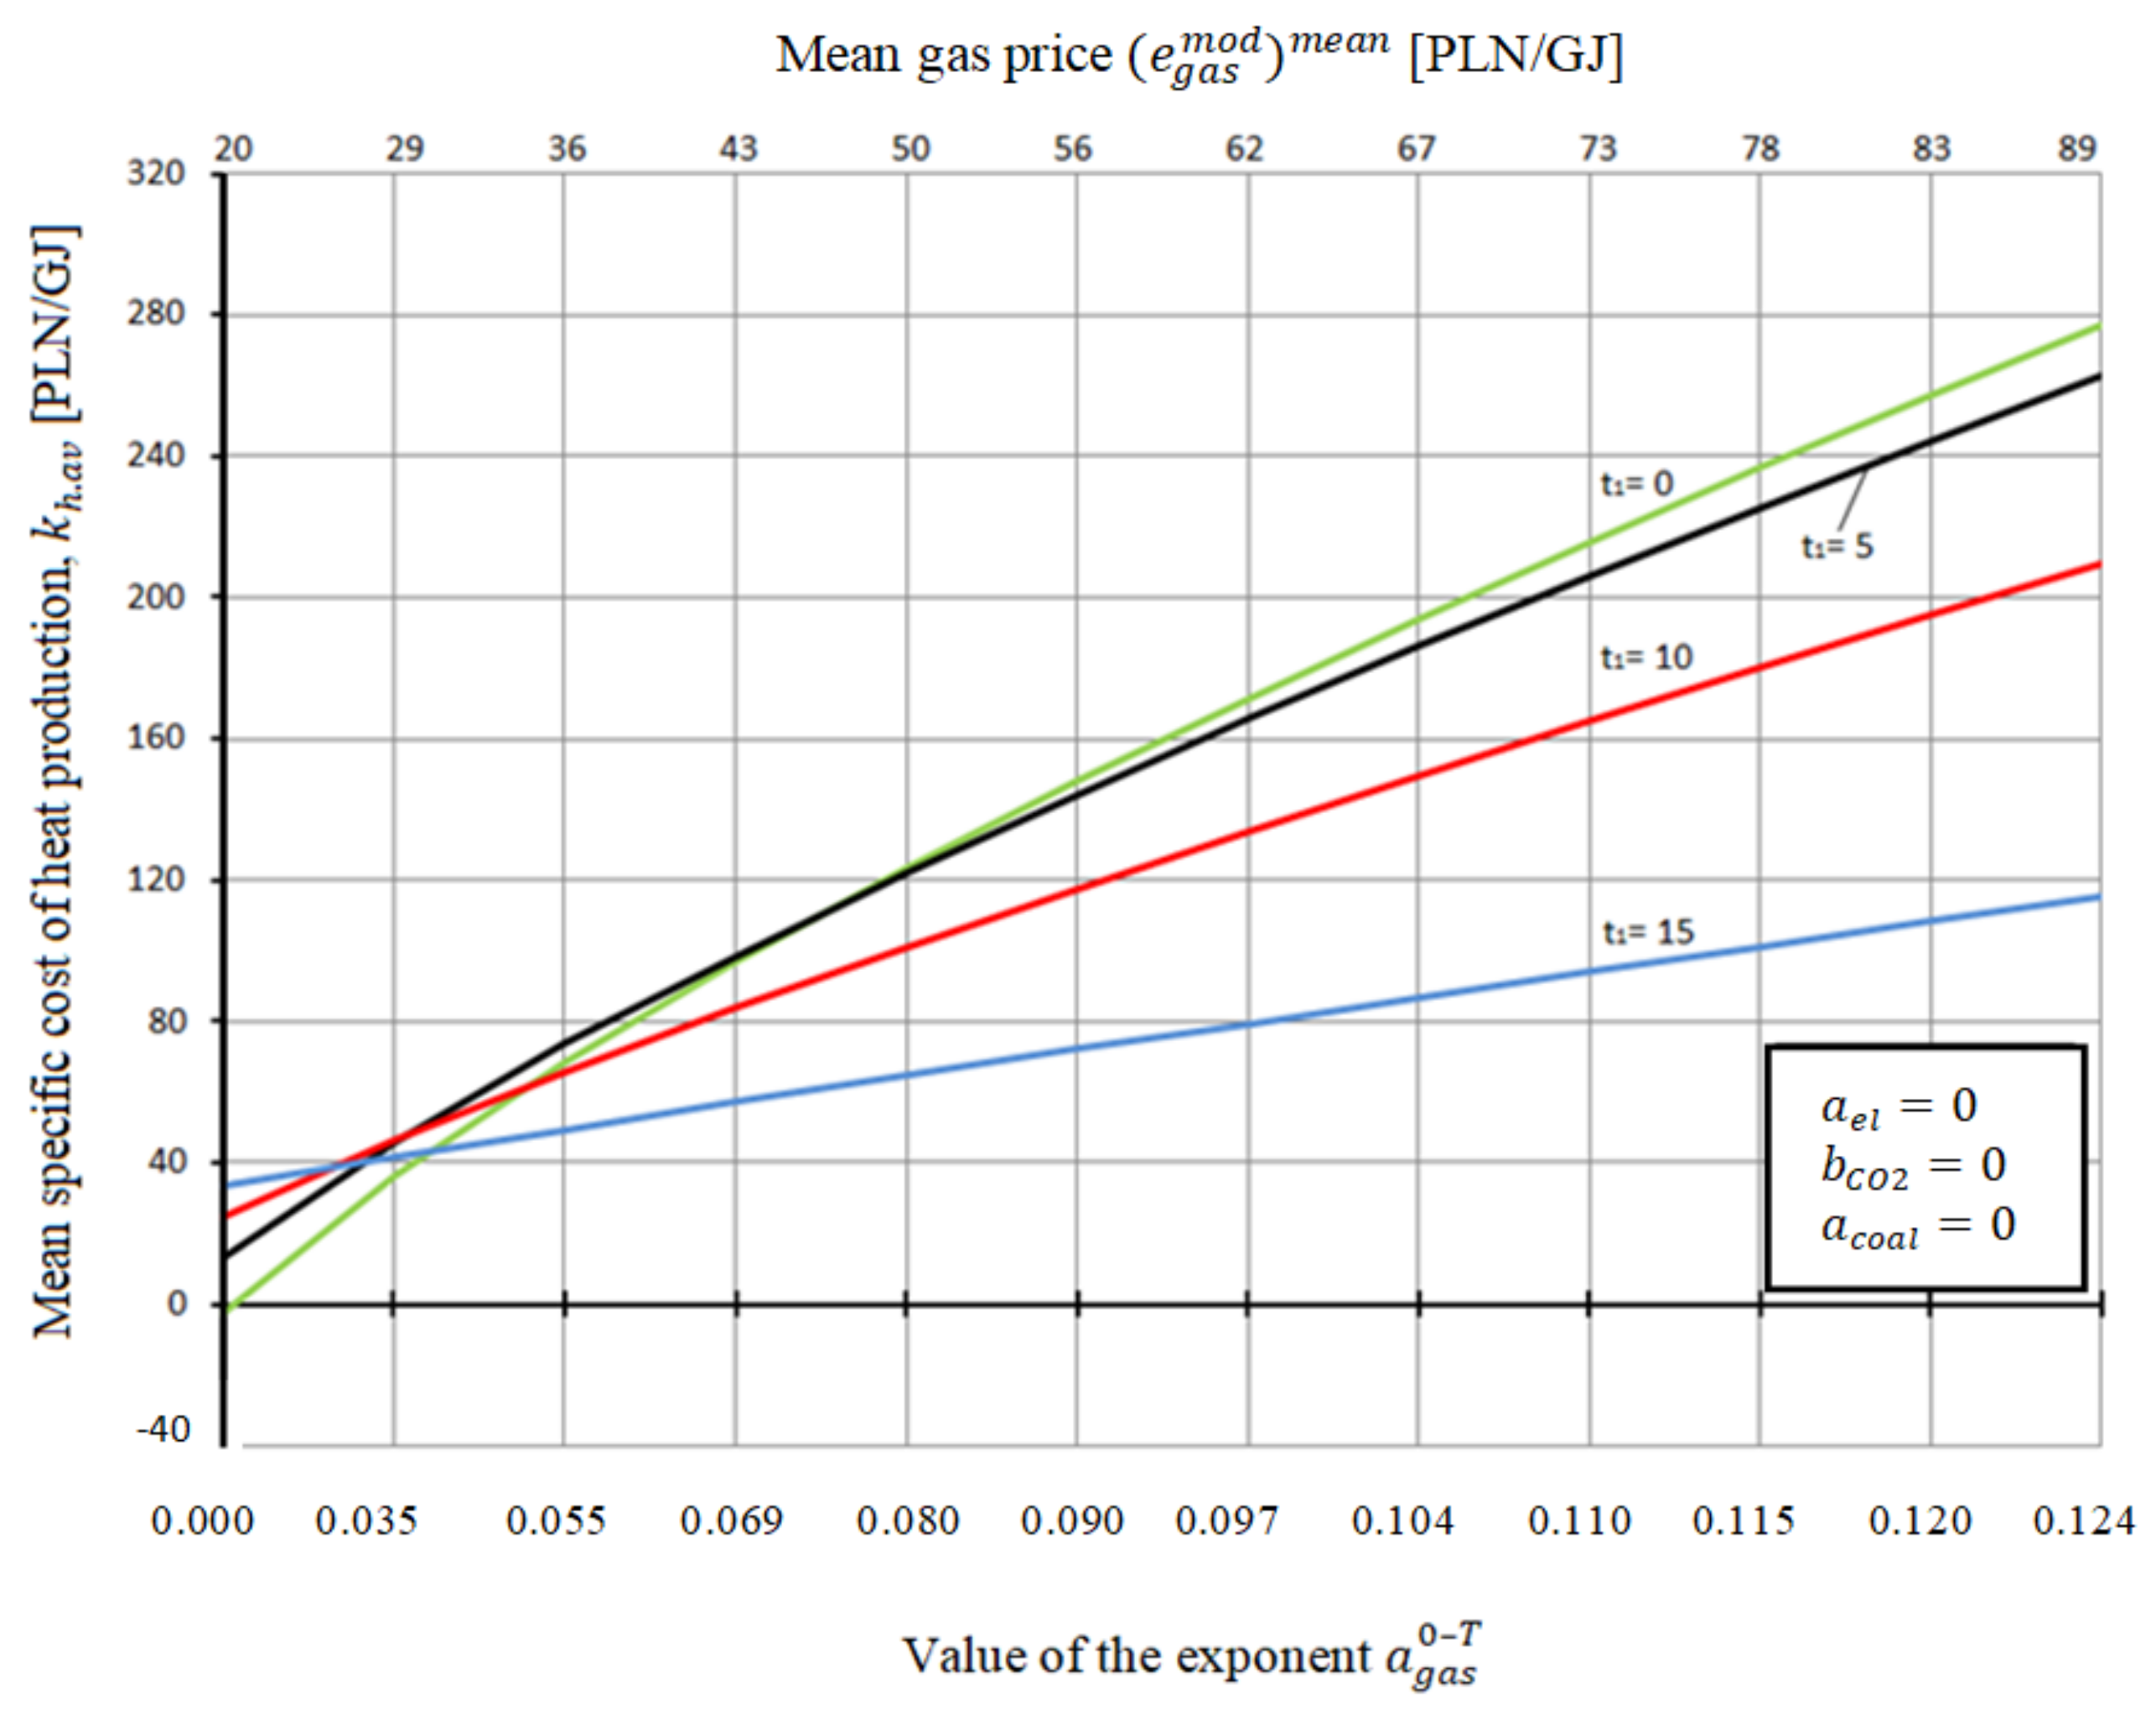
Figure 2.
Specific cost of heat production in a heating plant repowered to a single-fuel gas–steam CHP plant in the function of the mean gas price and value of the exponent depending on the year t1, corresponding to the initiation of the modernization.
Figure 2.
Specific cost of heat production in a heating plant repowered to a single-fuel gas–steam CHP plant in the function of the mean gas price and value of the exponent depending on the year t1, corresponding to the initiation of the modernization.
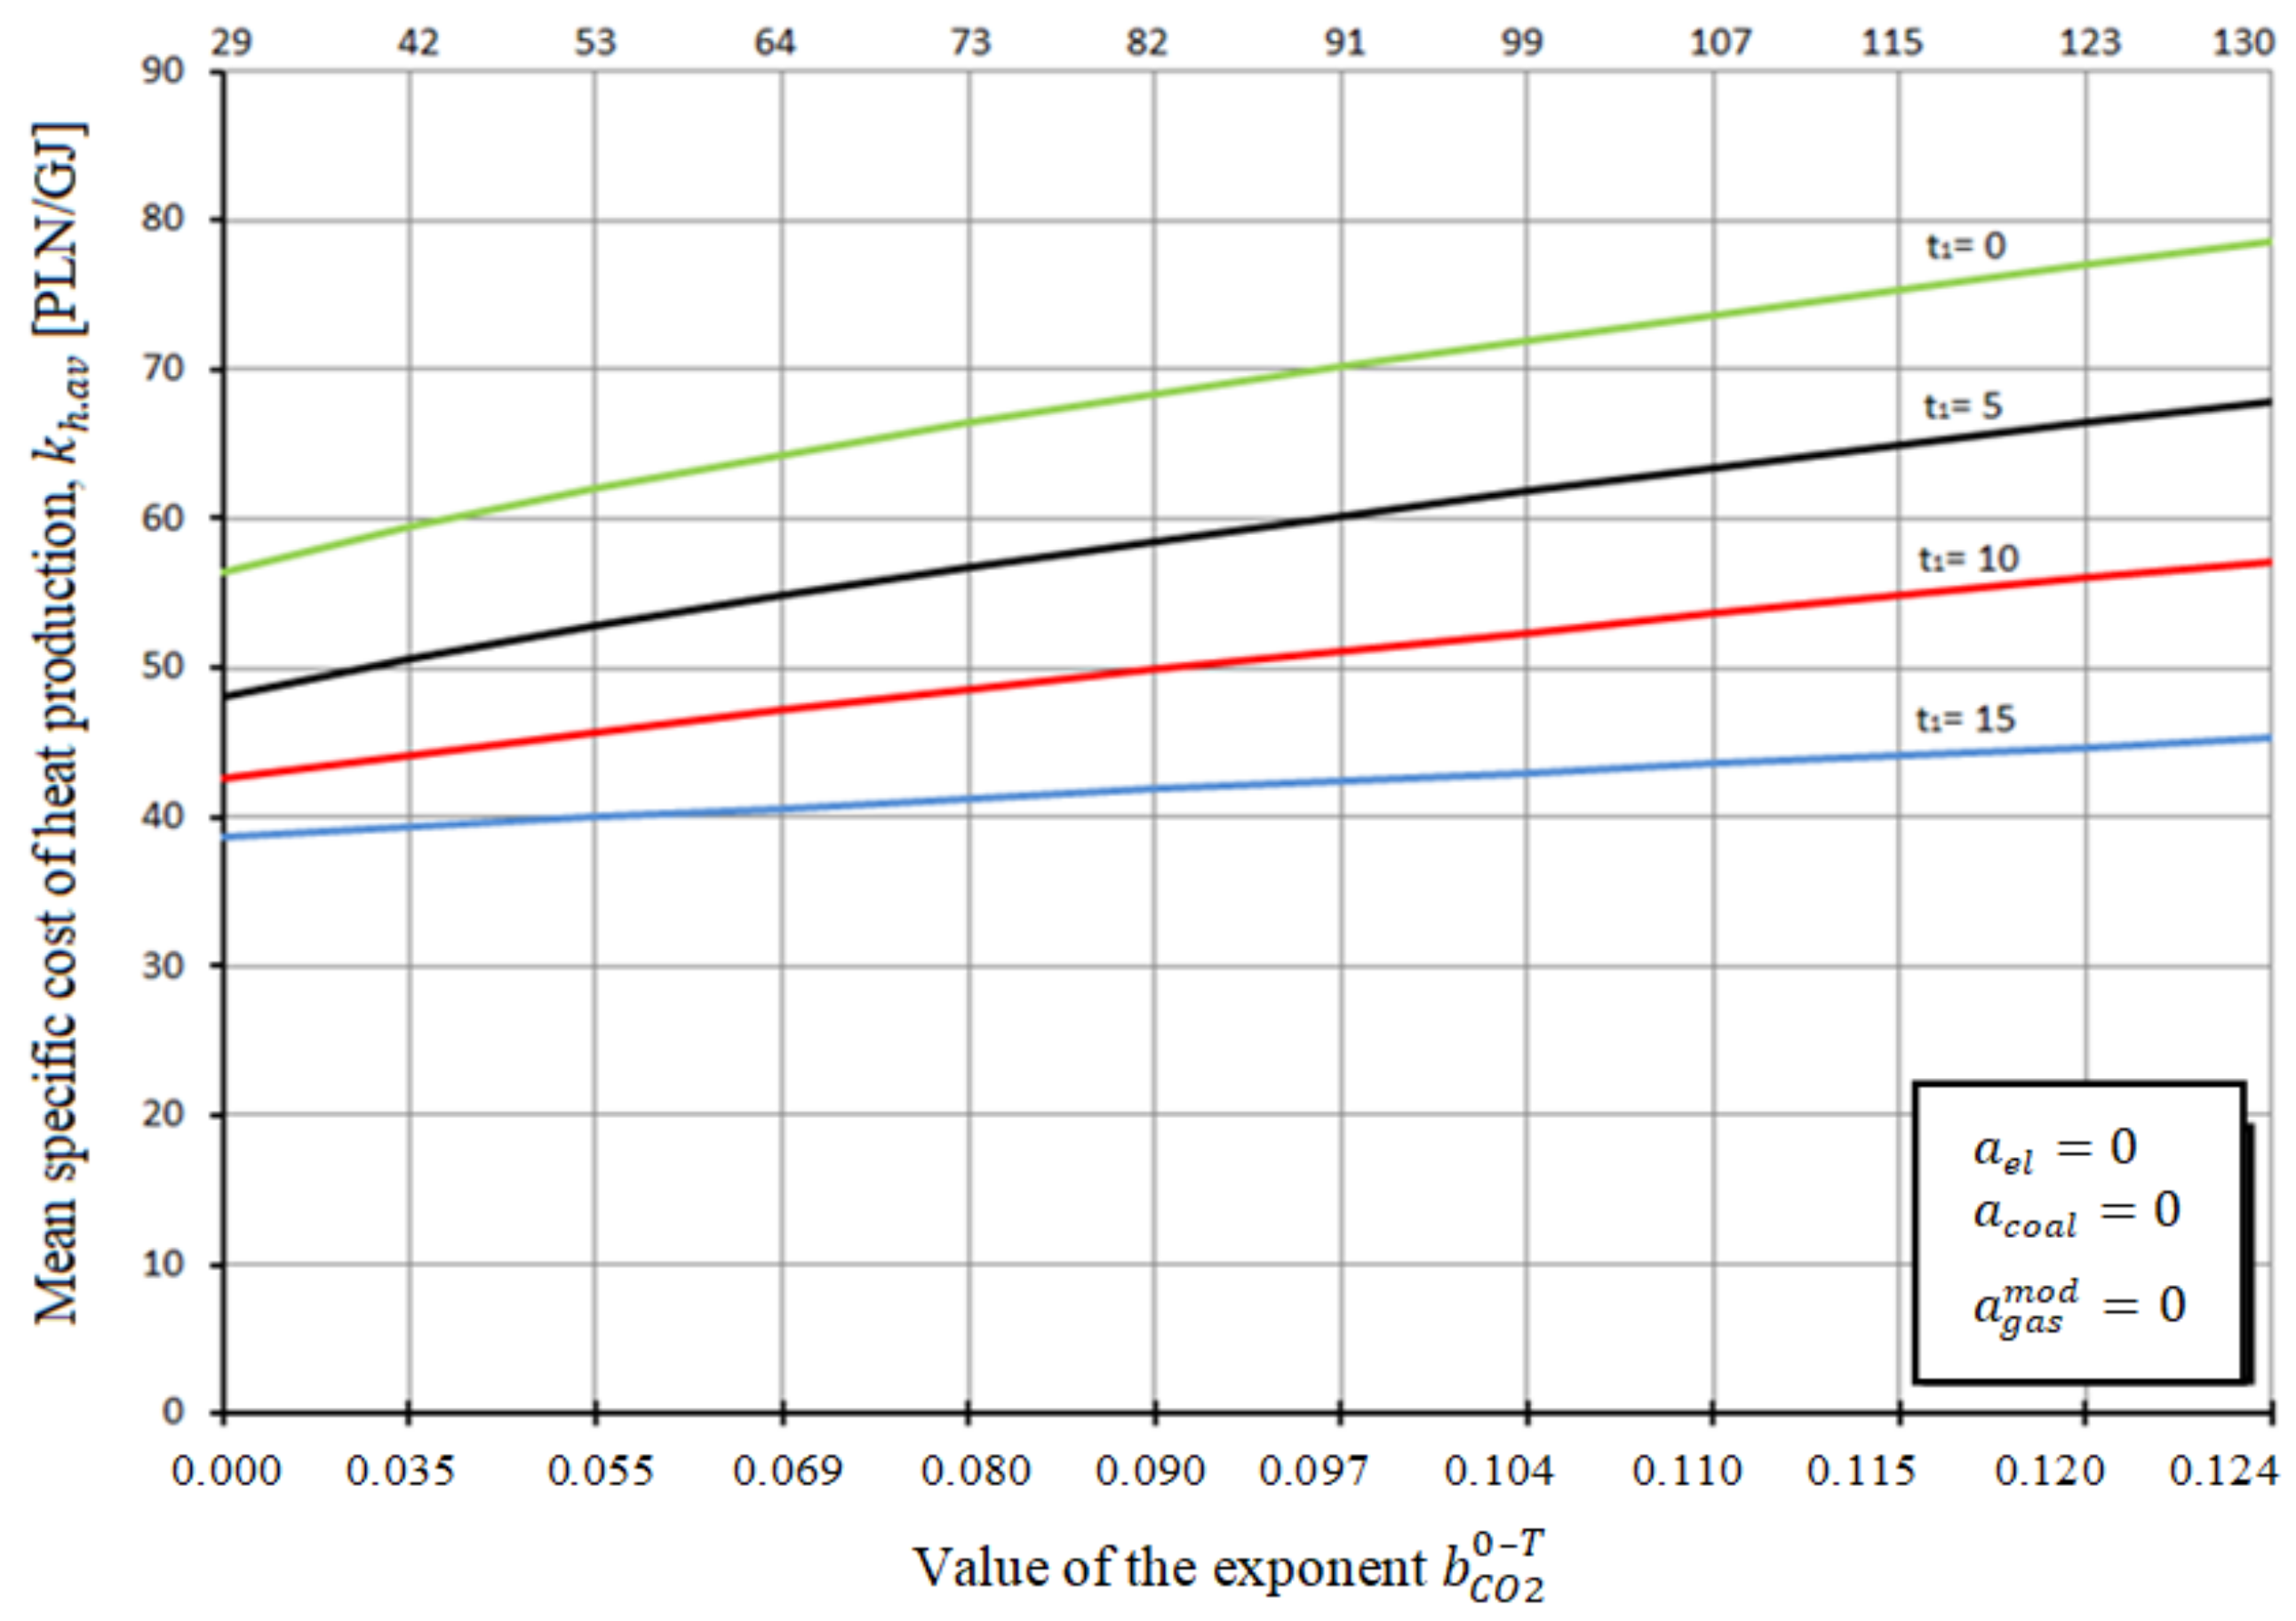
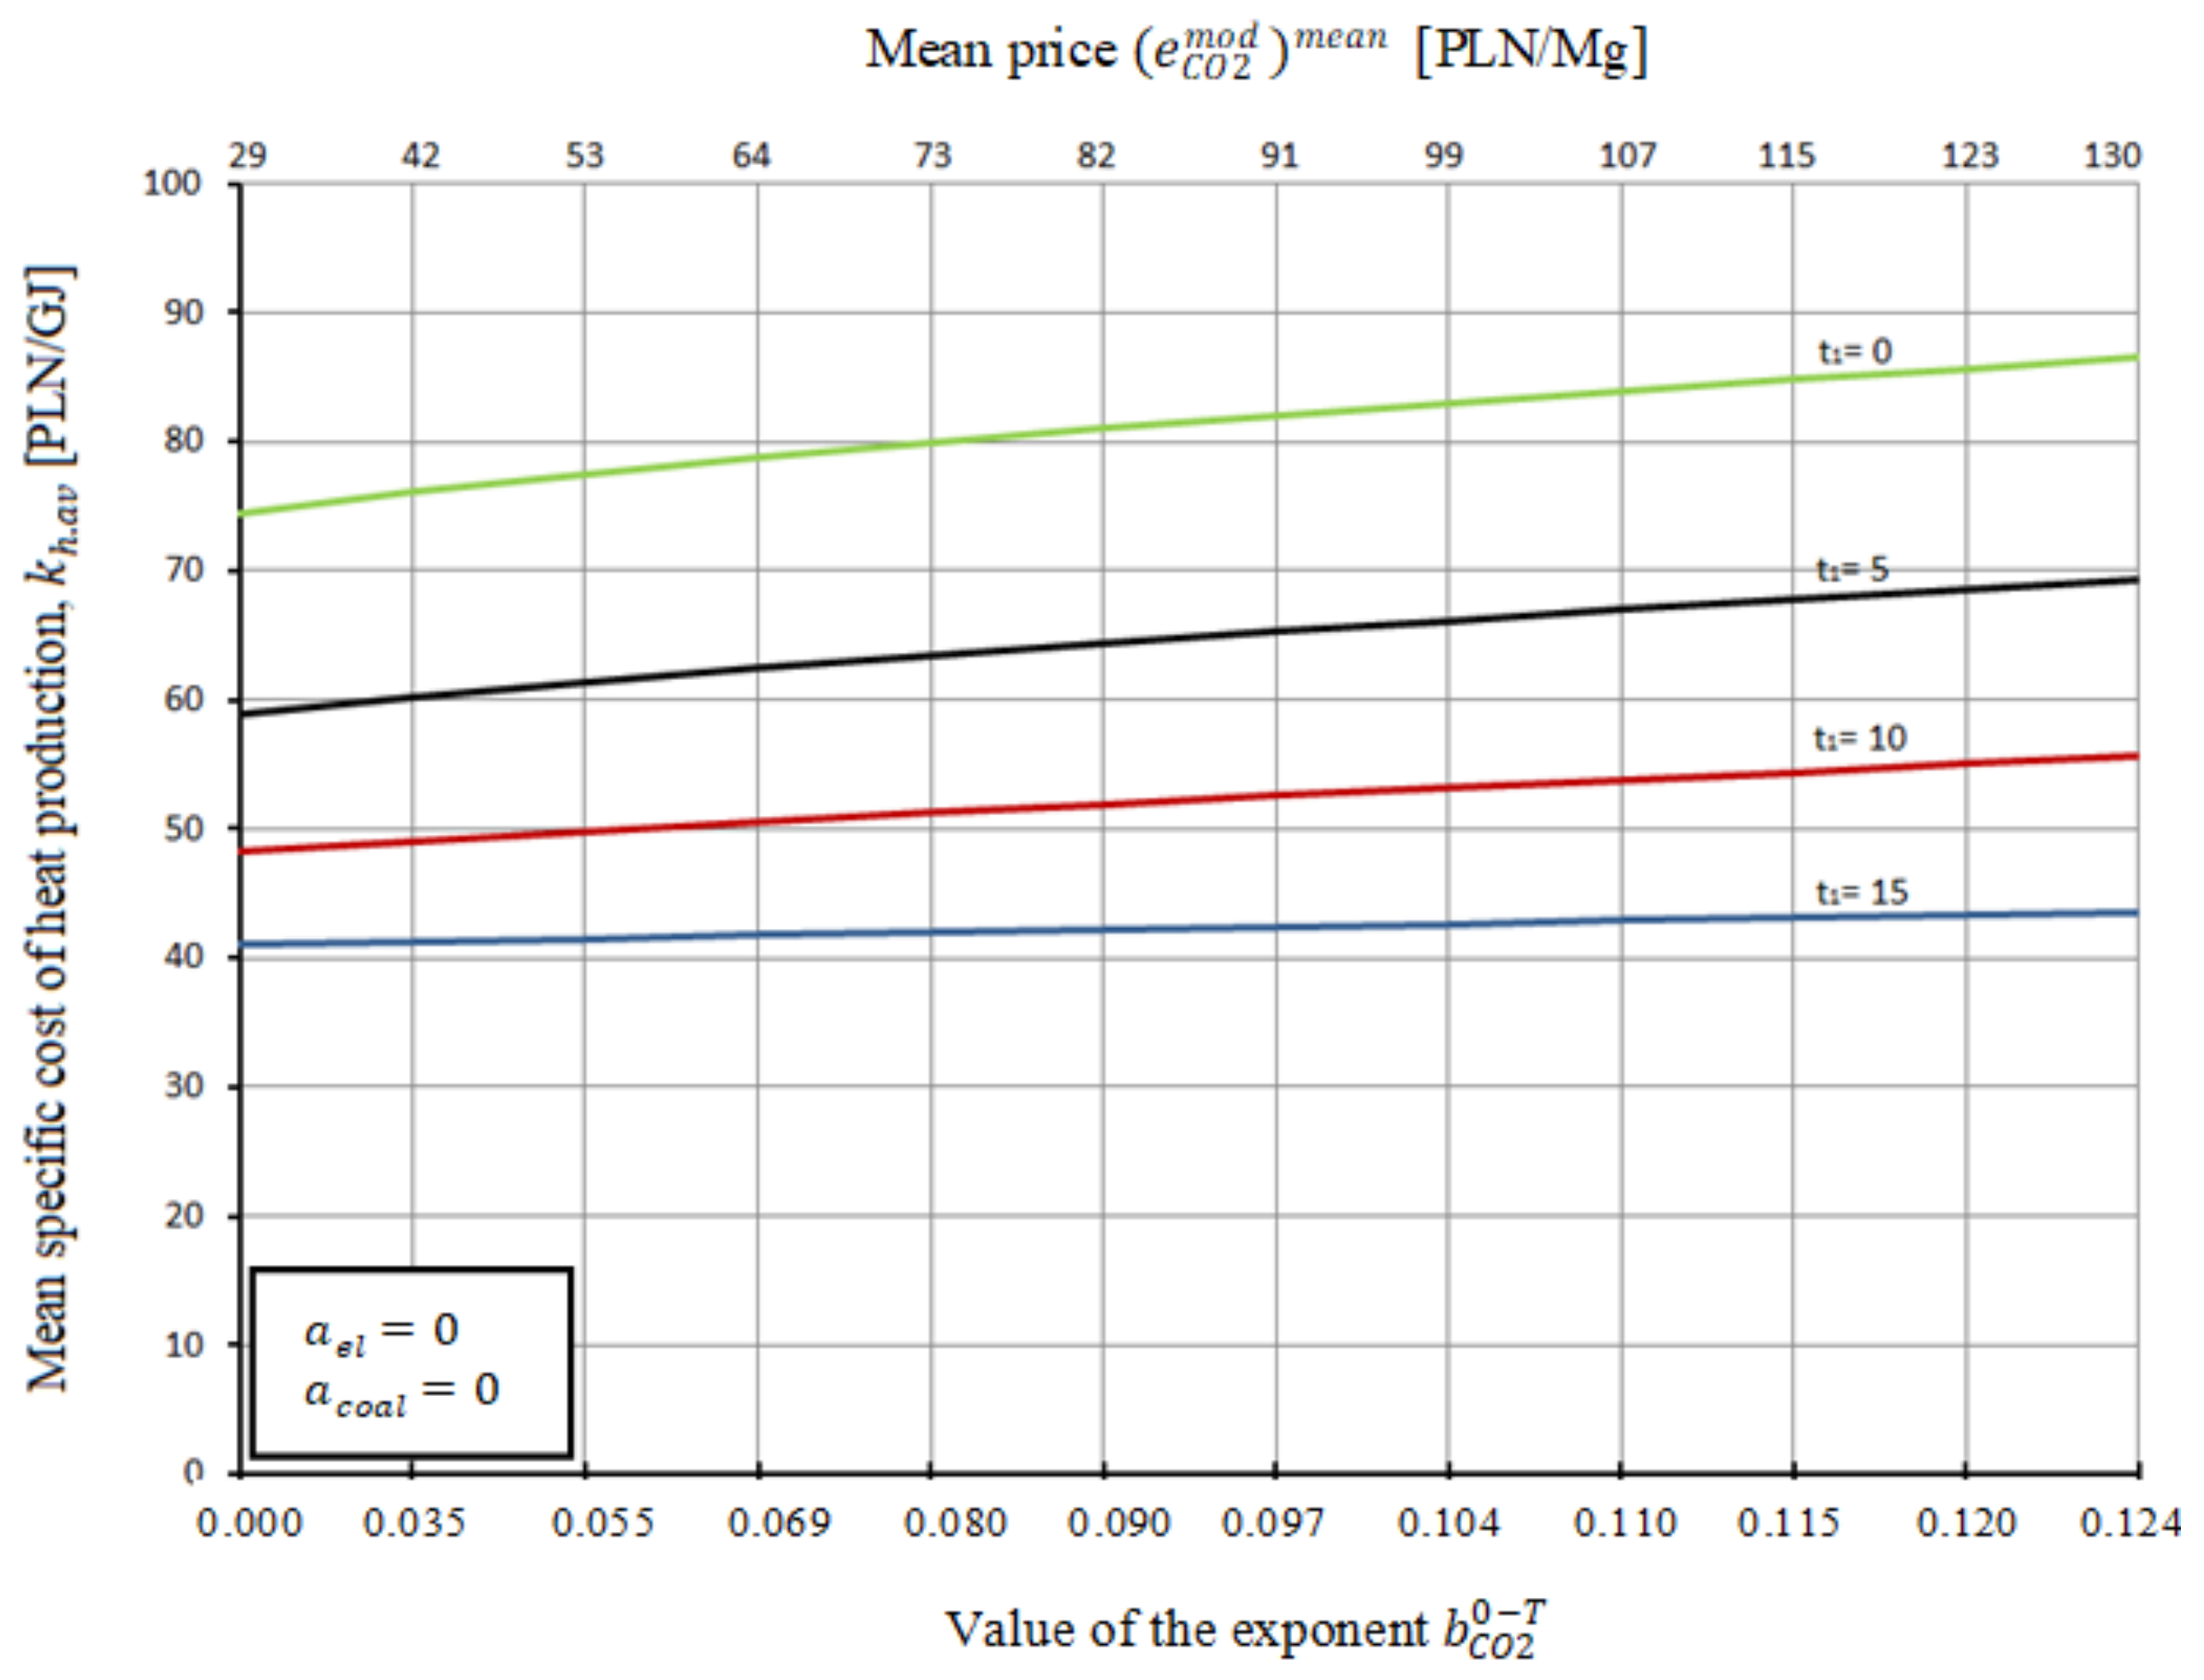
Figure 3.
Specific cost of heat production in a heating plant repowered to a single-fuel gas–steam CHP plant in the function of the mean price of CO2 emissions and value of the exponent depending on the year t1, corresponding to the initiation of the modernization.
Figure 3.
Specific cost of heat production in a heating plant repowered to a single-fuel gas–steam CHP plant in the function of the mean price of CO2 emissions and value of the exponent depending on the year t1, corresponding to the initiation of the modernization.
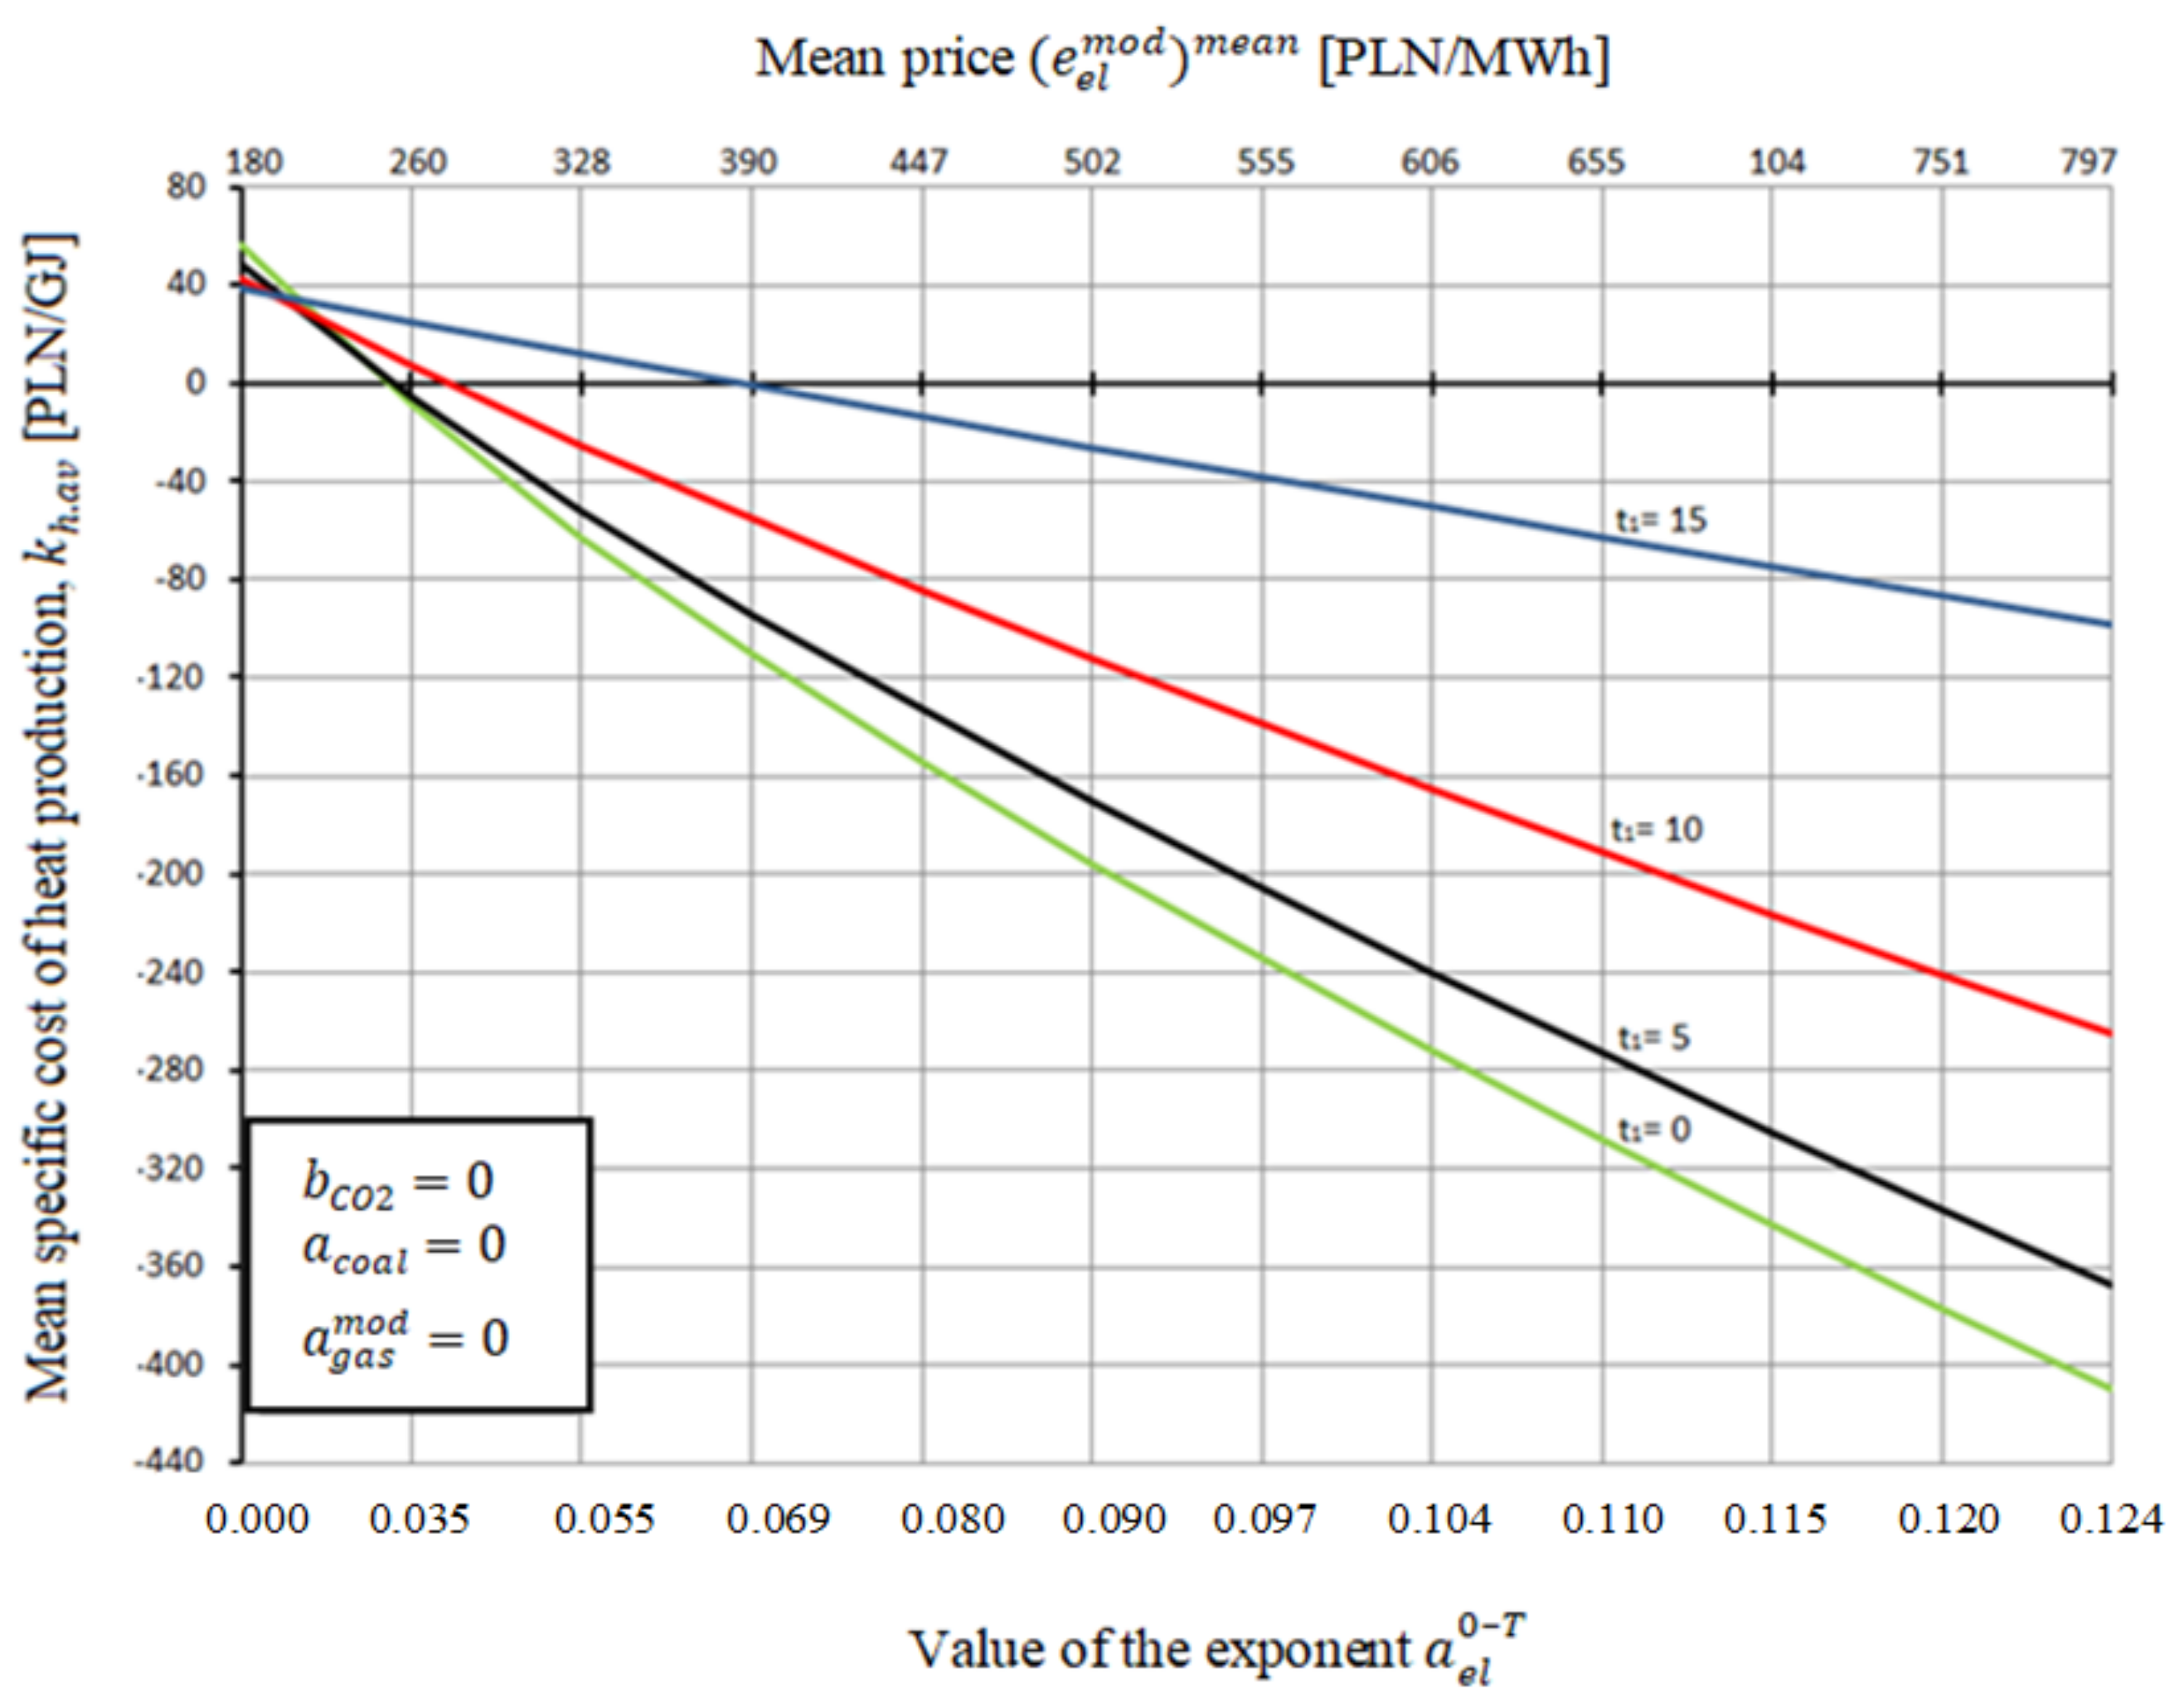
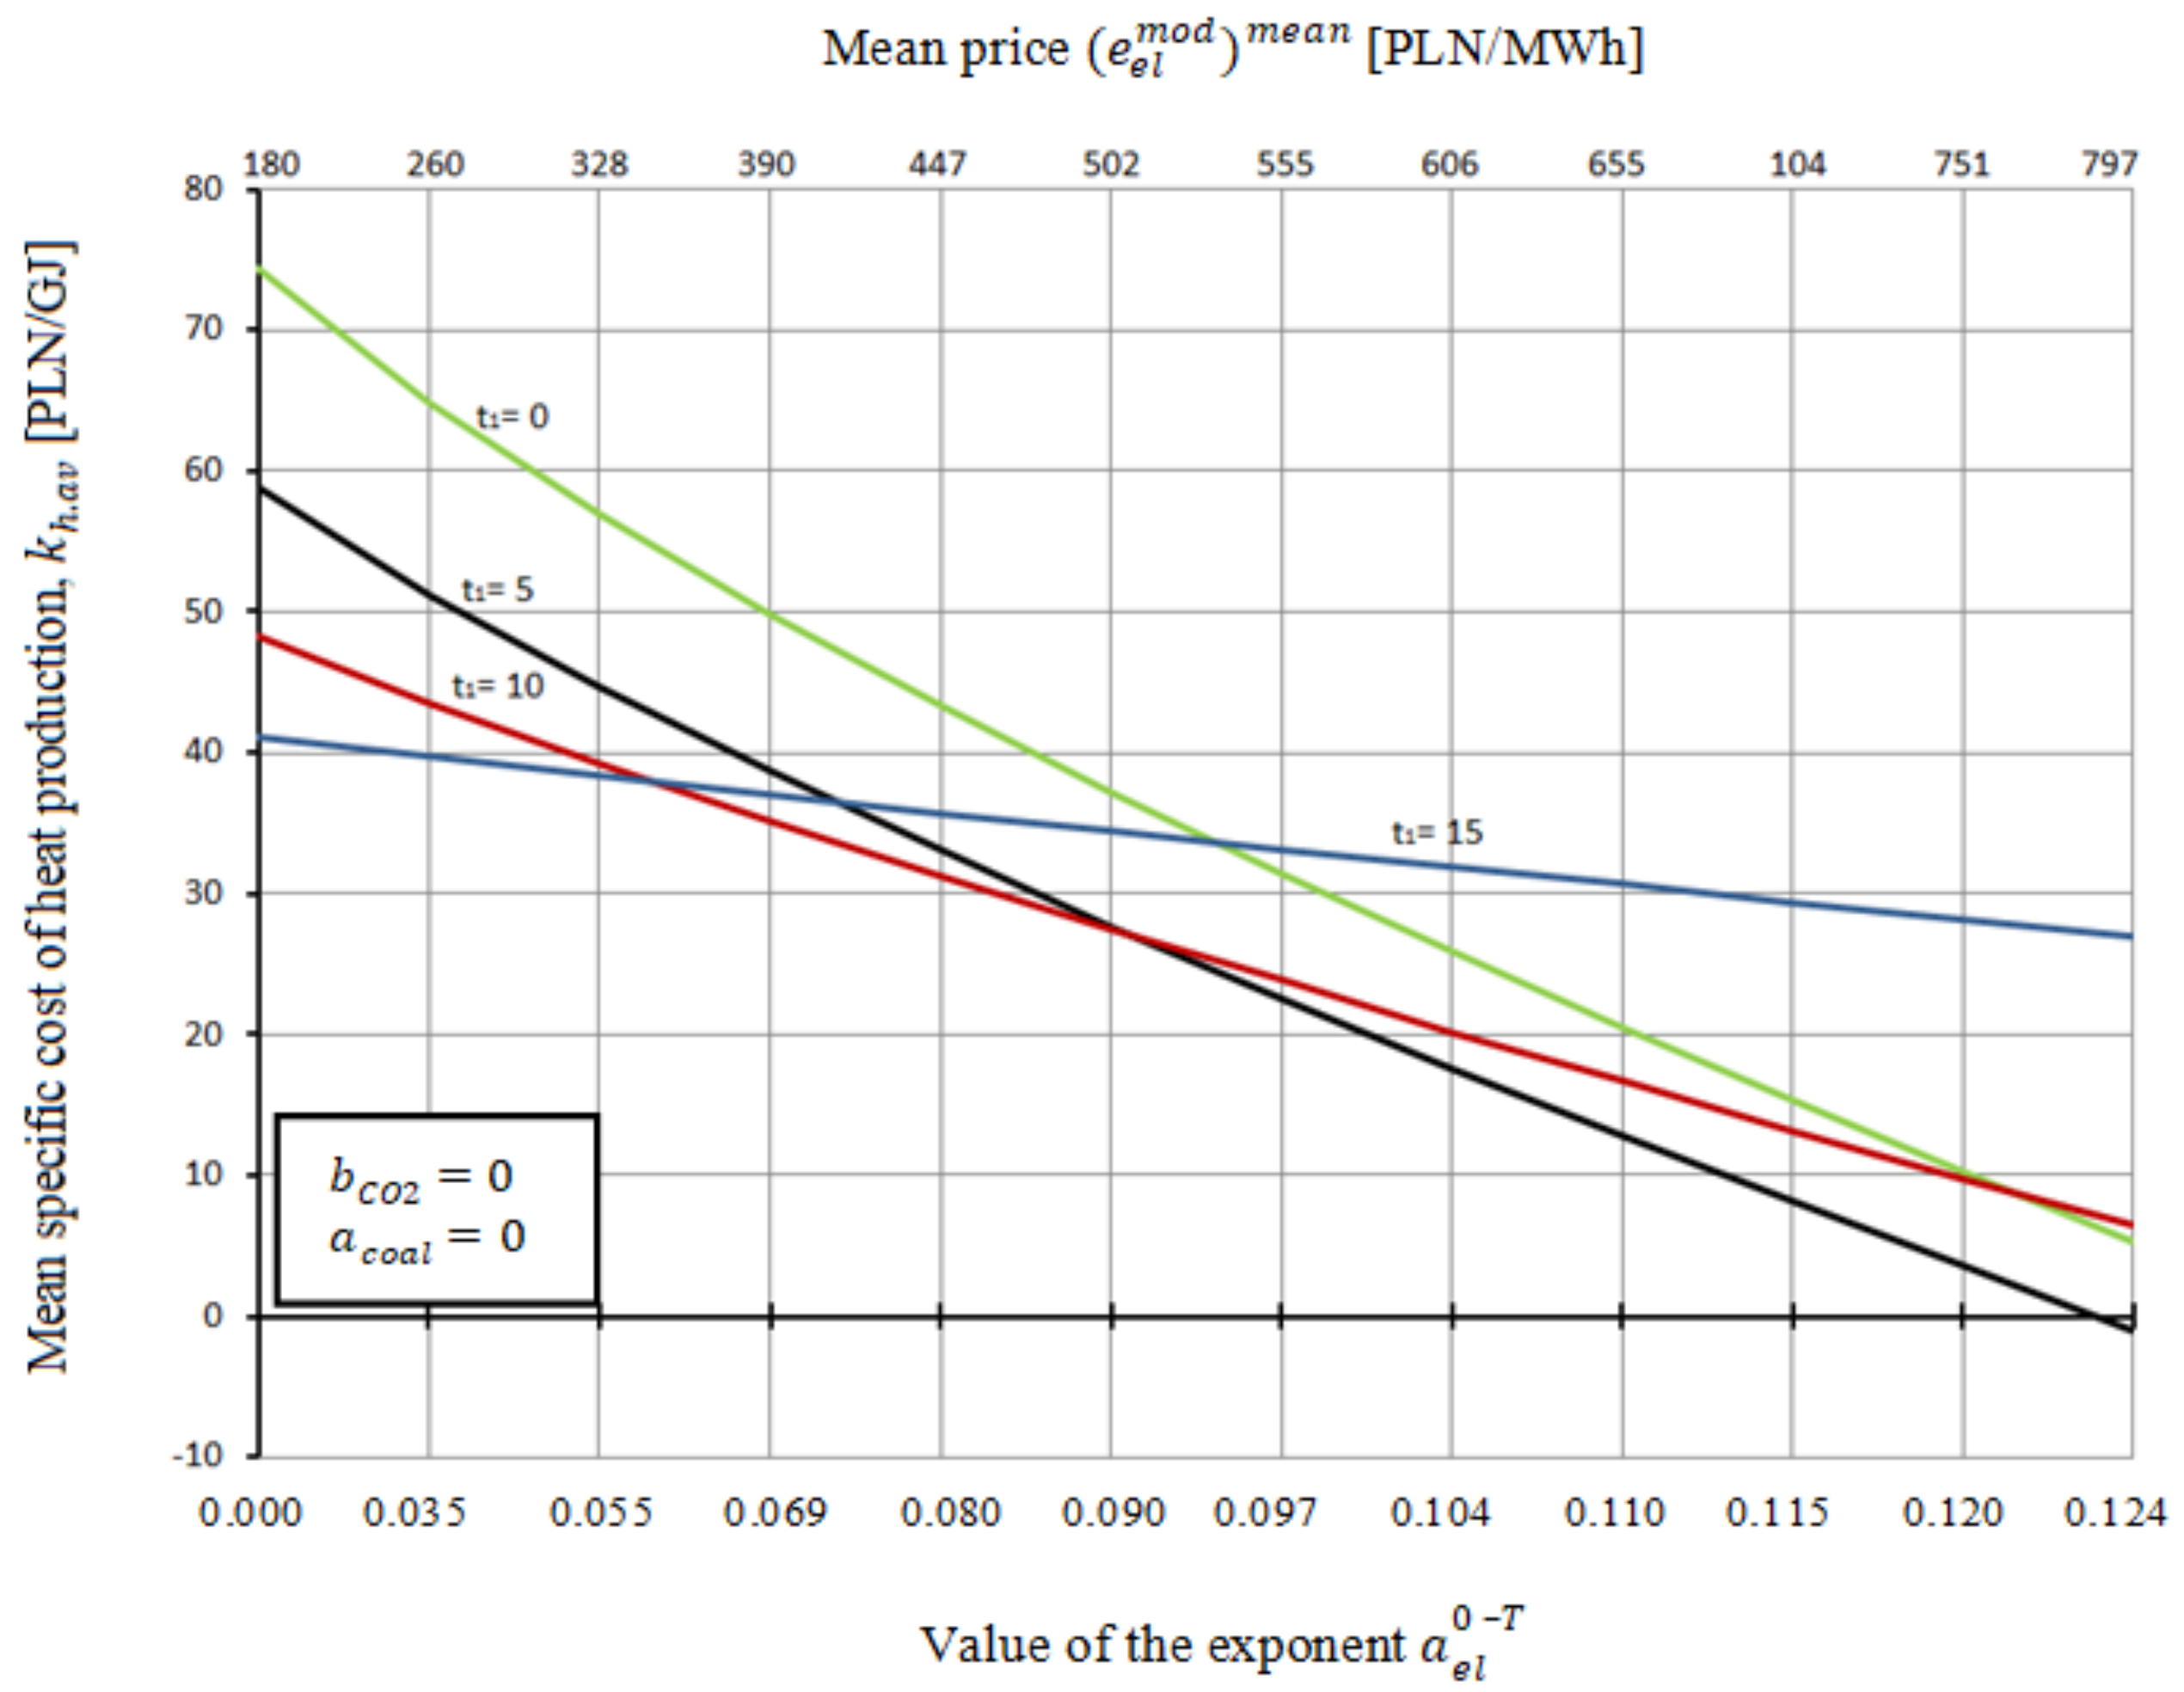
Figure 4.
Specific cost of heat production in a heating plant repowered to a single-fuel gas–steam CHP plant in the function of the mean price of electricity and value of the exponent depending on the year t1, corresponding to the initiation of the modernization.
Figure 4.
Specific cost of heat production in a heating plant repowered to a single-fuel gas–steam CHP plant in the function of the mean price of electricity and value of the exponent depending on the year t1, corresponding to the initiation of the modernization.
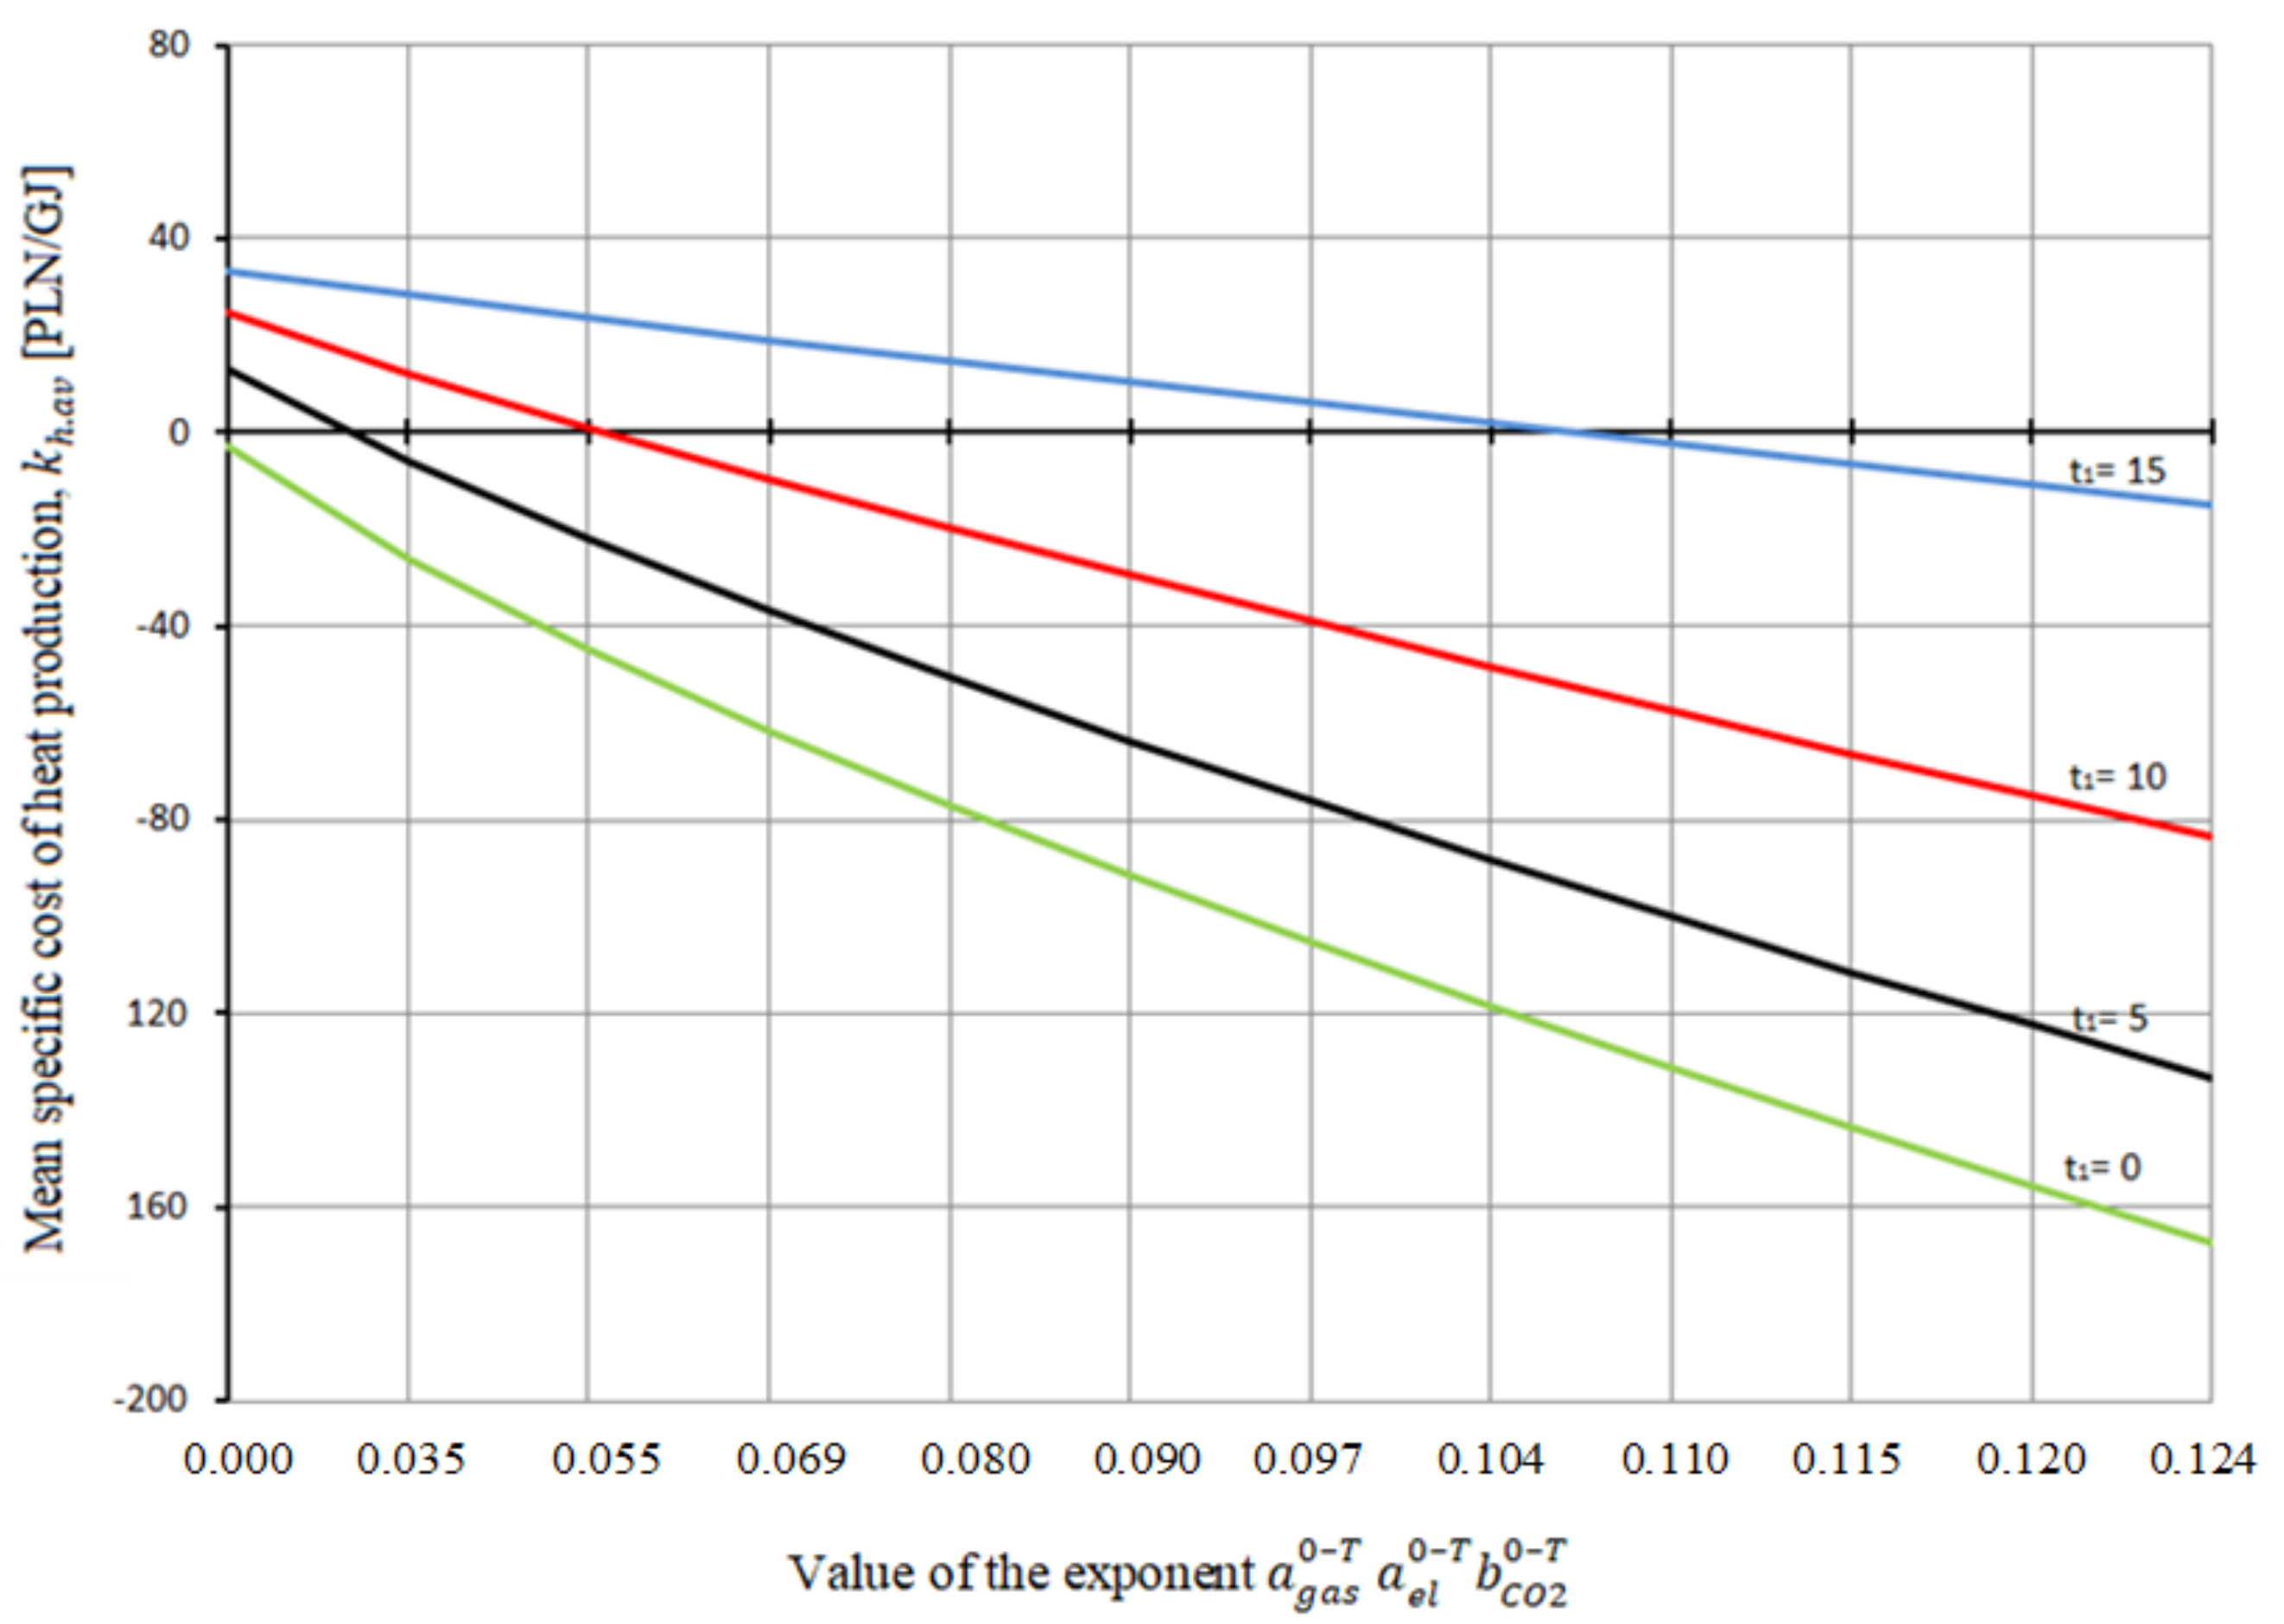
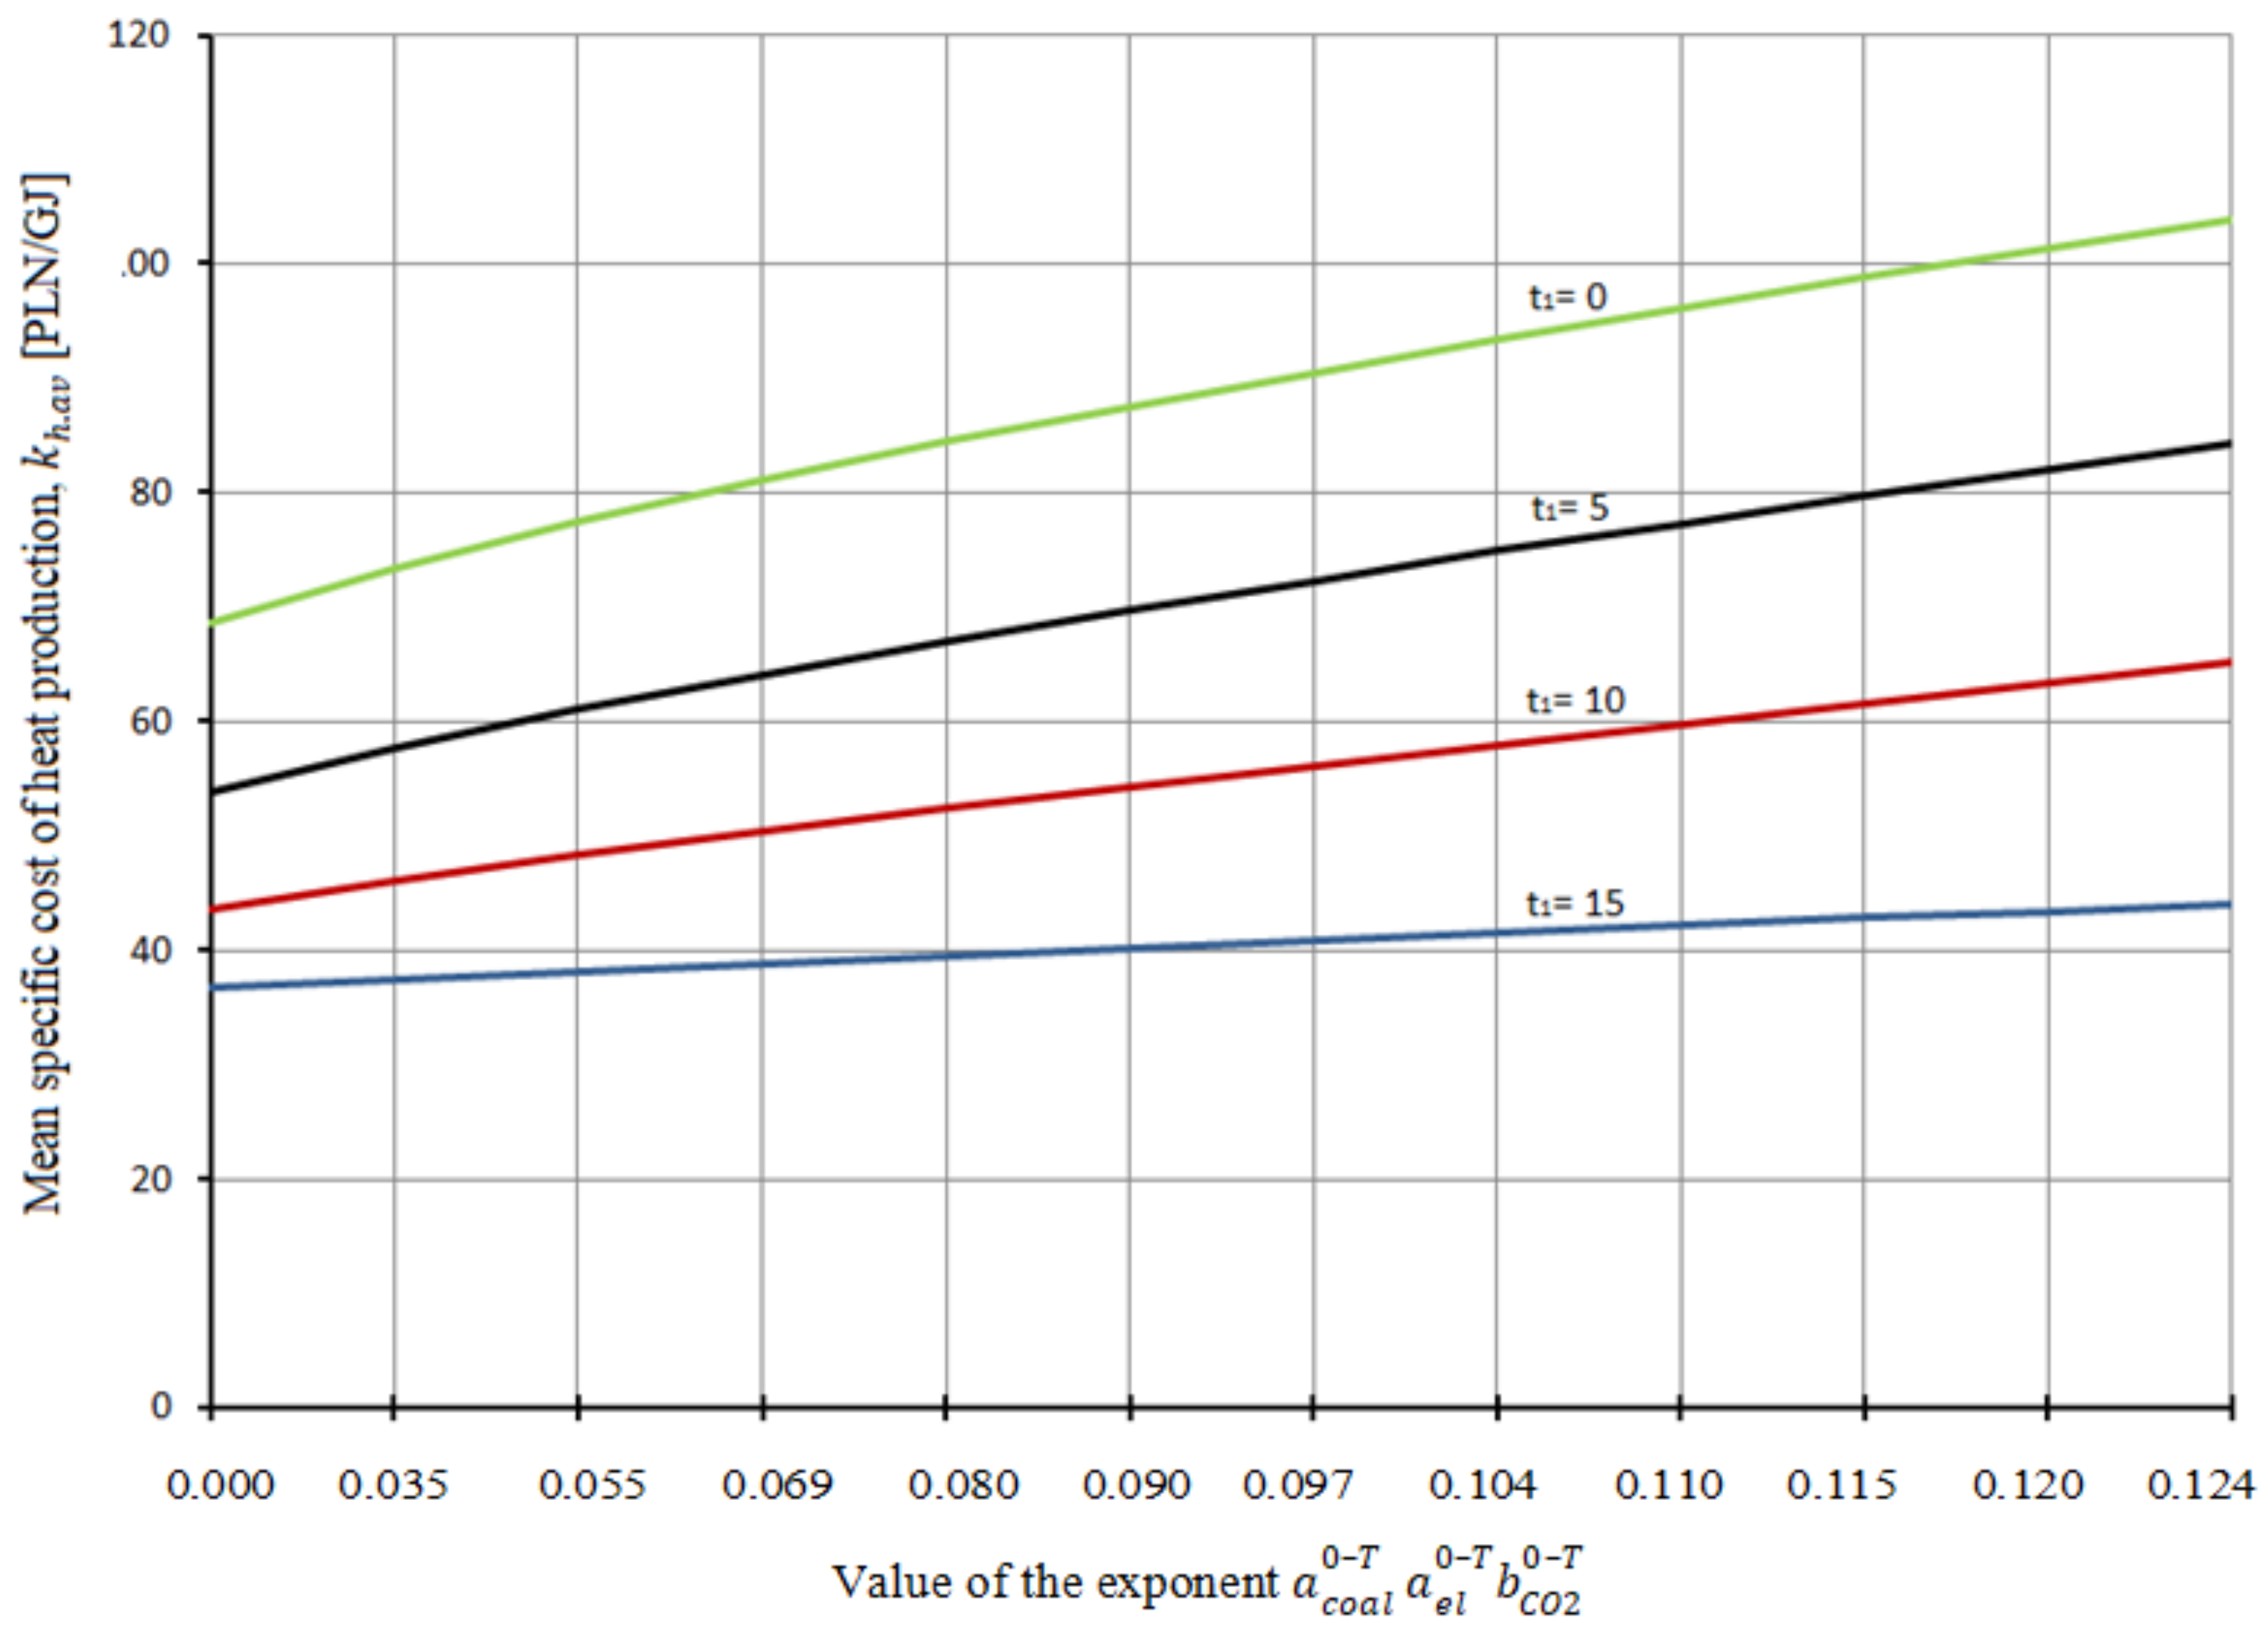
Figure 5.
Specific cost of heat production in a heating plant repowered to a single-fuel gas–steam CHP plant in the function of the value of the exponent depending on the year t1, corresponding to the initiation of the modernization.
Figure 5.
Specific cost of heat production in a heating plant repowered to a single-fuel gas–steam CHP plant in the function of the value of the exponent depending on the year t1, corresponding to the initiation of the modernization.
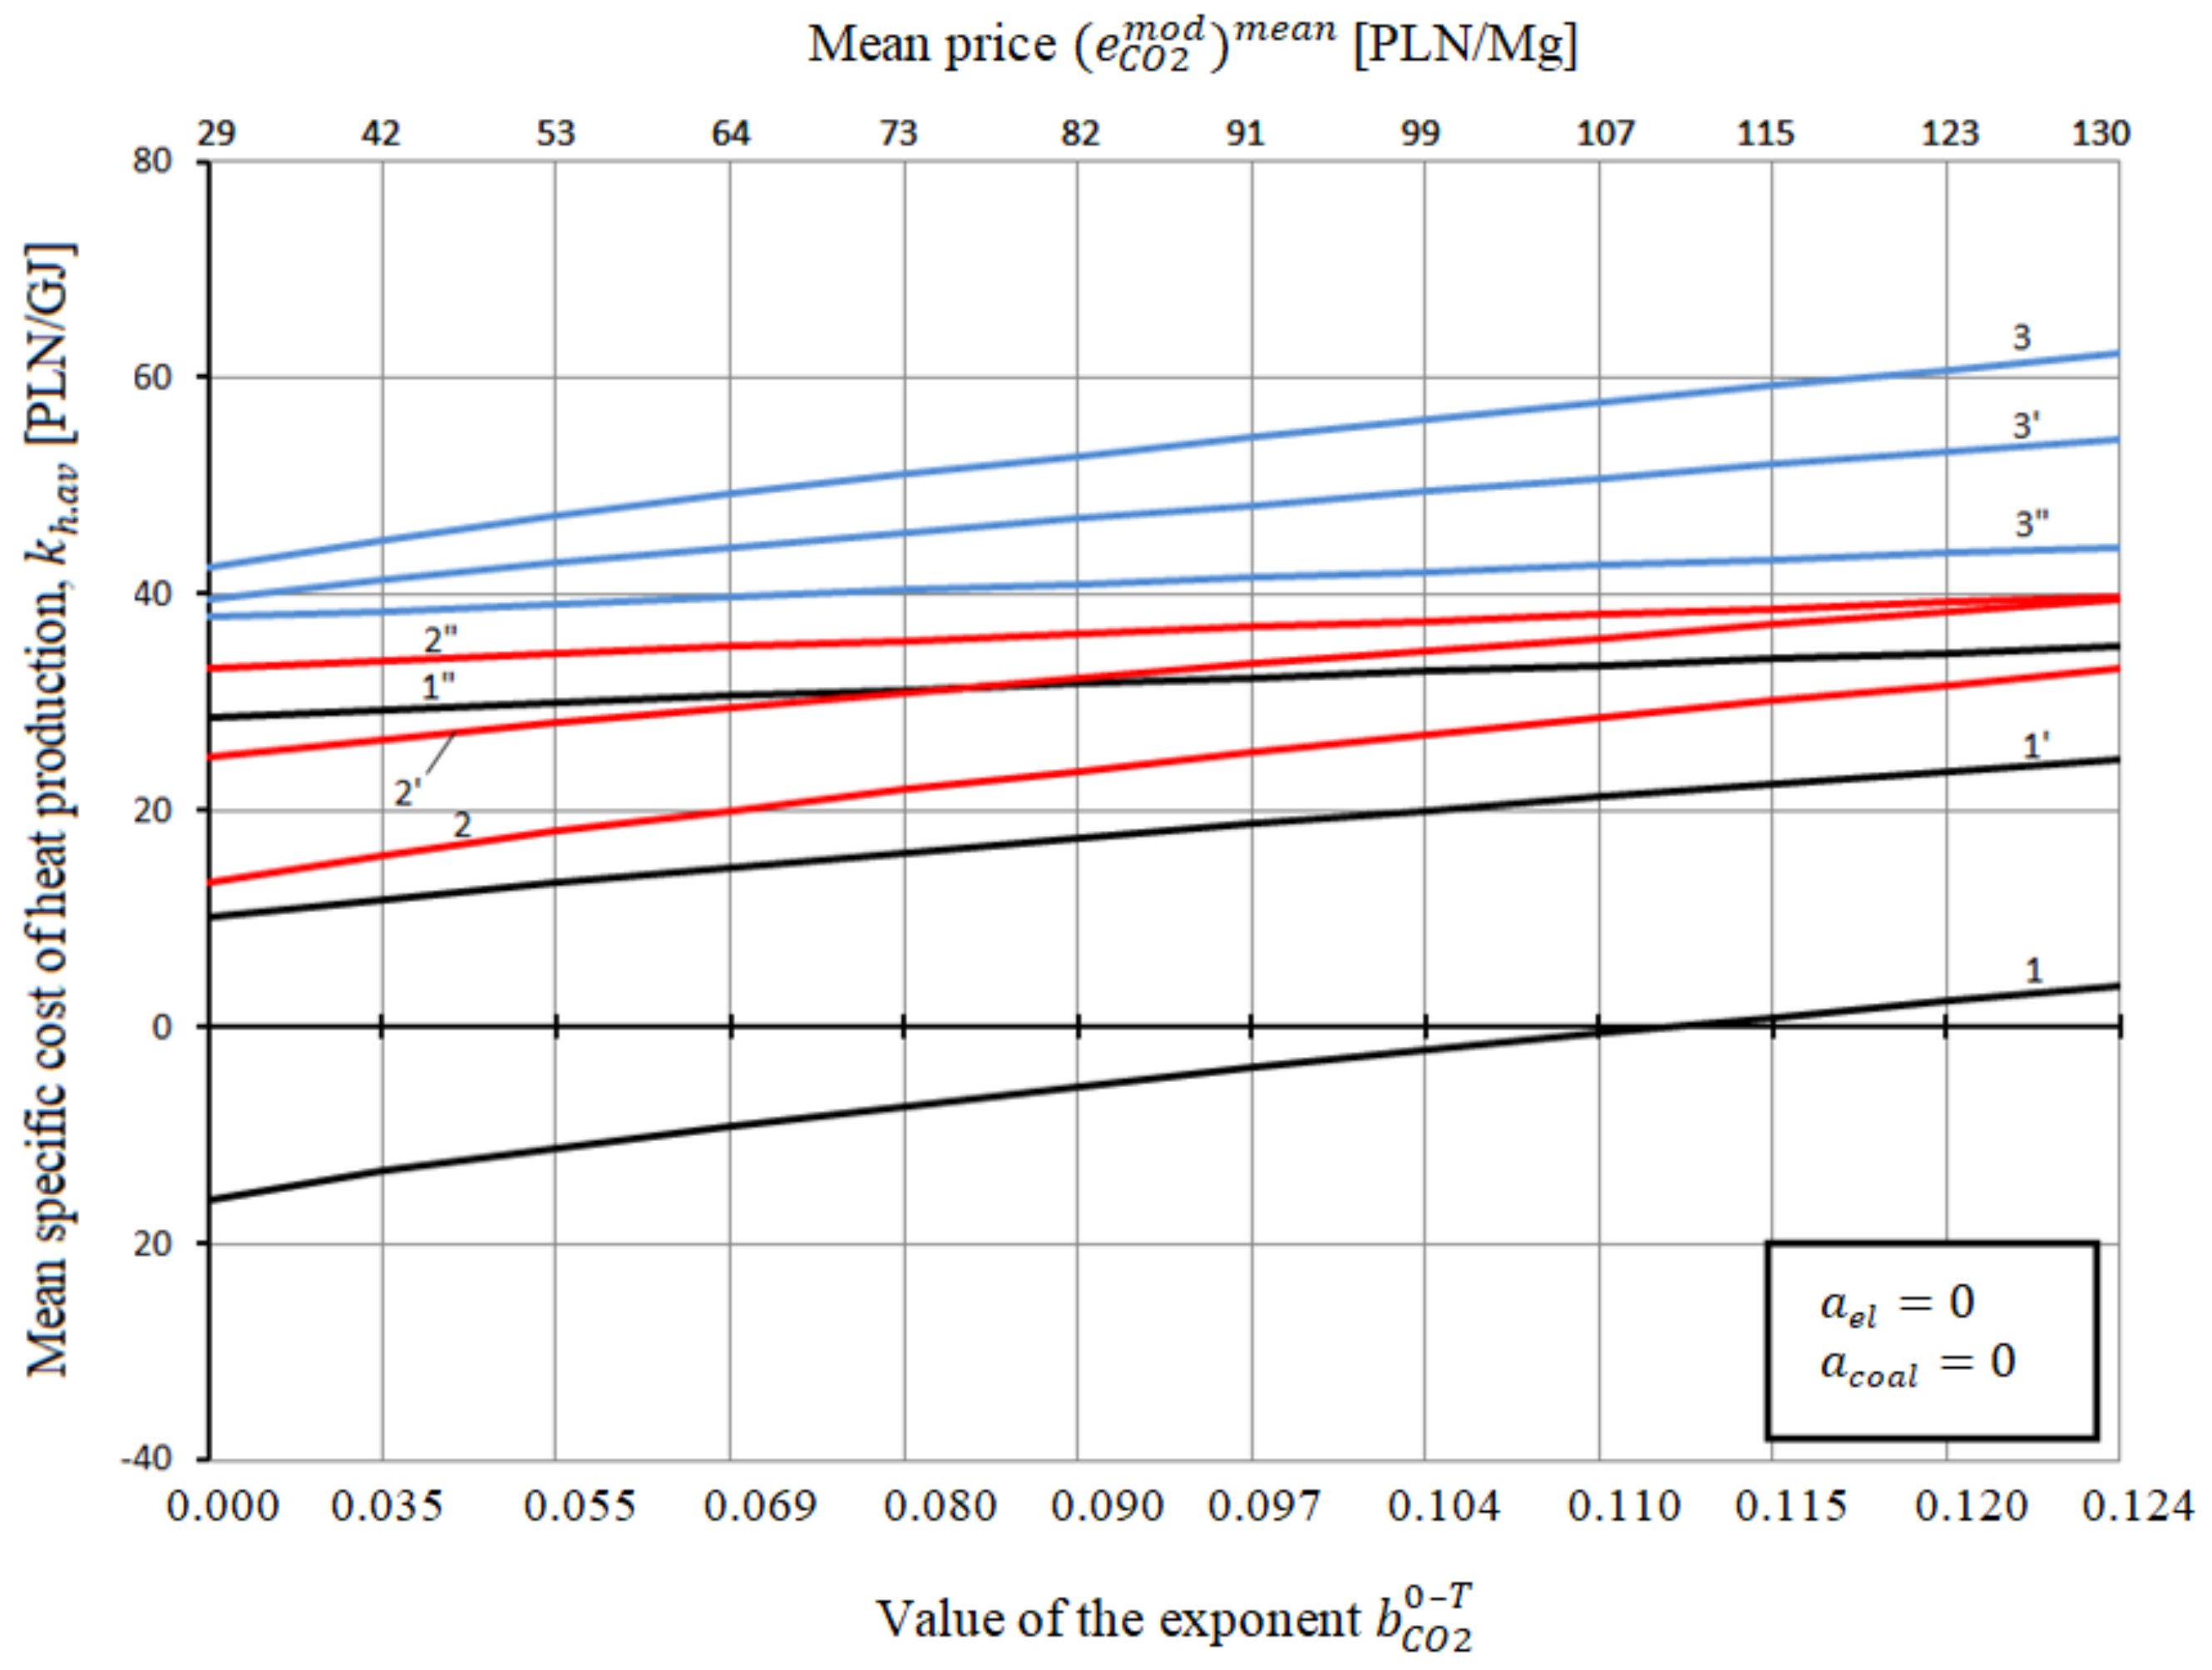
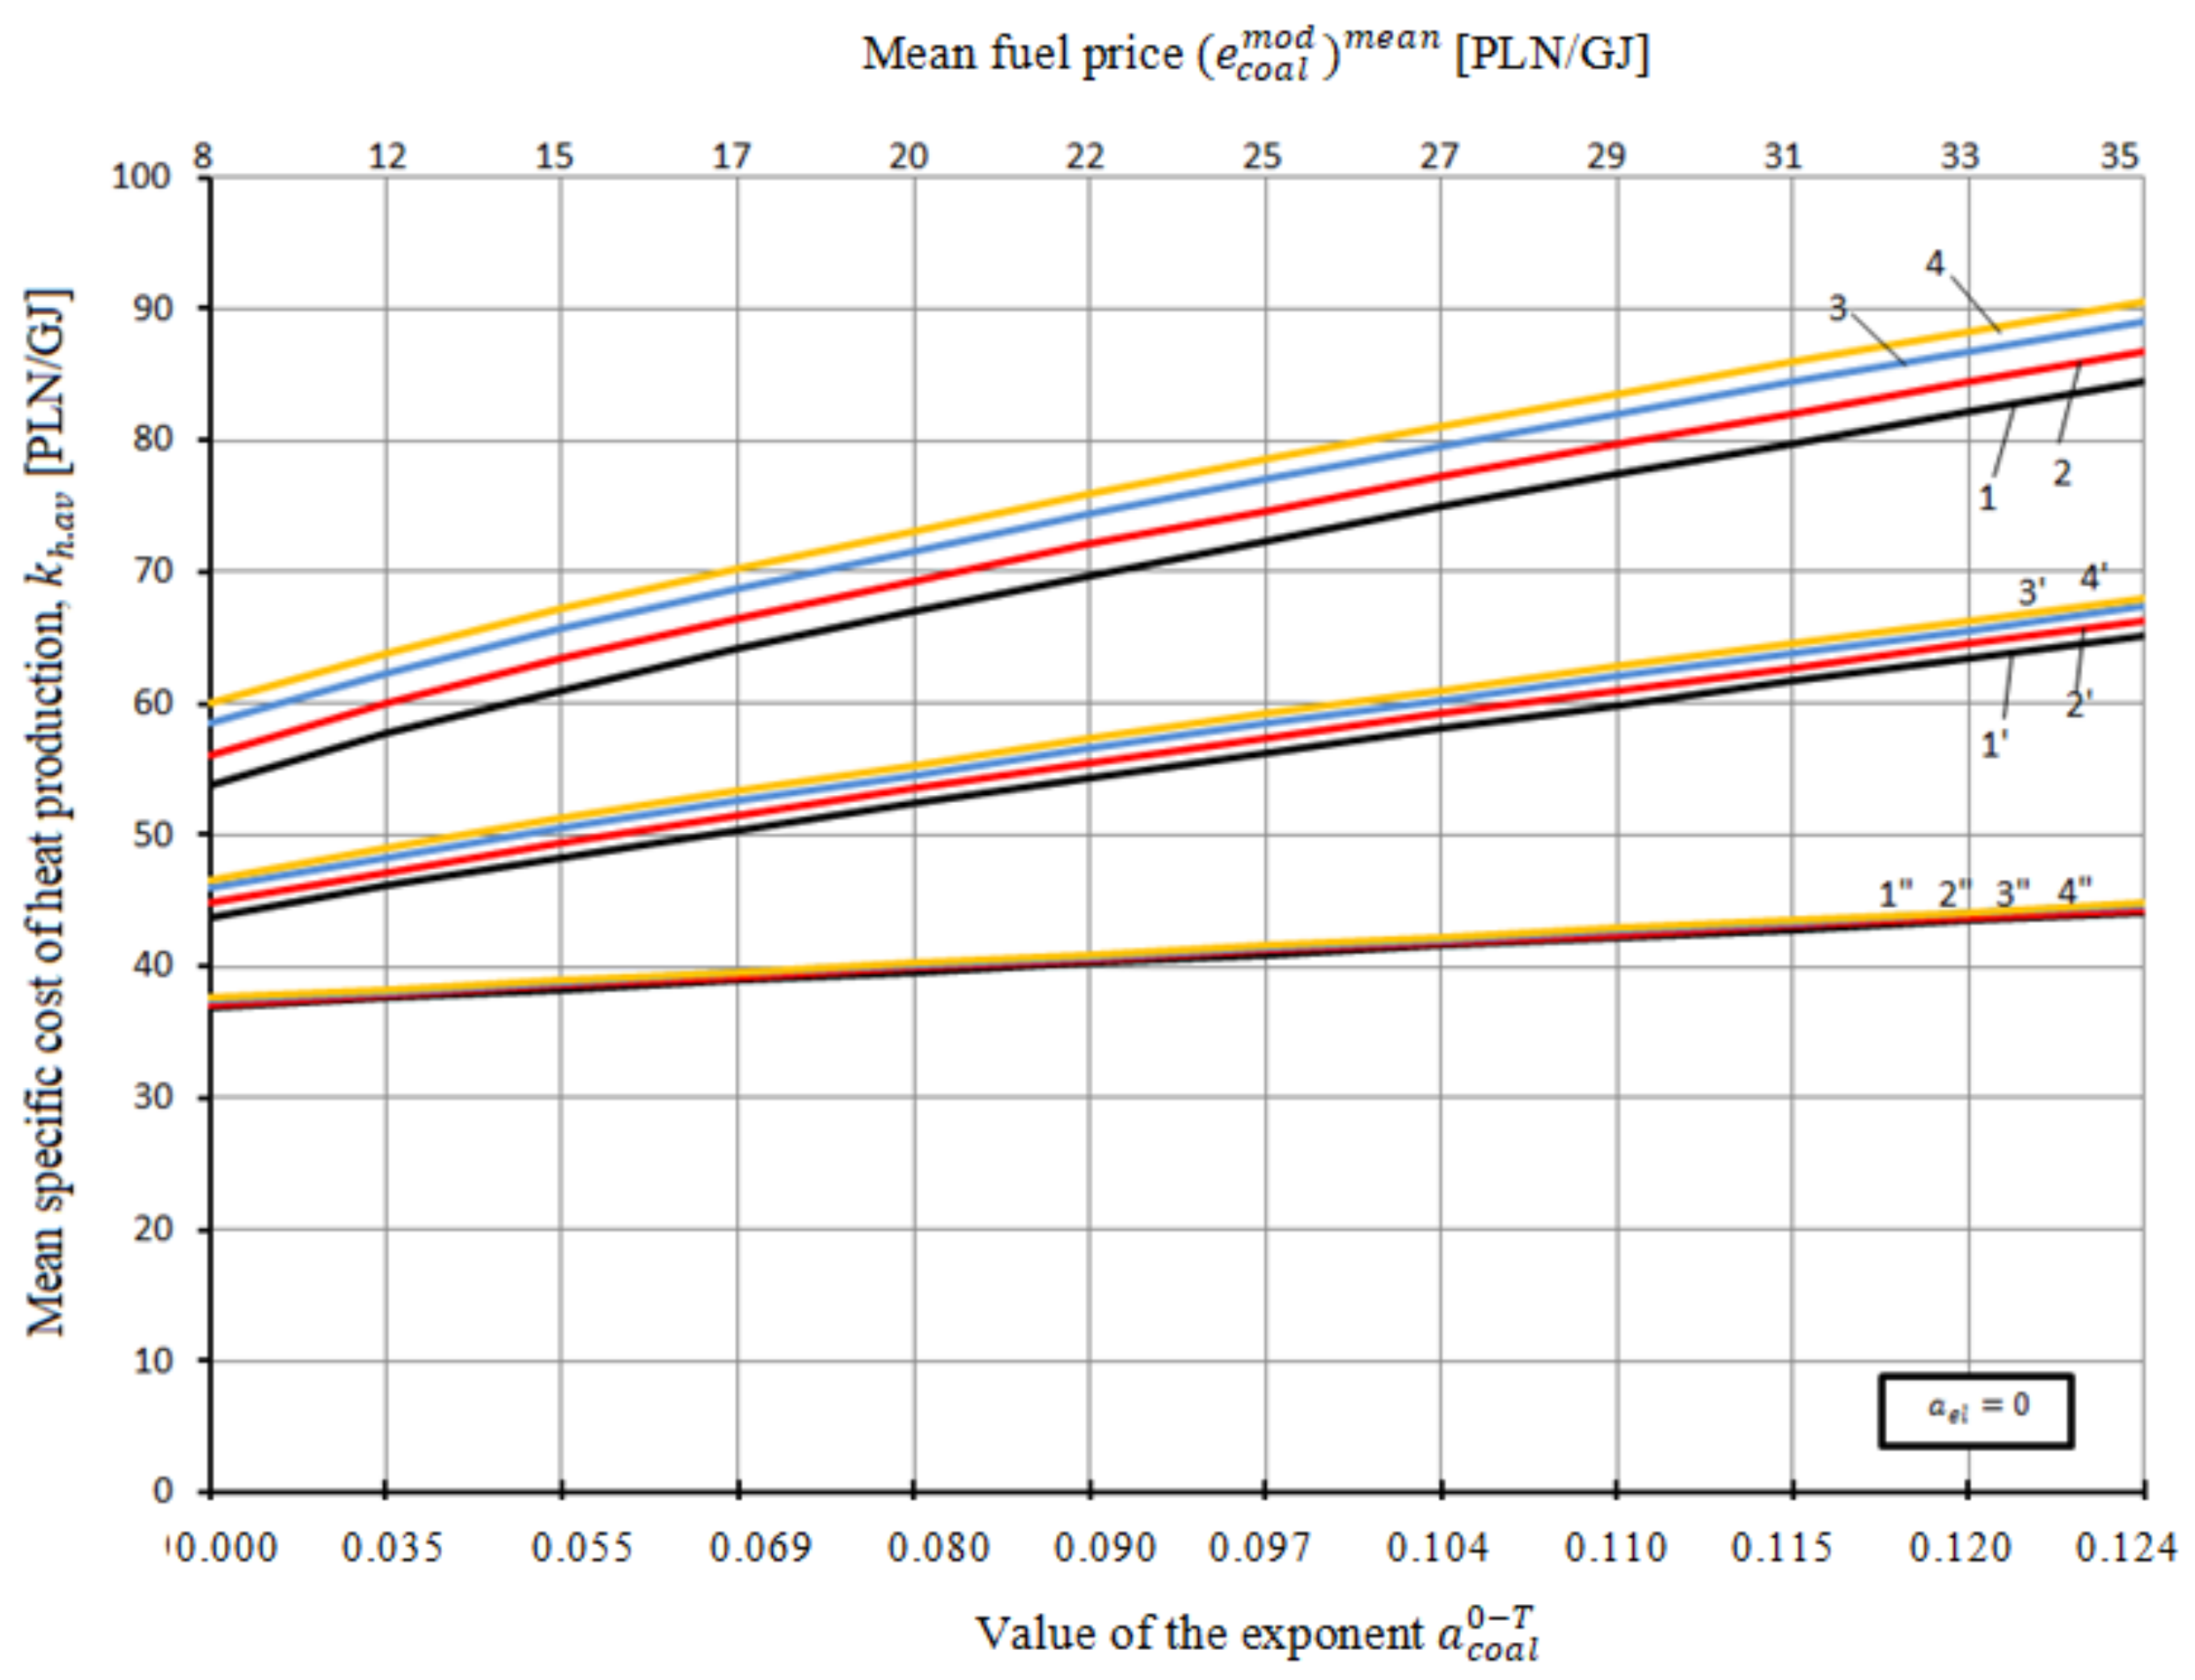
Figure 6.
Specific cost of heat production in the heating plant repowered to gas–steam CHP plant in the function of the mean fuel price and value of exponent depending on the year t1, corresponding to initiation of modernization, where: 1 applies to t1 = 5 years, = 30 PLN/Mgco2; 1′—applies to t1 = 10 years, = 30 PLN/Mgco2; 1″—applies to t1 = 15 years, = 30 PLN/Mgco2; 2—applies to t1 = 5 years, = 60 PLN/Mgco2; 2′—applies to t1 = 10 years, = 60 PLN/Mgco2; 2″—applies to t1 = 15 years, = 60 PLN/Mgco2; 3—applies to t1 = 5 years, = 90 PLN/Mgco2; 3′—applies to t1 = 10 years, = 90 PLN/Mgco2; 3″—applies to t1 = 15 years, = 90 PLN/Mgco2; 4—applies to t1 = 5 years, = 110 PLN/Mgco2; 4′—applies to t1 = 10 years, = 110 PLN/Mgco2; 4″—applies to t1 = 15 years, = 110 PLN/Mgco2.
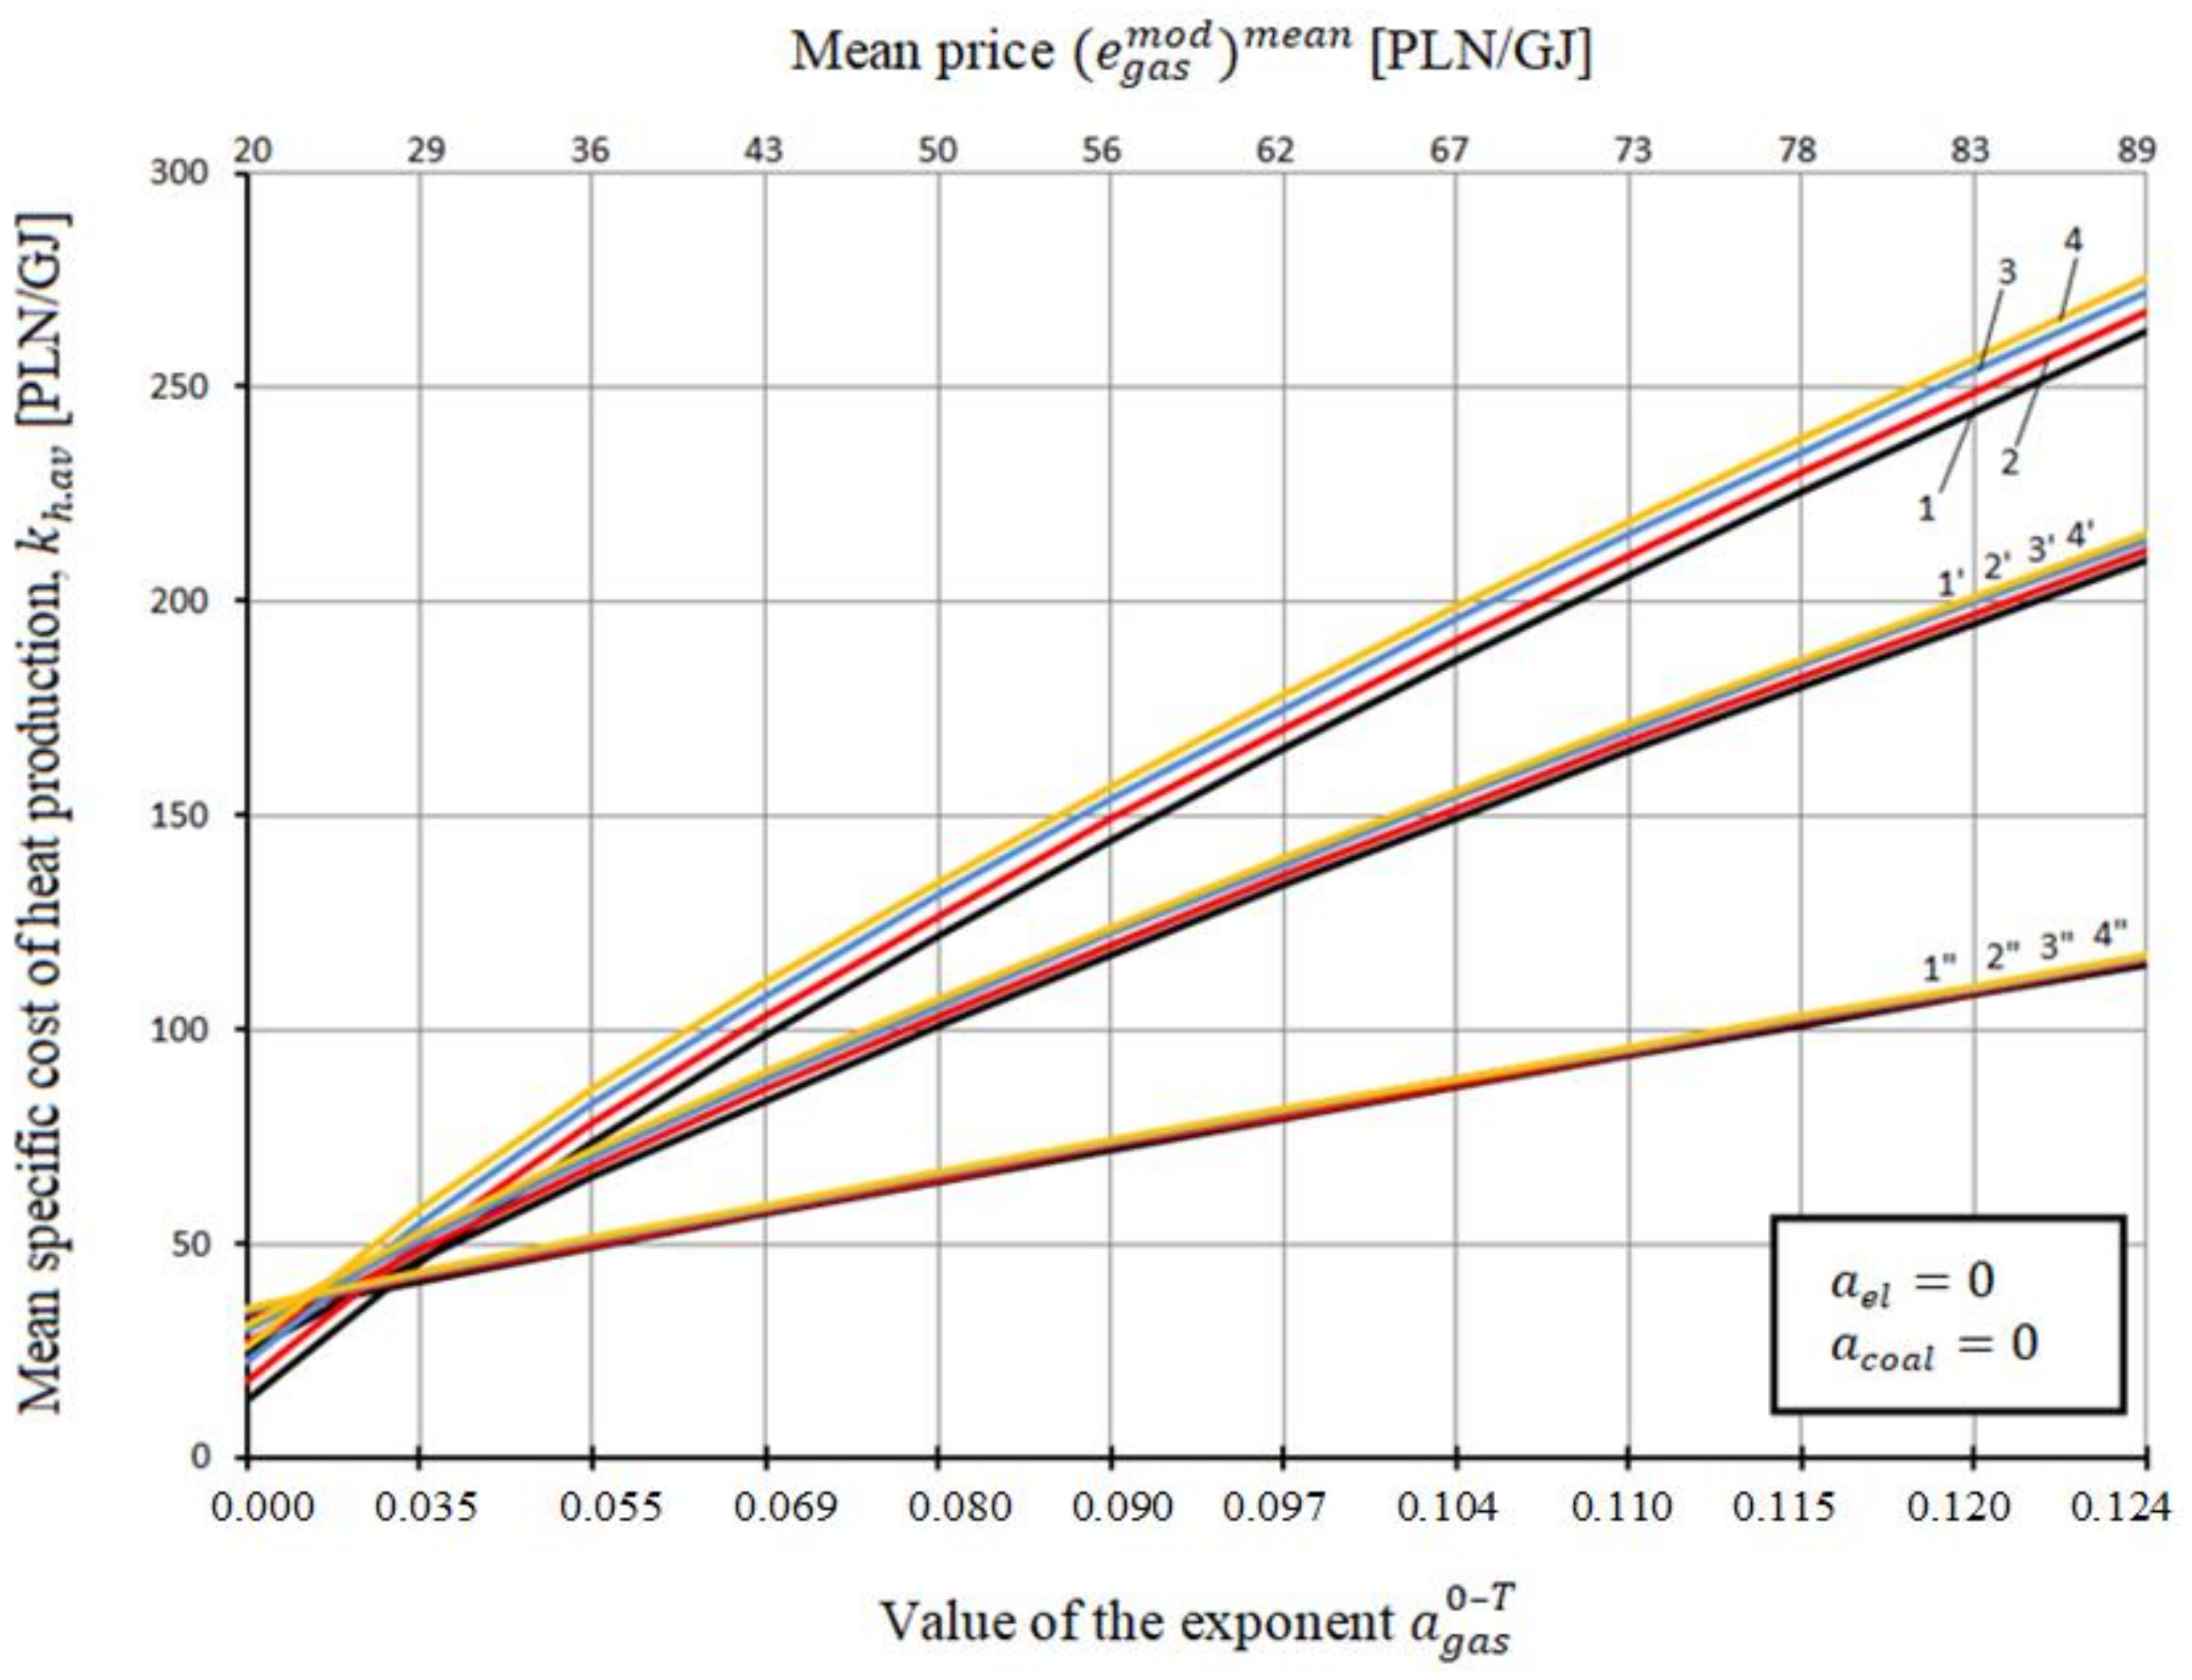
Figure 7.
Specific cost of heat production in the heating plant repowered to gas–steam CHP plant in the function of the mean fuel price and value of exponent depending on the year t1, corresponding to initiation of modernization, where: 1—applies to t1 = 5 years, 150 PLN/MWh; 1′—applies to t1 = 10 years, = 150 PLN/MWh; 1″—applies to t1 = 15 years, 150 PLN/MWh; 2—applies to t1 = 5 years, = 200 PLN/MWh; 2′—applies to t1 = 10 years, = 200 PLN/MWh; 2″—applies to t1 = 15 years, 200 PLN/MWh; 3—applies to t1 = 5 years, 250 PLN/MWh; 3′—applies to t1 = 10 years, 250 PLN/MWh; 3″—applies to t1 = 15 years, = 250 PLN/MWh.
Figure 8.
Specific cost of heat production in the heating plant repowered to gas–steam CHP plant in the function of the mean price and value of exponent depending on the year t1, corresponding to initiation of modernization, where: 1—applies to t1 = 5 years = 8 PLN/GJ; 1′—applies to t1 = 10 years, = 8 PLN/GJ; 1″—applies to t1 = 15 years, = 8 PLN/GJ; 2—applies to t1 = 5 years, = 16 PLN/GJ; 2′—applies to t1 = 10 years, = 16 PLN/GJ; 2″—applies to t1 = 15 years, = 16 PLN/GJ; 3—applies to t1 = 5 years, = 32 PLN/GJ; 2′—applies to t1 = 10 years, () = 32 PLN/GJ; 2″—applies to t1 = 15 years, = 32 PLN/GJ.
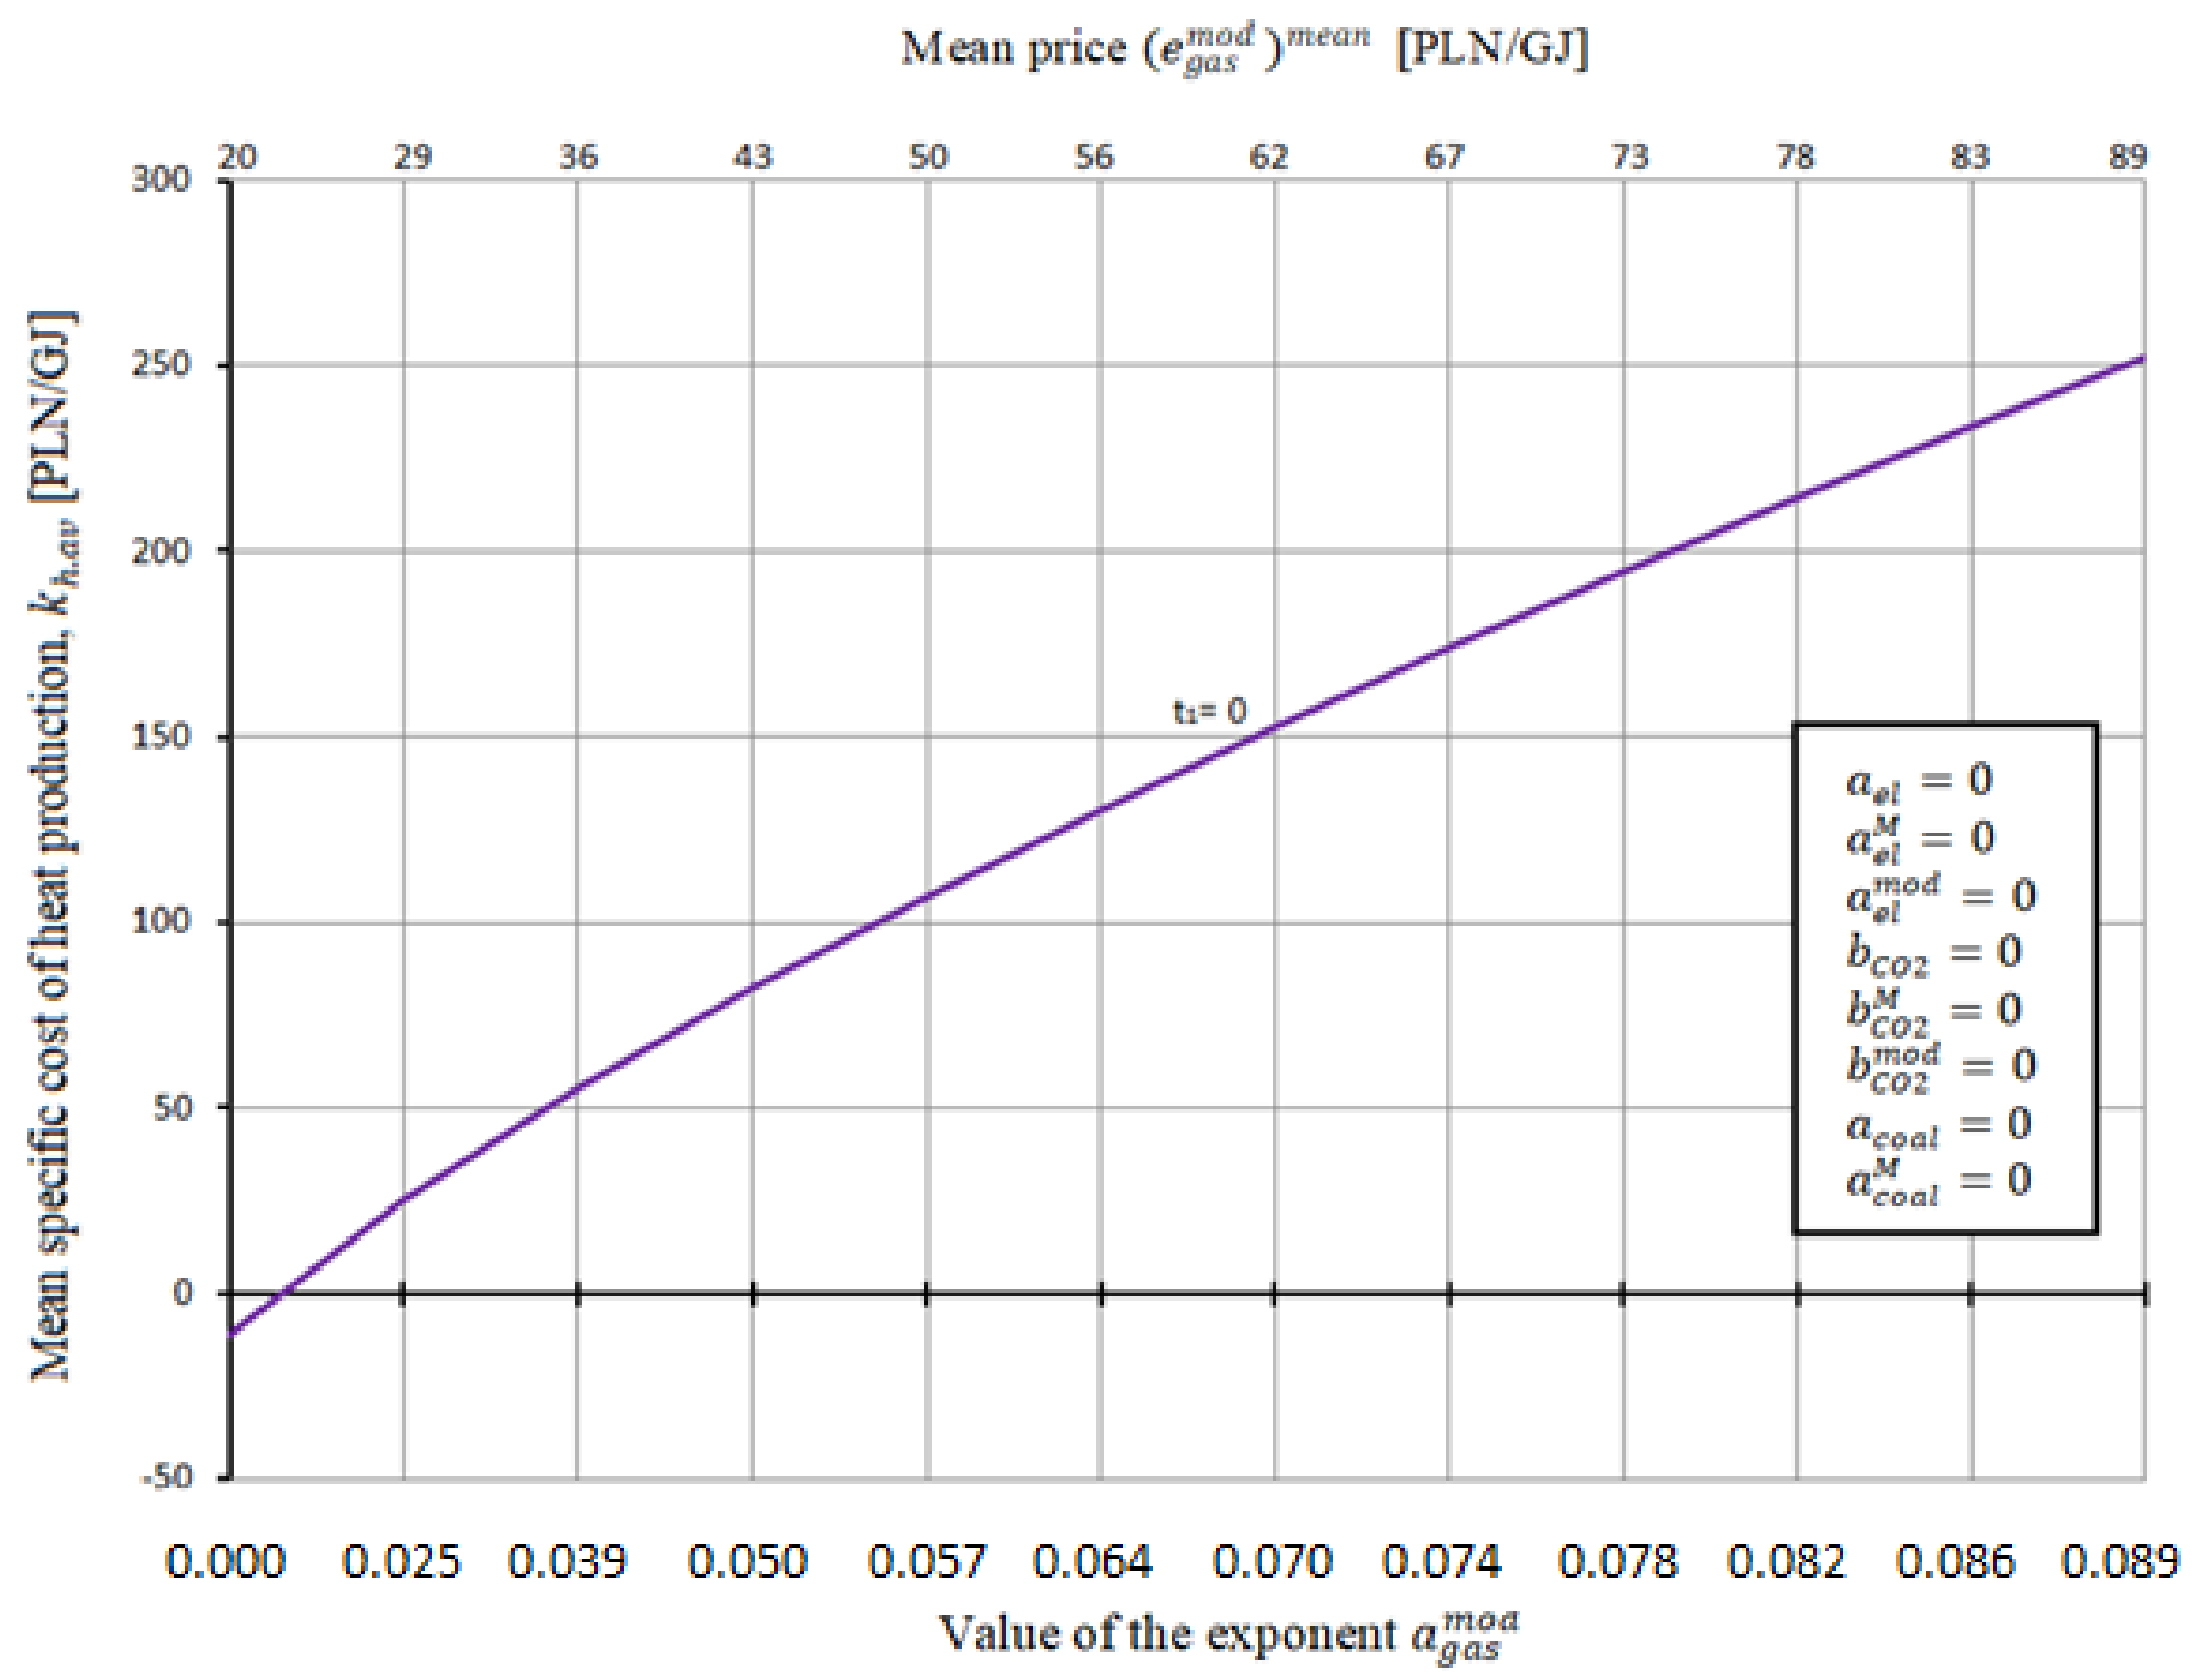
Figure 9.
Specific cost of heat generation in the heating plant repowered to a gas–steam CHP plant in the function of the mean gas price as well as value of the exponent for t1 = 0.
Figure 9.
Specific cost of heat generation in the heating plant repowered to a gas–steam CHP plant in the function of the mean gas price as well as value of the exponent for t1 = 0.
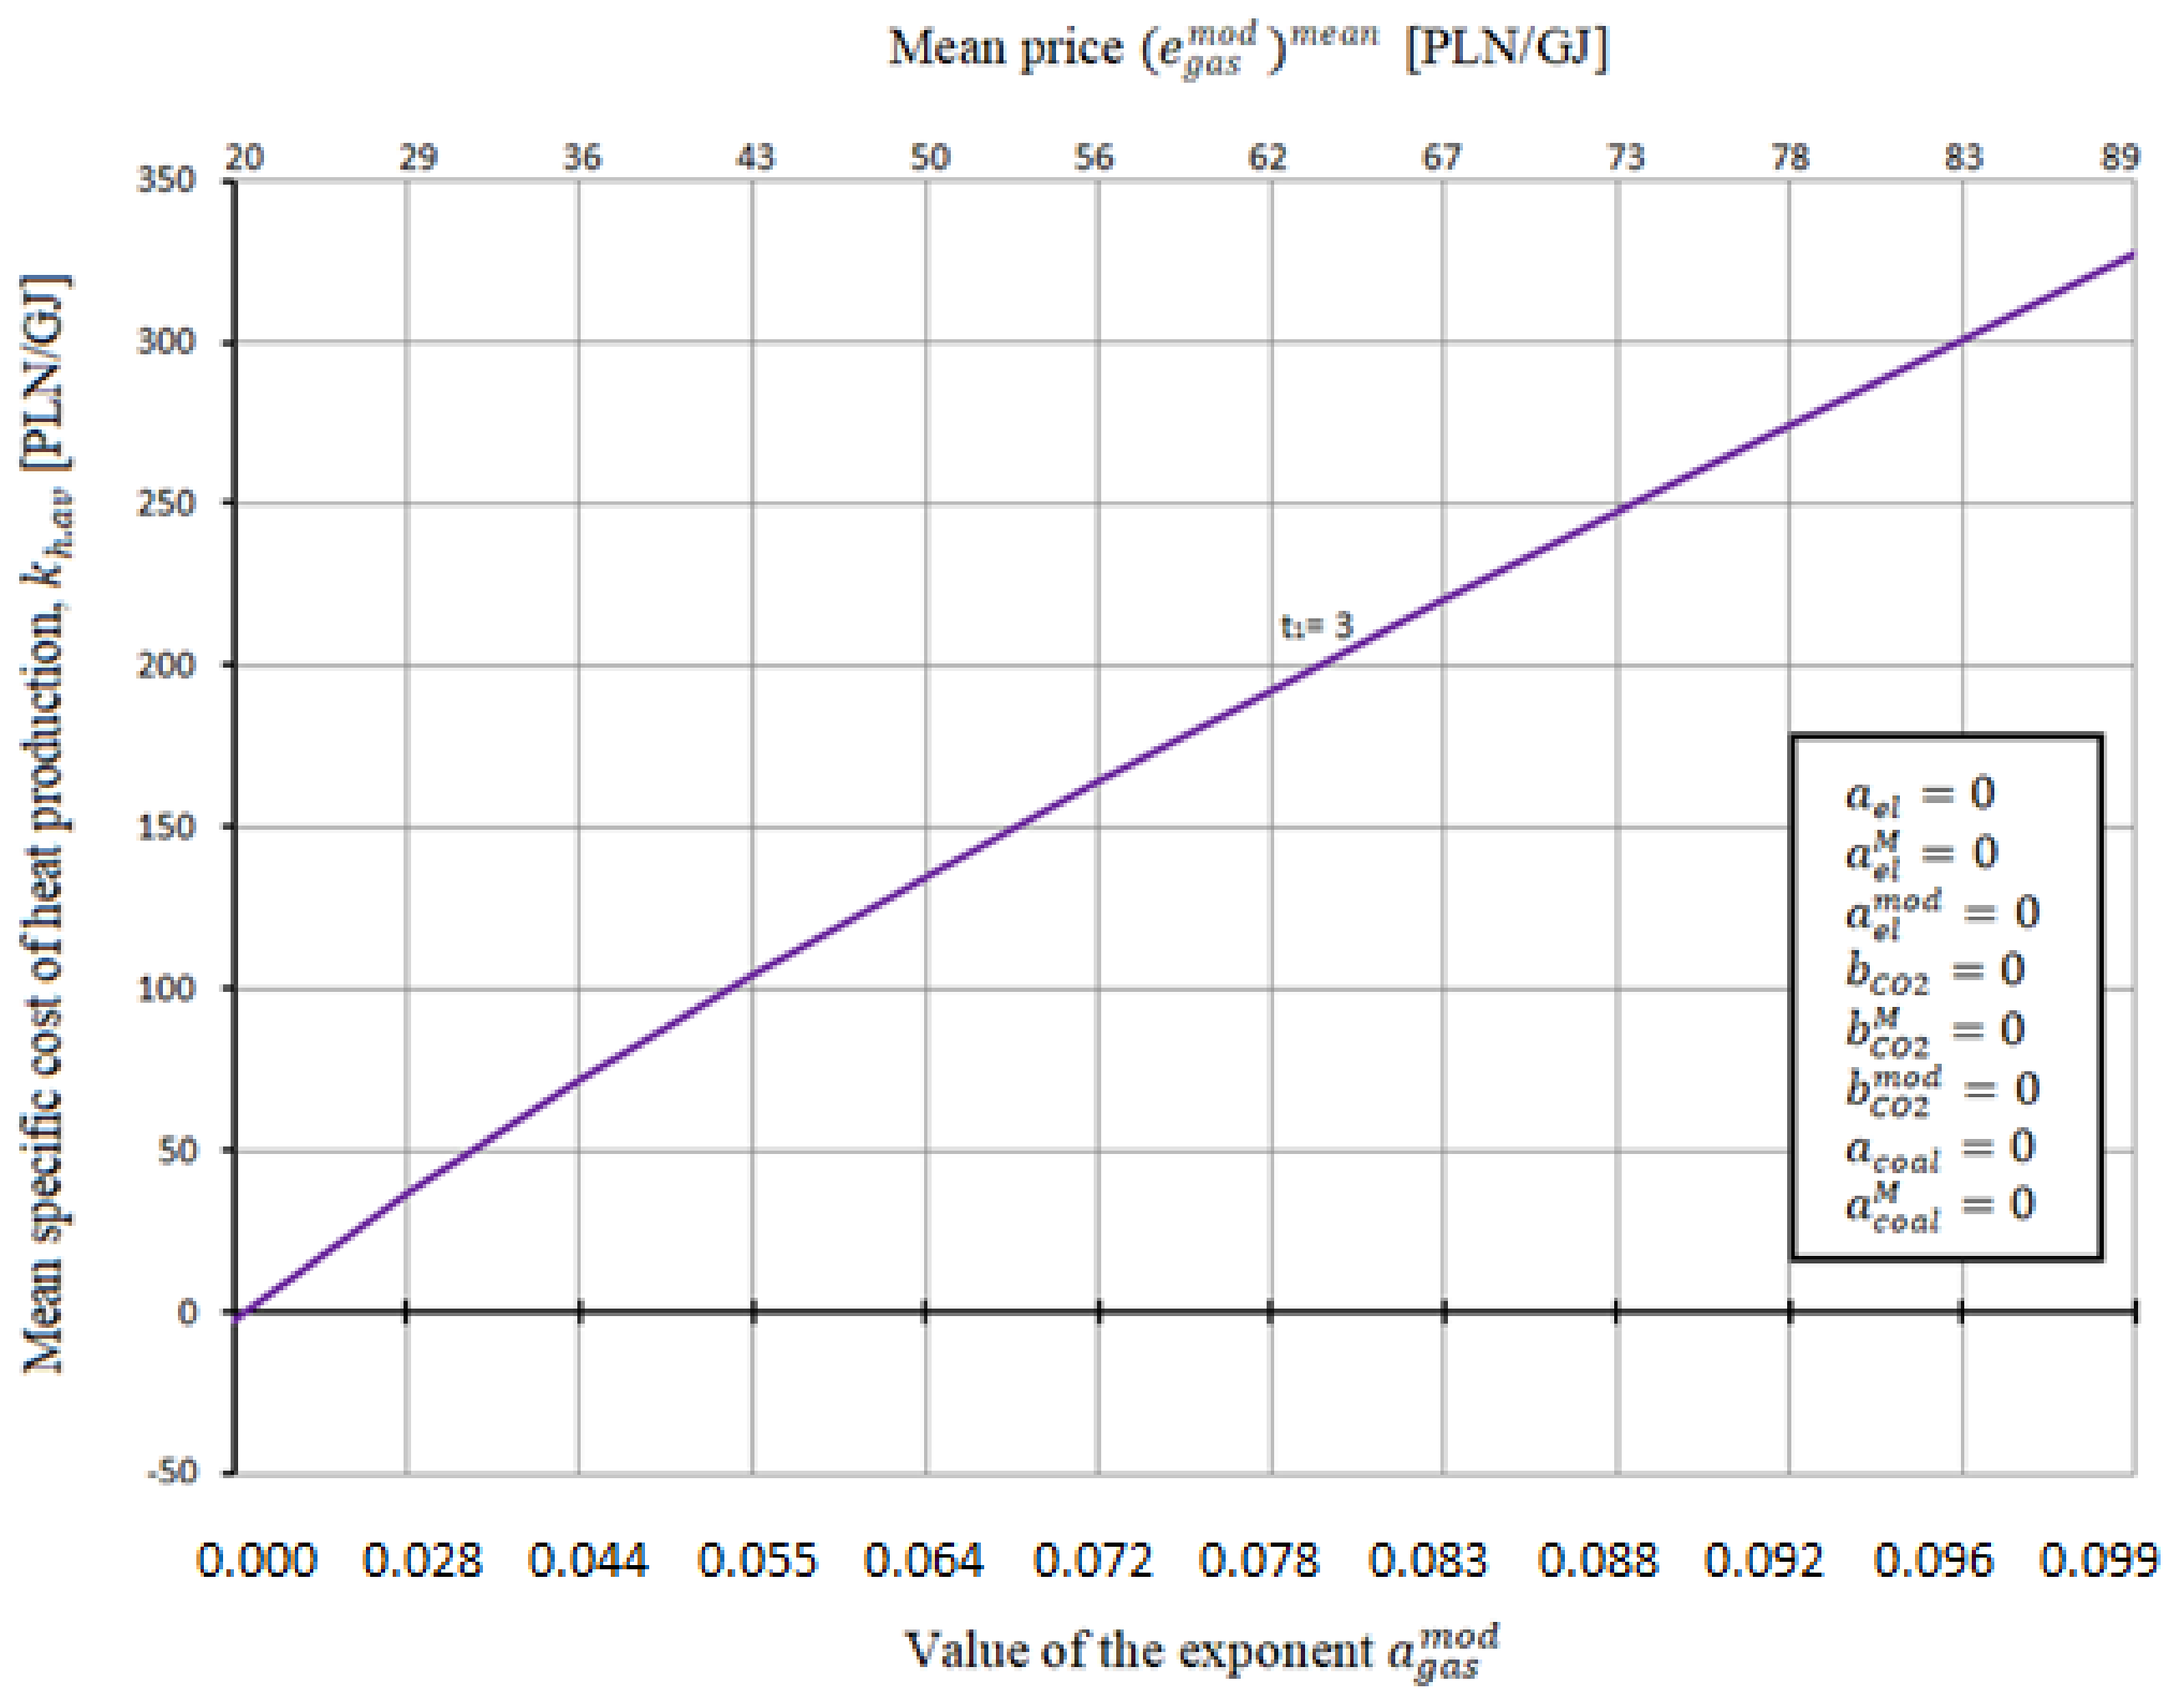
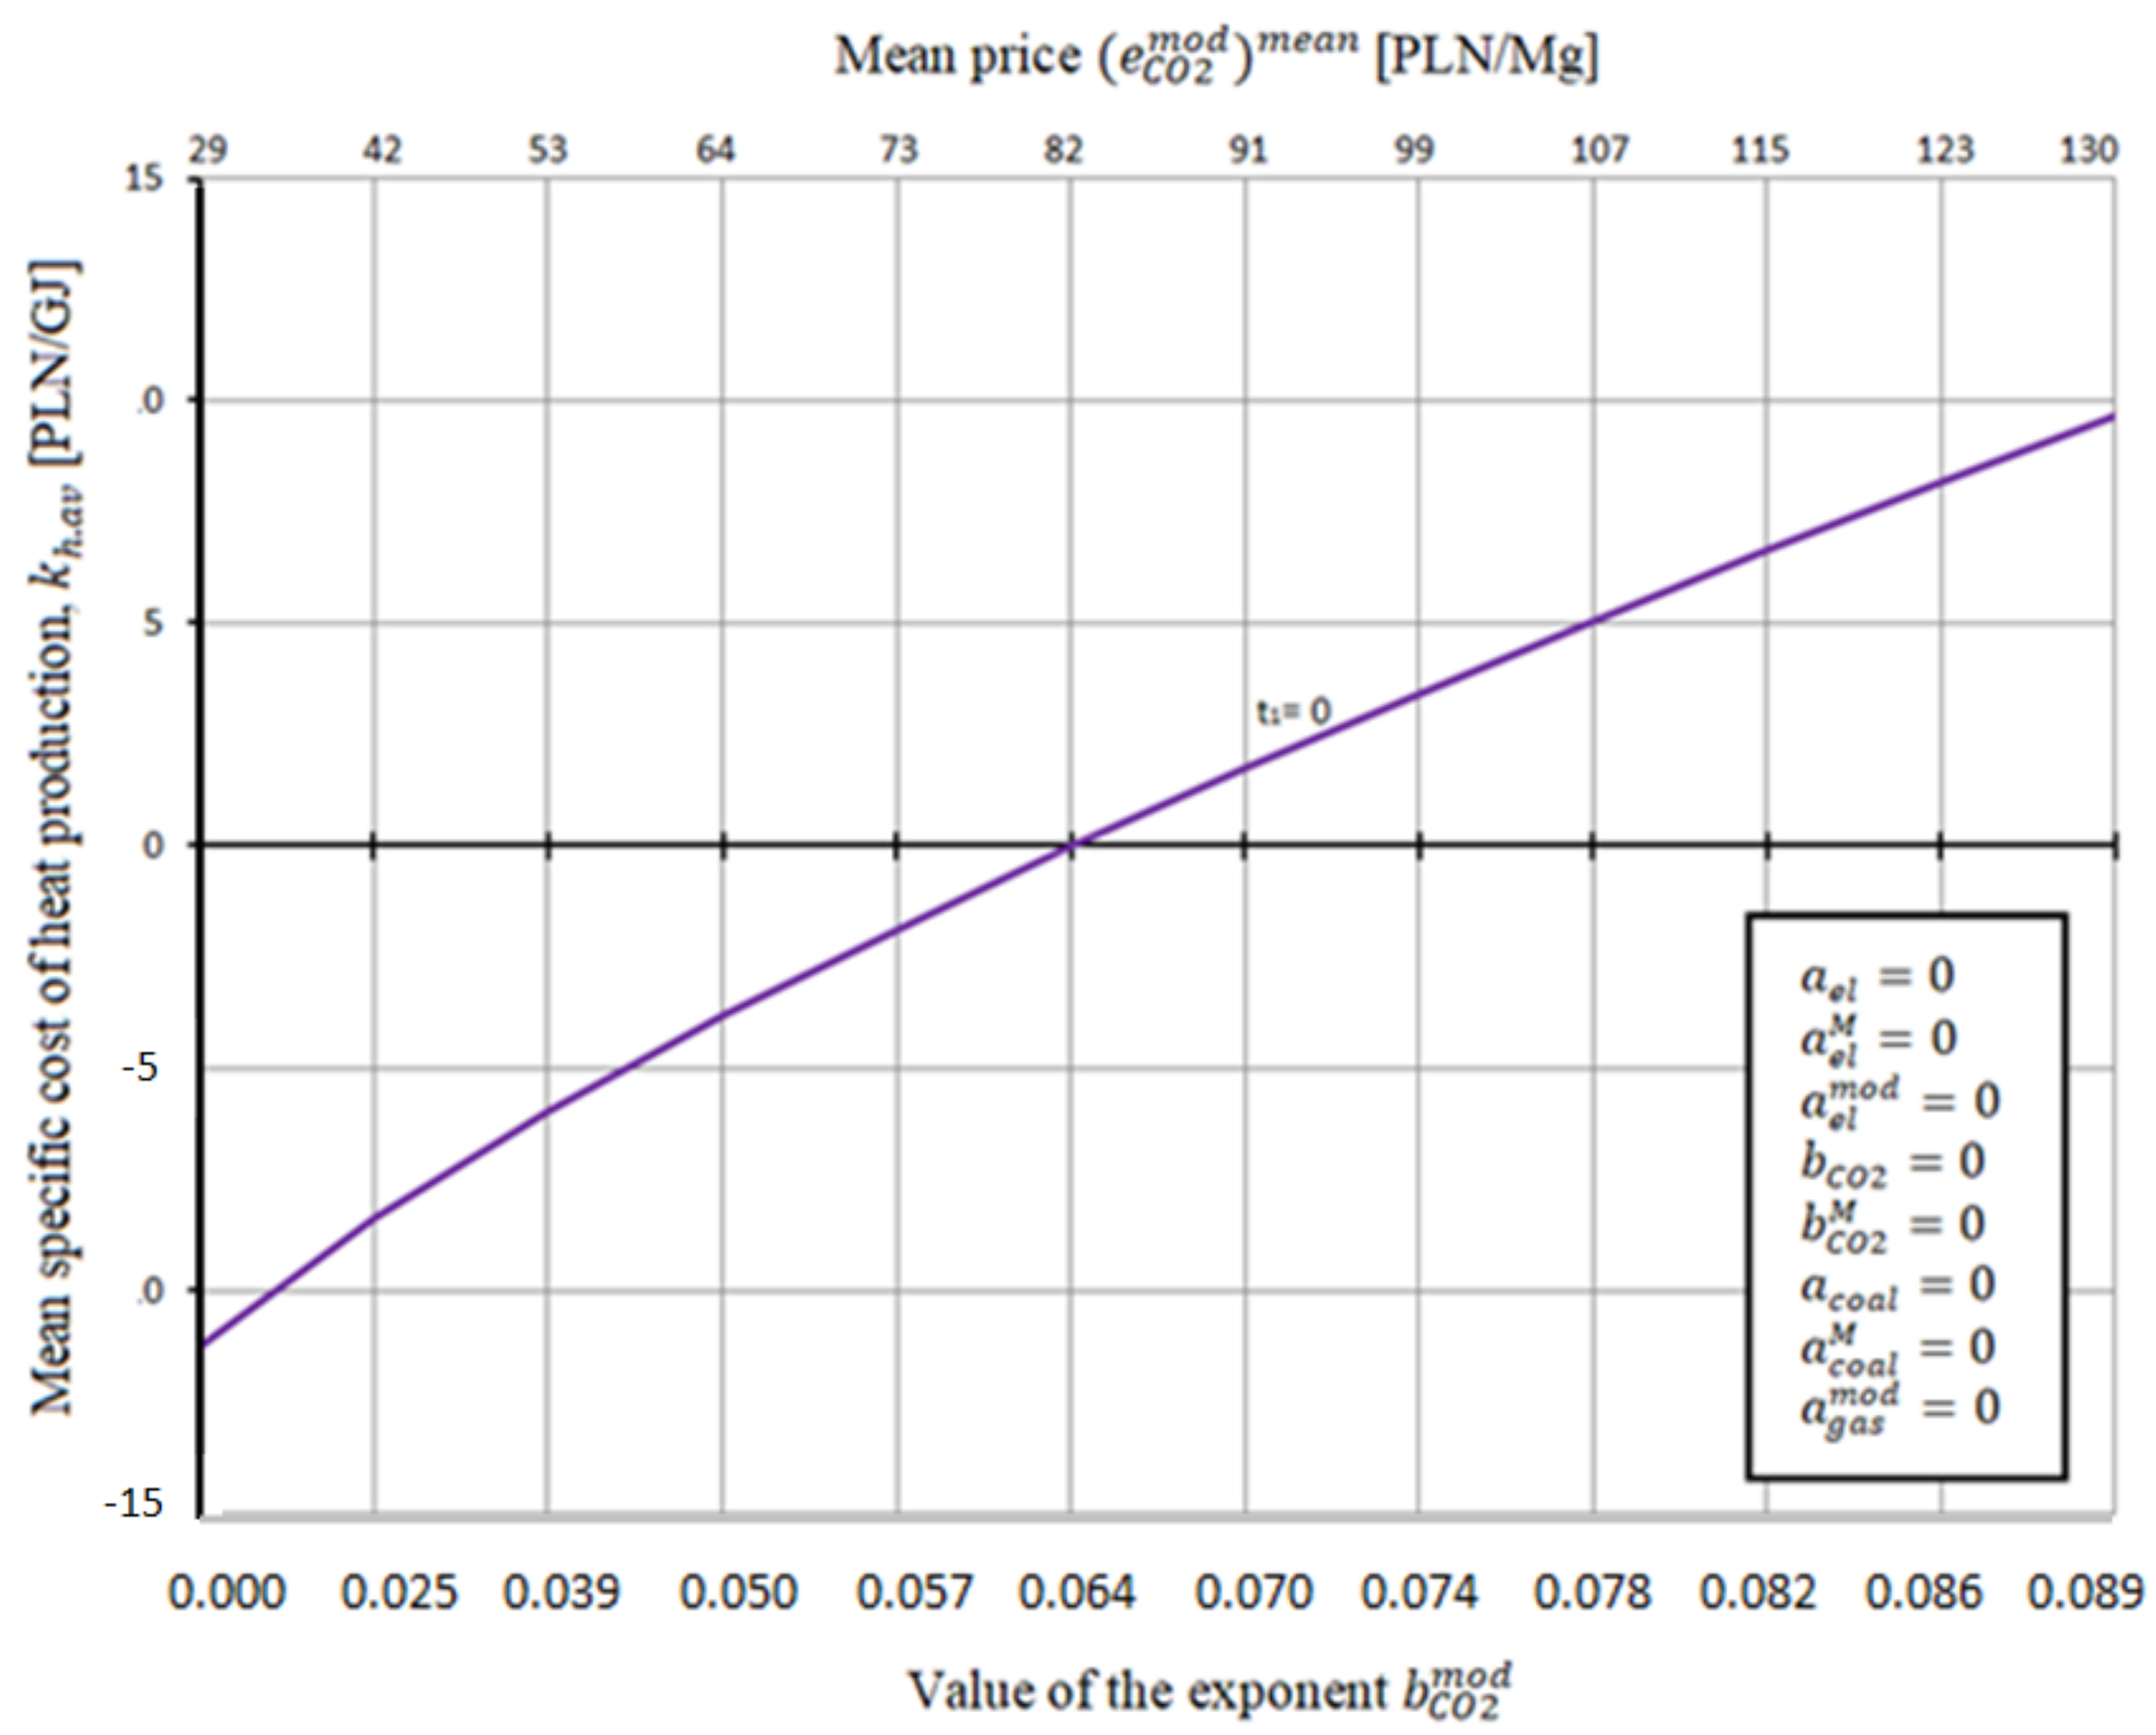
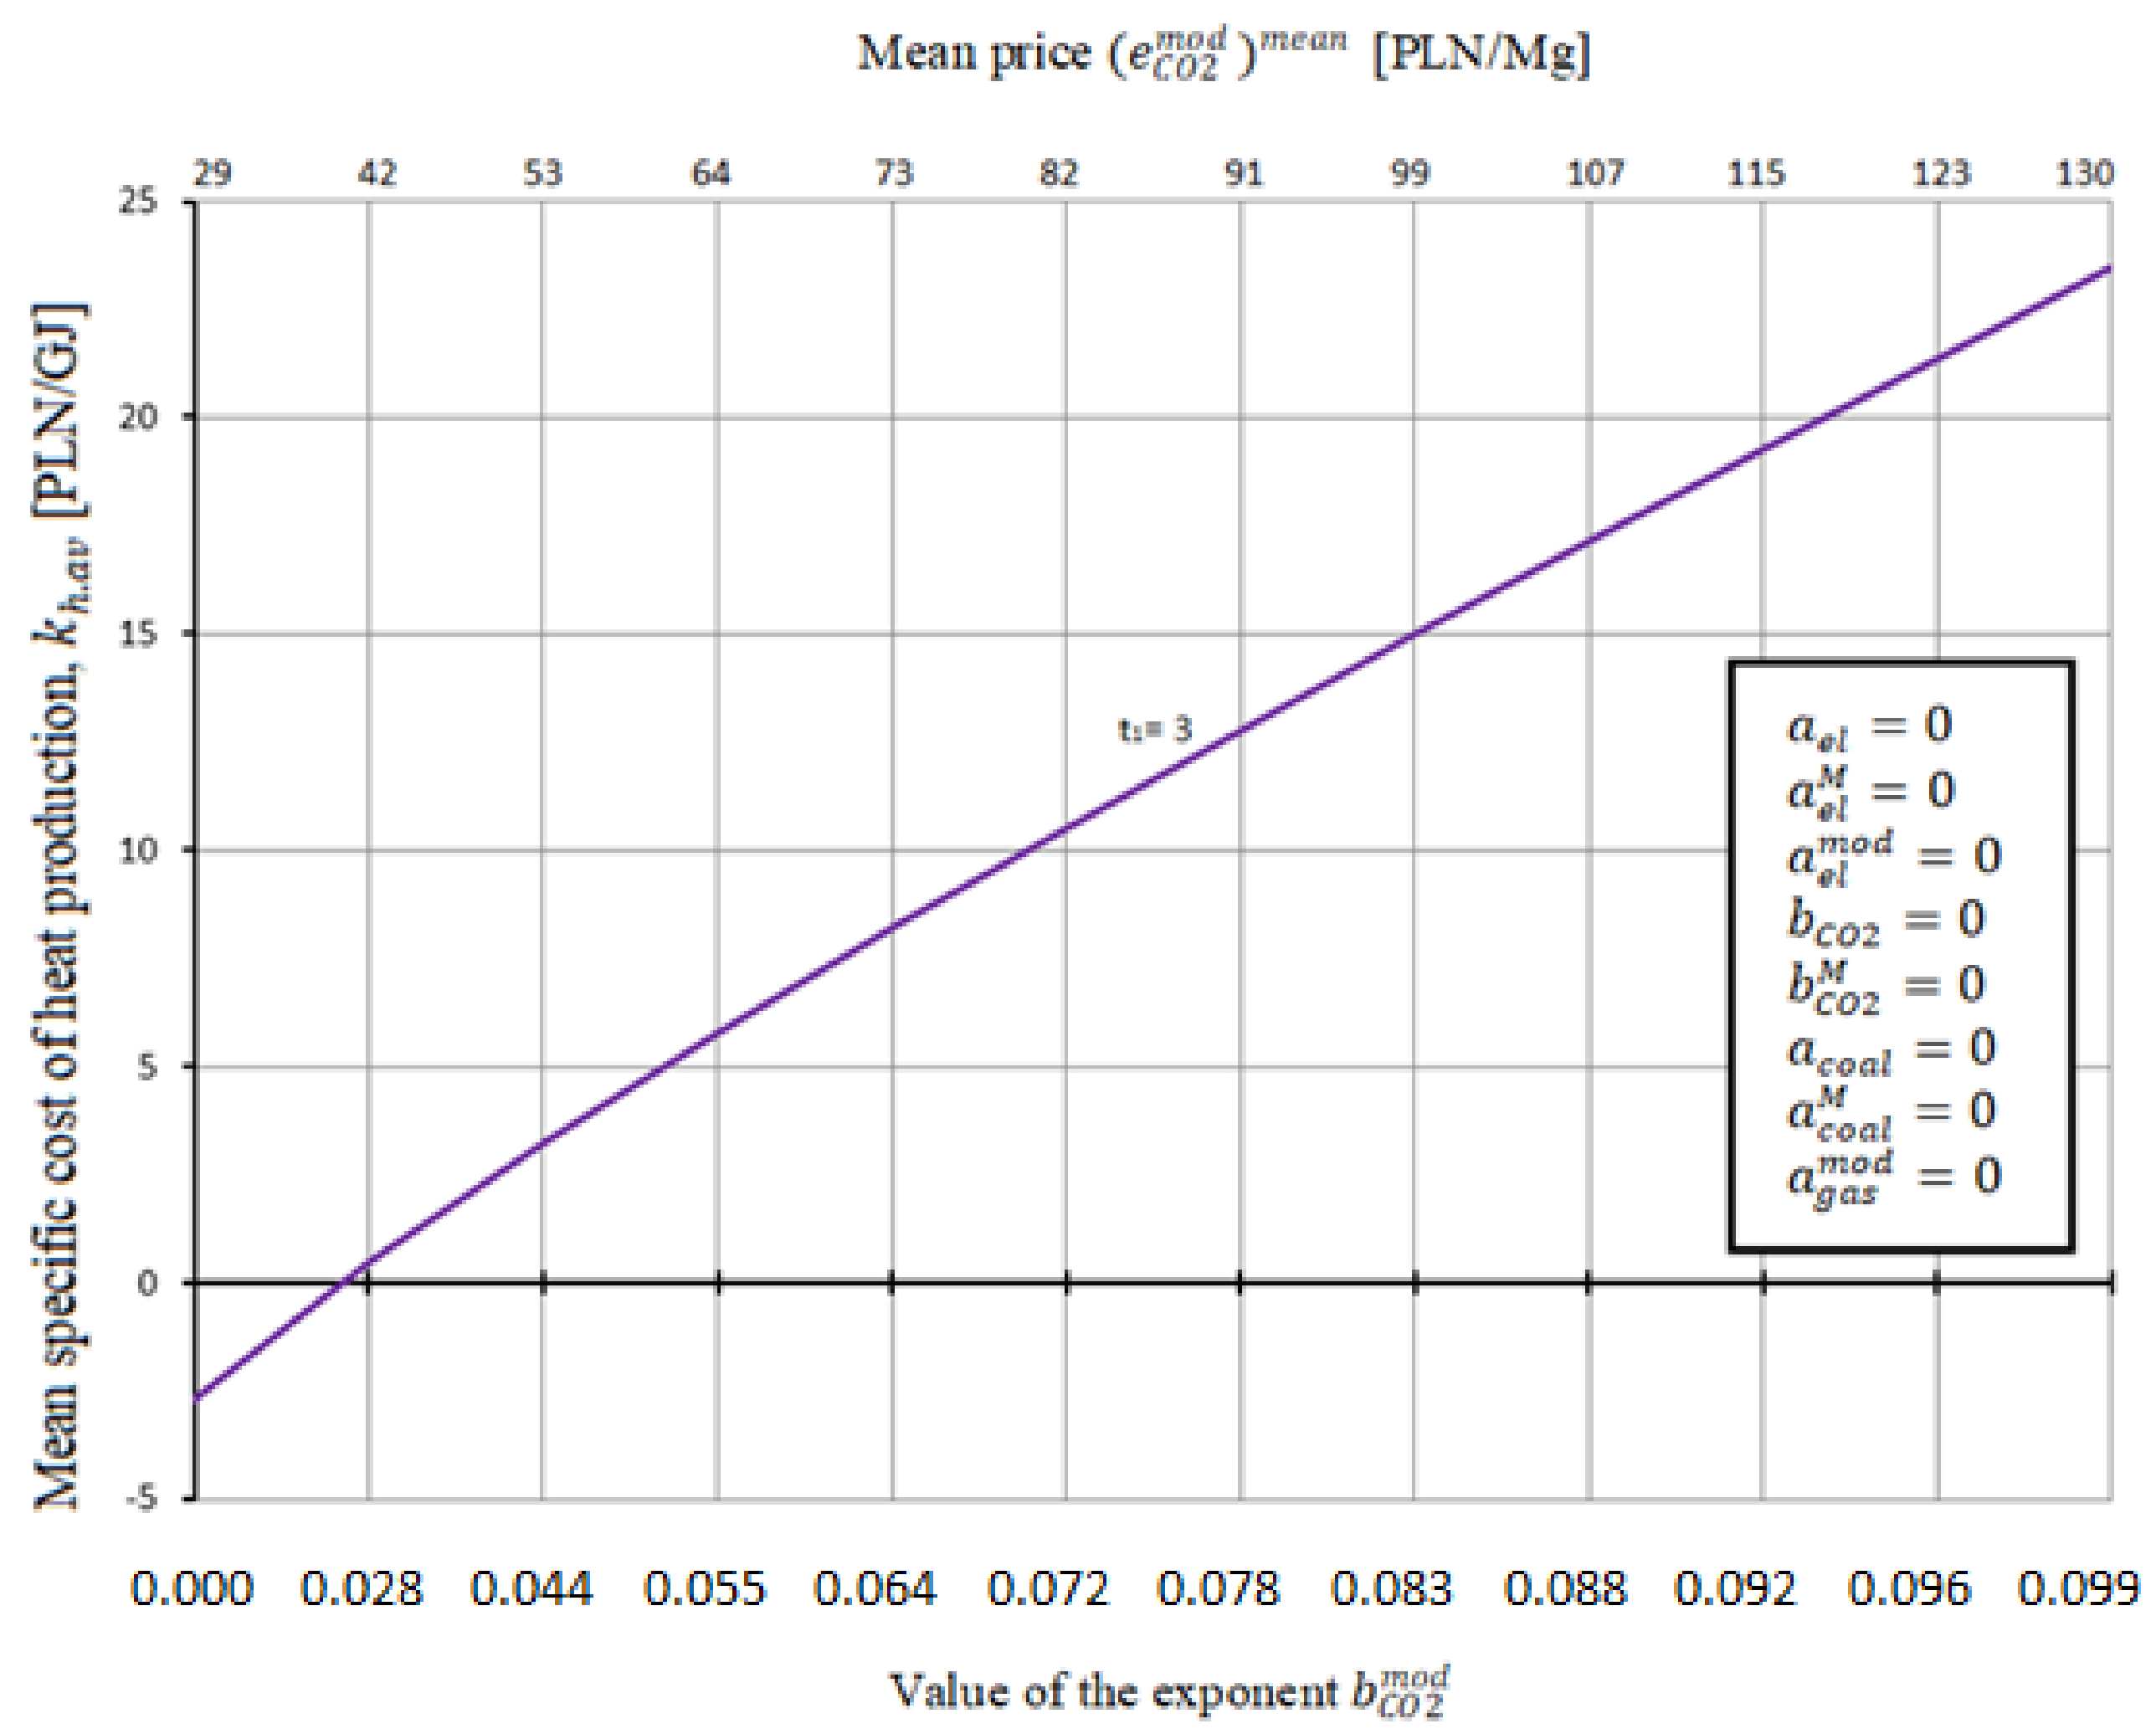
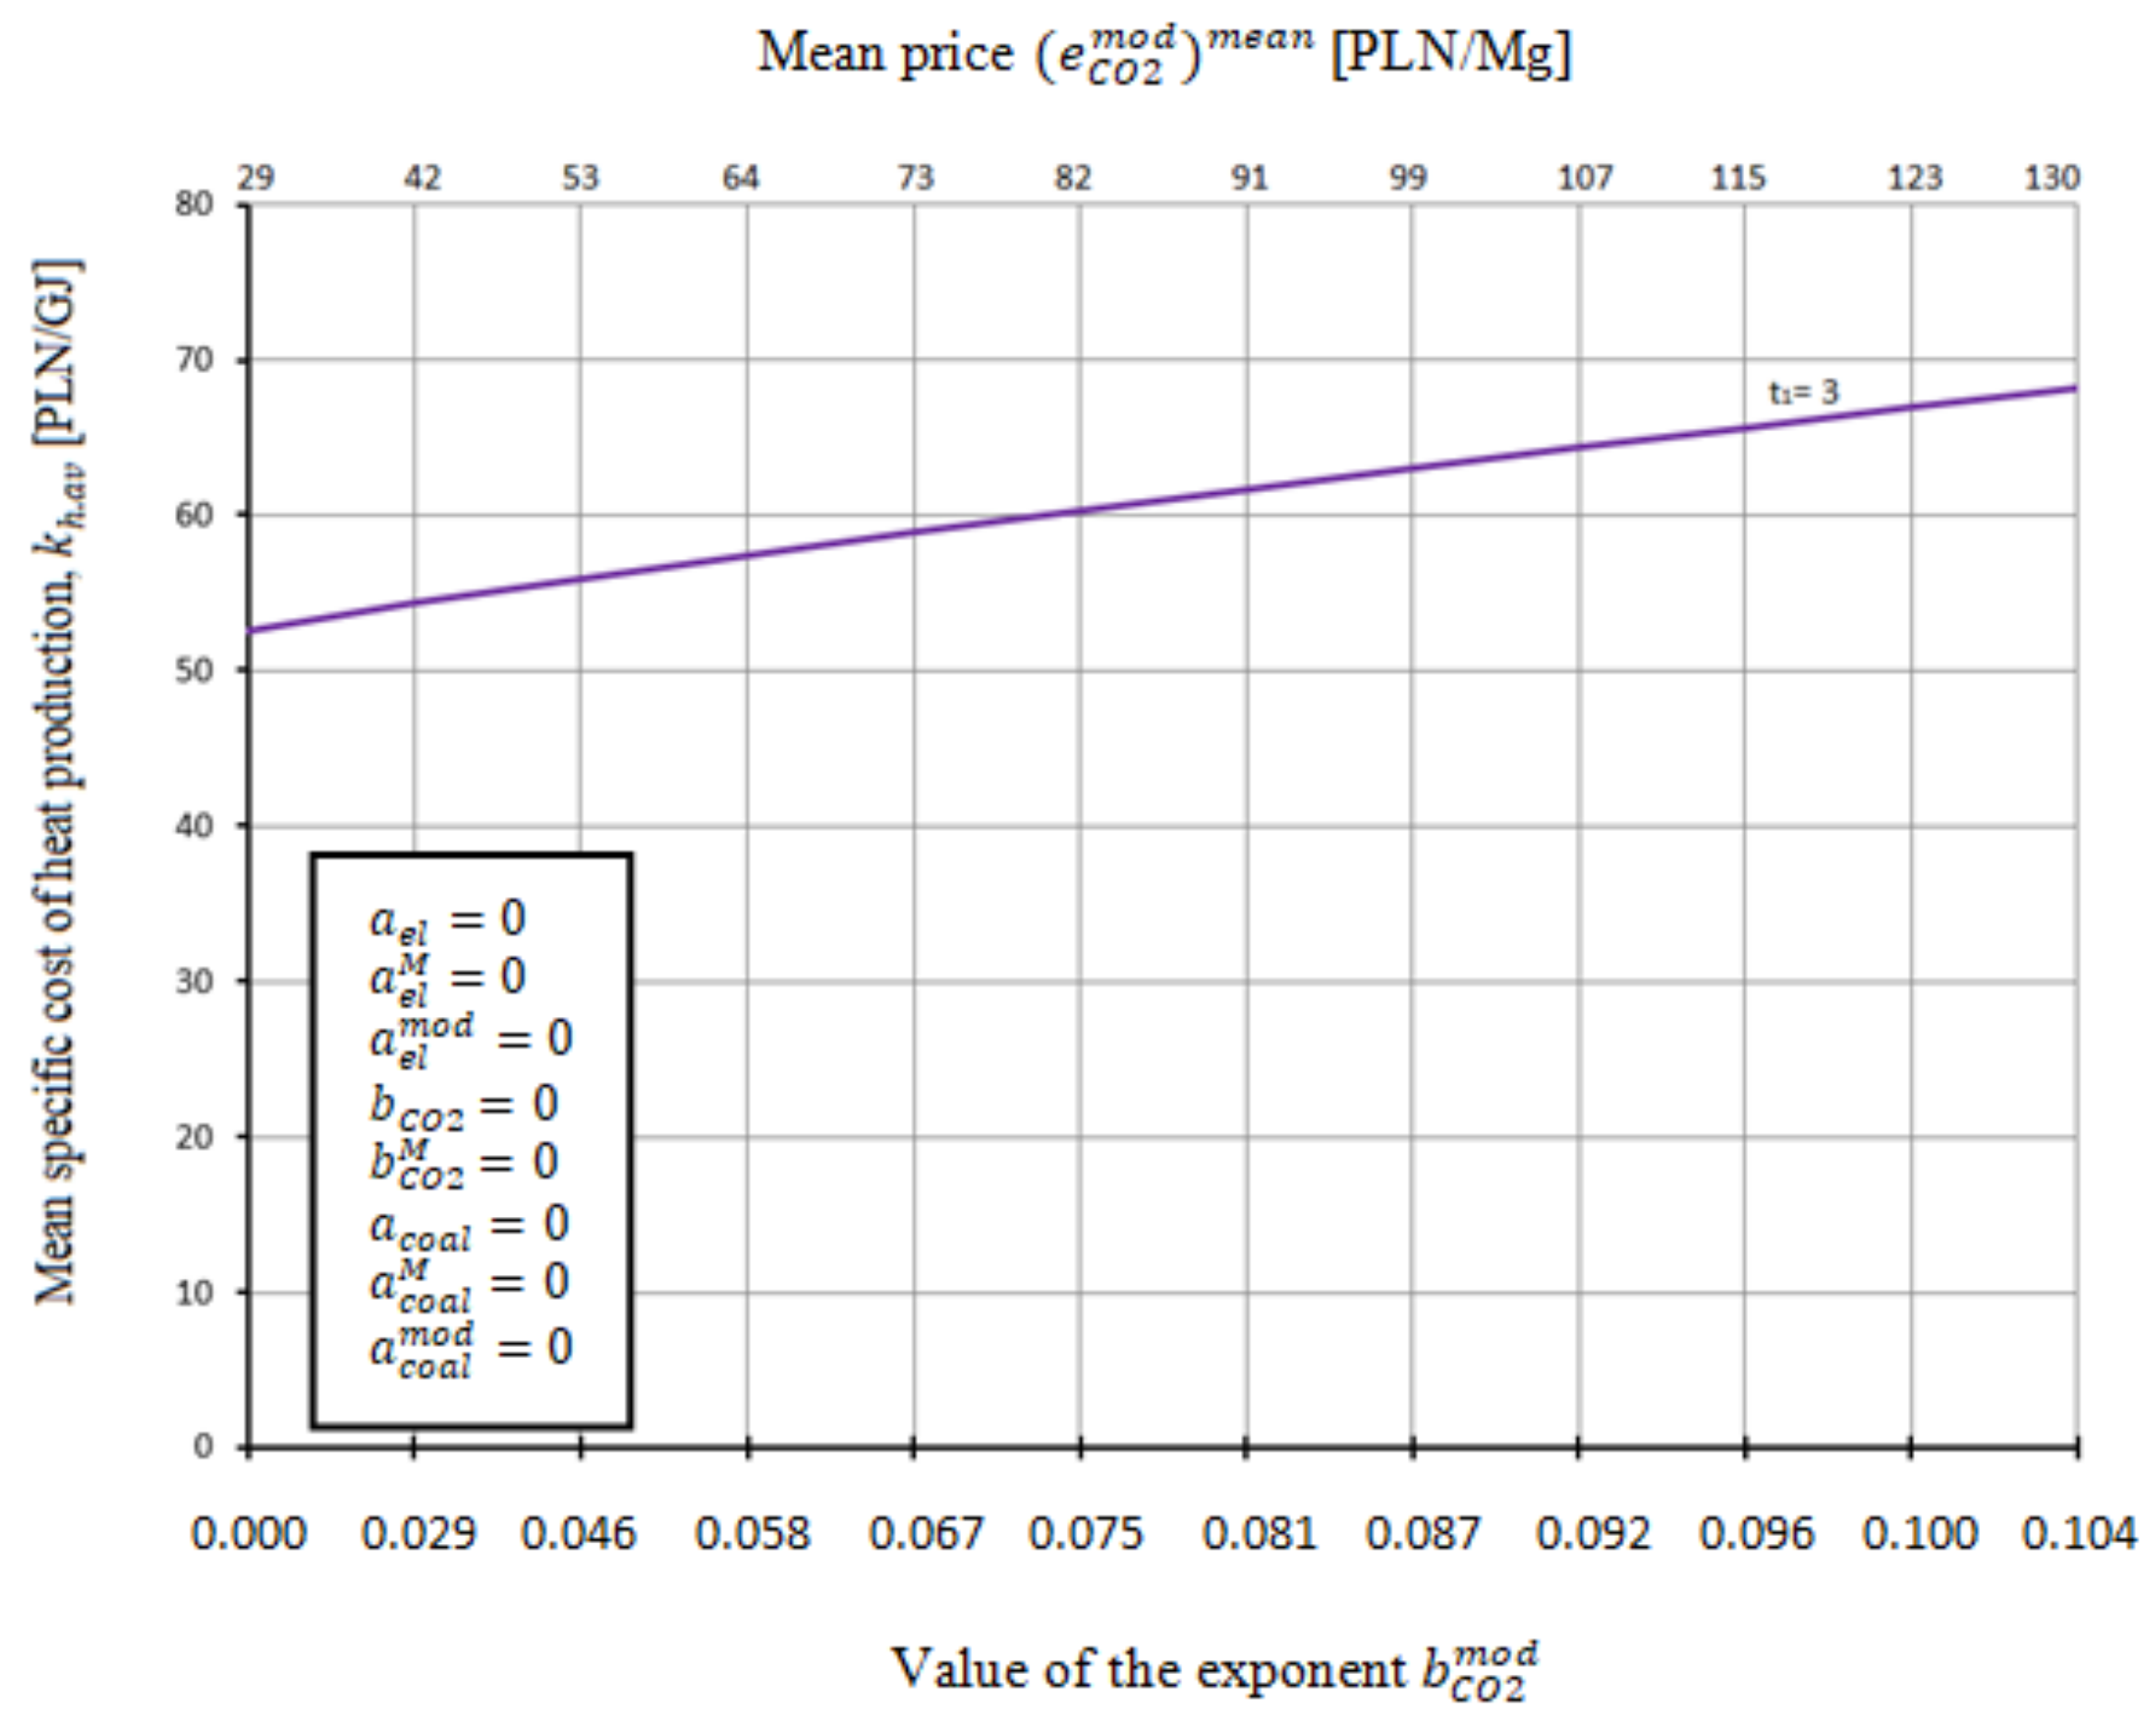
Figure 10.
Specific cost of heat generation in the heating plant repowered to a gas–steam CHP plant in the function of the mean gas price as well as value of the exponent for t1 = 3.
Figure 10.
Specific cost of heat generation in the heating plant repowered to a gas–steam CHP plant in the function of the mean gas price as well as value of the exponent for t1 = 3.
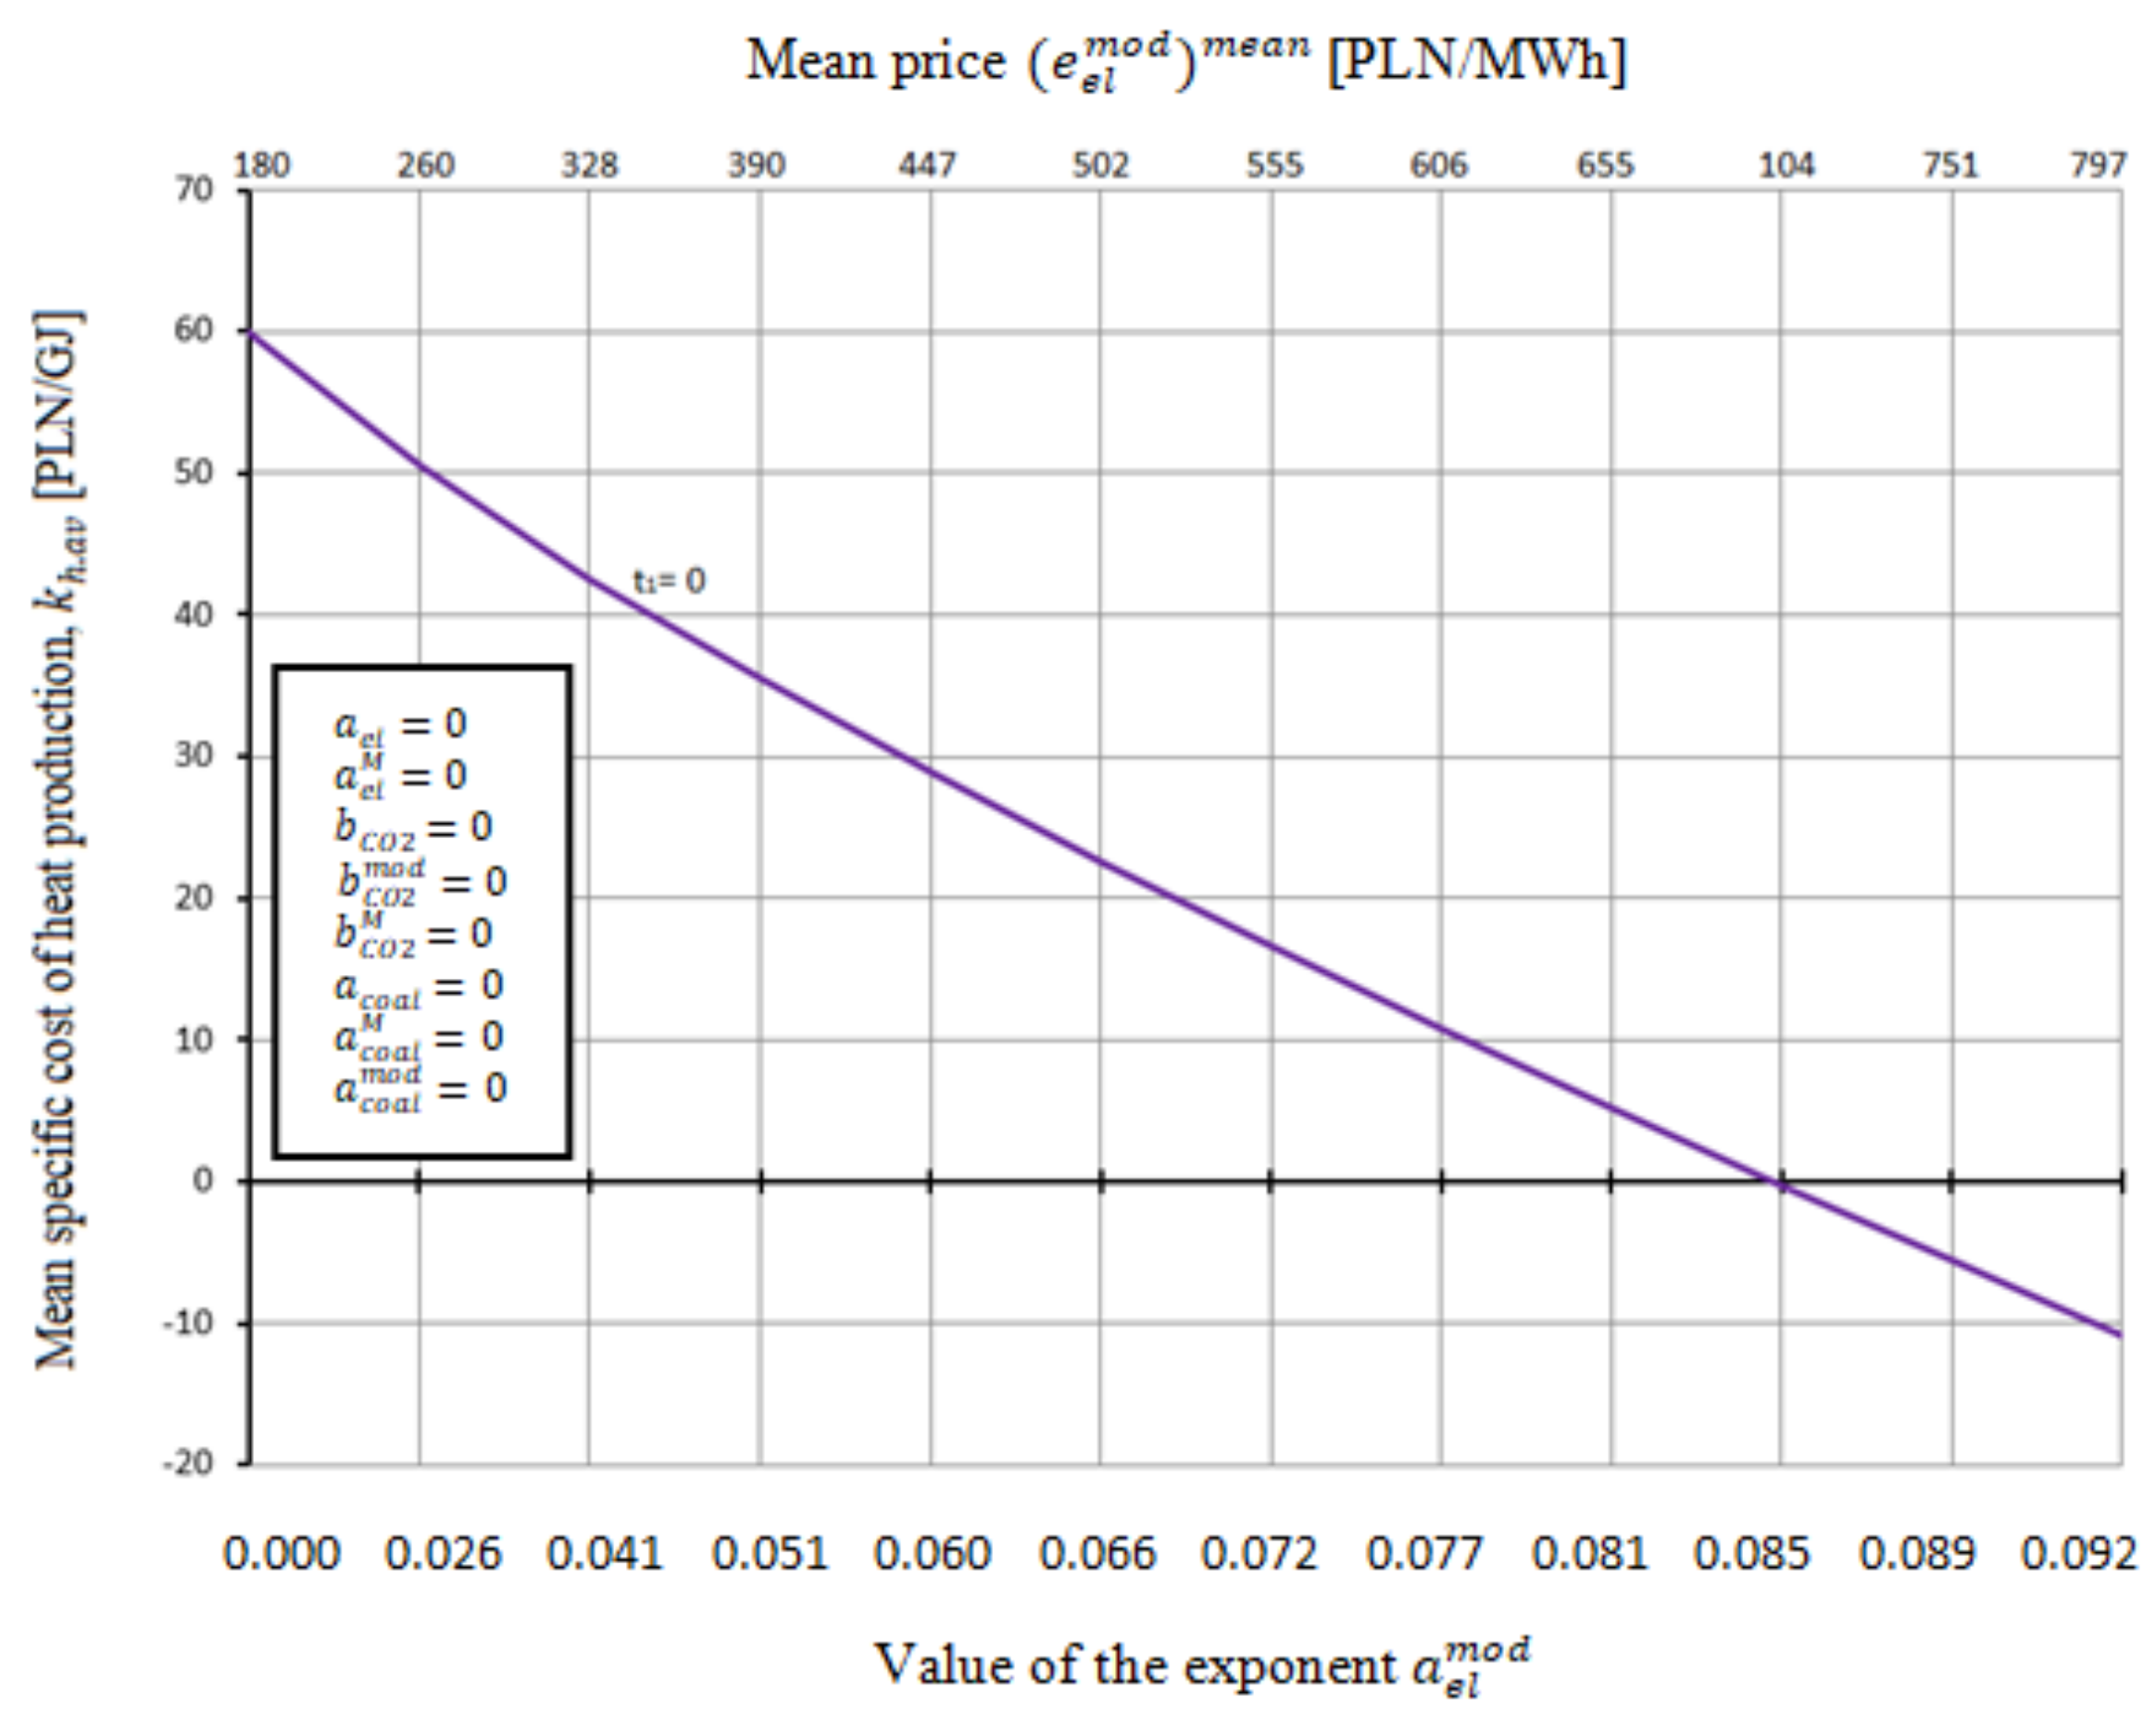
Figure 11.
Specific cost of heat generation in the heating plant repowered to a gas–steam CHP plant in the function of the mean price as well as value of the exponent for t1 = 0.
Figure 11.
Specific cost of heat generation in the heating plant repowered to a gas–steam CHP plant in the function of the mean price as well as value of the exponent for t1 = 0.
Figure 12.
Specific cost of heat generation in the heating plant repowered to a gas–steam CHP plant in the function of the mean price as well as value of the exponent for t1 = 3.
Figure 12.
Specific cost of heat generation in the heating plant repowered to a gas–steam CHP plant in the function of the mean price as well as value of the exponent for t1 = 3.
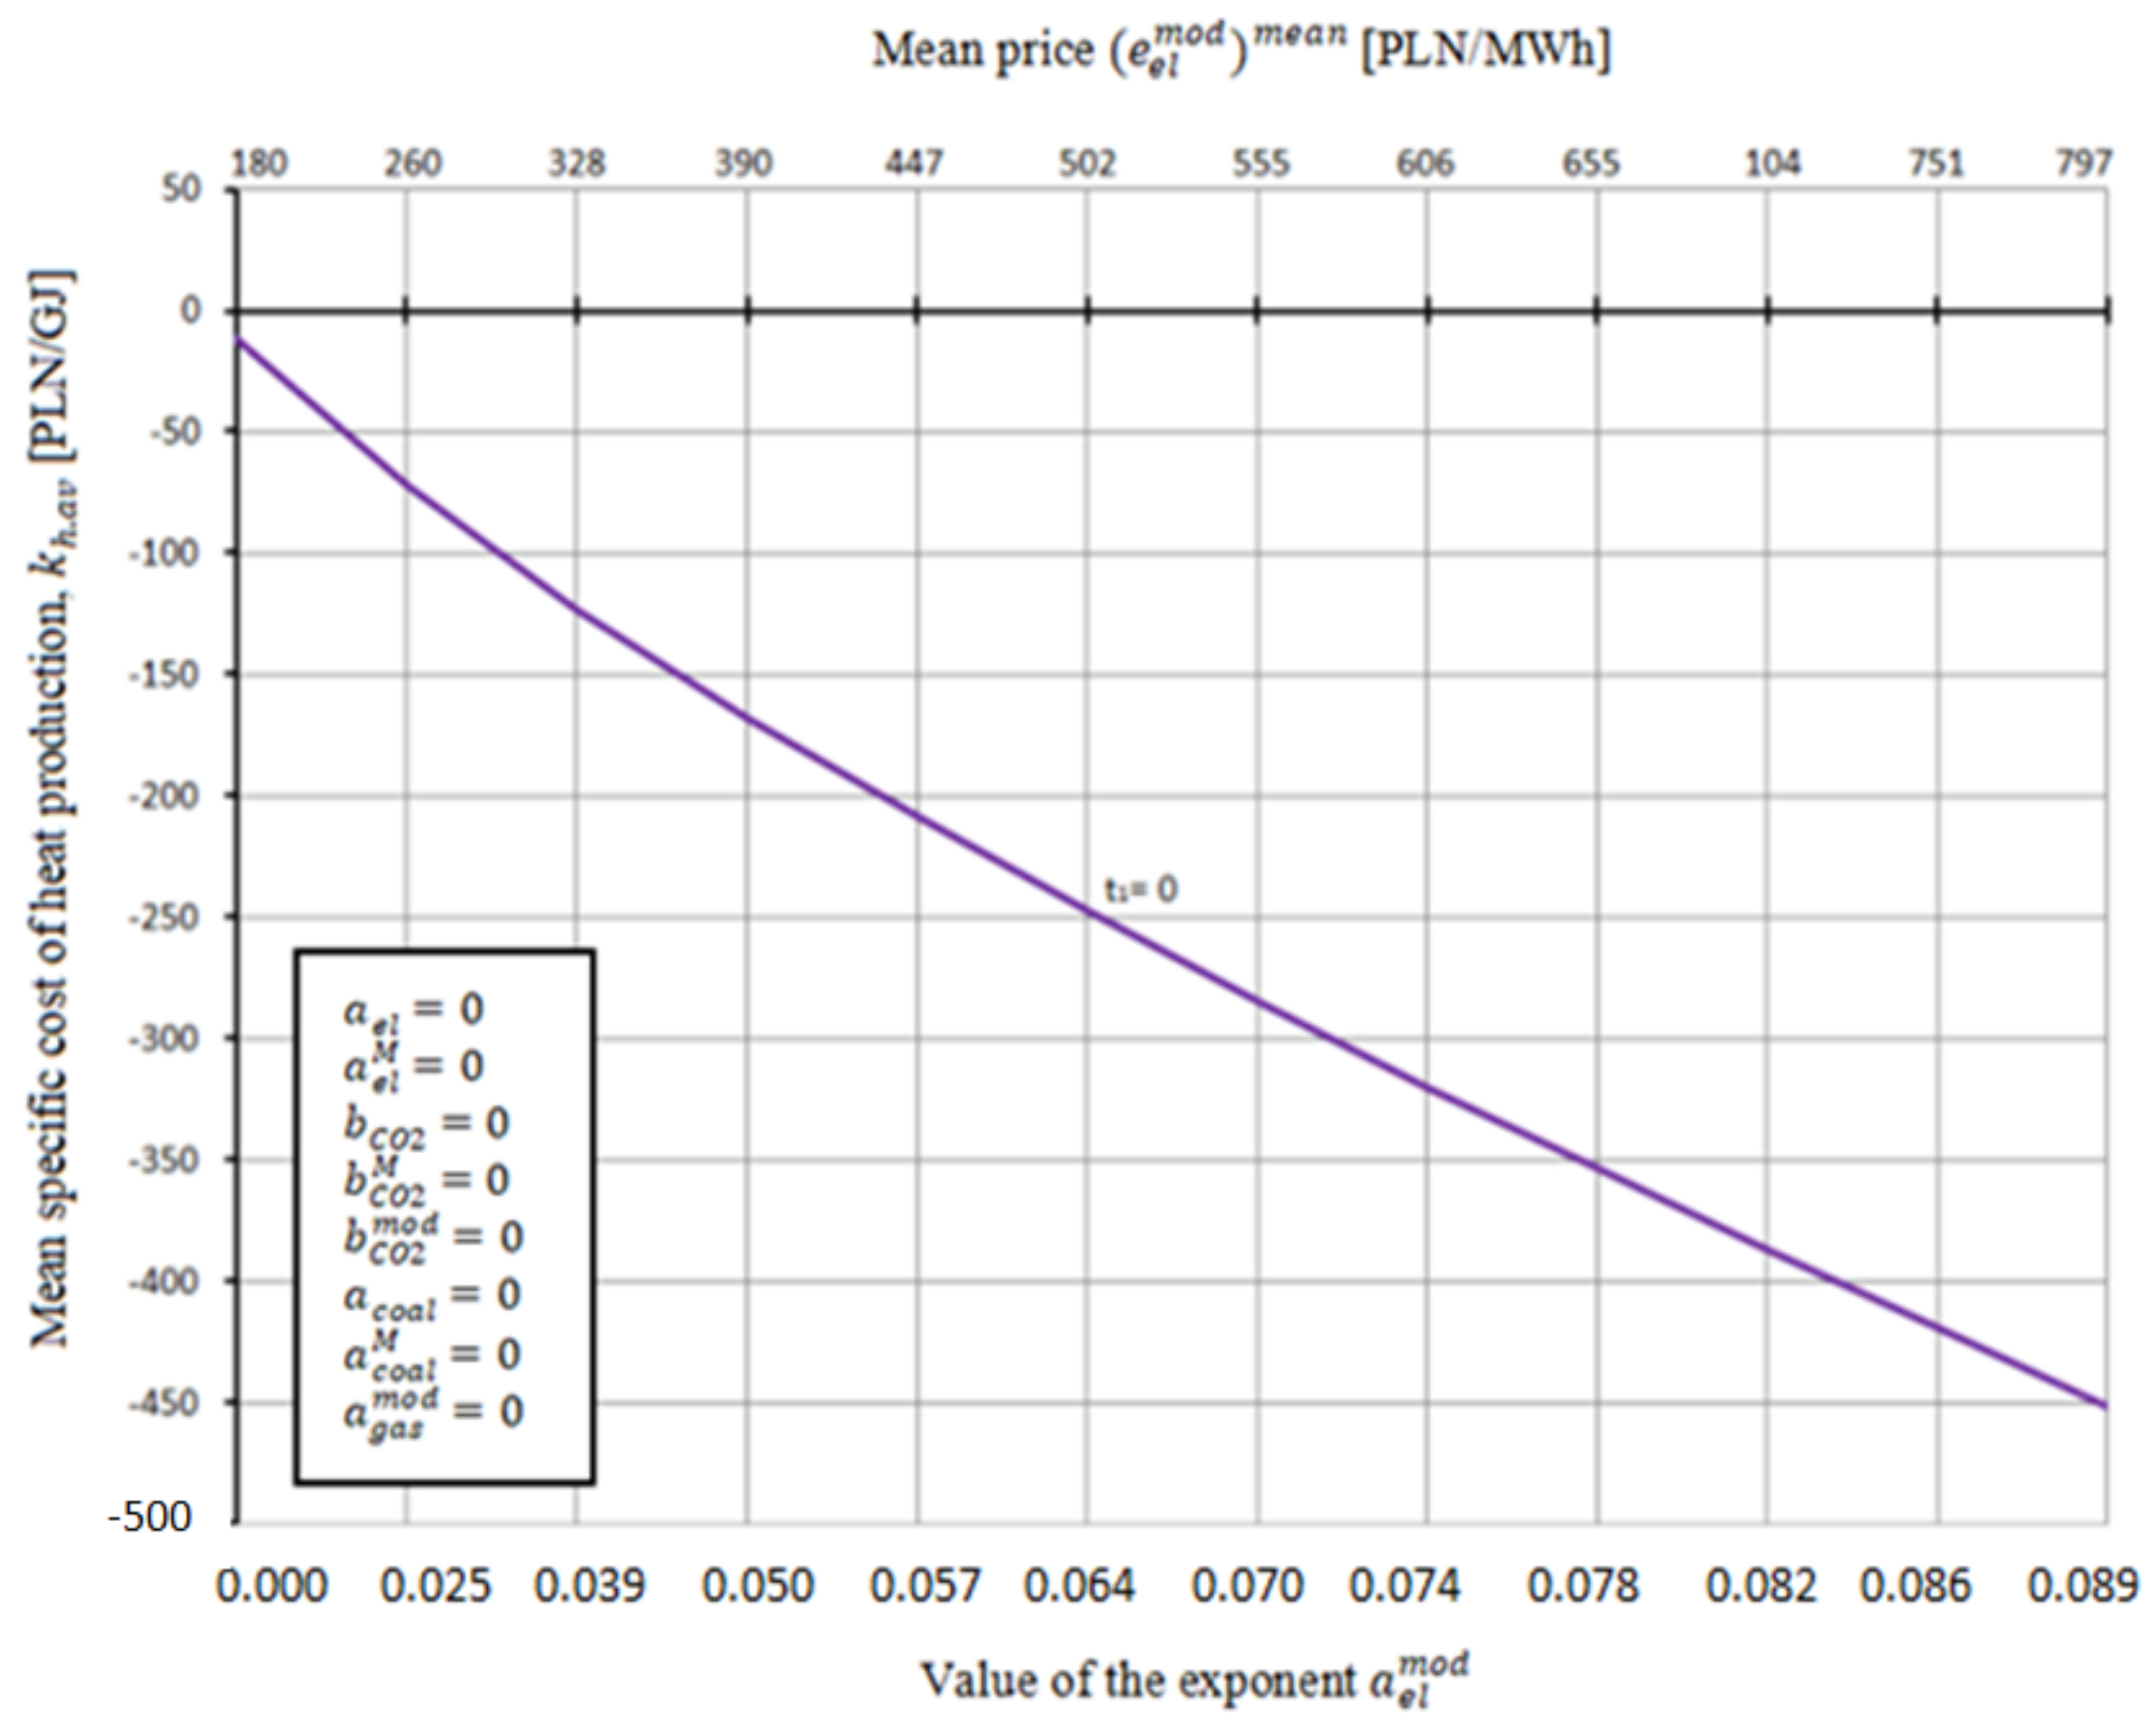
Figure 13.
Specific cost of heat generation in the heating plant repowered to a gas–steam CHP plant in the function of the mean electricity price as well as value of the exponent for t1 = 0.
Figure 13.
Specific cost of heat generation in the heating plant repowered to a gas–steam CHP plant in the function of the mean electricity price as well as value of the exponent for t1 = 0.
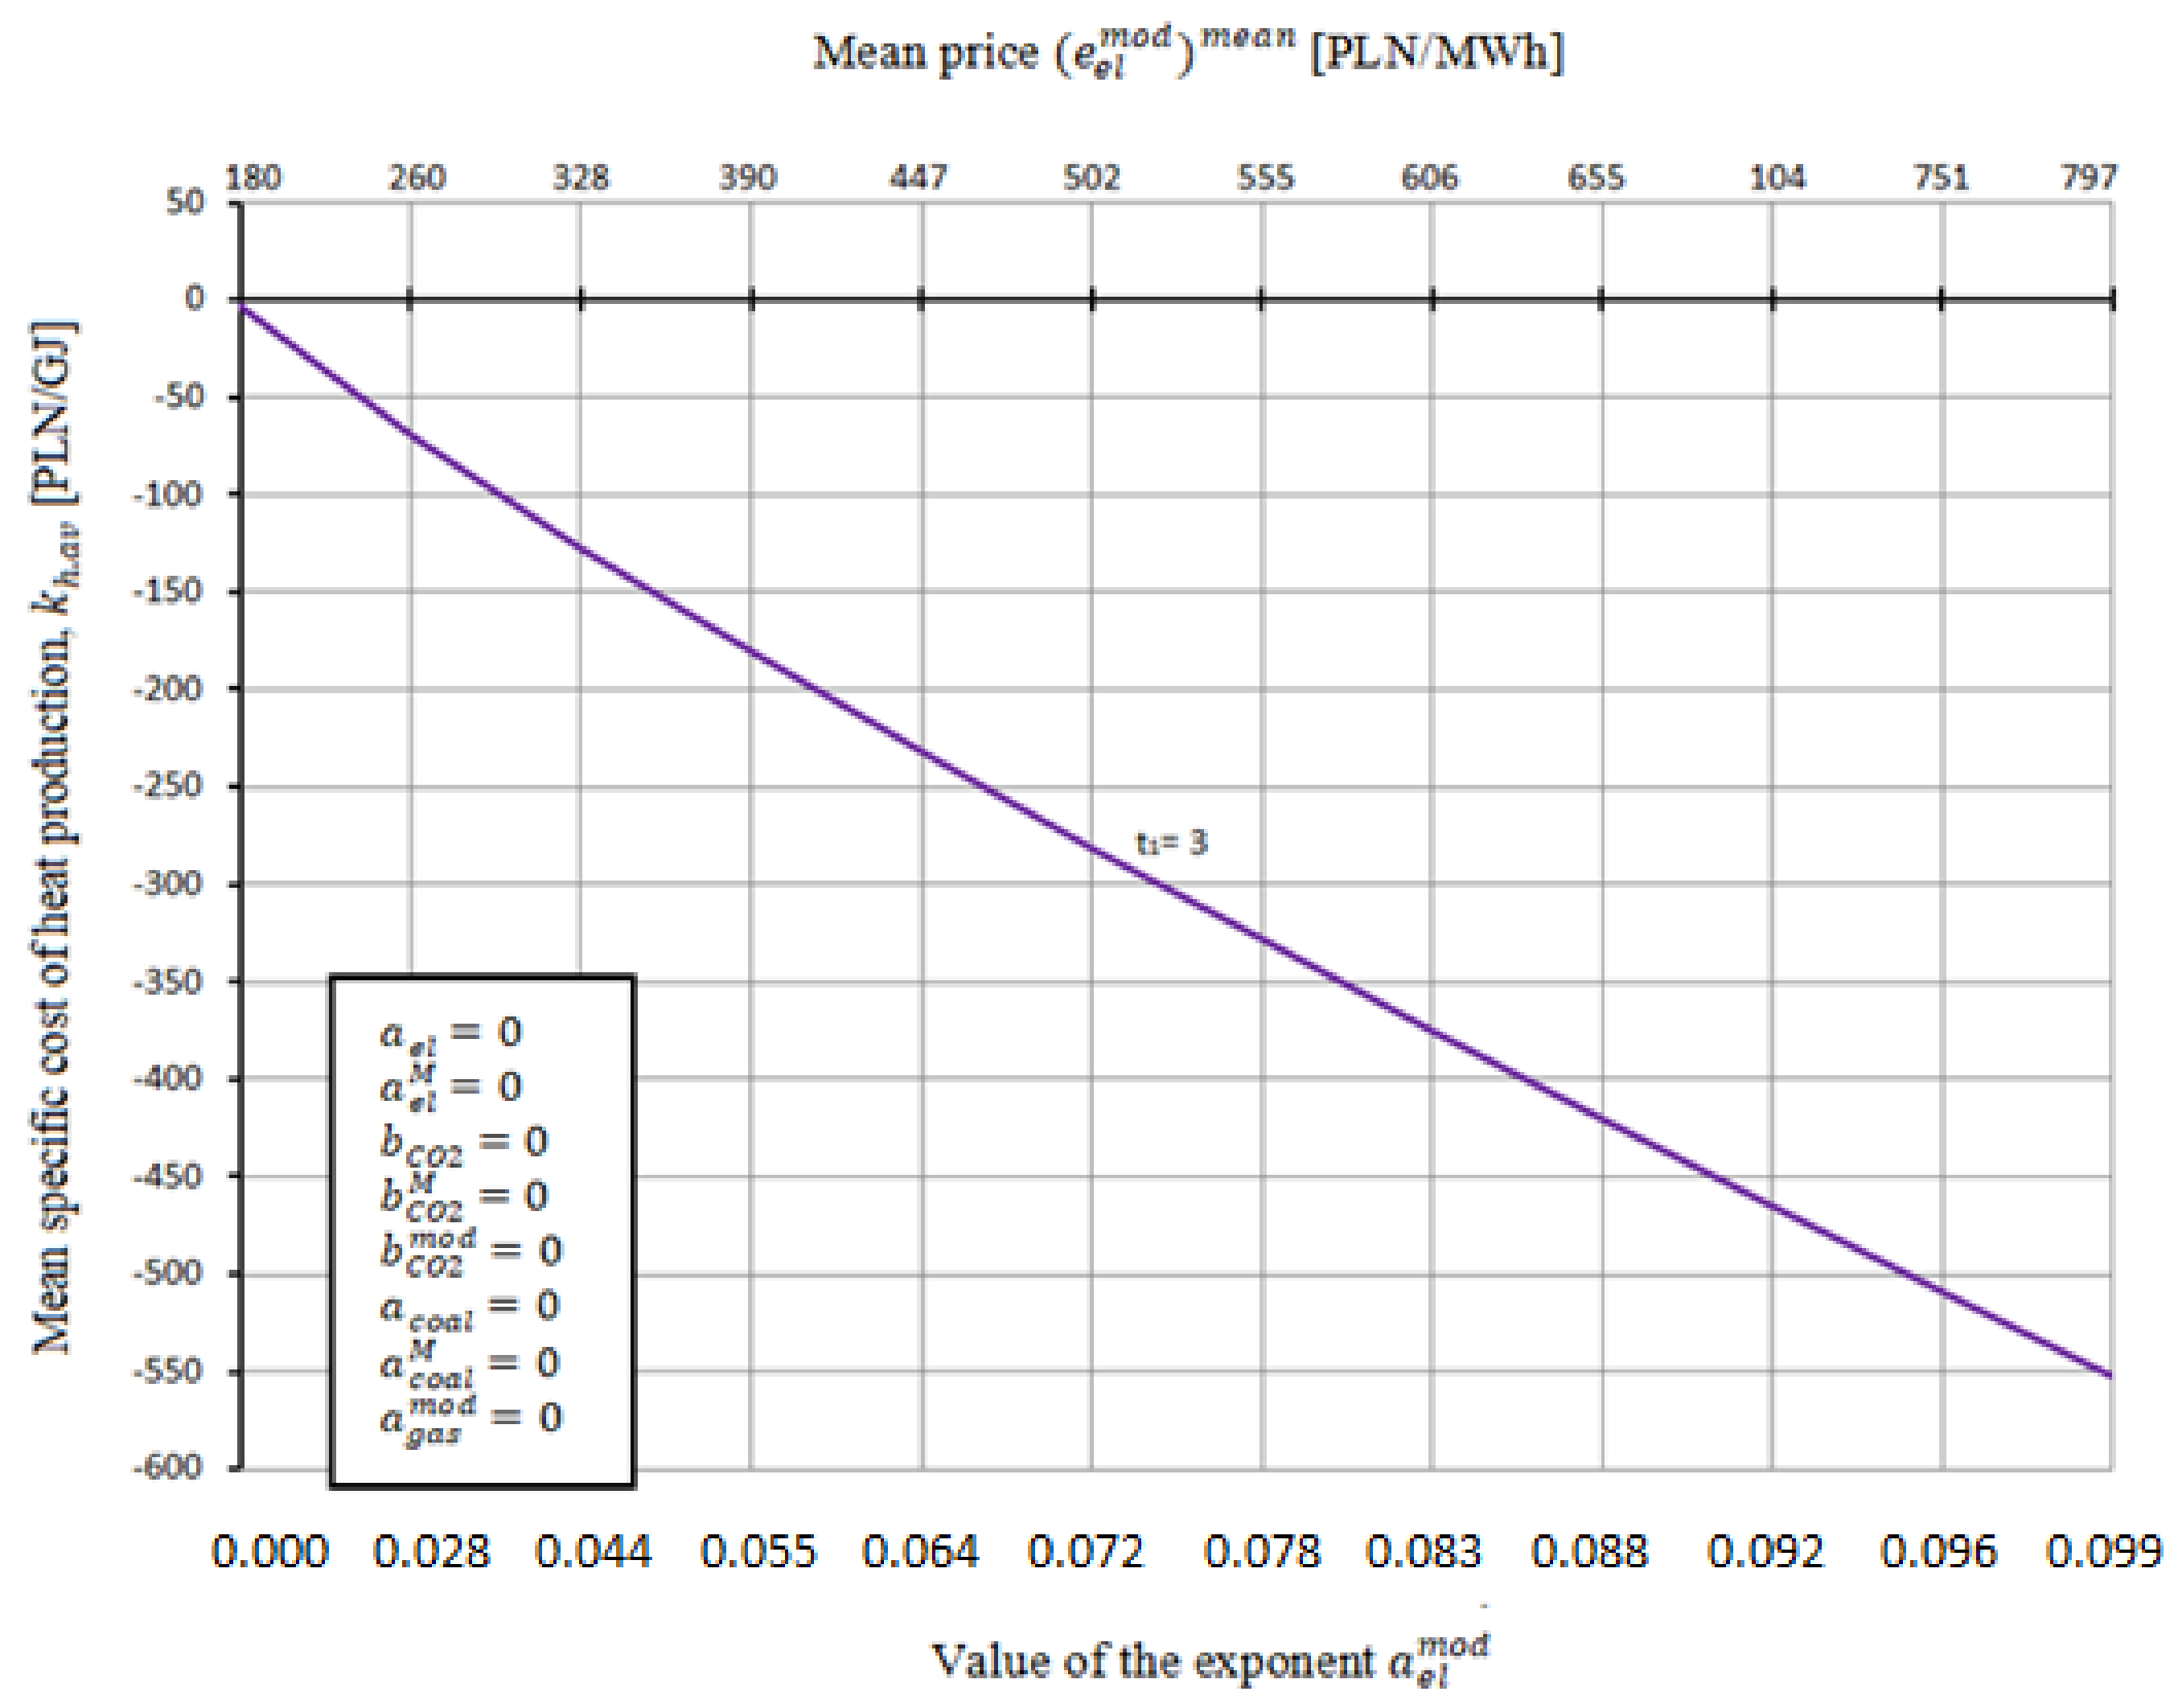
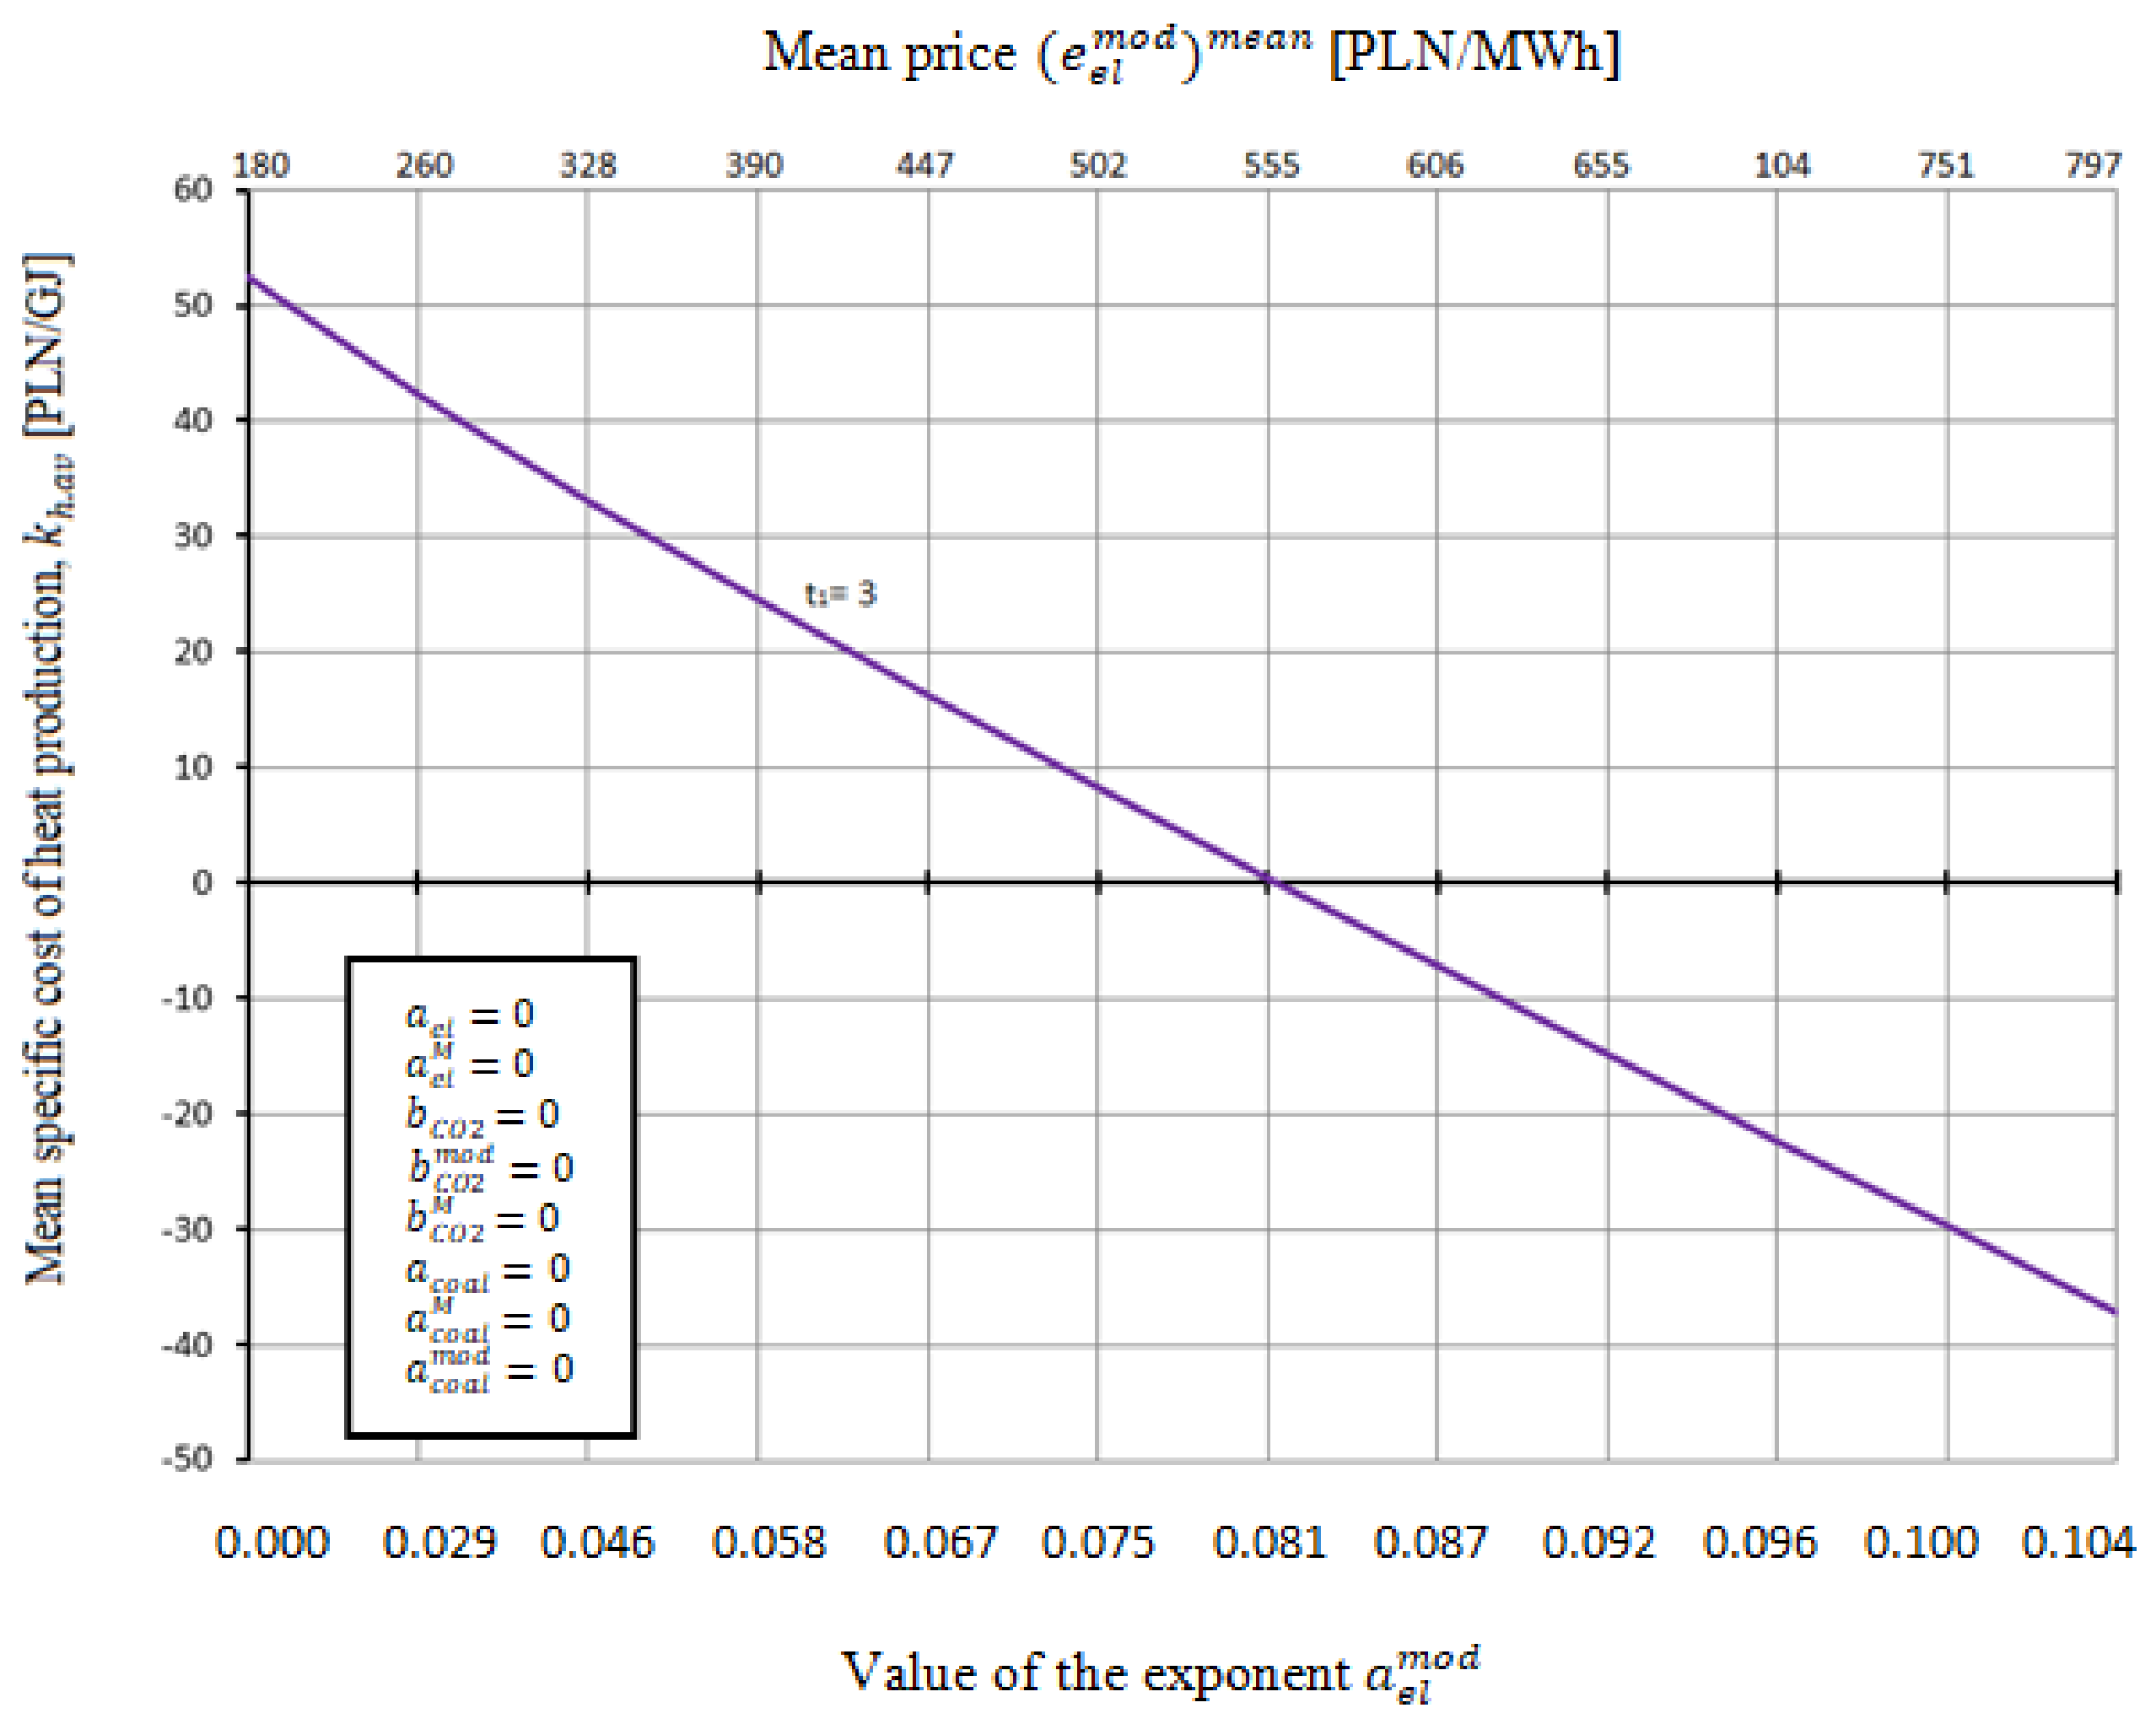
Figure 14.
Specific cost of heat generation in the heating plant repowered to a gas–steam CHP plant in the function of the mean electricity price as well as value of the exponent for t1 = 3.
Figure 14.
Specific cost of heat generation in the heating plant repowered to a gas–steam CHP plant in the function of the mean electricity price as well as value of the exponent for t1 = 3.
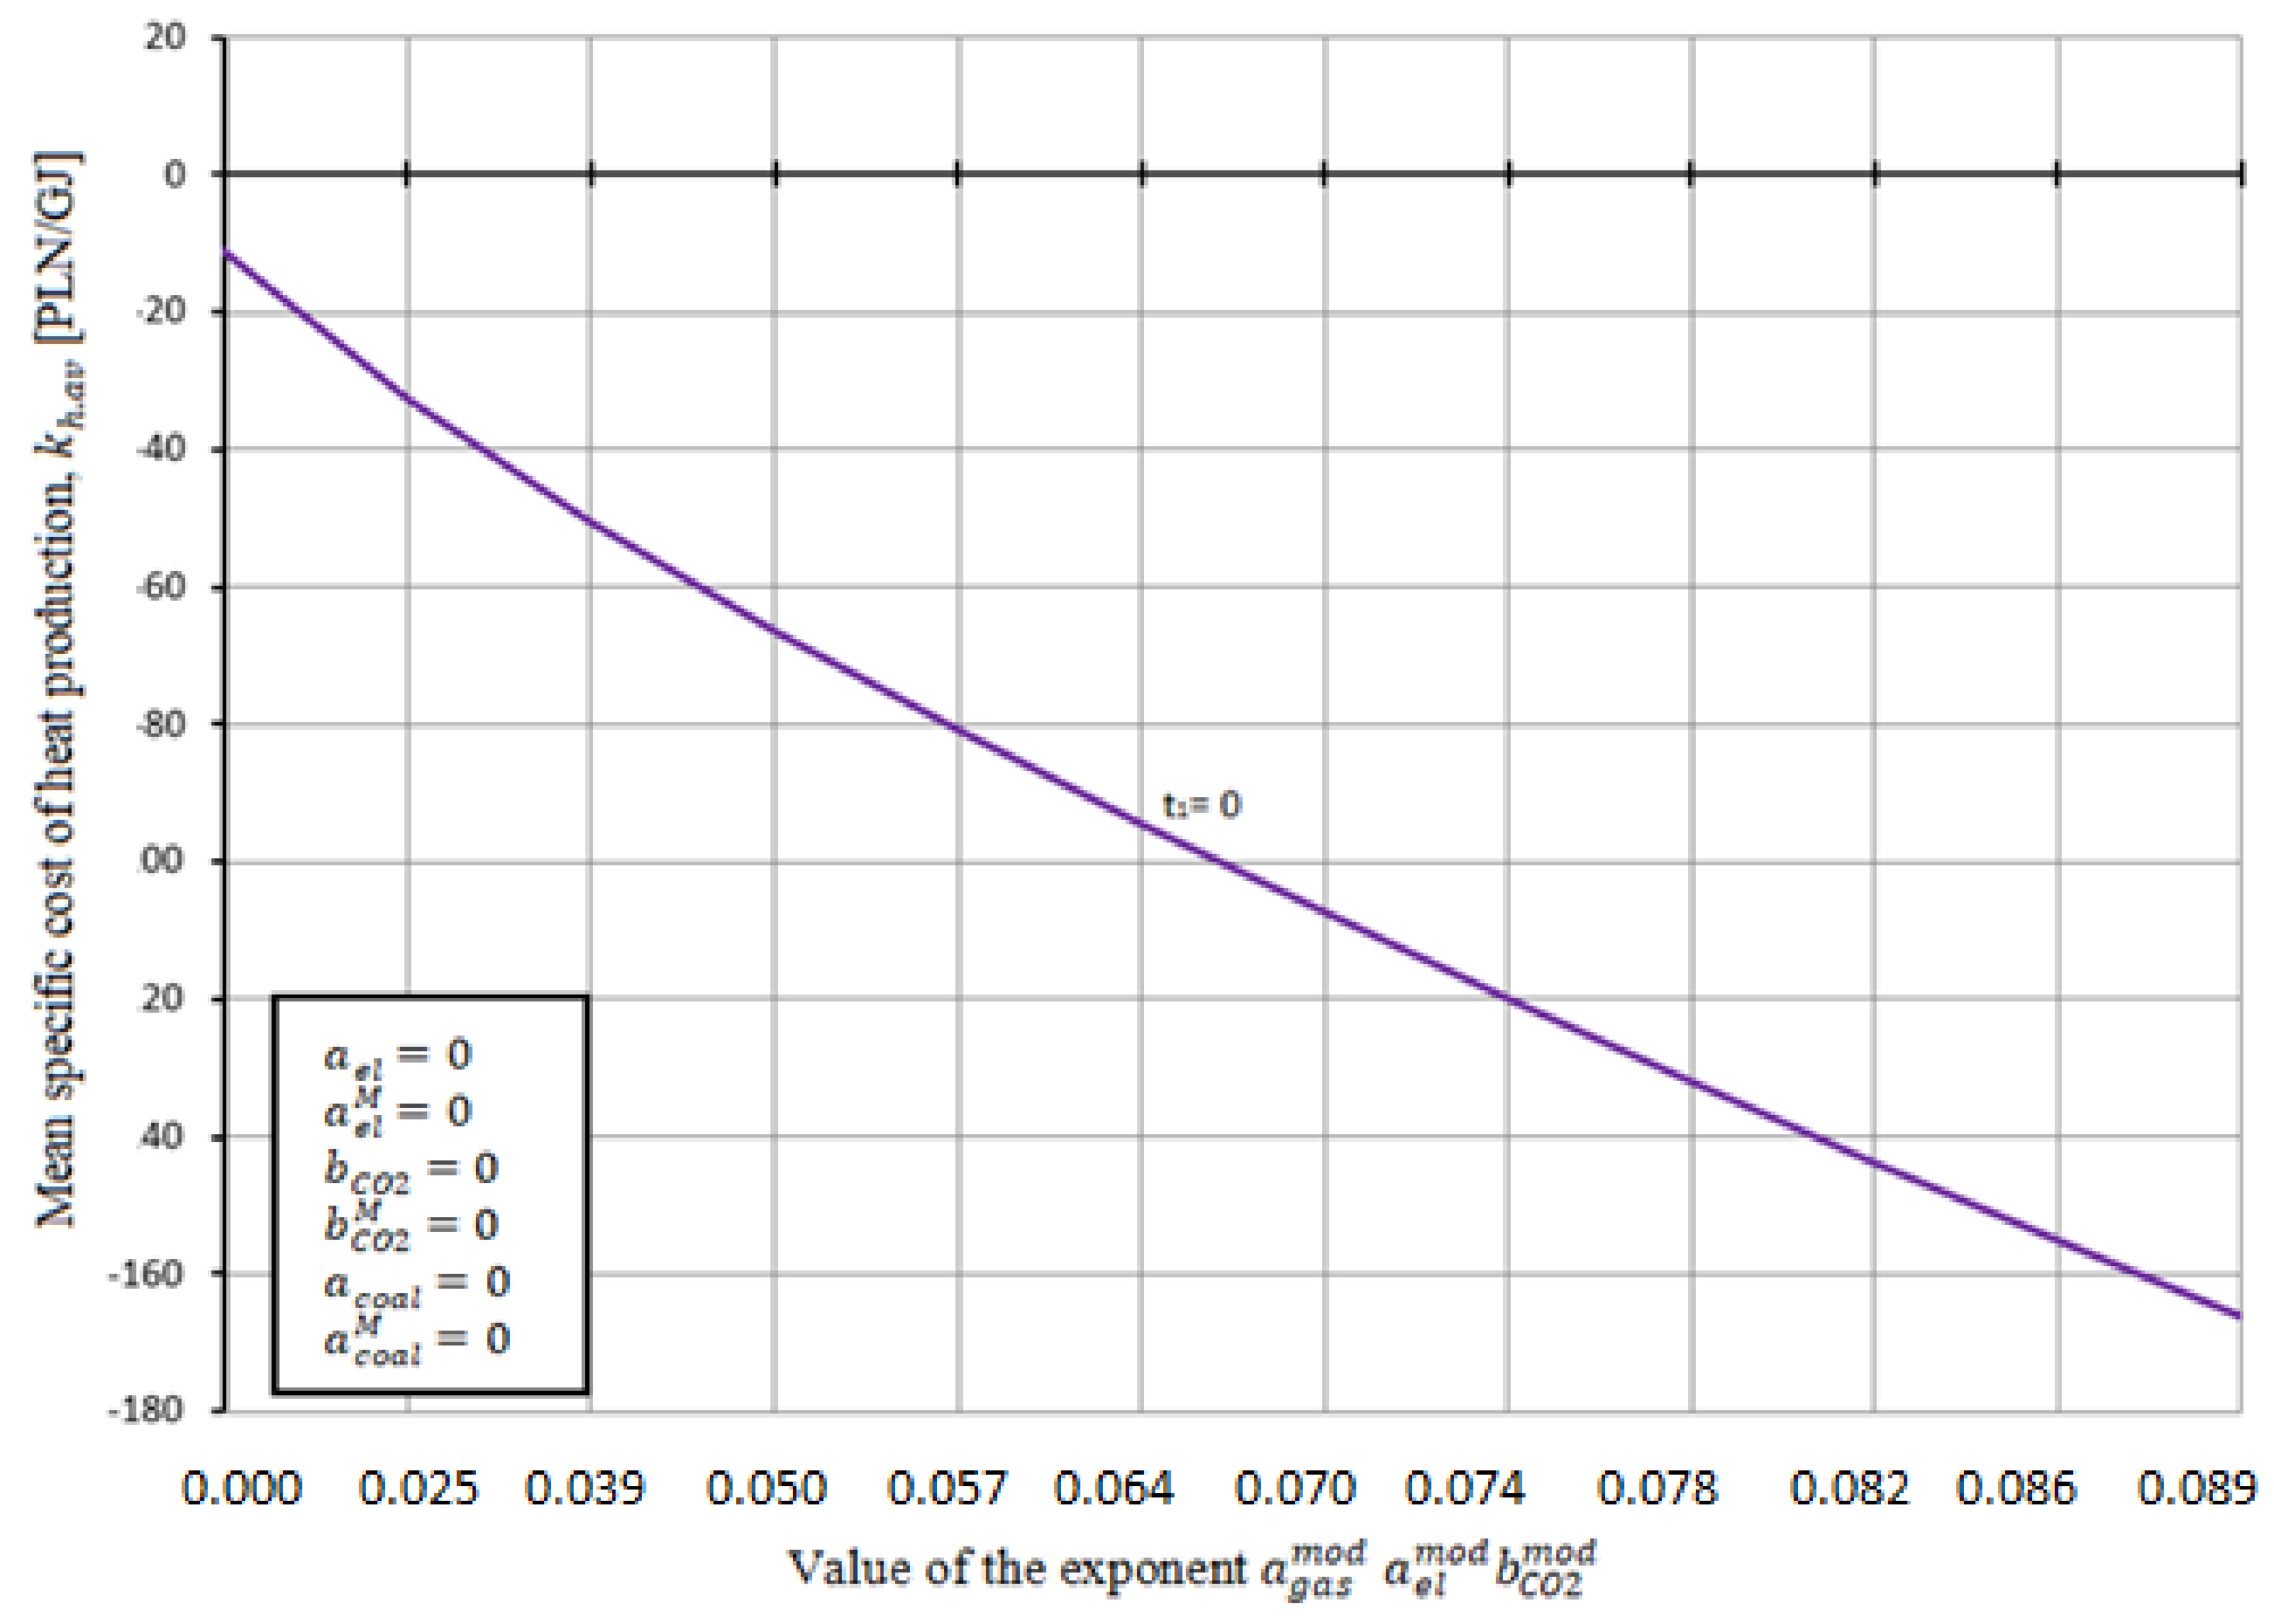
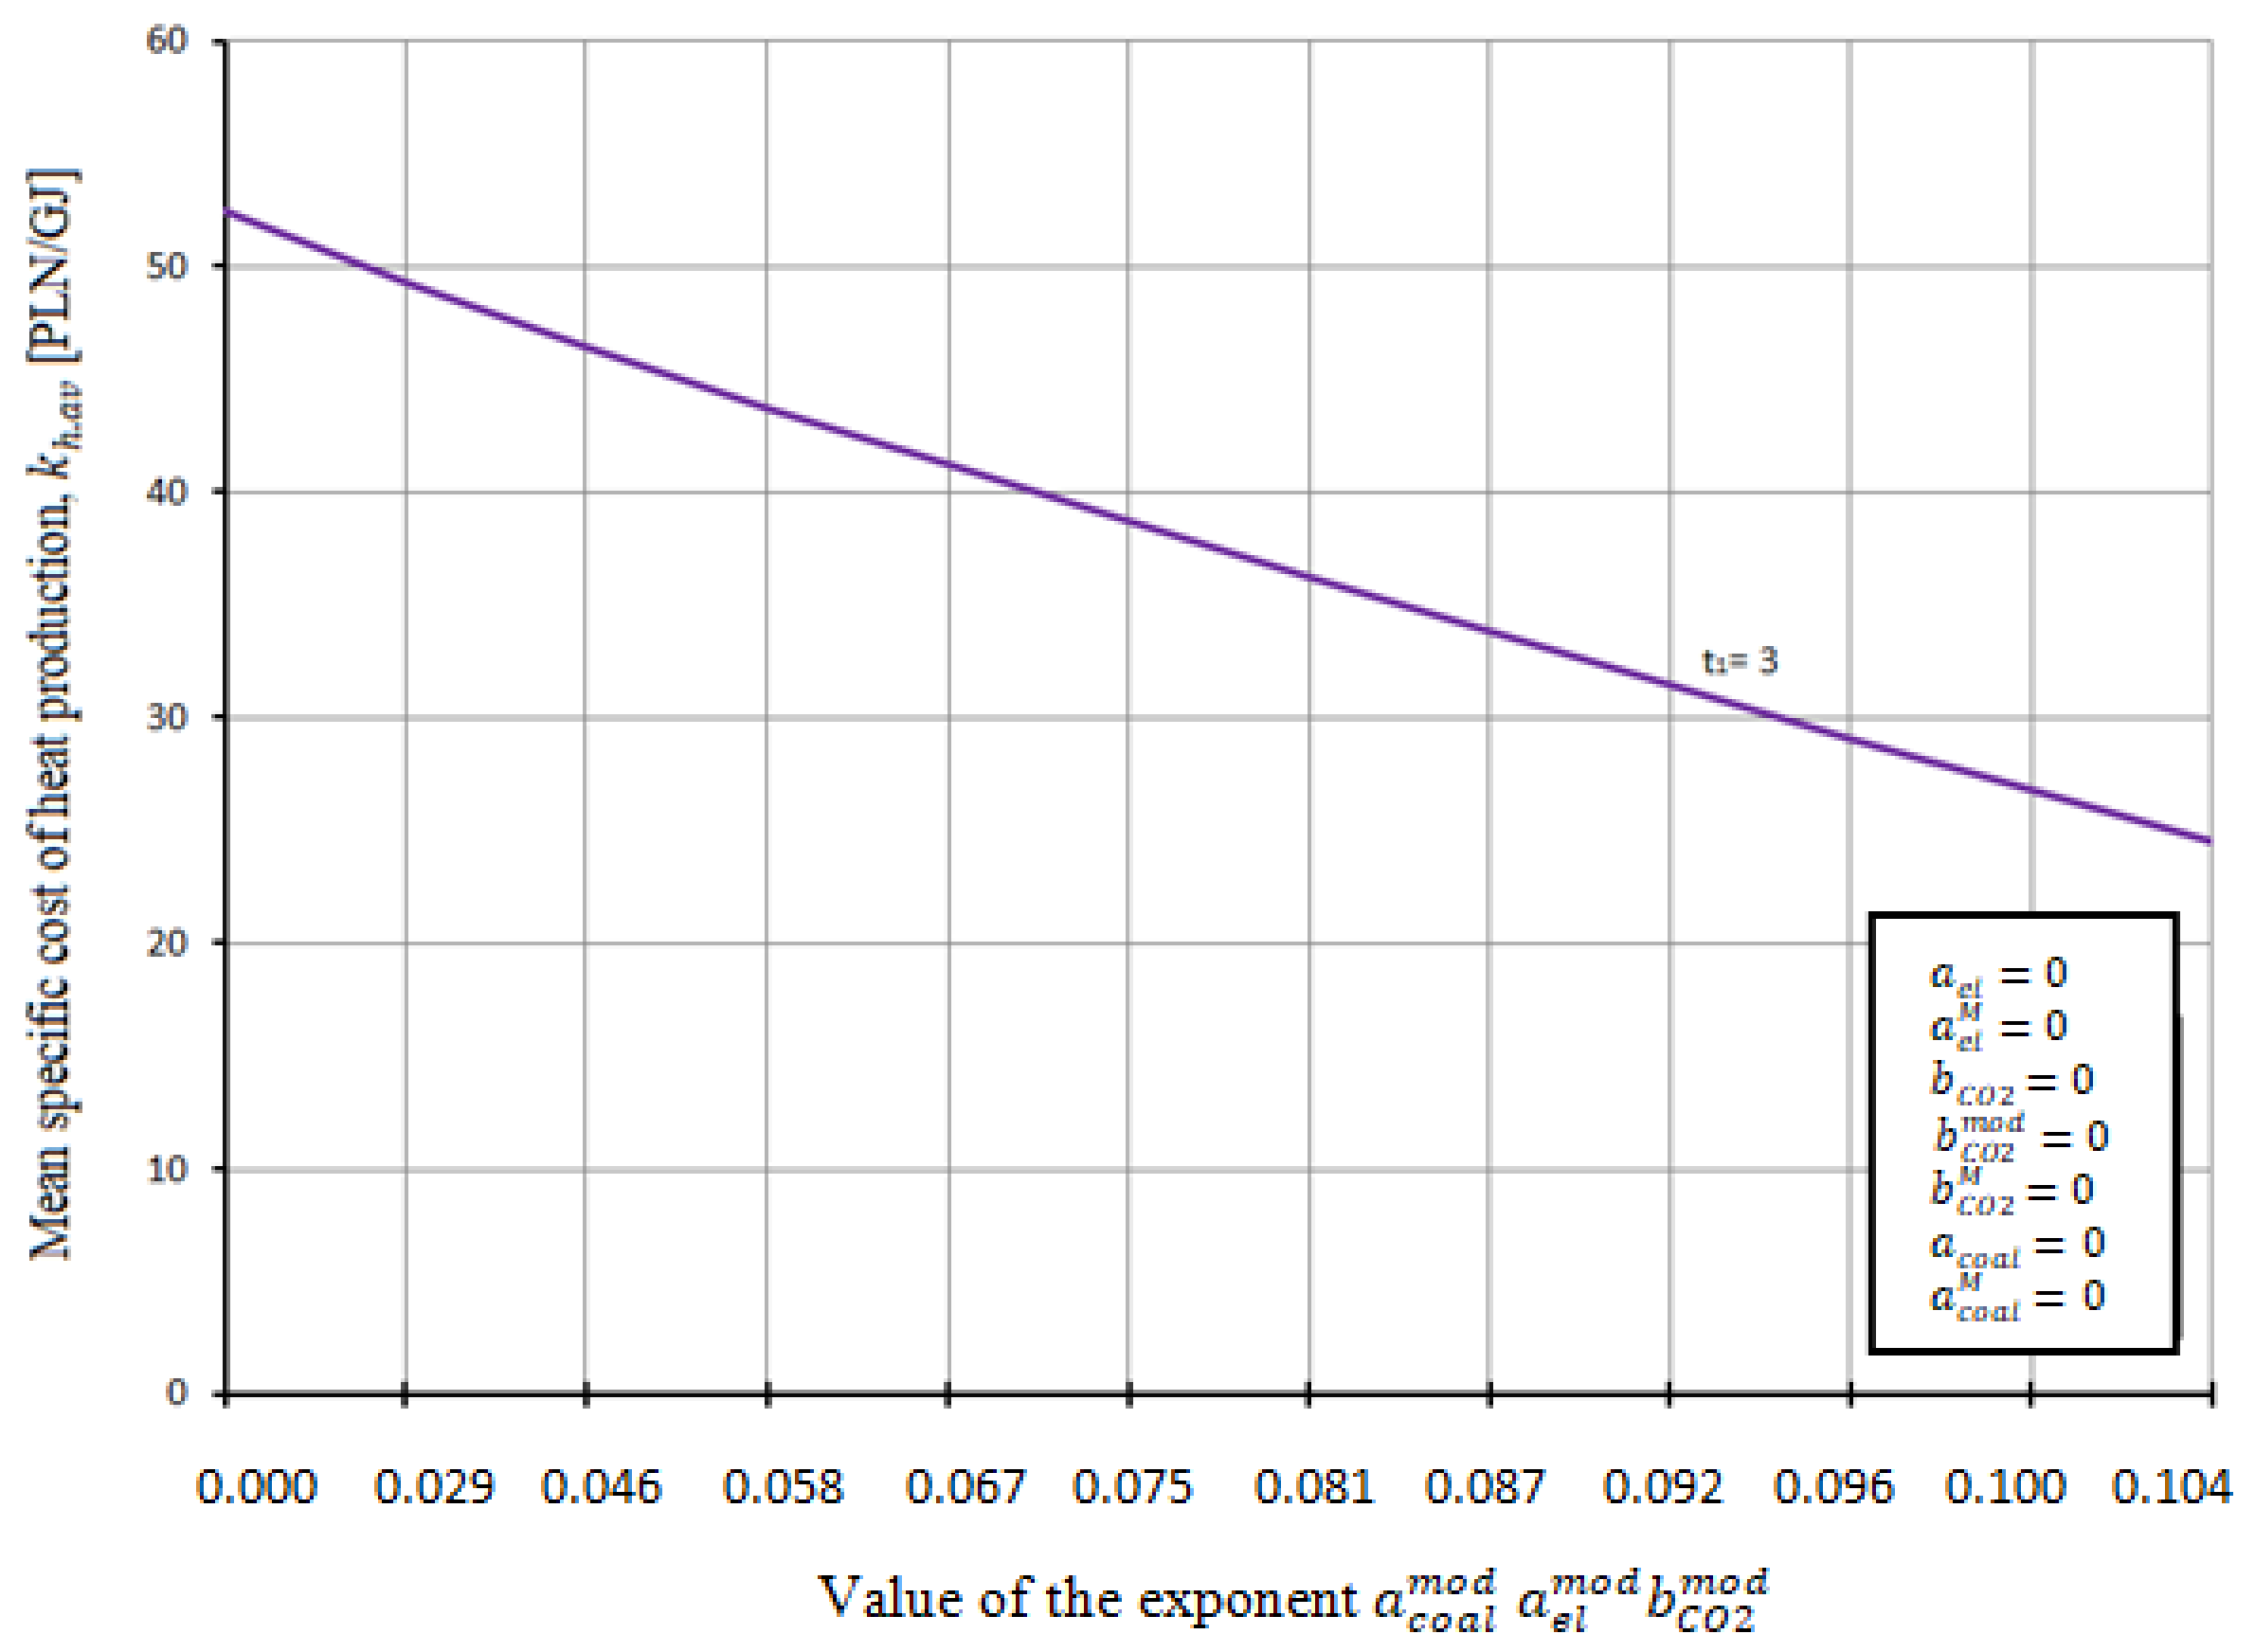
Figure 15.
Specific cost of heat generation in the heating plant repowered to a gas–steam CHP plant in the function of the of the exponent for t1 = 0.
Figure 15.
Specific cost of heat generation in the heating plant repowered to a gas–steam CHP plant in the function of the of the exponent for t1 = 0.
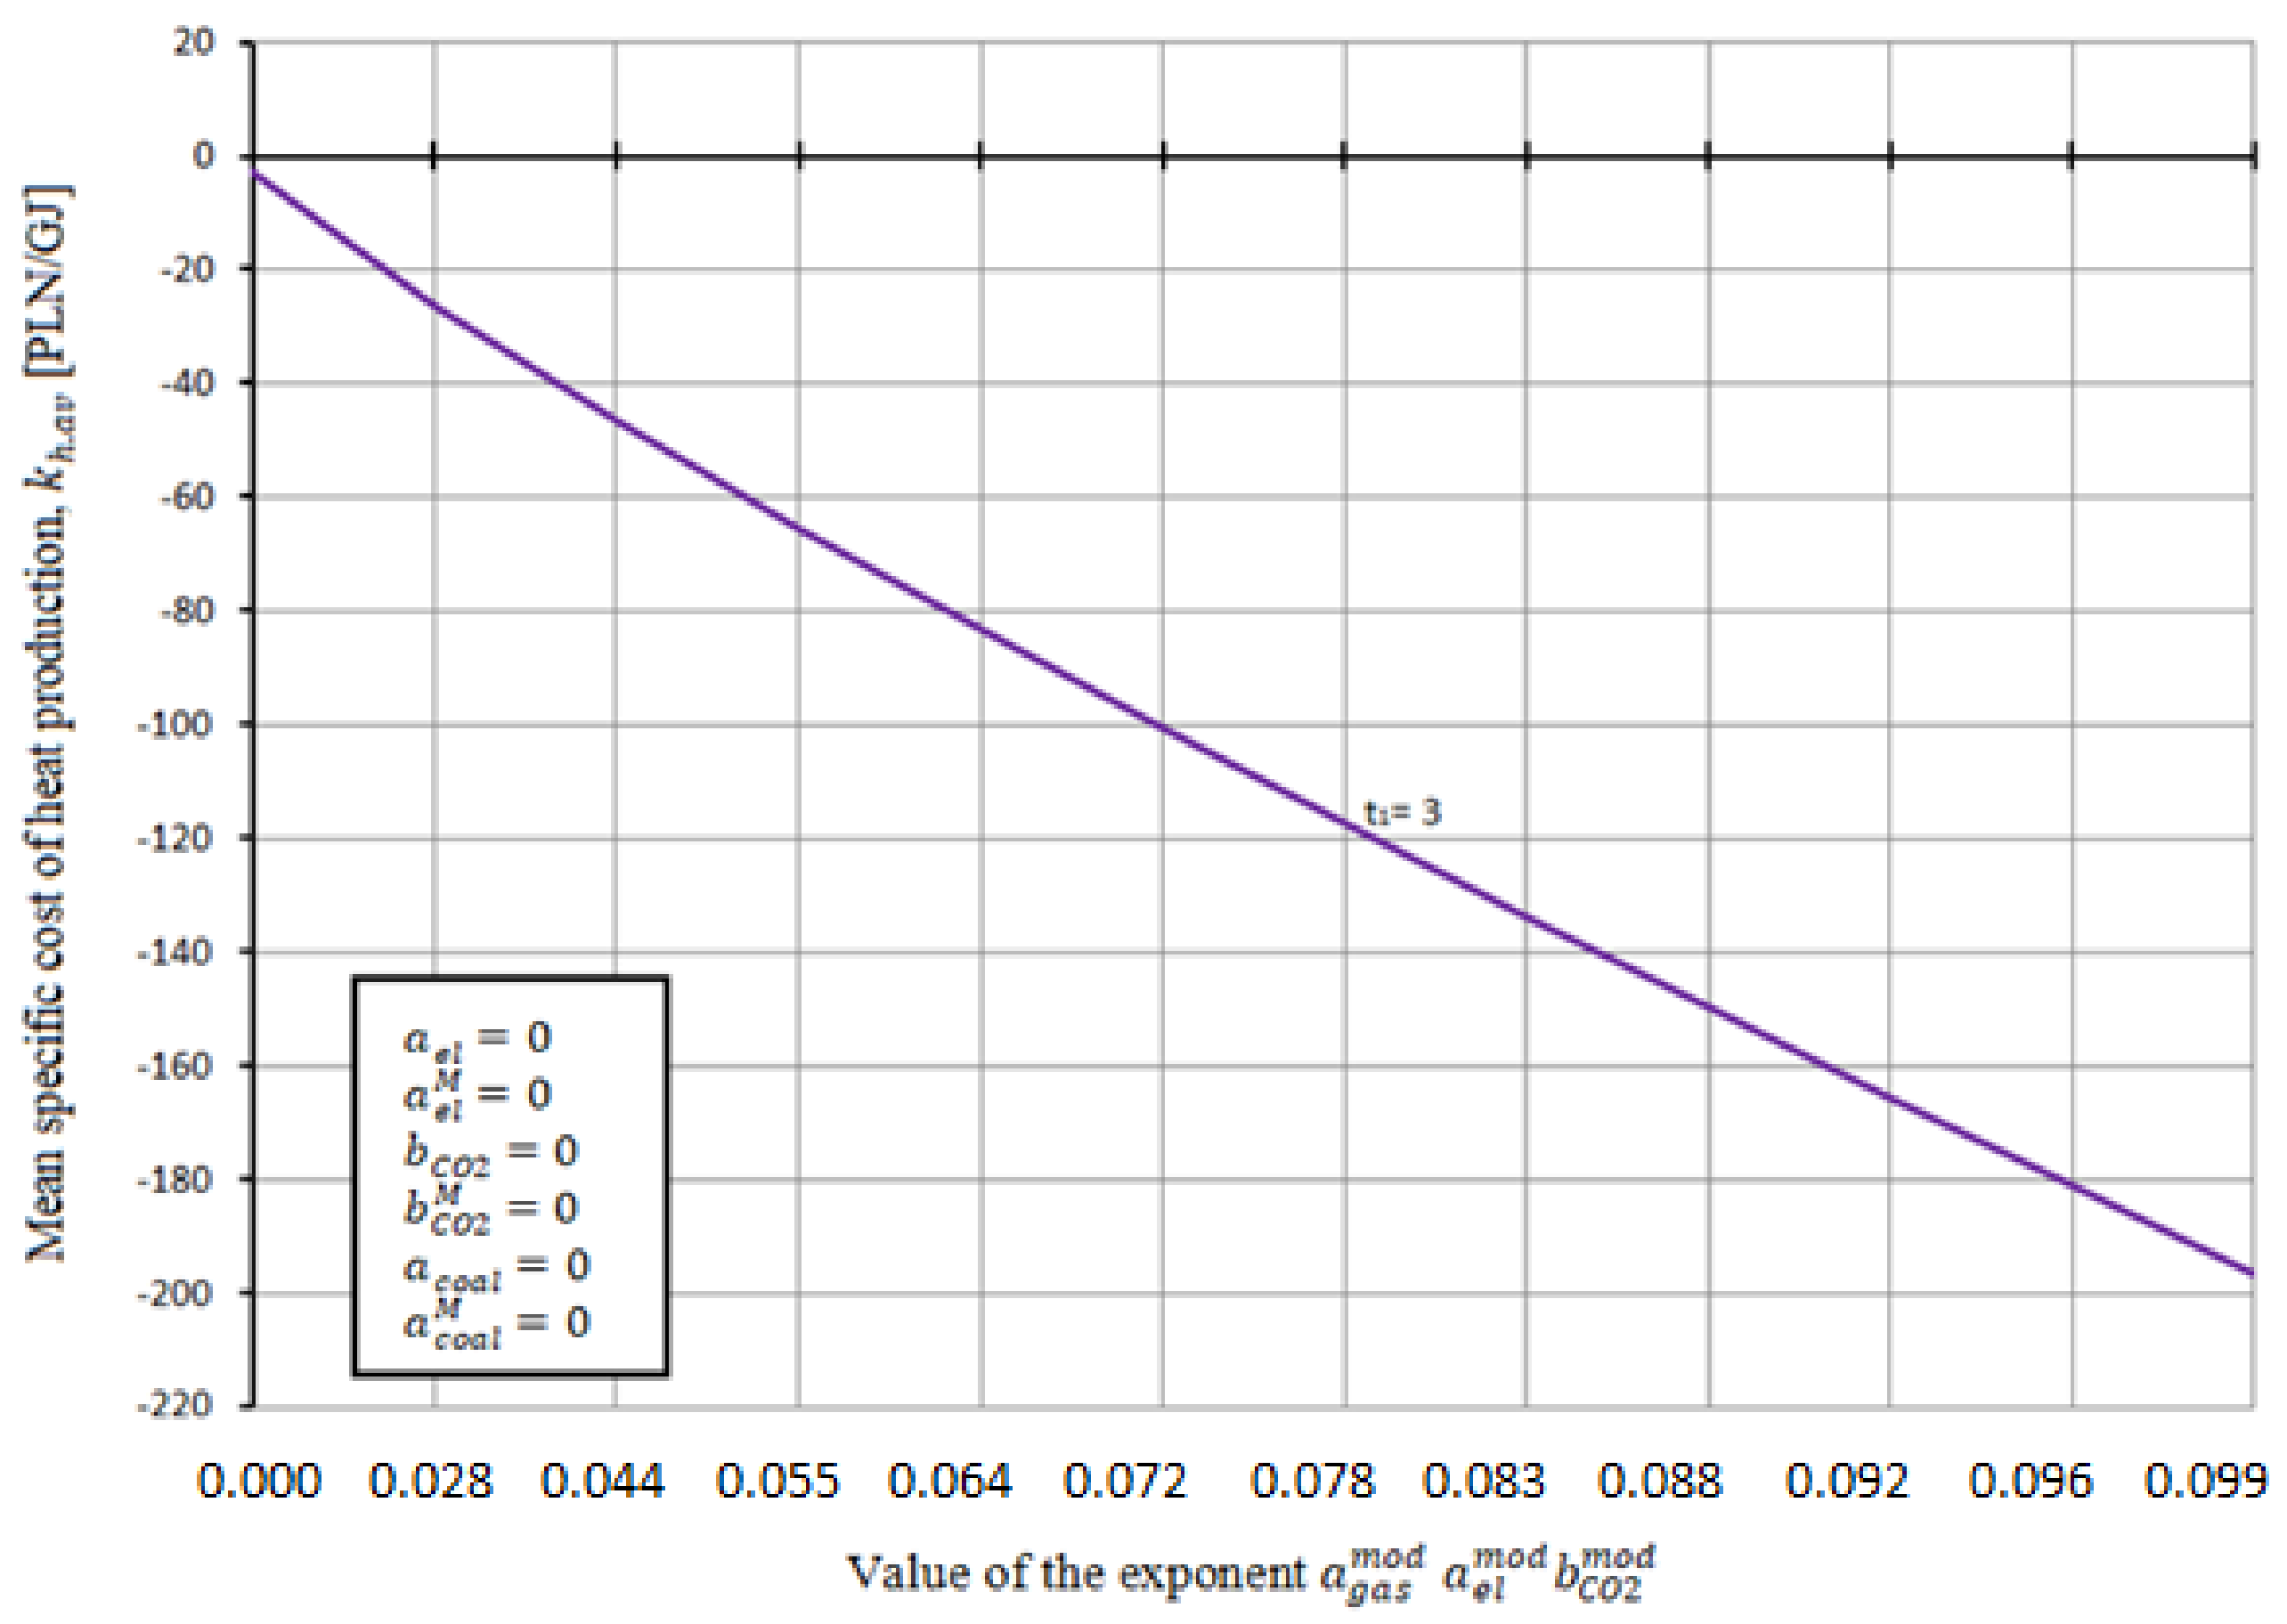
Figure 16.
Specific cost of heat generation in the heating plant repowered to a gas–steam CHP plant in the function of the of the exponent for t1 = 3.
Figure 16.
Specific cost of heat generation in the heating plant repowered to a gas–steam CHP plant in the function of the of the exponent for t1 = 3.
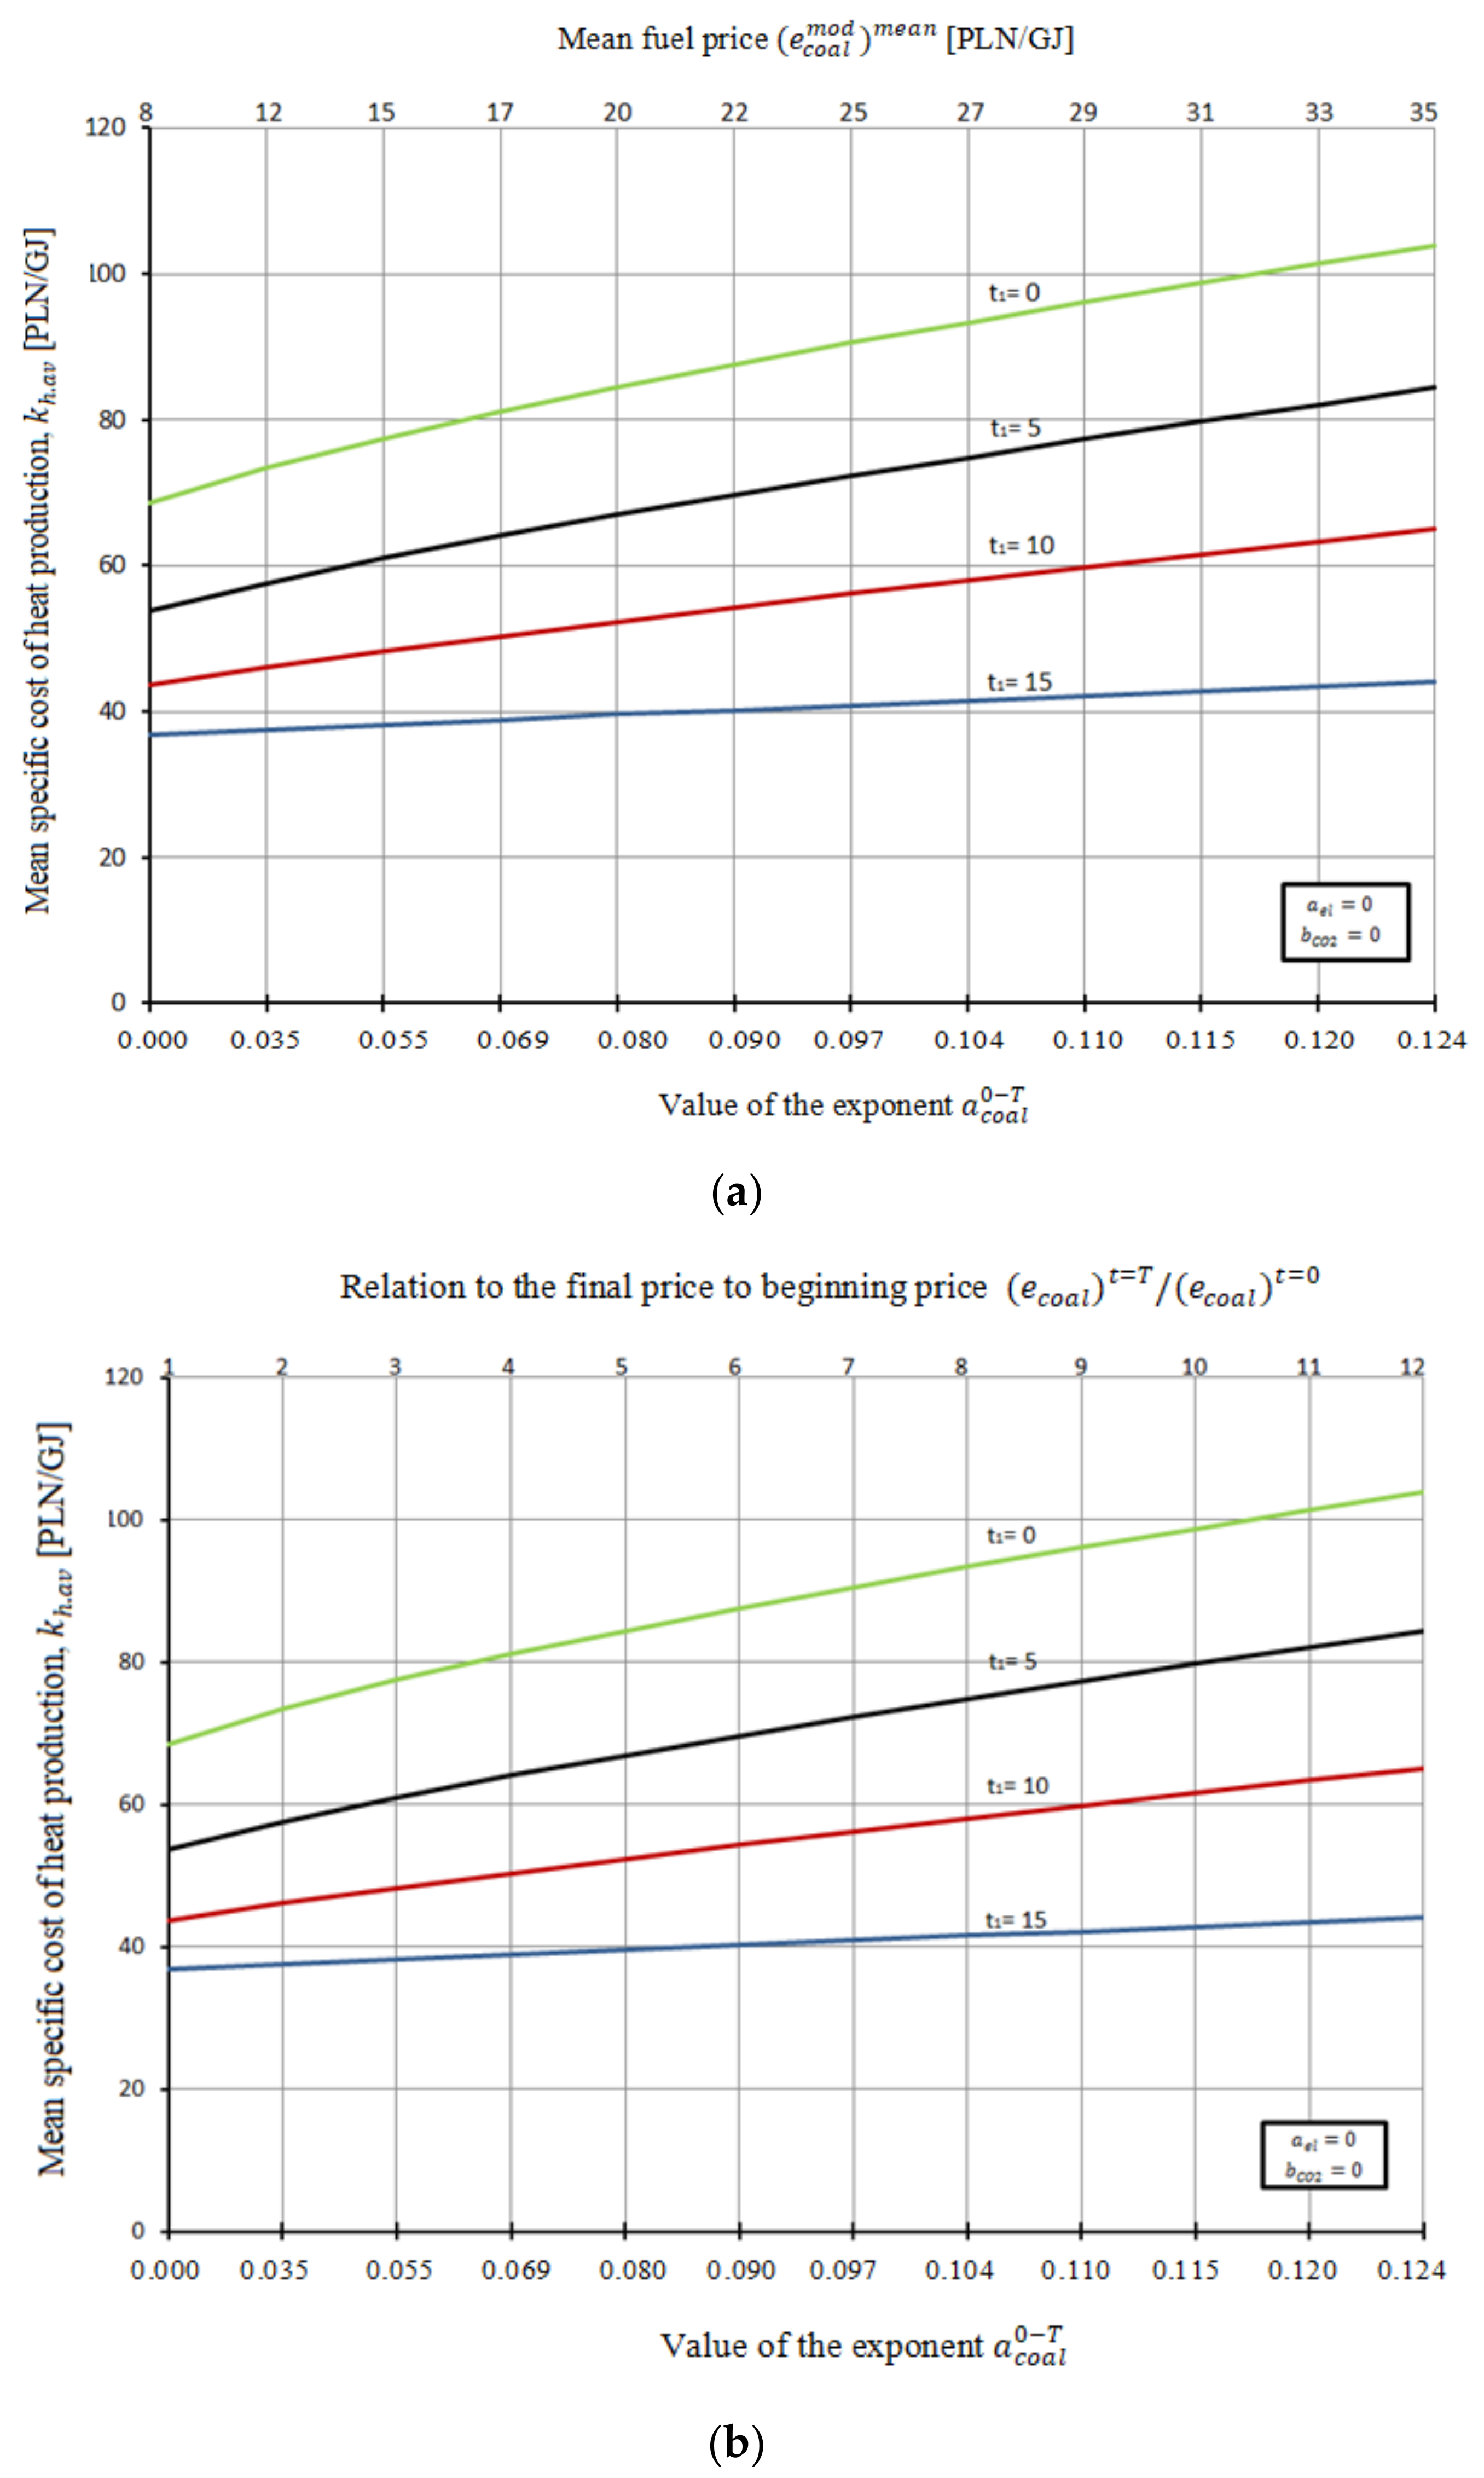
Figure 17.
(a) Specific cost of heat production in heating plant repowered to coal-fired CHP plant in the function of the mean fuel price as well as value of the exponent depending on the year t1, corresponding to the initiation of the modernization. (b) Specific cost of heat production in heating plant repowered to coal-fired CHP plant in the function of value of the exponent and price relations depending on the year t1, corresponding to the initiation of the modernization.
Figure 18.
Specific cost of heat production in heating plant repowered to coal-fired CHP plant in the function of the mean price as well as value of the exponent depending on the year t1, corresponding to the initiation of the modernization.
Figure 18.
Specific cost of heat production in heating plant repowered to coal-fired CHP plant in the function of the mean price as well as value of the exponent depending on the year t1, corresponding to the initiation of the modernization.
Figure 19.
Specific cost of heat production in heating plant repowered to coal-fired CHP plant in the function of the mean electricity price as well as value of the exponent depending on the year t1, corresponding to the initiation of the modernization.
Figure 19.
Specific cost of heat production in heating plant repowered to coal-fired CHP plant in the function of the mean electricity price as well as value of the exponent depending on the year t1, corresponding to the initiation of the modernization.
Figure 20.
Specific cost of heat production in a heating plant repowered to coal-fired CHP plant in the function of the value of the exponent depending on the year t1, corresponding to the initiation of the modernization.
Figure 20.
Specific cost of heat production in a heating plant repowered to coal-fired CHP plant in the function of the value of the exponent depending on the year t1, corresponding to the initiation of the modernization.
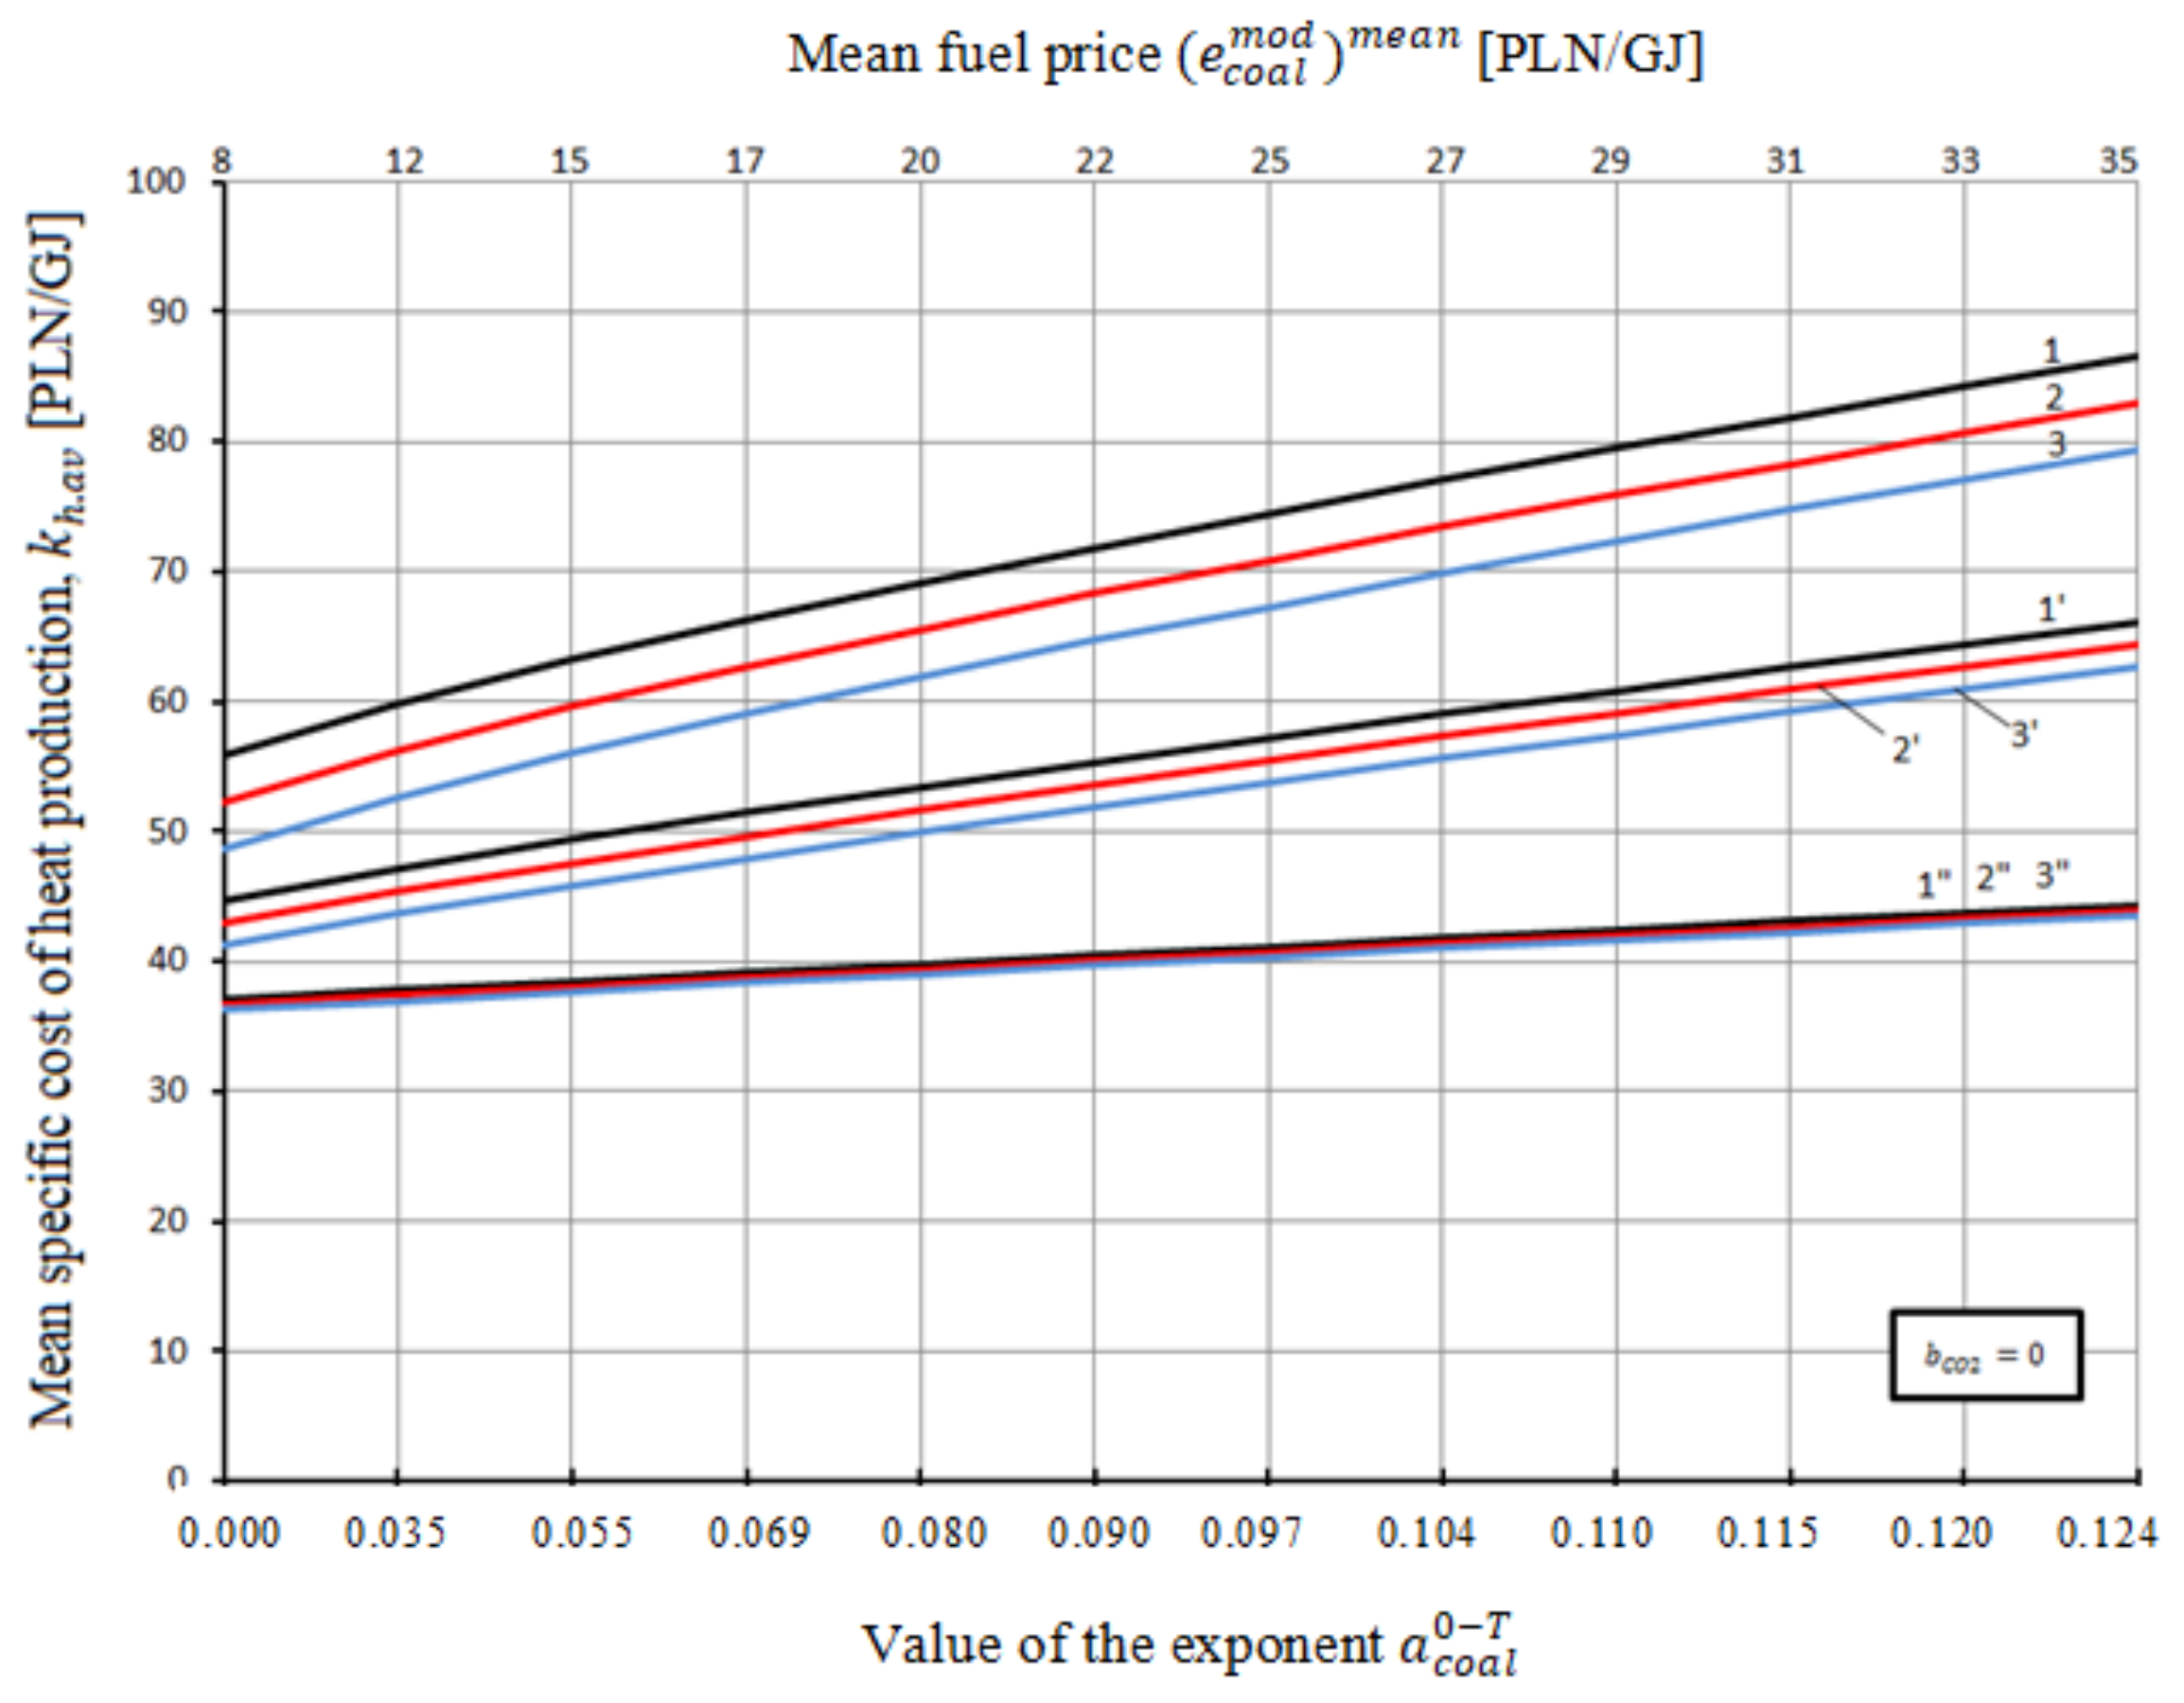
Figure 21.
Specific cost of heat production in the heating plant repowered to coal-fired CHP plant in the function of the mean fuel price and value of exponent depending on the year t1, corresponding to initiation of modernization, where: 1—applies to t1 = 5 years, = 30 PLN/Mgco2; 1′—applies to t1 = 10 years, = 30 PLN/Mgco2; 1″—applies to t1 = 15 years, = 30 PLN/Mgco2; 2—applies to t1 = 5 years, = 60 PLN/Mgco2; 2′—applies to t1 = 10 years, = 60 PLN/Mgco2; 2″—applies to t1 = 15 years, = 60 PLN/Mgco2; 3—applies to t1 = 5 years, = 90 PLN/Mgco2; 3′—applies to t1 = 10 years, = 90 PLN/Mgco2; 3″—applies to t1 = 15 years, = 90 PLN/Mgco2; 4—applies to t1 = 5 years, = 110 PLN/Mgco2; 4′—applies to t1 = 10 years, = 110 PLN/Mgco2; 4″—applies to t1 = 15 years, = 110 PLN/Mgco2.
![Energies 14 07426 g021]()
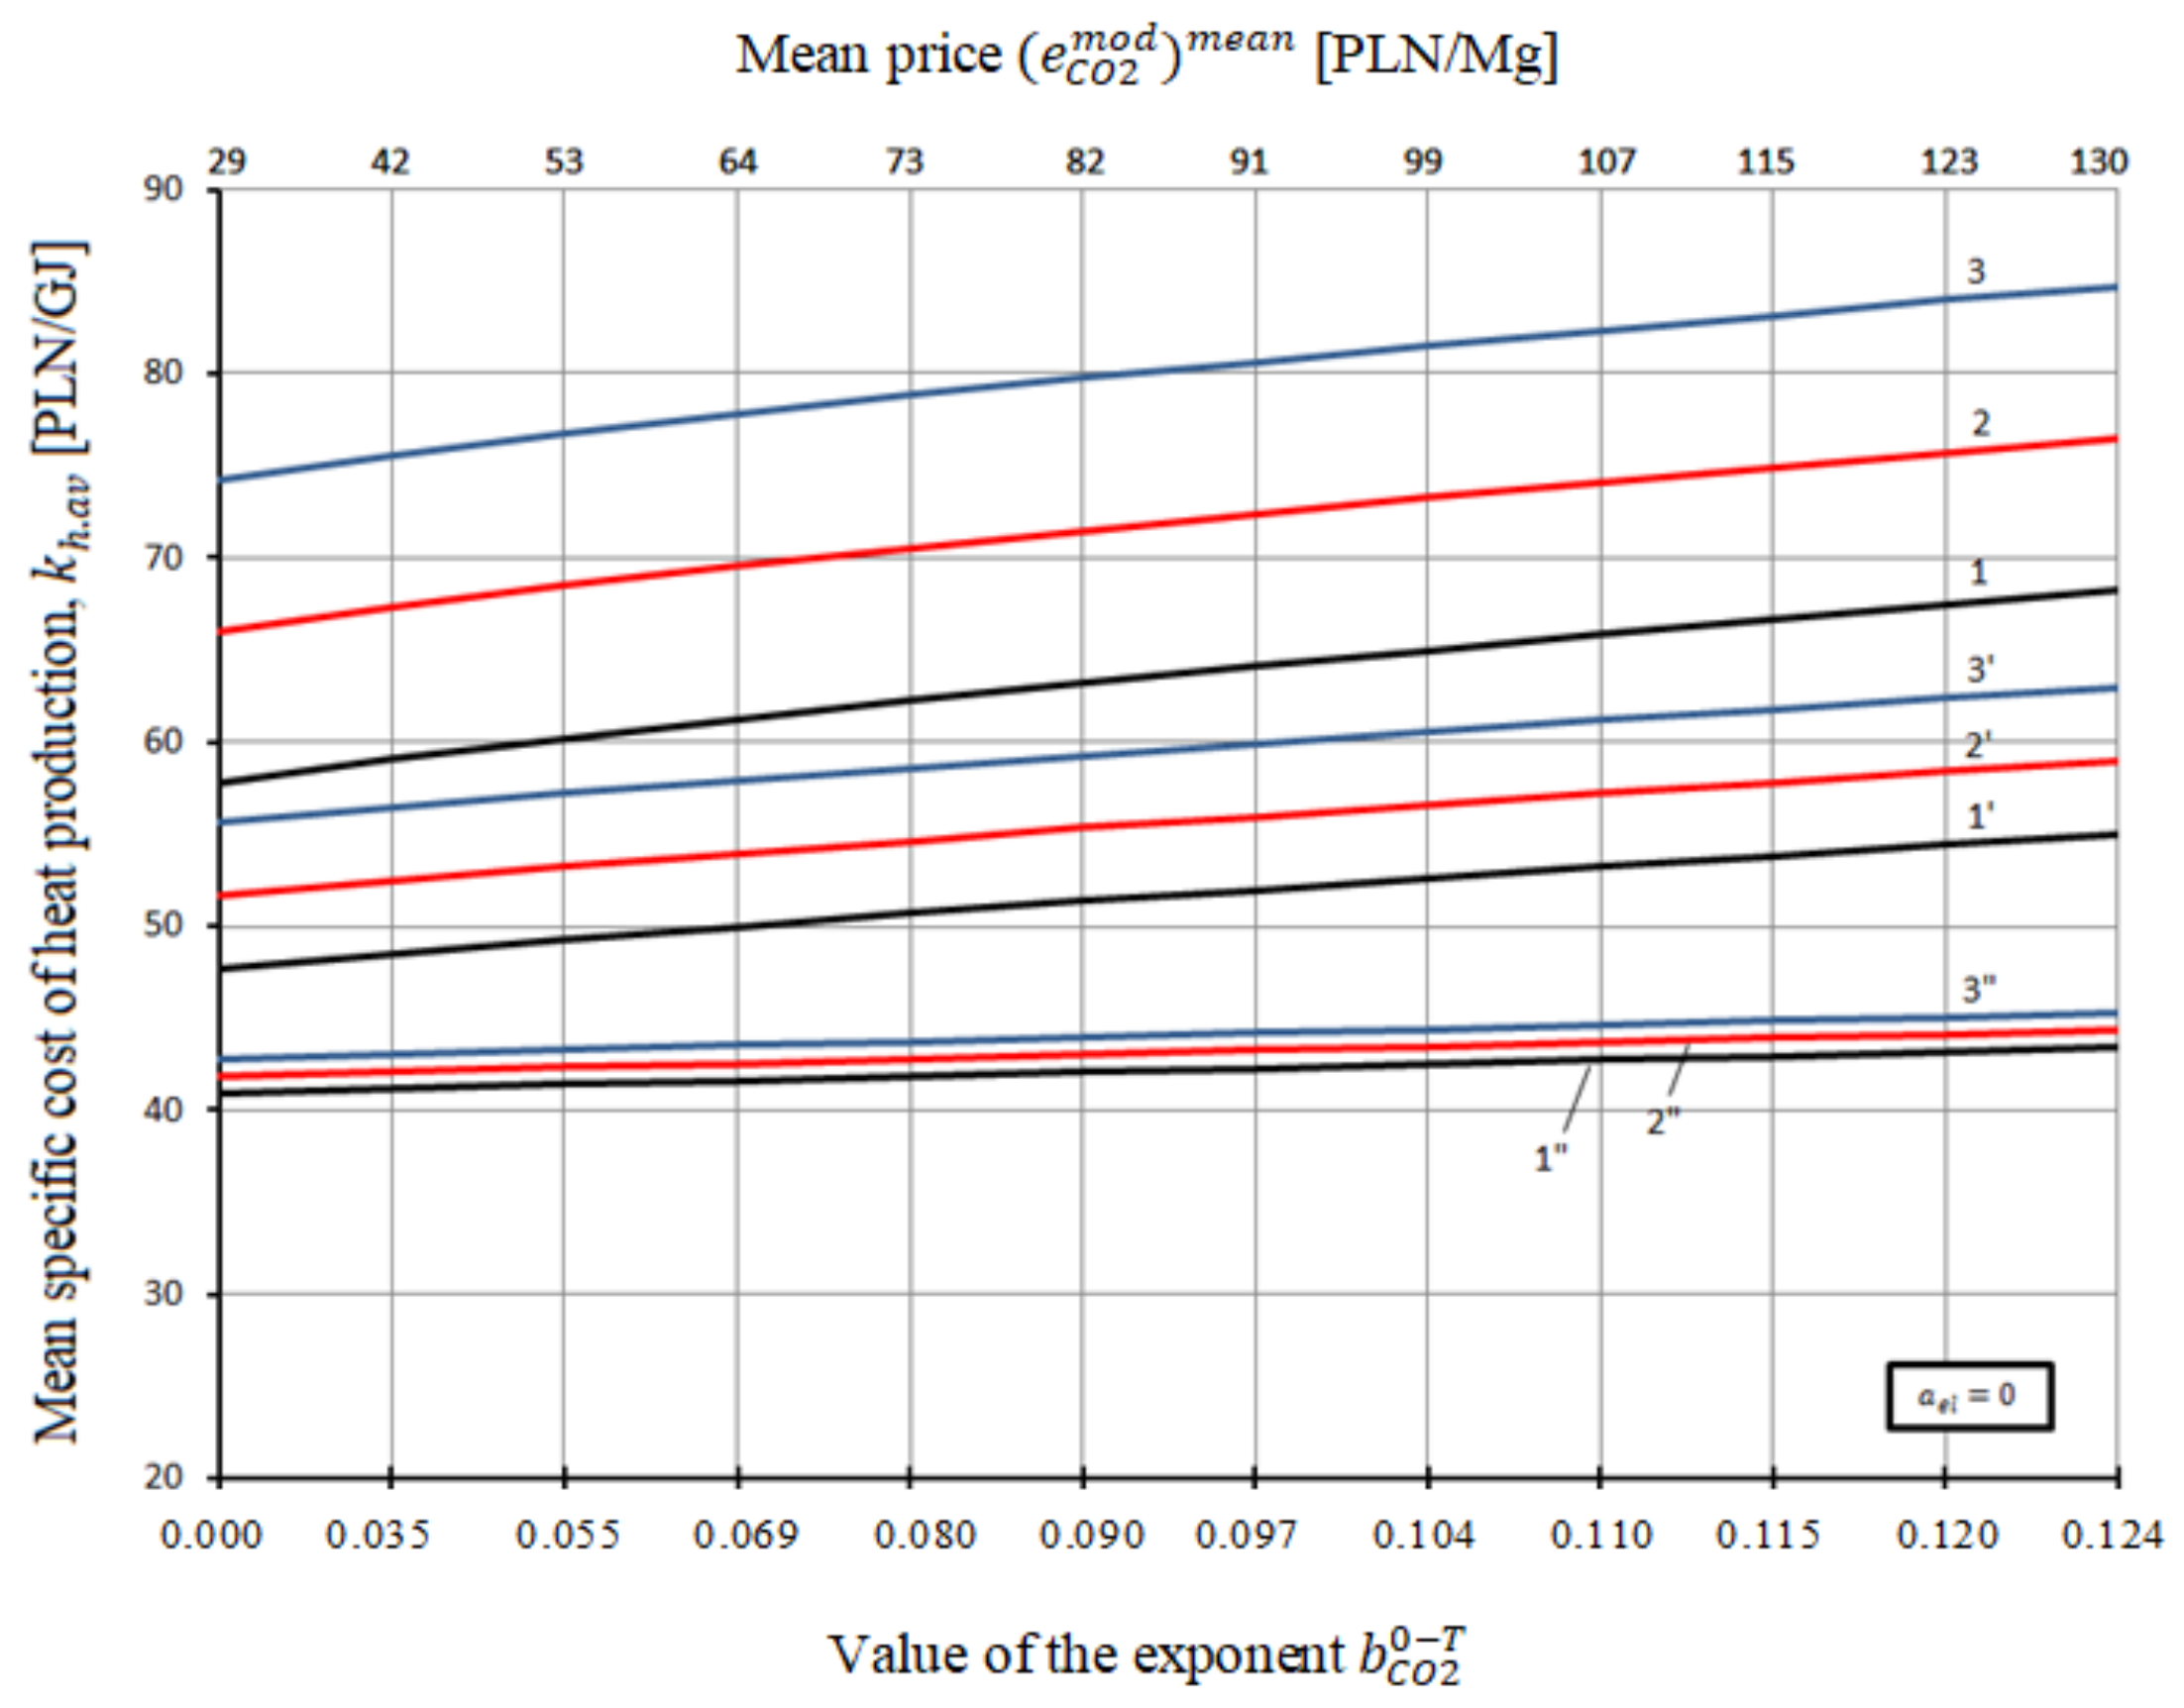
Figure 22.
Specific cost of heat production in the heating plant repowered to coal-fired CHP plant in the function of the mean fuel price and value of exponent depending on the year t1, corresponding to initiation of modernization, where: 1—applies to t1 = 5 years, = 150 PLN/MWh; 1′—applies to t1 = 10 years, = 150 PLN/MWh; 1″—applies to t1 = 15 years, = 150 PLN/MWh; 2—applies to t1 = 5 years, = 200 PLN/MWh; 2′—applies to t1 = 10 years, = 200 PLN/MWh; 2″—applies to t1 = 15 years, = 200 PLN/MWh; 3—applies to t1 = 5 years, = 250 PLN/MWh; 3′—applies to t1 = 10 years, = 250 PLN/MWh; 3″—applies to t1 = 15 years, = 250 PLN/MWh.
Figure 23.
Specific cost of heat production in the heating plant repowered to coal-fired CHP plant in the function of the mean price and value of exponent depending on the year t1, corresponding to initiation of modernization, where: 1—applies to t1 = 5 years, = 8 PLN/GJ; 1′—applies to t1 = 10 years, = 8 PLN/GJ; 1″—applies to t1 = 15 years, = 8 PLN/GJ; 2—applies to t1 = 5 years, = 16 PLN/GJ; 2′—applies to t1 = 10 years, = 16 PLN/GJ; 2″—applies to t1 = 15 years, = 16 PLN/GJ; 3—applies to t1 = 5 years, = 32 PLN/GJ; 2′—applies to t1 = 10 years, = 32 PLN/GJ; 2″—applies to t1 = 15 years, = 32 PLN/GJ.
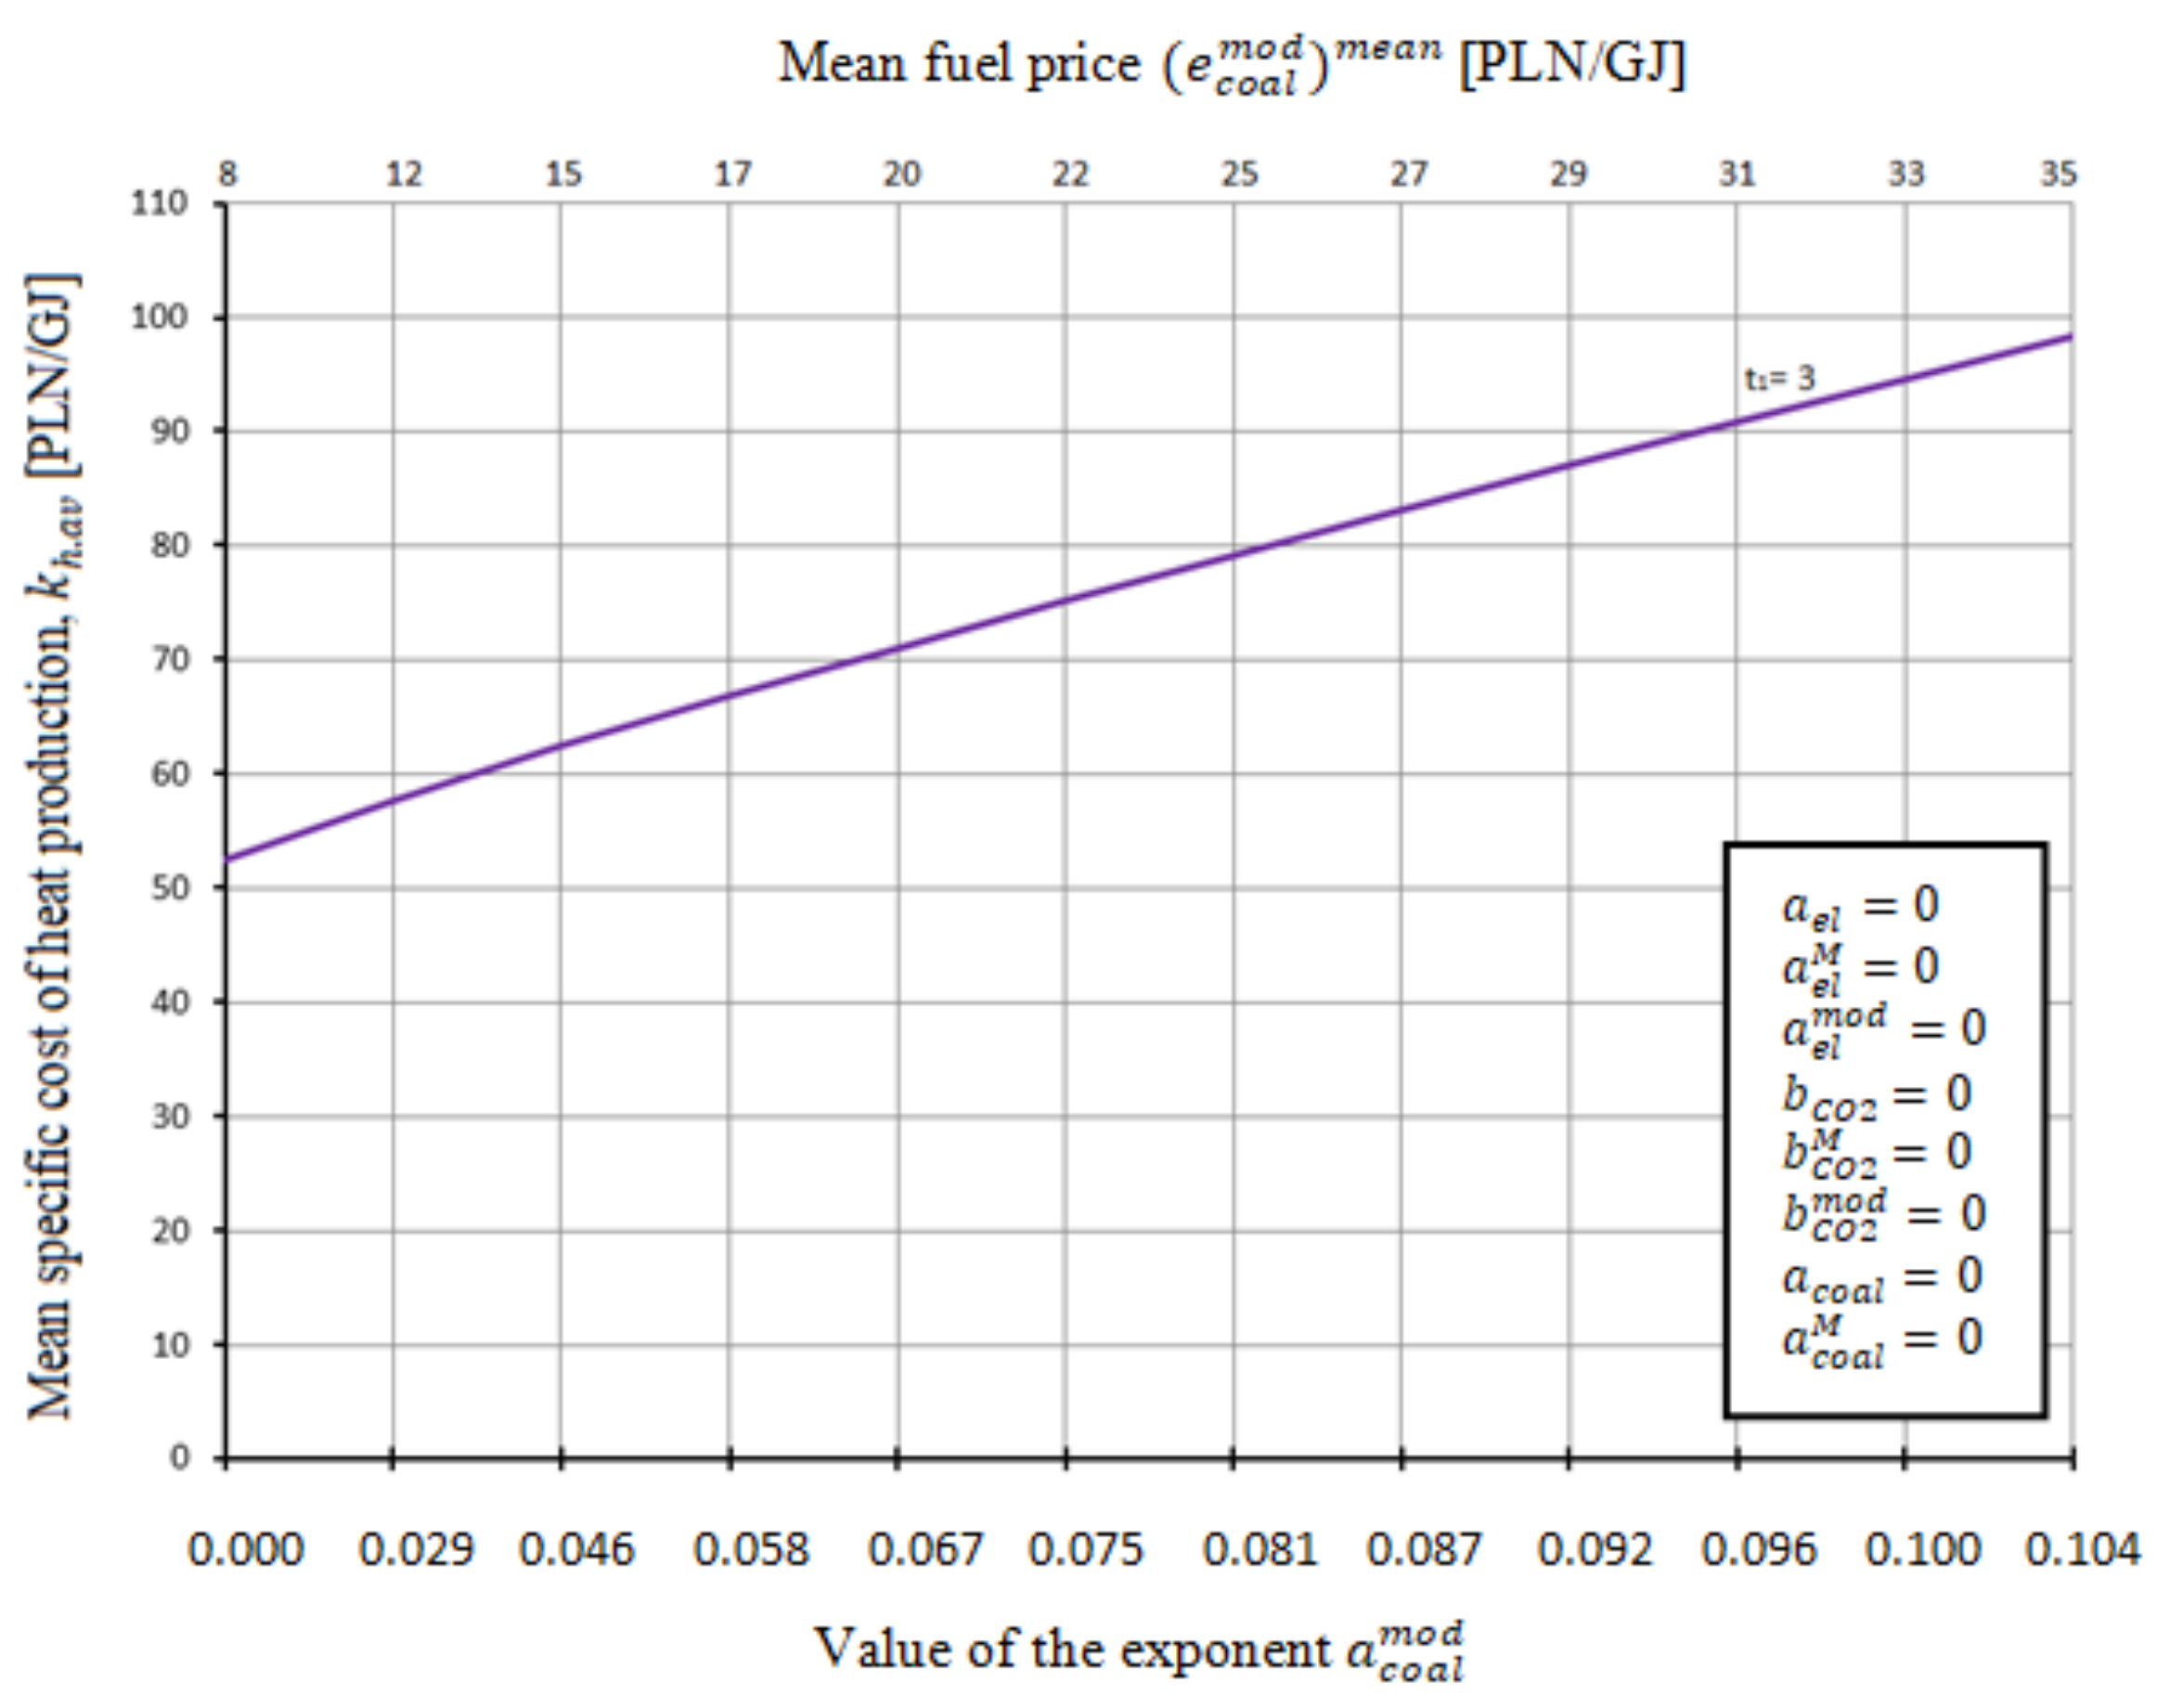
Figure 24.
Specific cost of heat generation in the heating plant repowered to coal-fired CHP plant in the function of the mean fuel price as well as value of the exponent for t1 = 0.
Figure 24.
Specific cost of heat generation in the heating plant repowered to coal-fired CHP plant in the function of the mean fuel price as well as value of the exponent for t1 = 0.
Figure 25.
Specific cost of heat generation in the heating plant repowered to a coal-fired CHP plant in the function of the mean fuel price as well as value of the exponent for t1 = 3.
Figure 25.
Specific cost of heat generation in the heating plant repowered to a coal-fired CHP plant in the function of the mean fuel price as well as value of the exponent for t1 = 3.
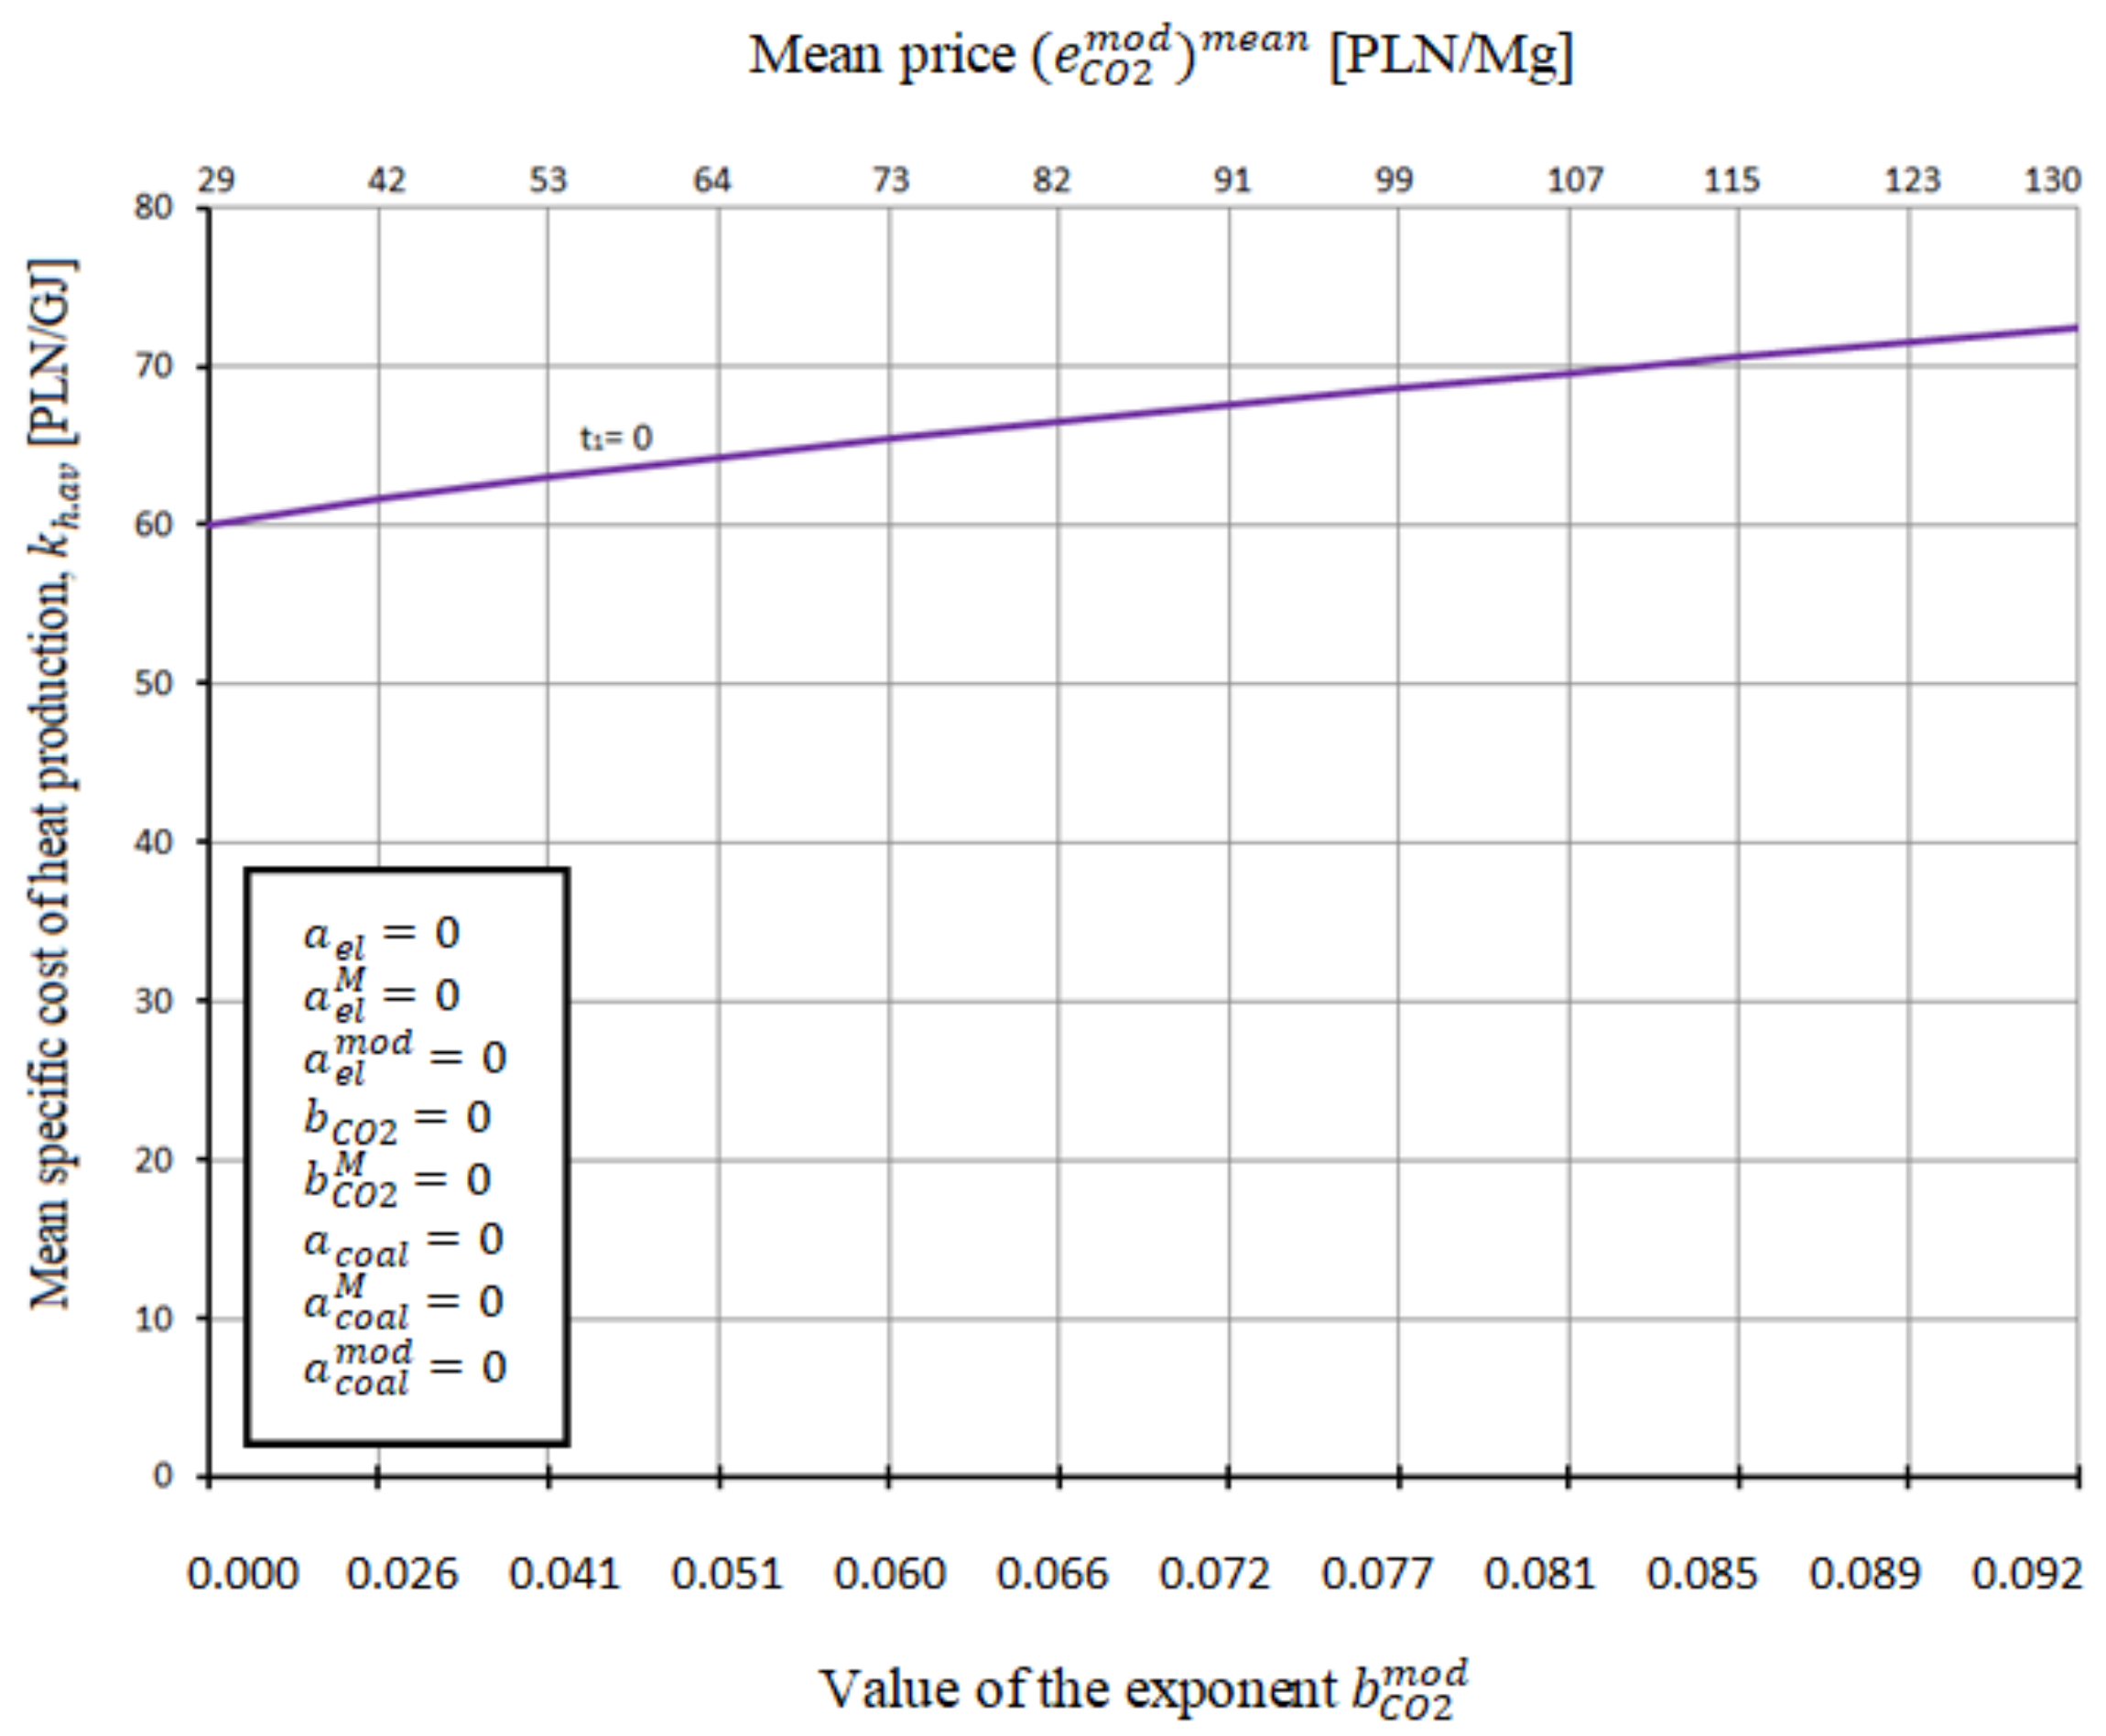
Figure 26.
Specific cost of heat generation in the heating plant repowered to coal-fired CHP plant in the function of the mean price as well as value of the exponent for t1 = 0.
Figure 26.
Specific cost of heat generation in the heating plant repowered to coal-fired CHP plant in the function of the mean price as well as value of the exponent for t1 = 0.
Figure 27.
Specific cost of heat generation in the heating plant repowered to coal-fired CHP plant in the function of the mean price as well as value of the exponent for t1 = 3.
Figure 27.
Specific cost of heat generation in the heating plant repowered to coal-fired CHP plant in the function of the mean price as well as value of the exponent for t1 = 3.
Figure 28.
Specific cost of heat generation in the heating plant repowered to a coal-fired CHP plant in the function of the mean price as well as value of the exponent for t1 = 0.
Figure 28.
Specific cost of heat generation in the heating plant repowered to a coal-fired CHP plant in the function of the mean price as well as value of the exponent for t1 = 0.
Figure 29.
Specific cost of heat generation in the heating plant repowered to coal-fired CHP plant in the function of the mean price as well as value of the exponent for t1 = 3.
Figure 29.
Specific cost of heat generation in the heating plant repowered to coal-fired CHP plant in the function of the mean price as well as value of the exponent for t1 = 3.
Figure 30.
Specific cost of heat generation in the heating plant repowered to coal-fired CHP plant in the function of the of the exponent for t1 = 0.
Figure 30.
Specific cost of heat generation in the heating plant repowered to coal-fired CHP plant in the function of the of the exponent for t1 = 0.
Figure 31.
Specific cost of heat generation in the heating plant repowered to coal-fired CHP plant in the function of the of the exponent for t1 = 3.
Figure 31.
Specific cost of heat generation in the heating plant repowered to coal-fired CHP plant in the function of the of the exponent for t1 = 3.


