Abstract
The combined mine backfill–geothermal (CMBG) system can be used to effectively extract geothermal energy by installing a heat exchange tube (HET) in the underground backfilled stopes of mines, which can be used as the heat supply for buildings in mines and the surrounding areas. The efficient performance of this system strongly depends on the thermal exchange process between the HET and its surrounding cemented paste backfill body (CPB). In this study, a validated simulation model is established to investigate the heat exchange performance of CPB, in which the nonuniformly distributed thermal properties in CPB are fully considered. The results indicate that the increase in the porosity has a negative effect on the heat exchange performance of CPB. With the increase in the porosity, the decreased rate of the conductive heat transfer in CPB could be up to approximately 18%. In conditions with seepage flow, the heat transfer capacity of CPB could be effectively improved. Generally, a higher hydraulic conductivity corresponds to a higher heat transfer performance of CPB. When the seepage velocity rose from 2 × 10⁻⁶ to 6 × 10⁻⁶ m/s, the thermal conductivity of CPB achieved a 114% increase from 1.843 to 3.957 W/(m·K). Furthermore, it was found that the thermal energy accumulates along the seepage flow direction, enhancing the thermal influencing radius of the HET in this direction. Thus, the arrangement of HETs should fully take into account the seepage flow effect. This proposed simulation model could provide a reference for parameter determination and optimization of CMBG systems.
1. Introduction
In recent years, the large consumption of conventional fossil energy has resulted in serious environmental problems [1]. It is urgent to utilize renewable energy to implement a low-carbon strategy. At present, geothermal energy utilization has been one of the most widely used renewable energy technologies [2]. It has been proved that abundant geothermal energy exists in China, approximately equivalent to 9.5 × 10⁹ tons of standard coal, and the amount of geothermal energy used in building areas for cooling and heating has reached 5 × 10⁸ m2 [3].
In addition, it has been found that the total energy consumption of buildings accounts for one-third of the total energy consumption [4], while approximately 50% of the building energy consumption is attributed to heating, ventilating, and air conditioning (HVAC) systems [5]. As an environmentally friendly technology extracting geothermal energy, the ground source heat pump (GSHP) system has been widely applied around the world. It extracts geothermal energy to satisfy the heat requirement of buildings and has a positive effect on the replacement of fossil fuel consumption [6,7,8]. There are also many mines in China, which contain considerable geothermal energy. The thermal energy exploitation of the mines could provide an alternative heat source for the heat demand of buildings in mining areas, such as hot water supply or heating in winter, effectively reducing the fossil fuel cost and carbon emission.
As early as the 1980s, the idea of utilizing mine geothermal energy had been put forward [9]. Concerning the relatively high temperature in deep mines, they have been regarded as good geothermal reservoirs [10]. There are many studies that utilize the geothermal energy from abandoned mines around the world [11,12,13,14,15]. Owing to the higher temperature of deep underground mines, the thermal energy contained in the surrounding rocks can be absorbed by HET [16]. In Heerlen, the Netherlands, heating from abandoned mine water provides heat for residential and commercial spaces and community buildings. The heating energy for hot water supply from the geothermal energy of a coal mine could reach 690 kW [17]. In China, Tangkou Coal Mine in Jining uses the recovered mine drainage to heat the mines and surrounding houses [18]. Mine galleries have been adopted for the preheating or precooling of relatively large buildings [12]. The utilization of the geothermal resources in deep mines could offset certain economic costs and supply green heat energy to communities distributed in and around the mine area, including commercial buildings and community buildings nearby, which is a rehabilitative way that effectively reduces the damage to the environment and promotes resource recycling [19].
In order to extract the geothermal energy contained in deep mines in an economic and water-protective way, the concept of the CMBG system was proposed by Liu et al. [20], which is based on the application of backfilling technology in mines [21]. Due to the large mined-out areas, after the ore is exploited, the closed-loop HET could be arranged in the backfill stopes to extract the geothermal energy [22,23]. Before backfilling, the HETs are installed in the mined-out area in advance, and then the backfilling slurry is poured into this area. Finally, the HETs are embedded in the solidified filling slurry (CPB). The thermal energy contained in the mine rock could be indirectly or directly absorbed by the heat medium (typically water) flowing in the HETs and finally supplied to the heat users.
For CMBG systems, one of the priority issues needed to be solved is the heat transfer performance of CPB. Many previous studies have analyzed the effects of different factors on the strength of CPB, such as the porosity [24,25], environment humidity [26], water saturation [27], cement/sand ratio [28,29], mixing grade of cement [30], and quantities of the polymer and fiber [31]. Meanwhile, all these above factors have certain influences on the thermal performance of CPB. For the heat transfer process in the CMBG system, one of the most important influence factors is thermal conductivity, which is also the key parameter in the engineering design of the CMBG system. Kavanaugh [32] found that the thermal conductivity had significant effects on the length deviation of the underground HET. When the deviation of the thermal conductivity of underground rock-soil was around 4.5–5.8%, the length deviation of the underground buried pipe would reach 10%. Abbasy evaluated the effects of design parameters, including the porosity, saturation, sample size, binder content, and pulp density, on the thermal conductivity of CPB [33]. The results indicate that in comparison with the steady-state test, the unsteady testing has a better performance in retaining the moisture content in the sample and outputs more accurate results. Célestin [34] experimentally studied the thermal conductivity of CPB and found that the components of CPB (such as the tailing type and grain diameter) have a very significant influence on its thermal conductivity. The higher content of quartz in the tailings, or the larger diameter of the components, always produces a higher thermal conductivity.
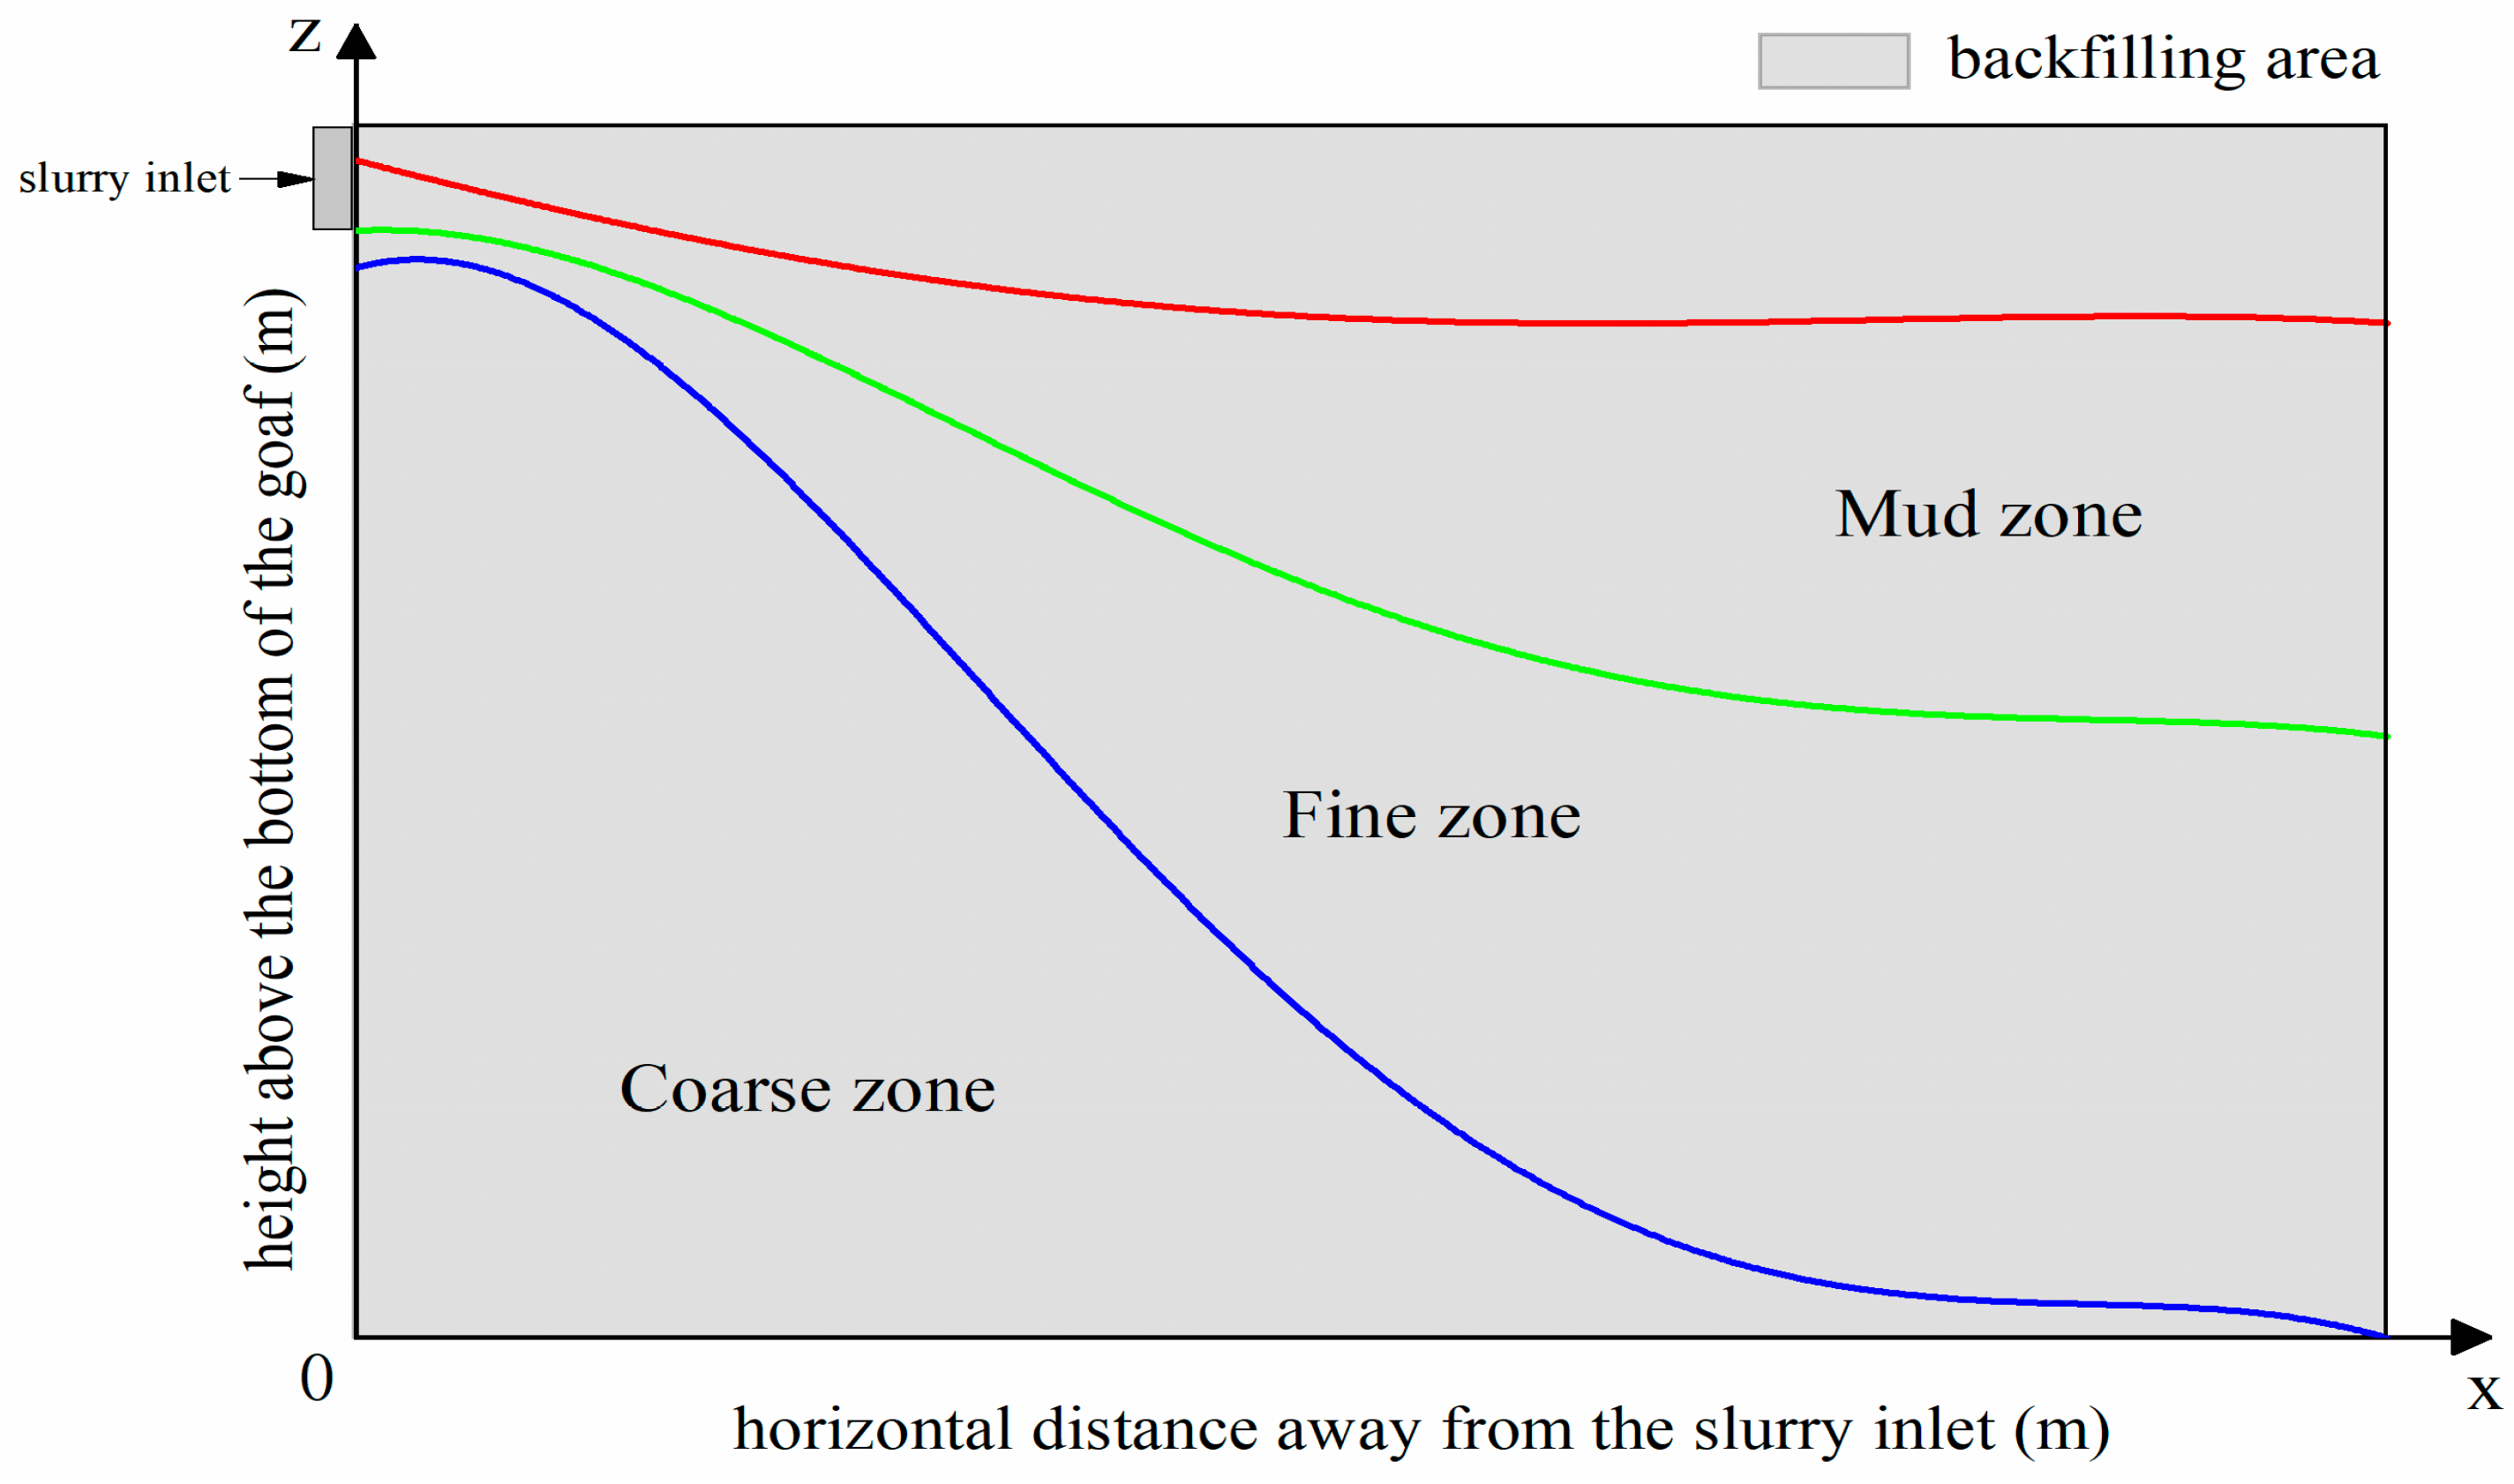
However, the previous studies have not fully considered the sedimentary characteristic of the slurry in backfilling process, which also has an important influence on the thermal conductivity of CPB. Due to the gravity effect in the actual situation, particles with different diameters have different movement trajectories when the filling slurry flows in the goaf, which finally leads to a nonuniform component distribution in CPB. Generally, along the horizontal flow direction, the particle size is related to the distance from the slurry inlet. As the distance increases, the percentage of the coarse particles in CPB decreases while that of the fine particles increases. It has been proven that the sedimentation of CPB slurry presents a normal distribution [35]. For an infinite horizontal plane, the cemented filling slurry gradually diffuses along the plane after discharging from the outlet and forms a cone shape. The flow region of CPB slurry can be divided into three zones in terms of particle size. The boundary curves of each zone are all normally distributed [36], as shown in Figure 1. This is mainly attributed to the different sedimentation characteristics of different particles. For a heat exchange material, the thermal conductivity is inevitably affected by the distribution of its components. Lee [37] developed a 3D numerical model to investigate the effect of material components on the heat exchange performance in a GSHP system. The results suggest that with the same complex thermophysical properties, there exists an obvious difference in long-term heat transfer performance between the uniformly distributed soil and the two-layer nonhomogeneous soil. Florides et al. [38] simulated the heat transfer performance of buried pipes installed in a multilayer environment, which consisted of four different soil layers with different thermophysical properties. The results show that under different arrangements of soil layers, the outlet water temperatures are obviously different. The above two studies indicate that the heterogeneity of the ground layer has a significant influence on the heat transfer performance of buried pipes. In the aforementioned studies related to the thermal conductivity of CPB, the filling slurry was filled into a volume cylindrical vessel. In such a limited space, the nonuniform distribution of thermophysical properties of CPB could not be fully exhibited; thus, the corresponding thermal conductivity was significantly different from the actual situation. Therefore, the stratified distribution of CPB components should be fully considered when examining the heat exchange performance of CPB in the CMBG system.
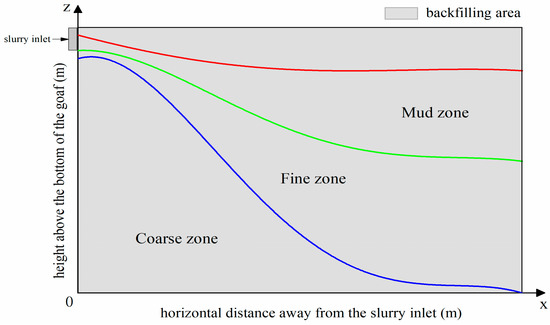
Figure 1.
The three areas and dividing lines of CPB.
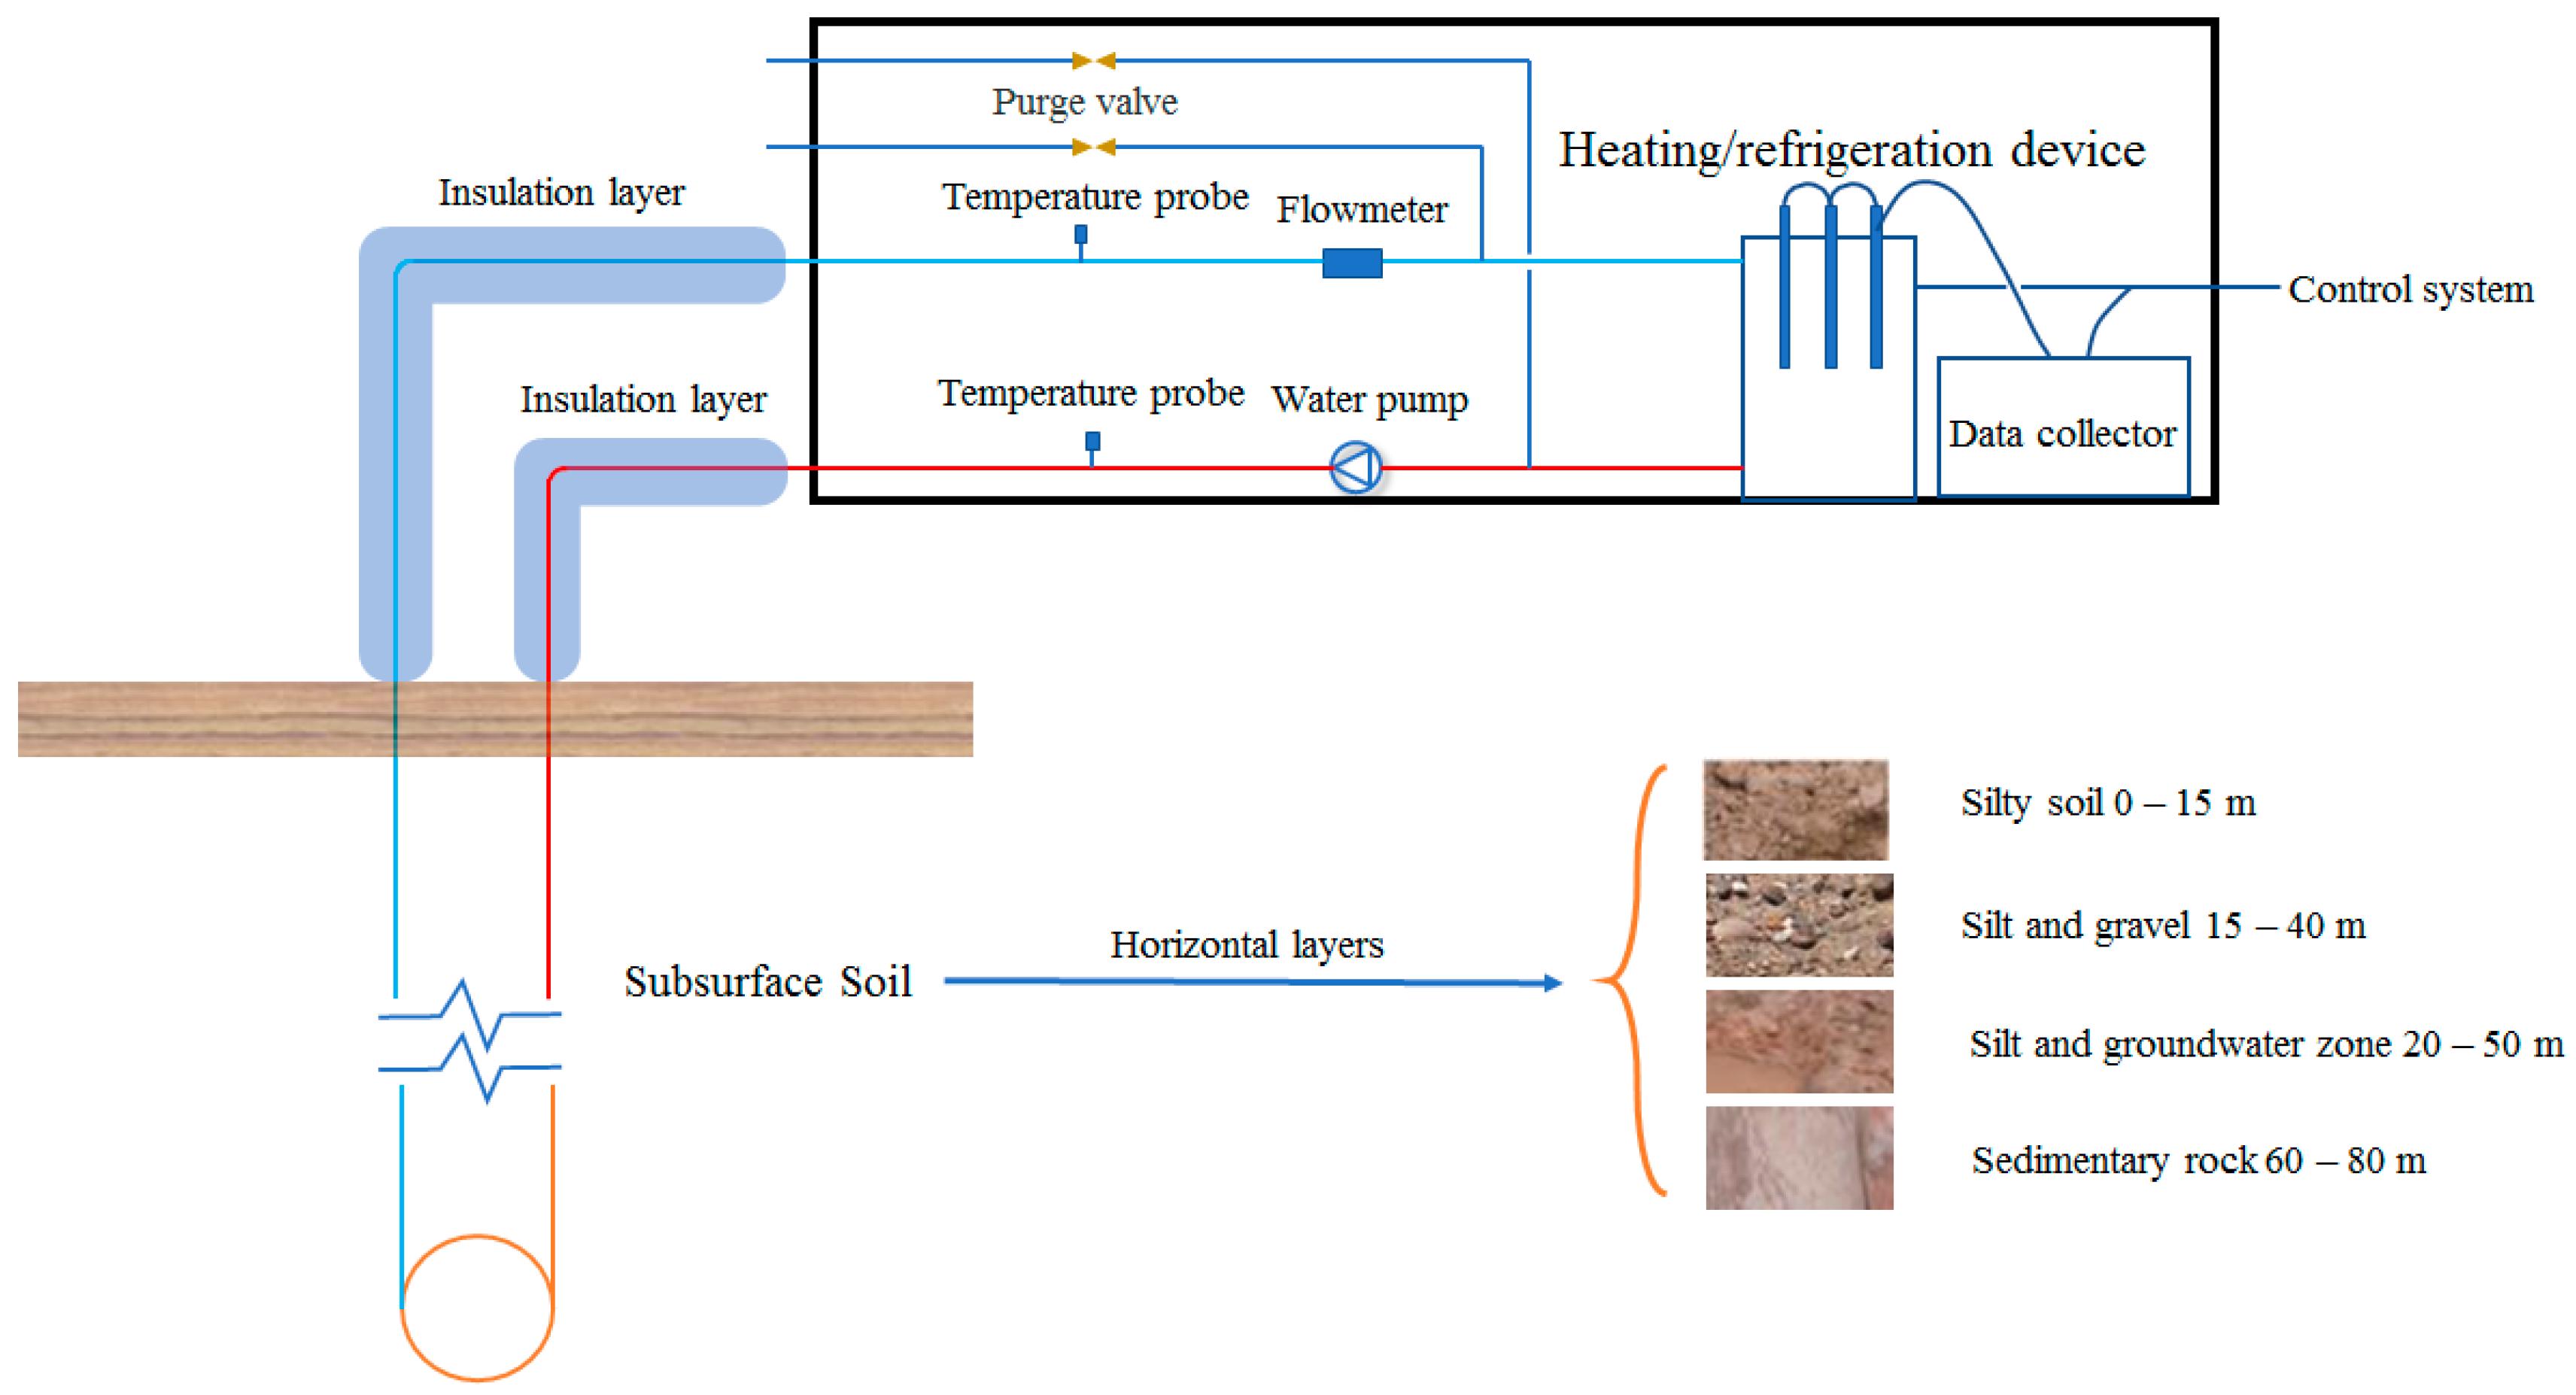
In order to test the thermal conductivity of CPB with nonuniformly distributed thermophysical properties, the sample should be large enough. Generally, one of the appropriate approaches is the thermal response test (TRT) [39], which is usually adopted to test the thermophysical properties and heat transfer of rocks and soils, as shown in Figure 2. The principle of this method is that the heated fluid (typically water) circulates in the HET and transfers heat energy to the surrounding soil, and the linear heat source or the cylindrical heat source theory is used to analyze the response parameters (generally the average fluid temperature in the HET). Finally, the soil thermal properties can be calculated in reverse. The theory simplifies the heat transfer inside and outside the tube as a pure heat conduction process, which is a mature technology in GSHP systems. Since it is difficult to accurately examine the values of thermal parameters of CPB via in situ testing, a numerical simulation model that fully takes account of the sedimentary characteristics of CPB slurry is proposed in this study, which is based on the thermal response theory.
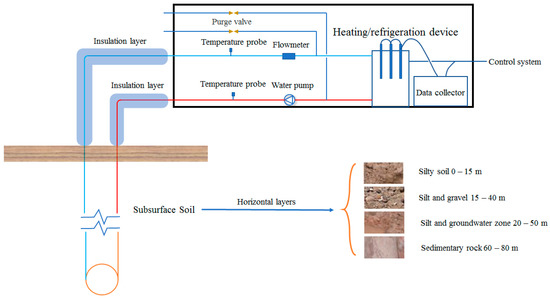
Figure 2.
Schematic of the thermal response test.
In this paper, a validated CFD simulation model is established to evaluate the thermal performance of CPB, in which the sedimentary characteristic of CPB slurry has been fully considered. After this introduction, Section 2 describes the establishment of the numerical model. In Section 3, the validation of the proposed numerical model is discussed. In Section 4, the performance of heat exchange between HET and its surrounding CPB is evaluated under different boundary conditions. Finally, the main conclusions are summarized in Section 5. The results of this study could be useful in the prediction of design parameters of the CMBG system, as well as providing a method of evaluating and optimizing the heat exchange performance of this system.
2. Numerical Modeling
2.1. Heat Transfer Equation
In this study, the heat transfer mechanisms in the CMBG system mainly involve two processes: (1) the heat conduction inside the solid material (CPB) and (2) the heat convection between the circulating fluid and the pipe walls. The governing equations describing these two processes can be expressed by Equations (1) and (2), respectively, as follows:
where ρ, T, λ, and c are the density (kg·m−3), temperature (K), thermal conductivity (W·m−1·K−1), and specific thermal capacity (J·kg−1·K−1), respectively; Q indicates the general heat source (W·m−3); the subscripts s and f represent the solid material (CPB) and fluid in the tubes; and Qwall is the equivalent heat source item (W·m−3), which results from the heat exchange between the fluid in the HET and its surrounding CPB.
2.2. Geometric Model and Mesh
The software ICEM was used for geometric mode establishment and mesh generation in this study. The research of Chen [36] indicated the interface positions of the particle stratification in solidified CPB. Therefore, the boundary conditions of the simulation model in our work were determined in accordance with Chen’s experiment, aiming to evaluate the thermal performance of CPB.
By adopting the three dividing curves for stratified CPB from Chen’s study, a three-dimensional model was established, wherein the stope size is 60 m × 12 m × 30 m, the same as Chen’s model [36]. Particularly, according to the sedimentary characteristic, the real height of CPB is 25.6 m after sedimentation. Since the filling slurry on the Y–Z plane is normally distributed, the top of the backfill body presents a curved surface. The HET is a closed circulating system to transfer heat energy with CPB. The dimensions of the HET are shown in Table 1.

Table 1.
Parameters of the HET.
In addition, the TRT in this study is the heating condition, which means the fluid is firstly heated in a water tank at constant power and then releases heat energy to the surrounding CPB. In order to accelerate the calculation, the heating water tank is represented by a U-bend pipe with 0.6 m length and constant heating power, as shown in Figure 3, which makes the whole HET become a circulating loop.
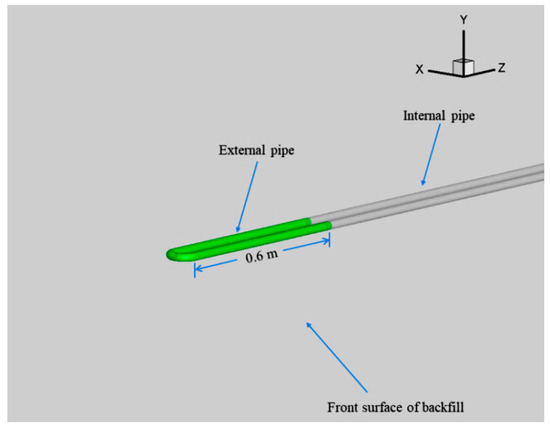
Figure 3.
The external U-bend pipe.
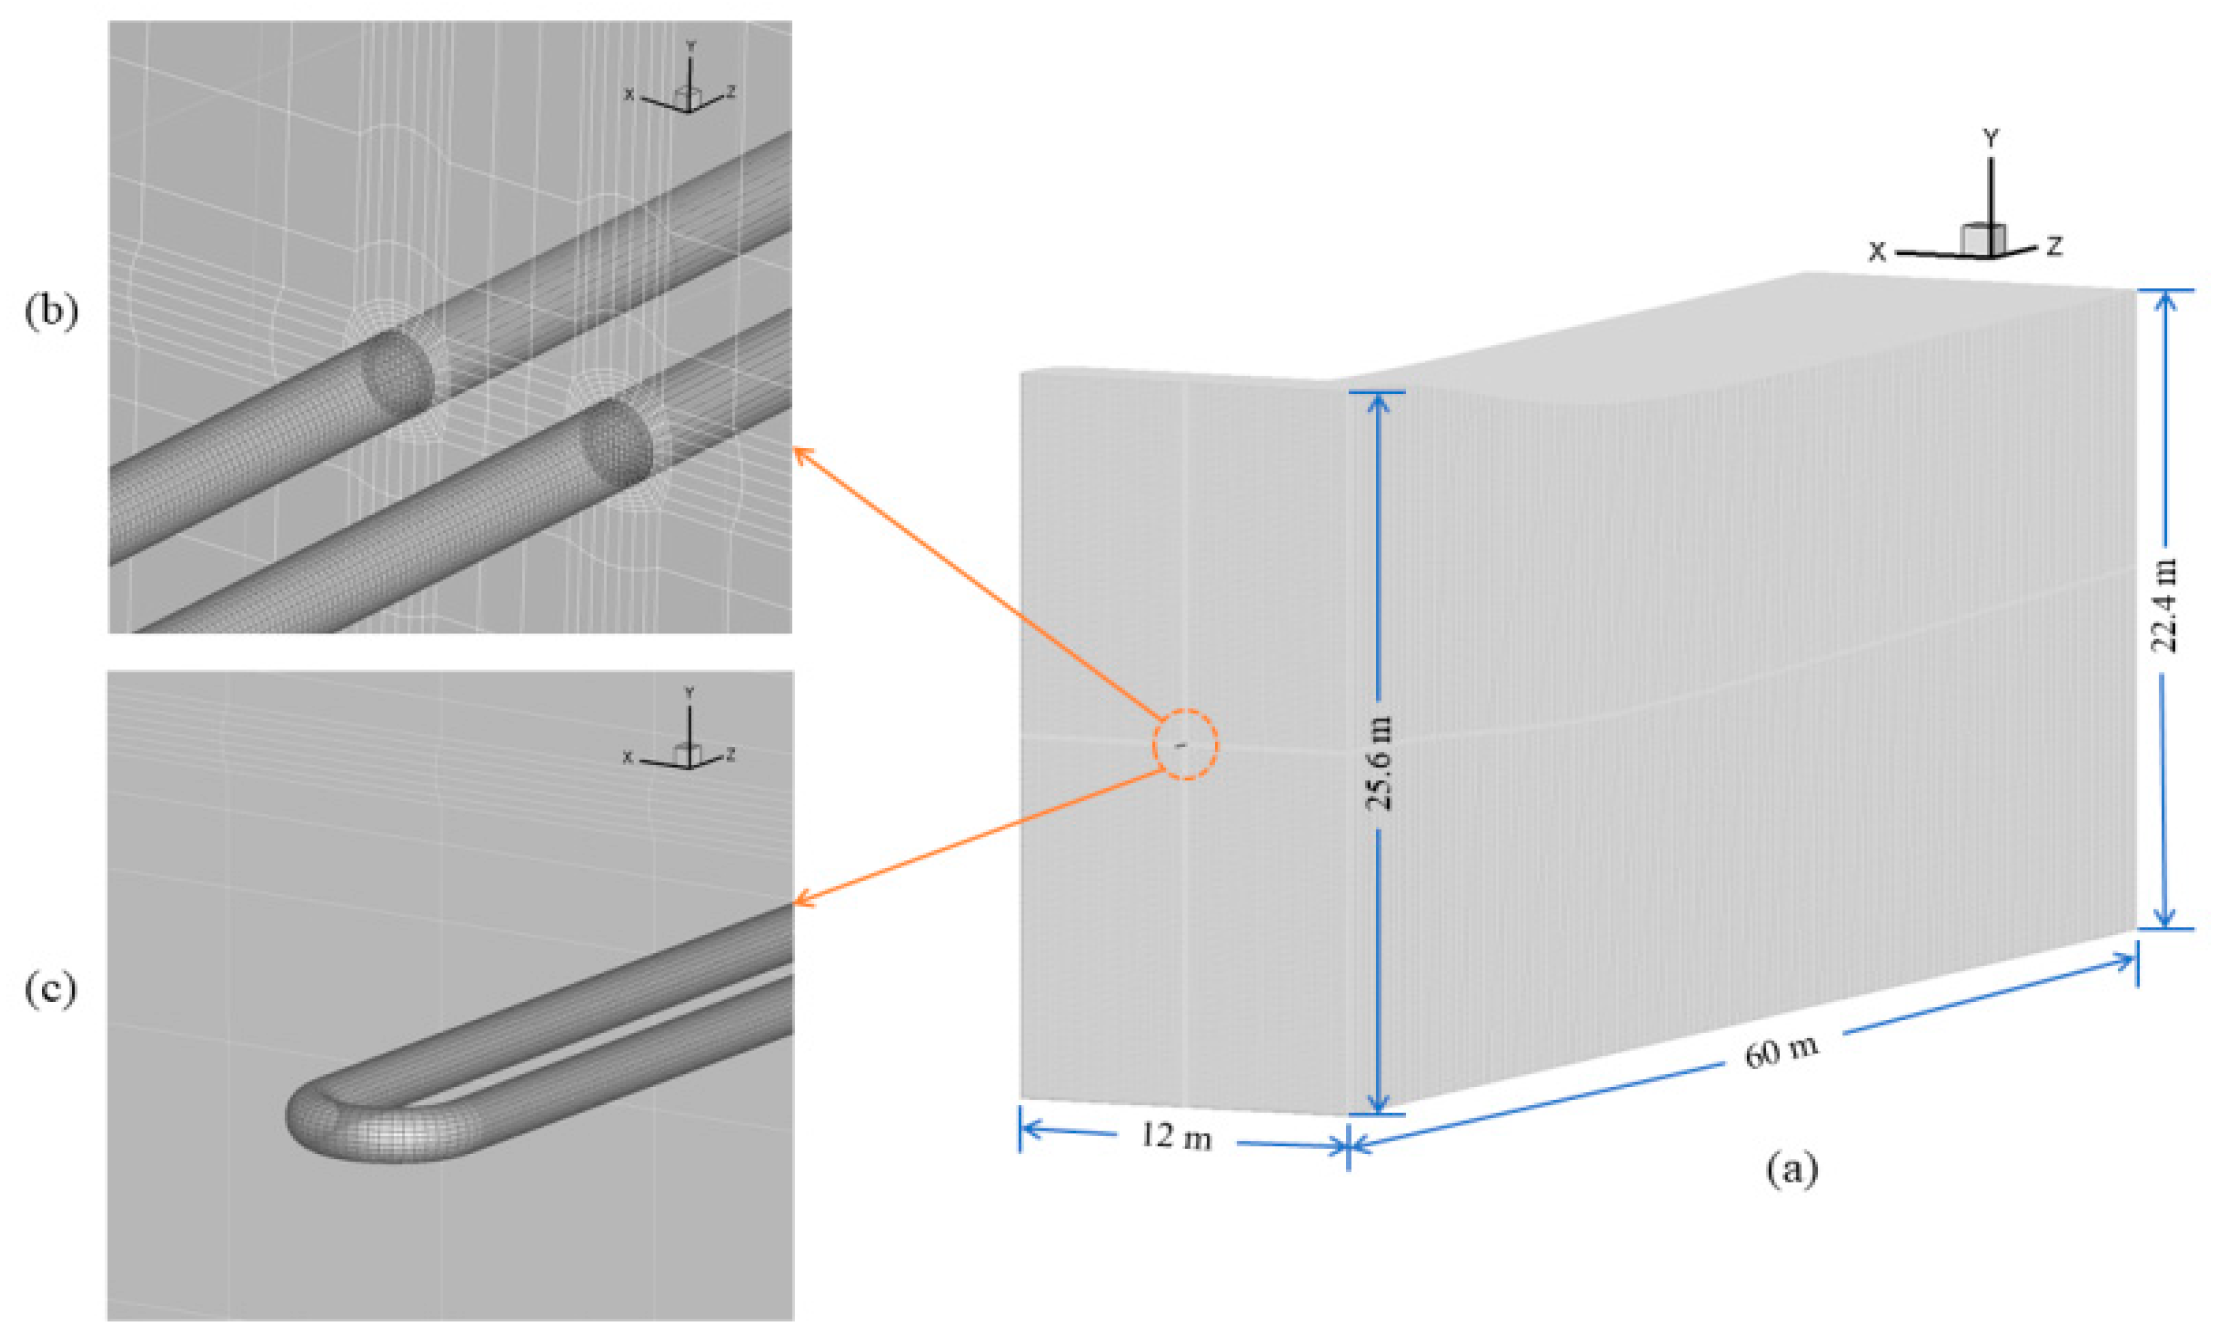
Since the structured grid can save computer resources and improve the accuracy of numerical simulation results effectively, it was used in this study. During the heat transfer process, the temperature varies greatly along the radial direction; thus, the grid should be intensive around the pipe in this direction. Lastly, the flow field varies sharply to form vortices because the curvature of the bend of the pipe is larger, which means that the intensive mesh is also required to avoid the inclination angle of the grid. The final mesh results are shown in Figure 4a–c. The total number of elements is more than 3.19 million.

Figure 4.
Mesh diagram of the simulation model. (a) Mesh of the whole zone; (b) mesh of the boundary layer of inside and outside of U-shaped tube; (c) mesh of the bend area.
2.3. Boundary Conditions and Thermophysical Property Settings of the Model
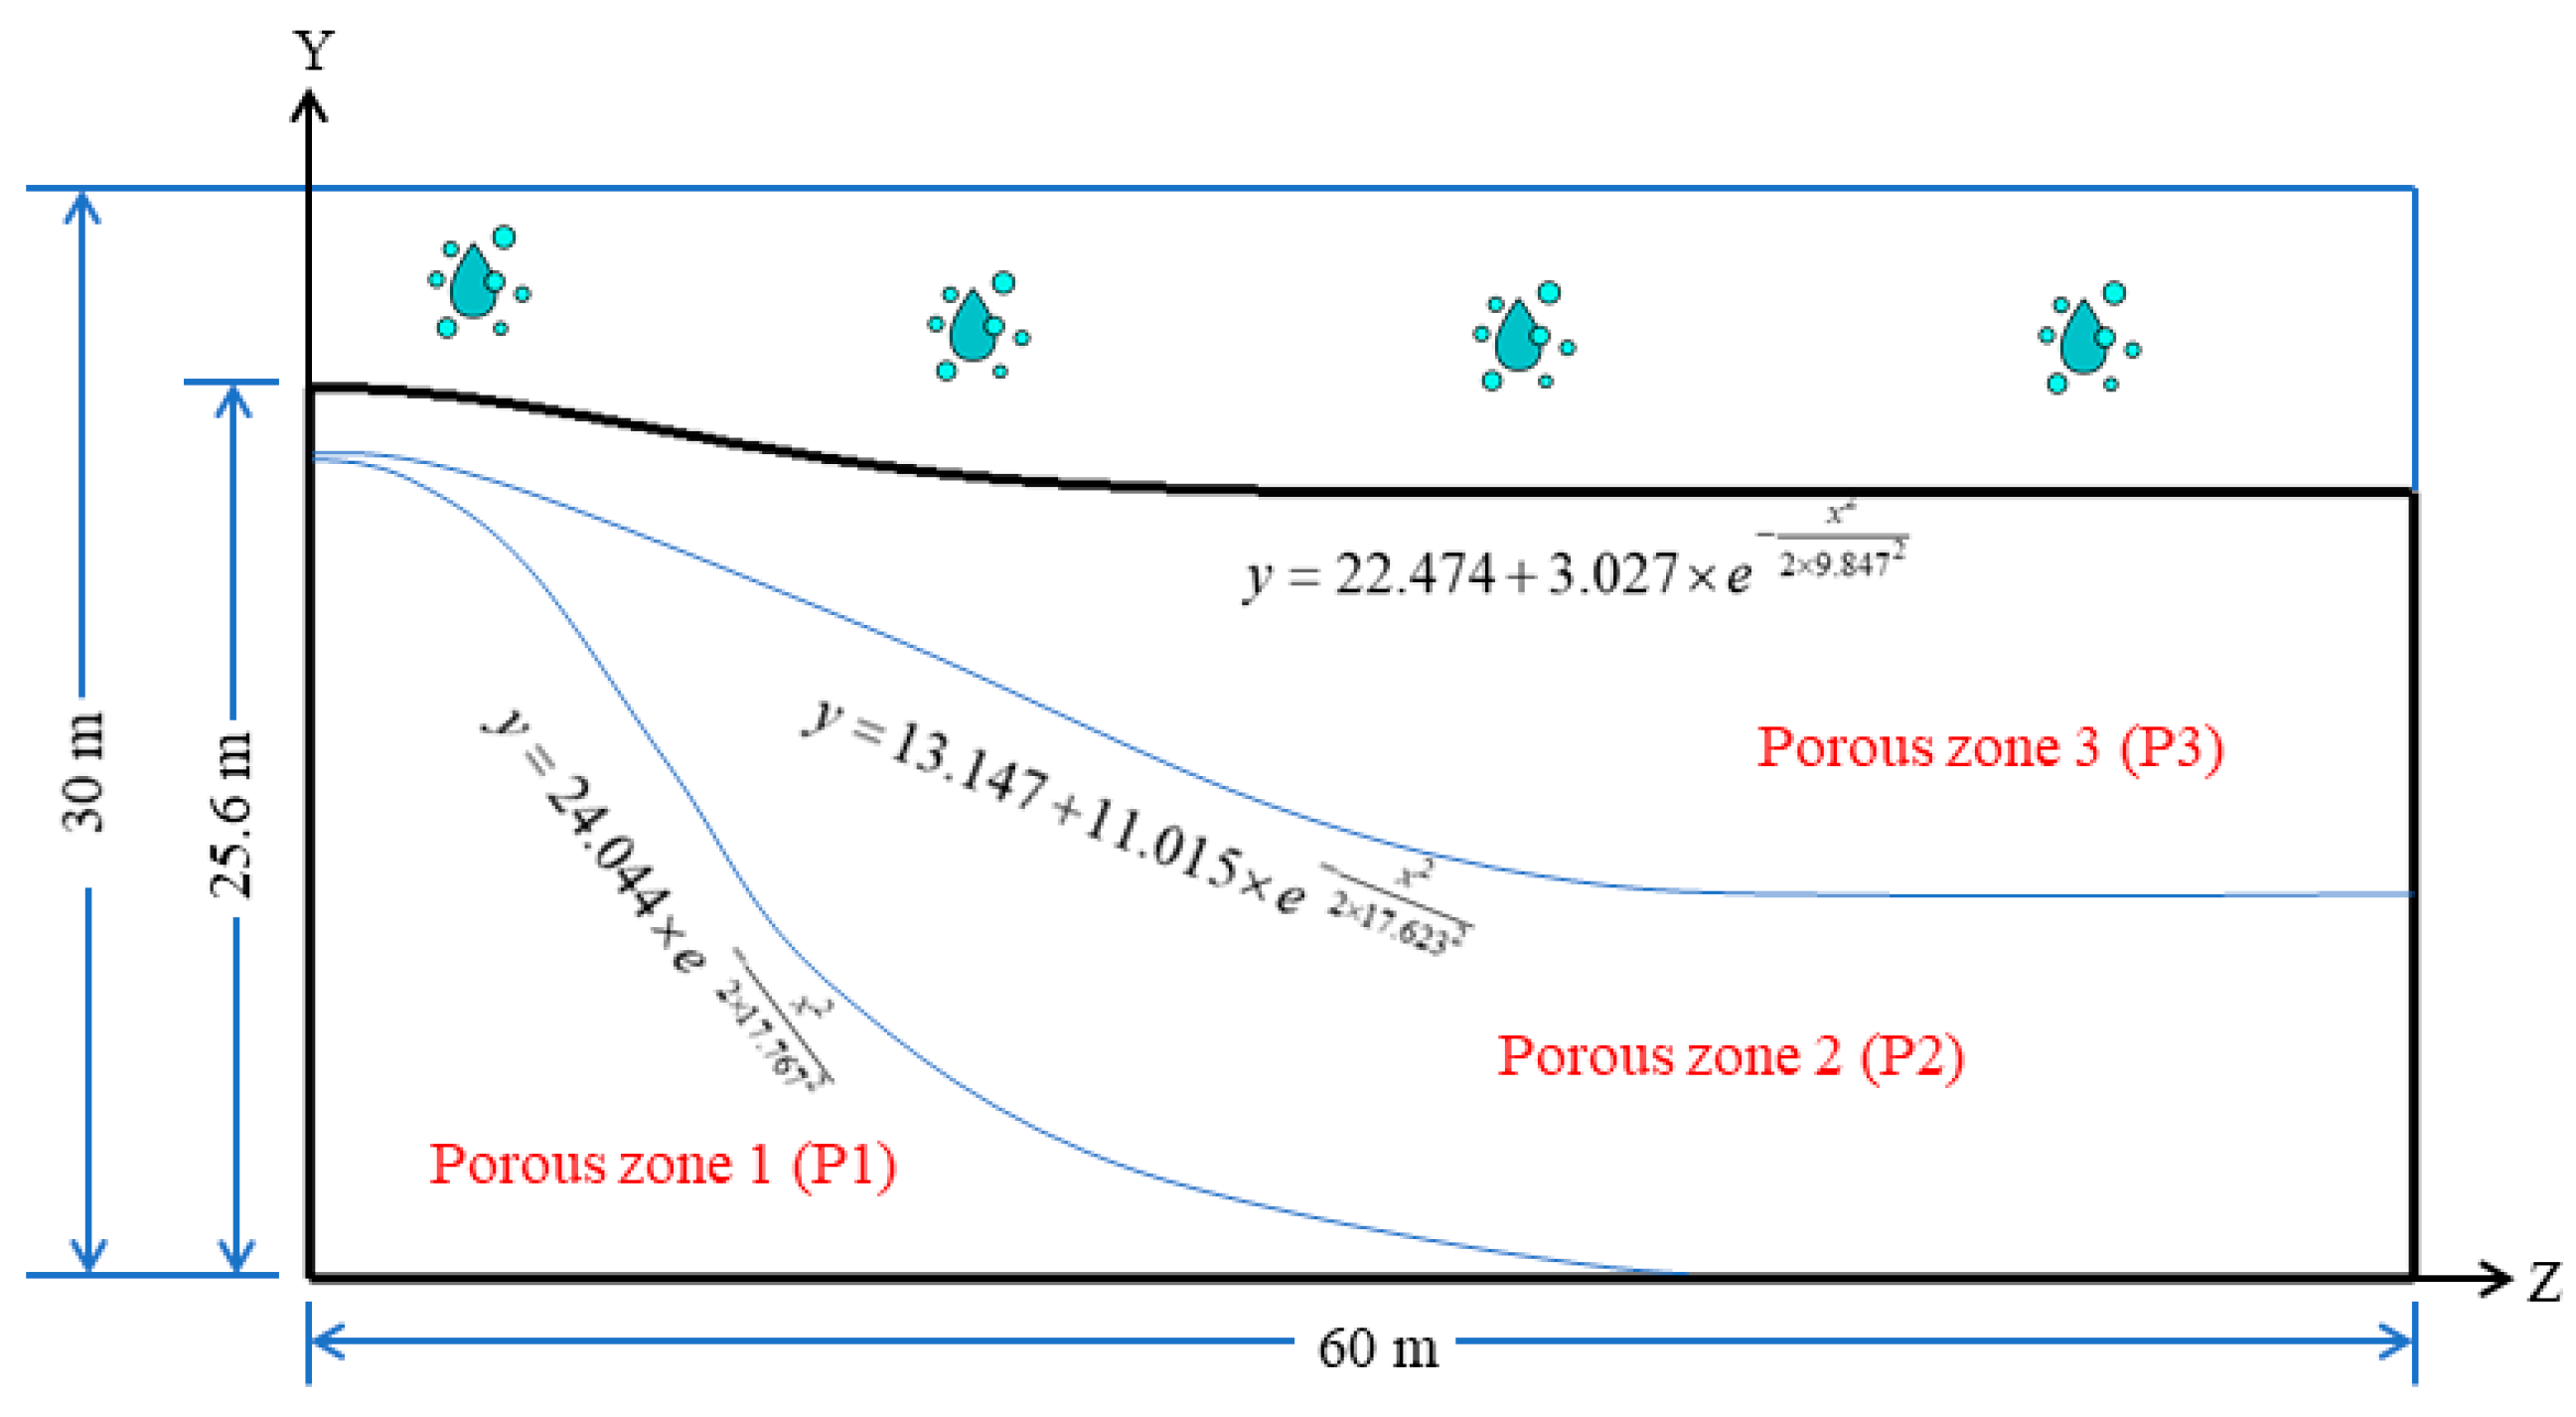
In this model, the fluid inlet surface of the U-bend pipe is defined as Fan, which means that it serves as a water pump for the circulating water system. The wall of the U-bend pipe and the periphery of CPB are defined as the wall. The 0.6 m length of U-bend pipe extends out of CPB (as shown in Figure 3), is heated under constant power, and serves as a heat source for TRT simulation. Therefore, the boundary of it is set as constant heat flux. In addition, the walls are set as insulation. Considering the heat and moisture coupling, each layer of backfill is regarded as an isotropic homogeneous porous medium in this paper, as shown in Figure 5. Finally, the details of the three porous zones with different properties are inputted by UDF. In order to ensure the convergence of the calculation, the under-relaxed iteration method is used for pressure and momentum. The PISO algorithm is used for the pressure–velocity coupling, which has great advantages in dealing with the mesh distortion [40].
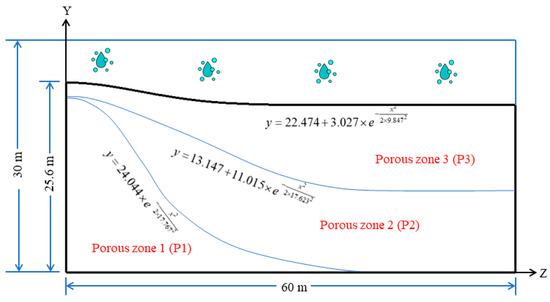
Figure 5.
Distribution of three different porous zones in the simulation model.
3. Validation of the Simulation Model
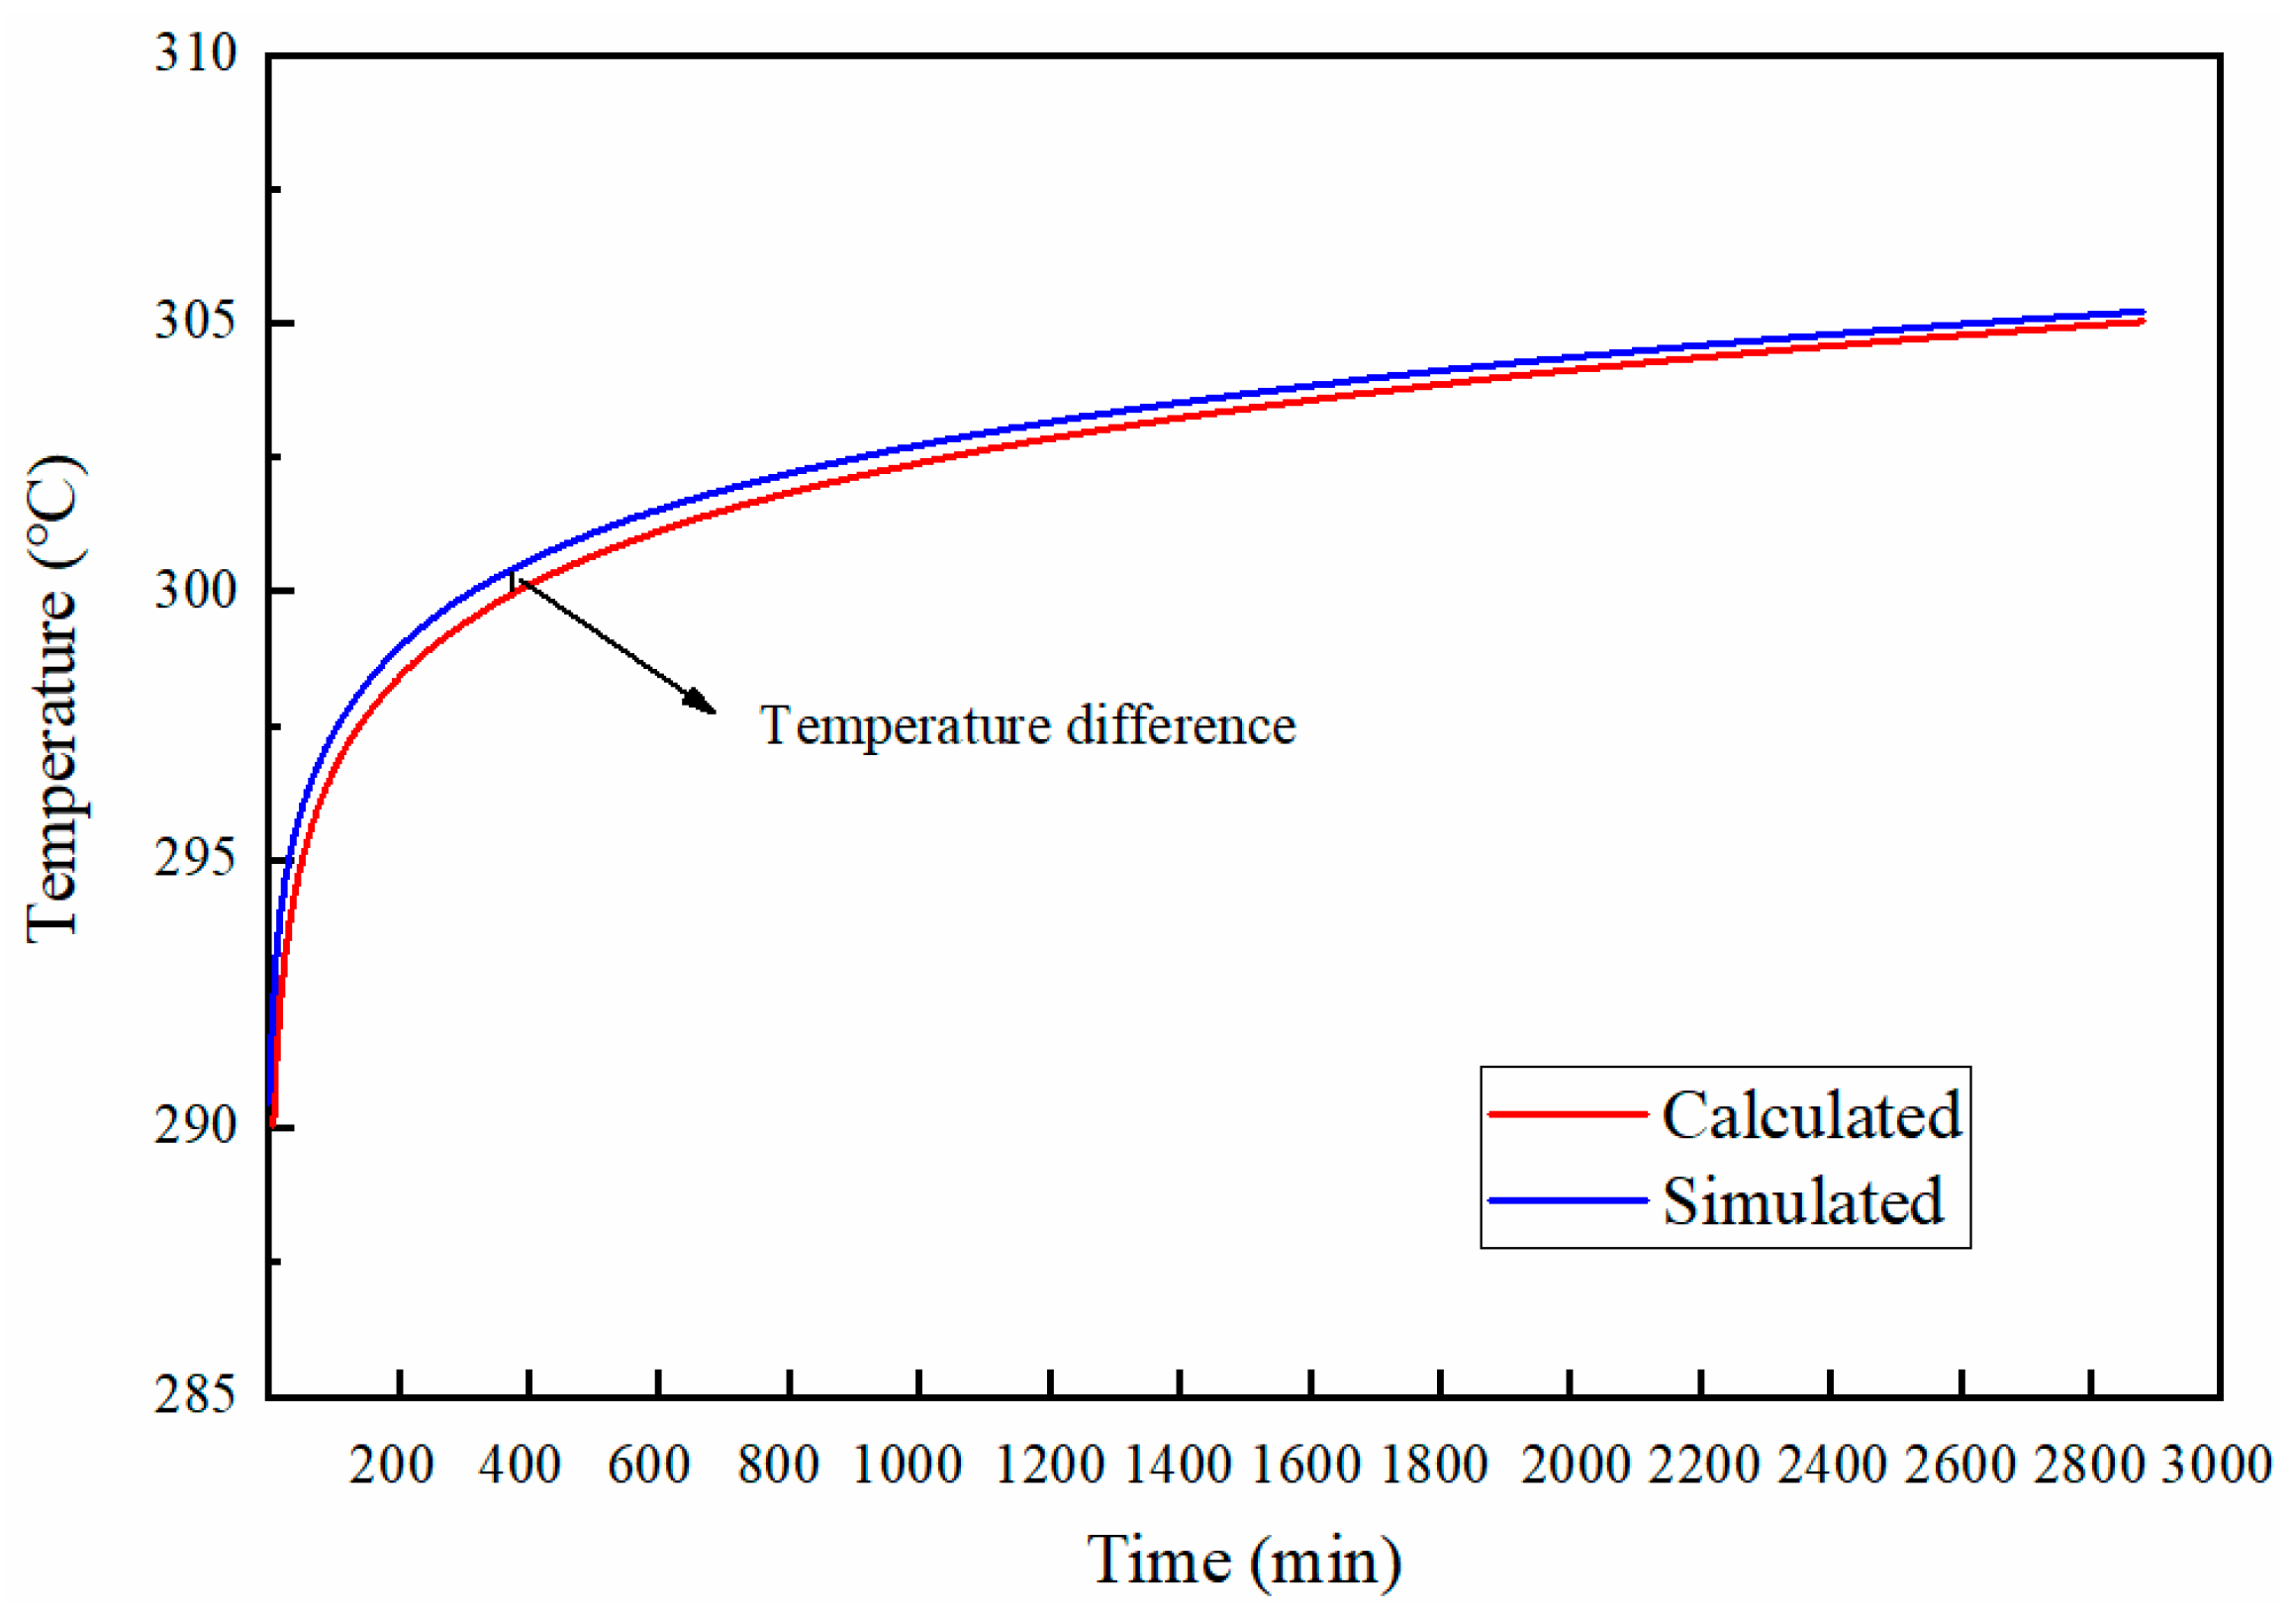
To ensure the accuracy of simulation results, the numerical model should be validated at first by experimental data or analytical method. In this study, the analytical TRT method based on linear heat source theory was adopted for the model validation [41], in which the HET is regarded as an infinite linear heat source while CPB outside the pipe is considered to be an infinite medium. The average fluid temperature in the HET was employed as the evaluation parameter. For the analytical model, the average fluid temperature could be calculated according to the previous studies [42]. Table 2 summarizes the relevant initial parameters in the analytical and simulation models. The comparison of average fluid temperature in the HET under these two models is shown in Figure 6.
Table 2.
Initial parameter settings in analytical and simulation models.
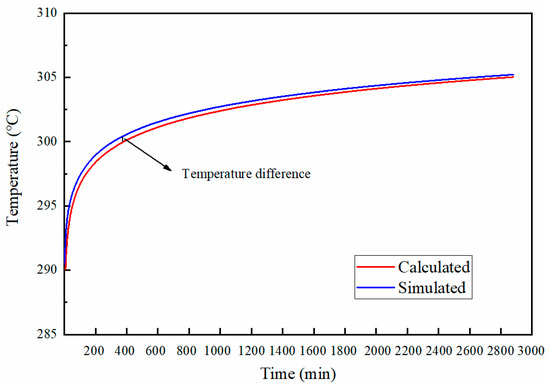
Figure 6.
The analytical and simulated variation of average fluid temperature over time.
From Figure 6, it can be found that in the initial phase, the simulated average fluid temperature slightly deviates from the analytical results. However, the values from the two models agreed well with each other over time. The difference attained from the model comparison is in an acceptable range.
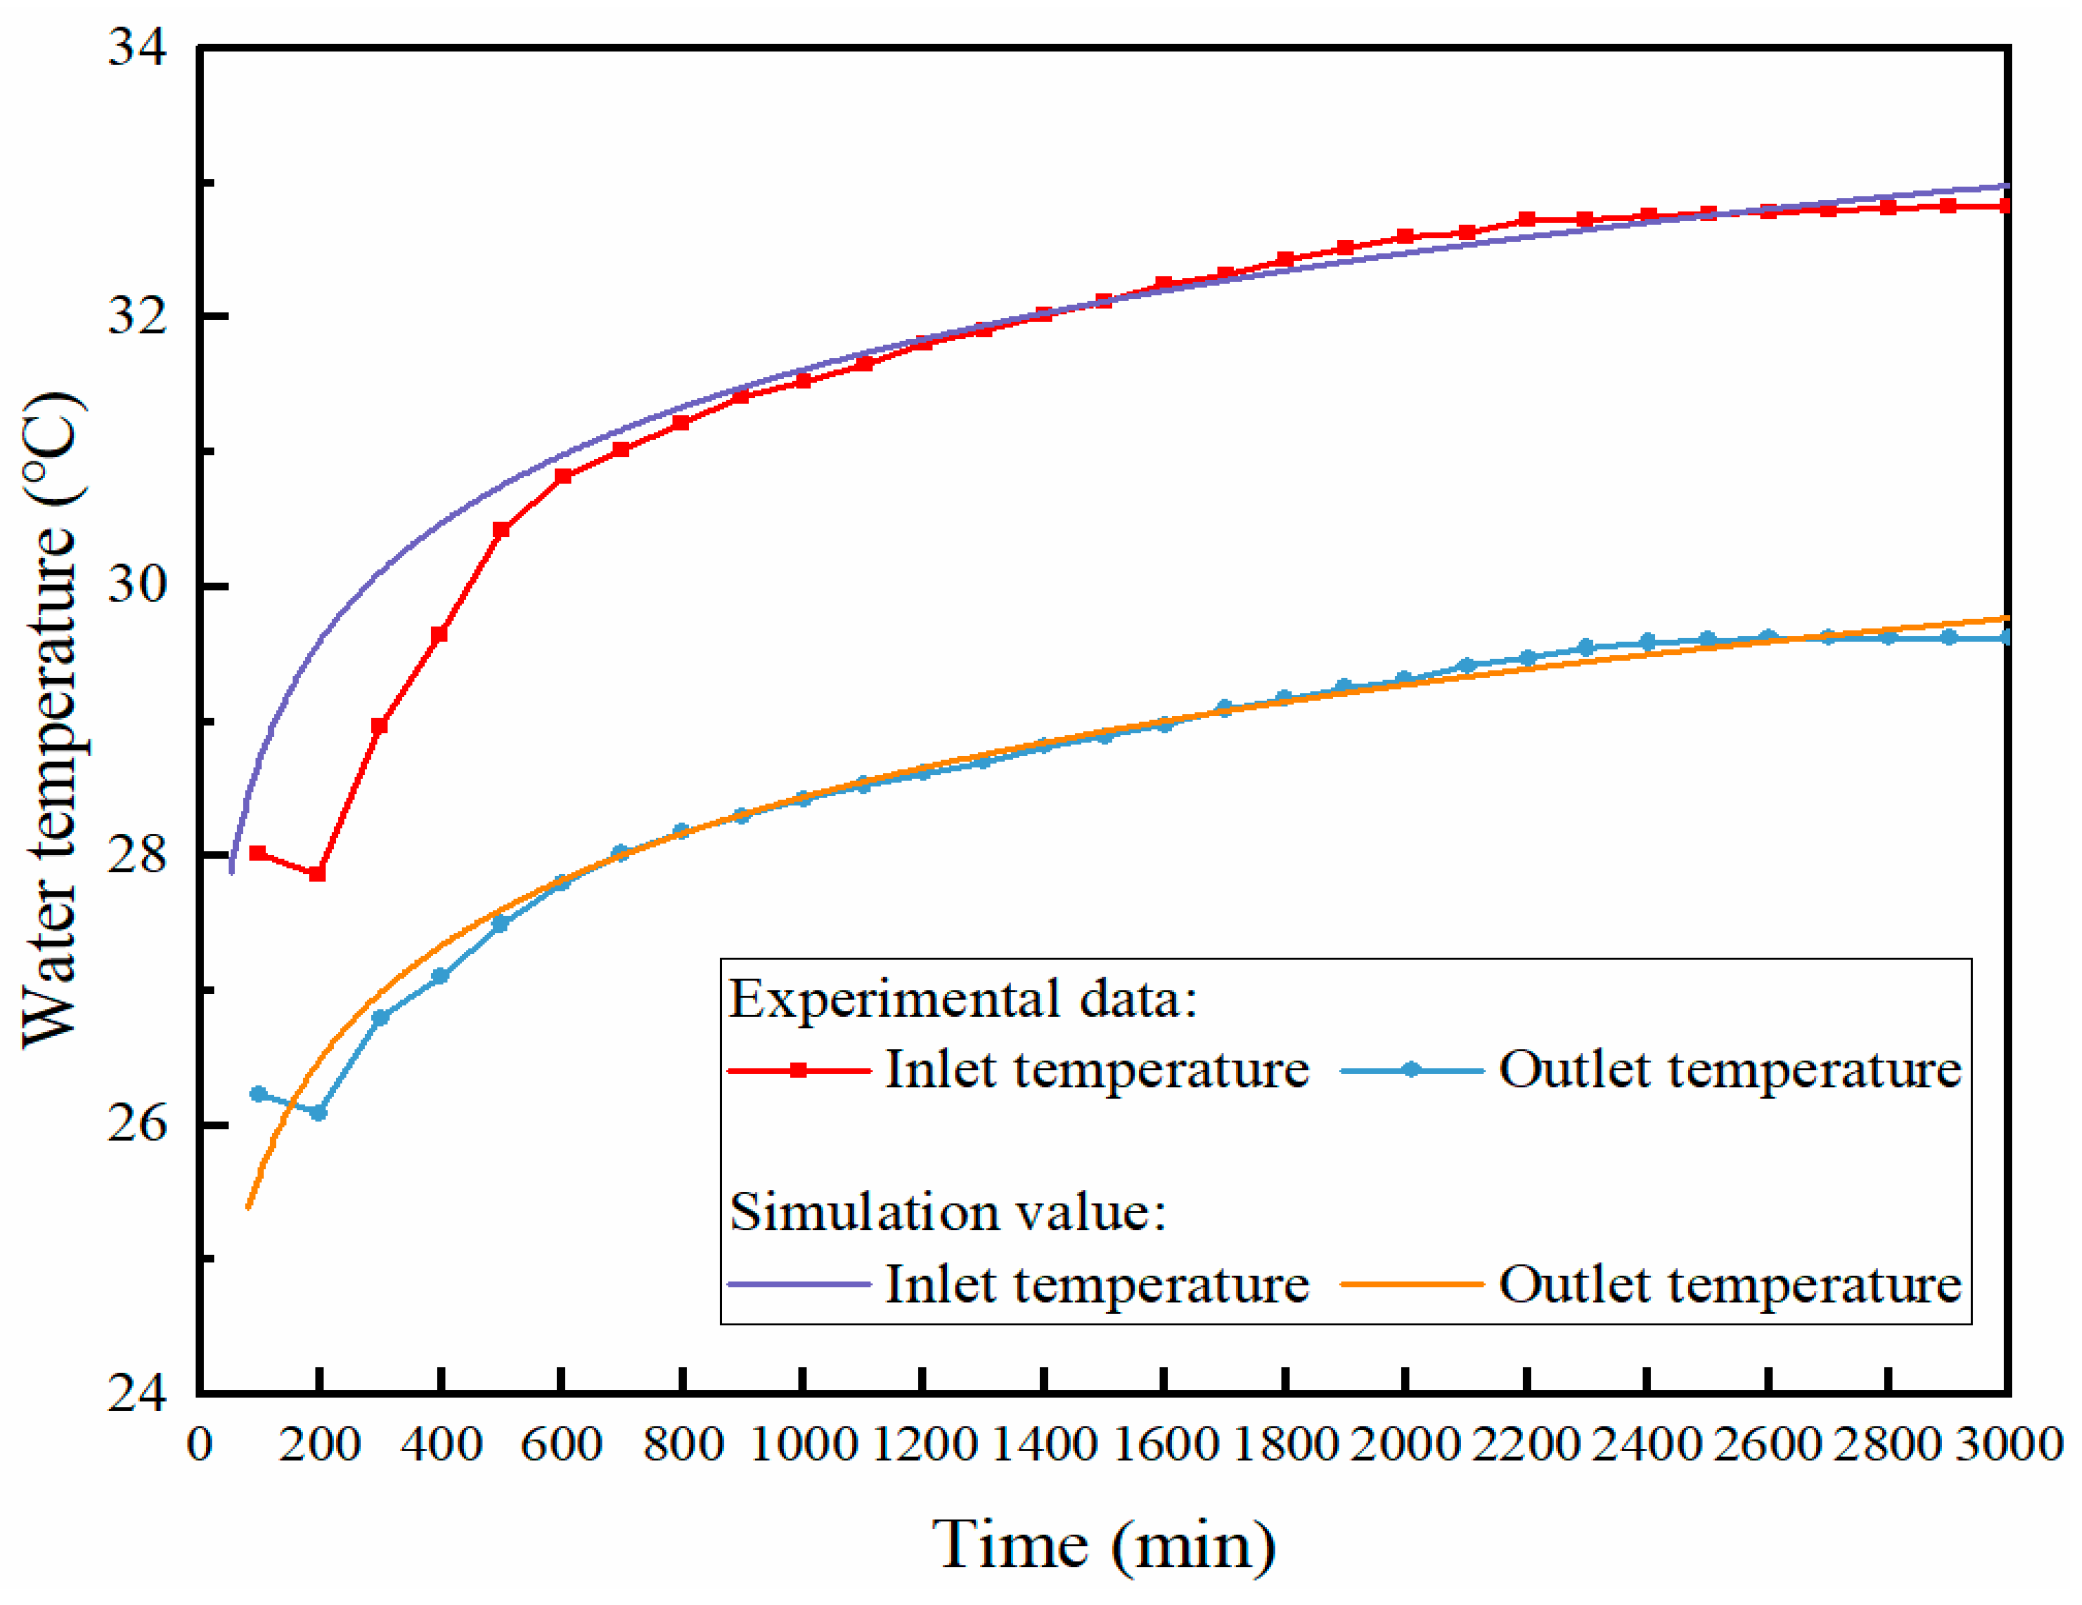
Furthermore, a UDF was used in this study to evaluate the nonuniformly distributed thermal properties of CPB; thus, the UDF should also be verified. It was examined through a comparison with results of experiments conducted by Li et al. [43], in which the nonuniform thermal property distribution of the layered subsurface was fully considered. The inlet and outlet fluid temperatures in the HET under simulation and experimental conditions were compared. Figure 7 gives the simulated and measured inlet/outlet water temperatures. It suggests that the numerical results fitted well with the experimental data after 10 h of operation (with a deviation of 0.24 °C). The error in the first 10 h may be attributed to the instability of measuring instruments at the initial experimental stage. In addition, the outside environment may also have an impact on the measurement results because it cannot guarantee complete thermal isolation compared to simulation. In general, the simulation and experiment results showed good agreement. According to the above validation, the proposed numerical model could be adopted to evaluate the thermal performance of CPB.
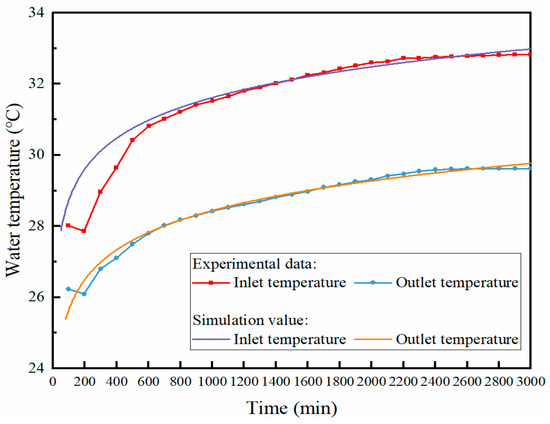
Figure 7.
Measured and simulated variations of inlet and outlet temperatures.
4. Results and Analyses
This study was carried out under vapor-saturated and liquid-saturated conditions. As aforementioned, the thermal conductivity should be obtained by considering the sedimentary effect of CPB slurry, which results in the nonuniform distributions of particle sizes, porosities, and thermal properties in CPB. Due to the hydration effect at the top region of CPB, the microstructure at this position is more compact and even nonporous compared to the bottom. In order to investigate the effects of different porosities and hydraulic conductivities on thermal conductivity, 3D simulations under different boundary conditions were conducted. The main parameters in each case are shown in Table 3, wherein P1, P2, and P3 represent the bottom, intermediate, and top regions in CPB, respectively (as shown in Figure 5). The seepage flow direction in this paper is defined from the top to the bottom regions of CPB.
Table 3.
Numerical condition parameters.
According to Abbasy’s study, the thermal conductivities of CPB under liquid-saturated and vapor-saturated conditions are 1.43 and 0.3 W/m·°C, respectively [22]. The CPB thermal conductivities with different porosities can be obtained by Equation (3):
where n is the porosity and λf and λs represent the thermal conductivities of fluid and solid phases in CPB, respectively. The details of material properties in this simulation model are listed in Table 4.
Table 4.
Material physical parameters.
In this paper, the initial temperatures of CPB and the fluid in the HET are set to be 290 K while the heating power is set as 2100 W. Figure 8 shows the velocity field in the HET, in which the direction of water flow is clearly denoted. When the fluid flows into the U-shaped part and out of the U-shaped part, the fluid gradually shifts from the center of the tube to the tube wall due to the inertia effect. For TRT duration, the recommended value is not less than 36 h [45]. It is assumed that 1.48 W/(m·°C) is the true value of thermal conductivity to investigate the influence of test duration. The results are shown in Figure 9. It can be seen that the thermal conductivity of CPB first increases with the increase in test time and then stabilizes at 1.43 W/(m·°C). In the actual TRT process, the test time should not be too long. The reason is that the long period will change the moisture content of CPB, which will impact the test results. Thus, with the acceptable test error, the simulation duration of this paper is 48 h.
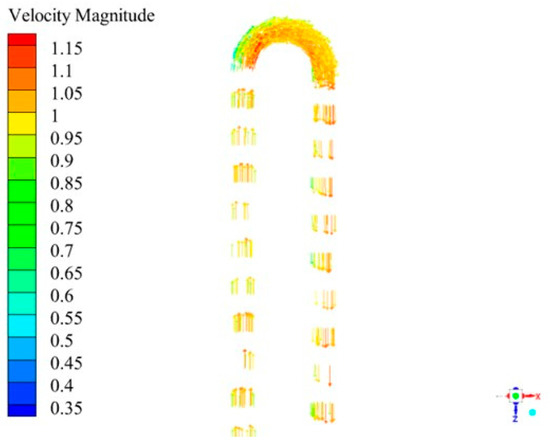
Figure 8.
Velocity field in the U-shaped tube.
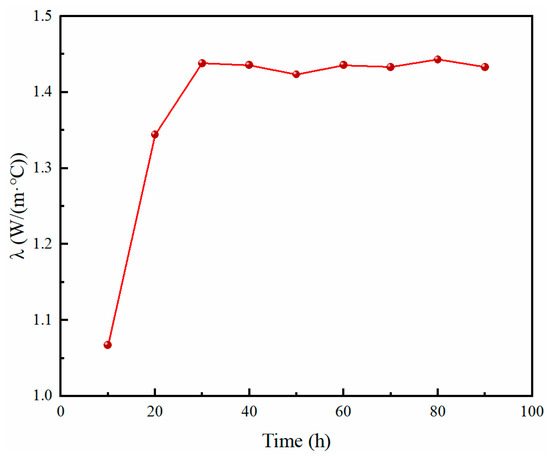
Figure 9.
Effects of test duration on thermal conductivity of CPB.
4.1. Effects of the Porosity on Heat Exchange Performance of CPB
CPB is composed of the solid skeleton and the pores. The porosity and distribution of the pores have an influence on the thermal performance of CPB. In this section, the seepage flow is not considered; thus, CPB could be treated as vapor-saturated. Figure 10a shows the temperature distribution of cross-section Z = 0 after 48 h of operation in Case 1, in which the water in the HET releases heat to its surrounding CPB, improving the CPB temperature from 290 K gradually over time. Owing to the shape of the HET, the thermal influence region approximately tends to be a circular region along the radial direction. The heat transfer performance of CPB could also be indicated. The CPB temperature gradually reduces away from the HET. This is clearly demonstrated in Figure 10b, wherein the CPB temperature drops obviously along the vertical direction (i.e., Y-direction), and the slope is gradually flattened. When the distance from the HET reaches 0.6 m, the CPB temperature approaches its initial value of 290 K, indicating a thermal influencing radius of 0.6 m for the HET. Beyond this range, the effect of the HET on CPB temperature could be ignored.
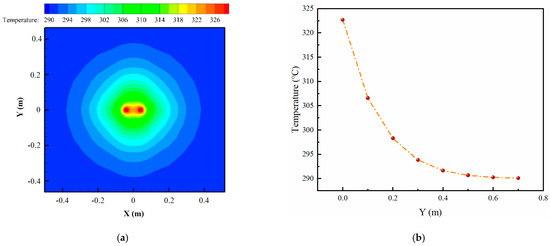
Figure 10.
Temperature distribution of CPB. (a) Temperature contour of cross-section Z = 0; (b) temperature variation along the Y-direction (Z = 0 m, X = 0).
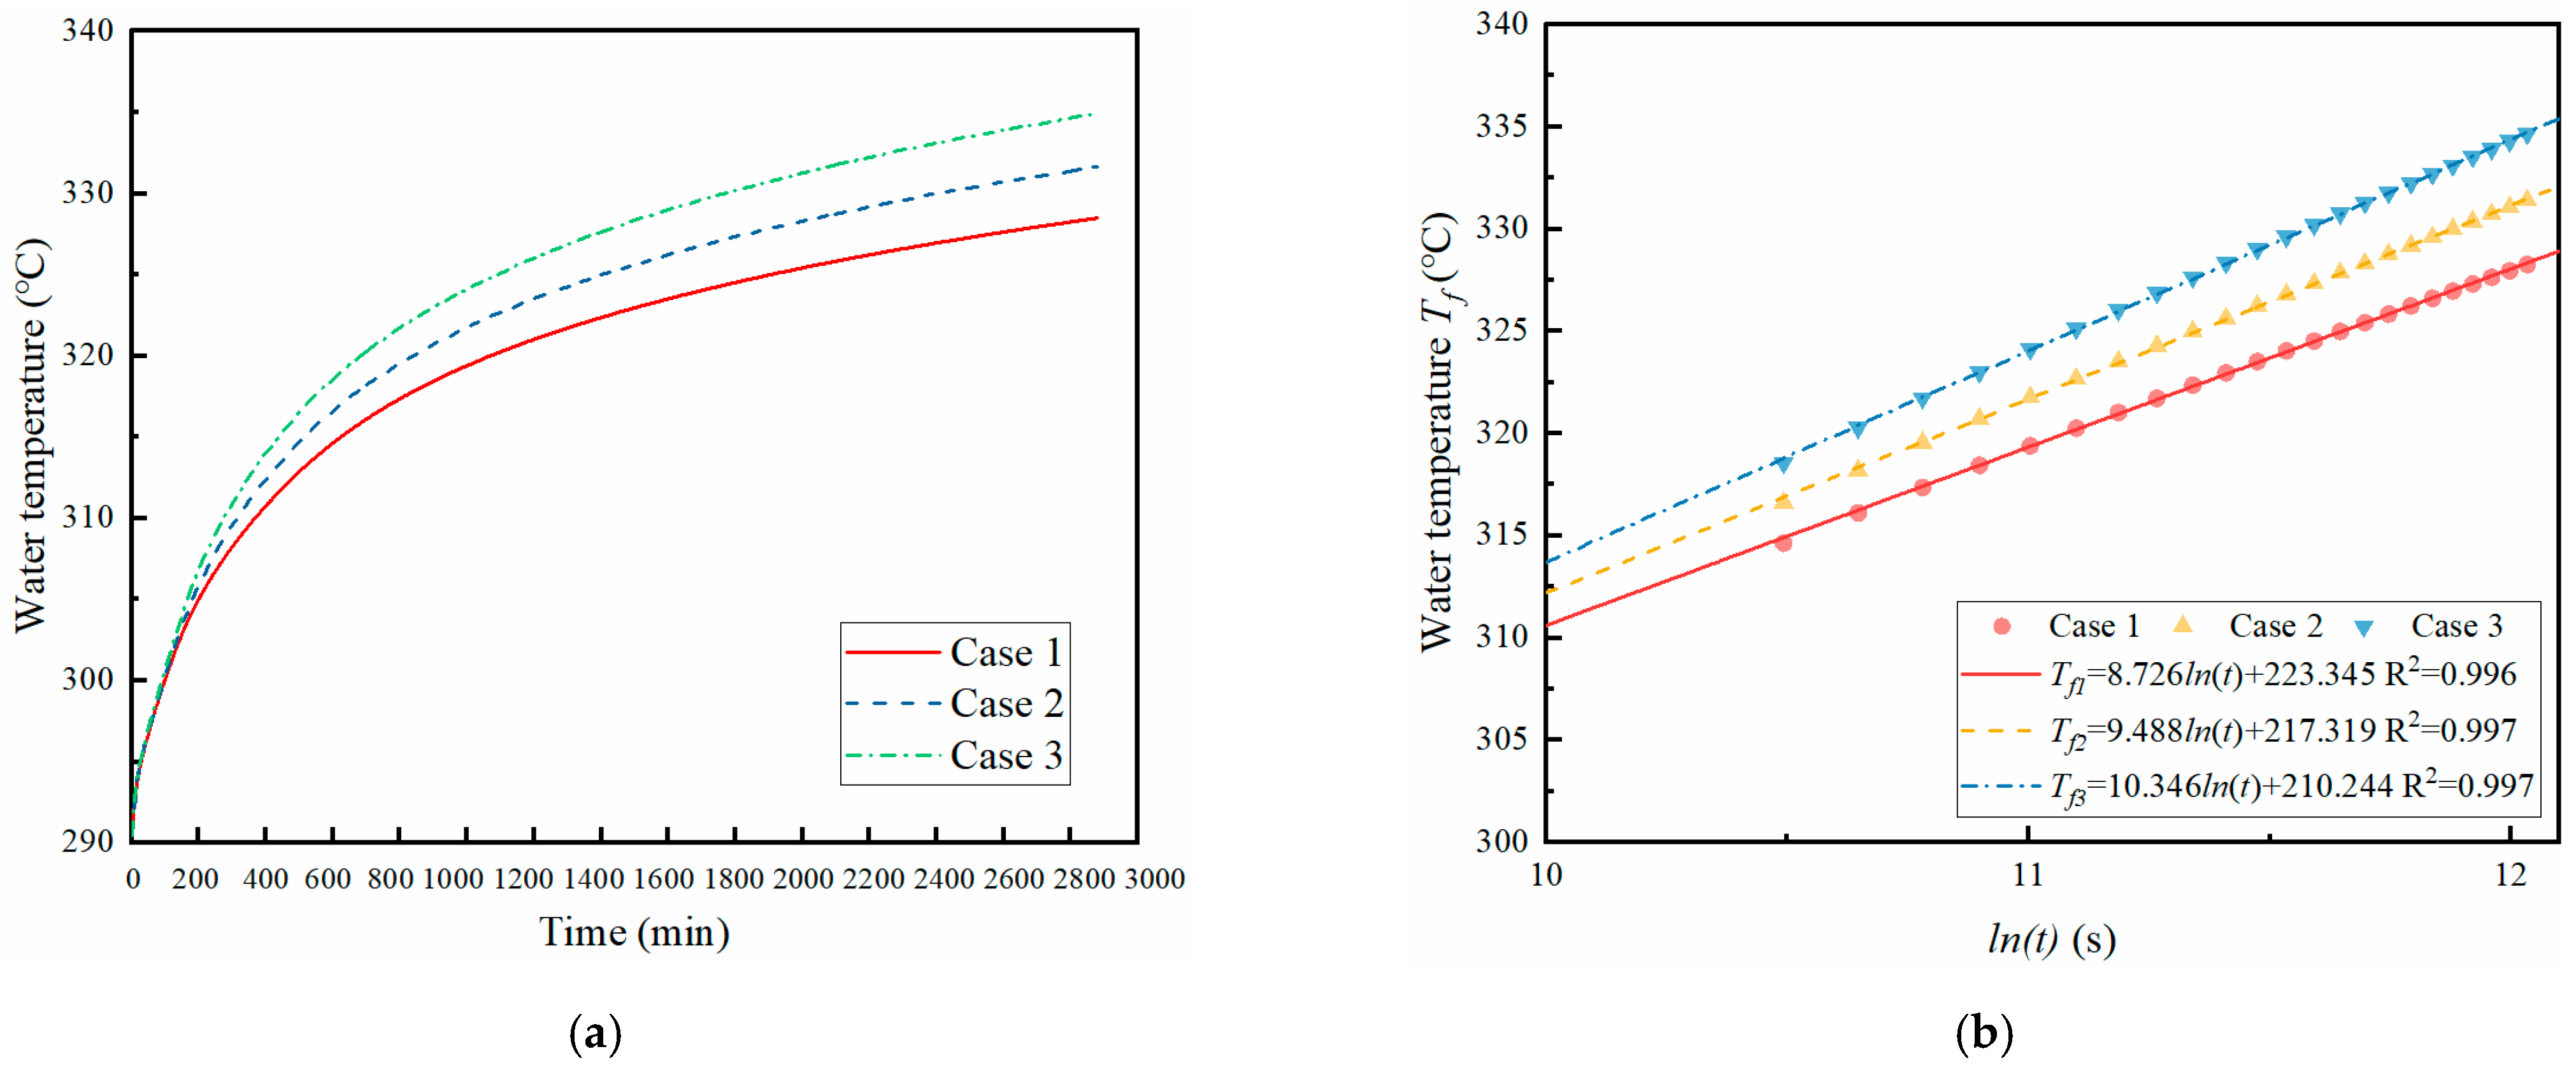
After 48 h of operation, the variation of average water temperatures in the HET in Case 1, Case 2, and Case 3 is shown in Figure 11a. The water temperatures in different cases increased from 290 K to 328.48, 331.65, and 334.93 K, respectively. In different simulation cases, the water in the HET is heated under a constant heat flux and then releases thermal energy to the surrounding CPB; thus, the higher water temperature in the tube means an inefficient heat transfer between the tube and surrounding CPB, as well as a low CPB thermal conductivity. In view of different porosities in Cases 1 to 3, it is manifested that the heat transfer performance between HET and CPB varies with the CPB porosity. As shown in Figure 11a, the higher porosity corresponds to a weaker heat conductive performance of CPB (Case 3). This is mainly because a higher porosity has a higher air content, the heat conductivity of which is much less than that of the solid phase, reducing the comprehensive heat conduction of CPB. Furthermore, under the TRT method [46], the average fluid temperature in the HET (Tf) keeps a linear relation with lnt, where t is system operation duration, as shown in the following equations:
where k and b are fitted values according to the data of Tf and lnt; λc denotes the thermal conductivity of CPB; and ql represents the heating power, which is a known value under TRT method. When the values of Tf and lnt are obtained, λc can be calculated by Equations (4) and (5). The relations between Tf and lnt in Cases 1 to 3 are shown in Figure 11b, and the corresponding complex thermal conductivities of CPB in these three cases are calculated to be 0.324, 0.298, and 0.273 W/(m·K), respectively. Comparing the results of each case with the thermal conductivity values in Table 4, it can be found that in each case, the value of complex thermal conductivity of CPB falls between the lower and upper limit values that correspond to the maximum porosity and minimum porosity, respectively. For example, for CPB in Case 1, the thermal conductivity of CPB ranges from 0.316 W·m−1·K−1 (corresponding to a minimum porosity of 0.3) to 0.364 W·m−1·K−1 (corresponding to a maximum porosity of 0.4). The complex thermal conductivity of CPB obtained by simulation is 0.324 W/(m·K), which is not equal to the average of the upper and lower limit values. This indicates that it is not feasible to acquire the comprehensive thermal conductivity of CPB by the arithmetic average method.
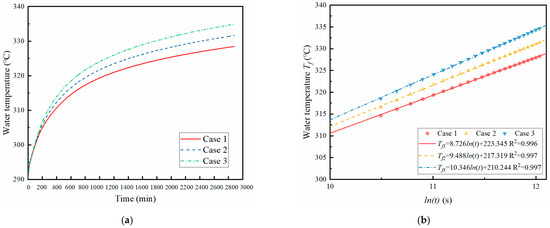
Figure 11.
Average water temperatures in the HET under different cases. (a) Variation of average water temperature over time; (b) relationship between average water temperature and logarithmic time.
4.2. Effects of the Hydraulic Conductivity on Heat Exchange Performance of CPB
The effect of seepage has a significant influence on the heat transfer between CPB and HET, which will have a certain impact on the heat exchange performance. Due to the bleeding behavior of CPB, there often exists bleeding water on the top surface of CPB after solidification. In addition, the underground environment usually induces seepage flow. Therefore, the effect of seepage flow was evaluated. The seepage direction was set from the top region to the bottom of CPB. Relative parameter settings are shown in Table 3 and Table 4.
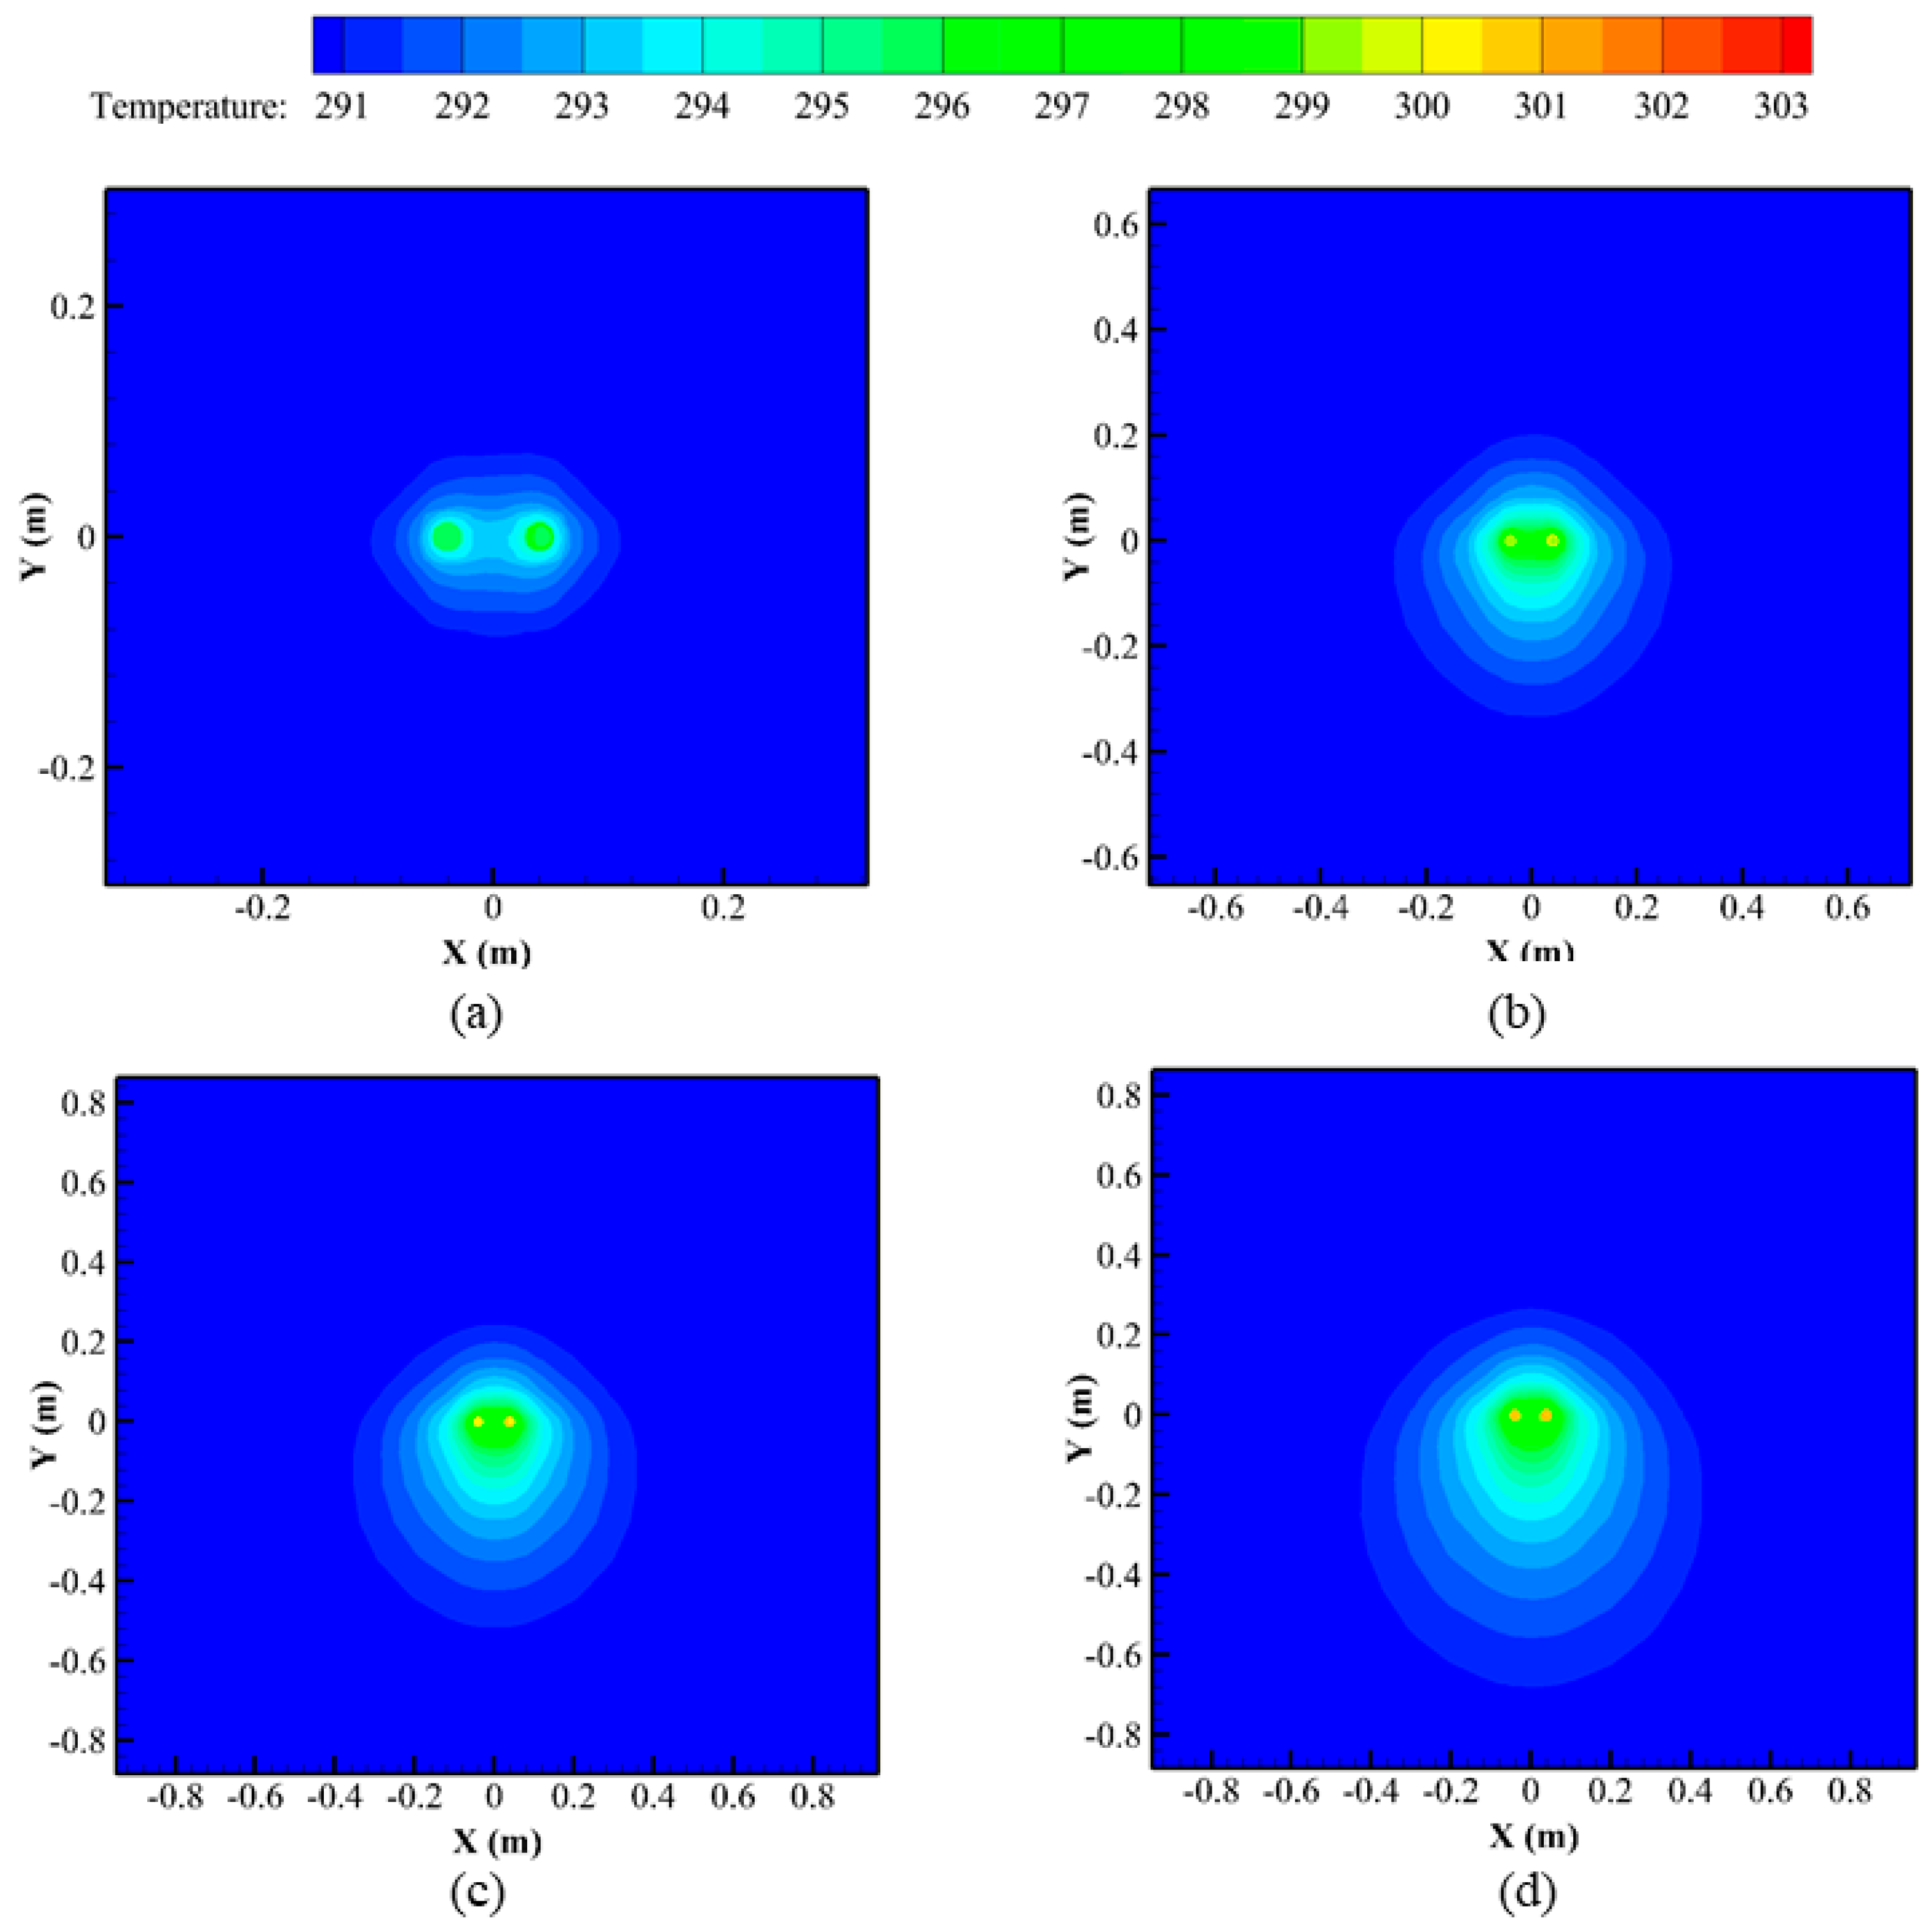
Figure 12 indicates the temperature distribution of cross-section Z = 0 under seepage condition, with a hydraulic conductivity of 2 × 10⁻⁶ (Case 8). By comparing Figure 12a–d, it can be seen that as time increases, the thermal influencing region of the HET gradually extends. The temperature field of the cross-section is no longer symmetrically distributed along the vertical direction. Instead, the thermal energy is gradually accumulated to the bottom region of CPB, forming a higher temperature than the upper region. This is clearly illustrated in Figure 13, wherein a higher temperature and larger influencing region are exhibited in the negative Y-direction compared to the positive Y-direction. Generally, with the increase in the hydraulic conductivity, the temperature field of the surrounding CPB near the HET deviates along the seepage flow direction. The higher the hydraulic conductivity is, the more uneven the temperature distribution is. Furthermore, the thermal influencing region shown in Figure 12d is larger than that in Figure 10a, indicating that the seepage flow could enlarge the thermal influencing radius of the HET in comparison with conditions without the seepage effect.
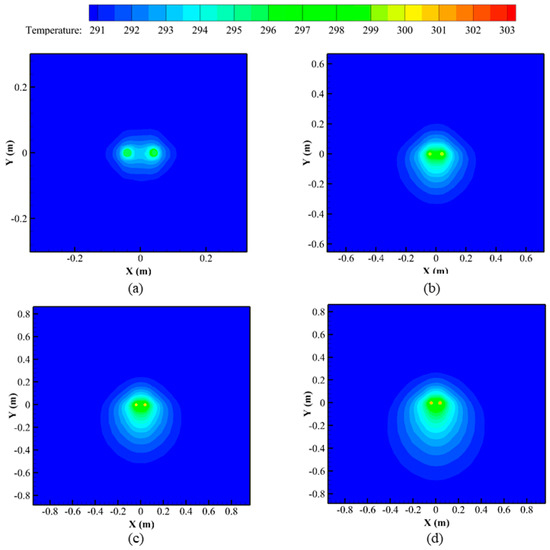
Figure 12.
Temperature distribution of the cross-section Z = 0 with a hydraulic conductivity of 2 × 10⁻⁶ m/s. (a) After 2 h; (b) after 16 h; (c) after 32 h; (d) after 48 h.
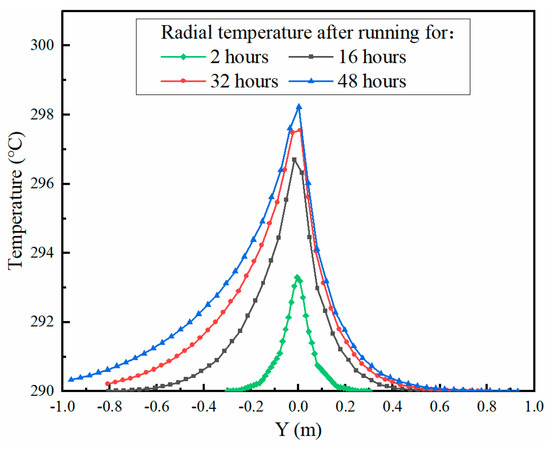
Figure 13.
Radial temperature distribution of CPB along the Y-direction (X = 0 m) with a hydraulic conductivity of 2 × 10⁻⁶ m/s.
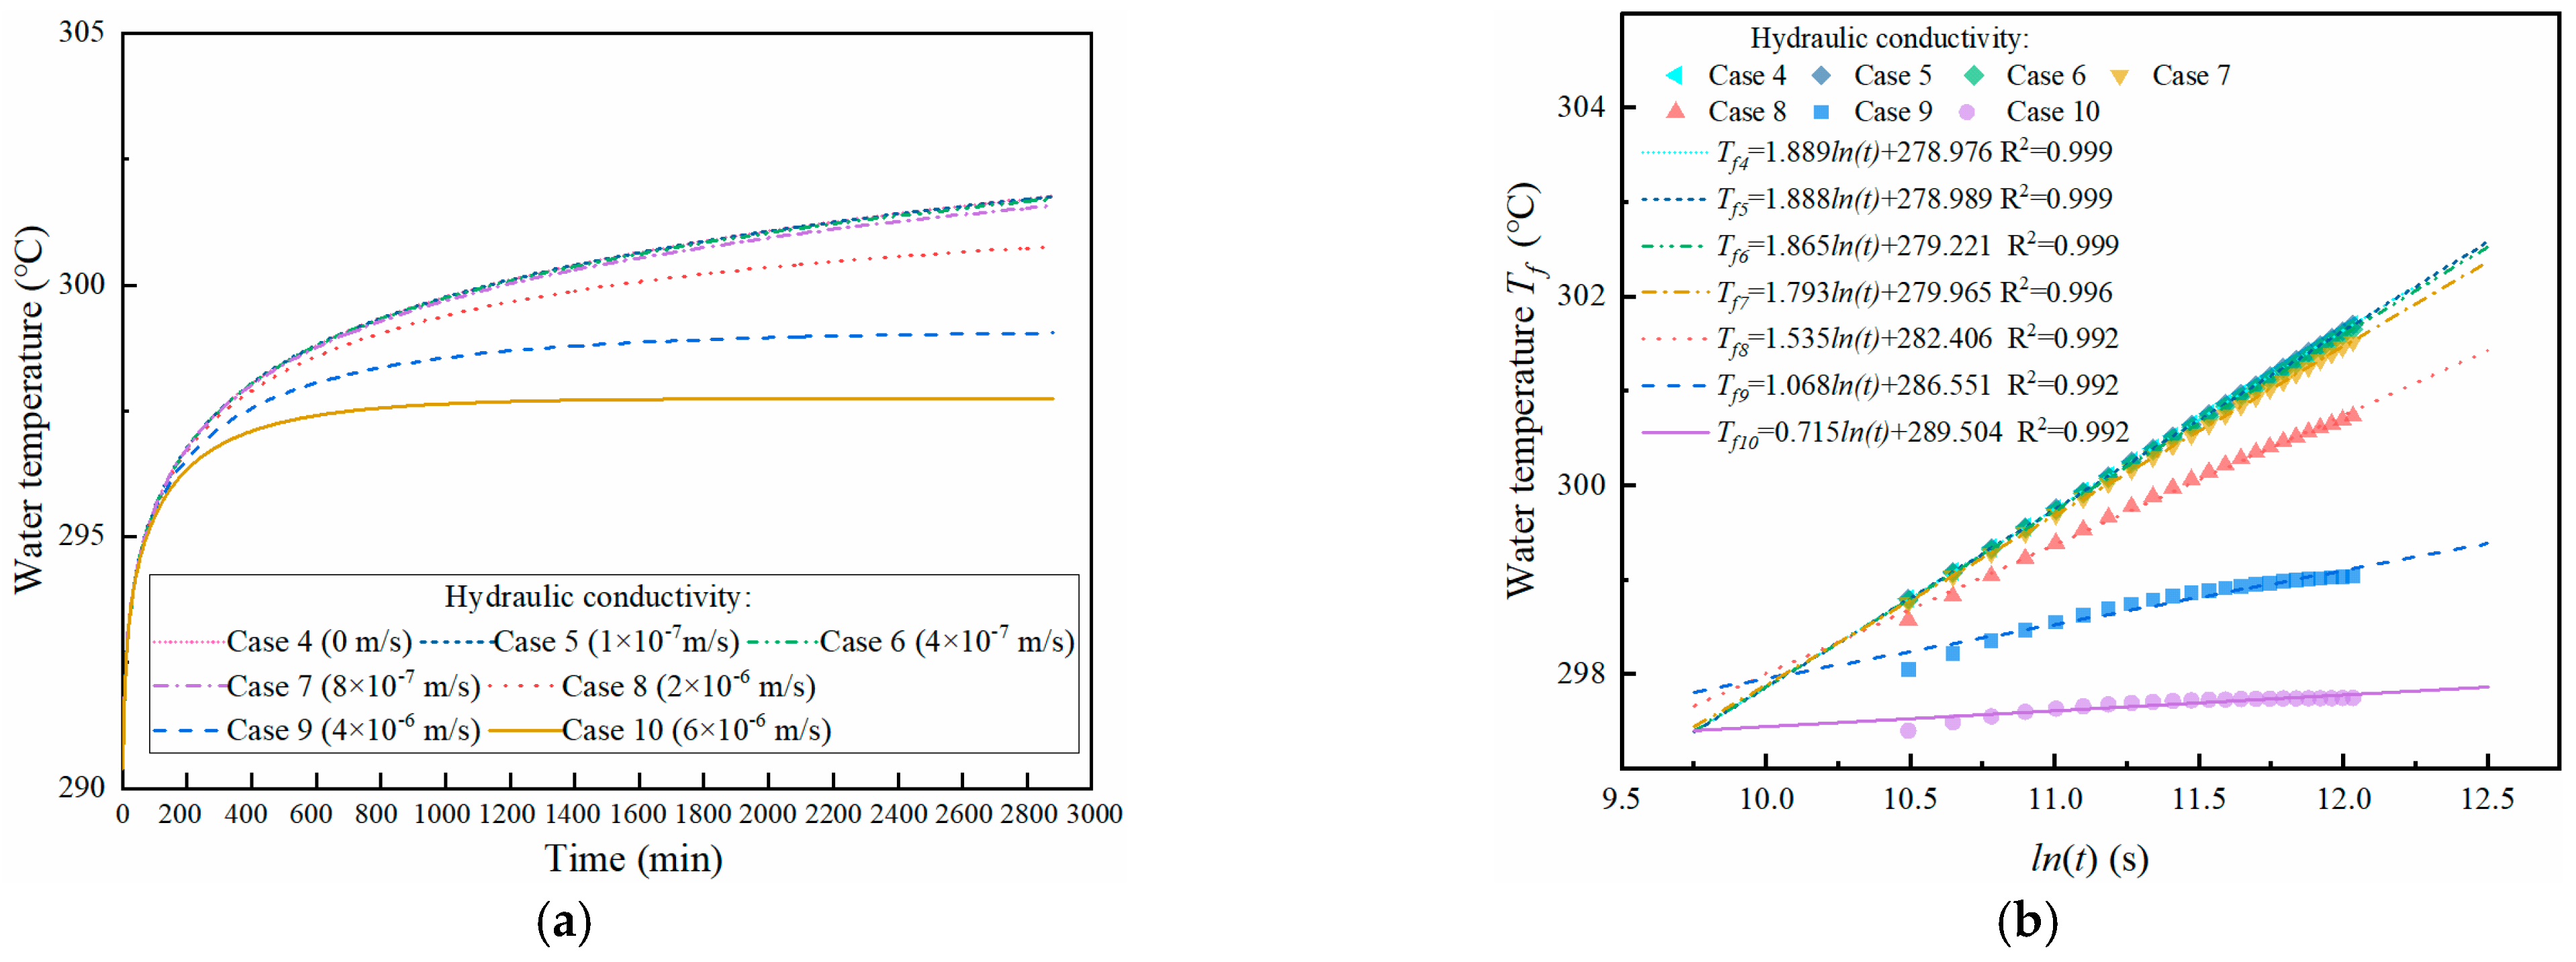
The average water temperature variations in the HET for 48 h of continuous operation under different hydraulic conductivities are shown in Figure 14a. It can be seen that water temperatures in the HET vary with the hydraulic conductivity. A higher hydraulic conductivity corresponds to a lower water temperature, indicating a better heat exchange performance between the tube and its surrounding CPB. With relatively similar hydraulic conductivities, which are 0, 1 × 10⁻⁷, and 4 × 10⁻⁷ m/s, respectively, the variations of average water temperature exhibited in Cases 4 to 6 are almost the same. This result manifests that the seepage flow can enhance the heat exchange capacity of CPB.
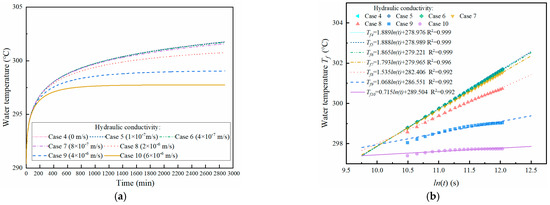
Figure 14.
Water temperature under liquid-saturated condition. (a) Variations of water temperature at different hydraulic conductivities; (b) regression curves of the water temperature.
Figure 14b denotes the relationship between average water temperature in the HET and operation time. By Equations (4) and (5), the complex thermal conductivity of CPB under different hydraulic conductivities could be acquired, as shown in Figure 15. Comparing Cases 2 and 4 in Figure 15, it is found that the complex thermal conductivity of CPB in Case 4 is 1.497 W/(m·K), much higher than that of 0.298 W/(m·K) in Case 2. The porosities in these two cases are set with the same values while the seepage behavior is not considered (as shown in Table 3). This suggests that under the same porosities and seepage conditions, the heat exchange performance of CPB under liquid-saturated condition is higher than that under vapor-saturated condition. The reason is that the thermal conductivity of water is much higher than that of air. The pore-water of liquid-saturated CPB could effectively improve its heat exchange capacity. Compared to the results shown in Section 4.1, it is indicated that the effect of the saturation condition of CPB on its thermal conductivity is stronger than the effect of the porosity.
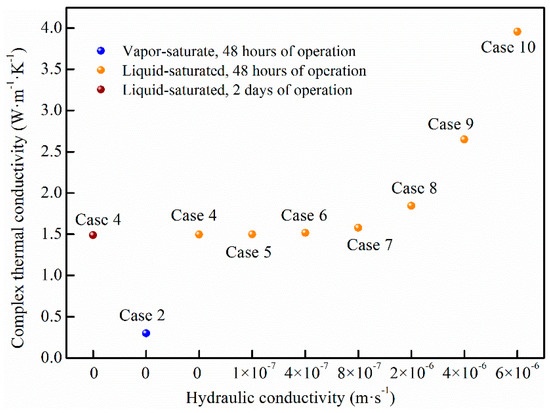
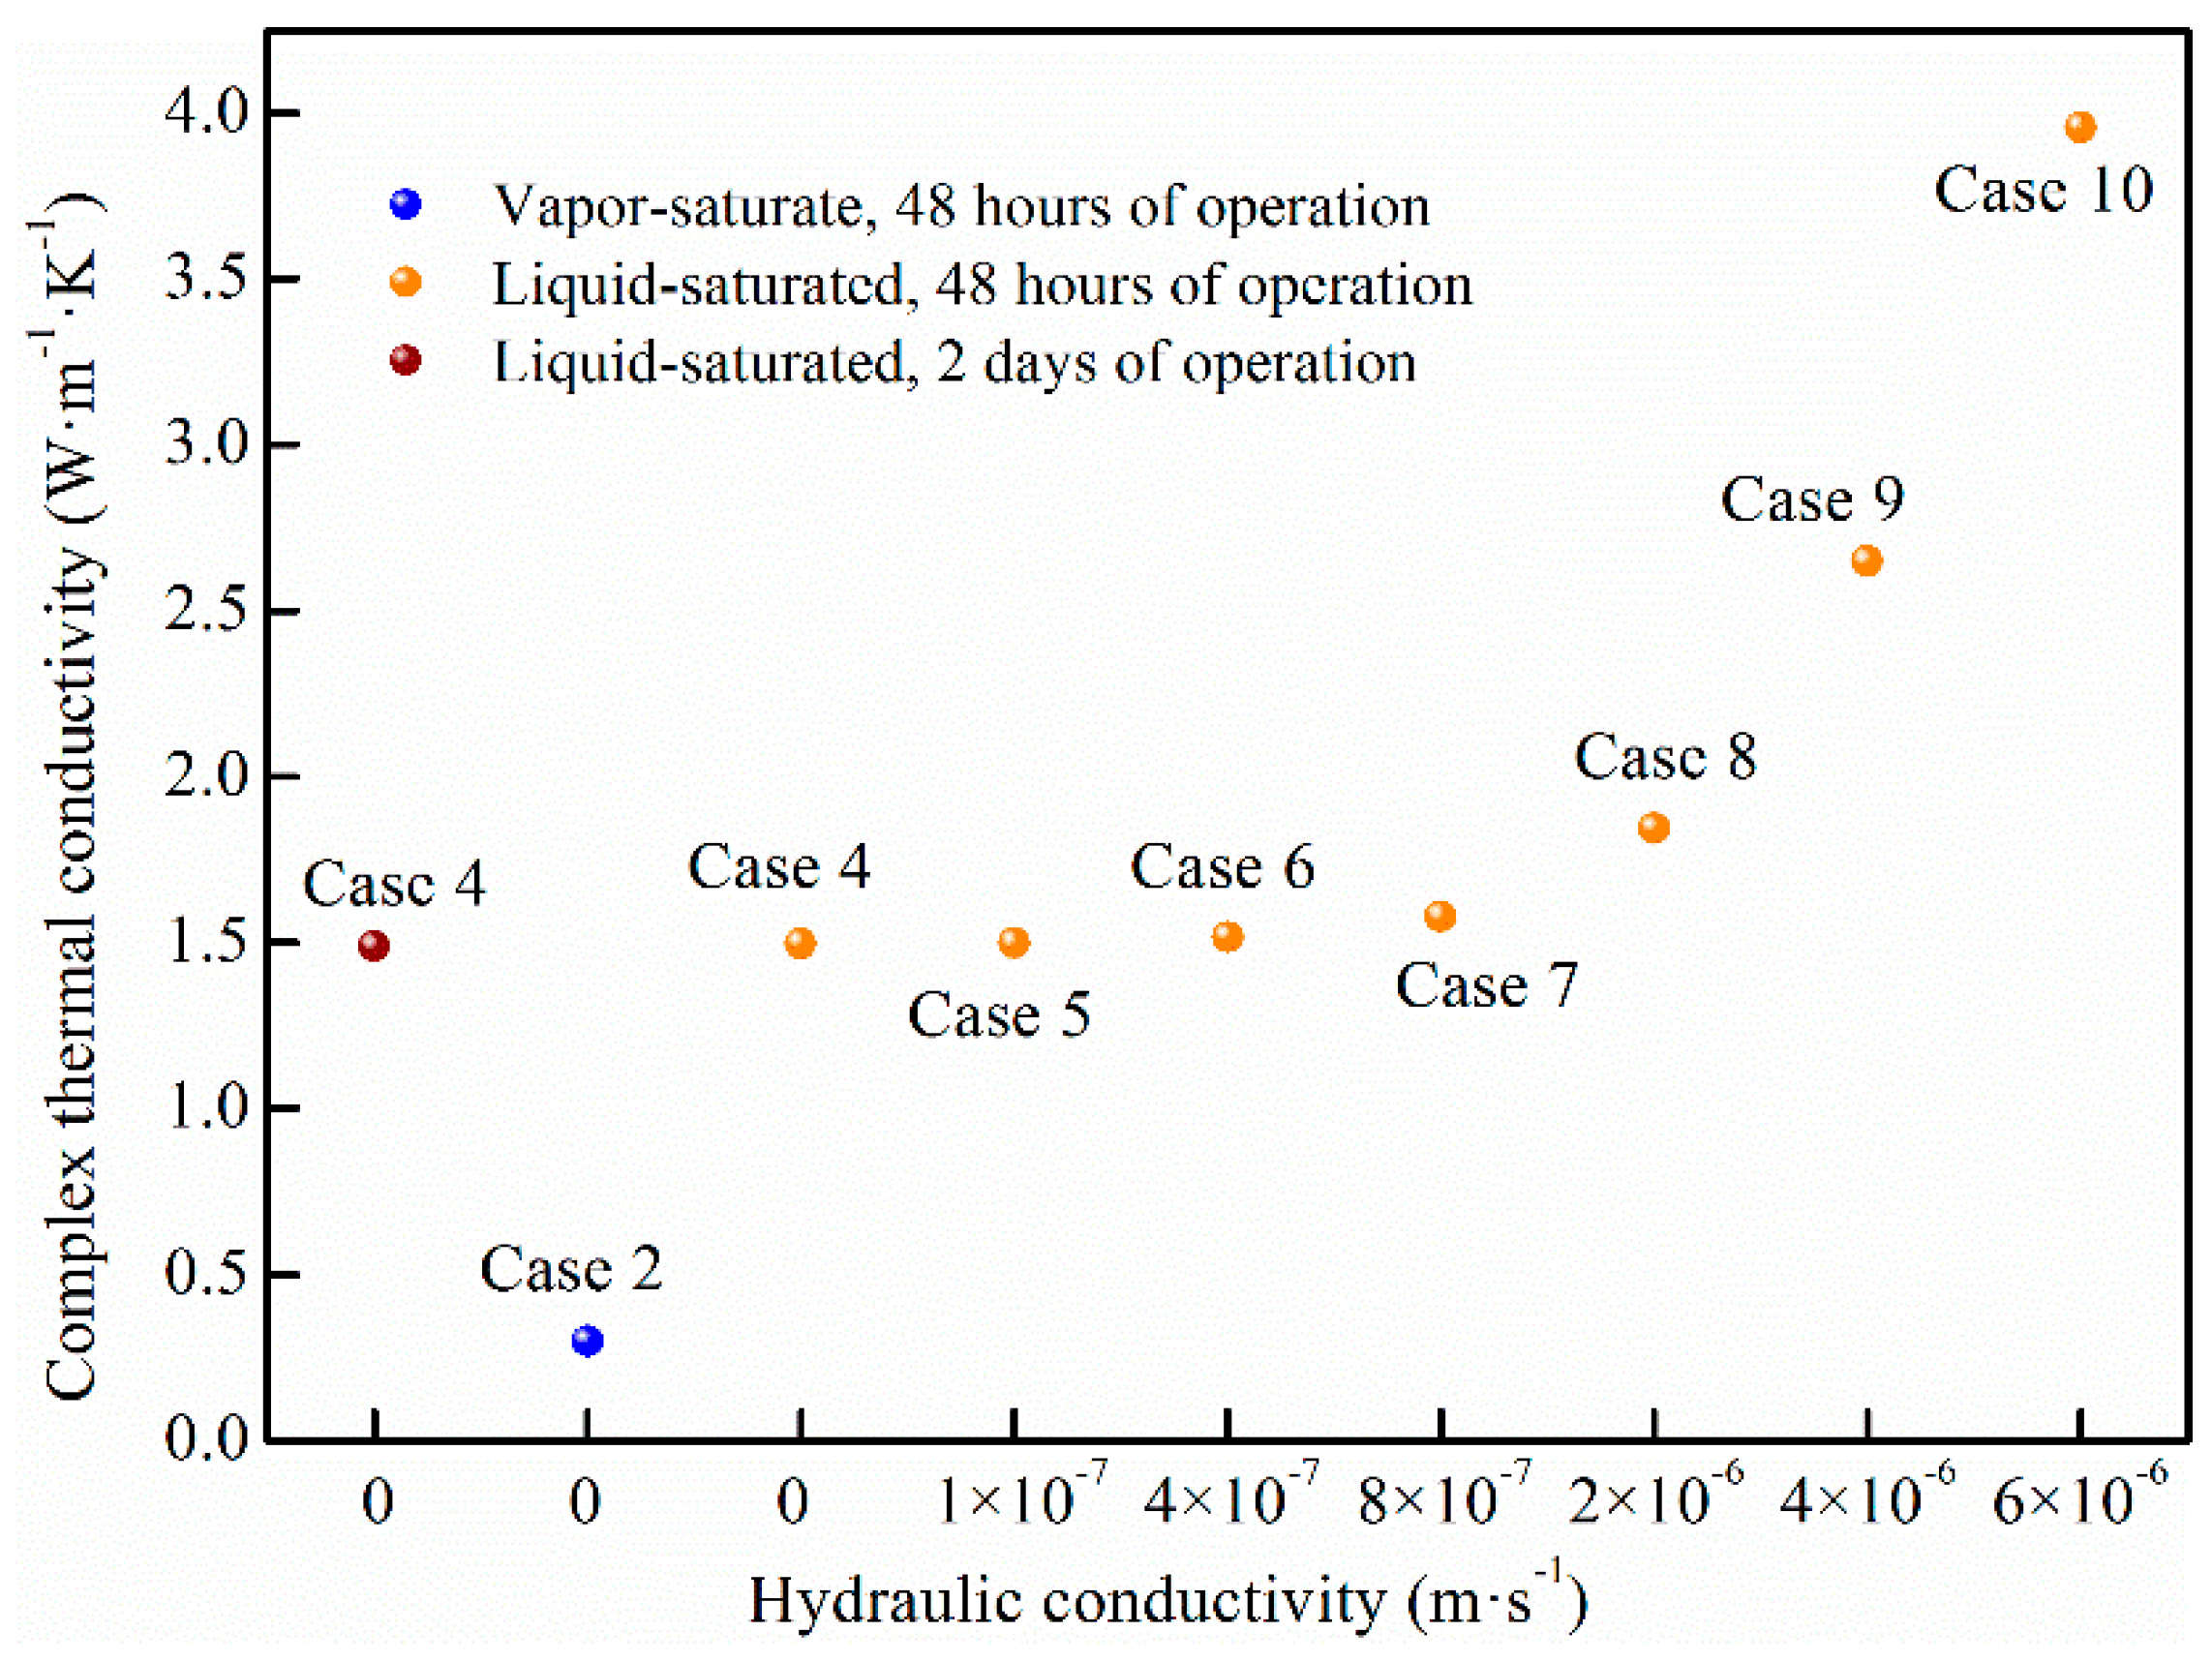
Figure 15.
Complex thermal conductivities of CPB with different hydraulic conductivities.
From Figure 15, it is also suggested that the complex thermal conductivities of CPB are increased with the increase in hydraulic conductivity, especially when the seepage velocity is above 10−7 m/s. In Cases 8 to 10, seepage velocities are 2 × 10⁻⁶, 4 × 10⁻⁶, and 6 × 10⁻⁶ m/s, while the corresponding complex thermal conductivities of CPB are 1.843, 2.649, and 3.957 W/(m·K), respectively, showing an obvious increasing trend. This is because with the velocity enhancement of the seepage flow, the effect of convective heat transfer becomes dominant.
4.3. Effects of the Operation Duration on Heat Exchange Performance of CPB
Figure 16a shows the temperature field of cross-section Z = 0 under 28 days of operation in Case 5. In comparison with Figure 10a and Figure 12d, a larger thermal influencing region of the HET can be found in Figure 16a, indicating a more thorough heat exchange between CPB and tubes. However, in view of the economical property of the system, a long operation duration does not mean a better exchange performance. In Figure 16b, the variation of average water temperature for 28 days in Case 5 is demonstrated. According to the fitting curve of Tf–lnt expressed in Figure 16b, the complex thermal conductivity of CPB after 28 days of operation is calculated to be 1.488 W/(m·K), with little difference from 1.498 W/(m·K) obtained in Case 5, wherein the operation duration is 48 h (as shown in Figure 15). This denotes that the operation duration has no significant effect on the complex thermal conductivity of CPB once the TRT simulation achieves stable operation, manifesting the feasibility of operation duration setting (i.e., 48 h) in this simulation for the evaluation of the complex thermal conductivity of CPB.
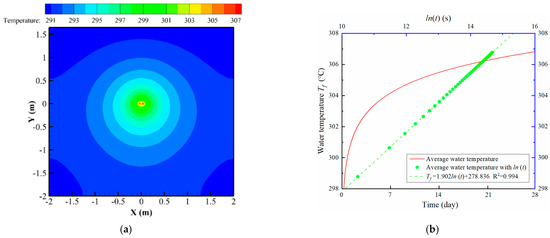
Figure 16.
Thermal performance of CPB with a hydraulic conductivity of 1 × 10⁻⁷ m/s after 28 days of operation. (a) Temperature contour of cross-section Z = 0; (b) variation of average water temperature in the HET over time.
5. Discussion
Considerable heat energy is consumed in buildings in mining areas for both production and daily life. The abundant geothermal energy contained in mining areas could be adopted as a supplementary heat source for the heat demand of users in mining [9,10,11]. The CMBG system is an efficient solution for achieving the collaborative exploitation of mines and geothermal energy [20]. For this system, the thermal conductivity and heat exchange performance of CPB are crucial factors for thermal exploitation performance [24,32,33,34]. Furthermore, due to the sedimentary characteristic of slurry in the backfilling process, the thermal conductivities in solidified CPB are nonuniformly distributed along both the vertical and horizontal directions. In view of the above factors, the heat exchange performance of CPB under different boundary conditions was evaluated, while the nonuniformly distributed thermal properties in CPB were fully considered.
According to the results, the porosity had significant effects on the heat exchange performance of CPB. For Cases 1 to 3 shown in Figure 11, as the porosities increased, the corresponding complex thermal conductivities were calculated to be 0.324, 0.298, and 0.273 W/(m·K), respectively, with a maximal reduction rate of 18%. This indicated that the increase in porosity exerted negative effects on the heat exchange performance of CPB. Since CPB is composed of different ingredients, the proportion of each component is highly relevant to the porosity distribution in CPB. Thus, in the practical design process, component proportions in CPB should be well designed for the thermal performance optimization of the CMBG system. Besides, the seepage flow also showed an obvious influence on the heat transfer performance of CPB. Results in this study illustrated that the heat transfer performance of CPB improved with the increase in seepage velocity, especially when the seepage velocity exceeded 2 × 10⁻⁶ m/s (as shown in Figure 15). When the seepage velocity rose from 2 × 10⁻⁶ to 6 × 10⁻⁶ m/s in Cases 8 to 10, the thermal conductivity of CPB achieved a 114% increase from 1.843 to 3.957 W/(m·K). Furthermore, due to the seepage flow, the thermal influencing radius of the HET was no longer symmetrically distributed along the seepage flow direction, causing a larger thermal influencing region under the HET in comparison with that above the HET (as shown in Figure 12). For the above reasons, in the practical engineering design of the CMBG system, the determination of layout parameters of the HET (such as tube pitch) should fully take into account the effect of seepage flow, avoiding the thermal interference among multiple HETs.
6. Conclusions
In this study, a validated numerical model was established to evaluate the heat exchange performance of CPB under stratified distribution conditions. Based on this model, the thermal influencing region of the HET and heat transfer performance of CPB were investigated under different porosities and hydraulic conductivities.
The heat exchange performance of CPB with different porosities was evaluated, and it was found that CPB with a higher porosity exhibits a weaker heat conductive performance. In actual conditions, porosities in CPB are nonuniformly distributed; the complex thermal conductivity of CPB obtained by the arithmetic average method could not represent its actual value. The proposed model provides an effective method for the prediction of the complex thermal conductivity of CPB. Seepage flow has an enhancement effect on the heat exchange between the HET and its surrounding CPB. The heat transfer performance of CPB strengthens with the increase in hydraulic conductivity. In addition, in conditions with seepage flow, the CPB temperature field of the vertical cross-section is no longer evenly distributed along the plumb direction. Thus, the seepage flow effect should be fully considered in the determination of HET arrangement, avoiding the thermal interference caused by the overlap of the thermal influencing radius of the HET.
The complex thermal conductivity of CPB cannot be accurately calculated by an arithmetic average method. The values obtained by the proposed simulation model and the arithmetic average method should be comparatively analyzed and discussed in the following work. In addition, the existing fractures in CPB could also affect the heat exchange performance of CPB; the influence of the fractures on the heat transfer performance of the CMBG system also needs to be evaluated in the future.
Author Contributions
Conceptualization, C.H.; data curation, S.Z. and X.Z.; formal analysis, B.Z.; funding acquisition, C.H.; investigation, X.Z. and P.T.; software, S.Z. and Y.Z.; writing—original draft, S.L. All authors have read and agreed to the published version of the manuscript.
Funding
The work described in this paper was supported by the National Natural Science Foundation of China (Grant Nos. 52004207, 51674188, and 52104148), the Chinese Postdoctoral Science Foundation (No. 2021M692594), and a Natural Science Basic Research Plan of Shaanxi Province of China (No. 2015JQ5187).
Data Availability Statement
The data that support the findings of this study are available from the corresponding author upon reasonable request.
Acknowledgments
We would like to express our gratitude to Zhiyu Fang for his assistance.
Conflicts of Interest
The authors declare no conflict of interest.
Nomenclature
| CMBG | combined mine backfill–geothermal |
| CPB | cemented paste backfill body |
| GSHP | ground source heat pump |
| HET | heat exchange tube |
| TRT | thermal response test |
| Tf | average fluid temperature in the buried pipe |
| ql | heat flux density of the linear heat source per unit length |
| λc | thermal conductivity of CPB |
| t | operation time |
| αs | thermal diffusivity of CPB |
| rb | distance from the line heat source |
| Rb | thermal resistance |
| γ | Euler constant |
| T0 | initial temperature of CPB |
| Dp | average particle size of CPB |
| n | porosity of CPB |
| 1/k | viscous resistance coefficient |
| C2 | inertial resistance coefficient |
| Ef | energy of the fluid phase |
| Es | energy of the solid phase |
| p | pressure term in fluid energy |
| λeff | effective thermal conductivity |
| λf | thermal conductivity of fluid phase |
| λs | thermal conductivity of solid phase |
| P1 | porous zone 1 |
| P2 | porous zone 2 |
| P3 | porous zone 3 |
| IGSHPA | International Ground Source Heat Pump Association |
References
- Zhou, X.X.; Feng, C. The impact of environmental regulation on fossil energy consumption in China: Direct and indirect effects. J. Clean. Prod. 2017, 142, 3174–3183. [Google Scholar] [CrossRef]
- Johnston, I.W.; Narsilio, G.A.; Colls, S. Emerging geothermal energy technologies. KSCE J. Civ. Eng. 2011, 15, 643–653. [Google Scholar] [CrossRef]
- Zhao, X.G.; Wan, G. Current situation and prospect of China’s geothermal resources. Renew. Sustain. Energy Rev. 2014, 32, 651–661. [Google Scholar] [CrossRef]
- Luis, P.L.; Jose, O.; Christine, P. A review on buildings energy consumption information. Energy Build. 2008, 40, 394–398. [Google Scholar]
- Huang, Y.; Niu, J.L.; Chung, T.M. Study on performance of energy efficient retrofitting measures on commercial building external walls in cooling-dominant cities. Appl. Energy 2013, 103, 97–108. [Google Scholar] [CrossRef]
- Johnstone, N.; Haščič, I.; Popp, D. Renewable Energy Policies and Technological Innovation: Evidence Based on Patent Counts. Environ. Resour. Econ. 2010, 45, 133–155. [Google Scholar] [CrossRef]
- Kong, X.R.; Deng, Y.L.; Li, L.Y.; Gong, W.S.; Cao, S.J. Experimental and numerical study on thermal performance of ground source heat pump with a set of designed buried pipes. Appl. Therm. Eng. 2017, 114, 110–117. [Google Scholar] [CrossRef]
- Wang, X.; Li, Z.; Li, D.Y. Energy Efficiency Analysis and Evaluation of GSHP in Operation. Procedia Eng. 2017, 205, 1364–1369. [Google Scholar] [CrossRef]
- Jessop, A.M.; Macdonald, J.K.; Spence, H. Clean Energy from Abandoned Mines at Springhill, Nova Scotia. Energy Sources 1995, 17, 93–106. [Google Scholar] [CrossRef]
- Hall, A.; Scott, J.A.; Shang, H. Geothermal energy recovery from underground mines. Renew. Sustain. Energy Rev. 2011, 15, 916–924. [Google Scholar] [CrossRef]
- Watzlaf, G.R.; Ackman, T.E. Underground Mine Water for Heating and Cooling using Geothermal Heat Pump Systems. Mine Water Environ. 2006, 25, 1–14. [Google Scholar] [CrossRef]
- Philippe, G.; Abdoulaye, G.; Haïkel, B.H.; Hassen, B.; Farid, L. Installation of a thermal energy storage site in an abandoned mine in Picardy (France). Part 1: Selection criteria and equipment of the experimental site. Environ. Earth Sci. 2019, 174, 1–16. [Google Scholar] [CrossRef]
- Ghoreishi-Madiseh, S.A.; Ghomshei, M.M.; Hassani, F.P.; Abbasy, F. Sustainable heat extraction from abandoned mine tunnels: A numerical model. J. Renew. Sustain. Energy 2012, 4, 259–265. [Google Scholar] [CrossRef]
- Preene, M.; Younger, P.L. Can you take the heat?–Geothermal energy in mining. Min. Technol. 2014, 123, 107–118. [Google Scholar] [CrossRef] [Green Version]
- Ramos, E.P.; Breede, K.; Falcone, G. Geothermal heat recovery from abandoned mines a systematic review of projects implemented worldwide and a methodology for screening new projects. Environ. Earth Sci. 2015, 73, 6783–6795. [Google Scholar] [CrossRef]
- Ghoreishi-Madiseh, S.A.; Hassani, F.P.; Mohammadian, A.; Radziszewski, P.H. A transient natural convection heat transfer model for geothermal borehole heat exchangers. J. Renew. Sustain. Energy 2013, 5, 043104. [Google Scholar] [CrossRef]
- Kranz, K.; Dillenardt, J. Mine water utilization for geothermal purposes in Freiberg, Germany determination of hydrogeological and thermophysical rock parameters. Mine Water Environ. 2010, 29, 68–76. [Google Scholar] [CrossRef]
- Bi, S.K.; Wan, Z.J.; Zhang, H.W. Research on development and utilization of geothermal resources in Tangkou Coal Mine. Coal Sci. Technol. 2018, 46, 208–214. [Google Scholar]
- Ghoreishi-Madiseh, S.A.; Hassani, F.; Abbasy, F. Numerical and experimental study of geothermal heat extraction from backfilled mine stopes. Appl. Therm. Eng. 2015, 90, 1119–1130. [Google Scholar] [CrossRef]
- Liu, L.; Xin, J.; Zhang, B.; Zhang, X.Y.; Wang, M.; Qiu, H.F.; Chen, L. Basic theories and applied exploration of functional backfill in mines. J. China Coal Soc. 2018, 43, 1811–1820. [Google Scholar] [CrossRef]
- Brackebusch, F.W. Basics of paste backfill systems. Int. J. Rock Mech. Min. Sci. Geomech. Abstr. 1995, 32, 85–88. [Google Scholar]
- Abbasy, F. An Investigation into Application of Geothermal Energy in Underground Mines. Ph.D. Thesis, Department of Mining and Materials, McGill University, Montreal, QC, Canada, 2014; pp. 203. [Google Scholar]
- Ghoreishi-Madiseh, S.A. Numerical and Experimental Study of Geothermal Energy Extraction from Underground Mines. Ph.D. Thesis, Department of Mechanical Engineering, McGill University, Montreal, QC, Canada, 2014; p. 135. [Google Scholar]
- Fall, M.; Benzaazoua, M. Modeling the effect of sulphate on strength development of paste backfill and binder mixture optimization. Cem. Concr. Res. 2005, 35, 301–314. [Google Scholar] [CrossRef]
- Kesimal, A.; Yilmaz, E.; Ercikdi, B.; Alp, I.; Deveci, H. Effect of properties of tailings and binder on the short-and long-term strength and stability of cemented paste backfill. Mater. Lett. 2005, 59, 3703–3709. [Google Scholar] [CrossRef]
- Yilmaz, E.; Benzaazoua, M.; Belem, T.; Bussière, B. Effect of curing under pressure on compressive strength development of cemented paste backfill. Miner. Eng. 2009, 22, 772–785. [Google Scholar] [CrossRef]
- Zhang, J.X.; Wang, B.; Song, B. Composition design and performance characterization of a novel backfilling concrete derived from urban construction waste. J. Clean. Prod. 2018, 190, 508–516. [Google Scholar] [CrossRef]
- Nasir, O.; Fall, M. Coupling binder hydration, temperature and compressive strength development of underground cemented paste backfill at early ages. Tunn. Undergr. Space Technol. 2010, 25, 9–20. [Google Scholar] [CrossRef]
- Xu, W.B.; Pang, W.D.; Ding, M.L. Experiment on evolution of microstructures and long-term strength model of cemented backfill mass. J. Cent. South Univ. 2015, 46, 2333–2341. [Google Scholar]
- Li, B.; Yin, H.G.; Mao, X.B.; Li, Y.; Zhang, L.Y.; Liu, R.X.; Qiu, P.T. Macroscopic and microscopic fracture features of concrete used in coal mine under chlorine salt erosion. Int. J. Min. Sci. Technol. 2016, 26, 455–459. [Google Scholar] [CrossRef]
- Koohestani, B.; Belem, T.; Koubaa, A.; Bussière, B. Experimental investigation into the compressive strength development of cemented paste backfill containing Nano-silica. Cem. Concr. Compos. 2016, 72, 180–189. [Google Scholar] [CrossRef]
- Kavanaugh, S.P. Field tests for ground thermal properties-methods and impact on ground-source heat pump design. ASHRAE Trans. 2000, 106, 851–855. [Google Scholar]
- Abbasy, F.; Hassani, F.P.; Ghoreishi-Madiseh, S.A.; Côté, J.; Nokken, M.R. An Experimental Study on the Effective Parameters of Thermal Conductivity of Mine Backfill. Heat Transf. Eng. 2014, 35, 1209–1224. [Google Scholar] [CrossRef]
- Célestin, J.C.; Fall, M. Thermal conductivity of cemented paste backfill material and factors affecting it, International Journal of Mining. Reclam. Environ. 2009, 23, 274–290. [Google Scholar] [CrossRef]
- Wang, X.M.; Xiao, W.G.; Wang, X.W.; Xiao, Z.Z. Study on Rheological Properies of Full Tailing Paste Filling Slurry of Jinchuan Mine. Min. Metall. Eng. 2002, 22, 13–16. [Google Scholar]
- Chen, Q.S.; Zhang, Q.L.; Fourie, A.; Chen, X.; Qi, C.C. Experimental investigation on the strength characteristics of cement paste backfill in a similar stope model and its mechanism. Constr. Build. Mater. 2017, 154, 34–43. [Google Scholar] [CrossRef]
- Lee, C.K.; Lam, H.N. A modified multi-ground-layer model for borehole ground heat exchangers with an inhomogeneous groundwater flow. Energy 2012, 47, 378–387. [Google Scholar] [CrossRef]
- Florides, G.A.; Christodoulides, P.; Pouloupatis, P. Single and double U-tube ground heat exchangers in multiple-layer substrates. Appl. Energy 2013, 102, 364–373. [Google Scholar] [CrossRef]
- Austin, W.A. Development Of an In-Situ System for Measuring Ground Thermal Properties. Ashrae Trans. 2013, 106, 365–379. [Google Scholar]
- Tao, W.Q. Recent Development of Computational Heat Transfer; Science Press: China, Beijing, 2000. [Google Scholar]
- Carslaw, H.S.; Jaeger, J.C. Conduction of Heat in Solids; University Press: Oxford, UK, 1959. [Google Scholar]
- Zhang, X.P.; Han, Z.W.; Ji, Q.; Zhang, H.Z.; Li, X.M. Thermal response tests for the identification of soil thermal parameters: A review. Renew. Energy 2021, 173, 1123–1135. [Google Scholar] [CrossRef]
- Li, Y.; Han, X.; Zhang, X.S.; Geng, S.B.; Li, C.F. Study the performance of borehole heat exchanger considering layered subsurface based on field investigations. Appl. Therm. Eng. 2017, 126, 296–304. [Google Scholar] [CrossRef]
- Fall, M.; Adrien, D.; Célestin, J.C.; Pokharel, M. Tourém Saturated hydraulic conductivity of cemented paste backfill. Miner. Eng. 2009, 22, 1307–1317. [Google Scholar] [CrossRef]
- ASHRAE. 2007 ASHRAE Handbook on HVAC Applications. Atlanta: American Society of Heating, Refrigerating and Air-Conditioning Engineers, Inc.; ASHRAE: Atlanta, GA, USA, 2007. [Google Scholar]
- Zhao, P.; Li, X.Z.; Zhang, Y.; Liu, K.; Lu, M.H. Stratified thermal response test measurement and analysis. Energy Build. 2020, 215, 109865. [Google Scholar] [CrossRef]


Publisher’s Note: MDPI stays neutral with regard to jurisdictional claims in published maps and institutional affiliations. |
© 2021 by the authors. Licensee MDPI, Basel, Switzerland. This article is an open access article distributed under the terms and conditions of the Creative Commons Attribution (CC BY) license (https://creativecommons.org/licenses/by/4.0/).