Article

Lifecycle Assessment of a Non-Phase-Transition Drying Pyrolysis and Mass Conversion Technology

School of Mechanical Engineering, Institute of New Rural Development, Tongji University, Shanghai 201804, China
*
Authors to whom correspondence should be addressed.
Energies 2021, 14(21), 7394; https://doi.org/10.3390/en14217394
Submission received: 15 October 2021 / Revised: 30 October 2021 / Accepted: 1 November 2021 / Published: 5 November 2021

Abstract

:
A lifecycle model was established to explore the efficiency, economy, and greenhouse gas emissions of a non-phase-transition drying pyrolysis and mass conversion technology, based on the principle of lifecycle assessment. The evaluation scope included straw collection and transportation, drying and crushing, biomass pyrolysis, charcoal processing, and waste heat utilization. The results show that the energy output/input ratio for non-phase-transition drying pyrolysis was 20.43, and the energy efficiency was high. The pure profit from treating wet straw was USD 45.32 per ton, the profit margin of sales was 52.11%, and the economic benefit was high. The equivalent emission of CO2 was 34.10 g·MJ−1, demonstrating high environmental benefits. Therefore, non-phase-transition drying pyrolysis and mass conversion technology is a potential biomass utilization technology with energy, economic, and ecological benefits.

Graphical Abstract

1. Introduction

Since the development of a large number of fossil fuels in the industrial revolution, one of the most serious environmental problems caused by the expansion of human production activities, and living areas brought about by the explosion in the global population, is the global greenhouse effect and the resulting climate change. This is due to the rising concentrations of greenhouse gases in the atmosphere, particularly carbon dioxide, which is expected to double by the end of the 21st century [1,2]. It has become a global consensus that the mitigation of global warming and climate change requires a significant reduction in the concentrations of greenhouse gases (GHGs) in the atmosphere.
With the rapid growth of agricultural and forestry products in China, the treatment and utilization of straw biomass has become a huge challenge. According to statistics, nearly a quarter of the crop straws in China are discarded or burned in the open, resulting in a waste of resources and environmental pollution [3]. Xu et al. [4] estimated the emissions from straw burning in three typical regions in China in 2016. The results showed that the carbon monoxide (CO) and PM2.5 emissions in northeast China were 3.63 × 10⁶ and 6.96 × 10⁵ tons, while those in Chengdu and Chongqing were 9.77 × 10⁵ and 1.36 × 10⁵ tons, and those in Guangdong were 1.24 × 10⁵ and 1.19 × 10⁴ tons, respectively. The burning of straws in the open accounts for 20.80% of the air pollutants in China. In addition, field burning often leads to the loss of soil nutrients [3]. Returning biomass residues directly to the field is a simple treatment for improving cropping systems. However, a questionnaire survey on the impact of straw incorporation on agricultural ecosystems in northern Chinese cities showed that direct straw incorporation may aggravate pest attack and plant diseases, resulting in additional application costs of nearly 46.99–70.48 USD·ha−1·yr−1 (the exchange rate is USD 1 = CNY 6.385) [5]. Therefore, it remains important to find a better way to utilize straw biomass in China’s development process.
In recent years, straw biomass energy development technology has developed rapidly, with a variety of processes, such as biomass power generation [6], the preparation of biodiesel [7], the preparation of biomass fuel [8], biomass biogas [9], biomass hydrogen production [10], and the liquefaction of biomass [11], which has played a positive role in replacing fossil energy, preventing environmental pollution, and realizing economic benefits [12]. The pyrolysis and hydrorefining of gasoline and diesel from biomass is one of the technologies for producing hydrocarbon fuels from biomass, which is considered to be a biomass renewable process with the most development potential [13]. The components of biocrude oil are complex and difficult to directly utilize, so it can only be used after mass conversion or refining, and the hydrorefining of bio-oil is the most common method [14,15,16]. At present, there is non-phase-transition drying pyrolysis and mass conversion technology in China, which can transform waste straw and other biomass into biogas and diesel with high added value and high efficiency. It has great potential for industrialization. Therefore, it is necessary to carry out scientific quantitative evaluation of the economic benefits and energy consumption of this technology, and clarify the impact of product utilization and by-products on the environment [17].
Full lifecycle assessment (LCA) is a comprehensive evaluation method for energy consumption, economy, and environmental impact in the full lifecycles of products. For the evaluation of the biomass utilization, there exists a consensus among scholars around using the LCA method. The International Standard Organization (ISO) has incorporated LCA into the ISO 14000 environmental management system. Among them, the ISO 14040 [18] and 14044 standards [19] unify LCA work at the international level by establishing principles and frameworks, requirements, and guidelines. ISO 14040 [18] divides LCA research into four phases: the definition of the objectives and scope, lifecycle inventory analysis, life impact assessment, and the interpretation of the results. The lifecycle impact assessment (LCIA) analyzes the input and output streams from the product or system under study and categorizes the impacts of these streams into various environmental impact categories. Internationally, there are various LCIA methods, such as CML, EDIP, and RECIPE, and many different tools have been developed to automate this calculation.
The LCA method can be used to analyze the total input, output, and potential environmental impacts of biomass utilization during the whole lifecycle. For example, transportation, production, and other related processes during the lifecycle may pose additional environmental burdens. LCA is an internationally recognized method for assessing the sustainability of biomass fuels [20]. The LCA method has been developed [21,22,23,24] to investigate the effects of different biomass energy utilization systems on the environment. Den Boer et al. [21] calculated the environmental effects of the pruning, residue harvesting, cutting, and transportation of straws to the power plant by using the LCA approach. LCA and techno-economic analysis (TEA) were applied to assess the economic feasibility and environmental benefits of adopting multiple biomass feedstocks for bioenergy products through three different technological pathways (the production of pellets, biomass-based electricity, and pyrolysis bio-oil) [22]. Vienescu et al. [23] also used the LCA method to analyze the processes for producing synthetic fuels from biomass using thermochemical treatments and other upgrade pathways. An environmental, social, and economic analysis of the crop residue utilization in China was performed by Zhang et al. [24], and the environmental lifecycle assessment (E-LCA), lifecycle cost (LCC), and social lifecycle assessment (S-LCA) were all used.
Interpretation of results: in this phase, the LCIA results are analyzed to draw conclusions and to find relevant knowledge sought through the LCA study. A series of tests are required to identify problems and evaluate data. These inspections are required by the ISO to verify that the assessment is transparent and consistent with the objectives and scope and that the data used are accurate and complete. The evaluator also needs to perform additional checks based on the actual situation to ensure the accuracy of the LCA.
Since the birth of LCA in 1950s, it has been gradually applied to the fields of environment, economy, and technology [25]. Compared with that in Western countries, the study of lifecycle theory in China started late and, therefore, is less well-established [26]. In the field of renewable energy, Chinese scholars have carried out lifecycle assessments in different dimensions for technologies such as biogas production [27], fuel ethanol production [28], and aviation kerosene production [29], but a general unified and efficient evaluation framework has not been formed, and it is difficult to conduct a technical comparison between different evaluation results [17,30]. Based on the principle of lifecycle assessment analysis, this paper will evaluate the production cost, energy conversion, and greenhouse gas emission of a non-phase0transition drying pyrolysis and mass conversion technology and put forward a biomass pyrolysis hydrofining gasoline and diesel technology with good energy potential advantages, to provide a reference basis for correctly evaluating the sustainable development of straw biomass conversion technology in China. The purpose of this study was to analyze the economic and energy benefits of a non-phase-transition drying pyrolysis and mass conversion technology for treating waste straw, using the LCA method.

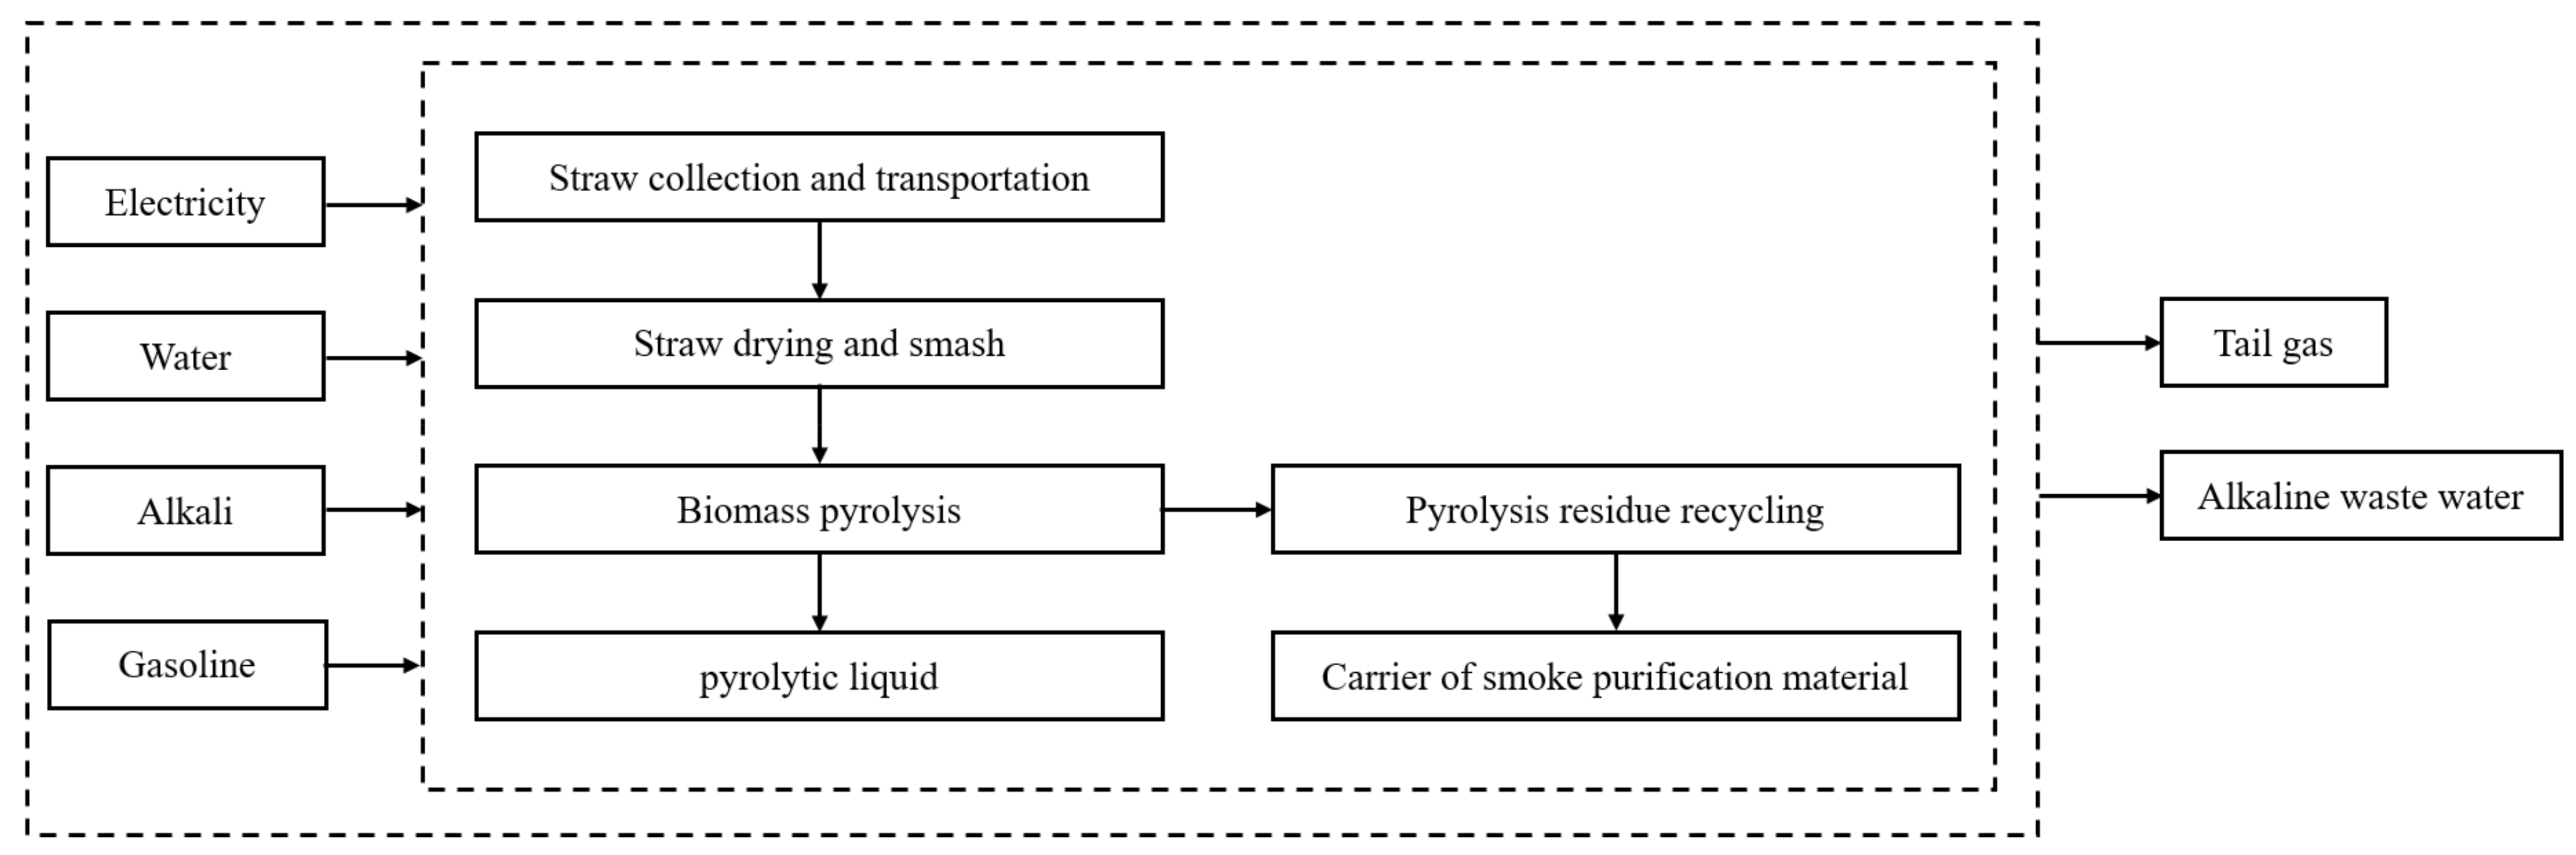
2. Non-Phase-Transition Drying Pyrolysis and Mass Conversion Technology

Non-phase-transition drying pyrolysis and mass conversion technology is one of the technologies for producing hydrocarbon fuels from biomass. It is a process in which biomass is decomposed into coke, bio-oil, and non-condensing vapor at high temperature in the absence of oxygen or hypoxia [31]. Non-phase-transition drying pyrolysis and mass conversion technology can transform low-grade biomass such as straw (the heat value is about 12–15 MJ·kg−1) into a large amount of high-grade bio-oil (the heat value is about 15–18 MJ·kg−1), which is a biomass comprehensive utilization process with great development prospects [32,33]. The process is shown in Figure 1.

3. Lifecycle Assessment Processes

The whole lifecycle assessment of a non-phase-transition drying pyrolysis and mass conversion technology should firstly be established, and the assessment indices within this framework should be defined; the energy, economic, and environmental data to be counted at each stage should be identified, and an assessment list should be made. The energy, economic, and environmental benefits of the whole lifecycle of a non-phase-transition drying pyrolysis and mass conversion should be evaluated by index calculation, and the main influencing factors for energy, economy, and environment of this process should be pointed out. Finally, the comprehensive benefits of the application of a non-phase-transition drying pyrolysis and mass conversion technology for straw biomass should be assessed. The LCA model covers all the stages of the whole lifecycle, including environmental impact indicators such as energy consumption and carbon emissions. The LCA evaluation method avoids the omission of environmental issues between stages and impact types. This work is based on the technological innovation of the non-phase-transition drying pyrolysis and mass conversion technology and waste heat utilization to carry out lifecycle assessment, which is significantly different from the existing LCA methods. Moreover, the LCA method proposed in this work focuses on the technology application process and calculates carbon emissions, which is different from the calculation focus of the existing LCA method.

3.1. Modeling Establishment

In the process of LCA, the system boundary includes all the necessary processes, and all the products need to be described as a system. Therefore, in terms of determining the system boundary, the lifecycle assessment of a non-phase-transition drying pyrolysis and mass conversion technology includes straw collection and transportation, drying and crushing, biomass pyrolysis and pyrolysis-residue reuse, and waste heat utilization. System boundaries define the scope of the LCA and determine the process of study and the energy and matter flows to be considered in the analysis. Based on the information of the system boundary, the processes, input, and output of the system are determined. The lifecycle system boundary diagram for non-phase-transition drying pyrolysis and mass conversion technology is shown in Figure 2.
Due to the complexity of the process system, the following hypotheses are proposed in this paper for the convenience of research and analysis:
(1)
Indirect effects with little impact in the process of production, such as plant construction, equipment manufacturing and recycling, equipment efficiency, labor, and other impacts on the environment were excluded. Since the purpose of this process is to deal with the excess waste straw in agricultural production, crop planting and other processes were not considered.
(2)
The straw collection radius of this system was considered to be 10 km.
(3)
The raw material of this system was wet straw with a moisture content of 35% (mass fraction). After drying, its moisture content decreased to about 10% (mass fraction), making it “dry straw”.
(4)
The heat required for biomass drying and pyrolysis in this system was provided by the re-combustion of non-condensing vapor generated during the pyrolysis process, and the exhaust gas after the combustion of non-condensing vapor was directly discharged into the environment.
(5)
The final product of this process was the flue gas purification material, produced after the pyrolysis of biomass and the reuse of the pyrolysis residue, without considering the subsequent pyrolysis liquid hydrogenation and other technological processes.
(6)
This process was calculated with a 30,000-ton straw/year device with a 10% moisture content (the scale of a single set of devices), and the total scale was 60,000 tons.

3.2. The Assessment Indices

(1)
Net energy and energy output/input ratio: the net energy is the difference between the energy released in the application of the product produced by non-phase-transition drying pyrolysis and mass conversion and the total energy consumed in the lifecycle process for the non-phase-transition drying pyrolysis and mass conversion. The energy output/input ratio is the ratio of the energy released in the application of the product produced by pyrolysis and mass conversion and the total energy consumed in the non-phase-transition drying pyrolysis and mass conversion.
N E = B E H E i
η = B E H E i
NE is the net energy, MJ·t−1; BE is the heat value of the biomass pyrolysis liquid, MJ·t−1; HEi is the energy consumption of the ith substance during the lifecycle of the biomass pyrolysis and mass conversion, MJ·t−1; η is the energy output/input ratio.
(2)
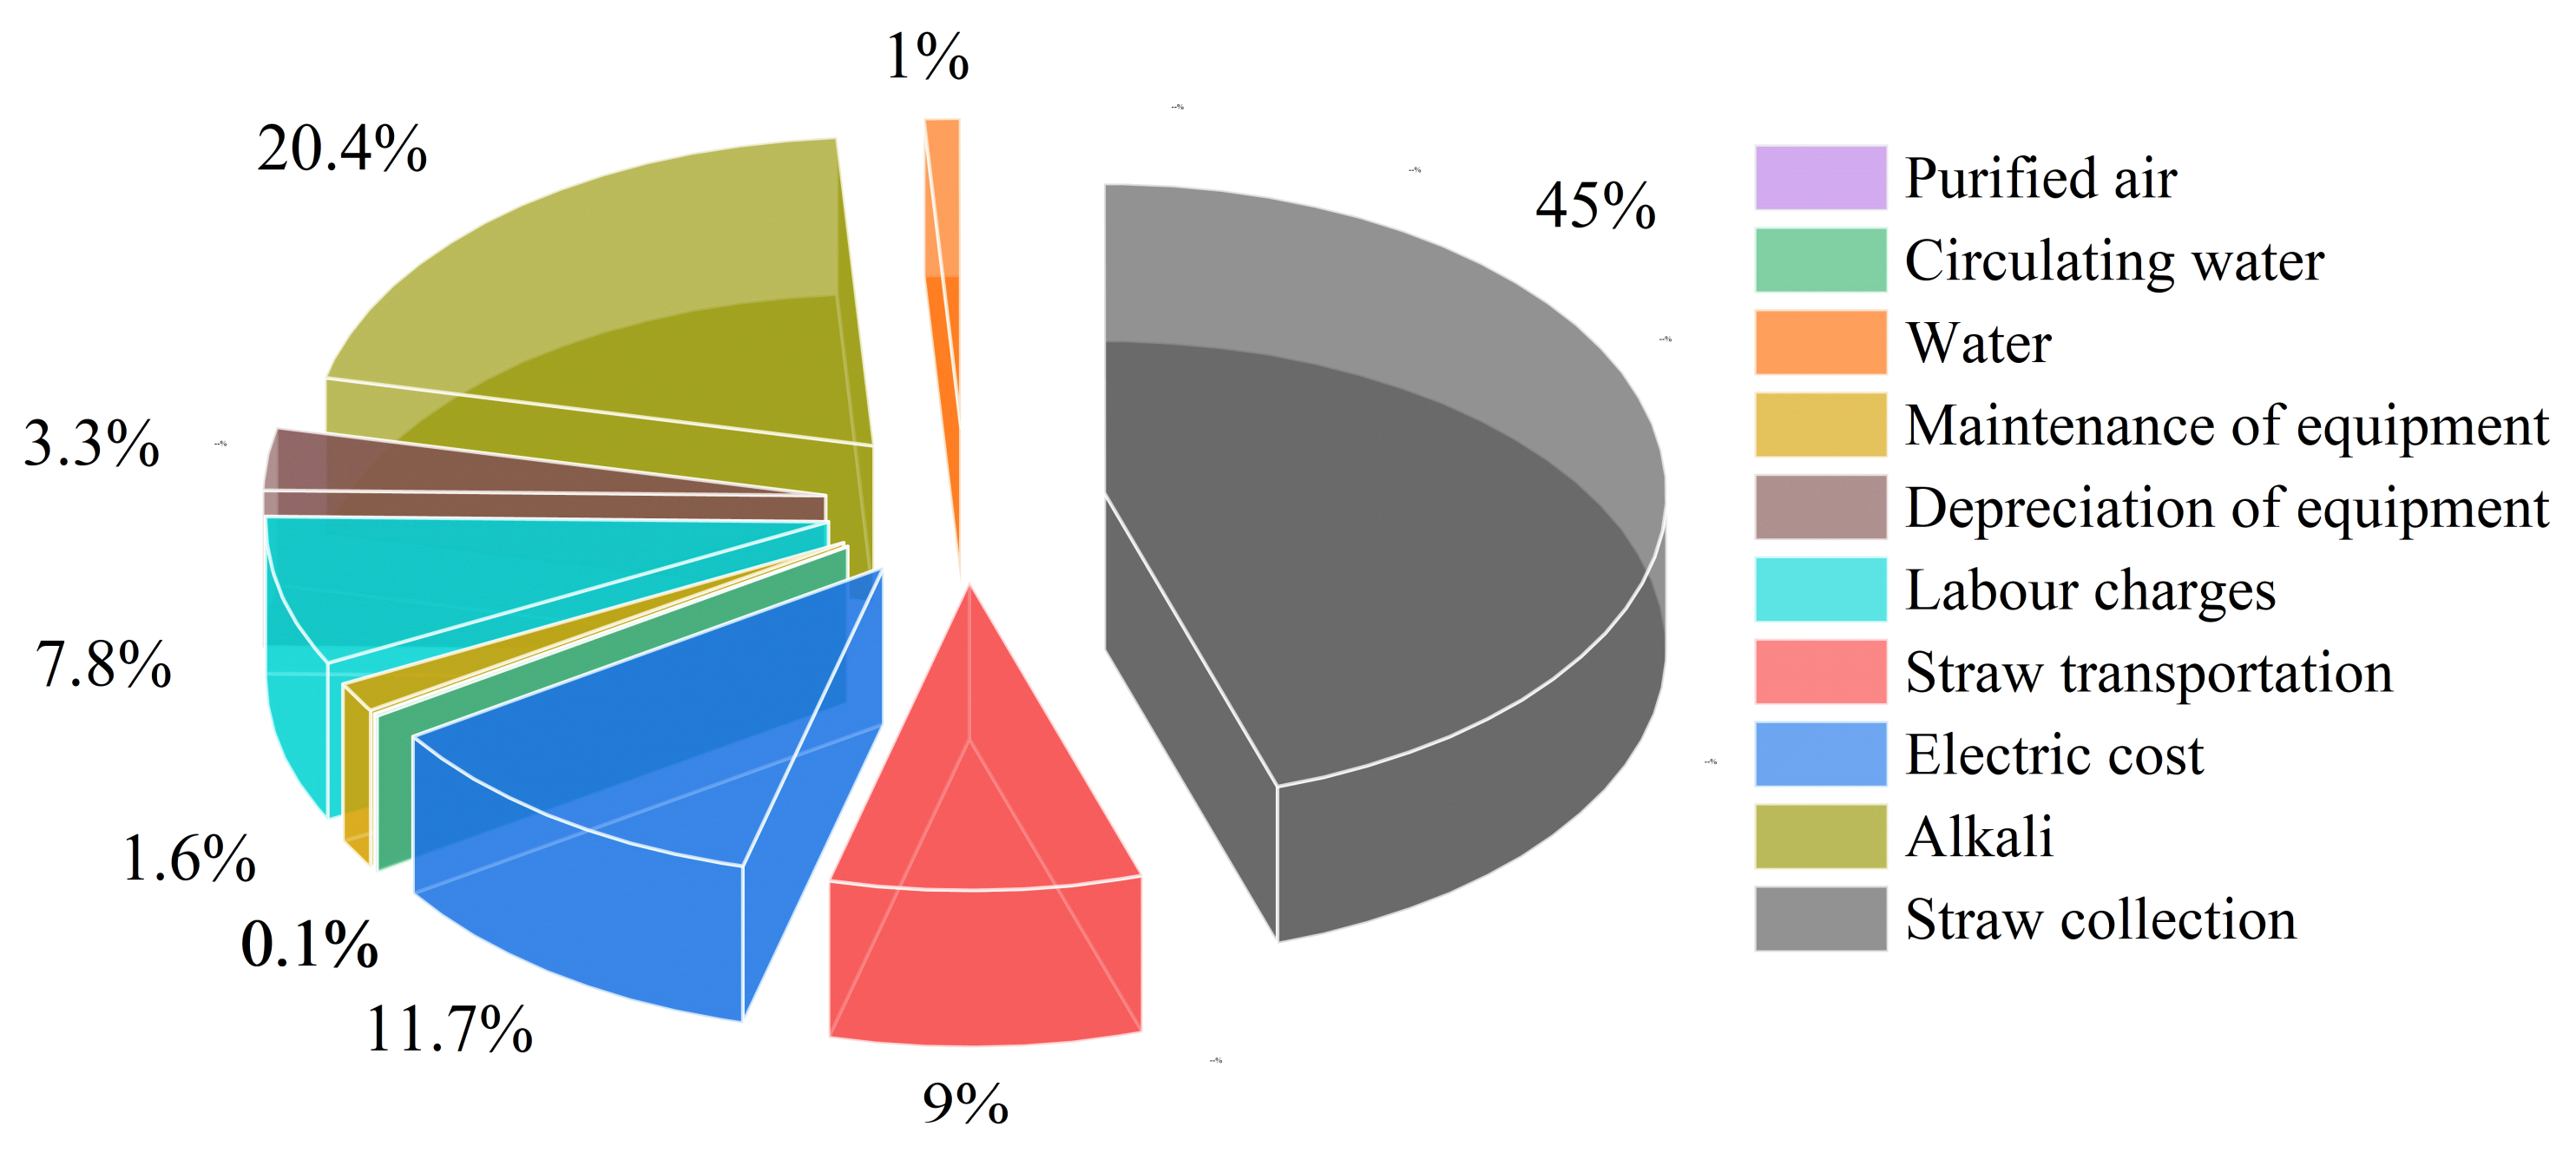
Full lifecycle cost: the lifecycle cost (LCC) of the biomass pyrolysis and mass conversion system includes labor charges, maintenance costs, production costs, etc.
L C C = C j S f  
The total cost of biomass pyrolysis and mass conversion is LCC; Cj is in the lifecycle process for biomass pyrolysis and mass conversion, the cost of the jth item; Sf refers to the sales revenue of various products after pyrolysis and mass conversion.
(3)
The equivalent emission of the greenhouse gas CO2: the equivalent emission of the greenhouse gas CO2 refers to the emission equivalent of the greenhouse gas after normalized treatment. For greenhouse gases, only CO2, CH4, and N2O are calculated, and the global warming potentials are 1, 23, and 296, respectively [34].
H F i = ( H E i · λ )
HFi is the CO2 equivalent emission at step i and, numerically, is the product of the greenhouse gas and the corresponding global warming potential, g·MJ−1; λ is the proportion of the consumption of various types of energy relative to the total energy consumption.

3.3. Inventory Analysis

Lifecycle inventory analysis: The lifecycle inventory (LCI) focuses on the source and quality of inventory data; arranges data for the product, process, or activity to be analyzed; and identifies and quantifies all the energy and material inputs and outputs associated with processes contained within system boundaries. This involves data collection and computation procedures. The inventory data are specific to the system boundaries of the study and are unified in functional units.
Table 1 is the cost table related to non-phase-transition drying pyrolysis and mass conversion technology. Table 2 lists the materials and energy related to non-phase-transition drying pyrolysis and mass conversion technology. Table 3 shows the composition and content of exhaust gas in non-condensing vapor combustion.

4. Results and Analysis

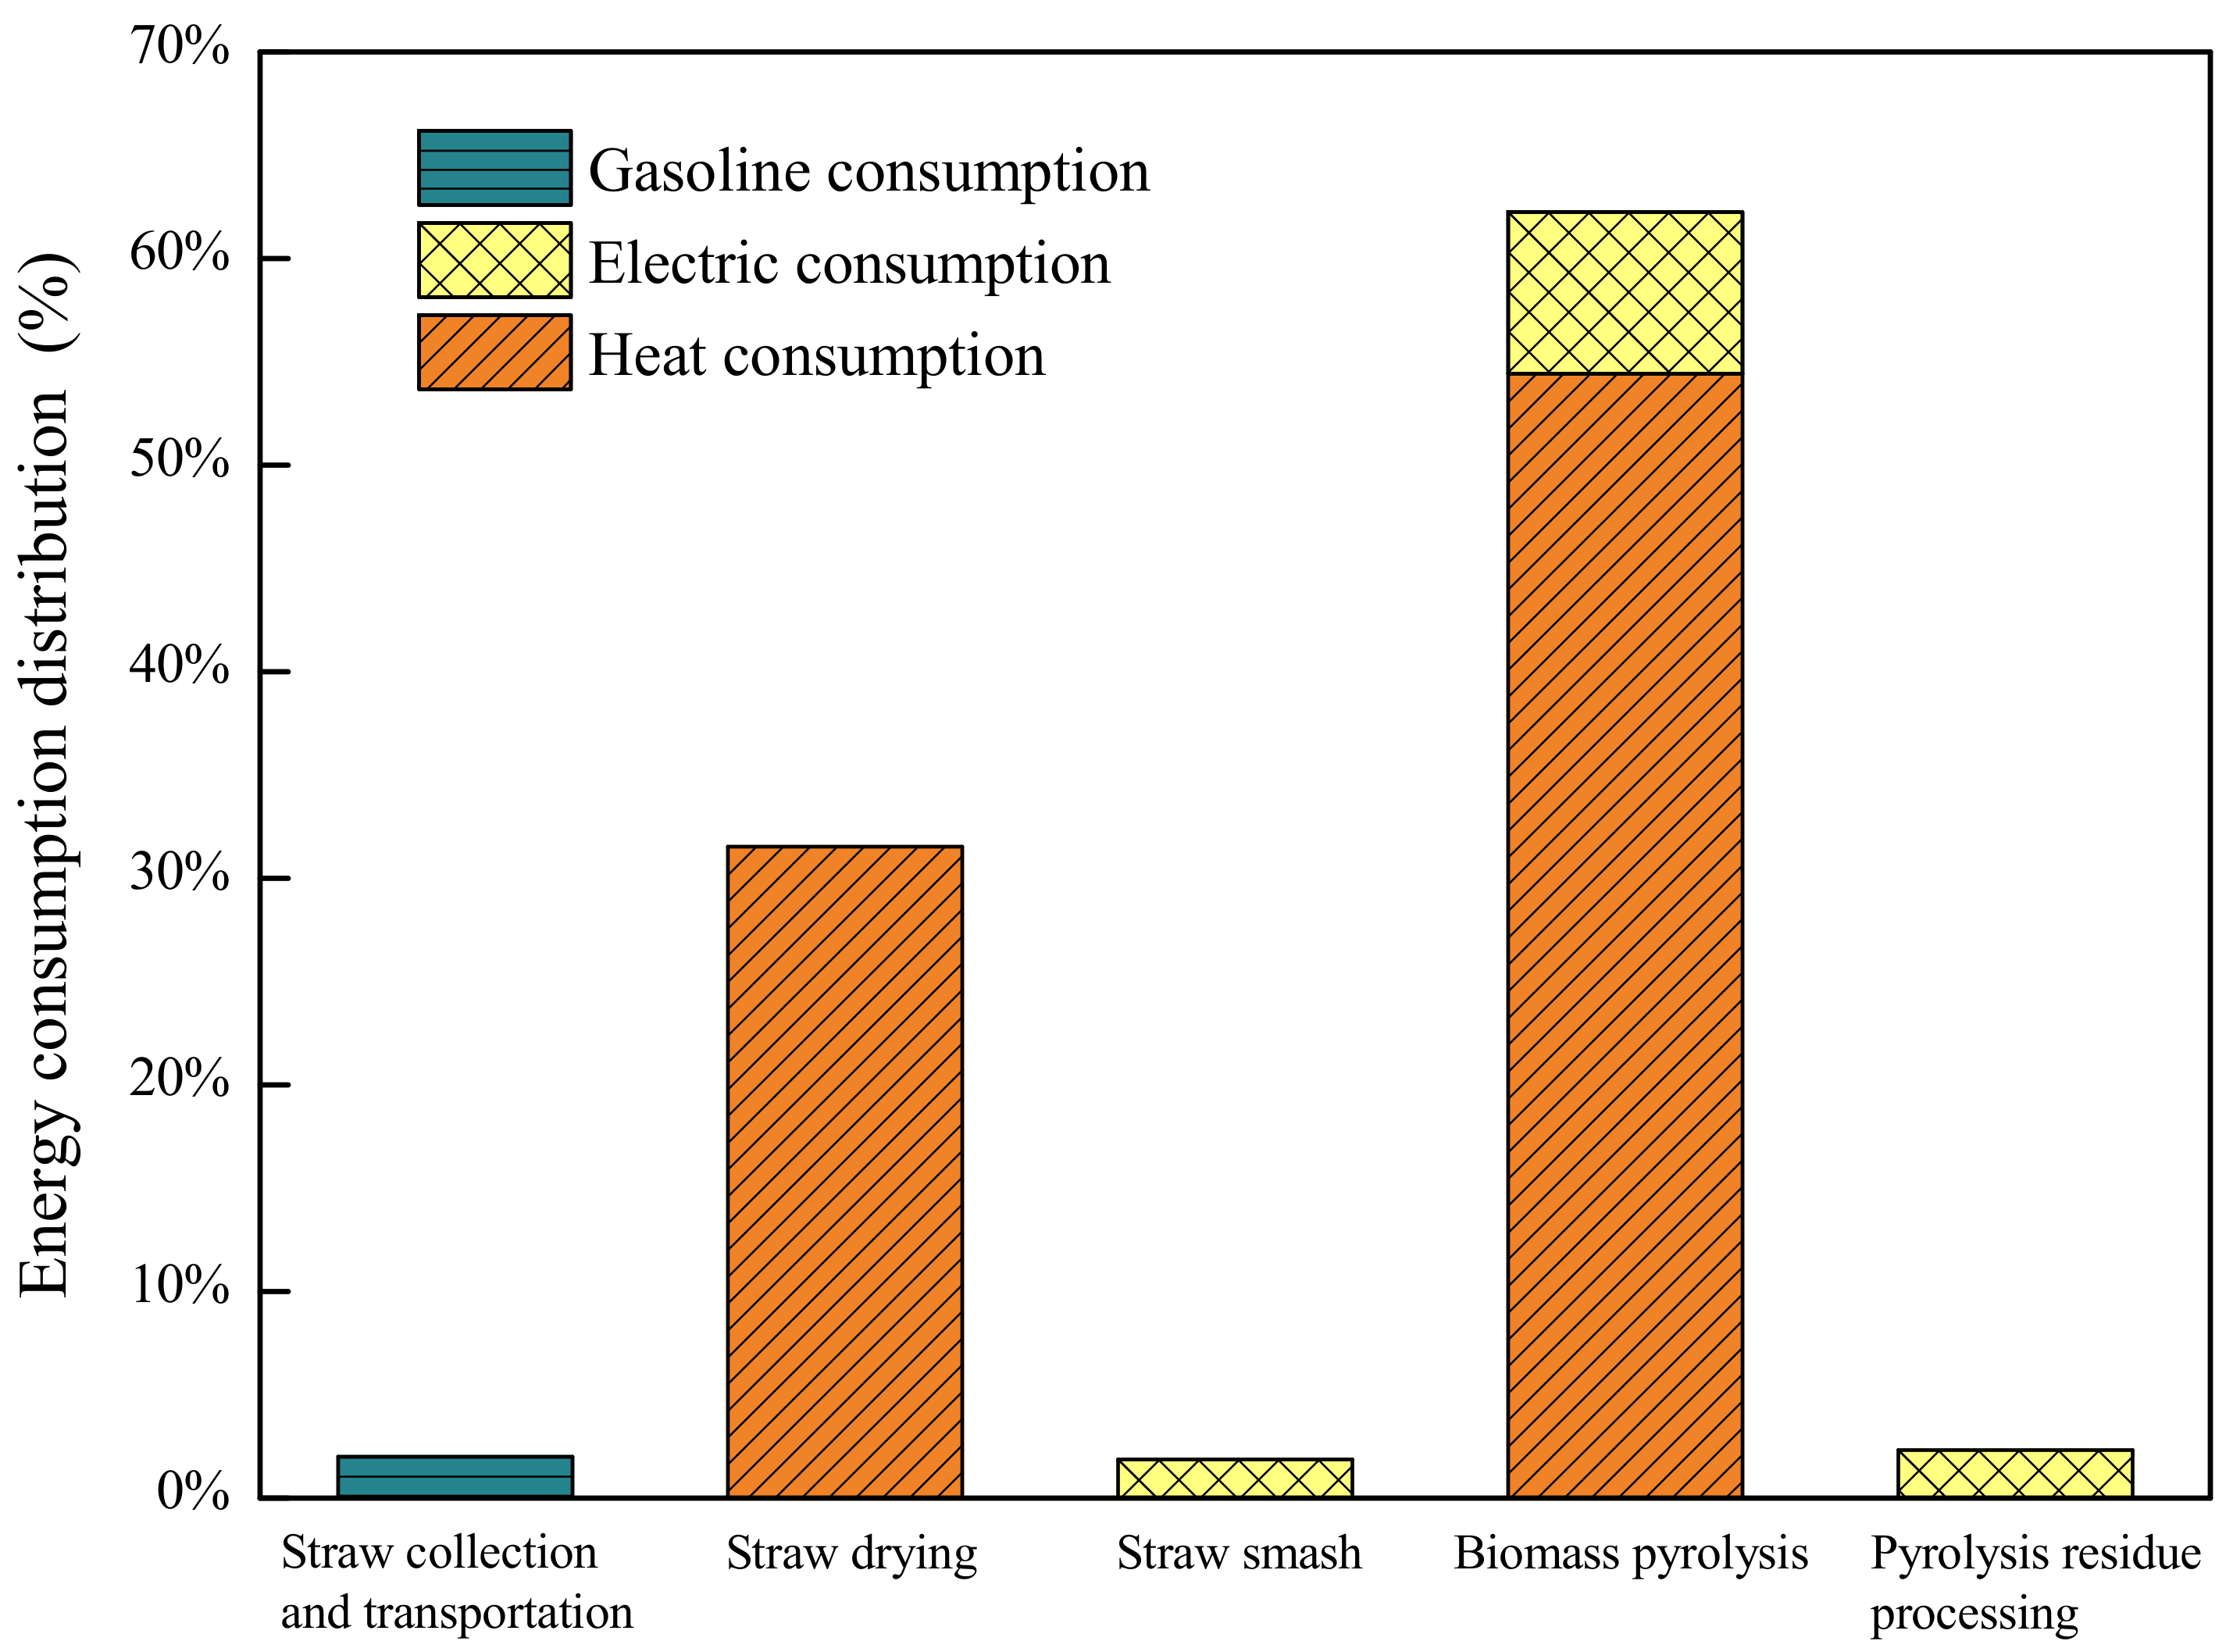
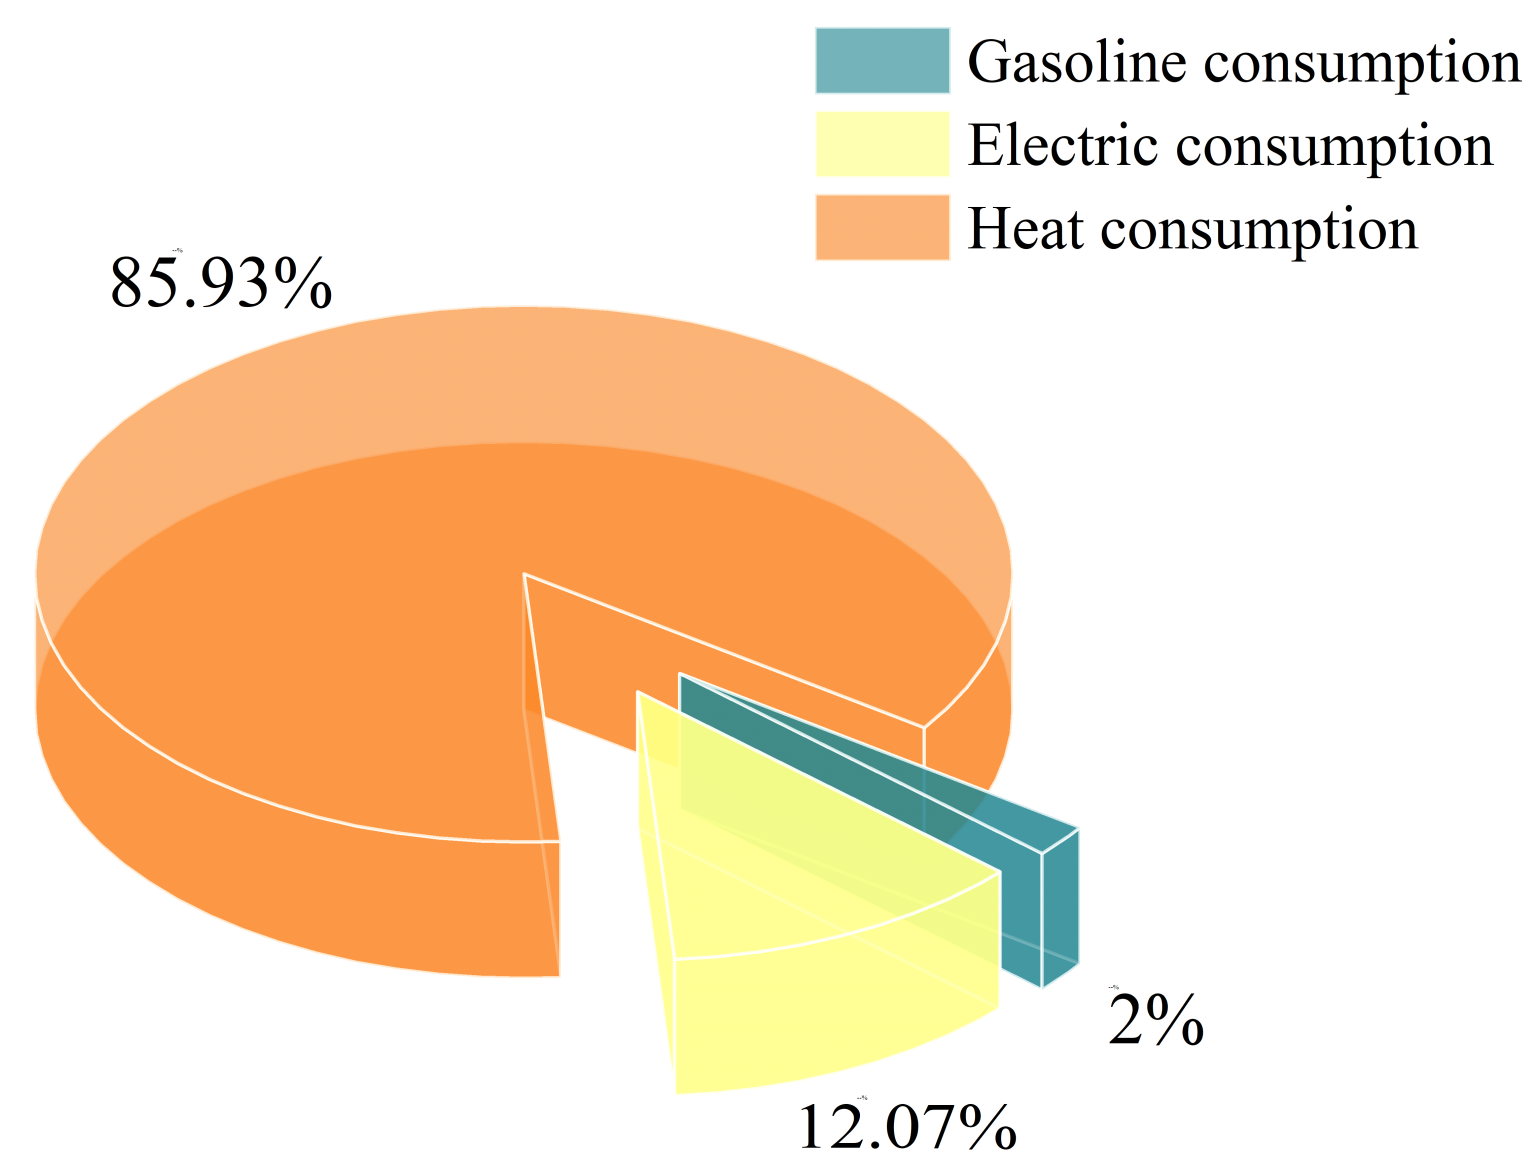
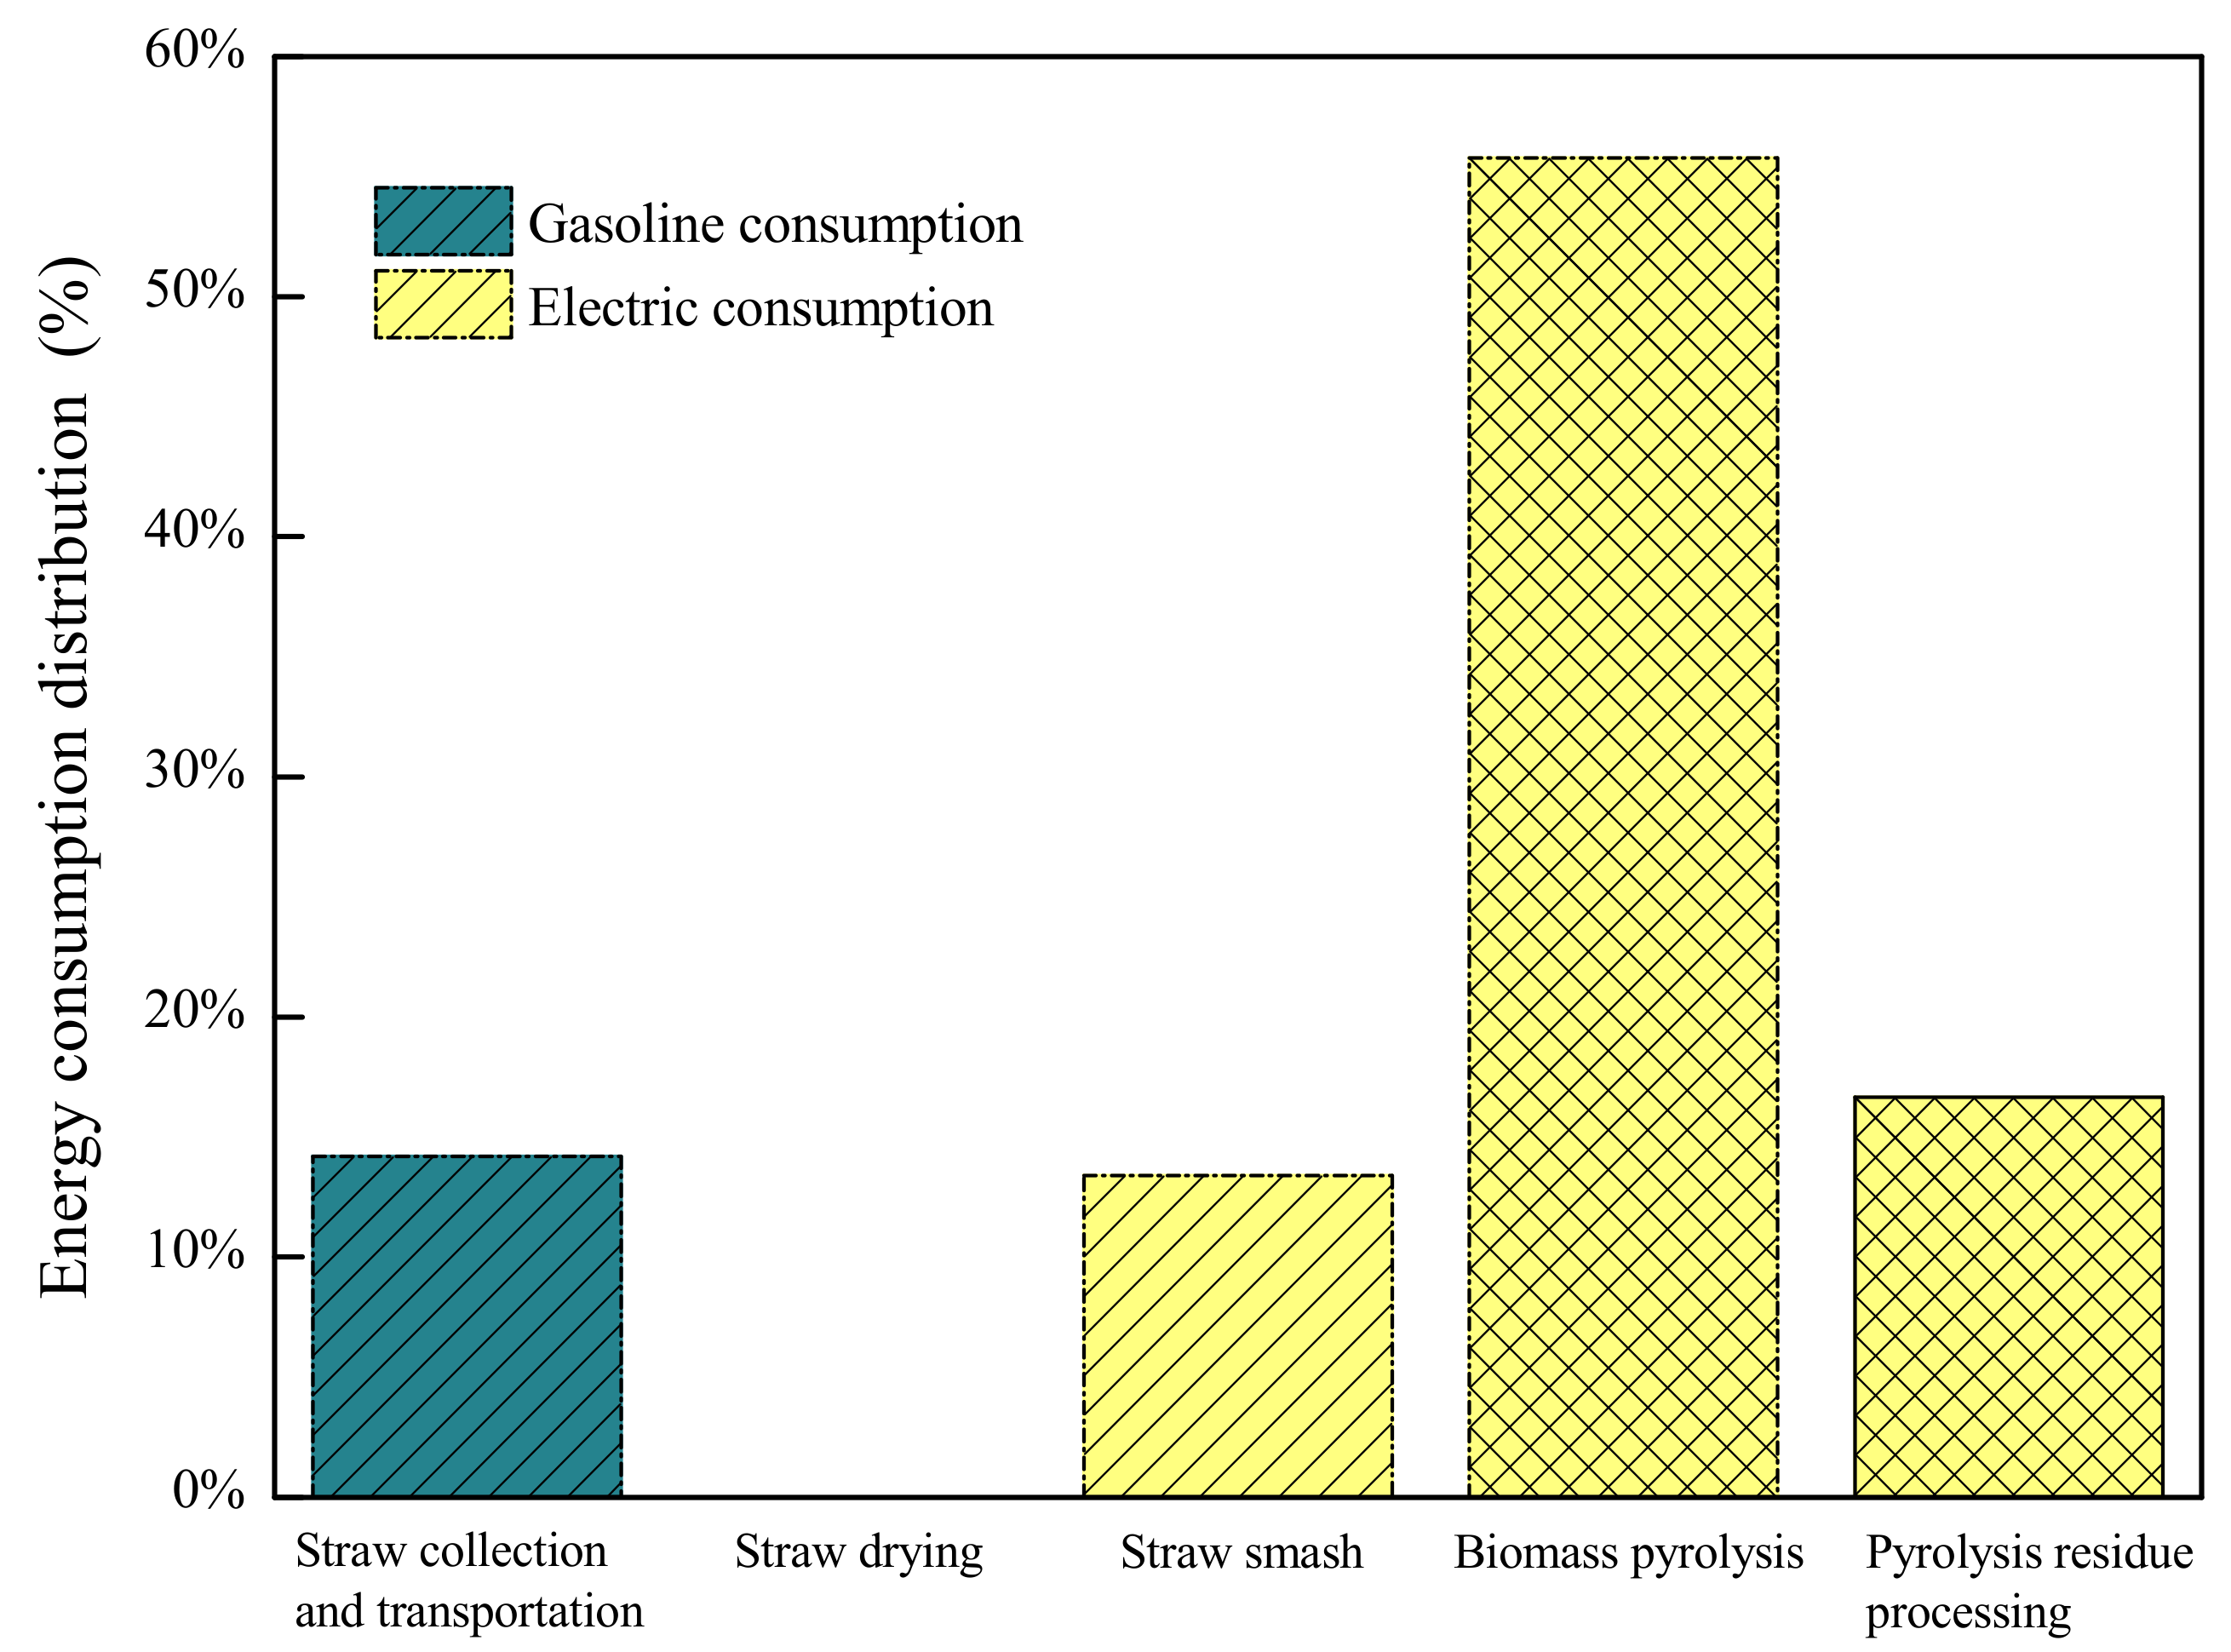
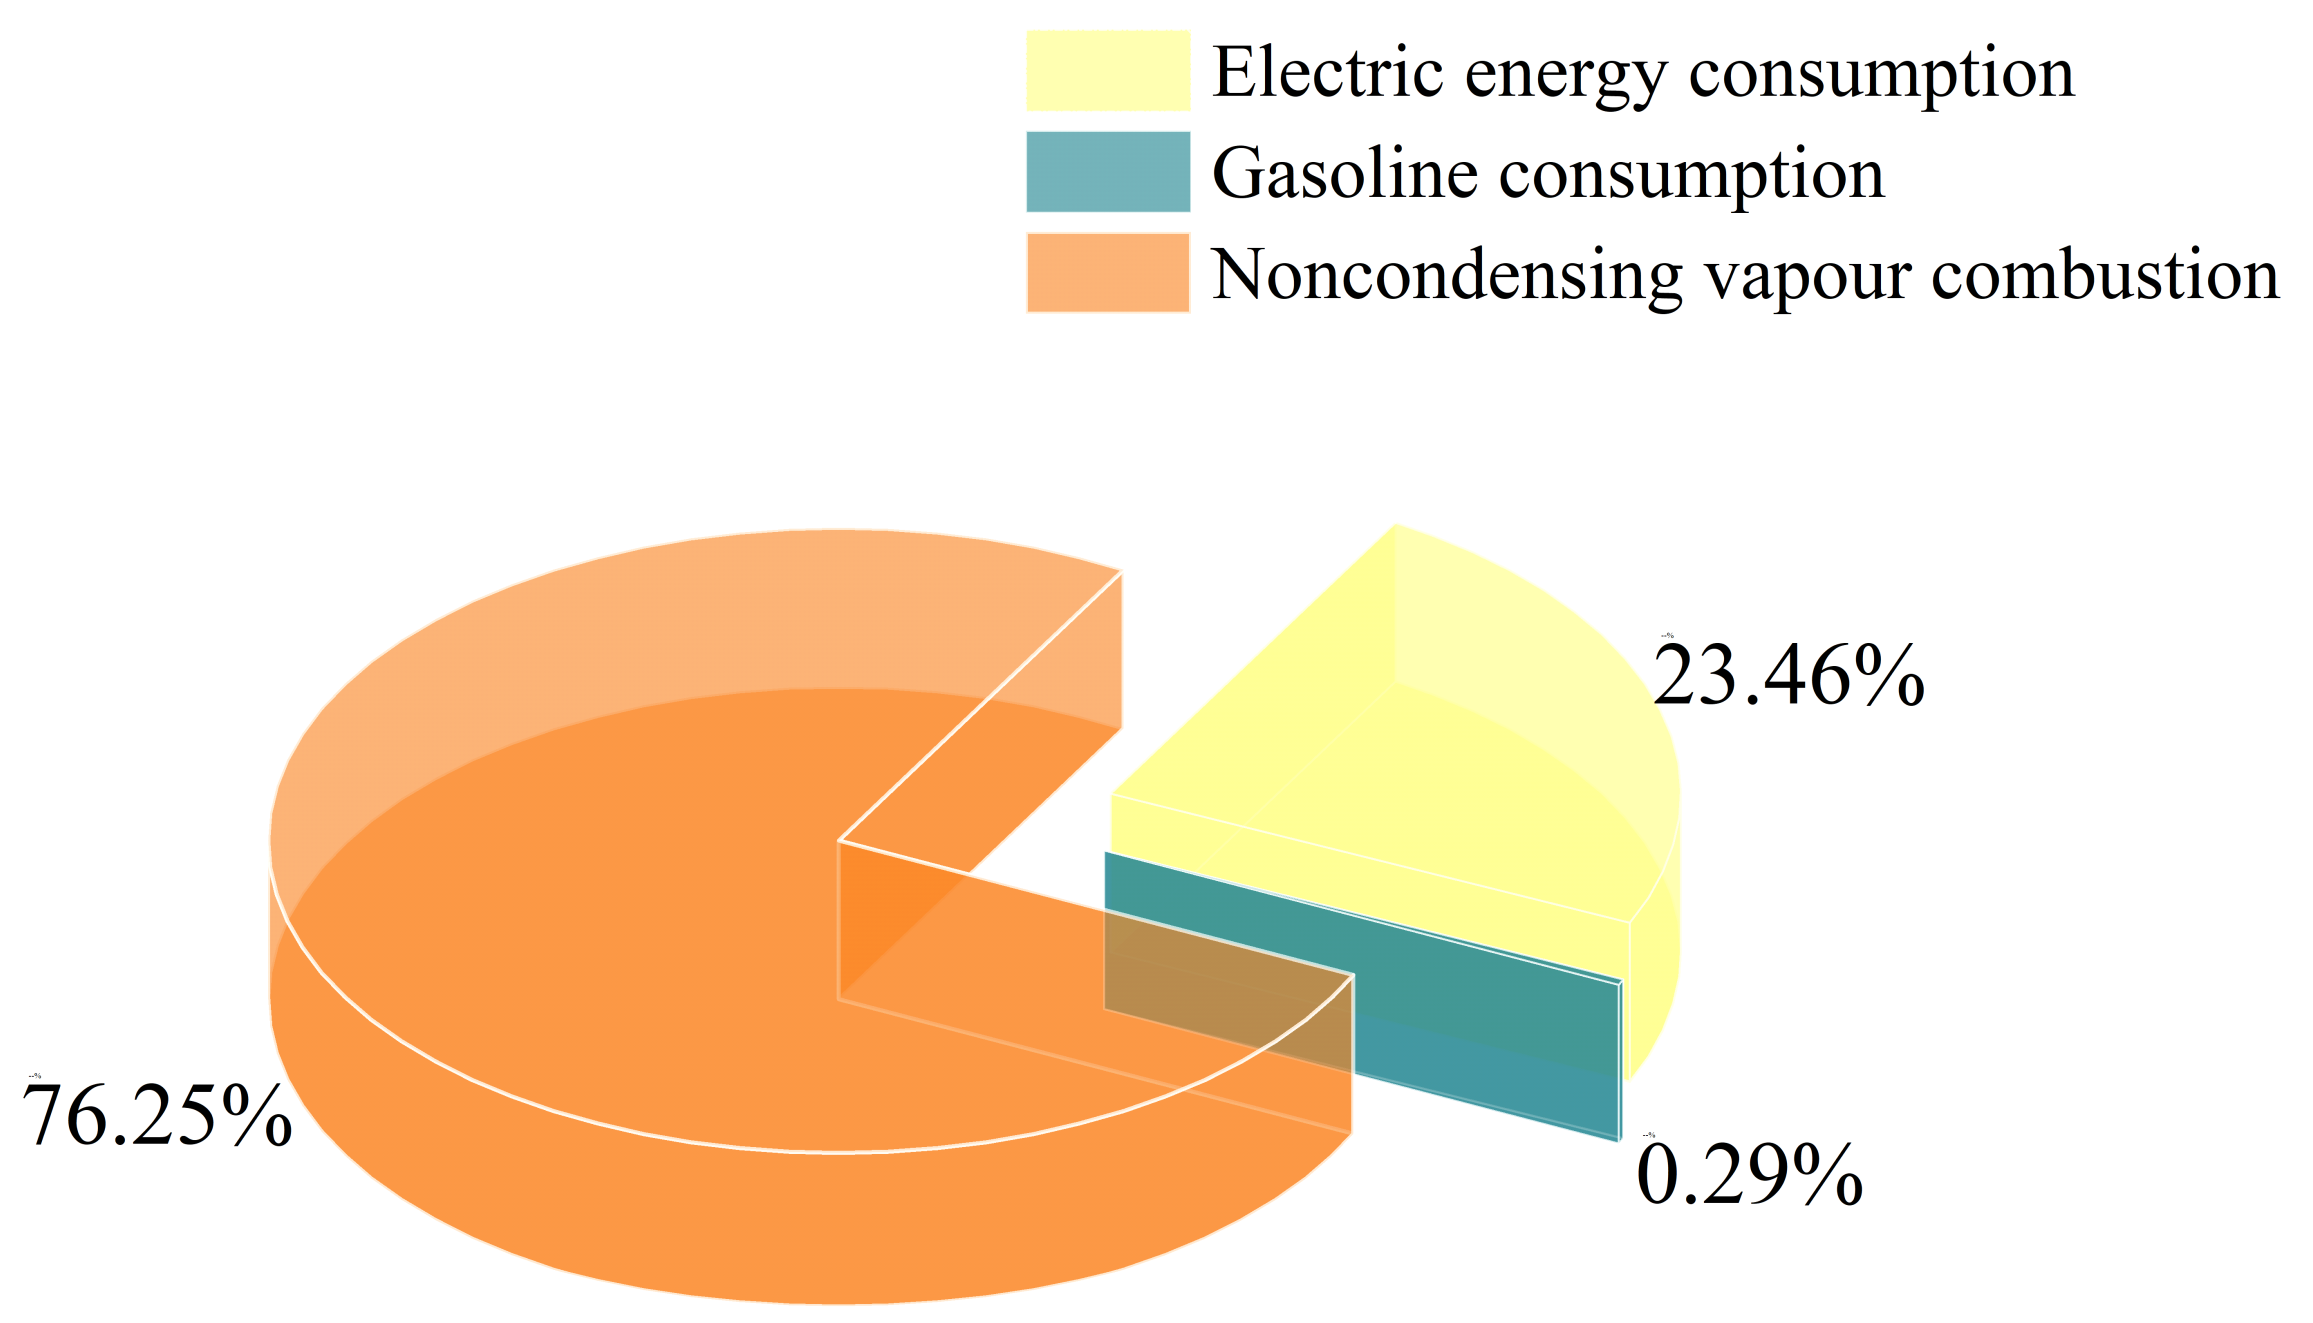
4.1. Energy Input and Output

The energy consumption involved in non-phase-transition drying pyrolysis and mass conversion can be divided into three types, namely, gasoline consumption, electric consumption, and heat consumption, with a total energy consumption of 2304.67 MJ. The distribution of the three types of energy consumption is shown in Figure 3. As can be seen from the figure, straw drying and biomass pyrolysis are the main energy-consuming steps in non-phase-transition drying pyrolysis and mass conversion, accounting for 31.52% and 62.26% of the total energy consumption, respectively. The reason their energy consumption is relatively high is that straw drying and biomass pyrolysis have high demands for heat. Straw collection and transportation energy consumption account for about 2%, all of which is gasoline consumption in the process of automobile transportation. The energy consumption of straw crushing and pyrolysis residue processing accounts for 1.88% and 2.34%, respectively, which all depends on electric energy.
To solve the problem of high energy consumption in straw drying and biomass pyrolysis, the non-phase-transition drying pyrolysis and mass conversion technology burns non-condensing vapor during biomass pyrolysis and uses the heat generated by the combustion to complete the two steps. The remaining energy consumption gap is supplemented by electric heating. In this way, the by-products in the pyrolysis process for biomass are utilized to prevent resource waste, and the power consumption is lowered, reducing the power and process operational costs.
Figure 4 shows the distribution of three kinds of energy consumption involved in the non-phase-transition drying pyrolysis and mass conversion. It can be seen that the energy consumption of thermal energy accounts for about 85.93% of the total energy consumption. Through waste heat energy supply, the entire non-phase-transition drying pyrolysis and mass conversion only needs 324.07 MJ of additional energy, which greatly reduces the energy consumption.
Figure 5 shows the distribution of additional energy consumption for each process step after the exclusion of heat consumption. As can be seen from the figure, the proportions of the energy input for straw collection and transportation, straw drying, straw crushing, biomass pyrolysis, and pyrolysis residue processing are 14.19%, 0%, 13.38%, 55.77%, and 16.66%, respectively. The biomass pyrolysis process is still the top energy consumer because there is still an energy consumption gap after recycling waste heat. Compared with the process of physically drying straw, the biomass pyrolysis process involves a chemical reaction and requires stricter heating conditions. Therefore, electrothermal heating and a waste heat cycle are used for heating.
According to actual measurements, the high heat value (HHV) of the pyrolysis liquid produced by this process ranges from 15 to 18 MJ/kg, and the typical value is 16 MJ/kg. According to calculations, the net energy of a non-phase-transition drying pyrolysis and mass conversion is 6619.93 MJ·t−1, and the energy output/input ratio is 20.43, which means that the output is far greater than the input. The above results indicate that the energy benefit of a non-phase-transition drying pyrolysis and mass conversion process is very high.

4.2. The Economic Costs

Figure 6 shows the cost distribution of a non-phase-transition drying pyrolysis and mass conversion. As can be seen from the figure, the costs are mainly incurred in straw collection, alkali, electric cost, straw transportation, and labor charges, accounting for 45.02%, 20.42%, 11.73%, 9%, and 7.81% of the total cost, respectively. Alkali is mainly used to treat the pyrolysis residue produced during biomass pyrolysis.
As can be seen from Table 2, the total cost of treating 1 ton of wet straw by non-phase-transition drying pyrolysis and mass conversion is about USD 86.98, while the revenue can reach USD 132.30, including USD 75.94 of revenue from the pyrolysis liquid and USD 61.06 from the material carrier for flue gas purification. Therefore, it is necessary to make a high investment in alkali. According to calculations, the net profit is about USD 45.32, and the profit margin is up to 52.11%. It can be seen that the non-phase-transition drying pyrolysis and mass conversion has high economic benefits.

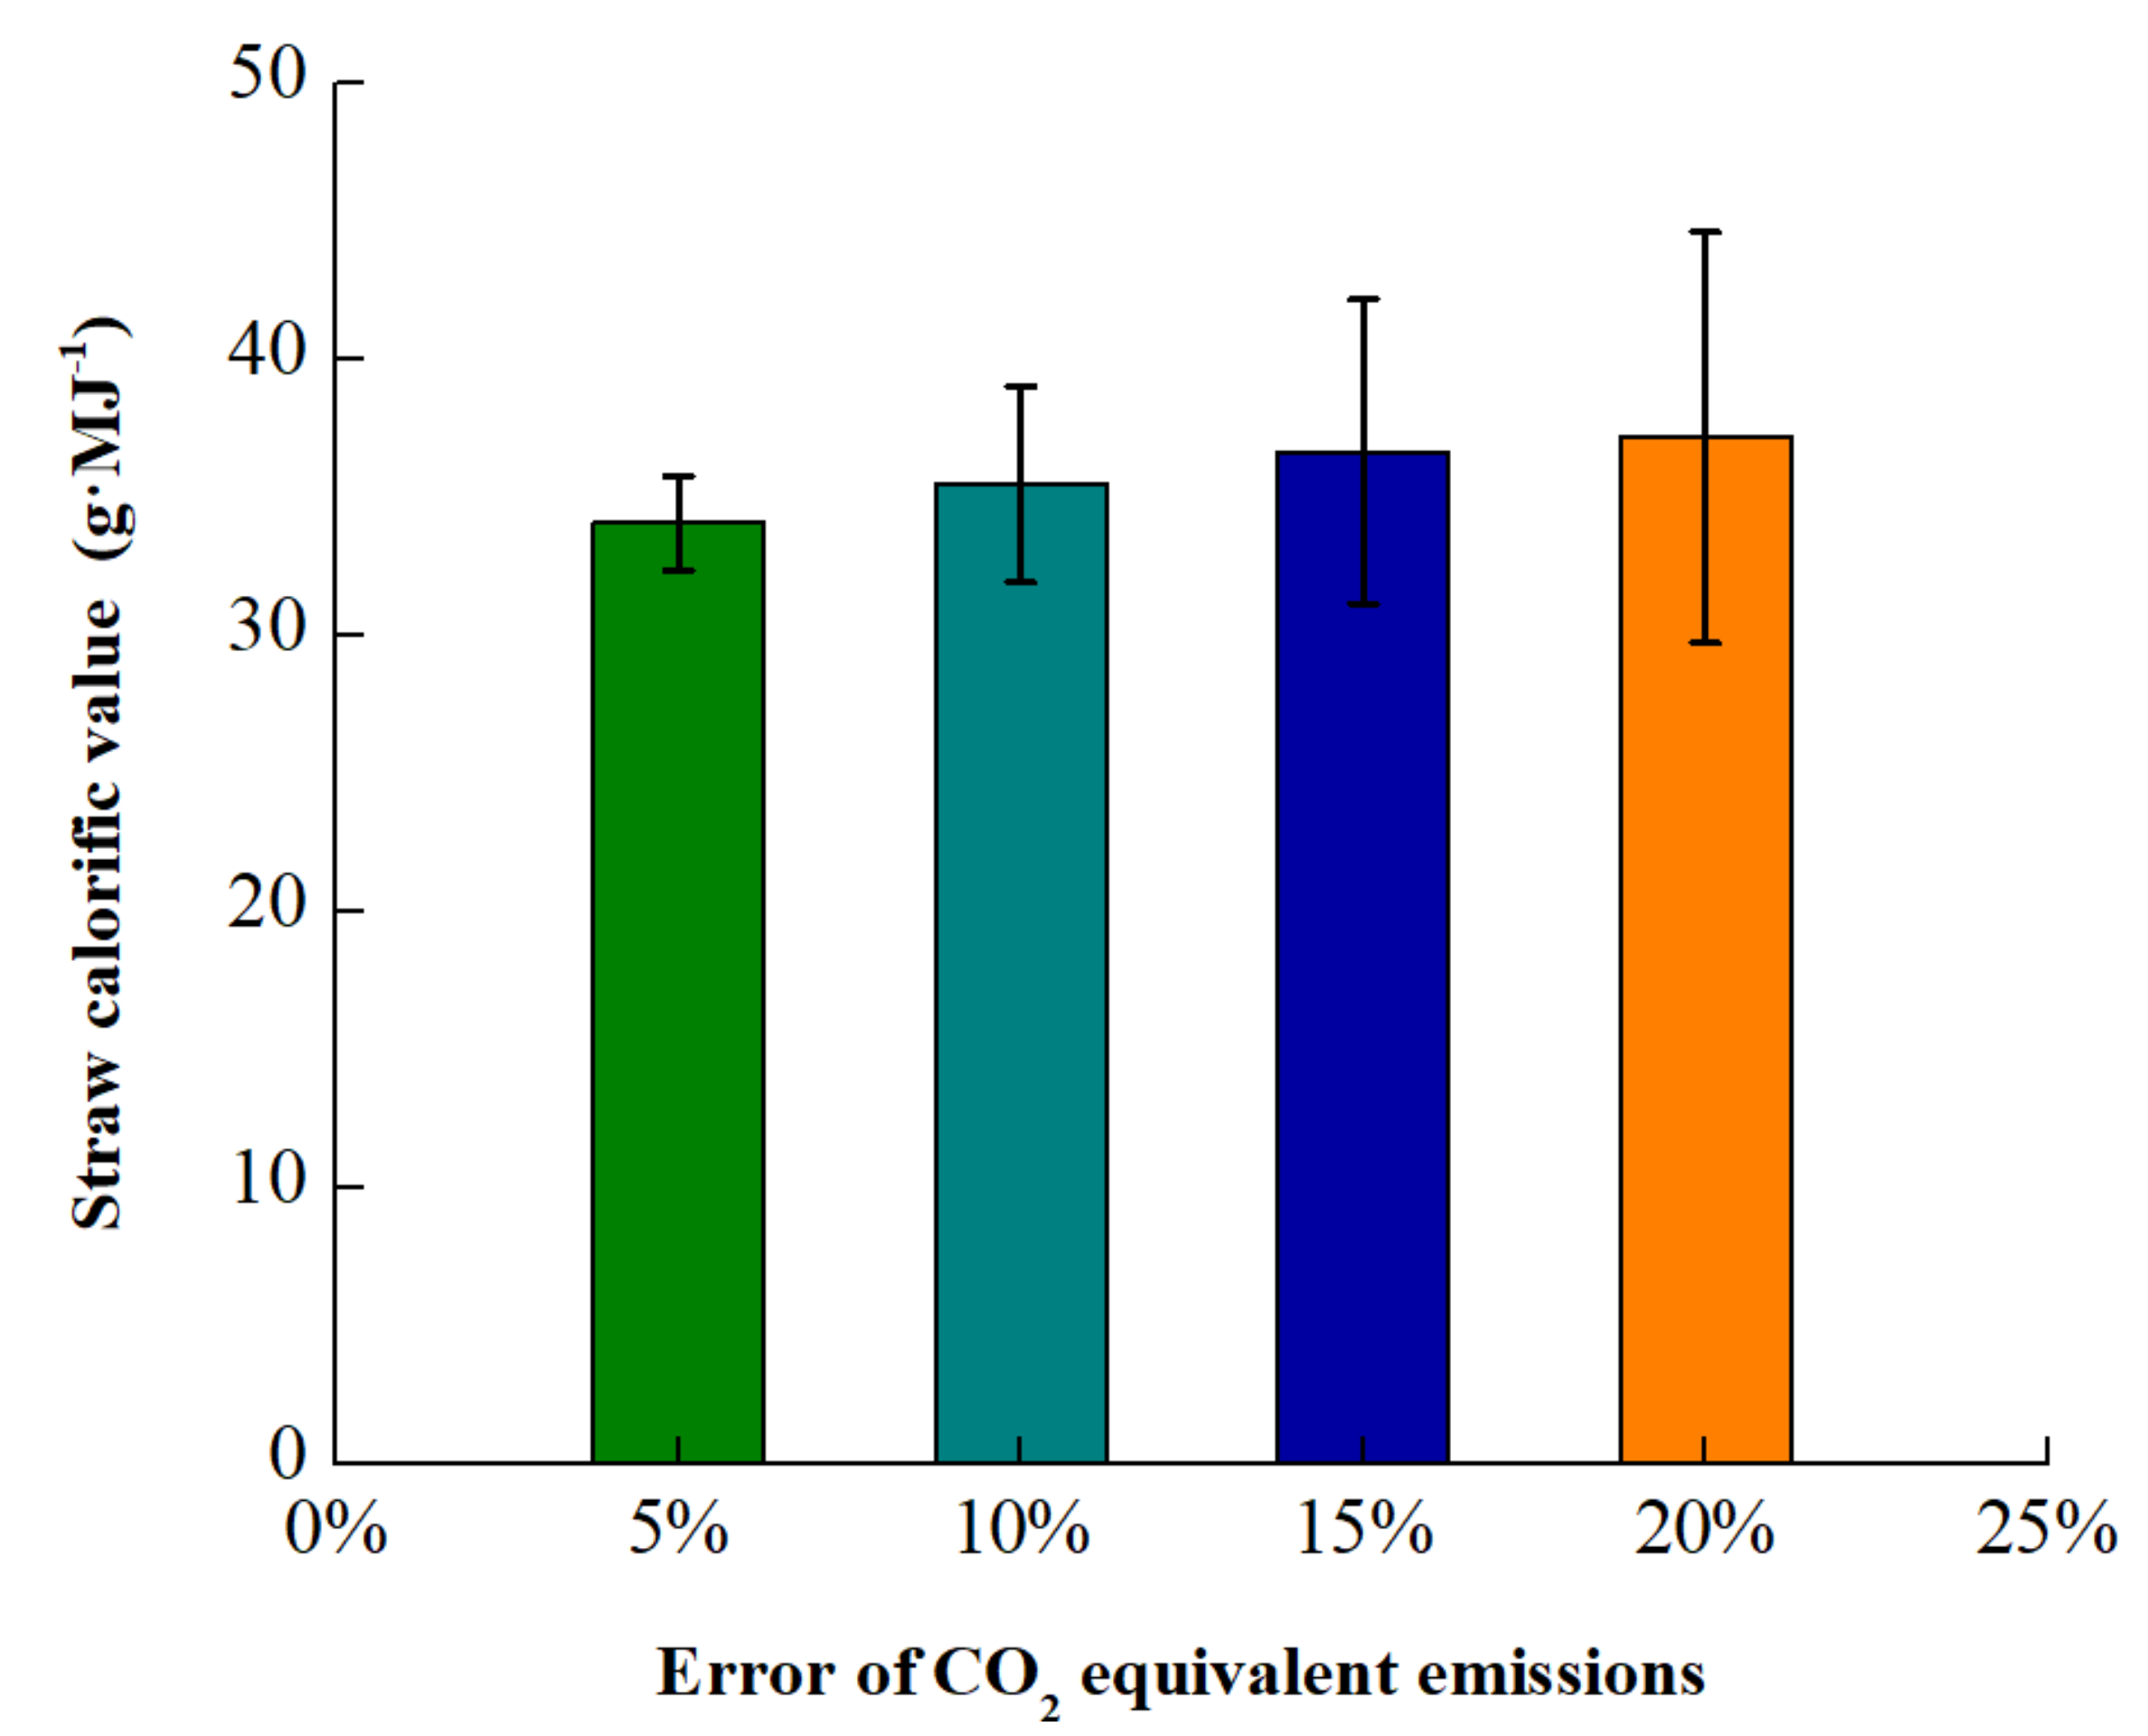
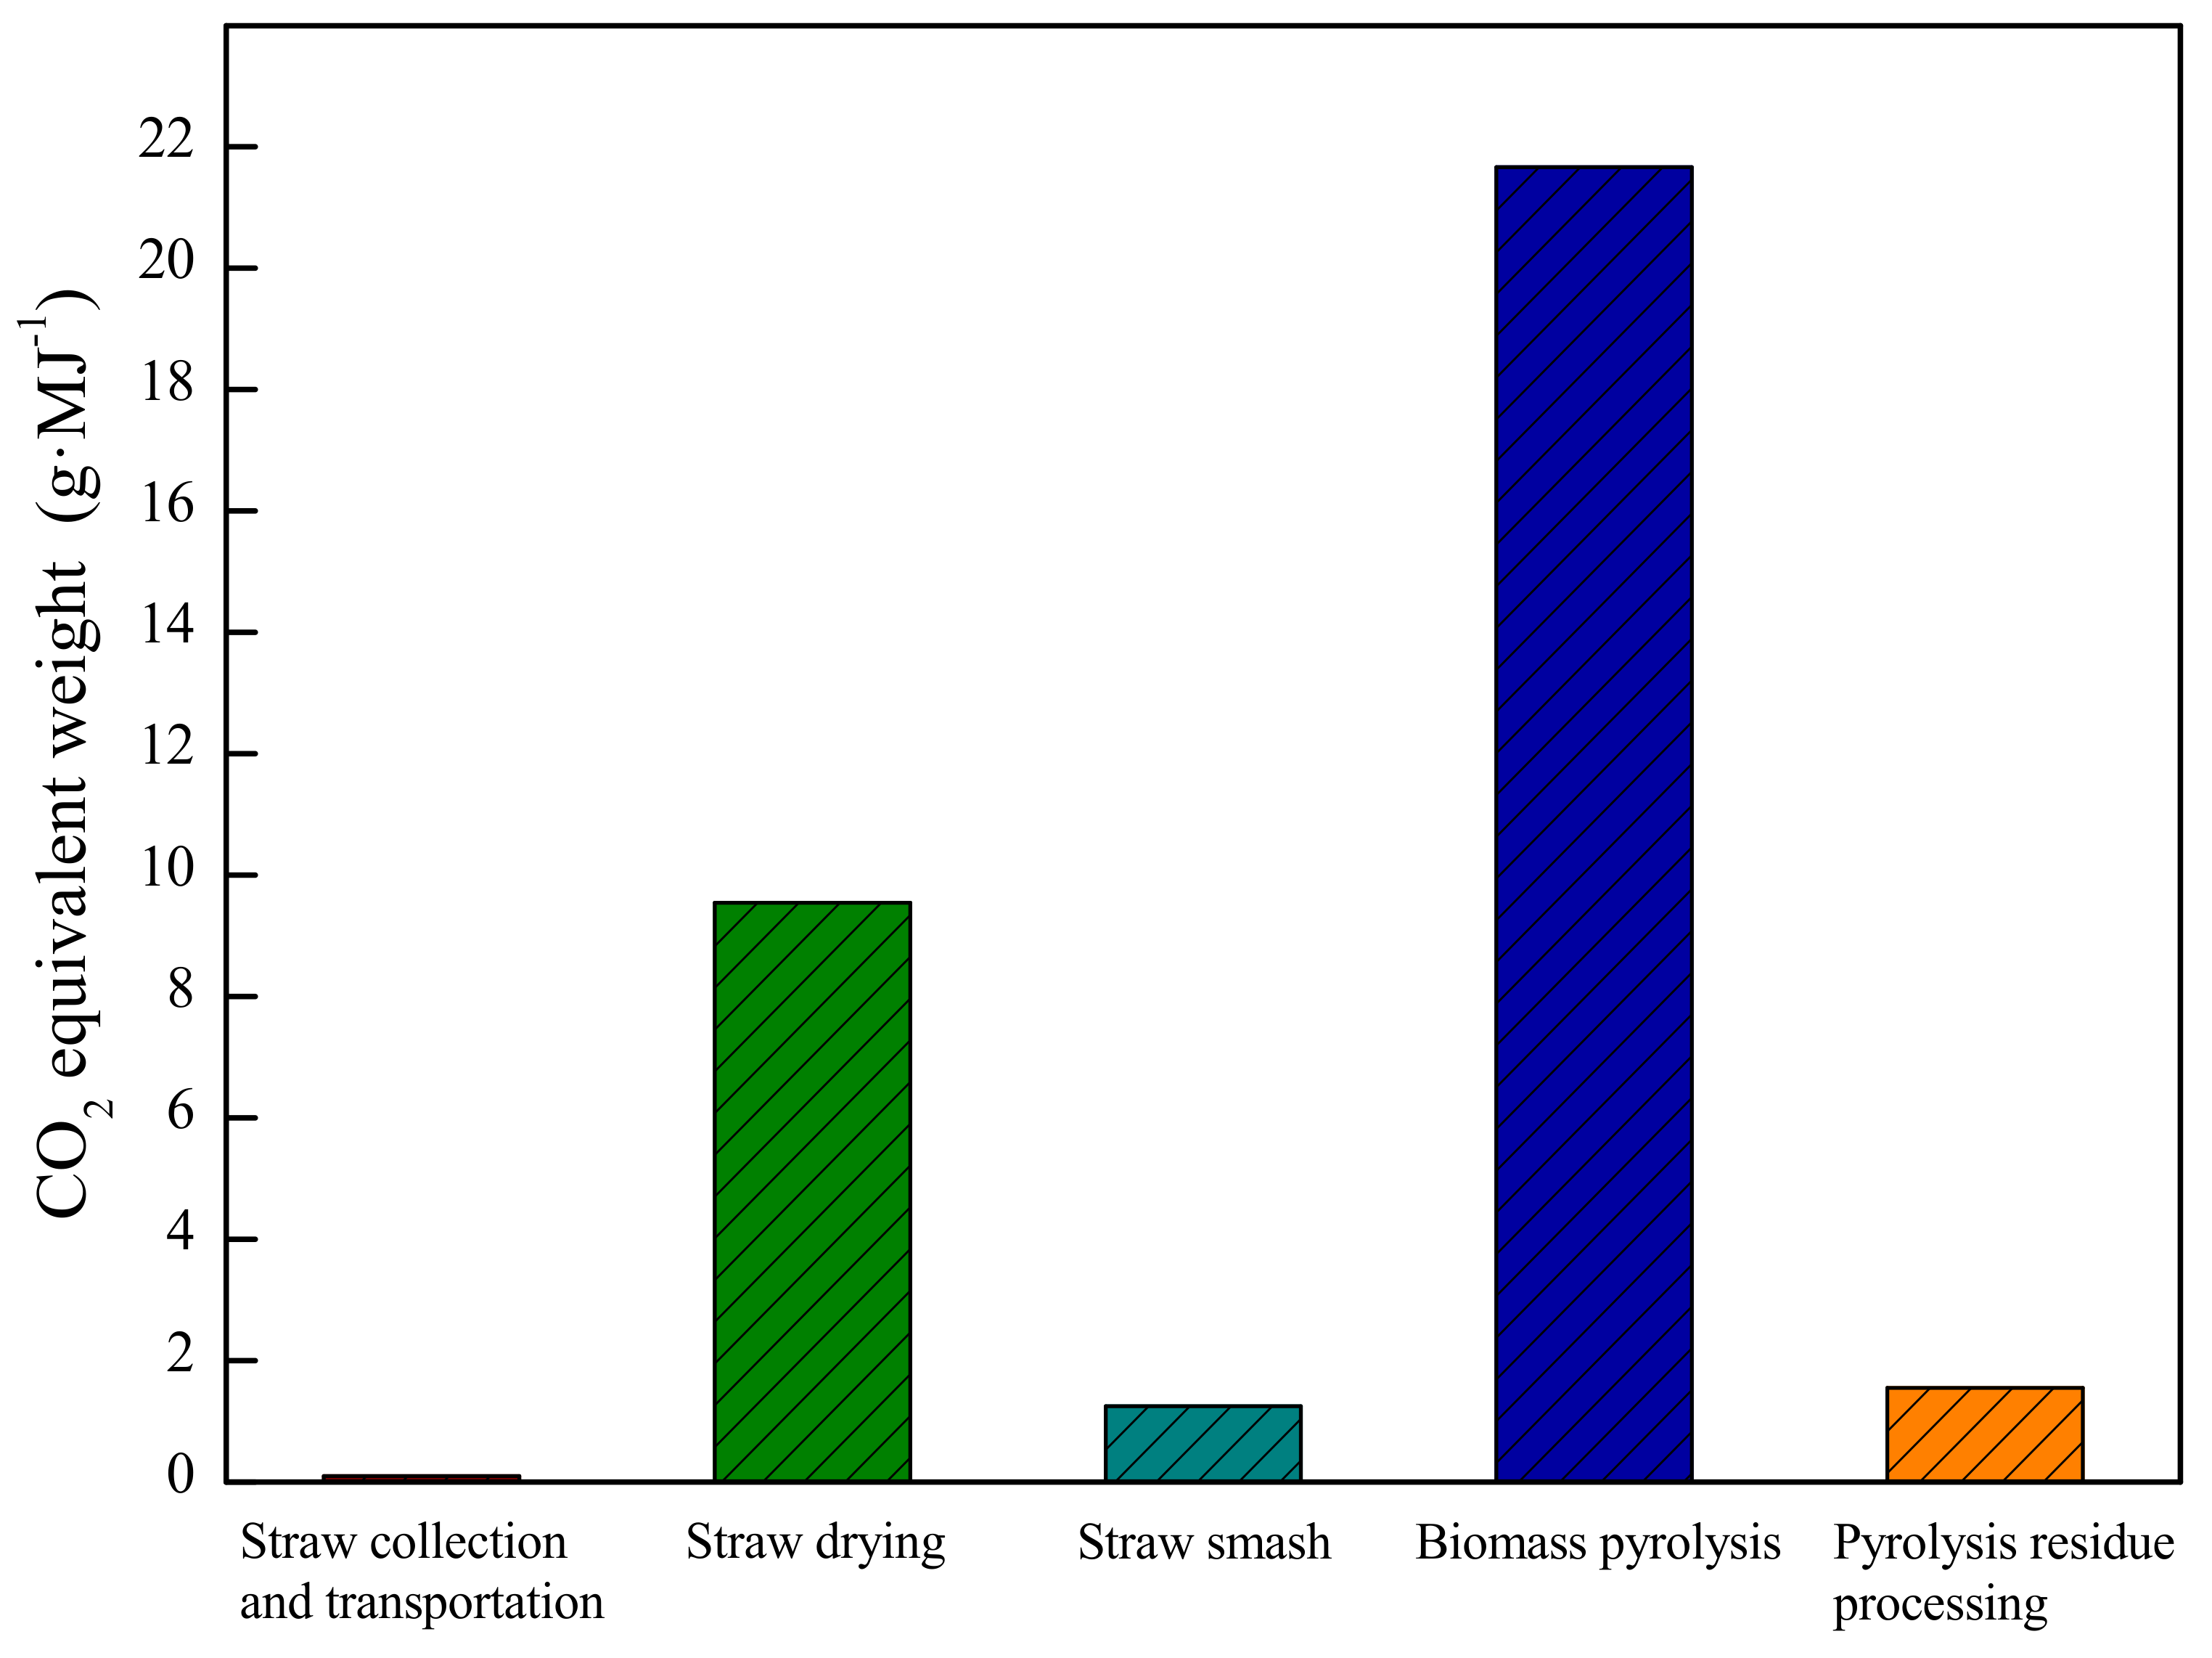
4.3. Emission of Greenhouse Gas

The list of substances and energy involved in the non-phase-transition drying pyrolysis and mass conversion is shown in Table 3. The functional unit is a key element of the LCA and is indispensable for quantifying the environmental impact of the product or system being compared. In order to compare with other research results, the functional unit of this paper was 1 MJ in the analysis process. It can be seen that there are three links related to greenhouse gas emissions: gasoline consumption, electric consumption, and non-condensing vapor combustion. The gas emission information of the gasoline consumption link came from the ECLD 3.0 database [35]. The CO2 equivalent emissions of power consumption are mainly generated by power production, and the data came from the CLCD database [35]. The gas components produced in the non-condensing vapor combustion process are shown in Table 3. The CO2 equivalent emission distribution of the three links is shown in Figure 7. The CO2 equivalent emission of greenhouse gas in non-phase-transition drying pyrolysis and mass conversion is 34.10 g·MJ−1. The CO2 equivalent emission for the non-condensing vapor combustion is the highest, at 26.00 g·MJ−1, and the second highest is that for the electricity consumption, with an emission equivalent of 8.00 g·MJ−1; the CO2 equivalent emissions from gasoline consumption are only 0.10 g·MJ−1.
According to the above analysis, straw is a low-grade biomass energy, and its calorific value fluctuates to a certain extent, resulting in a certain fluctuation in the high calorific value of the pyrolysis liquid, which eventually leads to a certain error in the CO2 equivalent greenhouse gas emission for the non-phase-transition drying pyrolysis and mass conversion process. The errors for CO2 equivalent emissions were calculated for fluctuations in the calorific value of straw of 5%, 10%, 15%, and 20%. As shown in Figure 8, the fluctuation of the CO2 equivalent emissions caused by the fluctuation of the straw calorific value is 28.42–42.62 g·MJ−1, which is generally lower than that for the carbon emissions caused by fuel ethanol, which is 34–56 g·MJ−1, and biodiesel carbon emissions, which is 39–76 g·MJ−1. Therefore, the non-phase-transition drying pyrolysis and mass conversion technology has high environmental benefits in this lifecycle [36].
Figure 9 shows the CO2 equivalent emissions of greenhouse gas in each process. Straw drying and biomass pyrolysis partly or entirely use heat energy generated by non-condensing vapor combustion, so these two steps share the CO2 equivalent emissions generated by non-condensing vapor combustion according to the proportion of heat energy used. It can be seen that the step with the highest greenhouse gas emission is biomass pyrolysis, whose CO2 equivalent emission is 21.66 g·MJ−1; the second highest is straw drying, whose CO2 equivalent emission is 9.54 g·MJ−1.

5. Conclusions

By establishing a lifecycle model for straw biomass, the energy input, economic cost, and greenhouse gas emission during the operation of a non-phase-transition drying pyrolysis and mass conversion technology were quantitatively analyzed, and the following conclusions were drawn:
(1)
The net energy of every 1 ton of wet straw treated by non-phase-transition drying pyrolysis and mass conversion technology is 6619.93 MJ·t−1, and the energy output/input ratio is 20.43, indicating a high-energy benefit. Recycling waste heat accounts for 85.93% of the energy consumption of all kinds, reflecting the green, recyclable, and sustainable development philosophies.
(2)
The total cost of a non-phase-transition drying pyrolysis and mass conversion technology is about USD 86.98/ton of wet straw treated, and the total revenue is USD 132.30, while the net profit is about USD 45.32 and the sales profit margin is up to 52.11%. The economic benefit is very high.
(3)
The CO2 equivalent emissions of greenhouse gas for non-phase-transition drying pyrolysis and mass conversion are 34.10 g·MJ−1, slightly lower than those for other processes. Therefore, this process is a feasible waste biomass regeneration process with high-energy, economic, and environmental benefits.
The limitation of this study is the fact that the model verification was only based on the data of one case study, the process in the case was only analyzed with a device of 30,000 tons of straw/year with a moisture content of 10% (single device scale), and the scale of the process was small. At the same time, this study lacked sensitivity analysis under the combined effect of multiple factors. Follow-up studies will consider including more case parameters in the model and carrying out LCA of the comprehensive utilization of straw.

Author Contributions

Writing—original draft preparation, Y.G.; methodology, J.J.; Conceptualization, Z.S. and X.Z.; validation, X.S. writing—review and editing, L.Z. All authors have read and agreed to the published version of the manuscript.

Funding

This work was supported by National Key Research and Development Plan (No. 2019YFC1906700) and the National Natural Science Foundation of China (No. 21978224).

Institutional Review Board Statement

Not applicable.

Data Availability Statement

The data presented in this study are available on request from the corresponding author. The data are not publicly available due to the technical collaboration agreement.

Acknowledgments

We would like to thank Huiping Si from Tongji University, for her help during this research.

Conflicts of Interest

The authors declare no conflict of interest.

References

  1. Bloom, A.J.; Burger, M.; Rubio-Asensio, J.S.; Cousins, A.B. Carbon Dioxide Enrichment Inhibits Nitrate Assimilation in Wheat and Arabidopsis. Science 2010, 328, 899–903. [Google Scholar] [CrossRef] [PubMed] [Green Version]
  2. Perera, A.T.D.; Nik, V.M.; Chen, D.; Scartezzini, J.-L.; Hong, T. Quantifying the impacts of climate change and extreme climate events on energy systems. Nat. Energy 2020, 5, 150–159. [Google Scholar] [CrossRef] [Green Version]
  3. Peng, L.; Zhang, Q.; He, K. Emissions Inventory of Atmospheric Pollutants from Open Burning of Crop Residues in China based on a National Questionnaire. Res. Environ. Sci. 2016, 29, 1109–1118. [Google Scholar]
  4. Xu, B.; Fan, M.; Chen, L.; Jiang, T.; Tao, J.; Cheng, L.; Ji, X.; Wu, W. Analysis of temporal and spatial characteristics and Influonling Factors of crop residue burning in major agricultural areas from 2013 to 2017. Yaogan Xuebao J. Remote Sens. 2020, 24, 1221–1232. [Google Scholar]
  5. Li, Z.; Li, M.; Pan, G.; Li, L.; Zheng, J.; Grace, W. Challenges for Crop Straw Return: A Questionnaire Survey on Farmers’Vision from Shangqiu Municipality, Henan Province. Chin. Agric. Sci. Bull. 2013, 29, 204–208. [Google Scholar]
  6. Cao, L. Research on utilization strategy of straw conversion to biomass energy. Agric. Technol. Equip. 2020, 11, 91–92. [Google Scholar]
  7. Dhawane, S.H.; Al-Sakkari, E.G.; Kumar, T.; Halder, G. Comprehensive elucidation of the apparent kinetics and mass transfer resistances for biodiesel production via in-house developed carbonaceous catalyst. Chem. Eng. Res. Des. 2021, 165, 192–206. [Google Scholar] [CrossRef]
  8. Dai, X.; Chen, S.; Cai, C.; Dai, L.; Hua, Y. Research and Economic Analysis of Mainstream Energy Technologies for Straw. Environ. Eng. 2021, 39, 1–17. [Google Scholar]
  9. Gao, T. Design scheme and application of prefabricated cabin type substation for biomass biogas power generation. Technol. Econ. Guide 2020, 28, 37–77. [Google Scholar]
  10. Ma, G.; Guo, P.; Chang, C. Research progress on hydrogen production by anaerobic fermentation of biomass. Mod. Chem. Ind. 2020, 40, 45–49. [Google Scholar]
  11. Zhang, S.; Zhou, S.; Yang, X.; Xi, W.; Zheng, K.; Chu, C.; Ju, M.; Liu, L. Effect of operating parameters on hydrothermal liquefaction of corn straw and its life cycle assessment. Environ. Sci. Pollut. Res. 2020, 27, 6362–6374. [Google Scholar] [CrossRef]
  12. Zhang, J.; Xi, J.; Hu, J. Research Summary on New Energy Technology. Shandong Chem. Ind. 2018, 47, 75–83. [Google Scholar]
  13. Bridgwater, A. Principles and practice of biomass fast pyrolysis processes for liquids. J. Anal. Appl. Pyrolysis 1999, 51, 3–22. [Google Scholar] [CrossRef]
  14. Yang, S. Corn Straw Pretreatment and Hydrodeoxygenation of Lignin-Derived Compounds in Ionic Liquids System. Ph.D. Thesis, University of Chinese Academy of Sciences, Beijing, China, 2019. [Google Scholar]
  15. Xiang, M. Synthesis of Hierarchical Zeolite ETS-10 and Its Catalytic Performance in the Biomass Hydrogenation Reactions. Ph.D. Thesis, Southeast University, Nanjing, China, 2019. [Google Scholar]
  16. Tran, Q.K.; Han, S.; Ly, H.V.; Kim, S.S.; Kim, J. Hydrodeoxygenation of a bio-oil model compound derived from woody biomass using spray-pyrolysis-derived spherical γ-Al2O3-SiO2 catalysts. J. Ind. Eng. Chem. 2020, 92, 243–251. [Google Scholar] [CrossRef]
  17. Liu, W.; Mao, K.; Zhang, T.; Ma, Z.; Fu, G.; Wang, W. Development of Life Cycle Assessment and Application in Biomass Resource Recovery. In Proceedings of the 2019 National Academic Annual Conference of Environmental Engineering (Volume II), Beijing, China, 20–22 September 2019; p. 6. [Google Scholar]
  18. ISO. Environmental Management—Life Cycle Assessment—Principles and Framework. In International Standard Organization, Reference Number ISO 14040:2006(E); ISO: Geneva, Switzerland, 2006. [Google Scholar]
  19. ISO. Environmental management—Life cycle assessment—Requirements and guidelines. In International Standard Organization, Reference number ISO 14040:2006(E); ISO: Geneva, Switzerland, 2006. [Google Scholar]
  20. Rathore, D.; Nizami, A.-S.; Singh, A.; Pant, D. Key issues in estimating energy and greenhouse gas savings of biofuels: Challenges and perspectives. Biofuel Res. J. 2016, 3, 380–393. [Google Scholar] [CrossRef] [Green Version]
  21. Den Boer, J.; Dyjakon, A.; Den Boer, E.; Garcia-Galindo, D.; Bosona, T.; Gebresenbet, G. Life-Cycle Assessment of the use of peach pruning eesidues for electricity generation. Energies 2020, 13, 2734. [Google Scholar] [CrossRef]
  22. Wang, Y.; Wang, J.; Zhang, X.; Grushecky, S. Environmental and Economic Assessments and Uncertainties of Multiple Lignocellulosic Biomass Utilization for Bioenergy Products: Case Studies. Energies 2020, 13, 6277. [Google Scholar] [CrossRef]
  23. Vienescu, D.N.; Wang, J.; Le Gresley, A.; Nixon, J.D. A life cycle assessment of options for producing synthetic fuel via pyrolysis. Bioresour. Technol. 2018, 249, 626–634. [Google Scholar] [CrossRef] [Green Version]
  24. Zhang, Y.; Li, J.; Liu, H.; Zhao, G.; Tian, Y.; Xie, K. Environmental, social, and economic assessment of energy utilization of crop residue in China. Front. Energy 2020, 15, 308–319. [Google Scholar] [CrossRef]
  25. Wei, L. Literature review of life cycle theory. CO-Oper. Econ. Sci. 2014, 24, 155–156. [Google Scholar]
  26. Zhou, Z.; Lin, Y.; Tang, Y. New research developments and their analysis of life cycle assessment research. Manuf. Autom. 2014, 36, 8–9. [Google Scholar]
  27. Wang, H. Environmental Impact Evaluation of Straw Biogas and Straw Gasification Project Based on LCA. Ph.D. Thesis, Chinese Academy of Agricultural Sciences, Beijing, China, 2018. [Google Scholar]
  28. Zhang, Y.; Gao, X.; Wang, A.; Zhao, L. Life-cycle assessment for Chinese fuel ethanol demonstration projects. Renew. Energy Resour. 2009, 27, 63–68. [Google Scholar]
  29. Guo, J.; Wang, S.; Yin, Q.; Zhu, L.; Luo, Z. Life cycle assessment compapision of biomass to gasoline through MTG and STG methods. Acta Energ. Sol. Sin. 2015, 36, 2052–2058. [Google Scholar]
  30. Wang, C.; Zhang, L.; Pang, M. A Review on Hybrid Life Cycle Assessment:Development and Application. J. Nat. Resour. 2015, 30, 1232–1242. [Google Scholar]
  31. Xu, G. Research Review and Future on Biomass Pyrolysis for Bio-oi. Yunnan Chem. Technol. 2019, 46, 148–149. [Google Scholar]
  32. Meng, G.; Sun, L.; Chen, L.; Zhao, B.; Zhang, X. Research advances of biomass catalytic pyrolysis. Shandong Sci. 2016, 29, 50–54. [Google Scholar]
  33. Haiyan, L. Integrated Performance Evaluation of Liquid Fuel Production from Biomass Pyrolysis Based on Exergy Theory. Master’s Thesis, Southeast University, Nanjing, China, 2015. [Google Scholar]
  34. Huo, L.; Zhao, L.; Meng, H.; Yao, Z.; Cong, H.; Wang, G. Life cycle assessment analysis for cogeneration of fuel gas and biochar. Trans. Chin. Soc. Agric. Eng. 2016, 32, 261–266. [Google Scholar]
  35. Li, M.; Zhao, W.; Xu, Y.; Zhao, Y.; Yang, K.; Tao, W.; Xiao, J. Comprehensive Life Cycle Evaluation of Jet Fuel from Biomass Gasification and Fischer–Tropsch Synthesis Based on Environmental and Economic Performances. Ind. Eng. Chem. Res. 2019, 58, 19179–19188. [Google Scholar] [CrossRef]
  36. Searchinger, T.D.; Hamburg, S.P.; Melillo, J.; Chameides, W.; Havlik, P.; Kammen, D.M.; Likens, G.E.; Lubowski, R.N.; Obersteiner, M.; Oppenheimer, M.; et al. Fixing a critical climate accountinq error. Science 2009, 326, 527–528. [Google Scholar] [CrossRef]
Figure 1. Technological process of the non-phase-transition drying pyrolysis and mass conversion technology.
Energies 14 07394 g001
Figure 2. Lifecycle assessment system boundary of the non-phase-transition drying pyrolysis and mass conversion technology.
Energies 14 07394 g002
Figure 3. Energy consumption distribution of the non-phase-transition drying pyrolysis and mass conversion technology.
Energies 14 07394 g003
Figure 4. Distribution of consumption of three kinds of energy for the non-phase-transition drying pyrolysis and mass conversion technology.
Energies 14 07394 g004
Figure 5. Distribution of additional energy consumption for the non-phase-transition drying pyrolysis and mass conversion technology.
Energies 14 07394 g005
Figure 6. Economic cost distribution of the non-phase-transition drying pyrolysis and mass conversion technology.
Energies 14 07394 g006
Figure 7. Distribution of CO2 equivalent emission in each link of the non-phase-transition drying pyrolysis and mass conversion technology.
Energies 14 07394 g007
Figure 8. Error analysis for CO2 equivalent emissions from the non-phase-transition drying pyrolysis and mass conversion technology based on fluctuations in straw calorific value.
Energies 14 07394 g008
Figure 9. Distribution of CO2 equivalent emission in each step of the non-phase-transition drying pyrolysis and mass conversion technology.
Energies 14 07394 g009
Table 1. Cost table for the non-phase-transition drying pyrolysis and mass conversion technology.
ItemCost (USD/a Ton of Wet Straw)
Entry 1data
Straw collection39.15
Straw transportation7.83
Electric cost10.21
Circulating water0.06
Purified air0.05
Equipment maintenance cost1.37
Labor charges6.79
Equipment depreciation2.85
Alkali17.76
Water0.91
The cost in total86.98
Pyrolysis liquid71.24
Flue gas purification materials61.06
Total revenue132.30
Total profit45.32
Table 2. Partial material and energy inventory of the non-phase-transition drying pyrolysis and mass conversion technology.
ItemInputOutput
Straw collection and transportationStraw, 1 tStraw, 1 t
Gasoline, 1 kg
Straw dryingStraw, 1 tDry straw, 0.72 t
Thermal energy consumption, 726.51 MJVapor, 0.28 t
Straw crushingDry straw, 0.72 tStraw granules, 0.72 t
Electric consumption, 43.37 MJ
Biomass pyrolysisStraw granules, 0.72 tPyrolysis liquid, 0.43 t
Thermal energy consumption, 1254.10 MJNon-condensing vapor, 0.14 t
Electricity consumption, 180.72 MJPyrolysis residue, 0.14 t
Non-condensing vapor combustionNon-condensing vapor, 144.58 kgExhaust gas, 1068.68 kg
Air, 924.10 kgThermal energy, 1980.72 MJ
Pyrolysis residue processingPyrolysis residue, 0.14 tFlue gas purification material carrier, 0.09 t
Alkali, 0.07 t
Water, 0.72 t
Electric consumption, 53.98 MJWaste lye, 0.79 t
TotalStraw, 1 t
Gasoline, 1 kgPyrolysis liquid, 0.43 t
Electric consumption, 278.07 MJExhaust gas, 1068.68 kg
Air, 924.10 kgFlue gas purification material carrier, 0.09 t
Alkali, 0.07 tWaste lye, 0.79 t
Water, 0.72 t
Table 3. Composition and content of exhaust gas in non-condensing steam combustion.
ComponentContent (Nm3·h−1)
CO2178.89
H2O238.66
Air650.99
Publisher’s Note: MDPI stays neutral with regard to jurisdictional claims in published maps and institutional affiliations.

