Review

Refrigerated Transport: State of the Art, Technical Issues, Innovations and Challenges for Sustainability

Department of Industrial Engineering, Università di Salerno, Via Giovanni Paolo II, 84084 Fisciano, SA, Italy
*
Author to whom correspondence should be addressed.
Energies 2021, 14(21), 7237; https://doi.org/10.3390/en14217237
Submission received: 20 September 2021 / Revised: 19 October 2021 / Accepted: 26 October 2021 / Published: 2 November 2021

Abstract

:
The cold chain is responsible for perishable products preservation and transportation, maintaining a proper temperature to slow biological decay processes. Often the efficiency of the cold chain is less than ideal, significantly increasing food waste and energy consumption. Refrigerated transport is a critical phase of the cold chain because of its negative impact on energy consumption and greenhouse gas emissions. It is estimated that around 15% of global fossil fuel energy is used in the refrigerated transport sector, so there has been a growing interest in the last decades in the optimization of these systems in order to reduce their environmental impact. Vapor compression refrigeration units, usually powered by means of a diesel engine, are the most commonly used systems in road refrigerated transport. This paper provides a review of (a) currently used systems and alternative technologies that could reduce the environmental impacts of road refrigerated transport and (b) optimization models and methods used to minimize fuel/energy consumption and greenhouse gas emissions, focusing both on reducing the thermal loads and solving the refrigerated vehicle routing problem.

1. Introduction

The growing need to ensure the preservation of perishable goods (foodstuffs, pharmaceuticals or similar products), together with the widespread use of refrigeration systems since the twentieth century, has led to an ever-increasing interest in the process that is commonly called the “cold chain”. This expression indicates the path, from the producer to the consumer, followed by the products that need to be maintained at a controlled temperature. The cold chain can be divided into five main phases:
  • Production/Packaging;
  • Storage;
  • Transport (also present among other phases);
  • Sale;
  • Preservation (consumer).
Vapor Compression Refrigeration (VCR) units are the most used systems (market share of 80% [1]) in refrigeration (industrial, commercial, domestic, refrigerated transport) and air conditioning (domestic and automotive) applications. These systems are responsible for the consumption of about 15% of the world’s electrical energy and contribute about 10% to greenhouse gas emissions [1]. In particular, VCR systems cause indirect emissions, related to the production of electrical/mechanical energy for the compressor supply, and direct emissions, due to the loss of refrigerant charge that occurs over time (up to 30%/year depending on the application [2]).
Refrigerant leakage also causes a reduction in the efficiency of the refrigeration system and, therefore, an increase in energy consumption and greenhouse gas emissions [3]. The most widely used refrigerants are HydroFluoroCarbons (HFCs), which are going to be phased out of the regulation EU No. 517/2014 [4] because of their high Global Warming Potential (GWP).
Numerous studies are still underway in order to reduce greenhouse gas emissions related to refrigeration and air conditioning systems by replacing HFCs with new refrigerants [5,6]. Although direct emissions due to refrigerants with low GWP are negligible compared to the case of HFCs, the increase in energy consumption (and consequently indirect emissions) due to the loss of refrigerant charge is significant [7]. A critical review of the parameters used for the assessment of the environmental impact of RACHP (Refrigeration, Air Conditioning, Heat Pump) systems has been conducted by Mota-Babiloni et al. [8].
It is estimated that about a third of global food products is lost or wasted along the food chain before reaching the consumer [9]. Perishable food, such as fruits, vegetables, dairy products, meat and fish products, need to be kept at a controlled temperature along the entire supply chain. The low efficiency of the actually used systems can cause product waste. Significant difficulties in this regard are encountered during transport, in particular during loading and unloading operations [10]. Product transport is practiced, in most cases, on the road [10,11] by means of special vehicles having a part of the bodywork thermally insulated and equipped with systems capable of lowering the temperature inside the empty body and maintaining it at a certain value. Food waste during transportation phases can be caused by the following:
  • Heterogeneity of air and food temperatures inside the refrigerated compartment, due to the type of the air delivery systems and the load patterns used;
  • Increase in air and, consequently, food temperatures due to warm air infiltration that occurs during door openings in loading/unloading operations;
  • Insufficient refrigeration capacity.
Further information concerning air infiltration and the temperature distribution inside the refrigerated compartments are respectively reported in Section 5.2 and Section 5.3.
Unlike static refrigeration units, refrigerated transport systems are subject to a strong variability of operating conditions (weather conditions, orientation of insulated walls, frequency of loading/unloading operations). This results in a generally lower COP than corresponding static systems [12].
The thermal load experienced by a refrigerated compartment is mainly given by:
  • Transmission load, depending on the shape, size, color of the refrigerated vehicle, the stratigraphy of the insulated walls and the characteristics of the route taken;
  • Infiltration load, due to the doors opening/closing cycles during loading and unloading operations;
  • Respiration heat load, due to the transformation of sugar and oxygen into CO2 e H2O that takes place in fresh products such as fruits and vegetables.
Thermal energy sources inside the compartment also contribute to the total heat load.
The presence of a refrigeration system on a vehicle causes an increase in the engine load due to three factors: additional weight (refrigeration unit and thermal insulation), increase in the front surface and, therefore, in the aerodynamic resistance of the vehicle (due, for example, to the presence of the condenser in the case of a VCR system) and refrigeration unit power supply [13], that is usually obtained by absorbing mechanical energy from the vehicle’s internal combustion engine.
Over the years there has been an increase in the number of refrigerated vehicles circulating, due to an increase in the quantities of products transported. This has led to an increasing energy consumption by the refrigerated transport industry [12,14]. It is estimated that around 15% of global fossil fuel energy is used in the refrigerated transport sector [15]. In the case of VCR systems, the greenhouse gas emissions due to the operation of the refrigeration system, including both direct and indirect emissions, can reach 40% of the total vehicle’s engine emissions [12].
Considering the growing interest in refrigerated transport, as evidenced by the increasing number of publications shown in Figure 1, a review of the studies conducted is indispensable, focusing both on refrigeration systems and on analysis/optimization methods.
Section 2 describes the test procedures indicated by the ATP agreement (Agreement on the International Carriage of Perishable Foodstuffs and on the Special Equipment to be used for such Carriage [16], abbreviated, in French, in Accord Transport Perissable) for refrigerated vehicles highlighting the absence of a reference standard for the execution of laboratory or road tests.
Section 3 and Section 4 describe, respectively, the systems currently in use in refrigerated transport (VCR systems, cryogenic systems, Phase Change Materials—PCM) and the possible alternative technologies (air, CO2, absorption/desorption cycles), focusing on the solutions proposed in the literature in order to improve the performance of the basic systems.
Section 5 addresses the problem of optimizing refrigerated vehicles. The methods proposed in the literature for the reduction of thermal loads, for the estimation of the temperature distribution inside the compartments and for the solution of the Vehicle Routing Problem (VRP) applied to refrigerated transport are then presented. For these topics some reviews in the literature are recalled, in particular:
  • a review by Selvnes et al. [17] on publications concerning the use of PCMs in refrigerated transport until 2021;
  • a review by James et al. [18] on publications concerning models for estimating the temperature field inside refrigerated compartments until 2006;
  • a review by Awad et al. [19] on publications concerning the solution of the Vehicle Routing Problem applied to refrigerated transport until 2020.
These works represent the starting point for the investigation carried out in this work.

2. Standard for Refrigerated Transport

In 1970 the International Agreement for the Transport of Perishable Foodstuffs (ATP agreement) was signed in Geneva. The ATP agreement is periodically updated and introduces standards regarding road, rail and sea transport (less than 150 km sea crossings preceding or following land journeys on condition that goods are transported in equipment used for road or/and rail journeys without transloading of the goods [16]).
According to the ATP agreement, the insulating capacity of an insulated equipment is characterized by the value of the overall thermal transmission coefficient (K), calculated using Equation (1) (Appendix to the ATP Agreement):
K = W S Δ T
where W is the cooling or thermal power required to keep constant the temperature difference ΔT between the average internal and external temperature during operation, and S is the average thermal exchange surface, given by Equation (2):
S = S i S e
The Si and Se surfaces are the internal and external surfaces of the refrigerated compartment, calculated taking into account the presence of any irregularities.
The ATP agreement defines the test methodologies for the evaluation of the insulating and cooling capacity of refrigerated vehicles. In the case of vehicles of parallelepiped shape, the average internal temperature can be calculated as an arithmetic average of the temperatures measured at a distance of 10 cm from the walls at the eight inside corners of the refrigerated compartment and the centres of the four inside faces characterized by the largest area [16]. The calculation of the average external temperature takes place in the same way, placing the sensors at the corresponding points outside the vehicle. If the shape of the vehicle is not parallelepiped, the distribution of the measuring points shall be carried out in the best possible way taking into account the actual shape of the bodywork.
The calculation of the insulating capacity (K) of the walls of the vehicle is carried out in permanent regime by internal cooling or heating method, placing the vehicle inside an isothermal chamber. A cooling or heating system is placed inside the compartment in order to guarantee a temperature difference with the outside of 25 °C ± 2 °C. Once the measuring instruments have been positioned, the internal heating or cooling system is put into operation until a stationary thermal flow through the walls is obtained. Under these conditions it is possible to carry out the calculation of the overall thermal transmission coefficient.
The ATP agreement defines Heavily Insulated vehicles with K values equal to or less than 0.4 W/(m2·K) and Normally Insulated those with K values equal to or less than 0.7 W/(m2·K). Refrigerated vehicles are also classified according to the temperature that the refrigeration system allows to reach and maintain inside the compartment. Regardless of classification, the thermal performance of vehicles deteriorates over time due to the normal deterioration of the insulation. Thermal insulation loss of 3–5% per year is estimated [20]. This leads to an increase in the thermal conductivity of the walls and, consequently, in energy consumption and CO2 emissions. A variability up to 50% in reference to the K value for similar vehicles can be caused by the production process of the insulating material [21].
In addition to the calculation of the insulating capacity of the vehicle, the ATP agreement provides for a series of tests for the evaluation of the cooling capacity of the refrigeration unit, in particular [16]:
  • Tests for three temperature levels between −25 °C and +12 °C obtained by using the on board thermostat. One of the three temperature levels is at the minimum prescribed for the class of the vehicle;
  • A test for the evaluation of the maximum cooling capacity, obtained by excluding the intervention of the thermostat.
During all tests an electric heater is placed inside the compartment in order to allow thermal equilibrium for each temperature level. The quantities measured during the tests are the following:
  • Air temperatures: at least four thermometers are uniformly distributed at the inlet of the evaporator. The same for the outlet of the evaporator and the inlet of the condenser;
  • Electrical energy and fuel consumption;
  • Speed of rotation of the compressors. “If the compressor is driven by the vehicle engine, the test shall be carried out at both the minimum speed and at the nominal speed of rotation of the compressor as specified by the manufacturer” [16]. If the compressor is driven by the vehicle motion, i.e., if the compressor supply system, other than the vehicle’s engine, allows it to operate at a fixed optimal speed, “the test shall be carried out at the nominal speed of rotation of the compressor as specified by the manufacturer” [16];
  • Pressure level at the condenser, the evaporator and the compressor inlet.
The tests are carried out by maintaining the temperature inside the climatic chamber at 30 °C ± 0.5 °C.
The cooling power W0 is calculated using the Equation (3):
W 0 = W j + U Δ T
where Wj is the heat dissipated by the fan heater unit to maintain each temperature difference in equilibrium and U ([W/K]) is the heat leakage coefficient of the insulated body.

Testing Methods

ATP agreement provides for the fulfillment of requirements in terms of maximum cooling capacity as well as thermal insulation, defining the methods of testing. The measured energy consumption is related only to stationary operation under these conditions. Similarly, the ISO 16440-1:2015 standards provide for a test under partial load conditions, obtained by means of the thermostat on board. In both cases, the test conditions are very far from actual on-road operation [22], so it is difficult to make a comparison between the standard technologies and the proposed alternatives, in terms of performance, energy or fuel consumption and environmental impact. Further details about testing methodologies can be found in EN16440 and EN17066 standards.
The performance of a refrigeration system powered by the vehicle engine is highly dependent on the operating conditions of the vehicle (speed and load). The consumption and emissions of refrigerated vehicles are given by the energy required for traction and refrigeration, but the contribution due to air conditioning inside the driver’s cab must also be considered.
To date, there is no legislation that defines standard test methodologies for the analysis of refrigerated transport systems during real road operation. All experimental studies are carried out considering arbitrary operating conditions. One solution could be to consider the driving cycles used to assess vehicle fuel consumption and emissions in the transport sector, such as the New European Driving Cycle (NEDC), the Worldwide harmonized Light duty Test Cycle (WLTC) and the Common Artemis Driving Cycle (CADC), represented, respectively, in Figure 2, Figure 3 and Figure 4:
With regard to the estimation of emissions and fuel consumption, there are no special calculation models for the study of refrigerated vehicles. The same methods used in the transport sector are usually used, i.e., macroscopic models such as MOBILE (Mobile Highway Vehicle Emision Factor Model), COPERT (Computer Programme to calculate Emissions from Road Transport), HBEFA (Handbook Emission Factors for Road Transport), ARTEMIS (Assessment and Reliability of Transport Emission Models and Inventory Systems), that are based on the average speed during the journey, or microscopic models such as PHEM (Passenger Car and Heavy Duty Emission Model) and MOVES (Motor Vehicle Emission Simulator), which are based on instantaneous data (second by second) [13].
Yang et al. [13] conducted a numerical and experimental study on the assessment of the fuel consumption and emissions of three different refrigerated vehicles equipped with a VCR system. The characteristics of the tests carried out are shown in Table 1. They used the PHEM model, validated using the London Drive Cycle (LDC), represented in Figure 5, on a roller test bench. The emissions were measured using a gas analyser.
Results show that CO2 and NOx emissions of the vehicles considered are higher than standard vehicles (+15% and +18%, respectively), confirming the increase in engine load due to the supply of a refrigeration system.
Different operating scenarios and vehicles can be considered by measuring engine emissions directly at the exhaust using portable devices called PEM (Portable Emission Measuring), in order to carry out tests considering the real behavior of a generic vehicle on the road [13,22,24]. A study conducted by Lawton et al. [24] in 2019 demonstrated that an auxiliary diesel engine powering a VCR unit for a 13.6 m semi-trailer refrigeration emits between 25 and 66 times more NOx than a modern Euro VI diesel engine, depending on the tests conditions (pull-down and part load conditions). The reason of such difference is that diesel engines used in transport refrigeration units are designed following less stringent standards than those regarding road transport vehicles. In order to achieve a significant reduction in transport refrigeration units emissions more stringent regulations for non-road engines need to be developed.
In order to evaluate the impact of refrigeration systems on the overall vehicle emissions, it’s necessary to model the vehicle’s body, the transient behavior of the refrigeration unit and of the vehicle’s engine and driveline. This allows one to make comparison between different solutions under arbitrary climate conditions in terms of energetic performance and environmental impact [25]. However, it is essential to define a standard regarding the driving cycle and the quantities to be measured, in order to make it possible to compare different solutions.

3. Refrigeration Systems Currently in Use

The refrigeration systems used in refrigerated transport are mainly based on the VCR cycle. In order to meet the requirements of the ATP agreement and the refrigeration needs in a wide range of operating conditions, these systems are generally oversized, guaranteeing a cooling capacity up to 1.75 times the calculated thermal load [12]. Other systems are cryogenic systems and PCMs [16], much less used compared to the previous ones.

3.1. Vapour Compression Refrigeration Systems

VCR systems are based on the vapour compression refrigeration cycle and consist mainly of the following components:
  • Evaporator: allows for the evaporation of the refrigerant by absorbing thermal energy from the environment to be cooled (cooling effect);
  • Compressor: compresses the refrigerant from the minimum pressure of the cycle (evaporator) to the maximum pressure (condenser) by absorbing mechanical energy from an external source;
  • Condenser: allows for the condensation of the refrigerant by rejecting thermal energy to the external environment;
  • Expansion device: allows for the pressure drop from the condenser level to the evaporator level.
VCR systems are the most commonly used for refrigerated transport [16], thanks to the wide variety of options regarding the power supply of the compressor:
  • Direct belt drive: the vehicle engine directly drives the compressor through a belt [12];
  • Auxiliary Diesel Unit: the compressor is powered by an auxiliary diesel engine;
  • Auxiliary alternator unit: a dedicated large alternator driven by the main traction engine through a belt is used to power the compressor. An alternative arrangement is to use a diesel generator system;
  • Vehicle alternator unit: the vehicle engine crankshaft drives a single alternator that charges the vehicle battery, which feeds a small refrigeration system (usually with 12 V dc supply).
Figure 6 shows the schematic diagram of a VCR system powered by a diesel engine:
Most refrigerated heavy-duty vehicles use solution (2), while light-duty vehicles use the energy produced by the vehicle’s engine (solutions (1), (3) and (4)), usually diesel-powered. The solution may be chosen considering the duty required, weight, noise and maintenance requirements, installation cost, environmental and fuel considerations [12]. Generally, the expected Coefficient of Performance (COP) is in the range between 0.5 and 1.5 [12].
Refrigeration units are usually controlled by a thermostat that activates/deactivates the compressor or reduces its rotation speed (on-off controller, PI controller, set-point controller, model predictive controller) [27,28]. Refrigerated containers usually use variable capacity systems, obtained mainly through hot gas bypass, suction pressure regulation, digital scroll compressors or the use of an inverter [29].
In configurations involving direct or indirect coupling with the vehicle engine (configurations 1, 2, 3), the operation of the refrigeration system is closely linked to the operating conditions of the engine. This feature leads to a significant increase in energy and fuel consumption during stops for unloading/loading goods, being the engine turned off or in conditions of minimum load (a diesel engine has an efficiency of 1–10% in these cases [30]).
Most of the studies in the literature on the use of VCR systems for the production of cooling energy in the automotive sector concern air conditioning inside vehicles. As far as the refrigerated transport sector is concerned, the proposed solutions for reducing consumption and emissions focus mainly on the power source of the compressor.
Fard and Kajepour [30] conducted a numerical study in which they proposed an anti-idling system consisting in the addition of an auxiliary electric generator and a storage battery, rechargeable by means of the generator or an external source, to power the compressor. This solution allowed the compressor to operate independently of the engine load, bringing benefits from the performance point of view. The use of Regenerative Auxiliary Power System (RAPS) to power the compressor was also considered. The authors developed a control system that ensured the right battery charge during stop periods for the power supply of the refrigeration unit and that allowed a reduction in consumption when the engine is running. The simulations carried out show an effective reduction in consumption, greater in city (−11.9%) than on motorway (−6.6%) driving thanks to the electric power coming from RAPS.
The use of a storage battery for the reduction of consumption and emissions due to the operation of a VCR system was also suggested in a numerical study by Bagheri et al. [31]. They developed a model to estimate the real-time performance of a refrigerated trailer and, in particular, of the refrigeration unit. In the simulations carried out, two different trailers were considered, equipped with two VCR systems operating with R404A and powered by diesel engines, for the storage of products at 4–5 °C during daily delivery missions in Vancouver (Canada). Based on the data provided by the manufacturer, the cooling capacity of the refrigeration system serving the first trailer was equal to 9.38 kW and 14.95 kW for air return temperatures to the evaporator respectively of −18 °C and +2 °C. The cooling capacity of the refrigeration system serving the second trailer was equal to 10.26 kW and 17.59 kW under the same conditions. The average annual COP of the two refrigeration systems considered was respectively equal to 0.58 and 0.62. The simulations carried out show that the use of a battery to replace the diesel engine would allow a strong reduction in fuel consumption (−3105 kg/year) and CO2 emissions (−8320 kg/year) due to the operation of a VCR system at the service of a refrigerated trailer.
Considering that delivery missions take place mainly during the hours when there is availability of solar energy, it is possible to use a photovoltaic system to power the refrigeration unit.
Most of the studies in the literature refer to the use of solar energy in the transport sector. With regard to the supply of refrigeration systems, reference is mainly made to static applications.
In 1998 the first commercial refrigeration system for articulated vehicles powered by photovoltaic panels was developed [32]. This system involved the addition of photovoltaic panels on the roof of the vehicle (surface of 35 m2 for a 4.4 kW photovoltaic system), a charge controller, a lead acid battery and an inverter for the control of a VCR system. The results reported concern experimental tests conducted for a single-delivery mission of goods at a temperature between 3 °C and 7 °C, lasting an average of two hours, in November, in London (UK) [33]. Under these conditions, a battery discharge (nominal capacity = 28 kWh) of about 20% was obtained after six days of delivery. The calculated payback period was about 15 years [34]. This result is certainly different from the one obtainable today having changed both the plant and operating costs.
In 2001 Bergeron [35] carried out a feasibility study on the possibility of using a system of the same type, proposing a system for the storage of electrical (by battery) or thermal (by PCM) energy, illustrating the advantages and disadvantages of both solutions. A heavy-duty vehicle for the transport of cooled (+3 °C) or frozen (−18 °C) products, having a length, width and height of approximately 16 m, 2.4 m and 2.6 m respectively was considered. Thermal insulation was given by an approximately 10cm polyurethane layer. Results show that the use of a battery as a storage system allows the operation of the compressor at an optimal fixed speed (advantage in terms of COP of the system) and guarantees the availability of electrical energy from solar even in conditions of poor insolation. The use of PCM, on the other hand, allows it to have a 60–70% weight reduction with the same cooling energy produced and a lower need for maintenance compared to the solution with electrical energy storage, but requires the use of a variable speed compressor for operation in conditions of intermittent insolation. In general, a battery system allows for the operation for different set-point temperatures, while with the use of a PCM the operating conditions are related to the melting temperature of the material. Considering a temperature inside the refrigerated compartment of −18 °C, an external temperature of 38 °C and assuming a COP of the refrigeration system equal to 0.6, a second law efficiency of about 0.13 was obtained. In order to improve this value, several improvements were proposed:
  • Increase in condenser and evaporator exchange surface;
  • Use of a two-stage compressor;
  • Performance evaluation using alternative refrigerants;
  • Reduction of the energy absorbed by the fans of the heat exchangers.
The replacement of 2.5 cm of polyurethane with a VIP panel (Vacuum Insulation Panel) would also allow the reduction of the thermal load of about 30% (from 3131 kW to 2 kW). The study demonstrated the feasibility of a thermal energy storage system, but the need of a back-up power source was highlighted.
In 2009 Elliston and Dennis [36] carried out a similar feasibility study to the previous one for a VCR system powered by a diesel engine. The PV system consisted of 52 PV modules (90 W, 12 V), 3 lead acid batteries (48 V, 225 Ah) connected in parallel, a 80 A charge controller and a 5 kW 48 V inverter. The battery bank was able to store electrical energy for a 18 h working day. Both PV modules and battery bank were designed to power the VCR unit in order to reduce diesel consumption, so the diesel engine was still used as a backup system. The refrigerated compartment considered had a length, width and height respectively of 14.15 m, 2.4 m and 2.7 m. The results show that the possibility of reducing fuel consumption by 85% by bringing the vehicle’s internal temperature to −18 °C. The study was conducted in Australia, where insolation levels are very high, so it is not likely to achieve similar results in other places with lower levels of insolation.
In 2019 Rossetti et al. [37] developed a prototype of PV powered VCR unit for a small refrigerated truck, which had a length, width and height of 3 m, 2 m and 2 m respectively. A polyurethane foam, covered with fiberglass layers was used for the walls and the ceiling of the vehicle. The proposed system consisted of 6 PV modules (940 W) placed on the roof of the vehicle, a charge controller and a battery pack (capacity of 8640 kJ). The batteries were also connected to the vehicle’s alternator, which was used as a backup system. At an external temperature of 30 °C and an internal temperature of 0 °C, the cooling capacity of the VCR system was 2 kW. The delivery missions considered during the simulations were based on the ECE and EUDC (repeated) standard speed profiles in Athens (Greece), and the VCR system was supposed to operate from 7:00 AM to 6:00 PM. Results show that the energy produced by the PV system is always at least 25% higher than the one required by the VCR system, so the vehicle’s alternator is never used. These results demonstrate the feasibility of using solar energy to power refrigerated transport VCR units.
In 2021 Meneghetti et al. [38] developed an optimization model to size a PV system (PV panels on the vehicle rooftop, power conversion system-PCS and a Li-ion battery bank) for a typical semitrailer used for frozen food transportation. The deliveries considered in the reference case were related to 10 supermarkets in Friuli region (North-Eastern Italy) [38]. The VCR system in question had a COP varying between 0.42 and 0.77. The reference case involved 30 palletised units to be delivered to 10 clients (3 units each) per journey. The distance between two consecutive stops was 20 km. A total trip duration of about 7 h with a typical departure time at 7:00 a.m. was considered. Speed values, affecting delivery timing, varied from 40 km/h (traffic peak) to 70 km/h (quiet periods), considering both urban and semi-urban driving modes. At the end of the delivery missions (after the last client), the refrigeration unit was switched off and the vehicle was parked outside in order to recharge the battery bank until solar irradiance is no longer available. The semi-trailer considered had a S∙U value (product between the heat exchange surface and the global heat transfer coefficient) equal to 48.2 W/K and a rooftop area of 35.3 m2. The model calculated the energy produced by the panels and that absorbed by the refrigeration system for a typical day of each month of the year. The optimal system selected by the model involved 13 PV panels placed on the roof of the vehicle, 31 battery modules (31 kWh total storage capacity), 18 PCS modules (9 kW nominal power) for the reference case [38]. The authors estimated a reduction in emissions up to 89% in the reference case, thanks to the replacement of the diesel engine with the photovoltaic system, and a pay back period of about six years, considering a set-point temperature of −20 °C. Better results in terms of coverage of refrigeration needs through the photovoltaic system and, consequently, of the pay back period, are achievable considering the use in the southern regions. In particular, results show that, considering the climatic conditions of Syracuse (Sicily, Italy), the percentage of coverage of the refrigeration needs moves from 58% (reference case, North-Eastern Italy deliveries) to about 80%, leading to a pay back period of 4.75 years with 37.2 kgCO2eq emissions saving per trip (same photovoltaic installed power).
The increasingly stringent regulations in the field of emissions from internal combustion engines, especially if diesel fuelled, have led to a significant increase in commercial vehicles powered by LPG (Liquefied Petroleum Gas). Setiyo et al. [39] conducted a numerical study in which they evaluated the possibility of recovering cooling energy from the evaporation of LPG in LPG fuelled vehicles. LPG is a mixture of propane and butane in variable ratio, whose evaporation temperature, for a pressure of 1.2 bar, is below −25 °C (for a 70/30 ratio the evaporation temperature is −32 °C [40]). The proposed system, schematically represented in Figure 7, consisted of a secondary evaporator, in parallel with the one of a VCR system, which allowed the heat exchange between the LPG, previously expanded and brought to the desired two-phase conditions, and the indoor air.
The results obtained show a cooling effect of more than 0.8 kW (about 25% of the refrigeration requirement of a medium-sized vehicle) for an LPG mass flow rate of 2.4 g/s, corresponding to the stationary mass flow rate at an engine speed of 3000 rpm. However, this value is variable depending on the operating conditions of the engine (speed and load).
Similar applications for vehicles fuelled by Liquid Natural Gas (LNG) are described in Section 3.3.
Fuel cells represent an alternative to diesel engines powering a VCR system, since they do not cause emissions of greenhouse gases or other pollutants if renewable hydrogen is used [41]. Garde et al. [41] developed a tool in Excel environment able to size the fuel cells and provide hydrogen consumption and energy production, based on the scenario analyzed in terms of thermal load and path. The results obtained using the sizing tool show a hydrogen consumption of about 0.3 kg/100 km for the power supply of a VCR system at the service of a heavy-duty vehicle. A hydrogen tank of 7.5 kg (used in the automotive sector) would allow a refrigeration range of about 2200 km (equivalent to a 25 h operation for a heavy-duty vehicle). The feasibility of such a system was verified, but its application is still limited by the lack of filling stations. This problem can be solved using an on-site hydrogen production system, based on water electrolysis, which would allow a sharp reduction in the price of hydrogen. Fuel cells allow to obtain more than 400,000 EUR of savings over 20 years and a reduction in CO2 emissions up to 21 t/year per vehicle can be achieved by using fuel cell power. Considering the data used by the authors, replacing the diesel engine with fuel cells (with on-site hydrogen production) would result in a pay-back period of about four years.
Table 2 shows a brief description and the main results of the scientific articles considered concerning the use of VCR systems in refrigerated transport.

3.2. Phase Change Materials (PCM)

In PCMs the cooling effect is given by the absorption of thermal energy (thermal load) by a material in phase transition from solid to liquid. Such systems consist of tubes or plates containing a phase change material usually frozen overnight. PCMs can be [42]:
  • Organic: Paraffin or non-paraffin;
  • Inorganic: Salt hydrates or metals;
  • Eutectic solutions: combinations of two or more materials.
The characteristics to consider when choosing a PCM are [42]:
  • Latent heat of fusion: represents the thermal energy that the PCM is able to absorb during the phase transition, per unit volume. It is therefore preferable to choose a material with high latent heat of fusion (lower volumes with the same thermal load);
  • Melting temperature: identifies the field of application of the material;
  • Thermal conductivity.
The melting point must be lower than the desired temperature in the refrigerated compartment, but not too low in order to avoid excessive power absorbed by the recharging refrigeration unit [43]. In refrigerated transport systems, it is possible to use only PCMs or a combination of PCMs with a VCR system.
Shafiei and Alleyne [44] conducted a numerical study proposing a VCR/Thermal Energy Storage (TES) hybrid refrigeration system in which the refrigerant also performed the PCM charging function when the vehicle’s speed exceeded a threshold value. A refrigerating temperature of 3 °C was considered. The container in question had a length, width and height, respectively, of 7 m, 2.4 m and 2.5 m, and was characterized by an overall heat transfer coefficient (product between the global thermal transmission coefficient of the insulated walls and the heat exchange surface) equal to 30 W/K. When the vehicle was stationary or moving at low speed, the cooling effect was given by both the VCR system and the PCM. The results of the simulations show that a 17% reduction in energy consumption can be achieved by charging the TES in moderate traffic conditions rather than in heavy traffic.
Mousazade et al. [45] proposed a hybrid system in which a VCR system was used to recharge the PCM plates when necessary. The VCR system could be internal or external to the compartment. A schematic diagram of the proposed system is shown in Figure 8.
The PCMs tested were E-26, E-29, E-32, which were eutectic-type PCMs with a melting temperature, respectively, of −26 °C, −29 °C and −32 °C. The results obtained relate to the time required for the melting of the different materials according to the speed of the vehicle, since the latter modifies the overall heat transfer coefficient of the refrigerated compartment.
Generally the shape of PCM containers is not optimized for use in refrigerated transport, resulting in a non uniform temperature distribution inside the compartment.
The degradation of the containers, due to a poor stability between the material and the container itself, can also cause contamination of the PCM, leading to a loss of its thermophysical properties [42]. For these reasons, the use of these systems is still limited in the field of refrigerated transport.
The main disadvantages of these systems lie in the possibility of having only one operating temperature and in the duration of the refrigeration effect, both related to the melting process of the material [42].
Further applications of PCMs concern their use for heat load reduction, as reported in Section 5.1.
Table 3 shows a brief description and the main results of the scientific papers considered concerning the use of PCMs in refrigerated transport.

3.3. Cryogenic Systems

In recent years, the high environmental impact of diesel engine powered VCR systems (emissions due to combustion and loss of refrigerant charge) has led to a growing interest in cryogenic refrigeration systems.
Liquid nitrogen (LN2) or liquid carbon dioxide (LCO2) are maintained at a controlled pressure (8.6 bar for LCO2 and 3 bar for LN2) inside an insulated tank.
There are three types of cryogenic systems:
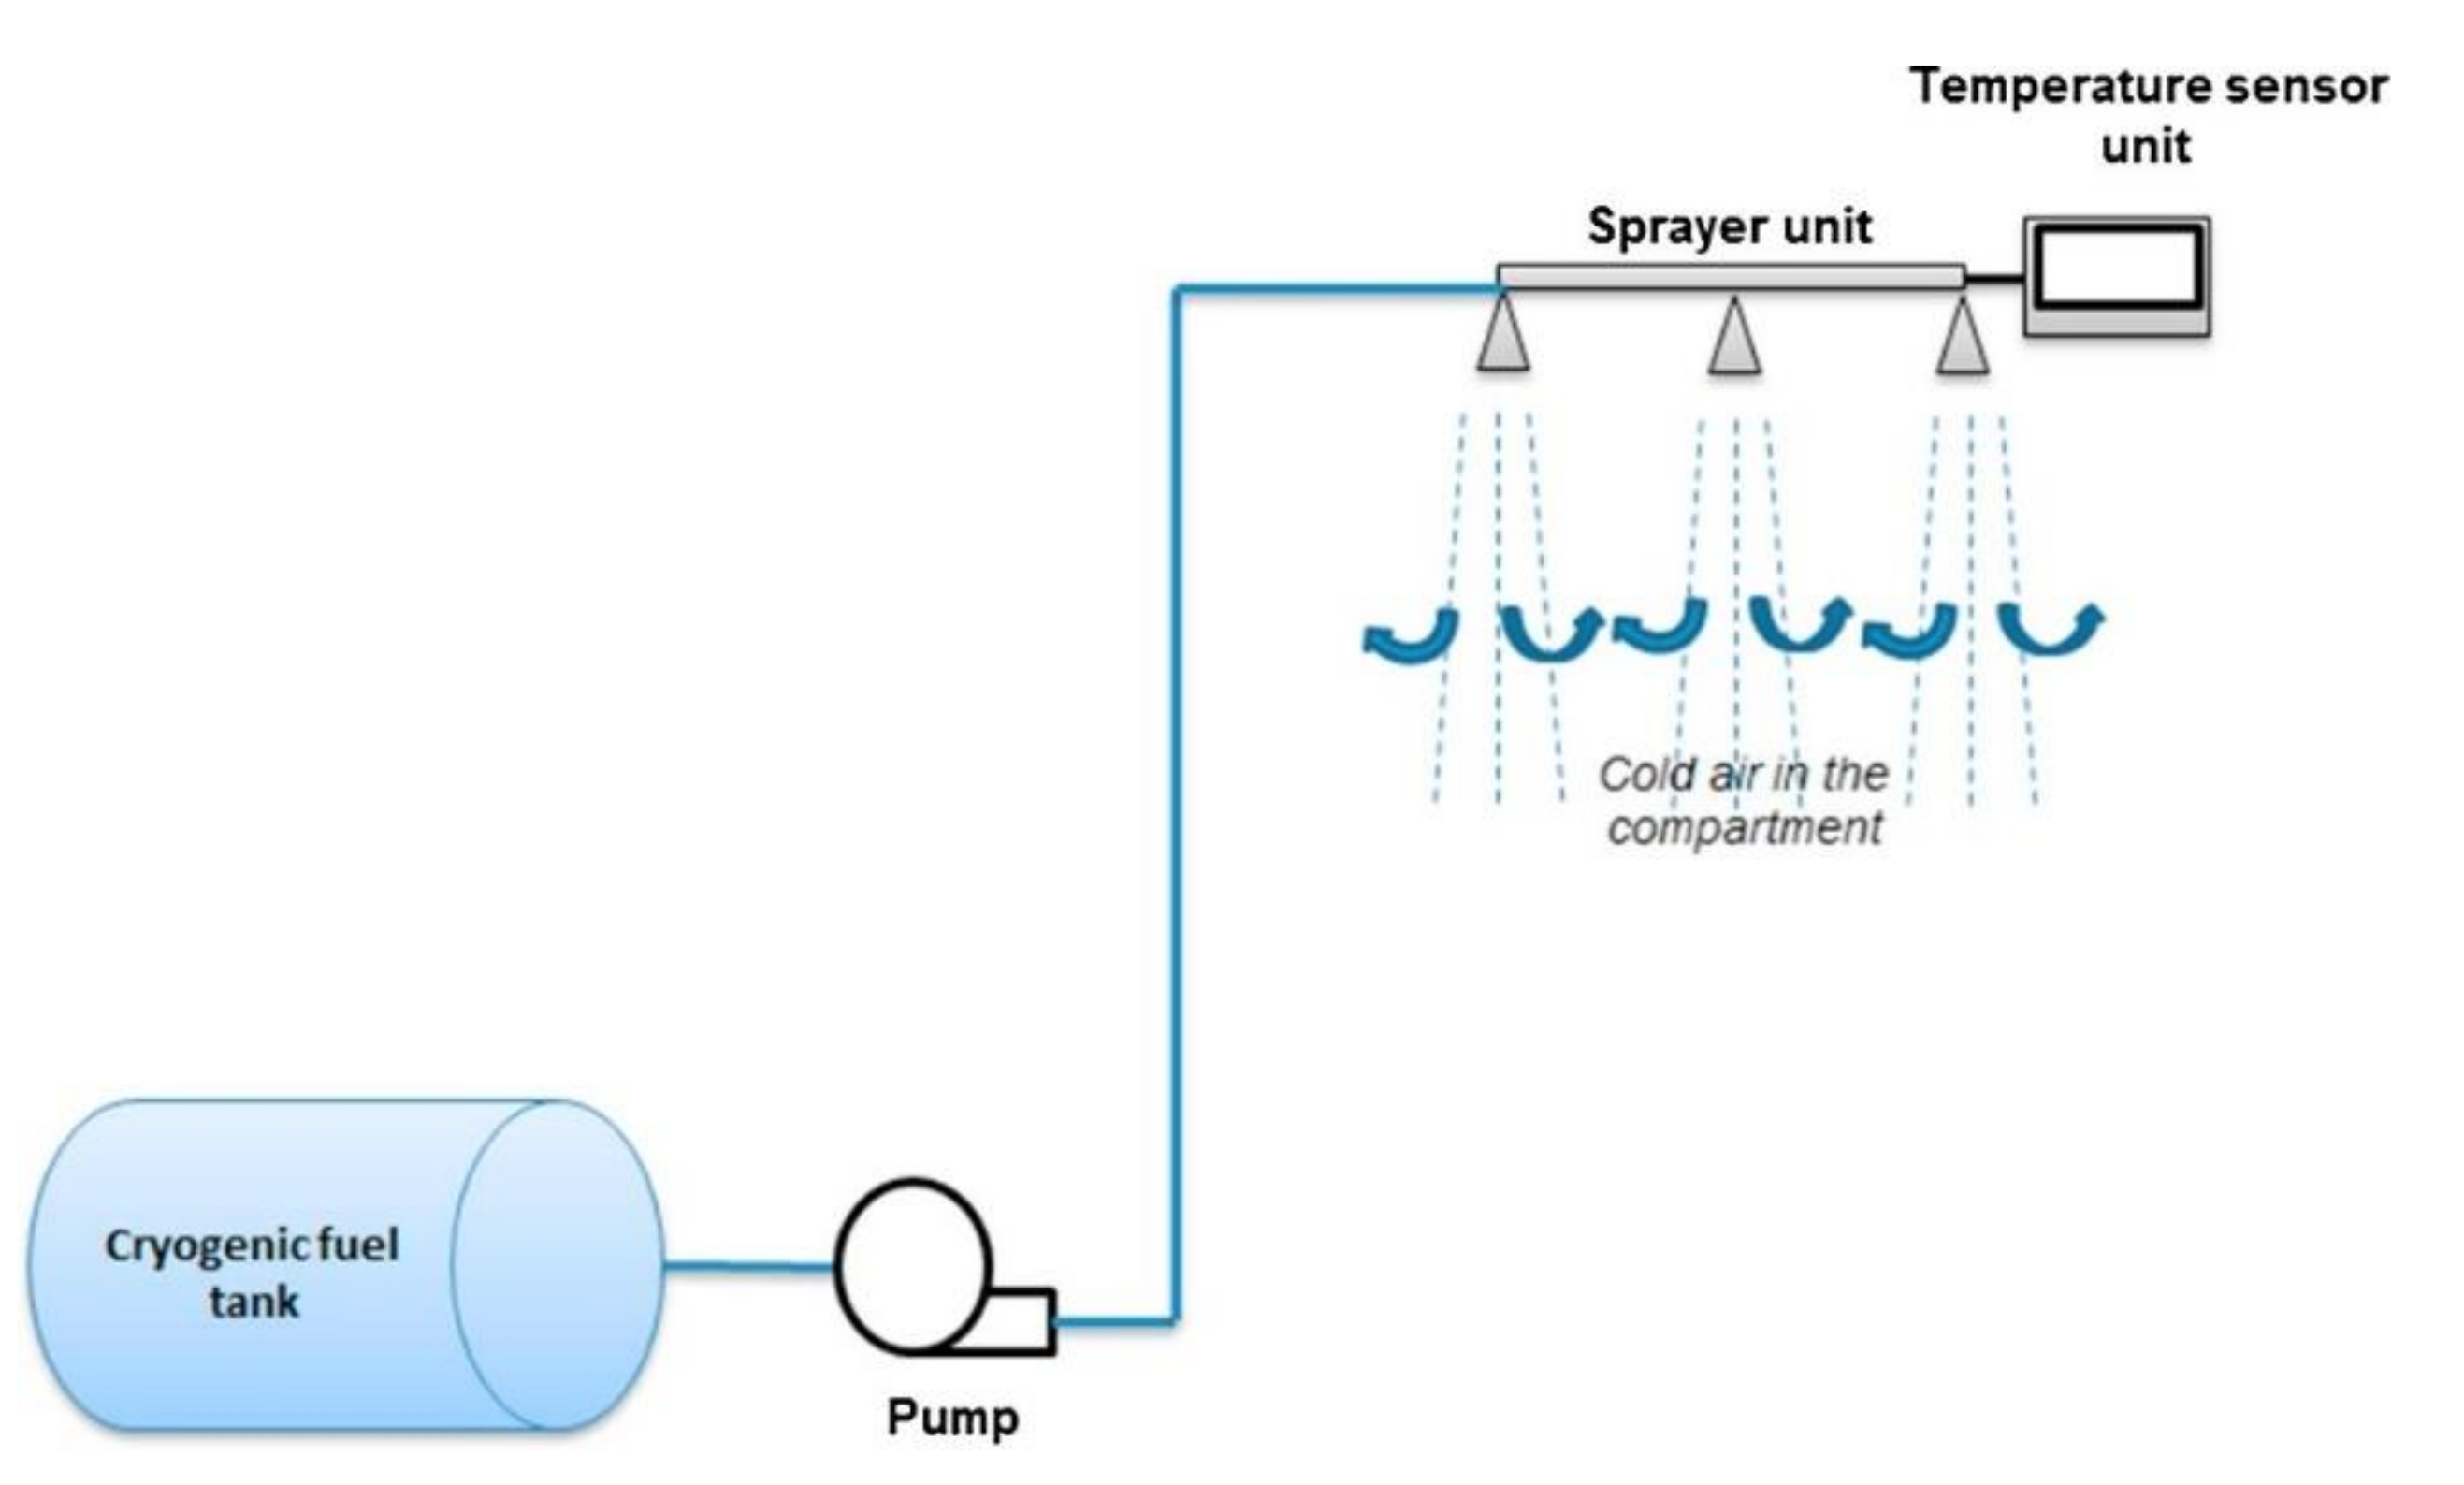
  • Direct: the cryogenic fluid is injected directly into the refrigerated compartment where it evaporates absorbing thermal energy, and then released into the external environment during the door openings. The scheme of a generic direct cryogenic system is represented in Figure 9.
The achievement of an internal temperature of −20 °C, starting from an ambient temperature of 30 °C takes place in less than thirty minutes. The system therefore allows a quick and efficient cooling, but causes a decrease in the concentration of oxygen inside the compartment [26]. In the most modern systems there is an oxygen concentration monitoring system that prevents access to the refrigerated compartment when the oxygen level is low (less than 19.5%) [26]:
2.
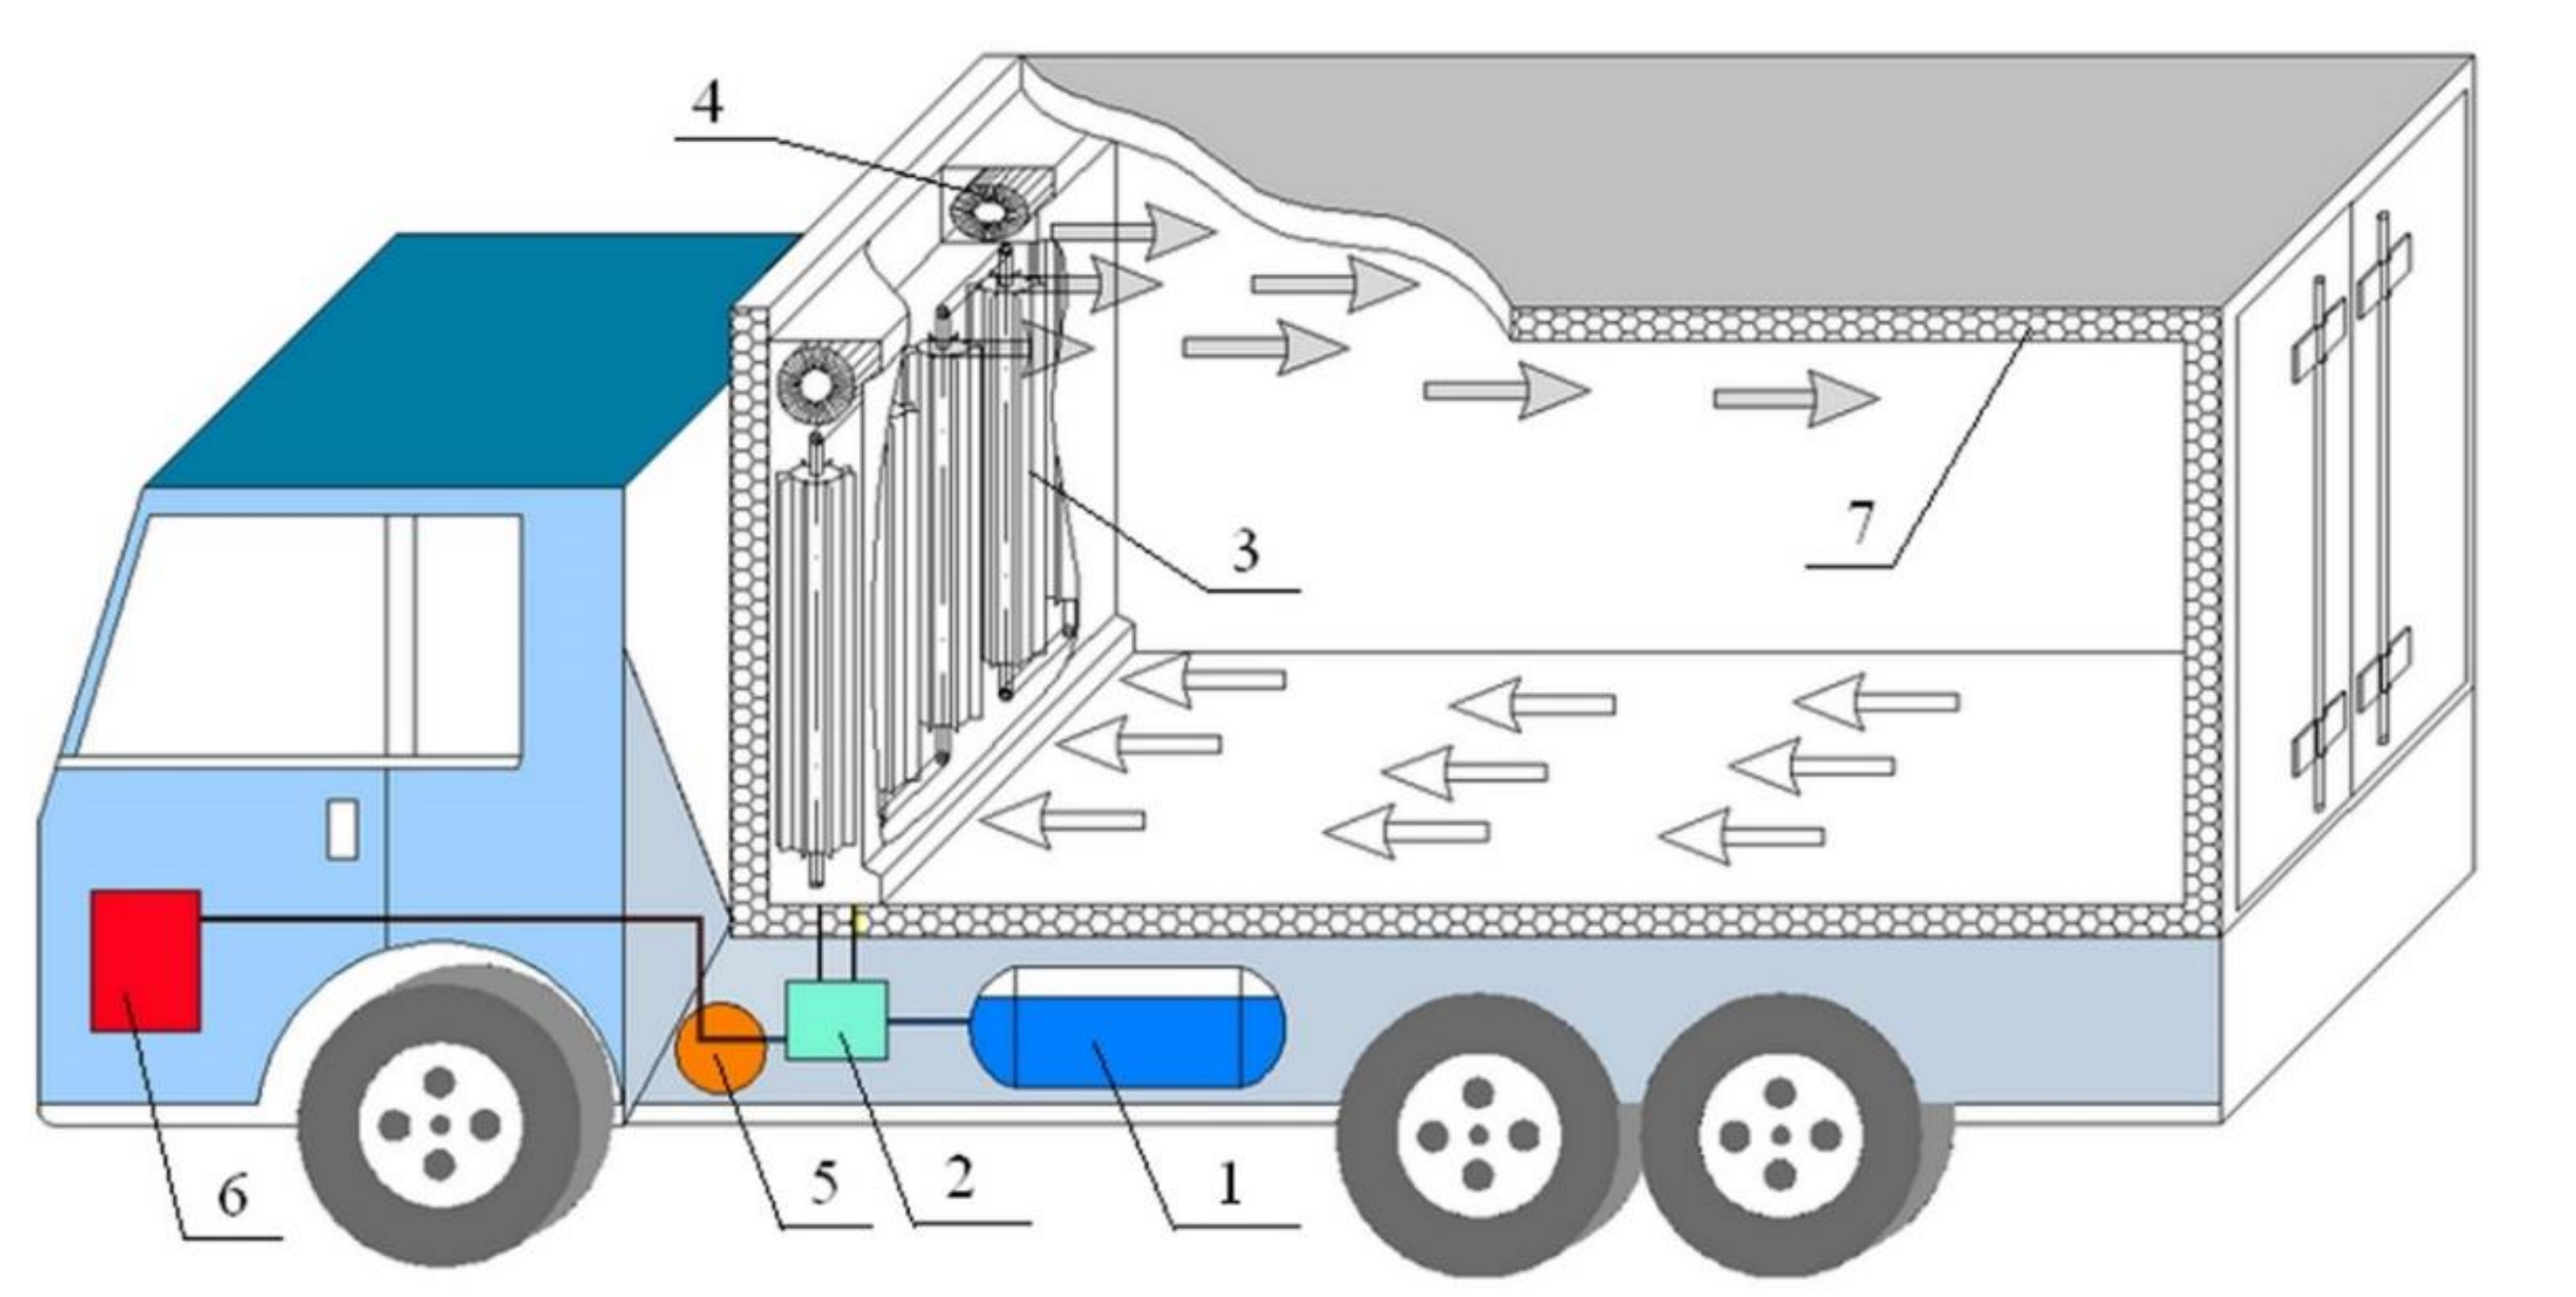
Indirect: the cryogenic gas is expanded in a heat exchanger, in which it absorbs thermal energy from the recirculated indoor air. The gas is then dispersed into the atmosphere. The scheme of a generic indirect cryogenic system is shown in Figure 10.
This avoids the problem of reduced oxygen concentration in the refrigerated compartment, but the time taken to perform the pull-down phases is greater than direct systems [26].
3.
Hybrids: a direct or indirect cryogenic system is added to a VCR system. The cryogenic system allows it to obtain a surplus of cooling capacity, useful especially in the pull-down phases [46].
Rai and Tassou [26] conducted a numerical study in which they compared a VCR system, powered by a diesel engine and operating with R452A, with LCO2 and LN2 cryogenic systems, considering two types of products (pre-cooled or frozen) and two types of vehicles (a 18 t rigid vehicle and a 38t articulated one). The developed model involved the calculation of the consumption of fuel/cryogenic liquid by using conversion factors into greenhouse gas emissions both for production and operation related emissions. The distance traveled considered in the simulations was the one defined by the Common Artemis Driving Cycles (CADC), shown in Figure 11. Considering the same cooling demand, results show that the emissions related to the production of the diesel fuel and refrigerant in the case of the VCR system are up to 66% lower than those related to the production of LCO2 and LN2 (a larger quantity of cryogenic fluids needs to be produced to overcome the same cooling demand). Total emissions (production and operation) from VCR and cryogenic systems, instead, result to be similar, as diesel combustion and refrigerant leakage during operation cause a considerable increase in the diesel engine driven VCR system emissions. As far as operating costs are concerned, there are no substantial differences between cryogenic systems and VCR systems.
Considering the case of frozen food products deliveries in the month of July (highest thermal load) it is required a 64.3 kg/h LCO2 or 68.9 kg/h LN2 consumption [26]. The tanks used in cryogenic systems are usually characterized by a storage capacity of 420–700 kg, leading to an autonomy in the range of 6.5–11 h and 6–10 h for LCO2 and LN2 systems, respectively.
The main advantages of these systems, compared to a diesel engine powered VCR system, are given by the high silence and low maintenance costs (few moving parts), reduced pull-down times and no need for disposal of lubricating oil. As for the payback time, it is difficult to make a direct comparison because of the cost fluctuations of diesel and cryogenic fluids [47].
In order to achieve greater environmental sustainability in the field of refrigerated transport, in recent years there has been a significant increase in vehicles powered by “cleaner” fuels, in particular Liquefied Natural Gas (LNG), composed mainly of methane (>98%) [48]. The LNG is contained in a tank at a temperature between −140 °C and −120 °C and a pressure ranging from 5 bar to 8 bar. Before use, the liquefied gas evaporates absorbing about 900 kJ/kg of thermal energy [49]. The use of this cooling capacity can allow a reduction in consumption due to air conditioning or refrigeration in vehicles. Most of the studies conducted focus on air conditioning, but in the literature there are some applications in the field of refrigerated transport.
Tan et al. [50], in an experimental study, proposed a new refrigeration system in which the evaporation of LNG allowed to recharge a PCM, in particular water/ice. In this regard, a shell and tube heat exchanger, with a rectangular cross-section, was used, as shown in Figure 12. The LNG flowed into the inner tube, while the PCM was placed outside the tube. The results show that the thickness of the ice layer not only increases over time in the radial direction but also propagates in the axial direction. The ice is distributed according to a parabolic shape, following the axial trend of the temperature of the wall of the inner tube.
The aim of the cooling energy storage was to avoid conditions of excessive undercooling in the compartment or reduced/zero cooling capacity, being the flow rate of LNG linked to the load of the engine. Tests conducted involving an exchanger with a smooth inner tube show that the ice layer formed in the outer tube contributes only about 10% to the overall thermal resistance, while the most important aliquot comes from the forced convection heat flow in the inner tube. The use of an internally finned tube (LNG side) significantly improves the heat exchange, as demonstrated by the increase in the contribution of the ice layer on the total thermal resistance (70–77%). The dynamics of ice formation were analyzed in several tests, but in none of these the same operating conditions were considered for both exchangers. It is therefore not possible to make a direct comparison on the rate of increase in ice thickness over time.
The same authors subsequently conducted a numerical and experimental study [48], proposing a refrigeration system in which the LNG present in the tank (1) was sent to an evaporator (3) placed inside the refrigerated compartment, where it absorbed thermal energy from the internal air in order to maintain an internal temperature of −20 °C. A schematic representation of this system is shown in Figure 13.
It was, therefore, an indirect cryogenic refrigeration system. The experimental results obtained show that the temperature inside the cold room can be kept below −20 °C for an LNG flow equal to or greater than 5607 kg/h. This value corresponds to the vehicle engine load equal to one third of the maximum power (75 kW). Under such conditions, the proposed system can completely replace a VCR system. With a LNG flow of 5607 kg/h, a pull-down phase (from 28 °C to −20 °C) has a duration of about 2.5 h.
Wang et al. [49], in a numerical study, proposed a radiant roof system, schematically represented in Figure 14, in which the LNG present in the tank (1) was sent to a heat exchanger (5) to cool a refrigerant. The latter, brought to the desired temperature, was sent to the radiant circuit present in the roof of the compartment (11) in order to absorb thermal energy from the air inside the compartment, while the LNG was superheated to the temperature necessary for combustion before being sent to the engine (13). In the simulations, a light-duty refrigerated vehicle for fruit transportation at a temperature of −1–2 °C was considered.
The simulations were carried out considering the climatic characteristics of 9 April in Haikou (China) with an external temperature varying between 27 °C and 34 °C. Considering a refrigerant flow rate of 70 kg/h, the cooling capacity of the system was always higher than 1.2 kW, ensuring the satisfaction of the refrigeration needs for any value of the LNG flow rate. An increase in the latter from 5.5 kg/h to 9.9 kg/h led to an almost linear increase in cooling capacity from 1.24 kW to 2.46 kW (about 0.28 kW for an increase in LNG flow rate of 1 kg/h). Considering an LNG flow rate of 8.8 kg/h, an increase in refrigerant flow rate of 1 kg/h allowed an increase in cooling capacity of about 0.003 kW.
In the proposed systems, the cooling capacity is linked to the fuel/coolant flow rate and, therefore, to the operating conditions of the engine, so the presence of a backup refrigeration unit is always necessary.
Table 4 shows a brief description and the main results of the scientific papers considered concerning the use of cryogenic systems in refrigerated transport.

4. Possible Alternative Technologies

Other refrigeration systems, alternative to those described in Section 3 and still being studied for application in the refrigerated transport sector, are described here below.

4.1. Sorption Systems

Internal combustion engines typically have a thermal efficiency of about 40%. This means that 40% of the energy produced by combustion is converted into mechanical energy, while the remaining part is contained in the exhaust gases that are thrown back into the atmosphere (about 30% [51]), absorbed by the cooling water or dispersed through the walls of the engine cylinders. The exhaust gas temperature varies between 150 °C and 450 °C, depending on the engine load. It is therefore possible to recover the residual thermal energy contained in the vehicle’s exhaust gases to power an absorption or adsorption refrigeration system. In these systems the mechanical compressor is replaced by a “thermal” compressor and an absorbent (liquid) or adsorbent (solid) substance. When the latter is cooled, it is able to absorb (or adsorb) the refrigerant fluid and release it at condensation pressure when heated. Such a solution would eliminate the mechanical compressor, reducing fuel consumption and emissions related to the refrigeration system.

4.1.1. Vapour Absorption Refrigeration Systems

Koehler et al. [52] conducted a numerical and experimental study in which they calculated the actual thermal energy that can be recovered from the exhaust gases and developed a prototype NH3/H2O Vapour Absorption Refrigeration (VAR) system for refrigerated transport, based on the traditional components (absorber, pump, generator, condenser, expansion device and evaporator). The vehicle considered was a typical refrigerated trailer with dimensions of 13.6 × 2.6 × 2.8 m, characterized by an overall thermal transmission coefficient of 0.4 W/(m2·K). The thermal energy that can be recovered from the exhaust gases is highly dependent on the operating conditions of the engine. In particular, it may be excessive in cases of high load and not sufficient in cases of low load (e.g., city driving conditions). In order to solve these problems, the authors suggested the use of an auxiliary burner to power the system at times of low load and a by-pass system in order to regulate the amount of thermal energy supplied to the generator in times of high load. The evaluation of the cooling capacity and the COP was carried out considering an internal temperature varying between −20 °C and 0 °C and external temperature conditions of 20 °C and 30 °C. The COP of the non-optimized prototype was 0.23–0.30 (based on the internal and external temperature), with the possibility of a significant improvement. In particular, optimizing the heat exchangers design (and, consequently, heat exchanges) and the insulation of the generator could improve the COP of the system by more than 25%. The proposed system was capable of developing a cooling capacity of 6 kW and 8.5 kW for an external temperature, respectively, of 30 °C and 20 °C, and a temperature inside the refrigerated compartment of −20 °C.
An experimental study of the same type was conducted by Horuz [53], confirming the possibility of using VAR systems by recovering thermal energy from the vehicle’s exhaust gases. The author suggested the use of eutectic plates as a backup system in order to meet the demand for cooling energy when the engine works at low loads. It was also highlighted that the presence of a heat exchanger at the exhaust of the vehicle has negative effects on the efficiency of the engine (reduction up to 2%), due to an increase in the pressure of the exhaust gases. The possibility of using these systems for refrigerated transport is therefore linked to the resolution of various problems [54]:
  • Optimization of the heat exchanger for heat exchange with exhaust gases, in order to increase the thermal energy absorbed, reduce the corrosive effect that the gases have on the heat exchanger material and limit the negative impact on the efficiency of the internal combustion engine;
  • Addition of an alternative fuel system that feeds the refrigeration unit when the vehicle is stationary;
  • Installation of the system on vehicles (limited on-board space).
The supply of a VAR system through the exhaust gases of an internal combustion engine therefore has the disadvantage of having a thermal source whose temperature varies according to the engine load. This variability can negatively impact the performance of the system and, consequently, the temperature reachable inside the refrigerated compartment, when the engine load is low. Venkataraman et al. [55], in a numerical study, evaluated the possibility of powering a single-stage NH3/H2O VAR system using thermal energy produced by Solid Oxid Fuel Cells (SOFC), rather than from the exhaust gases of an internal combustion engine, for use in refrigerated transport, as shown in Figure 15.
In the simulations conducted, three types of refrigerated vehicles were considered for the calculation of the thermal load, whose characteristic dimensions are shown in Table 5:
For each type of vehicle, a value of the overall thermal transmission coefficient of 0.3 W/m2·K was considered.
Using SOFC to power a VAR system avoids intermittent operation related to the use of internal combustion engine exhaust gases. It is also possible to vary the operating point on the polarization curve of fuel cells in order to increase or reduce the amount of thermal energy produced [56]. This allows it to reduce the load of the engine, leading to a reduction in consumption and emissions due to refrigeration. SOFC produce electrical energy and heat at the same time, but the latter is usually dissipated. The coupling between the SOFC and the VAR system took place by means of oil instead of a gas (for example, air), so that a more compact heat exchanger could be used. The average COP of this system, for an internal temperature of −20 °C, was about 0.42. According to the authors, the COP could increase by 50–60% by employing the following optimization strategies:
  • improve the effectiveness of the solution heat exchanger;
  • reduce the absorber rejection temperature;
  • increase the difference between the concentrations of the strong and the weak solutions.
Pandya et al. [57] conducted a numerical study on a system very similar to the previous one, considering the same types of vehicles and focusing on the fuel cell power supply circuit. In particular, air and fuel that do not react during cell operation were sent to an afterburner, whose exhaust gases were used to preheat the fuel, water and air upstream of the cell. The two proposed solutions concerned the circuit that led from the afterburner to the exchangers upstream of the cell, considering a series (the exhaust gases of the burner pass through the exchangers in series, Figure 16) and a parallel (the exhaust gas flow is divided into three flows that cross the exchangers separately, Figure 17) circuit.
The simulations were carried out considering heavy-duty (6 kW of required cooling capacity), medium (4 kW of required cooling capacity) and light-duty (1 kW of required cooling capacity) vehicles, for a desired internal temperature of −20 °C. Parallel configuration allows up to 65% less cell surface area to be used to meet refrigeration load, reducing CO2 emissions by 5–30%. The results obtained suggest that VAR systems, powered by fuel cells, allow for negligible greenhouse gas emissions compared to a diesel driven VCR or cryogenic systems and zero PM and NOx emissions [57].
In order to achieve a real advantage in using fuel cells to power a VAR system, the electrical energy produced must also be used, for example by charging the vehicle’s battery. [55]. However, an optimization in terms of size and performance is necessary in order to make VAR systems competitive with traditional systems [56].
Table 6 shows a brief description and the main results of the scientific papers considered concerning the use of VAR systems in refrigerated transport.

4.1.2. Solid Sorption Refrigeration Systems

In adsorption systems, working fluid molecules are adsorbed from the surface of a solid, rather than being absorbed by a fluid as in the case of VAR systems. The main disadvantage of this technology lies in the low COP value, usually lower than 0.4 [58].
Most of the studies in the literature refer to the recovery of thermal energy from exhaust gases for the supply of an absorption/adsorption refrigeration unit for air conditioning inside vehicles, rather than for the storage of foodstuffs. Several studies published in recent years focus on the use of adsorption systems in refrigerated transport.
Gao et al. [59] conducted an experimental study in which they developed and tested a two-stage MnCl2/CaCl2–NH3 adsorption system, powered by engine exhaust gases. A light-duty vehicle with an overall thermal transmission coefficient of 0.35 W/(m2·K) was considered.
Table 7 shows the demand for cooling capacity as a function of the desired internal temperature for the vehicle in question:
The use of two adsorption beds allows it to lower the desorption temperature, so these systems can be used even for low engine loads (low exhaust gas temperature). The laboratory tests were conducted using hot air to simulate exhaust gases. This system is shown in Figure 18.
At a refrigeration temperature of −5 °C the maximum COP of 0.14 was obtained with a hot air/exhaust gas temperature of 270 °C, with an average cooling capacity of 1.52 kW. A refrigerating capacity of 1.19 kW was achieved even when the hot air temperature was as low as 210 °C, satisfying the requirement for transporting fresh goods. For the transport of frozen products (−10 °C) a temperature greater than 270 °C was required, obtaining a cooling capacity of 1.32 kW. The transport of products at −15 °C and −18 °C required, instead, a temperature of at least 330 °C (high loads). It was, in any case, a complicated and heavy system.
In a subsequent experimental study, the same authors proposed a system with a single multi-salt adsorption bed (MnCl2/CaCl2) [60], represented in Figure 19, capable of guaranteeing operation for low engine loads in summer, without the increase in complexity due to the use of two different adsorption beds (two-stage system).
The results show that the adsorption bed is able to desorb much of the ammonia by absorbing thermal energy at a temperature of 200 °C. The COP is about 0.28 at an internal temperature below −10 °C, and about 0.4 at an internal temperature in the range between −5 and +5 °C.
The results obtained show that the previous systems cannot operate stably when the vehicle is stationary, for example in city traffic. In this case, the exhaust gas temperature is usually below 150 °C. The same authors [51] proposed a system capable of working even under these conditions. This system involved the addition of a mechanical compressor to two adsorption beds (MnCl2/CaCl2-NH3), which acted as thermochemical energy storage, as shown in Figure 20.
In the charging phases of the sorption beds, i.e., when they exchanged thermal energy with the hot (desorption phase) or cold (adsorption phase) sources, the refrigeration effect was produced by the VCR subsystem, while in the discharging phases it was produced by the adsorption unit, since the intervention of the compressor was not necessary. The average cooling capacity developed during the discharging phases was 2.2 kW, considering an air temperature at the outlet of the evaporator of −15 °C. At indoor and outdoor temperatures respectively of −20 °C and 30 °C, the proposed system had a COP of 1.4, which was about twice the value of a traditional VCR system at the same operating conditions [51].
Another hybrid VCR/adsorption system, proposed by the same authors [61] in an experimental study, provided that the compression phase was carried out partly by the adsorbent bed (double bed, in order to have continuity of operation) from the evaporation pressure to an intermediate pressure, and partly by the compressor to the condensing pressure, with an intermediate cooling. With this system, schematically represented in Figure 21, it was possible to act on the suction pressure of the compressor, reducing the desorption temperature and allowing operation with a thermal source at a temperature below 90 °C. In addition, the presence of the “thermal” compressor and the cooler allowed a reduction of the compression ratio of the mechanical compressor compared to a traditional VCR system, reducing the electrical energy absorbed.
Considering the relatively low temperature of the required thermal source, engine cooling water could also be used. From the analysis of the possible working pairs for the hybrid system, the most appropriate for the use of hot water below 90 °C is the SrCl2 (8–1)NH3 pair. The results obtained show that, at a condensation temperature of 50 °C and an evaporation temperature of −25 °C, the COP of the hybrid system is equal to 5, much higher than a classic VCR system.
The performance of adsorption systems is linked to the type of adsorbent bed. Sharafian and Bahrami [62] compared different types of adsorbent beds identifying the optimal configuration in terms of COP and SCP (Specific Cooling Power) for use in the automotive sector (air conditioning and refrigeration). In particular, the finned tube configuration is the most performing among the existing adsorbent beds.
Table 8 shows a brief description and the main results of the scientific articles considered concerning the use of adsorption systems in refrigerated transport.

4.2. Air Cycles

Systems based on the air cycle (reverse Joule cycle) represent an alternative to traditional VCR systems in the field of refrigerated transport. In the basic cycle the air undergoes the transformations of compression, cooling, expansion and heating (refrigeration effect). Spence et al. [63] designed, constructed and tested such a system on a refrigerated vehicle, replacing an existing VCR system.
A typical air cooling system with two-stage compression is schematically represented in Figure 22.
The built unit allowed it to obtain a cooling capacity of 7.8 kW at an internal temperature of −20 °C (+8% compared to a VCR system) and 9.5 kW at an internal temperature of 0 °C (−21%). In both conditions, at full load, the use of the air system caused an increase in fuel consumption of 200%, while at partial load (cooling capacity of 3.4 kW, equal to 44% of the capacity at full load) the increase was “only” 80%, equal to 43% of consumption at full load. The proportional variation in fuel consumption with respect to the load suggests that the COP remains more or less constant for each operating condition, so air systems are less sensitive to load variations than VCR systems. The lack of optimization of the components, in particular of the heat exchangers and the compressor-turbine coupling, led to an increase in energy consumption of about 25% compared to the optimized system and turned out to be about twice as much as the equivalent VCR system [64].
In a subsequent numerical study [64], the same authors estimated the COP value for the optimized air system at an internal temperature of −20 °C. The results showed a COP of 0.53, constant in operation at partial loads. When the load decreases by 56%, a VCR system would allow a 26% reduction in fuel consumption, while an air system would allow a 35% reduction.
An air cycle-based refrigeration unit, if optimized in terms of the components used, could therefore be a viable alternative to VCR systems for application in the refrigerated transport sector, especially with regard to partial load operation, which is the main mode of operation during transport missions [63].
Table 9 shows a brief description and the main results of the scientific articles considered concerning the use of air systems in refrigerated transport.

4.3. Low GWP Refrigerants

Due to the phase out of synthetic refrigerants imposed by F-Gas Regulation 517/2014 (EU), in recent years the interest in natural refrigerants such as hydrocarbons, ammonia, water, air and carbon dioxide has grown.
In recent years, it is possible to find few examples of natural refrigerants used in refrigerated transport units. In particular, the use of R290 (propane, a natural hydrocarbon) CO2 has been considered.
Colbourne et al. [65] compared the use of R290 and of R404A in terms of environmental impact. They demonstrated that the COP of the R290 system is higher than the corresponding R404A system of about 15–25% and 10–30% respectively in medium and low temperature applications. In addition, the authors suggested that the R290-based system could achieve a significant reduction in the indirect emissions (−16% diesel consumption) and generate only 34% of the overall global warming emissions with respect to the R404A system.
Ramaube and Huan [66] compared the performance of a VCR system working with R290 and R404A. Considering an ambient temperature and a refrigerating temperature respectively of −20 °C, results show that, with respect to the R404A system, the R290 system has:
  • 28.2% higher average refrigeration capacity;
  • Comparable measured power consumption;
  • 28.6% higher measured COP.
Regarding the flammability of R290, safety precautions about the charge amount were followed using the EN378 guidelines in both the above mentioned studies.
Regarding the use of CO2 systems for refrigerated road transport, there are few studies in the literature [67], as most of the applications are related to air conditioning and maritime transport.
CO2 is non-flammable, non-toxic, has 0 ODP, 1 GWP and can work at temperatures below 0 °C [68]. It is also an inexpensive refrigerant and has higher values of latent heat, specific heat, thermal conductivity, and density than HFCs [69]. The critical CO2 temperature is about 31 °C. CO2 systems work differently depending on the temperature of the fluid during the thermal energy rejection phase: if the temperature of the CO2 in the isothermal phase after the compression phase is lower than the critical temperature the system is called subcritical, otherwise it is called transcritical. In this case the refrigerant is in the gas phase, so there is no condensation phase and the condenser is replaced by a gas cooler.
Only recently CO2 refrigeration systems have been proposed for single-temperature containers, with multistage compressors with variable speed [70].
Lawrence et al. [71] developed a model to estimate the performance of a transcritical CO2 cycle serving a multi-temperature refrigerated container, intended for military applications, where transport takes place mainly by sea or rail. The container in question had a length, width and height respectively of 6.06 m, 2.44 m and 2.59 m. In order to obtain a COP of at least 1 for high outdoor temperatures, the authors considered the use of an internal heat exchanger, a microchannel gas cooler and an ejector for the recovery of expansion work. The saturated vapor CO2 from the separator is superheated by the IHX. Compression (dual stage compression with intermediate cooling) and cooling phases follow. The CO2 at the outlet of the gas cooler undergoes further cooling inside the IHX before being expanded by means of an adjustable ejector. The expanded CO2 is then sent to the separator. The liquid refrigerant from the separator splits into two parts, which are respectively sent to the medium temperature (MT) and the low temperature (LT) evaporators after being expanded by means of expansion valves, allowing to obtain two different refrigerating temperature. The CO2 from the LT evaporator is com-pressed by a LT compressor in order to be mixed with the refrigerant at the outlet of the MT evaporator and then sent to the suction nozzle of the ejector.
The estimated COP was 0.96 at an outside temperature of 57 °C and an indoor temperature of −20 °C. Compared to a traditional transcritical system, the internal heat exchanger, the microchannel exchanger for the gas cooler and the ejector allowed a maximum increase in COP respectively of 35.3%, 5.6% and 27.3%. The results obtained can be extended to the case of the road transport of containers by articulated vehicles.
Artuso et al. [72] developed a model to calculate the performance of a transcritical CO2 cycle for application in refrigerated road transport. This model was used to make a comparison between three types of possible refrigeration cycles, shown in Figure 23:
  • Traditional cycle with low pressure liquid receiver, expansion by back-pressure valve and presence of the internal heat exchanger: the refrigerant leaves the liquid/vapor receiver in saturated vapor conditions. Before being compressed, it is brought into superheated vapor conditions by the internal heat exchanger. After the compression phase, the fluid is sent to the gas cooler/condenser and then undergoes further cooling inside the internal heat exchanger. This is followed by the expansion by means of a back-pressure valve and evaporation phases before returning to the liquid/vapour receiver;
  • Cycle with low pressure liquid receiver, expansion by fixed geometry ejector in parallel to the back-pressure valve and absence of the internal heat exchanger (the refrigerant in the compressor suction line is in saturated vapor condition): at the outlet of the gas cooler/condenser there is a fixed geometry ejector, to which a parallel by-pass back-pressure valve is added in order to control the refrigerant flow rate processed by the ejector. The flow rates from the ejector and valve are mixed and sent to the liquid/vapor receiver. The liquid refrigerant is then expanded to evaporation pressure by means of a manual throttling valve and sent to the evaporator. The vapour refrigerant, eventually superheated, is sent to the suction nozzle of the ejector.
  • Cycle with low pressure liquid receiver, expansion by fixed geometry ejector in parallel to the back-pressure valve, absence of the internal heat exchanger and presence of an auxiliary evaporator between the expansion devices and the liquid receiver: the refrigeration cycle is very similar to that adopted in configuration (b), with the addition of an auxiliary evaporator between the outlet of the ejector/back-pressure valve and the liquid/vapour receiver. The cooling capacity in this configuration is divided between the main evaporator and the auxiliary evaporator.
The simulations were carried out considering a temperature inside the compartment equal to −2 °C and an external temperature ranging from 10 °C to 45 °C. At an outdoor temperature of 30 °C, the traditional cycle provided a cooling capacity of 5.3 kW.
The results show that the adoption of configuration (b) is more advantageous than configuration (a) for external temperatures above 26 °C, while configuration (c) is more advantageous than configuration (a) for any external temperature value. In configuration (c) the cooling capacity provided by the main evaporator increases as the outside temperature increases. When the latter exceeds 36 °C, all the cooling capacity is supplied by the main evaporator. On the contrary, as the outside temperature decreases, the cooling capacity provided by the auxiliary evaporator increases, exceeding that of the main evaporator when the external temperature is below 15 °C.
The estimate of the increase in COP using configurations (b) and (c) compared to configuration (a) was made considering an internal temperature varying between −5 °C and +5 °C. The maximum COP increase of the configuration (b) is equal to +15.9%, at an internal temperature and an external temperature respectively of −5 °C and 42 °C, while for the configuration (c) it is equal to +21% at an internal temperature and an external temperature respectively of 5 °C and 25 °C [72]. At the same internal temperature conditions, configuration (b) is advantageous for high external temperatures, while solution (c) should be used for external temperatures below 30 °C.
Taking advantage of the model proposed by Artuso et al. [72], Fabris et al. [68] carried out a dynamic characterization of a medium-sized refrigerated van equipped with a CO2 refrigeration system and a control system which allowed the system to operate according to each of the three configurations seen above. The truck considered was characterized by length, width and height respectively equal to 3.4 m, 2.6 m and 2.74 m, an internal volume of 20.3 m3 and an overall thermal transmission coefficient of 0.39 W/(m2·K). The control system chose the system configuration in order to maximize the COP or the cooling capacity. In particular, at an internal temperature below 5 °C, the control system made the choice to maximize the COP, while at higher temperatures the configuration was chosen in order to maximize the cooling power and minimize the duration of the pull-down phases. Since the ejector configurations performed better than the traditional system for the entire temperature range considered, the configuration (a) was never chosen by the control system. The average COP of the system, evaluated for long-distance deliveries, was equal to 1.6, with a duty cycle of about 10%. A safety system was also implemented in order to limit the increase in temperature and pressure (low pressure side) due to long periods of inactivity. This system worked by turning on the compressor and by-passing the evaporator. A layer of expanded polystyrene was also added to cover the phase separator, allowing up to one day of inactivity in summer weather conditions without the pressure exceeding the safety threshold. In absence of the insulation layer, the safety system intervened approximately every six hours.
Shi et al. [73] proposed a Combined Refrigeration and Power Cycle (CRPC) system, powered by the thermal energy contained in a vehicle’s exhaust gases [73], for application in a refrigerated truck. In particular, the CRPC consisted of the combination of a transcritical CO2 cycle for the production of cooling energy and a Brayton-Joule cycle for the production of electrical energy.
The proposed system used CO2 as a working fluid and could operate in three different modes (Multi-Mode Combined Refrigeration and Power Cycle-MM-CRPC):
  • Mode R: the system produced only cooling energy. The generator was disconnected from the turbine, which only powered the compressors;
  • Mode P: the system produced only electrical energy. The refrigeration cycle was excluded by means of the three-way valve, so the MM-CRPC became a classic Brayton cycle for the production of electrical energy;
  • Mode RP: the system produced electrical and cooling energy in a combined manner. When the heat load was low the turbine was able to power both the compressors and the generator.
The proposed system, schematically shown in Figure 24, could replace the original apparatus (VCR system powered by a dedicated diesel engine), ensuring the same cooling capacity (10.8 kW and 6.5 kW at evaporation temperatures respectively of 0 °C and −20 °C).
Results show that the MM-CRPC system allows an increase in electrical energy production and a reduction in fuel consumption respectively of +4.8% and −2.9% at an evaporation temperature of 0 °C, and +1.6% and −3.4% at an evaporation temperature of −20 °C. During operation in R mode, the cooling capacity of the combined system is twice the value of the original system under freezing conditions and four times under cooling conditions. During operation in P mode, the system allows an increase in electrical energy produced of 8.3% compared to the original system.
The use of ejectors allows an increase in the suction pressure of the compressor, reducing energy consumption. Pan et al. [74] proposed, in a numerical study, an alternative solution to absorption/adsorption refrigeration systems for the recovery of thermal energy from exhaust gases in order to supply a refrigeration unit. In this case, a Regenerative Supercritical CO2 Brayton Cycle (RSCBC) was able to produce the mechanical energy needed to power the compressor of an ejector cycle (Ejector Expansion Refrigeration Cycle—EERC) operating with a CO2-based zeotropic mixture. The RSCBC could also feed other loads if the cooling demand was low. Figure 25 shows the scheme of the RSCBC/EERC combined cycle:
Figure 26 shows the effect of four CO2-based zeotropic mixtures and the CO2 mass fraction on COP and exergetic efficiency of the combined system at certain operating conditions, in particular:
  • maximum temperature of the RSCBC (Tmax) = 220 °C;
  • maximum pressure of the RSCBC (Pmax) = 15 Mpa;
  • minimum temperature of the RSCBC (Tmin) = 32 °C;
  • minimum pressure of the RSCBC (Pmin) = 7.6 MPa;
  • condensing temperature (Tcond) = 30 °C
  • evaporating temperature (Teva) = 10 °C
  • pressure drop in the suction nozzle (ΔP) = 0.015 MPa.
Among the mixtures considered, R32/CO2 is the most promising one in terms of COP and exergetic efficiency.
Representing an alternative to VAR systems, the authors made a numerical comparison between the performance of the proposed combined system and a traditional LiBr-H2O VAR system. The operating conditions considered in the simulations of the RSCBC/EERC system and the VAR system are summarised in Table 10.
Results show that the COP of the combined RSCBC/EERC system, operating with an R32/CO2 mixture in a 0.9/0.1 ratio, allows it to obtain a cooling capacity equal to about 1.7 times that of a LiBr-H2O VAR system and a much greater COP, as shown in Table 11.
The total energy consumption, including the additional weight and power consumed by the second compressor contributions, accounts for 14.4% of the engine power output to realize refrigeration. The total energy consumed by the VCR system is about 18% of the engine power output, which is higher than that of the RSCBC/EERC related to the same refrigerating capacity (225.5 kW) [74].
Table 12 shows a brief description and the main results of the scientific articles considered concerning the use of CO2 in refrigerated transport.

5. System Optimization

Considering the need to reduce product waste, energy consumption and CO2 emissions related to the refrigerated transport phase, numerous studies have been conducted in recent years in order to optimize the design and use of these systems. In particular, attention has been paid to the reduction of the thermal load (transmission and infiltration), the temperature distribution inside the refrigerated compartment and the optimization of the routes performed by the vehicles.

5.1. Transmission Thermal Load Reduction

The walls of refrigerated compartments are normally made of an insulating foam coated on both surfaces by aluminium, steel or glass reinforced polyester. Today the commonly used insulation is expanded polyurethane foam [12], due to its good mechanical strength, low hydrophilicity and low cost [75]. It can also be recycled, but its production requires a large energy consumption.
The transmission thermal load can be calculated by using Equation (4) [76]:
Q ˙ = K S Δ T
where K is the global heat transfer coefficient of insulated walls, S is the heat exchange surface (average surface) and ΔT is the difference between the outside and inside (set-point) air temperatures. An increase in the thermal load causes an increase in the operating time of the refrigeration system and, consequently, in consumption and emissions.
For a dynamic evaluation of the thermal behaviour of insulated walls, Glouannec et al. [75] used a two-dimensional approach, solving the mass balance and energy equations within the walls. In particular, the Fourier equation for thermal conduction in solid material layers and a conduction-convection equation in air gaps possibly present in walls, associated with the Navier-Stokes equations for the motion field, were considered.
Another method, used by Artuso et al. [77], provides for a 0-D type model, based on lumped parameters energy balance equations for both the walls and the air inside the compartment. In this case, the overall thermal transmission coefficient, calculated considering the stratigraphy of the wall, causes non-negligible errors, so the authors conducted a tuning operation of the coefficients in order to minimize the error committed.
The previous models allow for the study of the thermal behavior of the insulated walls in order to compare different solutions in terms of materials and configurations to improve the thermal performance of the walls.
Several studies on the addition of PCMs in the insulating walls of refrigerated vehicles [75,78,79,80] have shown the possibility of reducing and delaying the thermal load, resulting in a lower cooling energy demand and, therefore, lower energy consumption for refrigeration.
Tinti et al. [79] conducted an experimental study exploring the possibility to incorporate a PCM into a rigid polyurethane foam layer (insulation). The microPCM used was in the form of dry micro-capsules (melting point of +6 °C) and consisted of a fine, dry powder. The capsules contained 85–90 wt% of paraffin-based PCM and 10–15 wt% of inert polymer shell, resulting in a mean particle size of 17–20 µm. Tests were conducted considering different microPCM contents. Results show that the temperature of the specimens increases more slowly in MicroPCM-integrated foams than in the reference case (polyurethane insulation only). Temperature was recorded by using a thermographic camera. In particular, the maximum temperature difference was approximately 3 °C in the case of the lowest MicroPCM content (4.5%), while in the case of the highest one (13.5%) it was approximately 7 °C [79]. Moreover, an increase in the PCM content leads to greater delays of the peak in ΔT vs. time curve [79], varying from approximately 260 s for 4.5% microPCM content to approximately 420 s for 13.5% microPCM content.
Principi et al. [81] conducted an experimental study in which they considered both the addition of PCM to the external compartment walls (case 1) and the use of a PCM air heat exchanger placed near the evaporator of a VCR system (case 2) of a refrigerated container. The experimental set-up consisted of a temperature controlled mini cold room. The maximum and the minimum operating temperatures of the cold room were respectively 8 °C and 0 °C (1140 W of cooling capacity). The cold room walls were made of galvanized metal sheet, insulated by polyurethane foam which determined a total panel thickness of 10 cm. In case 1, tests were conducted during a typical Italian summer (August–September 2014, Ancona, Italy), while in case 2 the cold rooms were tested in laboratory and kept at 32 °C. The addition of PCM to the insulated walls allowed an increase of the compartment wall thermal inertia, leading to a thermal heat flux peak reduction equal to 5.55% and a peak delay of almost 4.30 h. The reduced heat load stored during the day reached the internal refrigerated environment during the night hours, during which the system high performance (due to lower environmental temperature) and reduced energy costs [81]. The PCM air heat exchanger application allowed a reduction in the ON/OFF cycles over time (OFF time increased by about 7.75 min and ON time increased by about 3.17 min). During 2 h of stable operating conditions, a reduction of about 16% in the total electric power consumption was achieved with respect to the reference case.
Further details regarding the use of PCMs for application in refrigerated transport are reported in the review prepared by Selvnes et al. [17], the main results of which are reported in Table 13, Table 14 and Table 15.
Although most studies in the field of thermal insulation of refrigerated vehicles concern the use of PCMs, new insulation technologies have also been analyzed.
A study by Lawton e Marshall [82] suggests that Vacuum Insulation Panels (VIP, λ = 0.002–0.004 W/mK) allow the insulation level to be maintained constant for more than 20 years, with a thermal conductivity much lower than that of traditional insulating foams. The presence of thermal bridges, the high cost and the possibility of vacuum loss due to surface breakage represent, however, a technological obstacle for a wider use of this solution.
Uwa et al. [83] investigated the insulating capacities of polypropylene/nanoclay compounds in variable compositions. The results show a reduction in thermal conductivity up to 50% compared to pure polypropylene (λ ~ 0.3 W / m K ), as well as an increase in mechanical strength. These materials have a lower thermal conductivity than traditional polyurethane insulation, allowing a reduction in the transmission thermal load and, consequently, in consumption and emissions related to the refrigeration unit.
Table 16 shows the thermal conductivity values of the insulating materials considered.

5.2. Infiltration Heat Load Reduction

Most of the studies in the literature on the quantification of the infiltration thermal load concern the case of high refrigerated volumes and short-lived door openings. In these cases, from the physical point of view, the flow quickly reaches stationary conditions [84]. For large refrigerated chambers, the infiltration thermal load is small compared to the thermal inertia of the indoor air, so the flow can be considered as fully developed [85] and it is possible to use analytical expressions based on the ideal flow hypothesis, shown in Table 17.
ASHRAE [87] suggests using Gosney and Olama’s formulation to calculate the infiltration heat load for large refrigerated volumes.
With regard to the mass and energy flow due to air infiltration through doors in the context of refrigerated transport, there is still a limited number of studies in the literature. The global heat transfer coefficient identified by ATP standards recognizes only heat exchange through walls, neglecting the contribution due to hot air infiltration that occurs during the doors openings. The infiltration of humid hot air is also the main cause of ice formation on evaporators [88], with the consequent increase in energy consumption due to the use of defrost systems. Because of the difference in density between cold and warm air, this first flows out of the truck from the lower part of the opening, while warm air enters the truck through the upper part. As it is a typical natural convection process, it is called “natural infiltration” [89]. The thermal load due to the infiltration of warm air during the doors opening represents an important percentage (about 30% [26,47]) of the total refrigeration load and, therefore, of the energy consumption, variable according to the number and duration of the openings.
Tso et al. [90] experimentally studied the infiltration heat load of a 7.2 m3 refrigerated compartment with an opening of 0.9 m2. The authors found a heat load of 3.27 kW by measuring the temperature and humidity before, during and after the door opening period.
Lafaye de Micheaux et al. [85] conducted a numerical and experimental study on the evaluation of the infiltration thermal load in a refrigerated truck (outer dimensions 2.6 × 2.6 × 5.68 m and inner dimensions 2.35 × 2.5 × 5.51 m, K = 0.576 W/m2·K). Tests and CFD simulations showed that in the case of smaller refrigerated volumes, such as refrigerated van compartments, the flow cannot be considered as fully developed, so analytical formulations cannot be used. In particular, in this case two mechanisms of mass and energy exchange were found [85]:
  • Buoyancy driven flow: unsteady flow due to the difference in density between indoor and outdoor air;
  • Boundary layer flow: natural air convection on the cold vertical walls of the refrigerated compartment. This flow is established when the internal temperature approaches the external one. Therefore, an almost stationary heat exchange condition is reached until the door is closed. In this case it is possible to use the classic formulations for natural convection on a vertical wall.
The most widely used method of reducing infiltration is transparent PVC strip curtains [88,91], commonly considered unsafe, not particularly efficient, unhygienic. They also require a lot of maintenance operations [88].
The most promising method is represented by air curtains. It is a ventilating unit positioned above the door that produces a vertical air jet, forming a barrier against the entry of air, dust, odors and insects. In some cases, there is an air recirculation system at the bottom.
Through the use of CFD models it is possible to predict temperature variations over time and space both inside and outside the refrigerated compartment. It is therefore possible to evaluate the effect of the presence of an air curtain. Foster et al. [88] estimated an air curtain efficiency of 0.71 using a three-dimensional CFD model. This means that 71% of air infiltration is eliminated thanks to the barrier. In another study [91], the influence of jet velocity on efficiency was also evaluated. The use of an air curtain allows for a reduction in the mass of incoming hot air and energy consumption respectively by 38% [84] and 40% [90]. A numerical study conducted by Rai et al. [89] demonstrated the existence of an optimal air jet velocity that minimizes the energy required to bring indoor air and transported products back to set-point temperature (recovery energy), using a CFD model. In the case analyzed, with an air jet speed of 3.1 m/s a reduction in the required recovery energy of 48% is obtained.
The same authors subsequently conducted two numerical studies focusing on the discharge angle of the air jet [92] and the position of the barrier [93], by CFD simulation. The choice of the optimal discharge angle allows a reduction in the bending of the air jet due to the natural infiltration flow. Results show that at low jet speeds (up to 3 m/s) the effect of the discharge angle is negligible. At speeds of 4 m/s and 5 m/s, a discharge angle of 10° allows a reduction in the required recovery energy respectively of 5.6% and 17.6% compared to the standard case with vertical flow. The positioning of the ventilation unit outside the refrigerated compartment allows a slight energy saving in all discharge speed conditions, with a peak of −8.24% for a speed of 2 m/s. Air curtains allow a reduction in the natural infiltration flow. When the air jet hits the floor, it splits in two parts, one of which flows inside (forced infiltration), while the other flows outside. This forced infiltration flow [89,92,93], has no effect on the choice of the positioning of the ventilation unit as the forced convection flow is very similar in the two cases [93].
Most of the studies conducted on the effectiveness of air curtains against air infiltration concern static applications. Studies are still underway for the application in refrigerated transport, considering the great applicative importance.

5.3. Temperature Distribution Inside a Refrigerated Compartment

The achievement of a uniform temperature inside a refrigerated compartment is essential in order to preserve the quality, safety and life of the products, as well as to ensure a correct distribution of the cooling capacity and a reduction in energy consumption [94].
In the case of VCR systems the evaporator is usually placed in the upper area of the refrigerated compartment, near the roof, causing an asymmetrical flow. In addition, the positioning of the product load and the resistance to the passage of air caused by the narrow space between the containers lead to a non-uniform distribution of air, with the consequent presence of areas with poor ventilation [95]. In these areas, especially in the one furthest from the evaporator, it is possible to find higher temperatures, even if the cooling capacity is higher than the total thermal load. It is therefore clear that the study of the refrigeration system only is not sufficient to guarantee a good efficiency of the refrigerated transport phase, so models have been developed over the years to predict mass and thermal energy flows inside the compartments. Such models, mainly CFD-type, can focus attention on the air temperature distribution or the products temperature, or both of them, or also consider the microbial growth factor and its influence on the products preservation [18]. The respiration thermal load is caused by the presence of fresh food inside the compartment and can be calculated using Equation (5) [87]:
Q ˙ r e s p = 10.7 f 3600 9 T 5 + 32 g
where f and g are coefficients that depend on the food considered.
The commonly proposed models to estimate the velocity and temperature fields inside a refrigerated compartment consist of the numerical resolution of the equations of continuity, conservation of momentum and energy, also using a turbulence model. Further information on the models used can be found in the review prepared by James et al. [18] and summarized in Appendix A, Table A1.
As for turbulence, Han et al. [96] compared different models (standard k-ε, Re-Normalization Group (RNG) k-ε, k-ε achievable, k-ω standard, Shear Stress Transport (SST) k-ω, Reynolds Stress Model-RSM) used to calculate the temperature field inside a refrigerated compartment, finding a negligible difference between the models considered (error of about 1 °C in all cases). The k-ε turbulence model is most used, as it offers good accuracy in various situations, is simple to implement and has good stability. These models allow the analysis of several factors that influence the temperature distribution inside the refrigerated compartments. Table 18 shows some recent studies conducted by CFD simulation.

5.4. Vehicle Routing Problem (VRP)

Over the years route optimization models have been proposed (to solve the Vehicle Routing Problem—VRP), in order to increase the efficiency of current temperature-controlled transport systems. The simplest variants of these models aim to minimize the distance traveled [100], according to the hypothesis of linearity between the latter and the transport cost. Since the refrigeration load depends on the outside temperature and the duration of loading/unloading phases, the criterion of minimum distance traveled is not sufficient for the route optimization, so changes have been made to the objective function of the minimization algorithms.
Due to the increasingly stringent regulations in terms of environmental impact, it is essential to pay attention to emissions and fuel consumption attributable to refrigeration systems. Several Green Vehicle Routing Problem (GVRP) models have therefore been developed, allowing one to optimize the routes in order to minimize the environmental impact, in terms of CO2 emissions.
A simple model proposed by Meneghetti et al. [100] takes into account the total fuel consumption as a minimization function. In particular, the model provides for the calculation of the transmission and infiltration thermal loads during stop periods. The first is calculated using a steady-state formulation, considering a constant difference between internal and external temperatures during the journey. The objective function to be minimized is reported in Equation (6):
m i n i f u e l T r a v i + f u e l R e f r i
The estimated consumption related to the refrigeration system is about 10% of the total consumption (traction and refrigeration). The model suggests a path that coincides with the one obtained using simpler VRP models. However, an increase in stop times would lead to a significant increase in consumption due to refrigeration, so the result could be different.
Other models provide for optimization according to the carbon emission regulations (Low Carbon VRP—LCVRP) [101,102] actually in force, in order to reduce total costs. These models are based on more complex algorithms (e.g., genetic algorithms) than simple VRP models, taking into account transport costs (fuel for traction and refrigeration, loss of products), but also costs and restrictions related to CO2 emissions (carbon tax, carbon cap, carbon cap-and-trade, carbon cap offset). This kind of models can be very useful in the development of new energy saving and emission reduction policies [102].
VRP models can therefore identify the optimal route for refrigerated transport. Each method generally provides a different result in terms of the path to follow, since the objective function of the optimization algorithm is different depending factors and constraints considered.
Awad et al. [19] prepared a review concerning concerning the solution of the Vehicle Routing Problem applied to refrigerated transport until 2020. The common objective function is to minimize the total distribution cost, in terms of transportation, quality of goods and environmental factors/constraints [19].
Quality functions can be based on the total distribution cost, which may include transportation, quality or environmental costs, or a combination of them.
Costs and factors related to transportation which can be considered in the optimiza-tion models are:
  • Distance traveled by vehicles;
  • Fuel consumption, which can be calculated considering:
    • Driving and idling;
    • Vehicle’s motion and refrigeration systems operation;
    • Vehicle acceleration, weight and the slope of the road.
  • Truck maintenance and annual check-up costs;
  • Transportation mode (e.g., truck, train, airplane or ship);
  • Toll payments and parking costs;
  • Drivers’ wages based on working time.
Costs and factors related to the quality of products which can be considered in the op-timization models are:
  • Maintaining the temperature inside the compartments;
  • Temperature inside and outside the vehicle;
  • Vehicle’s door openings frequency and duration;
  • Humidity, vibration, lightning intensity inside the compartments, sensory index (e.g., odor and color of products);
  • Non-delivery due to a poor quality of products, causing waste disposal or rerouted shipment costs;
  • Excessive duration of the delivery mission;
  • Packaging method;
  • Multiple or single compartment delivery.
Environmental costs which can be considered in the optimization models mainly relate to GHG emissions:
  • Energy or fuel consumption, which can be converted into emissions by using car-bon emission coefficients;
  • Number of vehicles and their capacity;
  • Direct emissions due to refrigerant leakage.
Earlier articles (until 2013) focus on exact methods/solvers, while more recent studies use heuristic or meta-euristic aproaches, validated by using exact methods [19].
Further information regarding the input data considered and the solution methods used in the models presented in the literature is reported in the review prepared by Awad et al. [19].

6. Conclusions

VCR units are currently the most widely used systems in refrigerated transport. The power supply by internal combustion engines, mainly diesel powered, and the use of refrigerants characterized by high GWP values, cause a high environmental impact related to the operation of these systems in the refrigerated transport sector.
Starting from the studies considered in this review, the following conclusions can be drawn:
  • The use of electrical energy storage allows a strong reduction in consumption and emissions due to the operation of a VCR system, especially if coupled to a photovoltaic system. However, PV systems, even if coupled with a battery pack, could not be sufficient to overcome the cooling demand, so a backup system (internal combustion engine) is still needed;
  • The stability problems between the PCMs and the containers, as well as the limiting operating conditions imposed (operating temperature, duration of the refrigeration effect, no optimization of the shape of the containers) do not allow a widespread use of this type of systems, although the potential for reducing energy consumption and emissions are far from negligible;
  • Cryogenic systems represent a valid alternative to traditional VCR systems and allow one to obtain lower pull-down phases duration. However, the high energy consumption linked to the liquefaction processes of cryogenic gases does not allow for an effective reduction in emissions related to refrigeration. Consequently, these systems’ use is still limited;
  • Air-based and CO2-based refrigeration systems respond to the demand for cleaner refrigerants than current HFCs, allowing a reduction in direct emissions related to refrigeration. The use of air systems is however limited by the lack of standard components for application in refrigerated transport. In recent years the use of R290 (propane) in VCR systems have been considered. To date, there are still few studies about it’s performance in the refrigerated transport sector;
  • Absorption/adsorption systems allow the recovery of residual thermal energy contained in vehicle exhaust gases, but their operation is compromised at low engine loads (exhaust gas temperature below 200 °C). This problem can be solved with several methods, but they greatly increase the complexity of the system. In general, These systems are still studied as protypes. An optimization of the design of the components in terms of downsizing is indispensable in order to include these systems within the physical envelope of a refrigerated vehicle;
In general, the refrigeration systems still under study for application in refrigerated transport are not competitive with regard to the value of the COP. Systems powered by recovering the residual thermal energy from the exhaust gases of the vehicle (i.e., absorption/adsorption systems, Brayton cycle for the supply of refrigeration systems) are valid solutions for the reduction of energy consumption related to refrigeration. Surely the most interesting alternative from reducing emissions point of view is represented by the use of fuel cells for the production of thermal and electrical energy, since they are able to reduce the load of the engine and guarantee the supply of the refrigeration system.
Regarding the possible improvements of VCR systems, a good solution that could reduce both direct and indirect emissions is given by:
  • the use of a PV/battery system to power the VCR unit;
  • the addition of PCM to reduce the thermal load and/or increasing the OFF time of the compressor;
  • the use of a natural refrigerant (such as R290).
Most of the studies in the literature concern the application of refrigeration systems for air conditioning in the automotive sector. Although air conditioning systems are similar to those for automotive refrigeration, they are certainly characterized by completely different operating conditions and constraints, so further studies are needed to focus on the application in refrigerated transport.
The performance estimation models allow a strong reduction in the time related to the analysis of the systems (calculation of thermal loads and estimation of the air temperature distribution inside the refrigerated compartments). With regard to the estimation of the air temperature field inside refrigerated compartments, the models usually follow a numerical approach (CFD), since analytical formulations are unusable in refrigerated transport.
The last topic considered in this review regards the solution of the Vehicle Routing Problem applied to refrigerated transport. This allows for the calculation of the route to be followed in order to minimize an objective function, which is defined according to the needs (related to environment, transport, products quality). To date, most of the models used are based on environment/transport or environment/product quality considerations, so further studies are needed to take into account all three of the mentioned factors.

Author Contributions

A.M. conceived the idea and supervised the entire work; F.P. collected the state of the art and wrote the paper; C.A. supervised the entire work. All authors have read and agreed to the published version of the manuscript.

Funding

This research received no external funding.

Institutional Review Board Statement

Not applicable.

Informed Consent Statement

Not applicable.

Data Availability Statement

Not applicable.

Conflicts of Interest

The authors declare no conflict of interest.

Appendix A. Modelling of Food Transport Systems

Table A1. Summary of reviewed articles about land transport systems modelling. (James et al., 2006 [18]).
AuthorsApplication
Models of the environment in refrigerated
transport units
Comini et al., 1995A finite element model was used to calculate the solid’s temperature distribution and the fluid’s bulk temperature variations. Standard egineering procedures were used to estimate average fluid velocities and the convective heat transfer coefficient.
Lindqvist, 1998An integral-differential-algebraic solver was used to simulate the air distribution under different conditions, considering the effect of pallet loading in refeer holds. The model did not consider heat transfer from walls, packaging, ceiling and floor.
Zertal-Menia et al., 2002; Moureh et al., 2002CFD was used to optimize the air distribution, in order to decrease the temperature variation in the compartments of refrigerated vehicles.
Moureh and Flick, 2003CFD was used to optimize the air distribution, in order to decrease the temperature variation in the compartments of refrigerated vehicles. In addition, it was used to model a wall jet airflow within a long and empty slot-ventilated enclosure. The standard k-ε model and a renormalization group (RNG) one, were tested, contrasted and compared. Only the RSM model allowed to detect the presence and the localization of separated flow. In addition it was able to predict primary and secondary recirculation airflow patterns.
Moureh and Flick, 2004CFD was used to optimize the air distribution in refrigerated vehicles and to consider the effect of air ducts on temperature difference throughout the cargo.
Tso et al., 2002The effect of door openings on air temperature in the compartment of a refrigerated truck (unprotected doors, presence of plastic curtain strips, presence of air curtains) was modeled by using a commercial CFD program.
Models of heat and mass transfer in foods
and packages during transport
Rushbrook, 1974;
Rushbrook, 1976
The heat flow into cartons of chilled meat in a standard VCR container was simulated by using a simple 1-D model. Various types of control systems and measurement positions were considered. The model allowed to evaluate the effects on return air, delivery air and meat surface temperature.
Meffert, 1976;
Meffert, 1983;
Meffert, 1993 (a);
Meffert, 1993 (b);
Meffert, 1998;
A simple model for a steady state condition was developed to evaluate the temperature drop across the air cooler in a refrigerated container. This method can be applied in refrigerated containers and vehicles, storage rooms and retail cabinets.
Moureh and Derens, 2000A CFD model was used to evaluate temperature rises in pallet load of frozen food during distribution.
Stubbs et al., 2004A numerical model was used to evaluate the time food products could be mantained below 5 or 8 °C if contained in an expanded polystyrene box with a gel coolant.
Models of refrigeration performance during transportJolly et al., 2000The steady state performance of a refrigerated container system was modelled, considering compressor, evaporator, condenser and thermostatic expansion valve submodels. Coupling this model to appropriate mass and energy transfer relations allowed to obtain ±10% agreement with respect to experimental data.
Combined modelsFrith, 2003–2004A software model called “Censor”, based on a three-dimensional finite element analysis, was developed to estimate products’ temperatures during normal and abnormal operations of refrigerated containers.
Parry-Jones and James, 1994; James, 1997; Gigiel, 1997; Gigiel, 1998A model (CoolVan program) was used to predict the temperature of food products during multi-drop deliveries. The model was validated by using measured data from a real delivery mission, with an accuracy better than 1 °C when considering mean temperature.
Modelling of microbial growth during transportBaranyi et al., 2001; McMeekin et al., 1993; van Impe et al., 1992Only the growth of microorganisms in food during transportation was considered.
Almonacid-Merino and Torres, 1993A simple combined heat transfer (finite difference method) and microbial growth model was developed to evaluate the effect of temperature abuse during distribution.
Gill and Philips, 1993Microbial growth models were integrated with recorded temperature data.
Taoukis, 2001Use of Time Temperature Indicators (TTI) in transport applications and modelling was described.
Estrada-Flores and Tanner, 2005The growth of pseudomonads and Escherichia coli has been predicted by coupling recorded temperature histories with mathematical models, considering multi-temperature small vans.
James and Evans, 1992Recorded temperature histories were coupled with mathematical microbial growth prediction models.
Other transport factors that have been modelledGolob and Regan, 2001The perception of road congestion and low average speed problems were considered
Chatzidakis and Chatzidakis, 2005A transient finite difference model was applied to isothermal tanks, widely used for the transport of perishable liquid foodstuffs.
Milano and Corsi, 1982Finite difference methods were used to evaluate the overall heat transfer coefficient of a refrigerated vehicle assuming a steady state condition.
Zhang et al., 1994Other methods, more complex than the one proposed by Milano and Corsi (1982), were used to evaluate the overall heat transfer coefficient of a refrigerated vehicle without neglecting the unsteady temperature distribution in the insulating material.

References

  1. She, X.; Cong, L.; Nie, B.; Leng, G.; Peng, H.; Chen, Y.; Zhang, X.; Wen, T.; Yang, H.; Luo, Y. Energy-Efficient and -Economic Technologies for Air Conditioning with Vapor Compression Refrigeration: A Comprehensive Review. Appl. Energy 2018, 232, 157–186. [Google Scholar] [CrossRef]
  2. Koronaki, I.P.; Cowan, D.; Maidment, G.; Beerman, K.; Schreurs, M.; Kaar, K.; Chaer, I.; Gontarz, G.; Christodoulaki, R.I.; Cazauran, X. Refrigerant Emissions and Leakage Prevention across Europe—Results from the RealSkillsEurope Project. Energy 2012, 45, 71–80. [Google Scholar] [CrossRef]
  3. Tassou, S.A.; Grace, I.N. Fault Diagnosis and Refrigerant Leak Detection in Vapour Compression Refrigeration Systems. Int. J. Refrig. 2005, 28, 680–688. [Google Scholar] [CrossRef]
  4. The European Parliament and the Council of the European Union. The European Parliament and the Council of the European Union Regulation (EU) No 517/2014 of the European Parliament and the Council of 16 April 2014 on Fluorinated Greenhouse Gases and Repealing Regulation (EC) No 842/2006; The European Parliament and the Council of the European Union: Brussels, Belgium, 2014. [Google Scholar]
  5. Heredia-Aricapa, Y.; Belman-Flores, J.M.; Mota-Babiloni, A.; Serrano-Arellano, J.; García-Pabón, J.J. Overview of Low GWP Mixtures for the Replacement of HFC Refrigerants: R134a, R404A and R410A. Int. J. Refrig. 2020, 111, 113–123. [Google Scholar] [CrossRef]
  6. Nair, V. HFO Refrigerants: A Review of Present Status and Future Prospects. Int. J. Refrig. 2021, 122, 156–170. [Google Scholar] [CrossRef]
  7. Llopis, R.; Calleja-Anta, D.; Maiorino, A.; Nebot-Andrés, L.; Sánchez, D.; Cabello, R. TEWI Analysis of a Stand-Alone Refrigeration System Using Low-GWP Fluids with Leakage Ratio Consideration. Int. J. Refrig. 2020, 118, 279–289. [Google Scholar] [CrossRef]
  8. Mota-Babiloni, A.; Barbosa, J.R.; Makhnatch, P.; Lozano, J.A. Assessment of the Utilization of Equivalent Warming Impact Metrics in Refrigeration, Air Conditioning and Heat Pump Systems. Renew. Sustain. Energy Rev. 2020, 129, 109929. [Google Scholar] [CrossRef]
  9. FAO. The Future of Food and Agriculture—Trends and Challenges; FAO: Rome, Italy, 2017. [Google Scholar]
  10. Mercier, S.; Villeneuve, S.; Mondor, M.; Uysal, I. Time–Temperature Management Along the Food Cold Chain: A Review of Recent Developments. Compr. Rev. Food Sci. Food Saf. 2017, 16, 647–667. [Google Scholar] [CrossRef]
  11. Oury, A.; Namy, P.; Youbi-Idrissi, M. Aero-Thermal Simulation of a Refrigerated Truck under Open and Closed Door Cycles. In Proceedings of the 2015 COMSOL Conference, Grenoble, France, 14–16 October 2015. [Google Scholar]
  12. Tassou, S.; De-Lille, G.; Ge, Y. Food transport refrigeration—Approaches to reduce energy consumption and environmental impacts of road transport. Appl. Therm. Eng. 2009, 29, 1467–1477. [Google Scholar] [CrossRef] [Green Version]
  13. Yang, Z.; Tate, J.E.; Morganti, E.; Shepherd, S.P. Real-World CO2 and NOX Emissions from Refrigerated Vans. Sci. Total Environ. 2021, 763. [Google Scholar] [CrossRef]
  14. Ahmed, M.; Meade, O.; Medina, M.A. Reducing Heat Transfer across the Insulated Walls of Refrigerated Truck Trailers by the Application of Phase Change Materials. Energy Convers. Manag. 2010, 51, 383–392. [Google Scholar] [CrossRef]
  15. Adekomaya, O.; Jamiru, T.; Sadiku, R.; Huan, Z. Sustaining the Shelf Life of Fresh Food in Cold Chain—A Burden on the Environment. Alex. Eng. J. 2016, 55, 1359–1365. [Google Scholar] [CrossRef] [Green Version]
  16. United Nations. The Agreement on the International Carriage of Perishable Foodstuffs and on the Special Equipment to Be Used for Such Carriage; United Nations: New York, NY, USA, 1970. [Google Scholar]
  17. Selvnes, H.; Allouche, Y.; Manescu, R.I.; Hafner, A. Review on Cold Thermal Energy Storage Applied to Refrigeration Systems Using Phase Change Materials. Therm. Sci. Eng. Prog. 2021, 22, 100807. [Google Scholar] [CrossRef]
  18. James, S.J.; James, C.; Evans, J.A. Modelling of Food Transportation Systems—A Review. Int. J. Refrig. 2006, 29, 947–957. [Google Scholar] [CrossRef]
  19. Awad, M.; Ndiaye, M.; Osman, A. Vehicle Routing in Cold Food Supply Chain Logistics: A Literature Review. Int. J. Logist. Manag. 2020, 32, 592–617. [Google Scholar] [CrossRef]
  20. Chatzidakis, S.K.; Chatzidakis, K.S. Refrigerated Transport and Environment. Int. J. Energy Res. 2004, 28, 887–897. [Google Scholar] [CrossRef]
  21. Estrada-Flores, S.; Eddy, A. Thermal Performance Indicators for Refrigerated Road Vehicles. Int. J. Refrig. 2006, 29, 889–898. [Google Scholar] [CrossRef]
  22. Lawton, R.; Rhodes, C.; Mynott, T. Considerations for Emissions Test Methodology for Diesel-Engine Driven Transport Refrigeration Systems. In Proceedings of the 6th IIR International Conference on Sustainability and the Cold Chain, Nantes, France, 26–28 August 2020; pp. 394–401. [Google Scholar]
  23. Chindamo, D.; Gadola, M. What Is the Most Representative Standard Driving Cycle to Estimate Diesel Emissions of a Light Commercial Vehicle? IFAC Pap. 2018, 51, 73–78. [Google Scholar] [CrossRef]
  24. Lawton, R.; Mynott, T.; Marshall, N.; Wagner, F. Emission Testing of a Transport Refrigeration Unit. In Proceedings of the 25th IIR International Congress of Refrigeration, Montreal, QC, Canada, 24–30 August 2019; pp. 3729–3736. [Google Scholar]
  25. Fabris, F.; Artuso, P.; Rossetti, A.; Minetto, S.; Marinetti, S. Impact of the Refrigeration System on the Fuel Consumption and on the Emissions of a Small Refrigerated Truck. In Proceedings of the 6th IIR International Conference on Sustainability and the Cold Chain, Nantes, France, 26–28 August 2020. [Google Scholar]
  26. Rai, A.; Tassou, S.A. Environmental Impacts of Vapour Compression and Cryogenic Transport Refrigeration Technologies for Temperature Controlled Food Distribution. Energy Convers. Manag. 2017, 150, 914–923. [Google Scholar] [CrossRef]
  27. Li, B.; Otten, R.; Chandan, V.; Mohs, W.F.; Berge, J.; Alleyne, A.G. Optimal On-off Control of Refrigerated Transport Systems. Control. Eng. Pract. 2010, 18, 1406–1417. [Google Scholar] [CrossRef]
  28. Huang, Y.; Khajepour, A.; Khazraee, M.; Bahrami, M. A Comparative Study of the Energy-Saving Controllers for Automotive Air-Conditioning/Refrigeration Systems. J. Dyn. Syst. Meas. Control. Trans. ASME 2017, 139, 014504-9. [Google Scholar] [CrossRef]
  29. Hua, K. Study on a Novel Variable Capacity Technology and Control Strategy for Refrigerated Shipping Container Unit. IOP Conf. Ser. Earth Environ. Sci. 2018, 186, 12050. [Google Scholar] [CrossRef]
  30. Mohagheghi Fard, S.; Khajepour, A. An Optimal Power Management System for a Regenerative Auxiliary Power System for Delivery Refrigerator Trucks. Appl. Energy 2016, 169, 748–756. [Google Scholar] [CrossRef]
  31. Bagheri, F.; Fayazbakhsh, M.A.; Bahrami, M. Évaluation Des Performances en Temps Réel et de La Réduction Potentielle Des GES Dans Les Remorques Frigorifiques. Int. J. Refrig. 2017, 73, 24–38. [Google Scholar] [CrossRef]
  32. Bahaj, A. World’s first solar powered transport refrigeration system. Renew. Energy 1998, 15, 572–576. [Google Scholar] [CrossRef]
  33. Bahaj, A.S. Photovoltaic power for refrigeration of transported perishable goods. In Proceedings of the Conference Record of the Twenty-Eighth IEEE Photovoltaic Specialists Conference-2000 (Cat. No. 00CH37036), Anchorage, AK, USA, 15–22 September 2000; Volume 2000, pp. 1563–1566. [Google Scholar] [CrossRef]
  34. Bahaj, A.S.; James, P.A.B. Economics of solar powered refrigeration transport applications. In Proceedings of the Conference Record of the Twenty-Ninth IEEE Photovoltaic Specialists Conference 2002, New Orleans, LA, USA, 19–24 May 2002; pp. 1561–1564. [Google Scholar]
  35. Bergeron, D. Solar Powered Refrigeration for Transport Application—A Feasibility Study; Sandia Report; Sandia National Laboratories: Livermore, CA, USA, 2001. [Google Scholar]
  36. Elliston, B.; Dennis, M. Feasibility of Solar-Assisted Refrigerated Transport in Australia. In Proceedings of the 47th Conference of the Australia and New Zealand Solar Energy Society (Solar 2009), Australian and New Zealand Solar Energy Society (ANZSES), Townsville, Australia, 29 September–2 October 2009. [Google Scholar]
  37. Rossetti, A.; Artuso, P.; Minetto, S.; Marinetti, S.; Zennaro, D. Innovative Layout for Electric Powered Refrigeration for Insulated Trucks: The Integration of Photovoltaic Generator. In Proceedings of the 25th IIR International Congress of Refrigeration, Montreal, QC, Canada, 24–30 August 2019; pp. 3704–3711. [Google Scholar]
  38. Meneghetti, A.; Dal Magro, F.; Romagnoli, A. Renewable Energy Penetration in Food Delivery: Coupling Photovoltaics with Transport Refrigerated Units. Energy 2021, 232, 120994. [Google Scholar] [CrossRef]
  39. Setiyo, M.; Waluyo, B.; Purnomo, B.C.; Karmiadji, D.W.; Setiawan, I.C. Potential of 1/2 Cycle Refrigeration System for Food Transport Application. IOP Conf. Ser. Mater. Sci. Eng. 2018, 403, 12093. [Google Scholar] [CrossRef]
  40. Setiyo, M.; Soeparman, S.; Wahyudi, S.; Hamidi, N. A simulation for predicting potential cooling effect on LPG-fuelled vehicles. In Proceedings of the 4th International Conference and Exhibition on Sustainable Energy and Advanced Materials 2015 (ICE-SEAM 2015), Solo, Indonesia, 11 November 2016; Volume 1717, p. 30002. [Google Scholar]
  41. Garde, R.; Jiménez, F.; Larriba, T.; García, G.; Aguado, M.; Martínez, M. Development of a Fuel Cell-Based System for Refrigerated Transport. Energy Procedia 2012, 29, 201–207. [Google Scholar] [CrossRef] [Green Version]
  42. Ndanduleni, C.; Huan, Z. Review on Phase Change Materials for Sub-Zero Temperature Application in Transport Refrigeration. Suid- Afrik. Tydskr. Vir Nat. En Tegnol. 2019, 38, 1–10. [Google Scholar]
  43. Radebe, T.B.; Huan, Z.; Baloyi, J. A Simulation Study of Natural Convection Airflow Pattern for a Phase Change Material Chamber. SSRN Electron. J. 2019. [Google Scholar] [CrossRef]
  44. Shafiei, S.E.; Alleyne, A. Model Predictive Control of Hybrid Thermal Energy Systems in Transport Refrigeration. Appl. Therm. Eng. 2015, 82, 264–280. [Google Scholar] [CrossRef]
  45. Mousazade, A.; Rafee, R.; Valipour, M.S. Thermal Performance of Cold Panels with Phase Change Materials in a Refrigerated Truck. Int. J. Refrig. 2020, 120, 119–126. [Google Scholar] [CrossRef]
  46. Pedolsky, H.; La Bau, R. Reintroduction of Cryogenic Refrigeration for Cold Transport Reintroduction of Cryogenic Refrigeration for Cold Transport. In Proceedings of the 13th International Refrigeration and Air Conditioning Conference, West Lafayette, IN, USA, 12–15 July 2015. [Google Scholar]
  47. Tassou, S.A.; Hadawey, A.; Ge, Y.T.; Lagroy De Groutte, B. Carbon Dioxide Cryogenic Transport Refrigeration Systems; The Centre for Energy and Built Environment Research, Brunel University: Uxbridge, Middlesex, UK, 2009. [Google Scholar]
  48. Tan, H.; Li, Y.; Tuo, H. Theoretical and Experimental Study on a Self-Refrigerating System for LNG-Fueled Refrigerated Vehicles. J. Nat. Gas Sci. Eng. 2014, 20, 192–199. [Google Scholar] [CrossRef]
  49. Wang, F.; Li, M.; Zhang, Y.; Liu, X.; Xie, D.; Zhang, Q.; Yang, H. Study on Roof-Mounted Radiant Cooling System for LNG-Fueled Refrigerated Vehicles. Int. J. Low-Carbon Technol. 2021, 16, 268–274. [Google Scholar] [CrossRef]
  50. Tan, H.; Li, Y.; Tuo, H.; Zhou, M.; Tian, B. Experimental Study on Liquid/Solid Phase Change for Cold Energy Storage of Liquefied Natural Gas (LNG) Refrigerated Vehicle. Energy 2010, 35, 1927–1935. [Google Scholar] [CrossRef]
  51. Gao, P.; Wang, L.W.; Zhu, F.Q. Vapor-Compression Refrigeration System Coupled with a Thermochemical Resorption Energy Storage Unit for a Refrigerated Truck. Applied Energy. 2021, 290, 116756. [Google Scholar] [CrossRef]
  52. Koehler, J.; Tegethoff, W.J.; Westphalen, D.; Sonnekalb, M. Absorption Refrigeration System for Mobile Applications Utilizing Exhaust Qases. Heat Mass Transf. Waerme Stoffuebertragung 1997, 32, 333–340. [Google Scholar] [CrossRef]
  53. Horuz, I. An Alternative Road Transport Refrigeration. Turk. J. Eng. Environ. Sci. 1998, 22, 211–222. [Google Scholar]
  54. Horuz, I. Vapor Absorption Refrigeration in Road Transport Vehicles. J. Energy Eng. 1999, 125, 48–58. [Google Scholar] [CrossRef]
  55. Venkataraman, V.; Pacek, A.W.; Steinberger-Wilckens, R. Coupling of a Solid Oxide Fuel Cell Auxiliary Power Unit with a Vapour Absorption Refrigeration System for Refrigerated Truck Application. Fuel Cells 2016, 16, 273–293. [Google Scholar] [CrossRef]
  56. Venkataraman, V.; El-Kharouf, A.; Pandya, B.; Amakiri, E.; Steinberger-Wilckens, R. Coupling of Engine Exhaust and Fuel Cell Exhaust with Vapour Absorption Refrigeration/Air Conditioning Systems for Transport Applications: A Review. Therm. Sci. Eng. Prog. 2020, 18. [Google Scholar] [CrossRef]
  57. Pandya, B.; El-Kharouf, A.; Venkataraman, V.; Steinberger-Wilckens, R. Comparative Study of Solid Oxide Fuel Cell Coupled Absorption Refrigeration System for Green and Sustainable Refrigerated Transportation. Appl. Therm. Eng. 2020, 179. [Google Scholar] [CrossRef]
  58. Bibwe, B.; Kannaujia, P.; Mahawar, M.; Aradwad, P. Refrigerated transport systems for fruits and vegetables handling and its future prospect, AGRICULTURE & FOOD: E-Newsletter. 2019, pp. 278–284. Available online: http://www.agrifoodmagazine.co.in/wp-content/uploads/2019/04/May-2019.pdf (accessed on 27 September 2021).
  59. Gao, P.; Wang, L.W.; Wang, R.Z.; Zhang, X.F.; Li, D.P.; Liang, Z.W.; Cai, A.F. Experimental Investigation of a MnCl2/CaCl2-NH3 Two-Stage Solid Sorption Freezing System for a Refrigerated Truck. Energy 2016, 103, 16–26. [Google Scholar] [CrossRef] [Green Version]
  60. Gao, J.; Wang, L.W.; Gao, P.; An, G.L.; Wang, Z.X.; Xu, S.Z.; Wang, R.Z. Performance Investigation of a Freezing System with Novel Multi-Salt Sorbent for Refrigerated Truck. Int. J. Refrig. 2019, 98, 129–138. [Google Scholar] [CrossRef]
  61. Gao, P.; Wang, L.W.; Zhu, F.Q. A Novel Hybrid Solid Sorption-Compression Refrigeration Technology for Refrigerated Transportation and Storage. Int. J. Refrig. 2021, 122, 1–10. [Google Scholar] [CrossRef]
  62. Sharafian, A.; Bahrami, M. Assessment of Adsorber Bed Designs in Waste-Heat Driven Adsorption Cooling Systems for Vehicle Air Conditioning and Refrigeration. Renew. Sustain. Energy Rev. 2014, 30, 440–451. [Google Scholar] [CrossRef]
  63. Spence, S.W.T.; Doran, W.J.; Artt, D.W. Design, Construction and Testing of an Air-Cycle Refrigeration System for Road Transport. Int. J. Refrig. 2004, 27, 503–510. [Google Scholar] [CrossRef]
  64. Spence, S.W.T.; John Doran, W.; Artt, D.W.; McCullough, G. Performance Analysis of a Feasible Air-Cycle Refrigeration System for Road Transport. Int. J. Refrig. 2005, 28, 381–388. [Google Scholar] [CrossRef]
  65. Colbourne, D.; Solomon, P.; Wilson, R.; de Swardt, L.; Nosbers, R.; Schuster, M. Development of R290 Transport Refrigeration System; Institute of Refrigeration: Carshalton, UK, 2017. [Google Scholar]
  66. Ramaube, M.; Huan, Z. Testing and Performance Evaluation of a R404A Transport Refrigeration System Retrofitted With R290. In Proceedings of the AIUE 17th Industrial and Commercial Use of Energy (ICUE) Conference, Cape Town, South Africa, 26 November 2019. [Google Scholar]
  67. Barta, R.B.; Groll, E.A.; Ziviani, D. Review of Stationary and Transport CO2 Refrigeration and Air Conditioning Technologies. Appl. Thermal Eng. 2021, 185, 116422. [Google Scholar] [CrossRef]
  68. Fabris, F.; Artuso, P.; Marinetti, S.; Minetto, S.; Rossetti, A. Dynamic Modelling of a CO2 Transport Refrigeration Unit with Multiple Configurations. Appl. Thermal Eng. 2021, 189, 116749. [Google Scholar] [CrossRef]
  69. Kim, M.H.; Pettersen, J.; Bullard, C.W. Fundamental Process and System Design Issues in CO2 Vapor Compression Systems. Prog. Energy Combust. Sci. 2004, 30, 119–174. [Google Scholar] [CrossRef]
  70. NaturaLINE. Carrier Transicold NaturaLINE®—The World’s First Natural Refrigerant Unit for Container Refrigeration; NaturaLINE: Beijing, China, 2020. [Google Scholar]
  71. Lawrence, N.; Elbel, S.; Hrnjak, P. Design and Investigation of a Transcritical R744 Refrigerated Container for Military Applications. In Proceedings of the International Refrigeration and Air Conditioning Conference, West Lafayette, IN, USA, 9–12 July 2018. [Google Scholar]
  72. Artuso, P.; Marinetti, S.; Minetto, S.; del Col, D.; Rossetti, A. Modelling the Performance of a New Cooling Unit for Refrigerated Transport Using Carbon Dioxide as the Refrigerant. Int. J. Refrig. 2020, 115, 158–171. [Google Scholar] [CrossRef]
  73. Shi, L.; Tian, H.; Shu, G. Multi-Mode Analysis of a CO2-Based Combined Refrigeration and Power Cycle for Engine Waste Heat Recovery. Appl. Energy 2020, 264, 114670. [Google Scholar] [CrossRef]
  74. Pan, M.; Bian, X.; Zhu, Y.; Liang, Y.; Lu, F.; Xiao, G. Thermodynamic Analysis of a Combined Supercritical CO2 and Ejector Expansion Refrigeration Cycle for Engine Waste Heat Recovery. Energy Convers. Manag. 2020, 224, 113373. [Google Scholar] [CrossRef]
  75. Glouannec, P.; Michel, B.; Delamarre, G.; Grohens, Y. Experimental and Numerical Study of Heat Transfer across Insulation Wall of a Refrigerated Integral Panel Van. Appl. Therm. Eng. 2014, 73, 196–204. [Google Scholar] [CrossRef]
  76. Jovanović, B.; Maljković, M.; Stamenković, D.; Popović, V. Fuel Savings by Using Better-Quality Insulation in Refrigerated Vans. Industrija 2021, 49, 81–91. [Google Scholar] [CrossRef]
  77. Artuso, P.; Rossetti, A.; Minetto, S.; Marinetti, S.; Moro, L.; Col, D. del Dynamic Modeling and Thermal Performance Analysis of a Refrigerated Truck Body during Operation. Int. J. Refrig. 2019, 99, 288–299. [Google Scholar] [CrossRef]
  78. Michel, B.; Glouannec, P.; Fuentes, A.; Chauvelon, P. Experimental and Numerical Study of Insulation Walls Containing a Composite Layer of PU-PCM and Dedicated to Refrigerated Vehicle. Appl. Therm. Eng. 2017, 116, 382–391. [Google Scholar] [CrossRef] [Green Version]
  79. Tinti, A.; Tarzia, A.; Passaro, A.; Angiuli, R. Thermographic Analysis of Polyurethane Foams Integrated with Phase Change Materials Designed for Dynamic Thermal Insulation in Refrigerated Transport. Appl. Therm. Eng. 2014, 70, 201–210. [Google Scholar] [CrossRef]
  80. Copertaro, B.; Principi, P.; Fioretti, R. Thermal Performance Analysis of PCM in Refrigerated Container Envelopes in the Italian Context—Numerical Modeling and Validation. Appl. Therm. Eng. 2016, 102, 873–881. [Google Scholar] [CrossRef]
  81. Principi, P.; Fioretti, R.; Copertaro, B. Energy Saving Opportunities in the Refrigerated Transport Sector through Phase Change Materials (PCMs) Application. J. Phys. Conf. Ser. 2017, 923, 12043. [Google Scholar] [CrossRef]
  82. Lawton, A.R.; Marshall, R.E. Developments in Refrigerated Transport Insulation since the Phase out of CFC and HCFC Refrigerants. In Proceedings of the 22nd IIR International Congress of Refrigeration, Beijing, China, 21–26 August 2007. [Google Scholar]
  83. Uwa, C.A.; Jamiru, T.; Sadiku, E.R.; Huan, Z.; Mpofu, K. Polypropylene/Nanoclay Composite: A Solution to Refrigerated Vehicles. Procedia Manuf. 2019, 35, 174–180. [Google Scholar] [CrossRef]
  84. Azzouz, A.; Gossé, J.; Duminil, M. Détermination Expérimentale des Pertes de Froid Occasionnées Par l’ouverture d’une Porte de Chambre Froide Industrielle. Int. J. Refrig. 1993, 16, 57–66. [Google Scholar] [CrossRef]
  85. Lafaye De Micheaux, T.; Ducoulombier, M.; Moureh, J.; Sartre, V.; Bonjour, J. Experimental and Numerical Investigation of the Infiltration Heat Load during the Opening of a Refrigerated Truck Body. Int. J. Refrig. 2015, 54, 170–189. [Google Scholar] [CrossRef]
  86. Gonçalves, J.C.; Costa, J.J.; Lopes, A.M.G. Analysis of the Air Infiltration through the Doorway of a Refrigerated Room Using Different Approaches. Appl. Therm. Eng. 2019, 159. [Google Scholar] [CrossRef]
  87. American Society of Heating, Refrigerating and Air-Conditioning Engineers. ASHRAE Handbook: Refrigeration; ASHRAE: Peachtree Corners, GA, USA, 2018; ISBN 9781-939200983. [Google Scholar]
  88. Foster, A.M.; Swain, M.J.; Barrett, R.; D’Agaro, P.; Ketteringham, L.P.; James, S.J. Three-Dimensional Effects of an Air Curtain Used to Restrict Cold Room Infiltration. Appl. Math. Model. 2007, 31, 1109–1123. [Google Scholar] [CrossRef]
  89. Rai, A.; Sun, J.; Tassou, S.A. Numerical Investigation of the Protective Mechanisms of Air Curtain in a Refrigerated Truck during Door Openings. Energy Procedia 2019, 161, 216–223. [Google Scholar] [CrossRef]
  90. Tso, C.; Yu, S.; Poh, H.; Jolly, P. Experimental study on the heat and mass transfer characteristics in a refrigerated truck. Int. J. Refrig. 2002, 25, 340–350. [Google Scholar] [CrossRef]
  91. Foster, A.M.; Swain, M.J.; Barrett, R.; D’Agaro, P.; James, S.J. Effectiveness and Optimum Jet Velocity for a Plane Jet Air Curtain Used to Restrict Cold Room Infiltration. Int. J. Refrig. 2006, 29, 692–699. [Google Scholar] [CrossRef]
  92. Rai, A.; Sun, J.; Tassou, S.A. Numerical Investigation into the Influence of Air Curtain Discharge Angles in Refrigerated Trucks. Energy Procedia 2019, 161, 207–215. [Google Scholar] [CrossRef]
  93. Rai, A.; Sun, J.; Tassou, S.A. Three-Dimensional Investigation on the Positioning of Air Curtain on Its Effectiveness in Refrigerated Vehicles Used for Food Distribution. Energy Procedia 2019, 161, 224–231. [Google Scholar] [CrossRef]
  94. Li, B.; Guo, J.; Xia, J.; Wei, X.; Shen, H.; Cao, Y.; Lu, H.; Lü, E. Temperature Distribution in Insulated Temperature-Controlled Container by Numerical Simulation. Energies 2020, 13. [Google Scholar] [CrossRef]
  95. Moureh, J.; Menia, N.; Flick, D. Numerical and Experimental Study of Airflow in a Typical Refrigerated Truck Configuration Loaded with Pallets. Comput. Electron. Agric. 2002, 34, 25–42. [Google Scholar] [CrossRef]
  96. Han, J.-W.; Zhu, W.-Y.; Ji, Z.-T. Comparison of Veracity and Application of Different CFD Turbulence Models for Refrigerated Transport. Artif. Intell. Agric. 2019, 3, 11–17. [Google Scholar] [CrossRef]
  97. Kayansayan, N.; Alptekin, E.; Ezan, M.A. Analyse Thermique Du Débit d’air à l’intérieur d’un Conteneur Réfrigéré. Int. J. Refrig. 2017, 84, 76–91. [Google Scholar] [CrossRef]
  98. Jara, P.B.T.; Rivera, J.J.A.; Merino, C.E.B.; Silva, E.V.; Farfán, G.A. Thermal Behavior of a Refrigerated Vehicle: Process Simulation. Int. J. Refrig. 2019, 100, 124–130. [Google Scholar] [CrossRef]
  99. Jiang, T.; Xu, N.; Luo, B.; Deng, L.; Wang, S.; Gao, Q.; Zhang, Y. Analysis of an Internal Structure for Refrigerated Container: Improving Distribution of Cooling Capacity. Int. J. Refrig. 2020, 113, 228–238. [Google Scholar] [CrossRef]
  100. Meneghetti, A.; Da Rold, G.; Cortella, G. Sustainable refrigerated food transport: Searching energy efficient routes. IFAC—PapersOnLine 2018, 51, 618–623. [Google Scholar] [CrossRef]
  101. Li, L.; Yang, Y.; Qin, G. Optimization of Integrated Inventory Routing Problem for Cold Chain Logistics Considering Carbon Footprint and Carbon Regulations. Sustainability 2019, 11, 4628. [Google Scholar] [CrossRef] [Green Version]
  102. Wang, S.; Tao, F.; Shi, Y.; Wen, H. Optimization of Vehicle Routing Problem with Time Windows for Cold Chain Logistics Based on Carbon Tax. Sustainability 2017, 9, 694. [Google Scholar] [CrossRef] [Green Version]
Figure 1. Number of scientific papers about refrigerated transport in last decades (source: ScienceDirect: data used for number of publications regarding refrigerated transport since 1960).
Energies 14 07237 g001
Figure 2. NEDC driving cycle with urban section module in red and extra-urban section in green C. Reprinted with permission from original publication: “What is the Most Representative Standard Driving Cycle to Estimate Diesel Emissions of a Light Commercial Vehicle?”, by Daniel Chindamo and Marco Gadola. IFAC-PapersOnLine, 51-5, pp. 73–78 (2018) [23] @2018 International Federation of Automatic Control (IFAC).
Energies 14 07237 g002
Figure 3. WLTC Driving Cycle with urban section in red, extra-urban section in green and combined driving in light blue. Reprinted with permission from original publication: “What is the Most Representative Standard Driving Cycle to Estimate Diesel Emissions of a Light Commercial Vehicle?”, by Daniel Chindamo and Marco Gadola. IFAC-PapersOnLine, 51-5, pp. 73–78 (2018) [23] @2018 International Federa-tion of Automatic Control (IFAC).
Energies 14 07237 g003
Figure 4. CADC Driving Cycle with urban section in red, extra-urban section in green and combined driving in light blue. Reprinted with permission from original publication: “What is the Most Representative Standard Driving Cycle to Estimate Diesel Emissions of a Light Commercial Vehicle?”, by Daniel Chindamo and Marco Gadola. IFAC-PapersOnLine, 51-5, pp. 73–78 (2018) [23] @2018 International Federa-tion of Automatic Control (IFAC).
Energies 14 07237 g004
Figure 5. The London Drive Cycle speed profile (three different road types under three different traffic conditions). Adapted from ref. [13], Copyright (2020), with permission from Elsevier.
Energies 14 07237 g005
Figure 6. Schematic diagram of vapour compression transport refrigeration unit driven by a diesel engine. Reprinted from ref. [26].
Energies 14 07237 g006
Figure 7. Hybrid cooling box vehicle for transporting fresh food products. Reprinted from ref. [39].
Energies 14 07237 g007
Figure 8. The schematic diagram of the hybrid refrigeration system (VCRS+PCM). Reprinted from ref. [45], Copyright (2020), with permission from Elsevier.
Energies 14 07237 g008
Figure 9. Schematic diagram of direct cryogenic transport refrigeration system. Reprinted from ref. [26].
Energies 14 07237 g009
Figure 10. Schematic diagram of indirect cryogenic transport refrigeration system. Reprinted from ref. [26].
Energies 14 07237 g010
Figure 11. Common Artemis Driving Cycle for urban, rural and motorway with total duration of 3100 s and driving distance of 50,878 m. Adapted from ref. [26].
Energies 14 07237 g011
Figure 12. The Schematic diagram of the LNG refrigerated vehicle and the cold storage unit. Reprinted from ref. [50], Copyright (2010), with permission from Elsevier.
Energies 14 07237 g012
Figure 13. The schematic diagram of a light-duty LNG-chilled refrigerated vehicle 1, LNG tank; 2, Valves box; 3, Cold energy recovery heat exchanger; 4, Induced draft fan; 5, Superheater; 6, Engine; 7, Refrigerated vehicle body. Reprinted from ref. [48], Copyright (2014), with permission from Elsevier).
Energies 14 07237 g013
Figure 14. The schematic diagram of the radiant cooling system designed for the roof of an LNG-fuelled refrigerated vehicle: 1, LNG cylinder; 2, solenoid valve; 3, three-way valve; 4, temperature sensor; 5, sleeve-type heat exchanger; 6, bypass tube; 7, coolant tank; 8, alarm; 9, injection port; 10, pump; 11, radiation structure; 12, heater; 13, engine; 14, controller. Reprinted from ref. [49].
Energies 14 07237 g014
Figure 15. Schematic diagram of solid oxide fuel cell coupled with absorption refrigeration system. Reprinted with permission from ref. [55], Copyright (2016).
Energies 14 07237 g015
Figure 16. Series configuration of heat exchangers. Reprinted from ref. [57] (Pandya et al., 2020), Copyright (2020), with permission from Elsevier.
Energies 14 07237 g016
Figure 17. Parallel configuration of heat exchangers. Reprinted from ref. [57] (Pandya et al., 2020), Copyright (2020), with permission from Elsevier.
Energies 14 07237 g017
Figure 18. Two-stage solid sorption freezing system: (a) Sorption process of the HTS bed and desorption process of the MTS bed; (b) Resorption process between the HTS bed and the MTS bed; (c) lnP-T diagram. Reprinted from ref. [59], Copyright 2016, with permission from Elsevier.
Energies 14 07237 g018
Figure 19. Schematic sorption refrigeration cycle: heating of sorption bed (desorption phase in red line, a,b) and cooling of sorption bed (sorption phase in light blue line, c,d). Adapted from ref. [60], Copyright (2018), with permission from Elsevier.
Energies 14 07237 g019
Figure 20. Schematic of the novel refrigeration cycle consisting of a vapor-compression cycle and thermochemical resorption energy storage unit: (a) Charging process; (b) Discharging process. Reprinted from ref. [51], Copyright (2021), with permission from Elsevier.
Energies 14 07237 g020
Figure 21. Hybrid solid sorption-compression refrigeration cycle: (a) Decomposition process (sorption bed 1) synthesis process (sorption bed 2); (b) Synthesis process (sorption bed 1) and decomposition process (sorption bed 2); (c) lnP-T diagram. Reprinted from ref. [61], Copyright (2020), with permission from Elsevier.
Energies 14 07237 g021
Figure 22. Schematic layout of a typical air cycle system with two stage compression. Copyright (2004), with permission from Elsevier.
Energies 14 07237 g022
Figure 23. Schematic of the cooling unit working with: (a) low pressure receiver configuration; (b) ejector cycle configuration using a single evaporator; (c) ejector cycle configuration using an auxiliary evaporator. Reprinted from ref. [72], Copyright (2020), with permission from Elsevier.
Energies 14 07237 g023
Figure 24. Structure diagram of MM-CRPC. Reprinted from ref. [73], Copyright (2020), with permission from Elsevier.
Energies 14 07237 g024
Figure 25. Schematic diagram of the combined cycle RSCBC/EERC. Reprinted from ref. [74], Copyright (2020), with permission from Elsevier.
Energies 14 07237 g025
Figure 26. The effect of the zeotropic mixture and mass fraction of CO2 on the system. (a) COPcomb; (b) ηE. Reprinted from ref. [74], Copyright (2020), with permission from Elsevier.
Energies 14 07237 g026
Table 1. Drive cycle characteristics of each tested vehicles. Reprinted from ref. [13], Copyright (2020), with permission from Elsevier.
VehicleAB1B2
Engine Power (kW)90120120
Vehicle mass (kg)215034503450
Vehicle loading (kg)37504050
Road typeUrban, suburban, motorwaySuburbanSuburban
Duration (s)14,01929302930
Distance (km)1402727
Average speed (km/h)35.9232.6532.65
Maximum acceleration (m/s2)2.672.672.67
Table 2. Summary of proposed vapor compression systems in refrigerated transport applications.
AuthorsBrief DescriptionMain Results
Fard and Kajepour, 2016An anti-idling system was proposed by adding an engine driven auxiliary electric generator and a rechargeable battery. The use of a regenerative breaking system was also considered.Fuel consumption reduction both in city drive (−11.9%) and in highway drive (−6.6%).
Bagheri et al., 2017A mathematical model to simulate the performance of the on-board VCR systems in trailers was developed [31]. The yearly-averaged simulated and measured COP of the trailers were found to be, respectively, 0.58 and 0.62. Fuel consumption reduction (−3105kg/year) and CO2 emissions reduction (−8320 kg/year) were found by replacing the engine-driven VCR systems by battery-powered VCR systems.
Bahaj, 1998, 2000, 2002The world’s first solar powered transport refrigeration system was developed by installing a photovoltaic system on the roof of a trailer and adding a charge regulator, a lead-acid battery and an inverter in order to power a VCR system.The effect of a week’s operation was a reduction in battery charge by 20% (full capacity of 28 kWh). A payback time of ~15 years was found.
Bergheron, 2001A feasibility study was conducted to evaluate if a PV system was able to power a VCR system. Battery storage and PCM storage were considered.Feasibility was proven. The choice between battery storage and PCM storage should be carefully considered as it has significant impacts on the design of the refrigeration system [35]. The use of PCM offers the best long-term benefit [35], but presents more development effort.
Elliston and Dennis, 2009A feasibility study was conducted to evaluate if a PV system was able to power a VCR system in Australia. Battery storage was considered.Fuel consumption reduction (−85%) in order to refrigerate the trailer down to −18 °C.
Rossetti et al., 2019A prototype of PV powered VCR unit, consisting of PV modules, charge controller and battery pack, was developed for a small refrigerated truck application. Numerical simulations of delivery missions in Athens were carried out in order to evaluate the feasibility of such a system.Results show that the energy produced by the PV system was always higher than the one required by the VCR unit (at least 25% higher), so feasibility was demonstrated.
Meneghetti et al., 2021An optimization model to size a PV system (PV panels on the vehicle rooftop, power conversion system-PCS and a Li-ion battery bank) for a typical semitrailer used for frozen food transportation was developed.The optimization model was used to size a PV system used to power a VCR unit instead of a diesel engine. With such a system, a reduction in emissions up to 89% in the reference case (North-Eastern Italy) considered and a pay back period of about six years was estimated. The percentage of coverage of the refrigeration needs moves from 58% (reference case, North-Eastern Italy deliveries) to about 80%, leading to a pay back period of 4.75 years with 37.2 kgCO2eq emissions saving per trip.
Setiyo et al., 2018Use of LPG evaporation to refrigerate the transportation box as a secondary refrigeration system in LPG fuelled vehicles was analyzed.This system provides a cooling effect of more than 0.8 kW (about 25% of a medium-size cooler box requirement in terms of refrigeration capacity) [39] at LPG flow rate of 2.4 g/s (stationary condition of 3000 rpm). The driving mode strongly affects the potential cooling effect that can be harvested.
Garde et al., 2012Fuel cells powered VCR system was considered. A tool to size fuel cells system was developed.Feasibility was proven. The Tool results show that the hydrogen requirements for a heavy refrigerated truck is about 0.3 kg/100 km [41], which means that using a 7.5 kg hydrogen tank, the autonomy would be as high as 2200 km. An onsite optimized electrolysis system to produce hydrogen could reduce hydrogen costs to the equivalent of 6 EUR/kg [41]. This could lead to a 21 tons reduction in CO2 emissions [41]. A payback time of ~4 years was found.
Table 3. Summary of proposed PCMs applications in refrigerated transport.
AuthorsBrief DescriptionMain Results
Shafiei and Alleyne, 2015A hybrid vapour compression system that included a Thermal Energy Storage was proposed. The VCR system was able to refrigerate the transportation box and recharge the PCM when the vehicle’s speed exceeded a threshold value.Energy consumption reduced by 17% with respect to traditional systems.
Mousazade et al., 2020A PCM refrigerating unit was proposed. The internal or external VCR system was only used to recharge PCM plates when needed. Different PCMs’ melting time was evaluated.
Table 4. Summary of proposed cryogenic systems in refrigerated transport applications.
AuthorsBrief DescriptionMain Results
Rai and Tassou, 2017A diesel driven VCR system was compared to LCO2 and LN2 cryogenic systems. Two types of vehicle (18 t and 38 t) and two types of products (precooled and frozen) were considered.Considering the same cooling demand, results show that the emissions related to the production of the diesel fuel and refrigerant in the case of the VCR system are up to 66% lower than those related to the production of LCO2 and LN2 (a larger quantity of cryogenic fluids needs to be produced to overcome the same cooling demand). Total emissions (production and operation) from VCR and cryogenic systems, instead, result to be similar, as diesel combustion and refrigerant leakage during operation cause a considerable increase in the diesel engine driven VCR system emissions.
Tan et al., 2010A new refrigeration system in which the evaporation of LNG allowed to recharge a PCM, in particular water/ice was proposed. The heat transfer tubes were internally cooled by LNG, while water solidified outside. Both smooth and internally finned tube heat exchangers were considered.When considering a smooth tube heat exchanger, the thermal resistance due to the ice layer accounts for a small part (less than 10%) of the total value. The greatest contribution is given by the weak convective heat exchange related to LNG.
An internally finned tube (LNG side) heat exchanger greatly improves the convective heat exchange related to the LNG flow. Results show that the thermal resistance related to the ice layer accounts for 70–77% of the total value. With reference to the ice formation dynamics, none of the conducted tests provide a direct comparison between the two types of heat exchangers.
Tan et al., 2014Feasibility analysis of a self-refrigerated vehicle, obtained by recovering the cold energy of LNG fuel evaporation (indirect cryogenic system).The experiment results show that the refrigerating temperature of the compartment could be kept lower than −20 °C when the LNG flow rate exceeds 5.607 kg/h. This value can be achieved when the power output of the engine for the LNG-fuelled refrigerated vehicle is more than 75 kW, which is one third of its maximum output power [48].
The internal temperature of the compartment drops from 28 °C to −20 °C in about 2.5 h when the LNG flow rate is 5.709 kg/h.
Wang et al., 2020A roof-mounted radiant cooling system was designed for use on LNG-fuelled refrigerated vehicles. The relationship between cooling capacity and LNG flow rate was studied.The cooling capacity of the system increases by 0.28 kW with each 1 kg/h increase in the LNG flow rate when considering a coolant flow rate of 70 kg/h. When considering a LNG flow rate of 8.8 kg/h, as the coolant flow rate increases by 1 kg/h, the cooling capaciy of the system increases by 0.03 kW.
Table 5. Size of different types of trucks used for modeling. Reprinted with permission from ref. [55], Copyright 2016.
Type of TruckExternal Length (m)External Width (m)External Height (m)
Large (40 t)13.62.62.4
Medium (12 t)9.42.52.5
Small (0.7 t)2.481.881.57
Table 6. Summary of proposed absorption refrigeration systems in refrigerated transport applications.
AuthorsBrief DescriptionMain Results
Koehler et al., 1997Analysis of the recoverable energy from the exhaust gases to power a VAR system used for the application in a refrigerated truck. An absorption refrigeration system prototype was designed, built and tested.The unoptimized prototype has a COP of about 0.27. Results show that it can be improved by more than 25% by optimizing the heat exchangers design and the insulation of the generator. The cooling capacity of the prototype is able to satisfy the cooling needs of a typical 40 t truck trailer [52].
Horuz, 1998–1999Analysis of the recoverable energy in the exhaust gases from the vehicle’s engine to power a VAR system.The use of VAR systems in refrigerated transport field was proven. The use of eutectic plates as backup systems was suggested by the author. Introducing a VAR system into the exhaust system reduces engine efficiency by 2%.
Venkataraman et al., 2016, 2020A model to simulate a VAR system powered by a solid oxide fuel cell for a truck application was developed. The COP of the considered scenario (internal temperature of −20 °C) is around 0.42 for a single stage NH3–H2O system. The maximum COP that can possibly be achieved is 0.7, after implementation of improvement strategies.
Pandya et al., 2020A thermo-economic study for two different solid oxide fuel cell system configurations was conducted. Series and parallel configurations were compared to optimize the fuel cell sub-system layout.The parallel configuration of heat exchangers required 45–65% less cell active surface to satisfy the refrigeration needs. In addition, “an enhanced thermodynamic performance by 4–10%, a 5–30% lower amount of CO2 emissions, and 2–7% lower cost of cogeneration under various operating conditions” [57] were shown by parallel configuration, referring to a refrigeration load of 6 kW (large truck).
Table 7. Required refrigerating capacity under different refrigerating temperatures. Reprinted from ref. [59] with permission from Elsevier.
Refrigerating Temperature (°C)Required Refrigerated Capacity (W)
0971.2
−51133.1
−101295
−151456.8
−181554
Table 8. Summary of proposed adsorption refrigeration systems in refrigerated transport applications.
AuthorsBrief DescriptionMain Results
Gao et al., 2016A dual-stage MnCl2/CaCl2–NH3 adsorption refrigeration system using engine exhaust gases was built and tested. Refrigerating capacity of the system was evaluated.Low temperature exhaust gases (210 °C) are sufficient to transport cooled goods (0 °C or −5 °C refrigerating temperature), showing a COP of 0.14. Lower refrigerating temperatures need higher exhaust gas temperature (higher than 270 °C).
Gao et al., 2019A freezing system with CaCl2/MnCl2 multi-salt sorbent was proposed for refrigerated trucks.
At the heating temperature of 200 °C, most of the ammonia can desorb from the sorbent [60]. The proposed system can produce cooling power for the refrigerated truck at low heating temperature and high cooling temperature. The COP of the system ranges from ~0.27 to ~0.43 when the refrigeration is between −15 °C and 5 °C.
Gao et al., 2021A system involving a mechanical compressor and two adsorption beds (MnCl2/CaCl2-NH3), which acted as thermochemical energy storage, was proposed.The thermochemical energy storage is able to recover exhaust gas waste heat to store cold energy. During the discharging process, at an evaporator outlet temperature of −15 °C, the refrigerating capacity is 2.2 kW. At an ambient temperature and a refrigerating temperature respectively of 30 °C and −20 °C, the energy efficiency of the proposed system is 1.4, which is twice the value of a conventional system [51].
Gao et al., 2021A compressor was added between the sorption bed and the condenser to control desorption pressure, allowing sorbent to regenerate at a lower heat source temperature.At a condensing temperature and an evaporating temperature respectively of 50 °C and −25 °C, the COP of the hybrid system is up to 5.
Sharafian and Bahrami, 2014An in-depth assessment of available adsorber bed design for waste-heat driven adsorption refrigeration system was presented with a focus on vehicle air conditioning and refrigeration applications.Finned tube adsorber beds have better performance among the existing adsorber beds. Prominent finned tube adsorber bed designs were selected for vehicle air conditioning and refrigeration applications. In order to increase heat and mass transfer rates inside the adsorber beds, the authors proposed an increase in the thermal conductivity of adsorbent materials, as well as an optimization of fin spacing and height in finned tube adsorber beds [62].
Table 9. Summary of proposed air cycle refrigeration systems in refrigerated transport applications.
AuthorsBrief DescriptionMain Results
Spence et al., 2004–2005An air cycle-based system was designed and fitted within the physical envelope of an existing VCR trailer unit. The performance of such system was analysed and compared with the VCR original system.At −20 °C, The full load capacity of the air-cycle system was 7.8 kW, 8% greater than the equivalent VCR unit, but its fuel consumption was excessively high. “At part load operation the disparity in fuel consumption dropped from approximately 200% to around 80%” [63]. The components used in the aircycle demonstrator were not optimized, so considerable potential exists for efficiency improvements.
The power requirement of the optimized air-cycle unit was 7% greater than the equivalent VCR unit at full-load operation. However, at part-load operation the air-cycle unit was estimated to absorb 35% less power than the VCR unit. The COP of the optimized system is 0.53 for a refrigerating temperature of −20 °C.
Table 10. Operating conditions considered in simulations.
RSCBC/EERCTmax320 °C
Pmax25 MPa
Tmin40 °C
Pmin7.5 MPa
Tcond30 °C
Teva0 °C
ΔP45 kPa
VARS Li-H2OGenerating temperature80 °C
Absorbing temperature30 °C
Condensing temperature30 °C
Evaporating Temperature0 °C
Solution concentration at the outlet of the absorber55%
Table 11. The performance parameters of the RSCBC/EERC and absorption refrigeration system. Reprinted from ref. [74], Copyright (2020), with permission from Elsevier.
ParametersRSCBC/EERCVARS
Net power output (kW)20.84/
Refrigerating Capacity (kW)225.589.0245
Energy recovered (kW)86.74117.61
COP2.0530.7569
Table 12. Summary of proposed CO2 refrigeration systems in refrigerated transport applications.
AuthorsBrief DescriptionMain Results
Lawrence et al., 2018The design and performance of a transcritical CO2 multi-temperature refrigerated container system were analyzed. The use of a microchannel gas cooler and the addition of an internal heat exchanger and an ejector to the cycle was considered.It has been seen that, compared to a traditional transcritical system, the internal heat exchanger, the microchannel exchanger for the gas cooler and the ejector allow a maximum increase in COP respectively of 35.3%, 5.6% and 27.3%. The obtained COP is up to 0.96 at very high ambient temperature (57 °C).
Artuso et al., 2020The thermal performance of a CO2 VCR system for refrigerated transport applications was analyzed. Three different configurations were investigated: the standard back-pressure with low pressure receiver lay-out and two arrangements integrating a two-phase ejector. In particular, in order to extend the ejector operating range, the use of an auxiliary evaporator was considered [72].At hot climate conditions (ambient temperature and internal space temperature respectively of 42 °C and −5 °C), the ejector cycle configuration is convenient and has a maximum COP increase equal to 15.9%, if compared to the traditional configuration. The operating range of the ejector can be extended to lower ambient temperatures by using an auxiliary evaporator. This configuration allow a maximum COP improvement of 21.0%, if compared to the traditional configuration, at ambient temperature and internal space temperature respectively of 25 °C and 5 °C [72].
Fabris et al., 2021The dynamic simulation of a CO2 system designed for a medium-size refrigerated truck. The system involved a two-phase ejector to improve its performances. In order to extend the ejector operating range, an auxiliary evaporator was considered. A safety system was also implemented in order to limit the increase in temperature and pressure (low pressure side) due to long periods of inactivity. This system worked by turning on the compressor and by-passing the evaporator [68].Results show that the system has an average COP of 1.60. For the delivery mission considered, an overall Duty Cycle of 10% is obtained. The 96.6% of the total cooling energy provided by the system is given by exploiting both the main and the auxiliary evaporator. However, results show that exploiting both evaporators can become counterproductive when the systems operate during the hottest hours of the day [68].
Shi et al., 2020A system able to produce cooling and electrical power simultaneously was proposed. Such system consisted of a CO2 Brayton cycle for electrical power production, and a transcritical CO2 ejector cycle for refrigeration. The system was able to operate in three different modes: R (Refrigeration), P (Power generation) and RP (Refrigeration and power generation).The feasibility of the multi-mode operation was demonstrated. The proposed energy solution (engine + MM-CRPC) could replace the original energy solution (engine + VCR system) by recovering the waste heat of exhaust gas. Under the refrigeration ondition, the system allow to obtain a 2.9% fuel saving and 4.8% power increase at the same time. Under freezing condition, a 3.4% fuel saving and 1.6% power increase simultaneously can be achieved. The fuel economy is correspondingly improved by 7.4% and 4.9%.
When the MM-CRPC operates in full refrigeration mode, the maximum refrigeration capacity of the proposed system is up to four times and twice the values of the original refrigerator respectively under the refrigeration and freezing conditions. When the system operates in full power mode (no refrigeration demand), a 8.3% extra power relative to the engine power can be produced [73].
Pan et al., 2020A combined power and refrigeration system, consisting of a regenerative supercritical CO2 Brayton cycle and an ejector expansion refrigeration cycle, was proposed. The Brayton cycle generated power by recovering the waste heat of the engine [74].The refrigerating capacity and COP of the system are respectively up to 225.5 kW and 2.05, if considering the R32/CO2 (0.9/0.1 ratio) mixture. The total energy consumption, including the additional weight and power consumed by the second compressor contributions, accounts for 14.4% of the engine power output to realize refrigeration. The total energy consumed by the VCR system is about 18% of the engine power output, which is higher than that of the RSCBC/EERC related to the same refrigerating capacity (225.5 kW) [74]
Table 13. Commercially available PCMs in the temperature range from −65 °C to 10 °C. Reprinted from ref. [17].
MaterialMelting Temperature (°C)Latent Heat
(kJ/kg)
Type of Product
E-65−65240Inorganic
SP-50−50 to −48200Inorganic
E-50−50175Inorganic
PureTemp-37−37175Bio-based
organic
E-37−37225Inorganic
E-34−34200Inorganic
ATS-40−33300Inorganic
E-32−32225Inorganic
va-Q-accu-32G−32243n.a.
PCM-30−30150–160Organic
HS30N−30224Inorganic
E-29−29250Inorganic
SP-30−29 to −28250Inorganic
SP-28−29 to −28260Inorganic
HS26N−26274Inorganic
E-26−26265Inorganic
SP-24−25 to −23285Inorganic
HS23N−23262Inorganic
E-22−22305Inorganic
CrodaTherm-22−23217n.a.
va-Q-accu-21G−21234n.a.
ClimSel C-21−21285Inorganic
PureTemp-21−21239Bio-based
organic
E-21−21285Inorganic
ATS-21−21320Inorganic
SP-21−21 to −19285Inorganic
E-19−19300Inorganic
HS18N−18242Inorganic
ClimSel C-18−18288Inorganic
SP-17−18 to −17300Inorganic
E-15−15320Inorganic
HS15N−15308Inorganic
PureTemp-15−15301Bio-based
organic
ATS-12−12360Inorganic
E-11−12310Inorganic
SP-11−12 to −11240Inorganic
SP-11 UK−12 to −10330Inorganic
PCM-10−10175–185Organic
MPCM-10−10170–180Organic
MPCM-10D−10170–180Organic
HS10N−10290Inorganic
RT-9 HC−9250Organic
HS7N−7296Inorganic
SP-7−7 to −5290Inorganic
ATS-6−6360Inorganic
E-6−6300Inorganic
RT-4−4180Organic
E-3−4330Inorganic
HS3N−3346Inorganic
ATS-3−3330Inorganic
PureTemp-2−2277Bio-based
organic
E-2−2325Inorganic
RT00175Organic
E00395Inorganic
va-Q-accu + 00G0330n.a.
HS011350Inorganic
A22230Organic
ATP 22215Organic
RT2 HC2200Organic
SP5 gel2 to 7155Inorganic
va-Q-accu + 05G2 to 8240n.a.
OM033229Organic
FS033161Organic (fatty acid)
RT3 HC3190Organic
A33230Organic
RT44175Organic
PureTemp 45187Organic
A44235Organic
RT55180Organic
RT5 HC5250Organic
OM05P5216Organic
A55170Organic
CrodaTherm 55191Bio-based
organic
SP7 gel5 to 8155Inorganic
ATP 66275Organic
A66185Organic
A6.56.5190Organic
CrodaTherm 6.56.8184Organic plant-based
Gaia OM PCM77180Organic
ClimSel C78123Inorganic
A77190Organic
PureTemp 88178Organic
OM088175Organic
RT88175Organic
RT8 HC8190Organic
S88130Inorganic
A88180Organic
A99190Organic
CrodaTherm 9.59.7186Bio-based
organic
RT1010160Organic
RT10 HC10200Organic
A1010210Organic
S1010170Inorganic
SP9 gel10 to 11155Inorganic
Table 14. Summary of the characteristics required for a PCM. Reprinted from ref. [17].
CategoryProperty
ThermalSuitable phase change temperature;
High latent heat capacity;
Good heat transfer characteristics
PhysicalFavorable phase equilibrium;
High density;
Small volume change;
Low vapour pressure
KineticNo supercooling; Sufficient crystallisation rate
ChemicalLong term stability;
Compatibility of PCM with other materials;
No toxicity;
No flammability concerns
Economic and environmentalAbundant; Available;
Cost-effective;
Good recyclability
Table 15. Main results from use of PCM in food transport and packaging. Reprinted from ref. [17].
ApplicationTheoretical (T)
Experimental (E)
PCM (Tmelting (°C))Main ResultsReference
Wall for refrigerated vehicleERT5 (5)Peak shift (2 to 2.5 h);
Peak heat transfer reduction (29.1%);
Average heat transfer reduction (16.3%)
Ahmed et al., 2010
Wall for refrigerated vehicleT/EEnergain PCM panel (21)Average heat transfer reduction daytime (25%)Glouannec et al., 2014
Wall of 20 ft ISO containerT/ERT35HC (35)Peak shift (3 h);
Peak heat transfer reduction (20%);
Average heat transfer reduction (about 4.5%)
Copertaro et al., 2016
Wall for refrigerated vehicleT/ERT35HC (35)Peak shift (3.5 to 4.5 h);
Peak heat transfer reduction (5.5 to 8.5%)
Fioretti et al., 2016
Wall for refrigerated vehicleT/EComposite PU/PCM C18 Inertek (18)Average heat transfer reduction (0.3 to 4.1%)Michel et al., 2017
Storage container for cold/hot foodT/ERT-2 (2);
PT-15 (−15);
PT-63 (63)
Increase in storage time (320% to 400%)Oró et al., 2013
Storage container for ice creamT/EE-21 (−21)Decrease in product temperature when stored in room temperature (10 K)Oró et al., 2013
Storage container for ice creamEE-21 (−21)Decrease in product surface temperature during heat load test (17 K)Leducq et al., 2015
Packaging for chilled foodT/ERT5 (5)Increase in thermal buffering capacity; Increased shelf life of ham (6.7%)Hoang et al., 2015
Packaging for blood bagsEMixture of n-alkanes (4.8)Correct storage temperature for 6 h (8 times increase)Mondieig et al., 2003
PCM-HEX system for refrigerated transportT/EInorganic salt-water solution
(−26.8)
Reduction in annual cost (51 to 86.4%); Storage space kept at −18 °C for 10 hLiu et al., 2012;
Liu et al., 2014
Table 16. Thermal conductivity of the insulating materials considered.
Insulating Material λ   ( W / m K )
Polyurethane (PU)0.022–0.028
Reflective Multi-Foil0.035
Aerogel0.0217
Vacuum insulation Panel0.002–0.004
Polypropilene + nanoclay0.123–0.293
Table 17. Empirical models for air infiltration rate calculation. Reprinted from ref. [86], Copyright (2019), with permission from Elsevier.
ModelEquation
Brown-Solvason (1963) v ˙ = 0.343 w h g h 0.5 ρ i ρ 0 ρ a v e 0.5 1 0.498 b H 0.5
Tamm (1966) v ˙ = 0.333 A g h 0.5 ρ i ρ 0 ρ i 0.5 2 / 1 + ρ 0 ρ i 0.333 1.5
Fritzsche-Lilienblum (1968) v ˙ = 0.333 K F , L A g h 0.5 ρ i ρ 0 ρ i 0.5 2 / 1 + ρ 0 ρ i 0.333 1.5
Gosney-Olama (1975) v ˙ = 0.221 A g h 0.5 ρ i ρ 0 ρ i 0.5 2 / 1 + ρ i ρ 0 0.333 1.5
Pham-Oliver (1983) v ˙ = 0.226 A g h 0.5 ρ i ρ 0 ρ i 0.5 2 / 1 + ρ 0 ρ i 0.333 1.5
Jones et al. (1983) v ˙ = 0.173 A ρ a v e g h 0.5 T 0 T i T i T 0 0.5
Wilson-Kiel (1990) v ˙ = K 3 w h 3 g ρ i ρ 0 ρ a v e 0.5
ρ a v e = ρ i + ρ 0 / 2 K F , L = 0.48 + 0.004   T 0 T i K = C d 1 C m
Table 18. Summary of recent studies on the temperature distribution inside refrigerated vehicle through CFD modelling.
AuthorsApplication
Kayansayan et al., 2017 Numerical analysis of heat transfer inside a refrigerated container. The effects of “the container shape factor, the inlet air slot width, and the Reynolds number of supplied cold air on the temperature distribution” [97] were analyzed.
Jara et al., 2019 A numerical analysis of the temperature distribution inside a refrigerated vehicle in transient conditions, without load, was carried out [98].
Radebe et al., 2019 A 3D model, including the turbulence RSM, was used to measure the temperature distribution and the velocity of natural convection airflow inside a refrigerated vehicle equipped with eutectic plates at a temperature of −18 °C. Three different configurations were considered [43].
Jiang et al., 2020The effect of the presence of fruit stacks on the distribution of cooling capacity inside the compartment was analyzed. In addition, the positive effect of adding baffles that can improve the cold air flow through the products was evaluated. The fruit stacks were simplified to be porous medium [99].
Li et al., 2020 The temperature distribution in a container was evaluated. Four velocities and four locations of the fan were considered and the performance obtained were compared to explore the influence of different operating parameters on temperature distribution [94].
Publisher’s Note: MDPI stays neutral with regard to jurisdictional claims in published maps and institutional affiliations.

