1. Introduction
The development of society has led to a significant increase in the demand of oil and gas resources, and the depletion of conventional petroleum resources made the exploration and extraction of unconventional hydrocarbon resources necessary [
1,
2]. Tight sandstone reservoirs are widely distributed and account for a high production of China’s total natural gas [
3,
4]. Large-scale gas fields with great potential have been discovered in more than ten basins, including Sichuan, Ordos, Songliao, Tuha, and Junggar [
5].
Deep burial generally leads to high mechanical compaction and cementation of a sandstone reservoir, so that tight and heterogeneous reservoir rocks are generated, where microcracks are developed [
6]. These microcracks affect the rock elastic properties and control the fluid flow, providing channels for hydrocarbon migration [
7,
8,
9]. Their identification is a key factor for evaluating reservoir quality [
10,
11].
The study of microcracks in tight sandstones has become an important topic of rock-physics studies [
12]. Hudson [
13] established a relation between microcrack density and rock elastic properties, while Smith [
14] stated that in low porosity rocks, the effect of cracks on seismic velocity can be important as mineral composition, total porosity, and fluid type. Yoon [
15] established a relation between aspect ratio and microcrack density. Cheng [
16] studied the effect of effective pressure and fluids. Zhang et al. [
17,
18] proposed a differential poroelastic model to describe wave propagation and dissipation in fluid-saturated rocks which contain inclusions at multiple scales.
The use of RPT (rock physics template; the list of abbreviations is given in Abbreviations) is widespread: Avseth and Ødegaard [
19] linked the reservoir characteristics with elastic attributes, whereas Avseth et al. [
20] used the Biot–Gassmann theory to discriminate between oil and gas in reservoirs. RPT was also used by Xin and Han [
21] to estimate reservoir lithology and fluids. Michel [
22] predicted porosity and oil saturation in shales, based on RPTs built with P-wave impedance (
) and the ratio between the P- and S-wave velocities (
). Gupta et al. [
23] identified thin sandy layers saturated with oil, and Ba et al. [
24] estimated porosity and gas saturation. Carcione and Avseth [
25] evaluated organic content, hydrocarbon saturation, and in-situ pressure in source rocks, and Liu et al. [
26] proposed a combination of fluid indicators. Pang et al. [
27] predicted microcrack properties in tight sandstone reservoirs, based on P-wave impedance and attenuation.
The Biot–Rayleigh (BR) theory was introduced by Ba et al. [
28,
29] for describing wave propagation characteristics in rocks with multi-phase pore structures. This work is mainly based on BR theory. We consider ten wells in the proposed area and perform a sensitivity analysis by using the ultrasonic and well-log data. On the basis of Poisson’s ratio (
) and P-wave impedance, we establish multi-scale RPTs for tight sandstone gas reservoirs, which relate the total and microcrack porosities to the seismic properties, which are obtained by means of seismic inversion.
2. Overview of the Work Area
2.1. Geology
The West Sichuan depression, bounded by the Longmenshan thrust and Longquanshan uplift belts, is a key area of natural gas exploration in China [
30]. The maximum buried depth of the Xujiahe Formation exceeds 4.5 km, and the average thickness of the target layer is approximately 120 m. The work area was subjected to multi-stage Indosinian, Yanshan, and Himalayan tectonic movements, which resulted in diverse structural fractures that are controlled by complex diagenesis processes. A mechanical compaction is an aspect of diagenesis that destroys the primary pores. The sedimentary facies are mainly about the braided river delta facies. The channels overlap with each other from different periods, forming a longitudinal superposition and plane contiguous sand bodies [
31].
2.2. Reservoir Characteristics
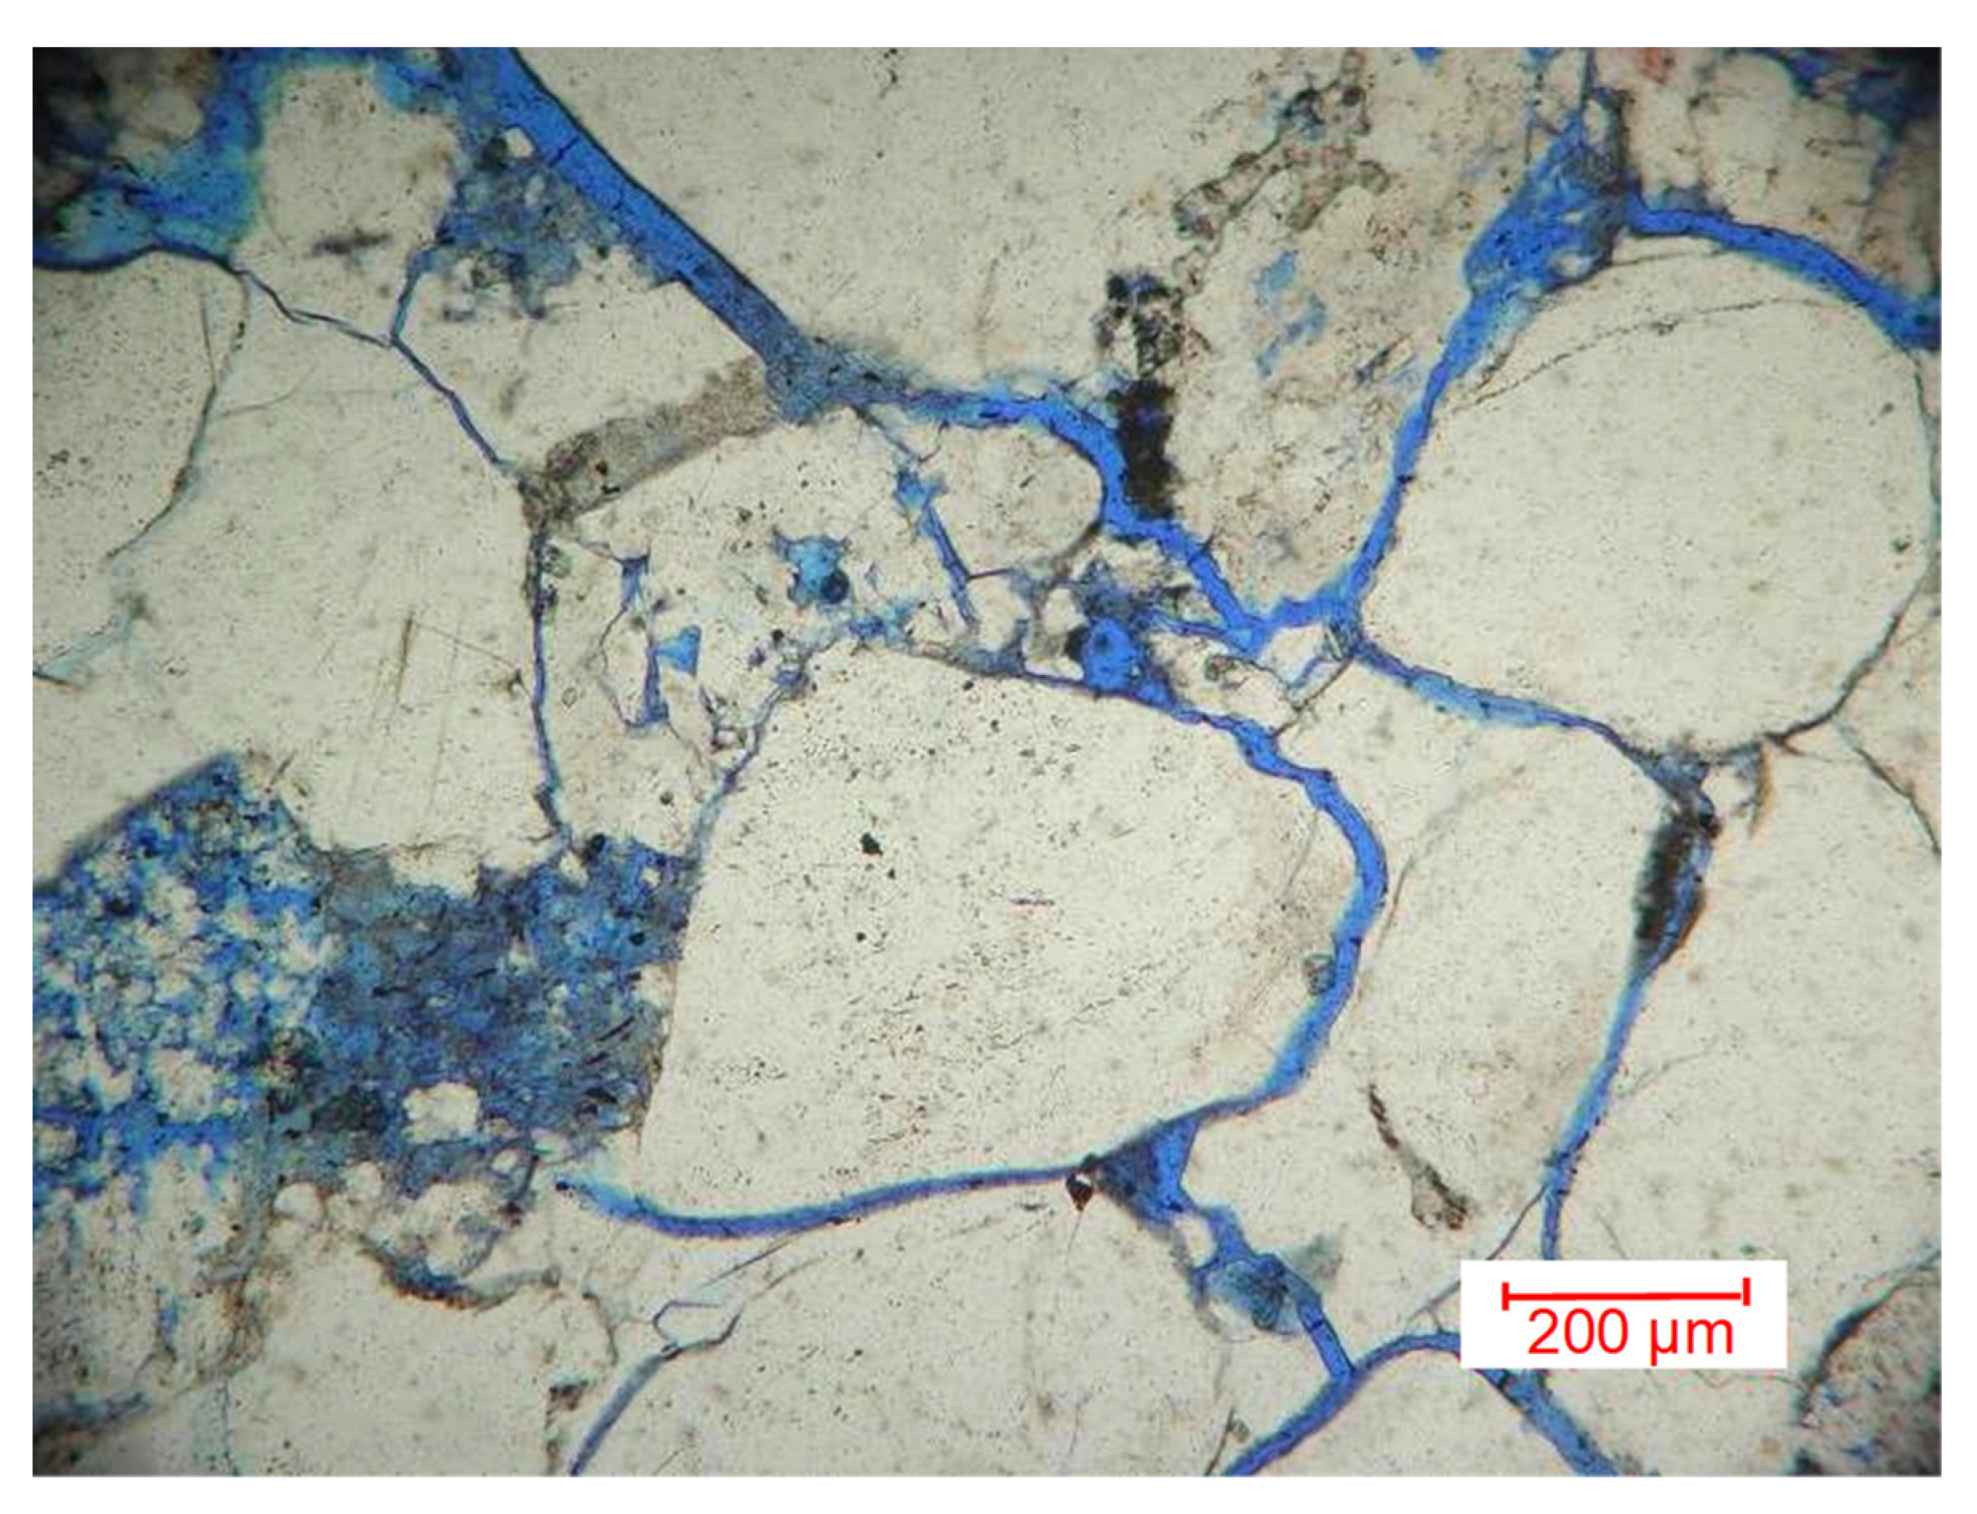
The tight sandstones are mainly composed of litharenites, with small amounts of lithic quartz arenite and feldspathic litharenite. In terms of mineral content, the average amounts of quartz and feldspar are 69% and 8.2%, respectively [
32]. The effect of compaction on the reservoirs is more significant than that of cementation.
Figure 1 shows that the compaction process is responsible for the developed geological characteristics such as complex pore structures and network microcracks. The average secondary, primary, and microcrack porosities are 2.9%, 1.1%, and 0.3%, respectively. The grain size varies from fine to medium, and the sorting property varies from poor to good. Moreover, the reservoir exhibits low porosity, low matrix permeability, and small pore-throat radii [
31]. The microcracks maintain the reservoir connectivity and facilitate the gas production [
33].
2.3. AVO Characteristics
Amplitude variations with offset (AVO) discriminate lithologies and help to detect hydrocarbons [
34]. Rutherford and Williams [
35] categorized the AVO responses of mudstone/gas-bearing sandstone interface into the three types. Subsequently, Castagna and Swan [
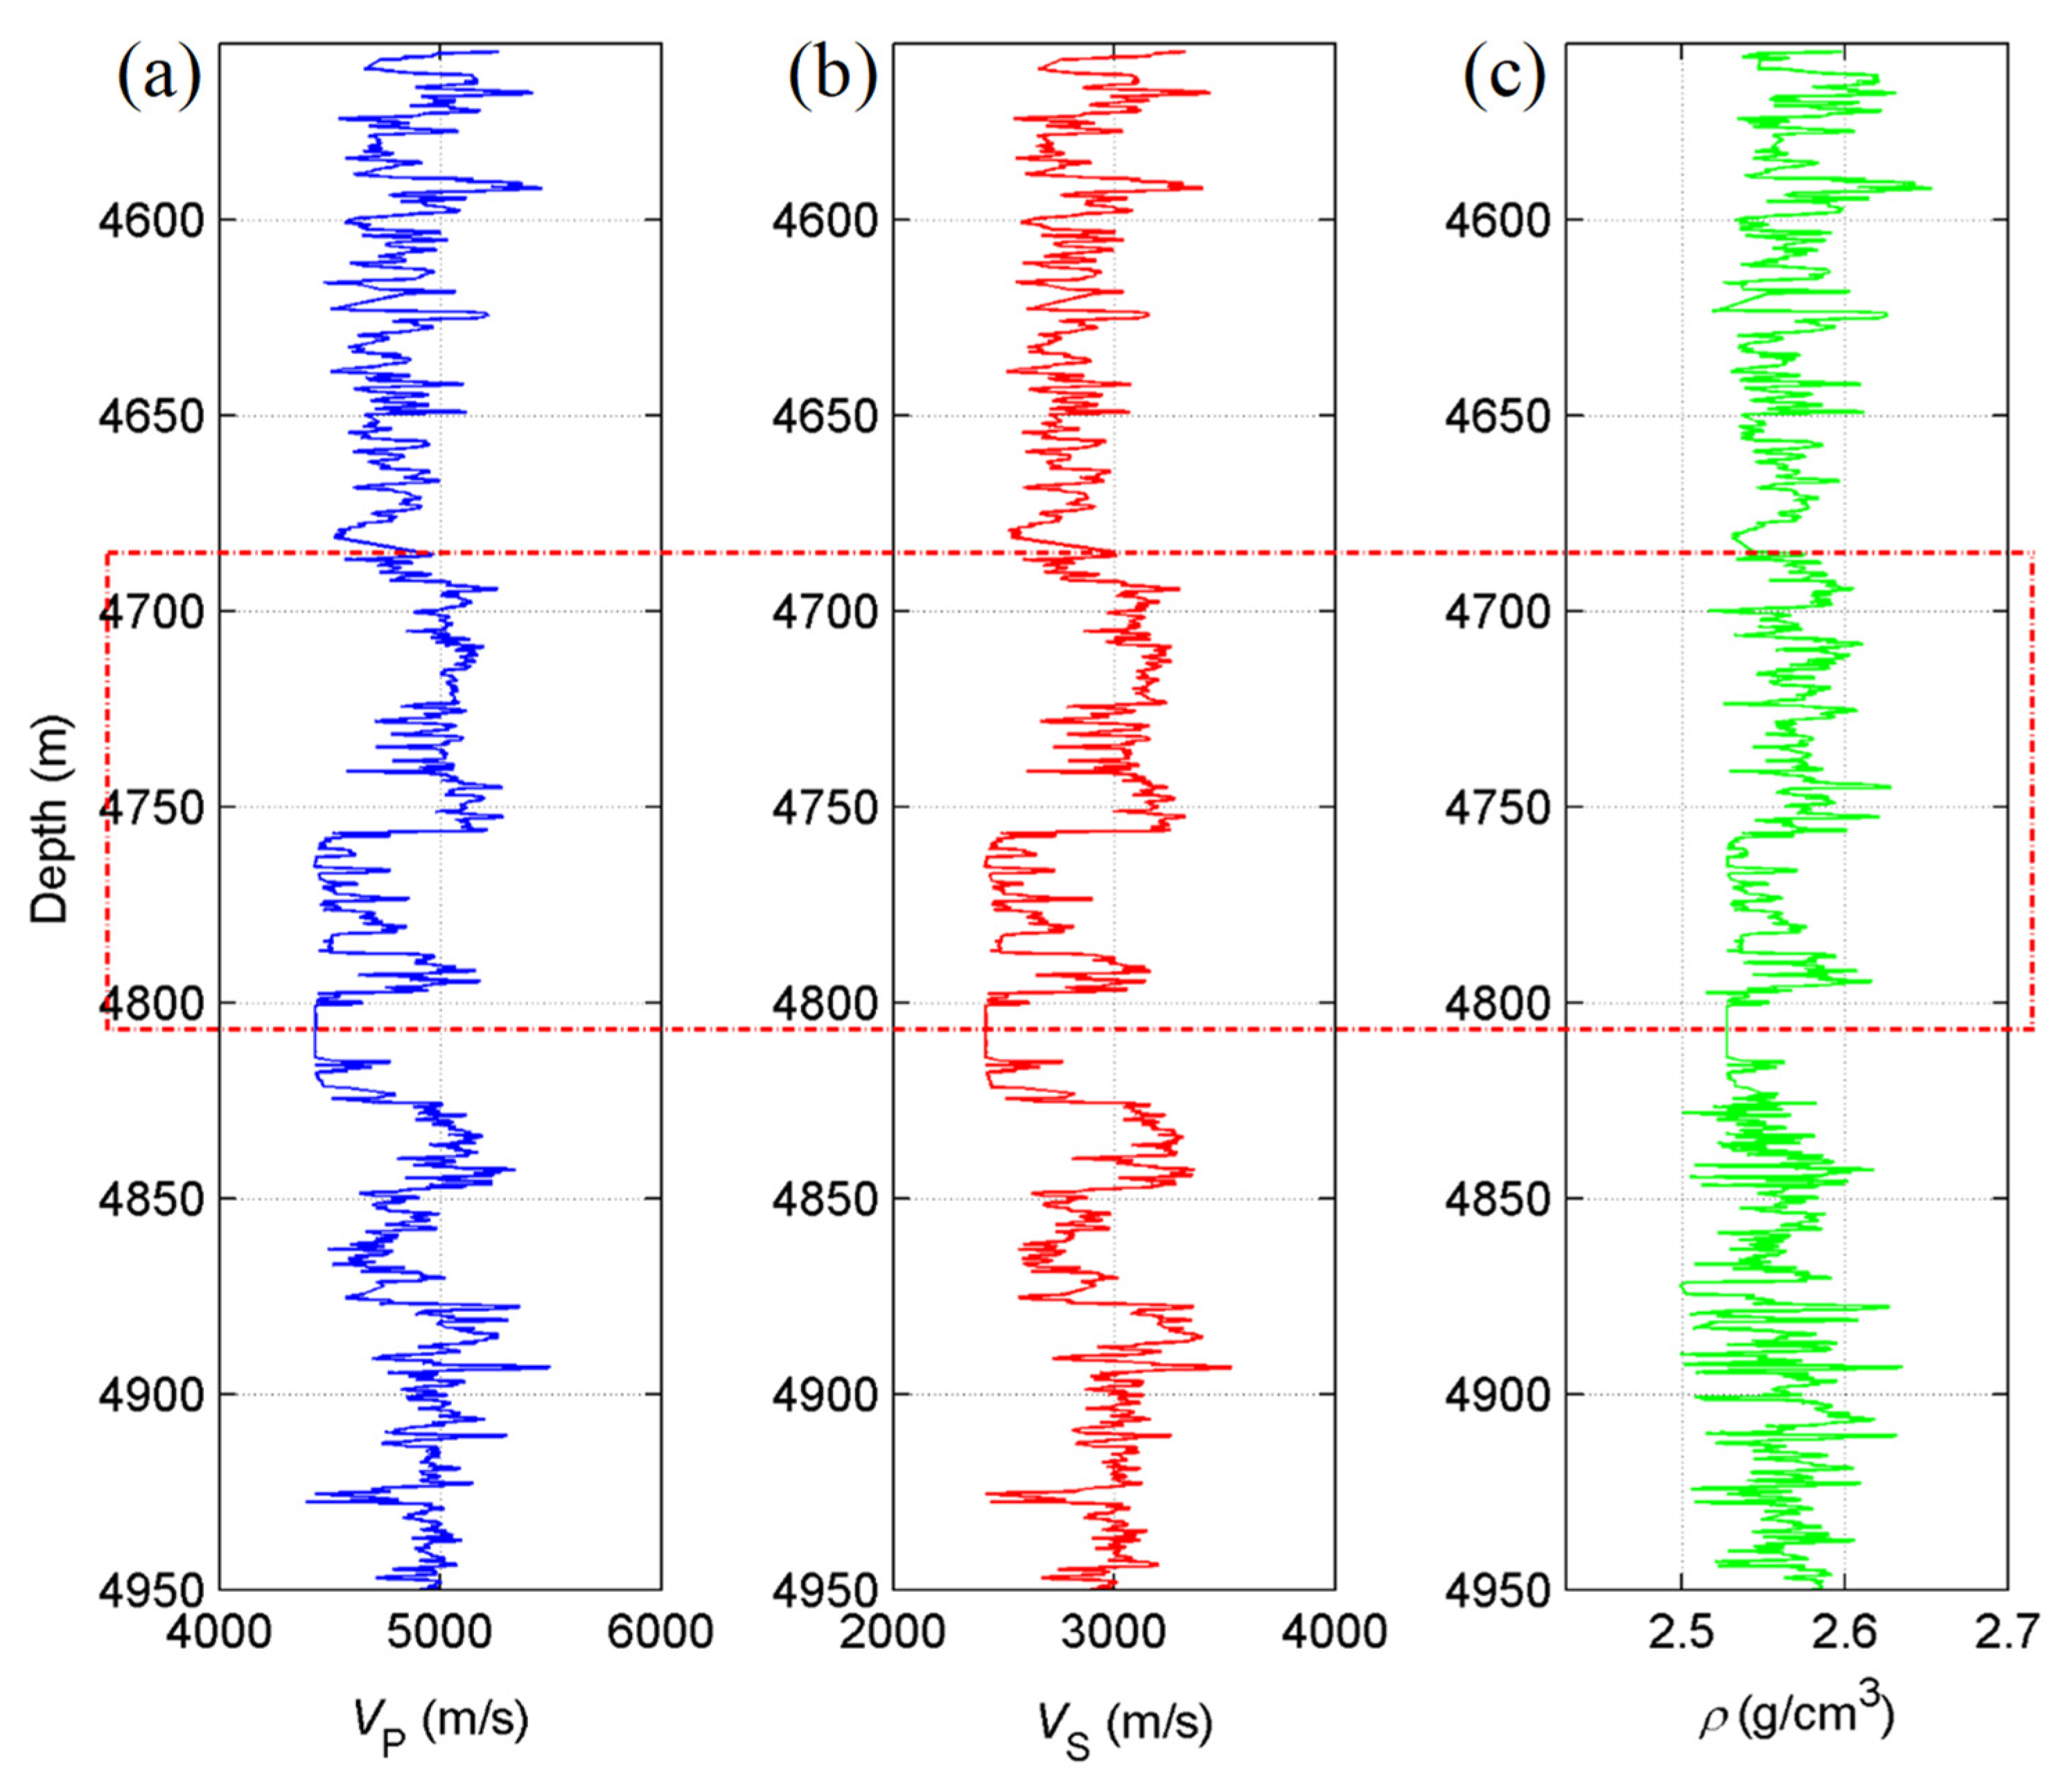
36] added a fourth AVO response type. We analyze the AVO characteristics based on the profiles of Well P, shown in
Figure 2, where the target layer is indicated with dashed red lines.
Table 1 shows the seismic properties of the sandstone model of the Xujiahe Formation based on the log data. To obtain the P- and S-wave velocities and density, a 60 m interval is selected. The model data are collected from the interval above the top interface of the target layer that has a relatively stable P-wave velocity. For the target layer, we consider average values.
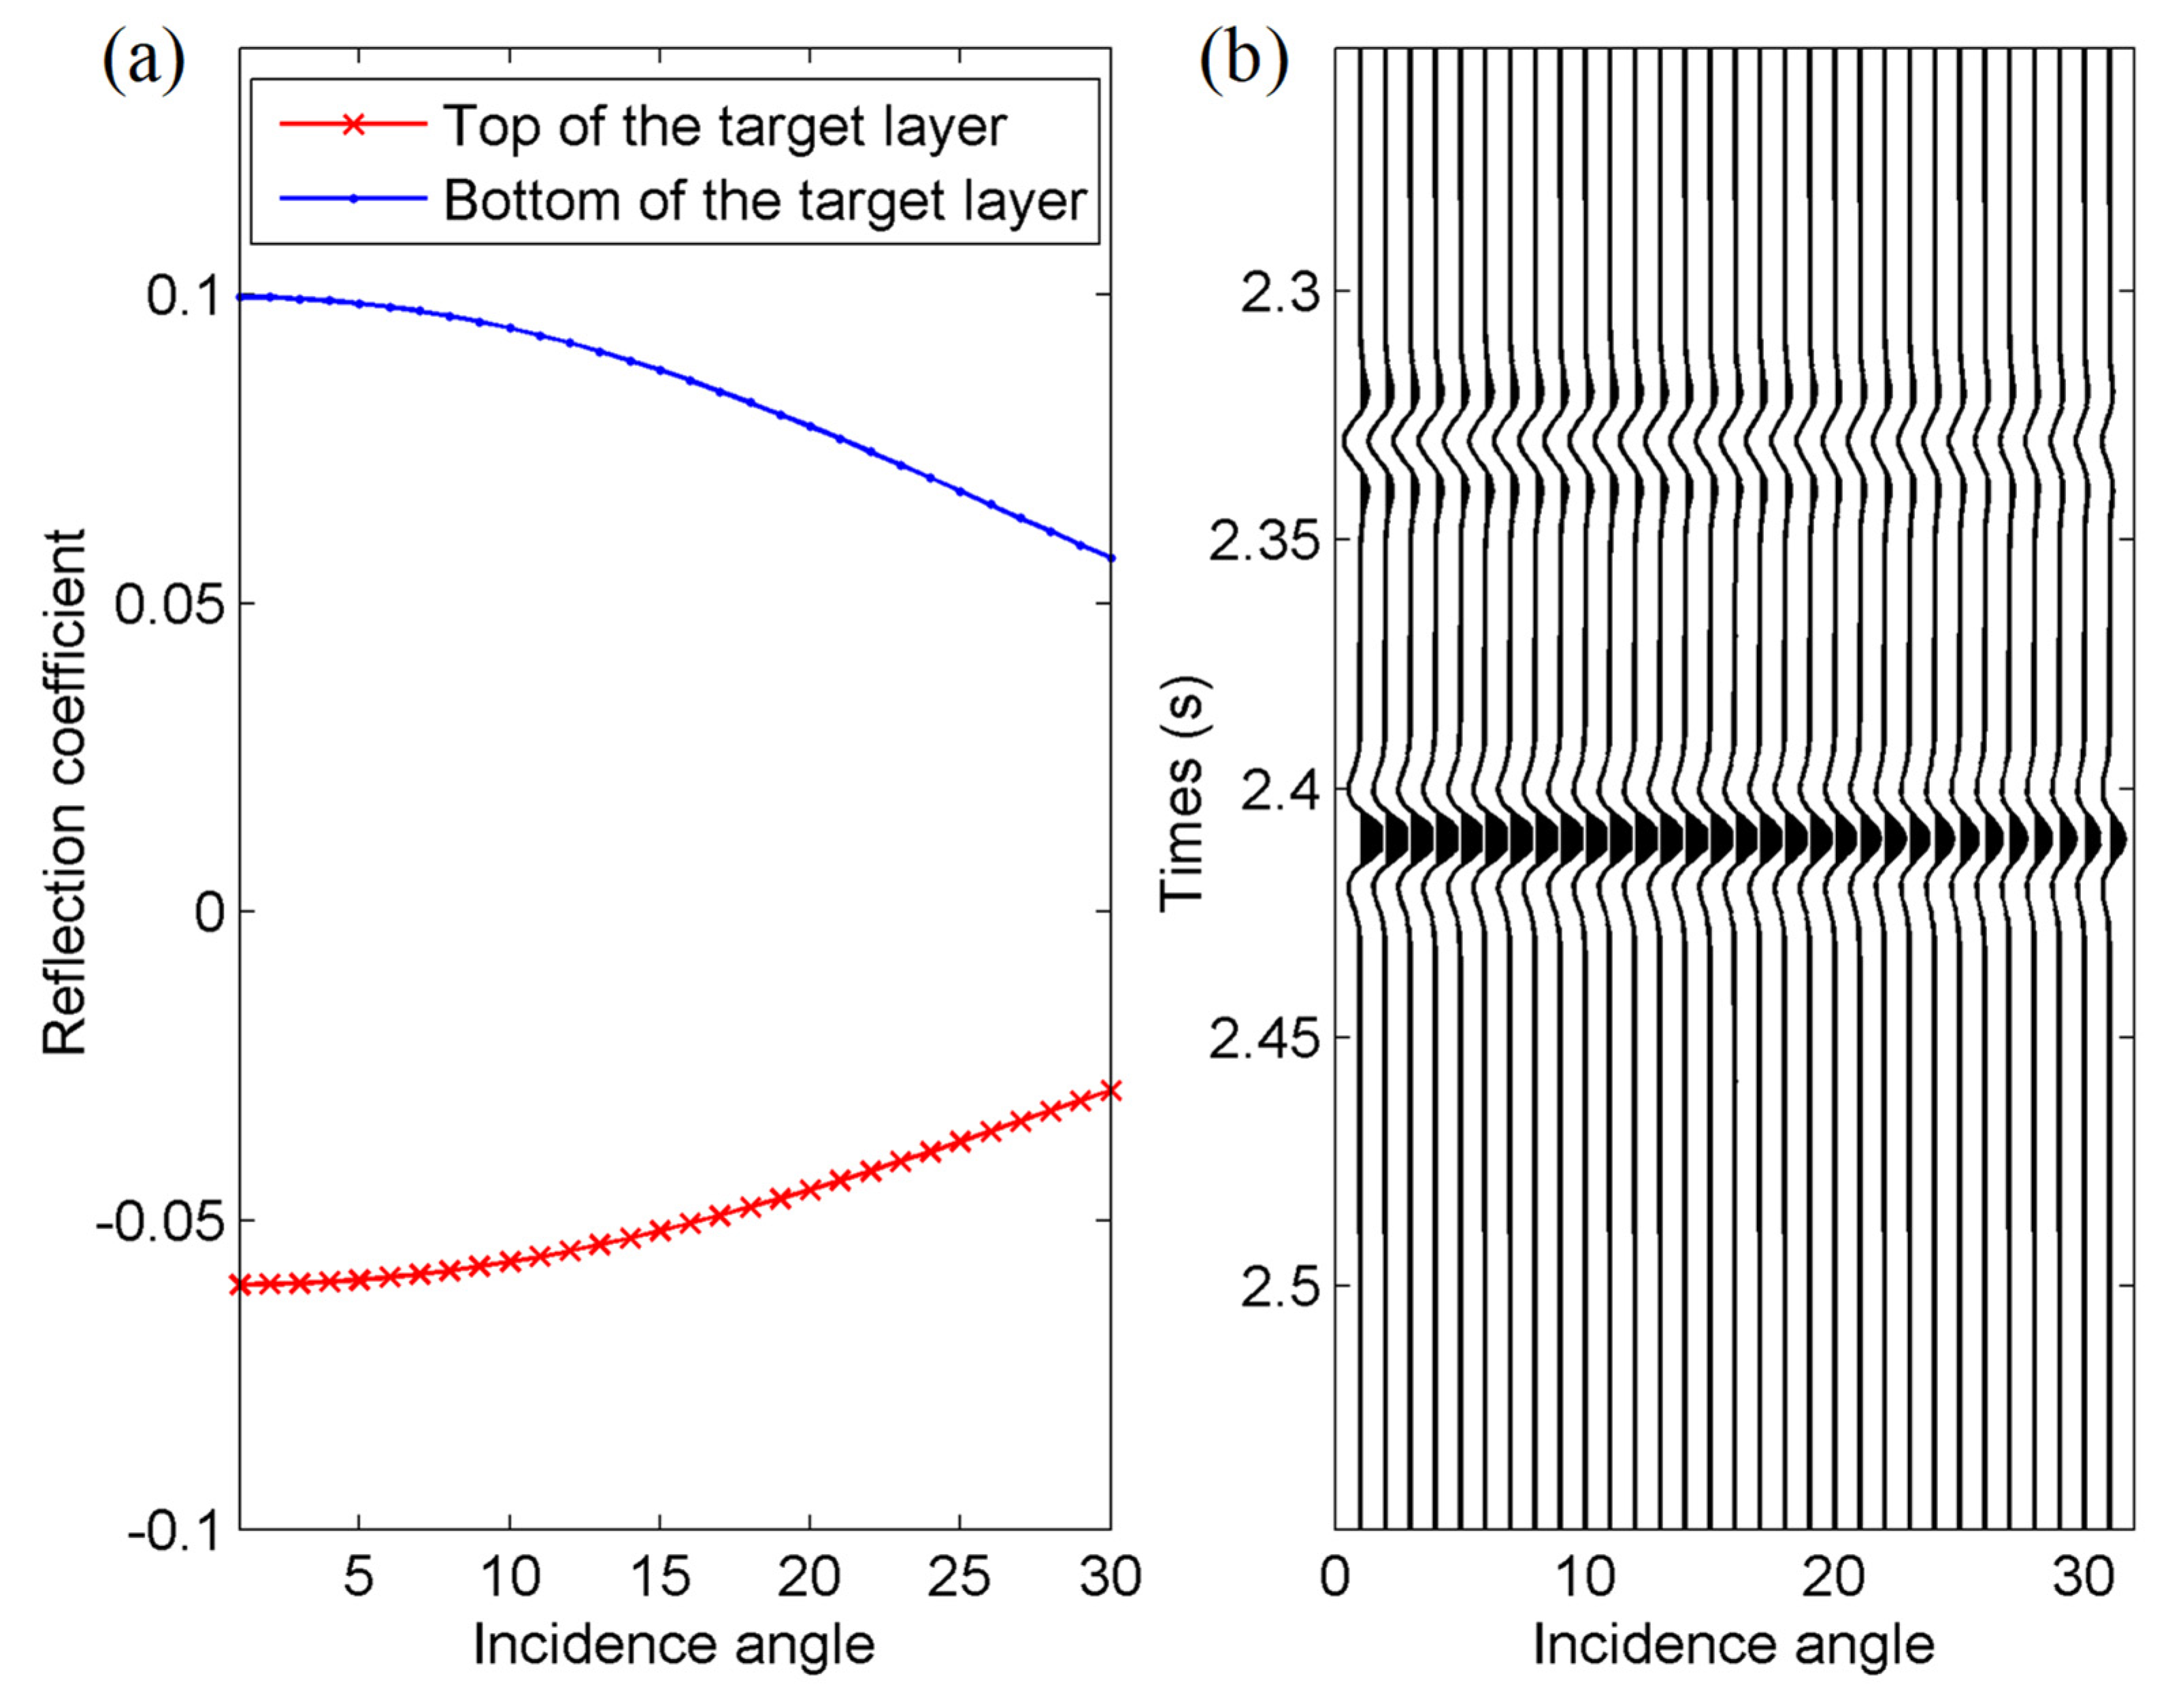
Figure 3 illustrates the AVO of the top (red color) and bottom (blue color) interfaces. The characteristics of the curves agree with the fact that that the P- and S-wave impedances of the target layer are smaller than those of the overburden mudstone. The top and bottom responses are type IV and I AVO curves, respectively.
3. Theory and Flowchart
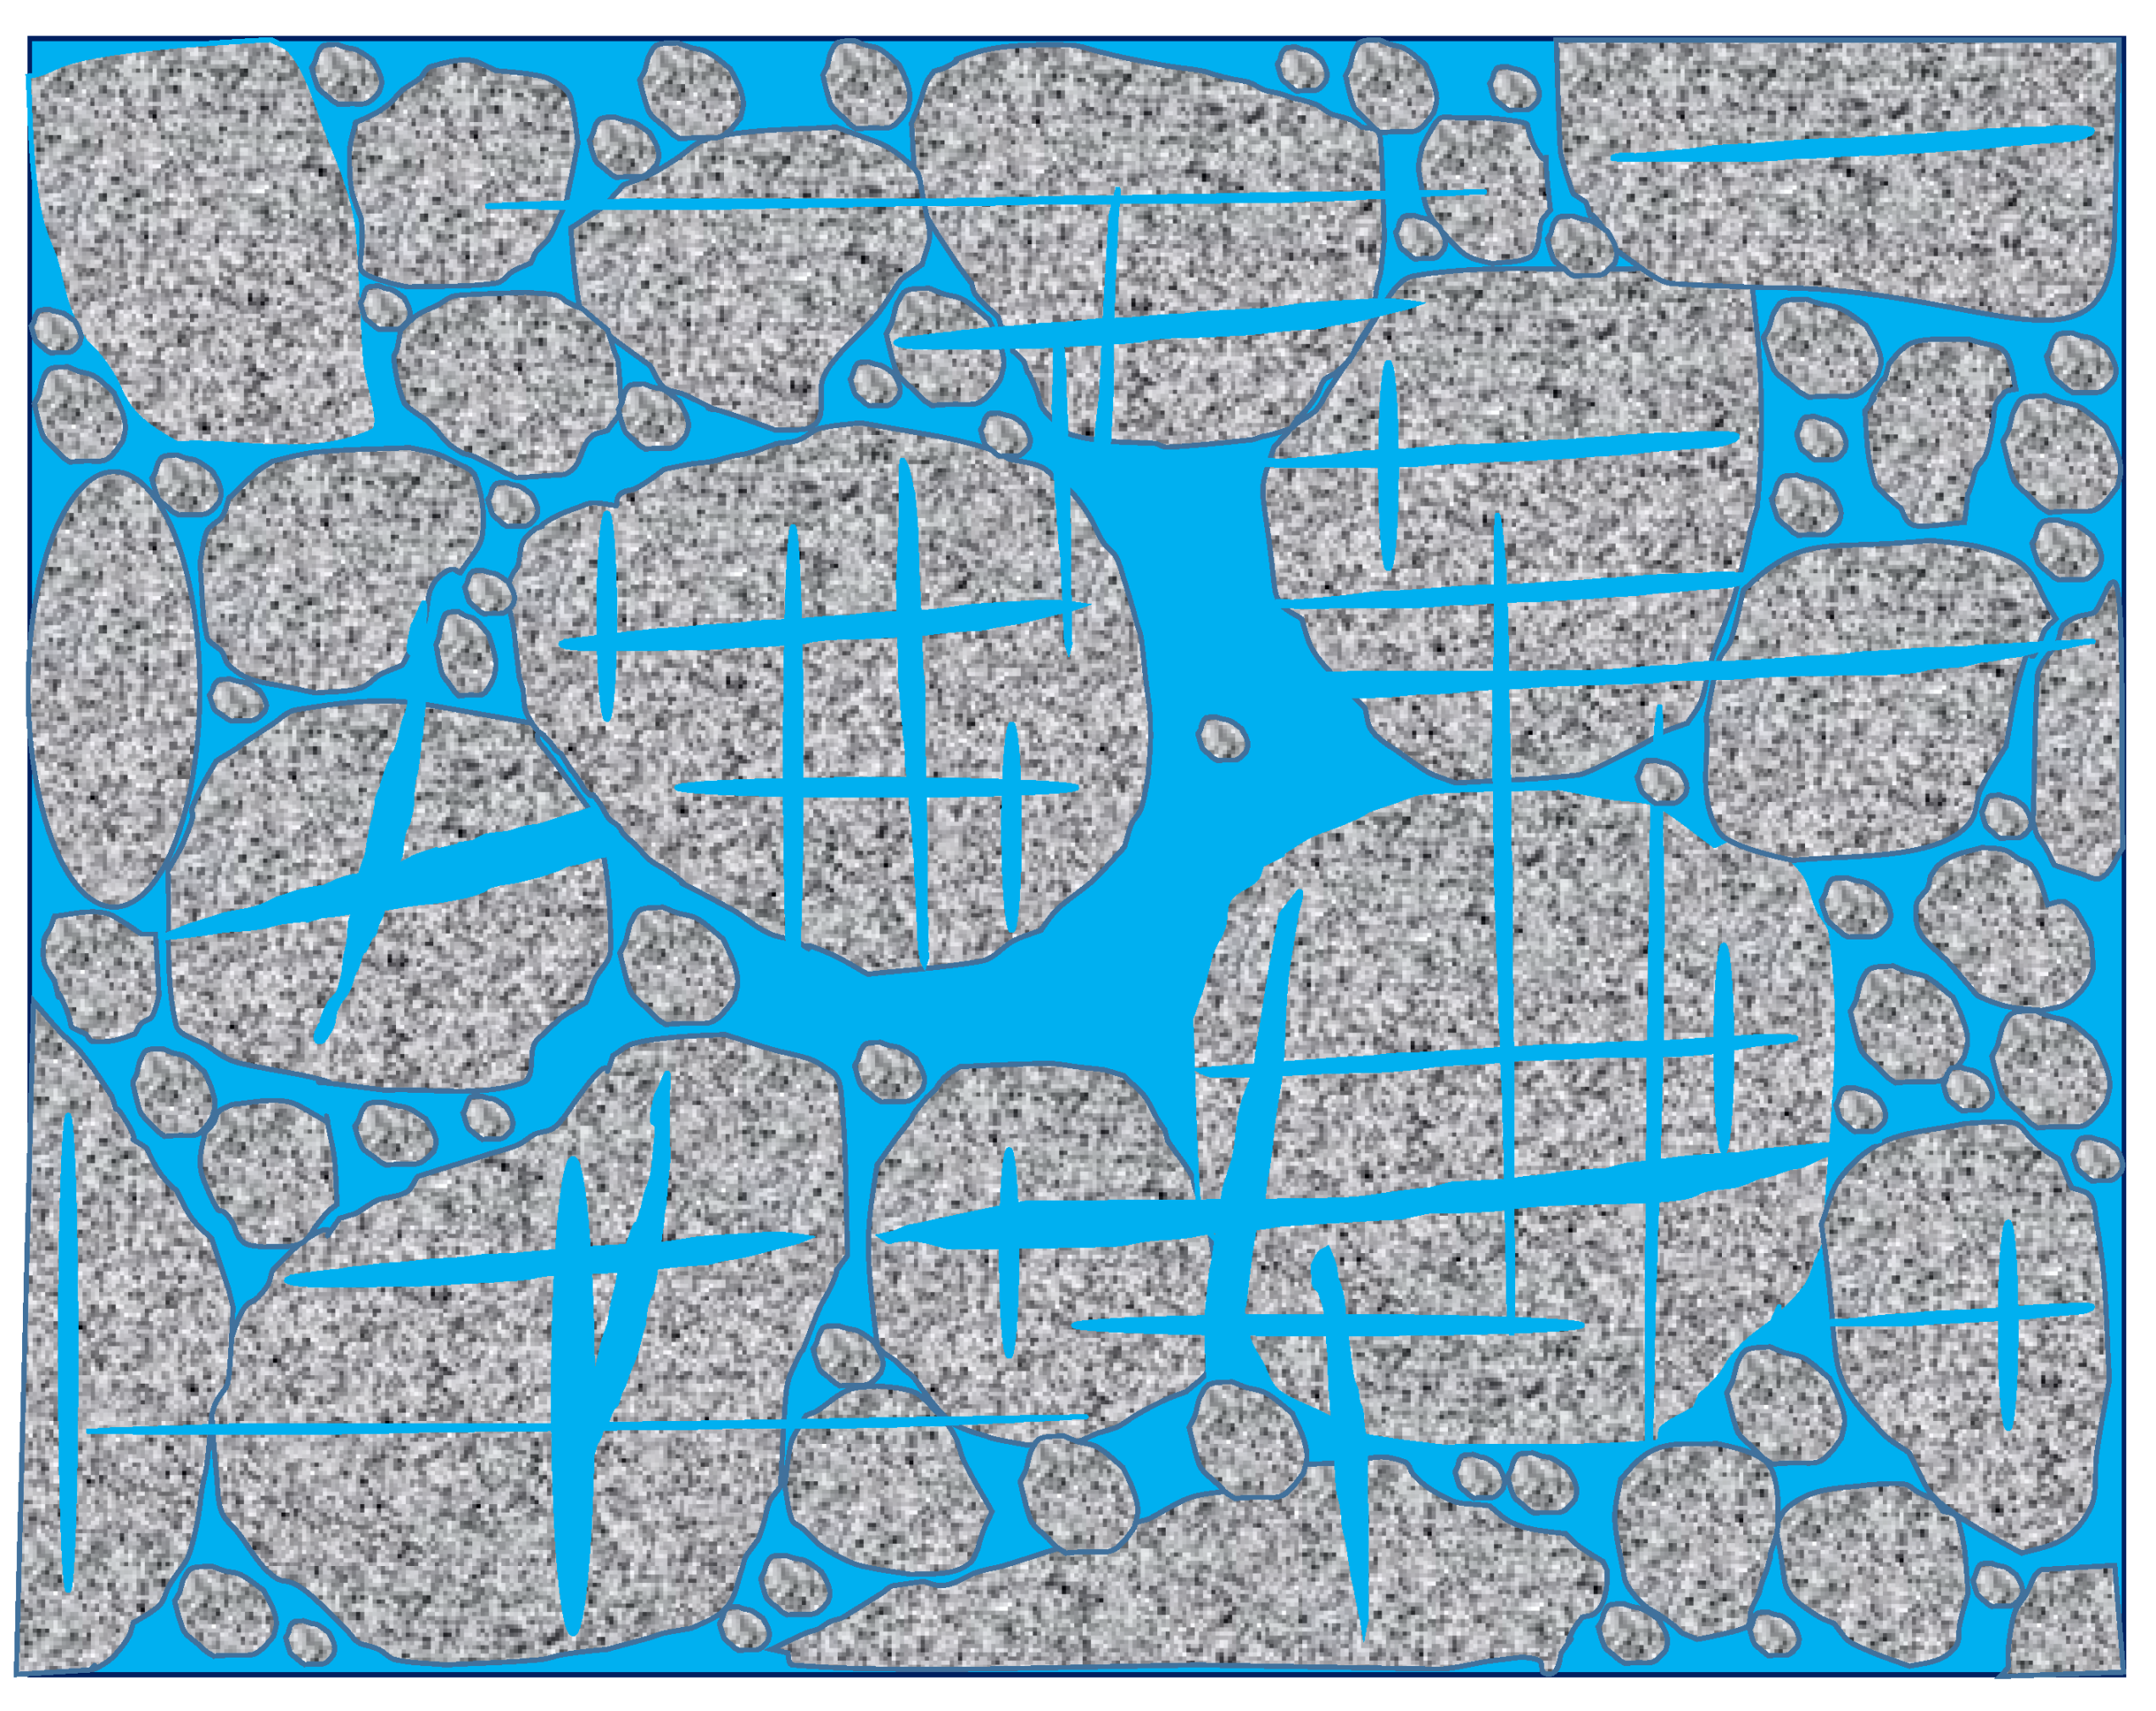
Figure 4 shows an idealization of the tight sandstone of the Xujiahe Formation, which is characterized by a complex pore structure and microcrack network. The total porosity is the sum of intergranular and microcrack porosity.
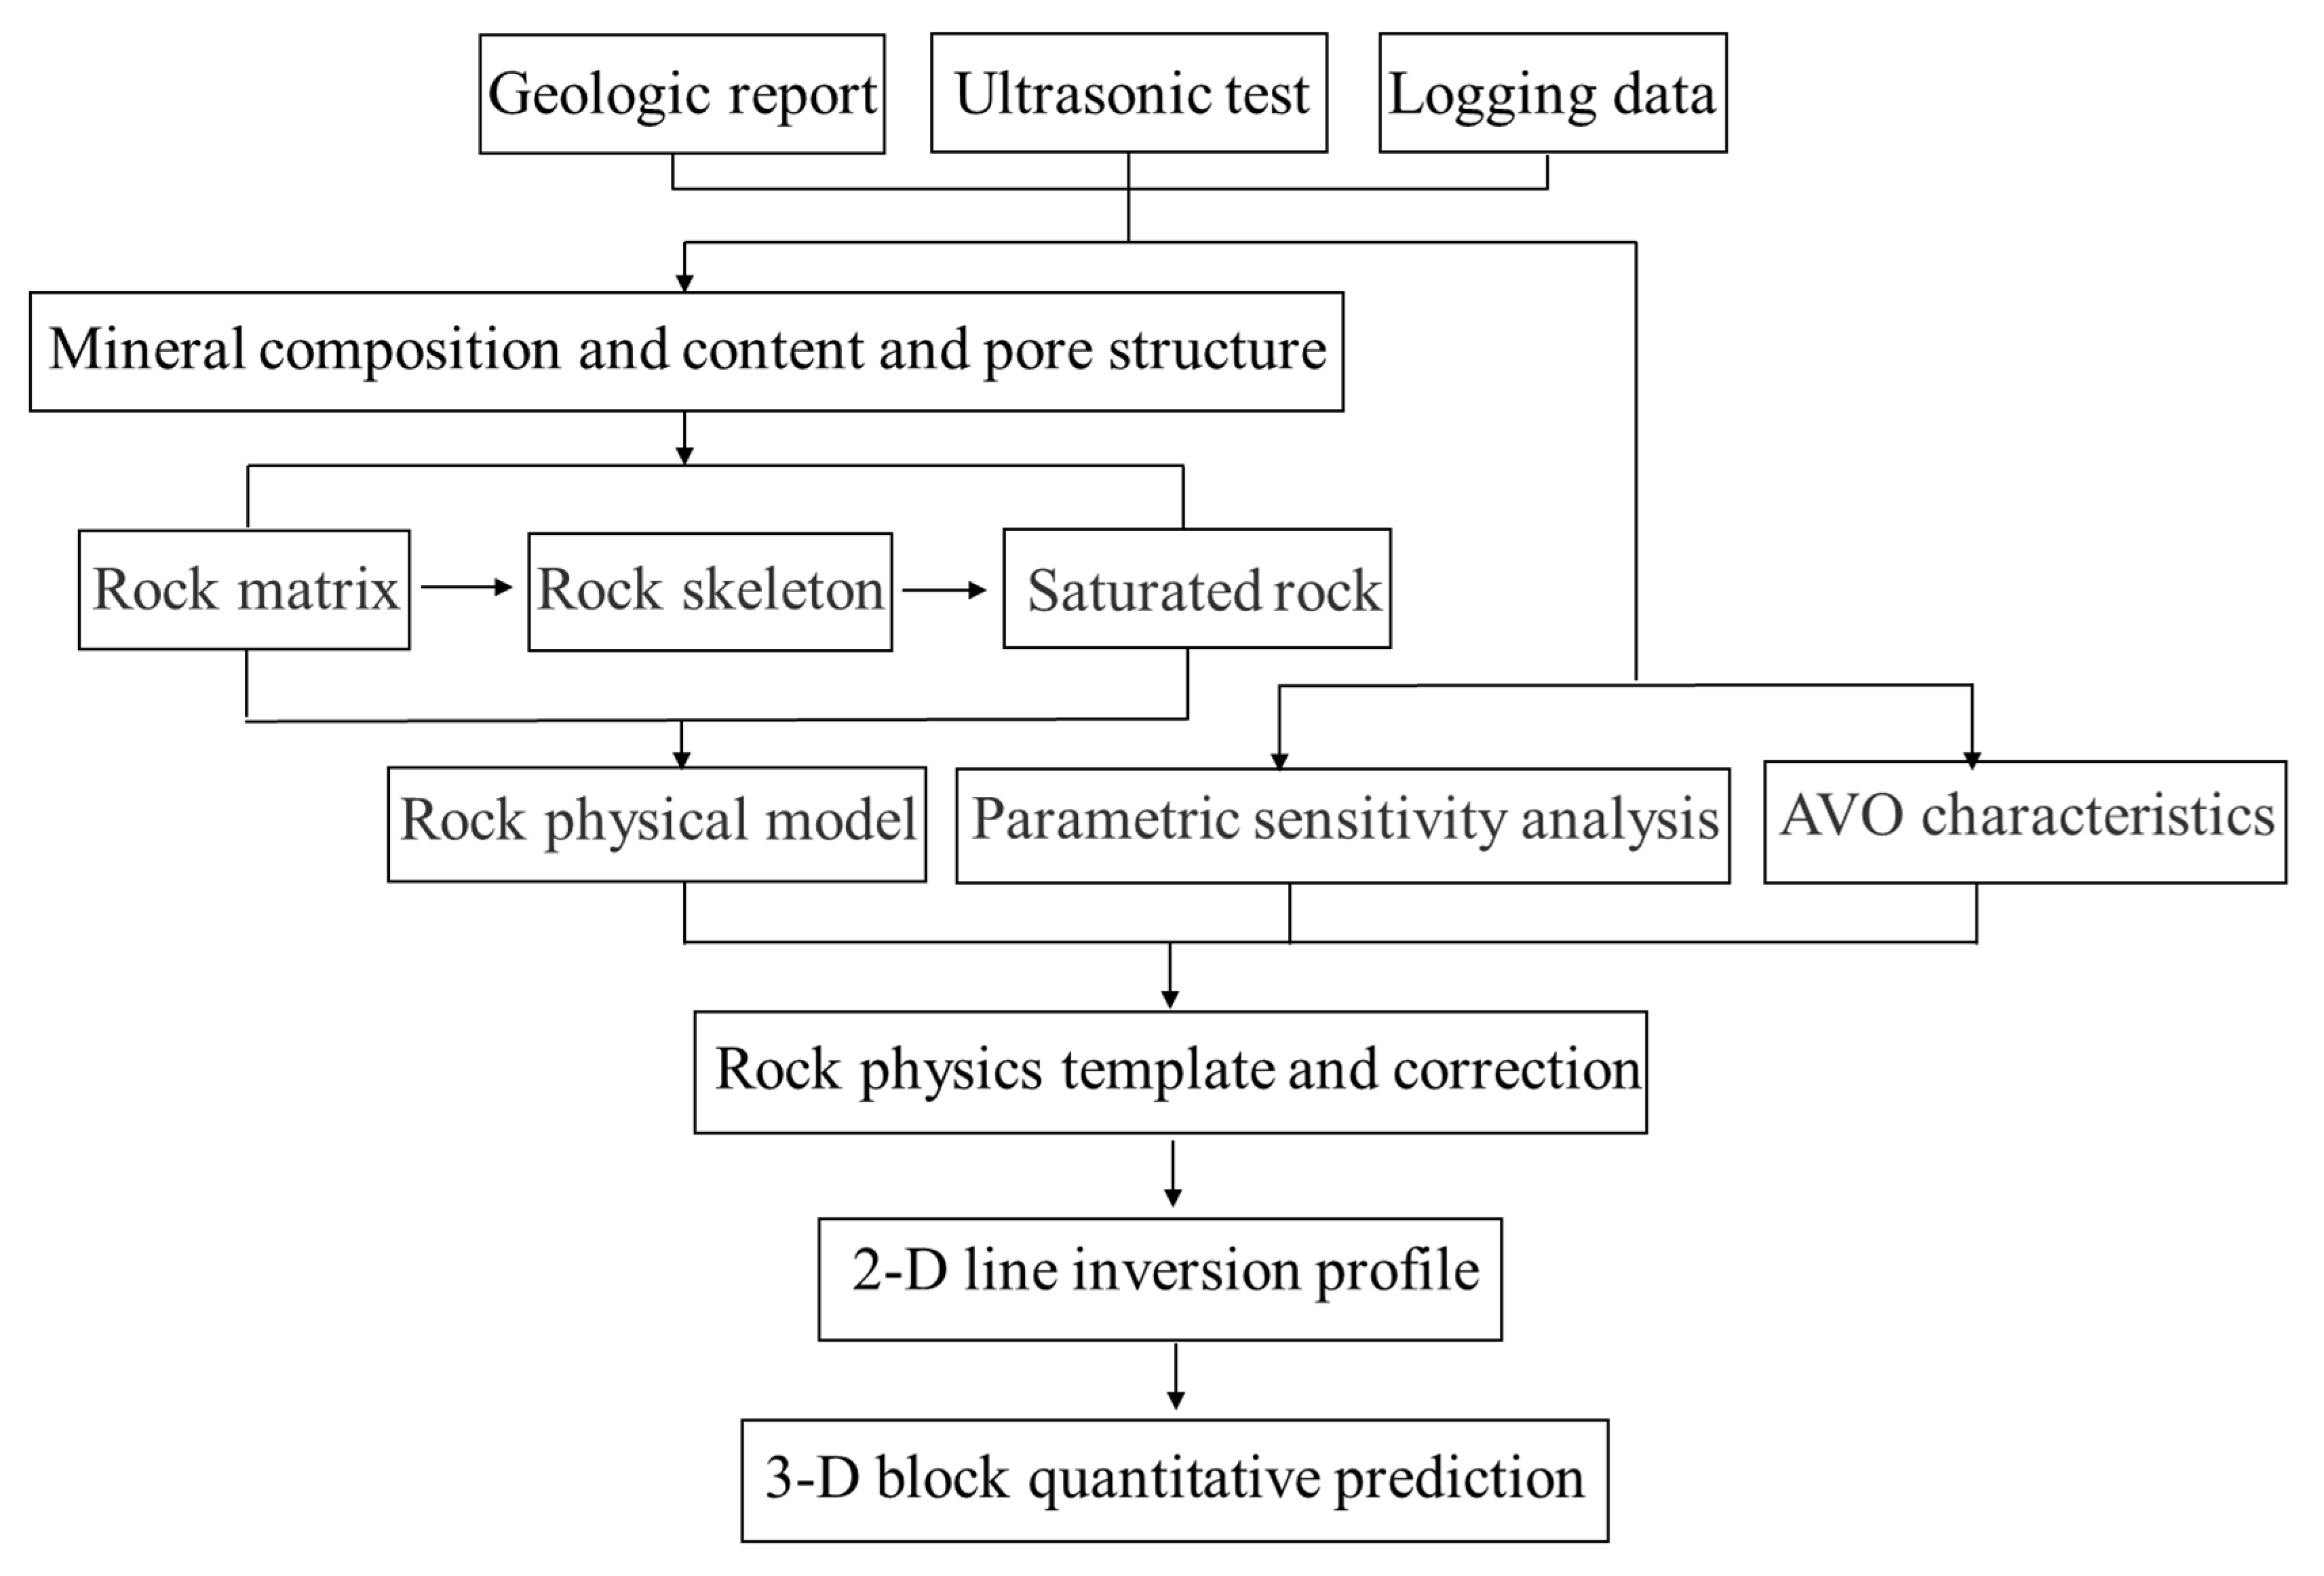
The flowchart for the prediction of the reservoir properties is given in
Figure 5. The microcrack porosity is estimated by using the quantitative relation between the elastic attributes and reservoir properties, based on a rock-physics model and aided by geological, log data, and ultrasonic data.
The main minerals are quartz, feldspar, and clay. The total porosity is less than 12%. The procedure to establish the rock-physics model is as follows.
- (1)
The Voigt–Reuss–Hill equation [
37,
38,
39] is used to compute the elastic modulus of mineral mixture
according to the mineral composition:
where
and
denote the volume fraction and elastic modulus, respectively, of the
i-th component.
- (2)
According to the pore structure shown in
Figure 4, we use the differential equivalent medium (DEM) theory [
40] to add spherical pores and oblate cracks, whose aspect ratio are 1 and 0.0005, respectively, to add pores and microcracks into the matrix, and obtain the bulk and shear moduli of the rock skeleton (starred quantities),
The initial conditions are
and
, where
and
are the bulk and shear moduli, respectively, of the initial main material (phase 1);
and
are the bulk and shear moduli, respectively, of the inclusion that is gradually added (phase 2);
y is the volume content of phase 2; and
and
[
41] are related to the shape of the inclusion.
- (3)
The equations proposed by Batzle and Wang [
42] are used to compute the bulk modulus, viscosity, and density of pore fluids at different temperatures and pressures.
- (4)
The BR theory is used to compute the wave response.
Appendix A shows the computation of the complex wave number
. The complex velocity is
, where
is the angular frequency, and the P-wave velocity and quality factor are [
7]
where “Re” and “Im” take real and imaginary parts, respectively.
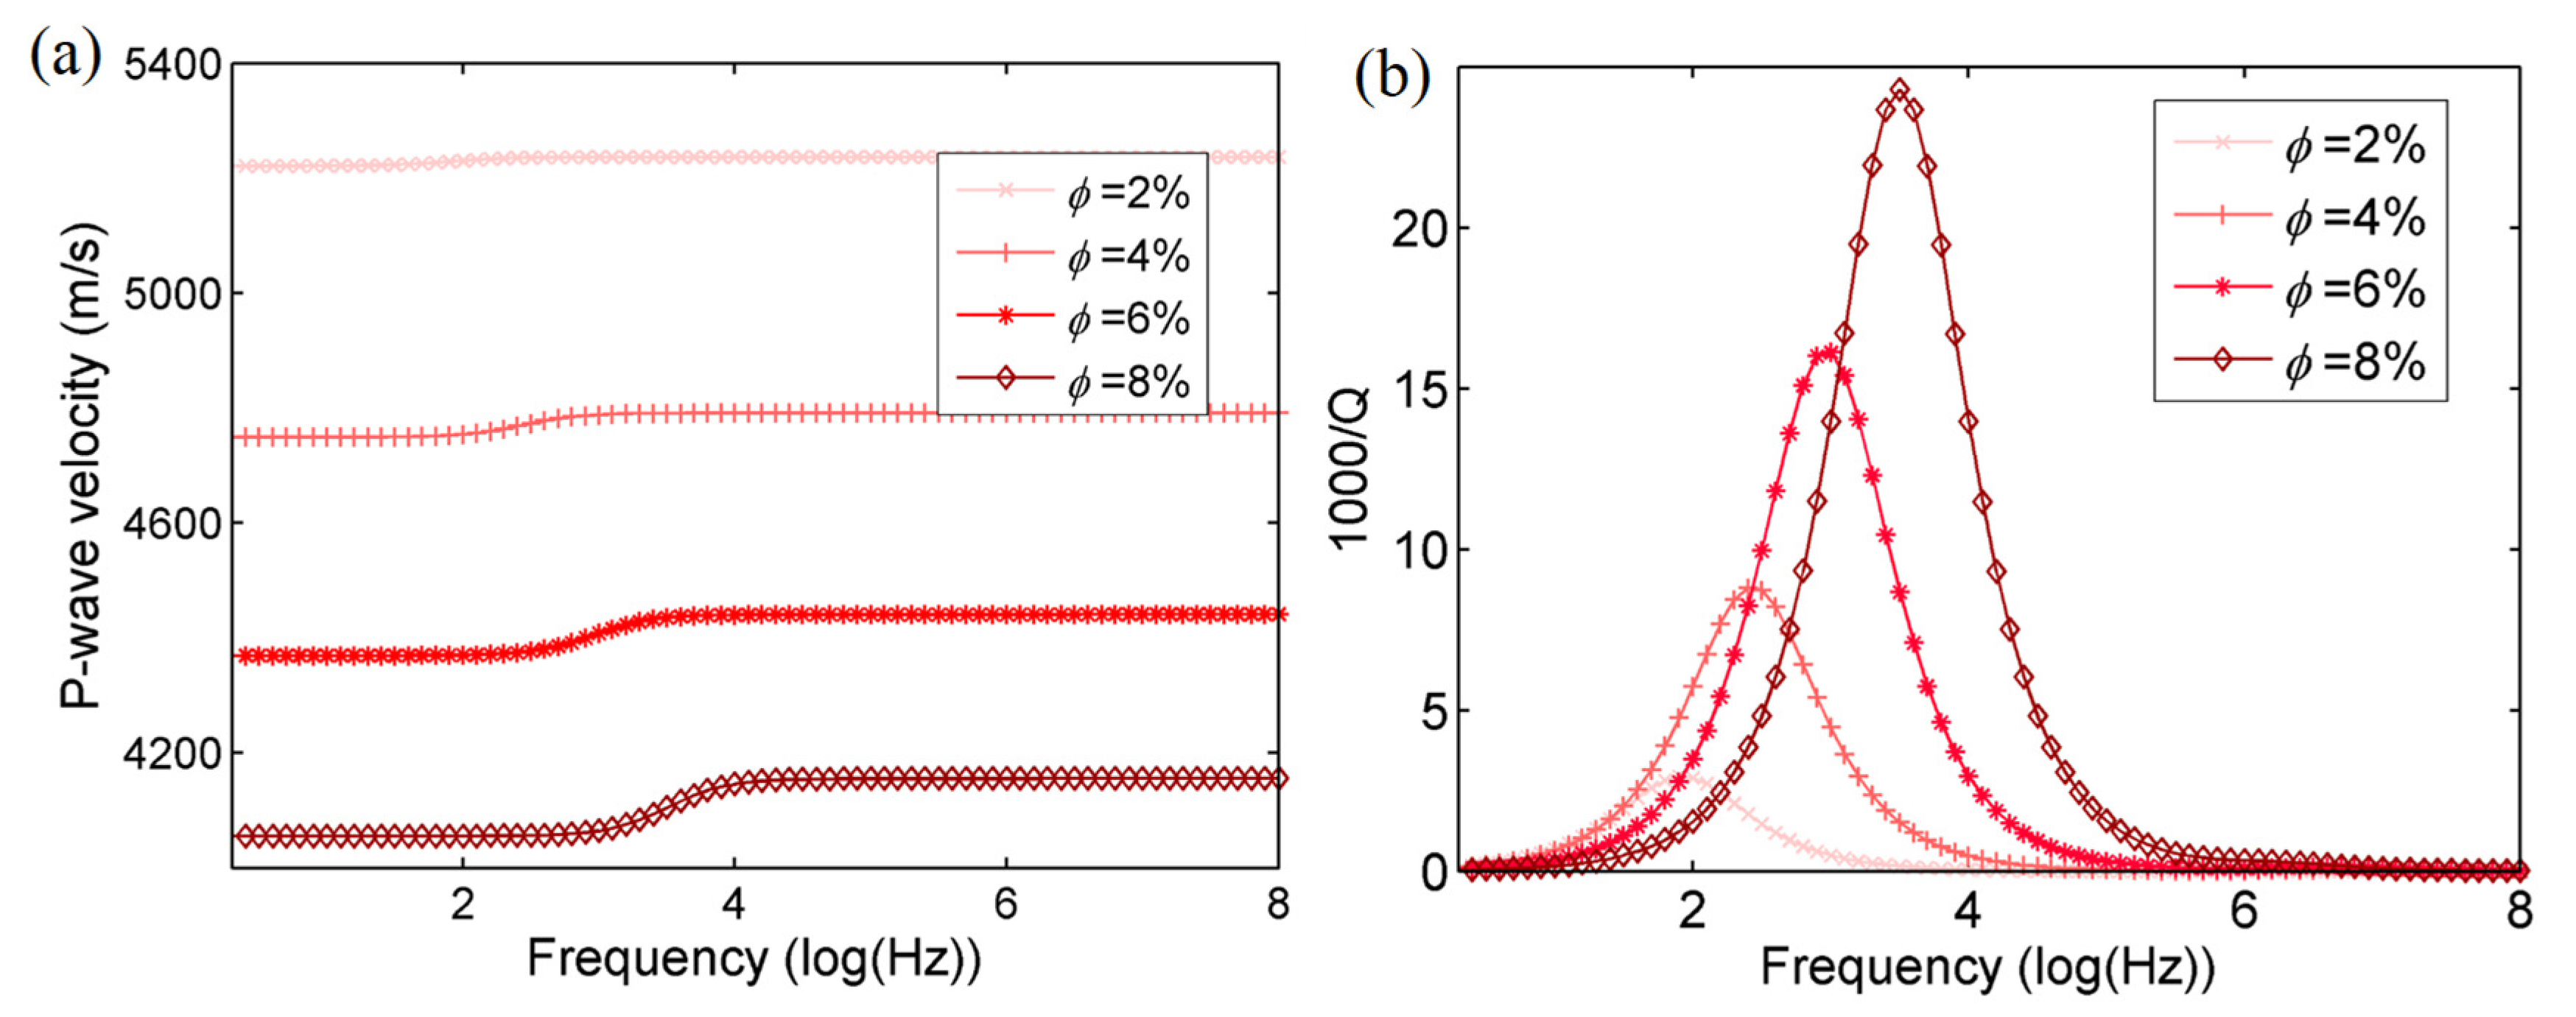
We consider the inclusion radius of 100 μm, and the bulk and shear moduli of the matrix are 33 GPa and 45 GPa, respectively. Gas has a bulk modulus of 0.02 GPa, a density of 0.089 g/cm
3, and viscosity of 0.016 × 10
−3 Pa·s. The crack porosity is set to 0.2%, and the total porosity varies as shown in
Figure 6, where the P-wave velocity and dissipation factor are plotted as a function of frequency. Increasing porosity implies increasing velocity dispersion, attenuation, and relaxation frequency.
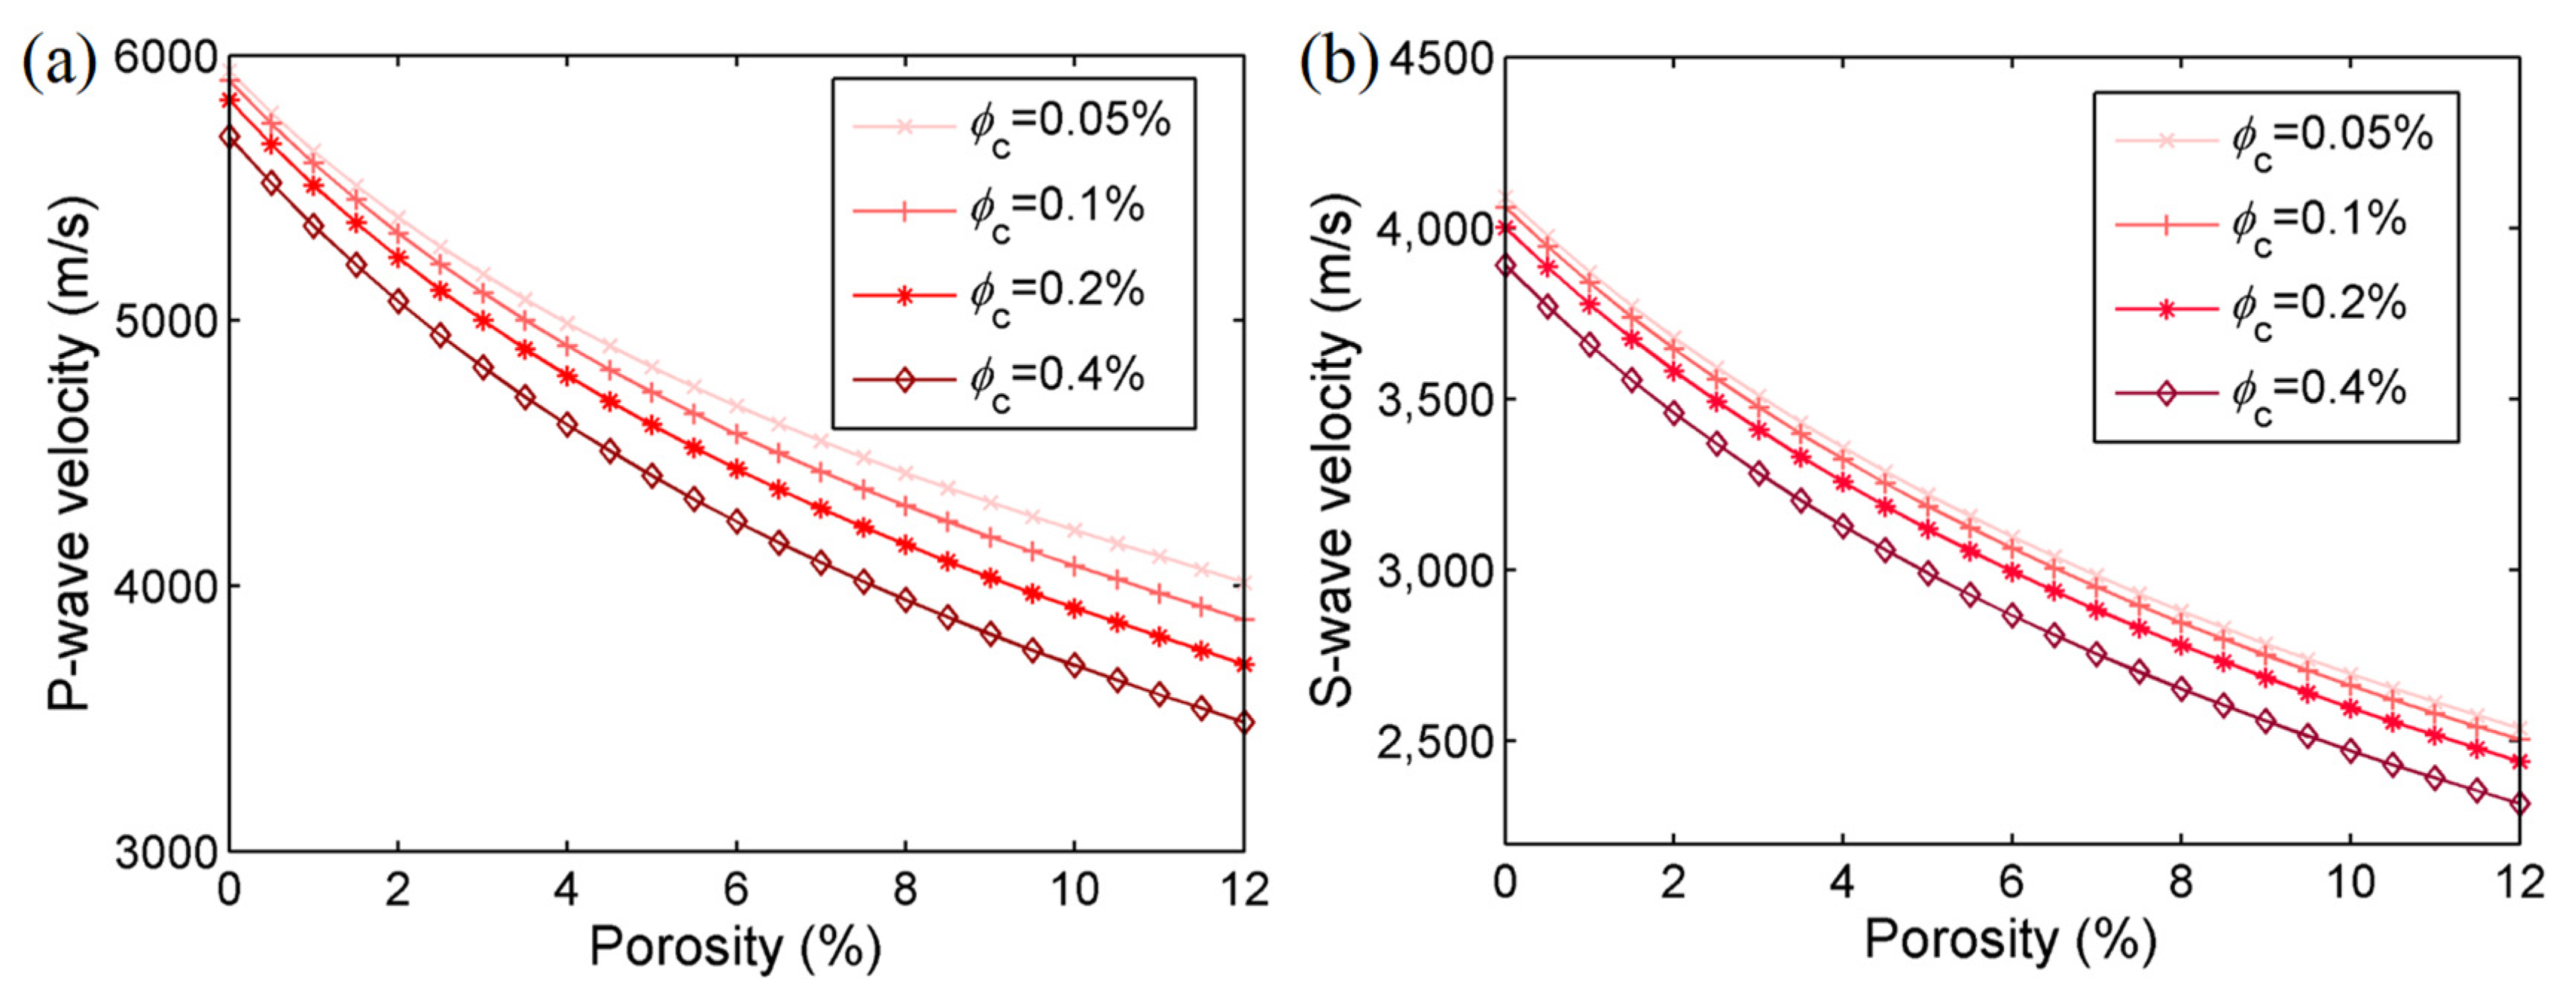
Figure 7 shows the P- and S-wave velocities as a function of the total porosity for various microcrack porosities at 1 MHz. As can be seen, the velocities decrease with increasing total and microcrack porosities, as expected.
4. Ultrasonic Experiments and Sensitivity Analysis
To investigate the effects of the microcracks, ultrasonic experiments at 1 MHz were performed. We select a sample with a porosity of 4.39% and a grain bulk modulus of 39 MPa. The grain, dry-rock, and wet-rock densities are 2.691, 2.573, and 2.62 g/cm
3, respectively, where the sample is saturated with water. The experimental setup proposed by Guo et al. [
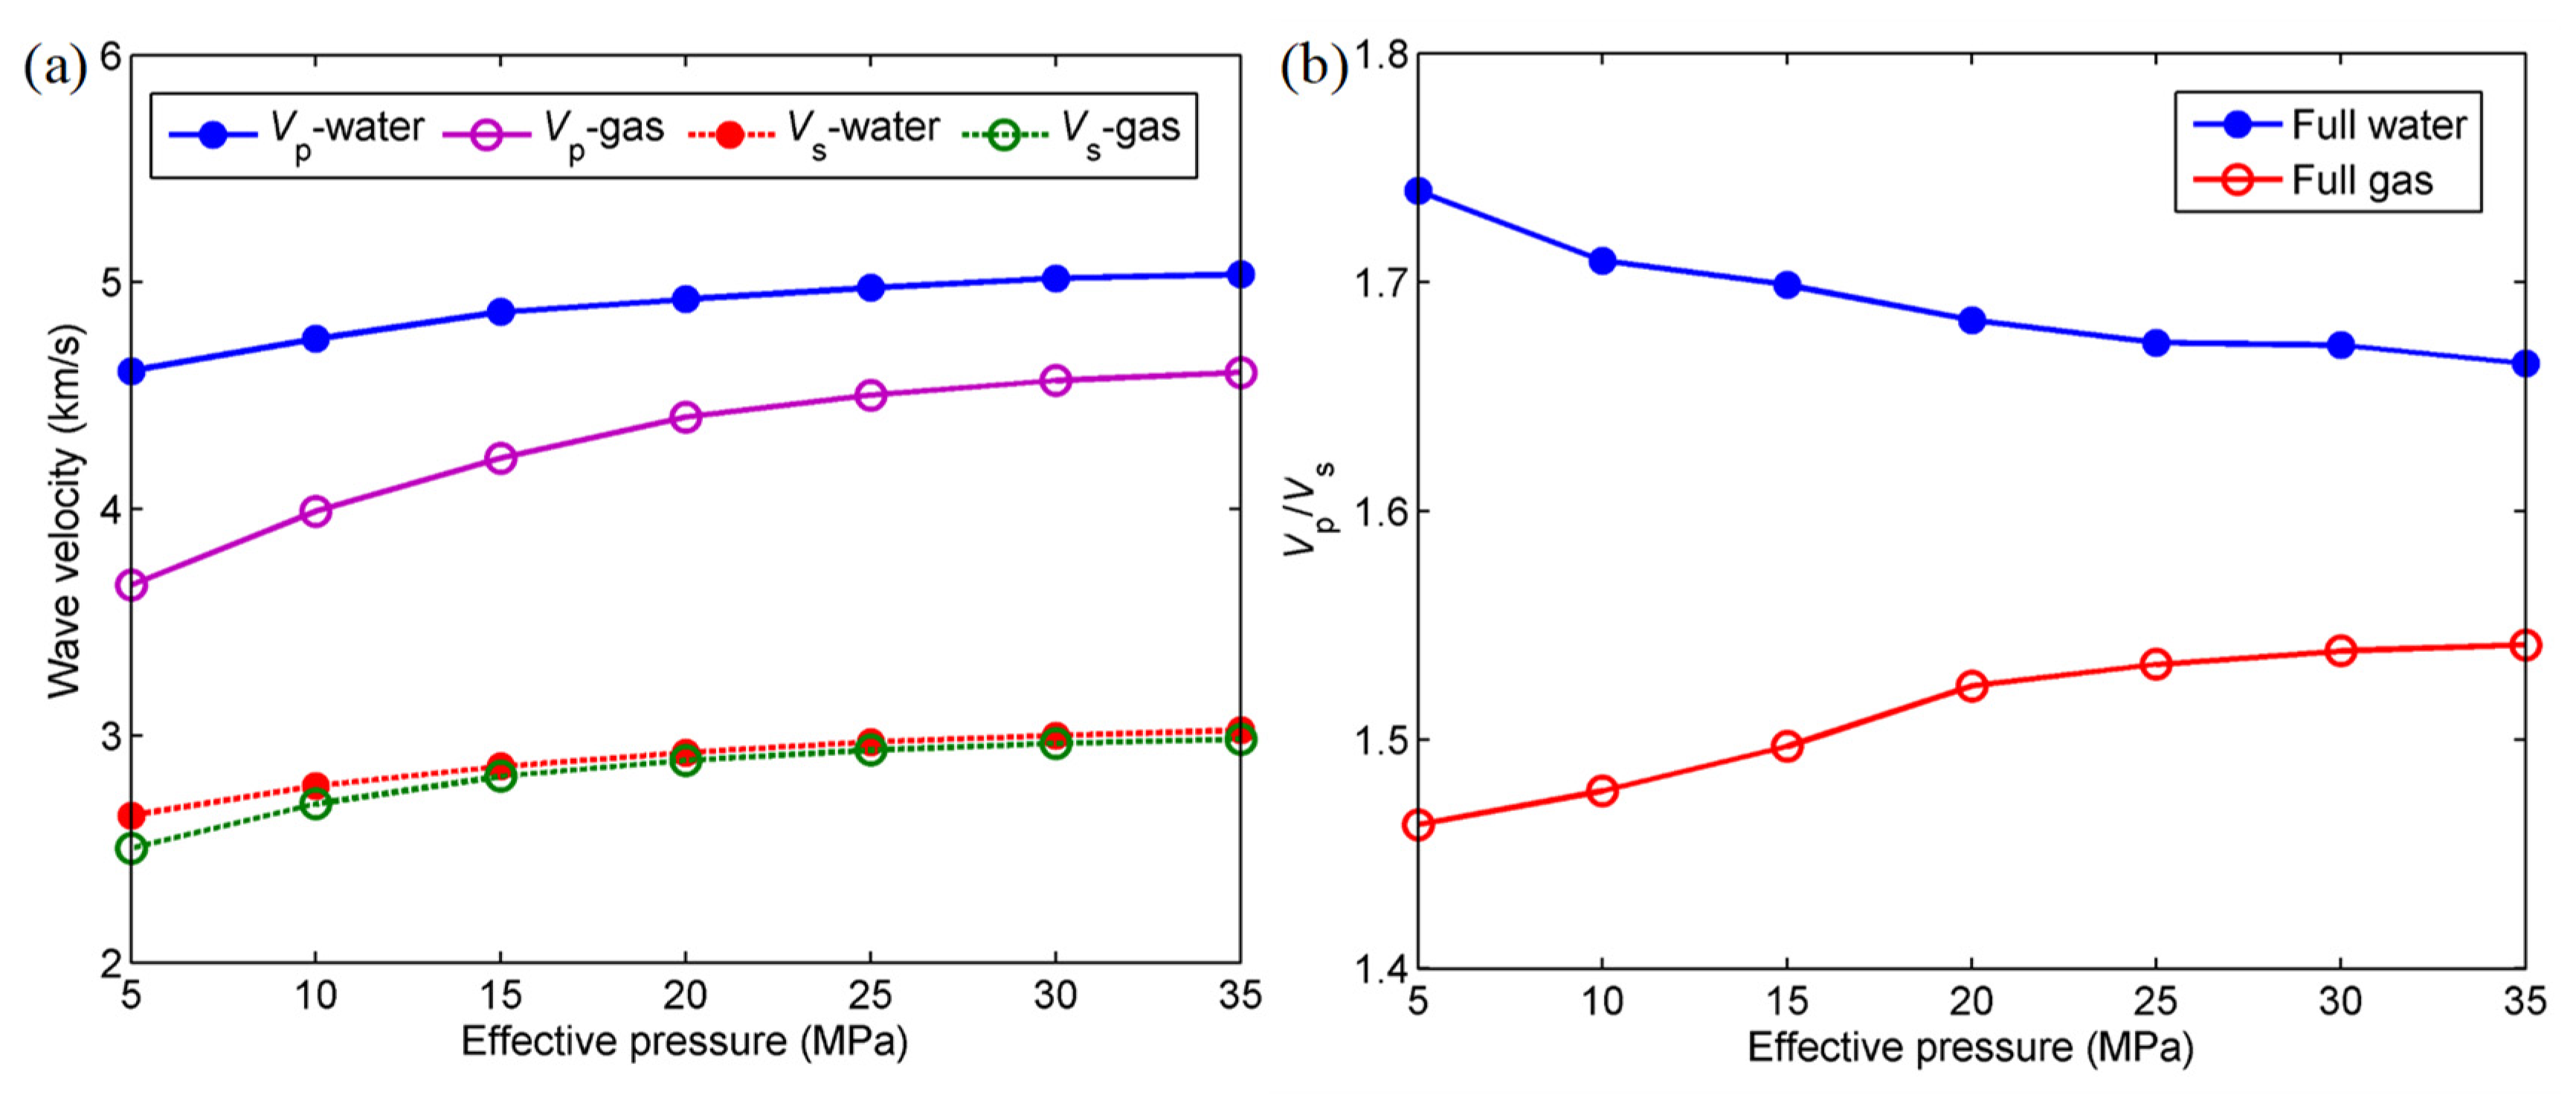
43] is used to measure the velocities at 20 °C, with the ultrasonic pulse method. The sample is sealed with a rubber sleeve and placed in the vessel. The pore pressure and temperature are fixed. Effective pressures of 5, 10, 15, 20, 25, 30, and 35 MPa are applied to the sample, in both the gas-saturated and water-saturated cases, and the velocities are measured.
As shown in
Figure 8a, the measured P- and S-wave velocities increase with effective pressure. The increase of the confining pressure at a fixed pore pressure will lead to the gradual closure of internal microcracks (especially at low effective pressures), so as to stiffen the rock skeleton and increase its elastic moduli (and the wave velocities).
Figure 8b shows the velocity ratio. In the full gas saturation case,
increases with increasing effective pressure and the opposite behavior occurs for full water saturation case.
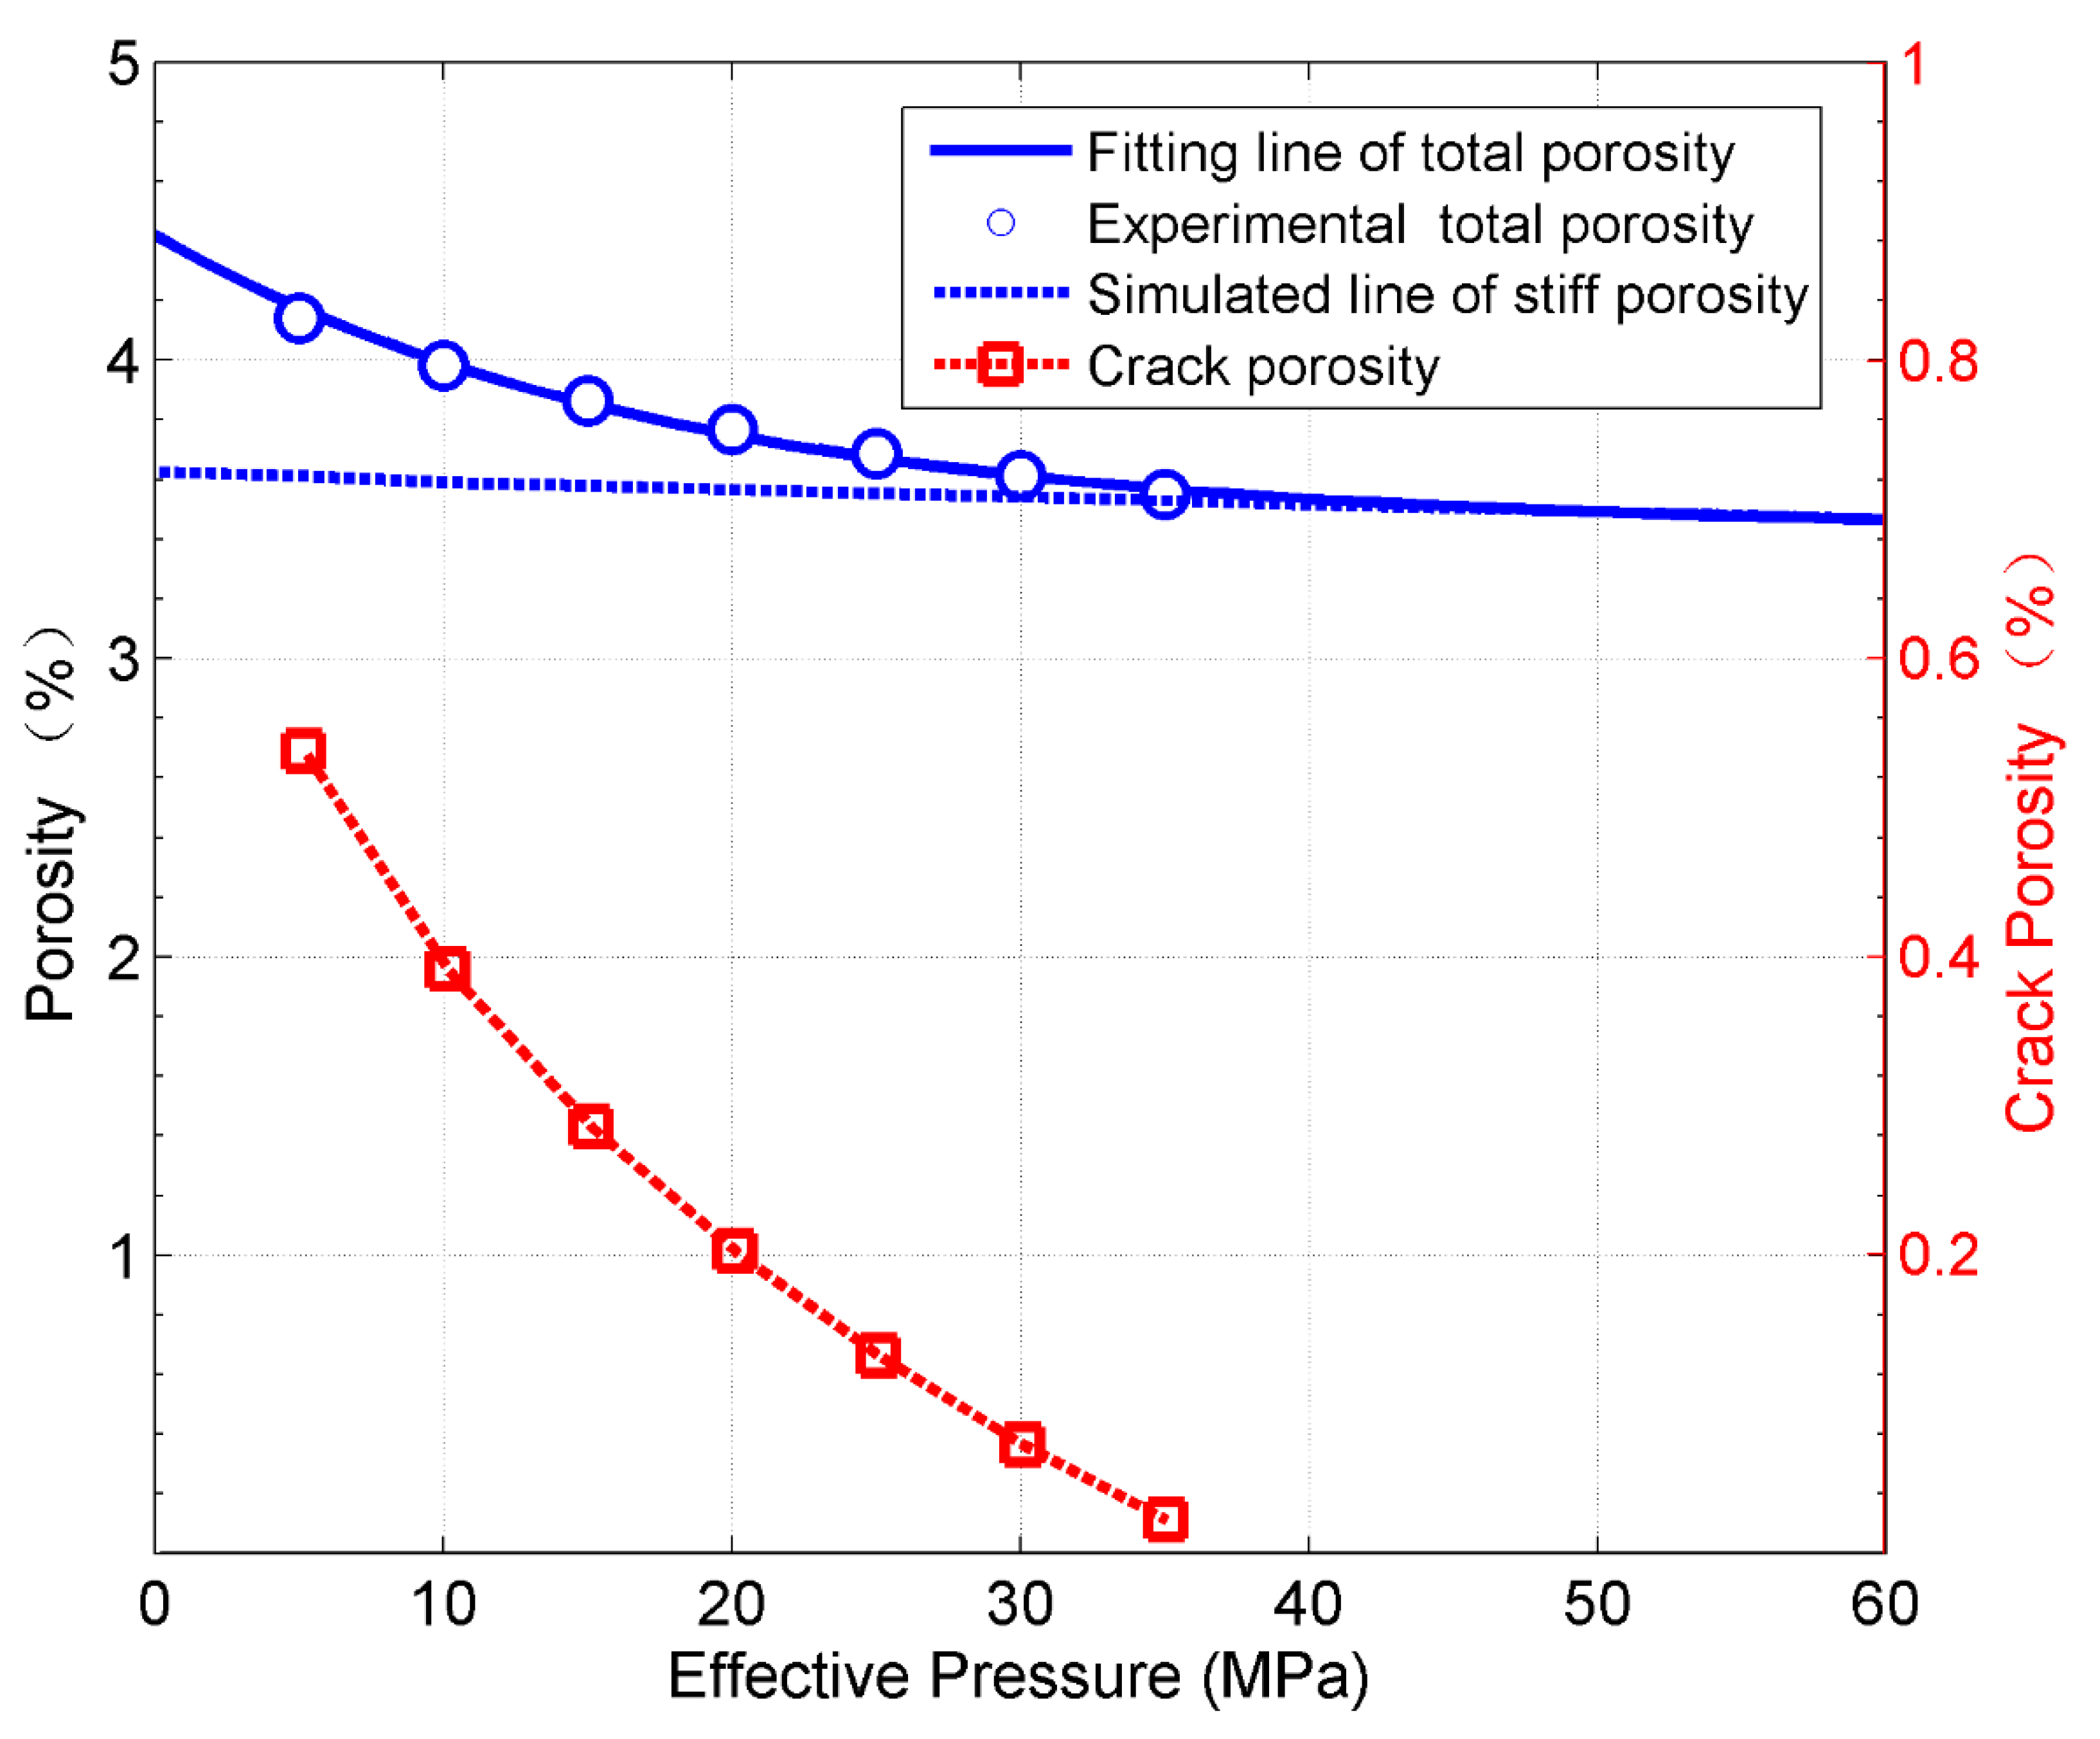
In addition, we measured the total porosity in the range 5–35 MPa. Microcracks with small aspect ratios tend to close first with increasing effective pressure and the relation between porosity and pressure changes from exponential to linear [
44].
Experimental measurements can be performed to predict microcrack porosity based on the relation between porosity and effective pressure [
45,
46,
47]. Stiff porosity can be obtained through a linear extrapolation of this relation and the microcrack porosity can be estimated as the difference between the total and stiff porosities.
Figure 9 shows the different porosities as a function of the effective pressure.
The sensitivity analysis method like Sobol’s indices can be used to analyze the interactions between the parameters, which can be applied with the given forward modeling equation or method/procedure [
48]. In this work, sensitivity analysis to the total and microcrack porosities as inputs is performed based on the actually measured data from the experiments and well logs as puts, without considering the detailed modeling equations (or procedures). Based on the observed experimental or log data, the fluid sensitivity indicator (FSI) [
49,
50,
51,
52] has been proposed to analyze how the rock elastic properties are affected by the different fluid saturation statuses. Whereas, in this study, a similar method is adopted to analyze the relative variations of rock physics attributes with respect to the changes in total/microcrack porosity, and it is defined as
where
and
represent the value of rock physics attribute at the minimal total (or microcrack) porosity and the average value of rock physics attribute within the considered range, respectively. Eleven attributes are considered, including density and the P- and S-wave velocities. The other eight are
, P-wave impedance (
), S-wave impedance (
), Poisson’s ratio (
), shear modulus (
), the first Lamé constant (
),
, and
.
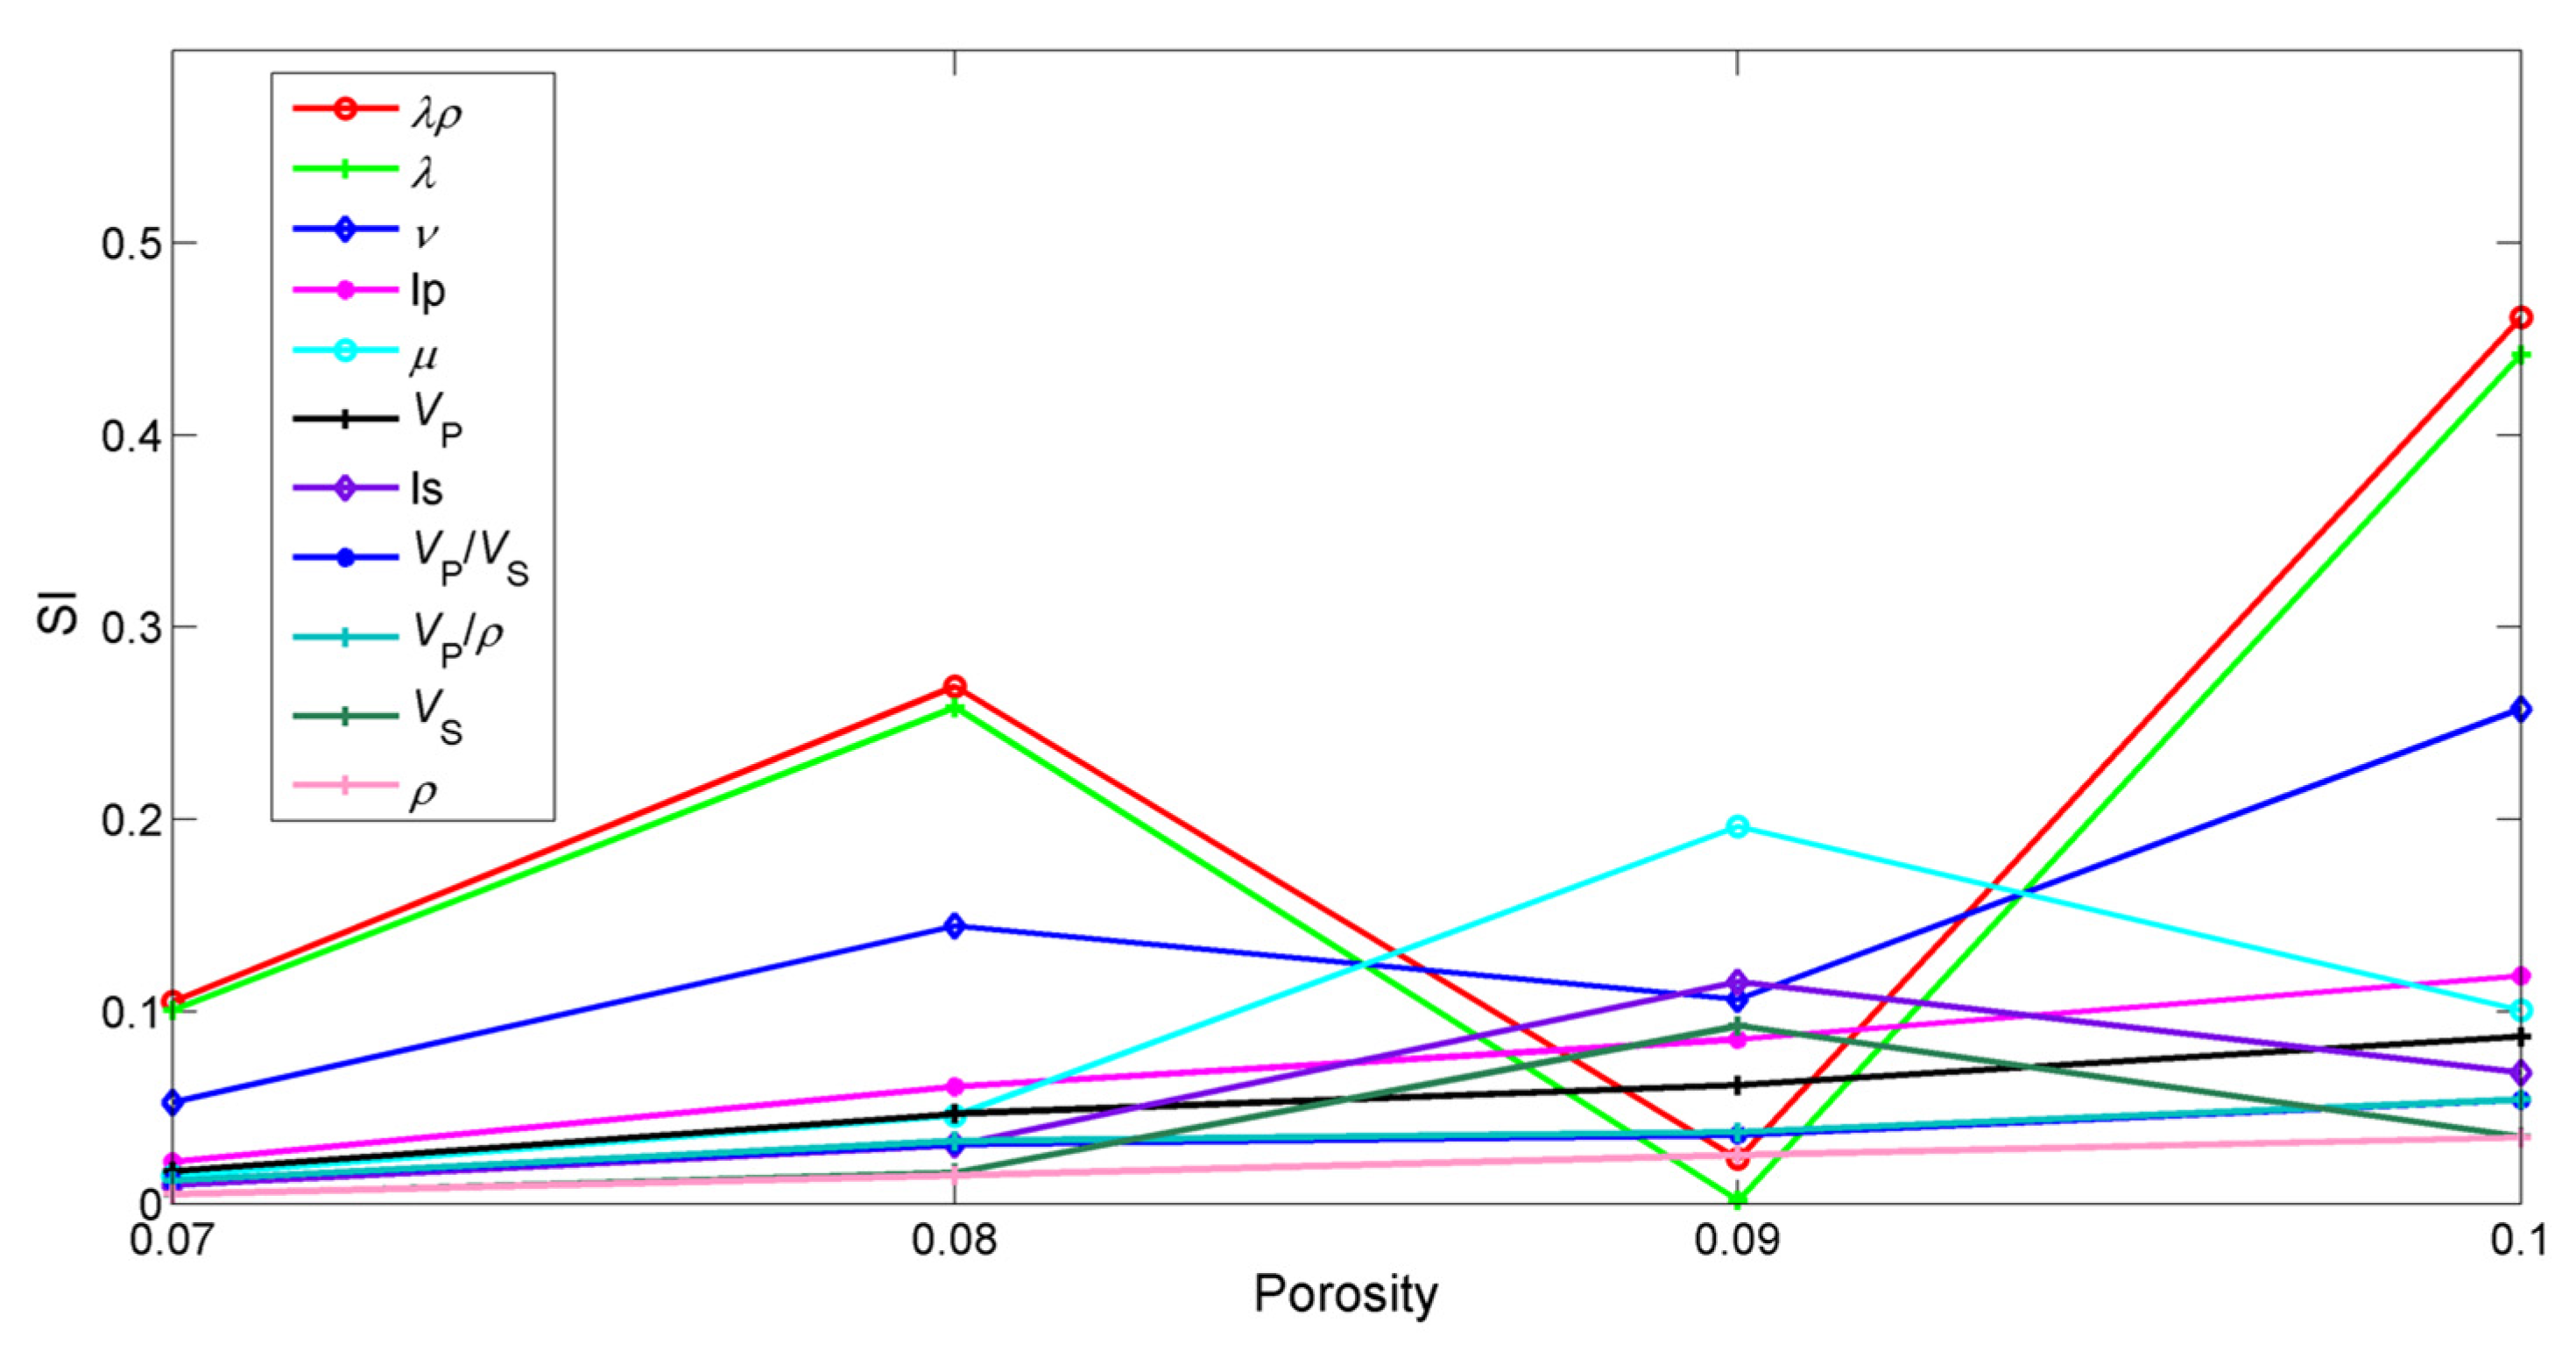
Figure 10 shows the sensitivity indices to microcrack porosity at ultrasonic frequencies, where we observe that
,
,
,
, and
are the most sensitive ones.
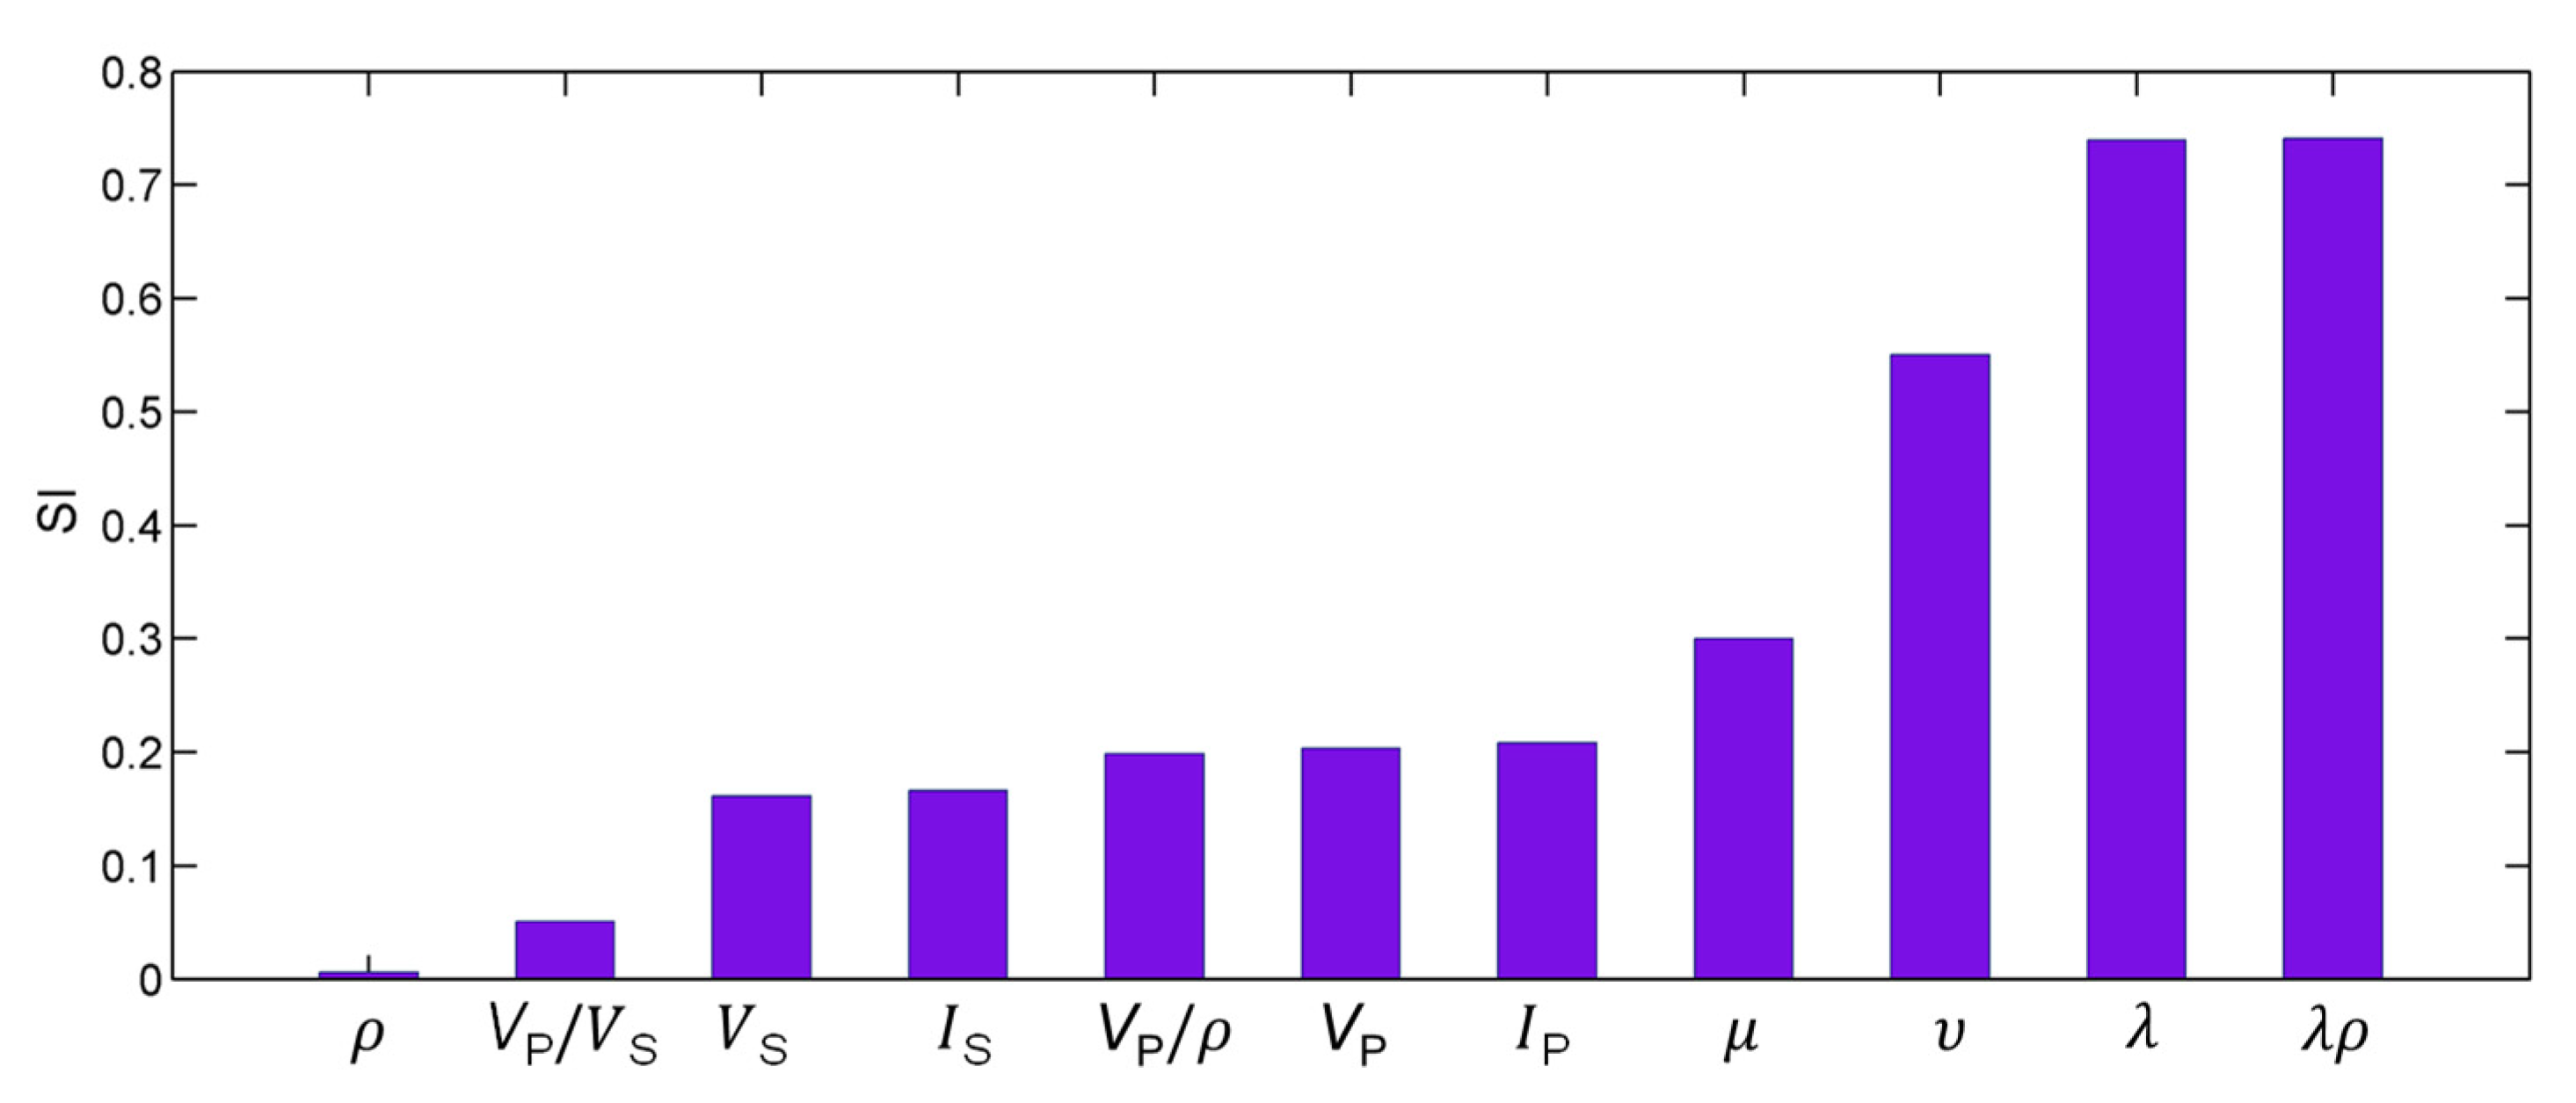
The sensitivity analysis to total porosity is performed for the sonic log data, where we consider the gas-saturated layers of Well P.
Figure 11 shows the results, where
,
,
,
, and
are the most sensitive. In
Figure 10,
,
, and
have a similar value while that of
is slightly higher than the values of
and
. However, it is obvious that in
Figure 11 the value of
is higher than the values of
and
. According to
Figure 10 and
Figure 11,
and
are sensitive to both porosities and can be considered to build the rock-physics templates.
5. Rock-Physics Templates
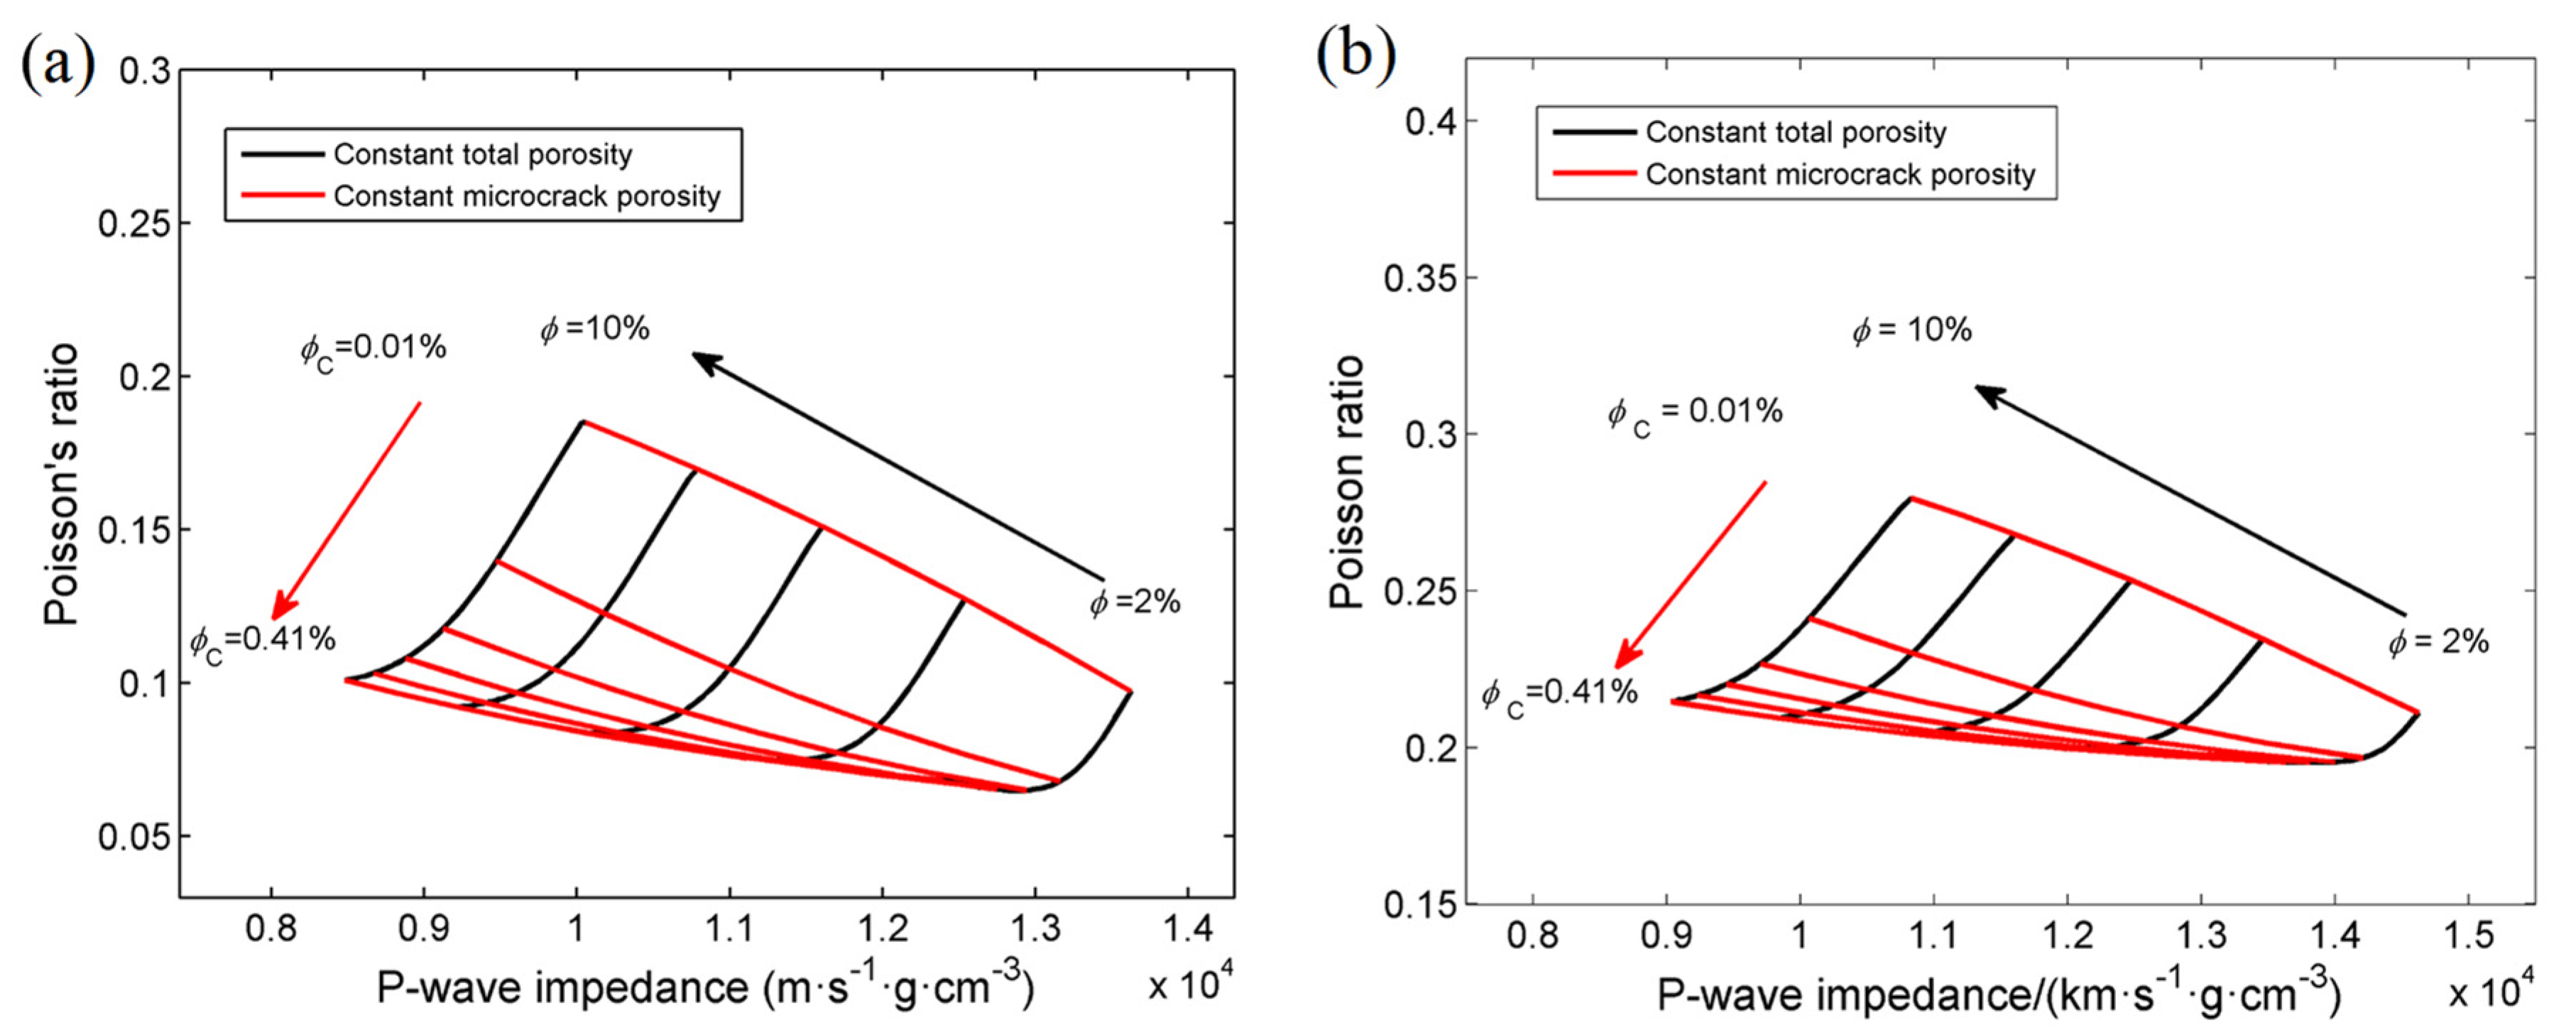
5.1. Modeling
Figure 12 shows the RPTs with respect to total and microcrack porosities at ultrasonic and log frequencies, where the black and red curves isolines of total and microcrack porosities, respectively.
5.2. Calibration
Ultrasonic and log data are used to calibrate the RPTs.
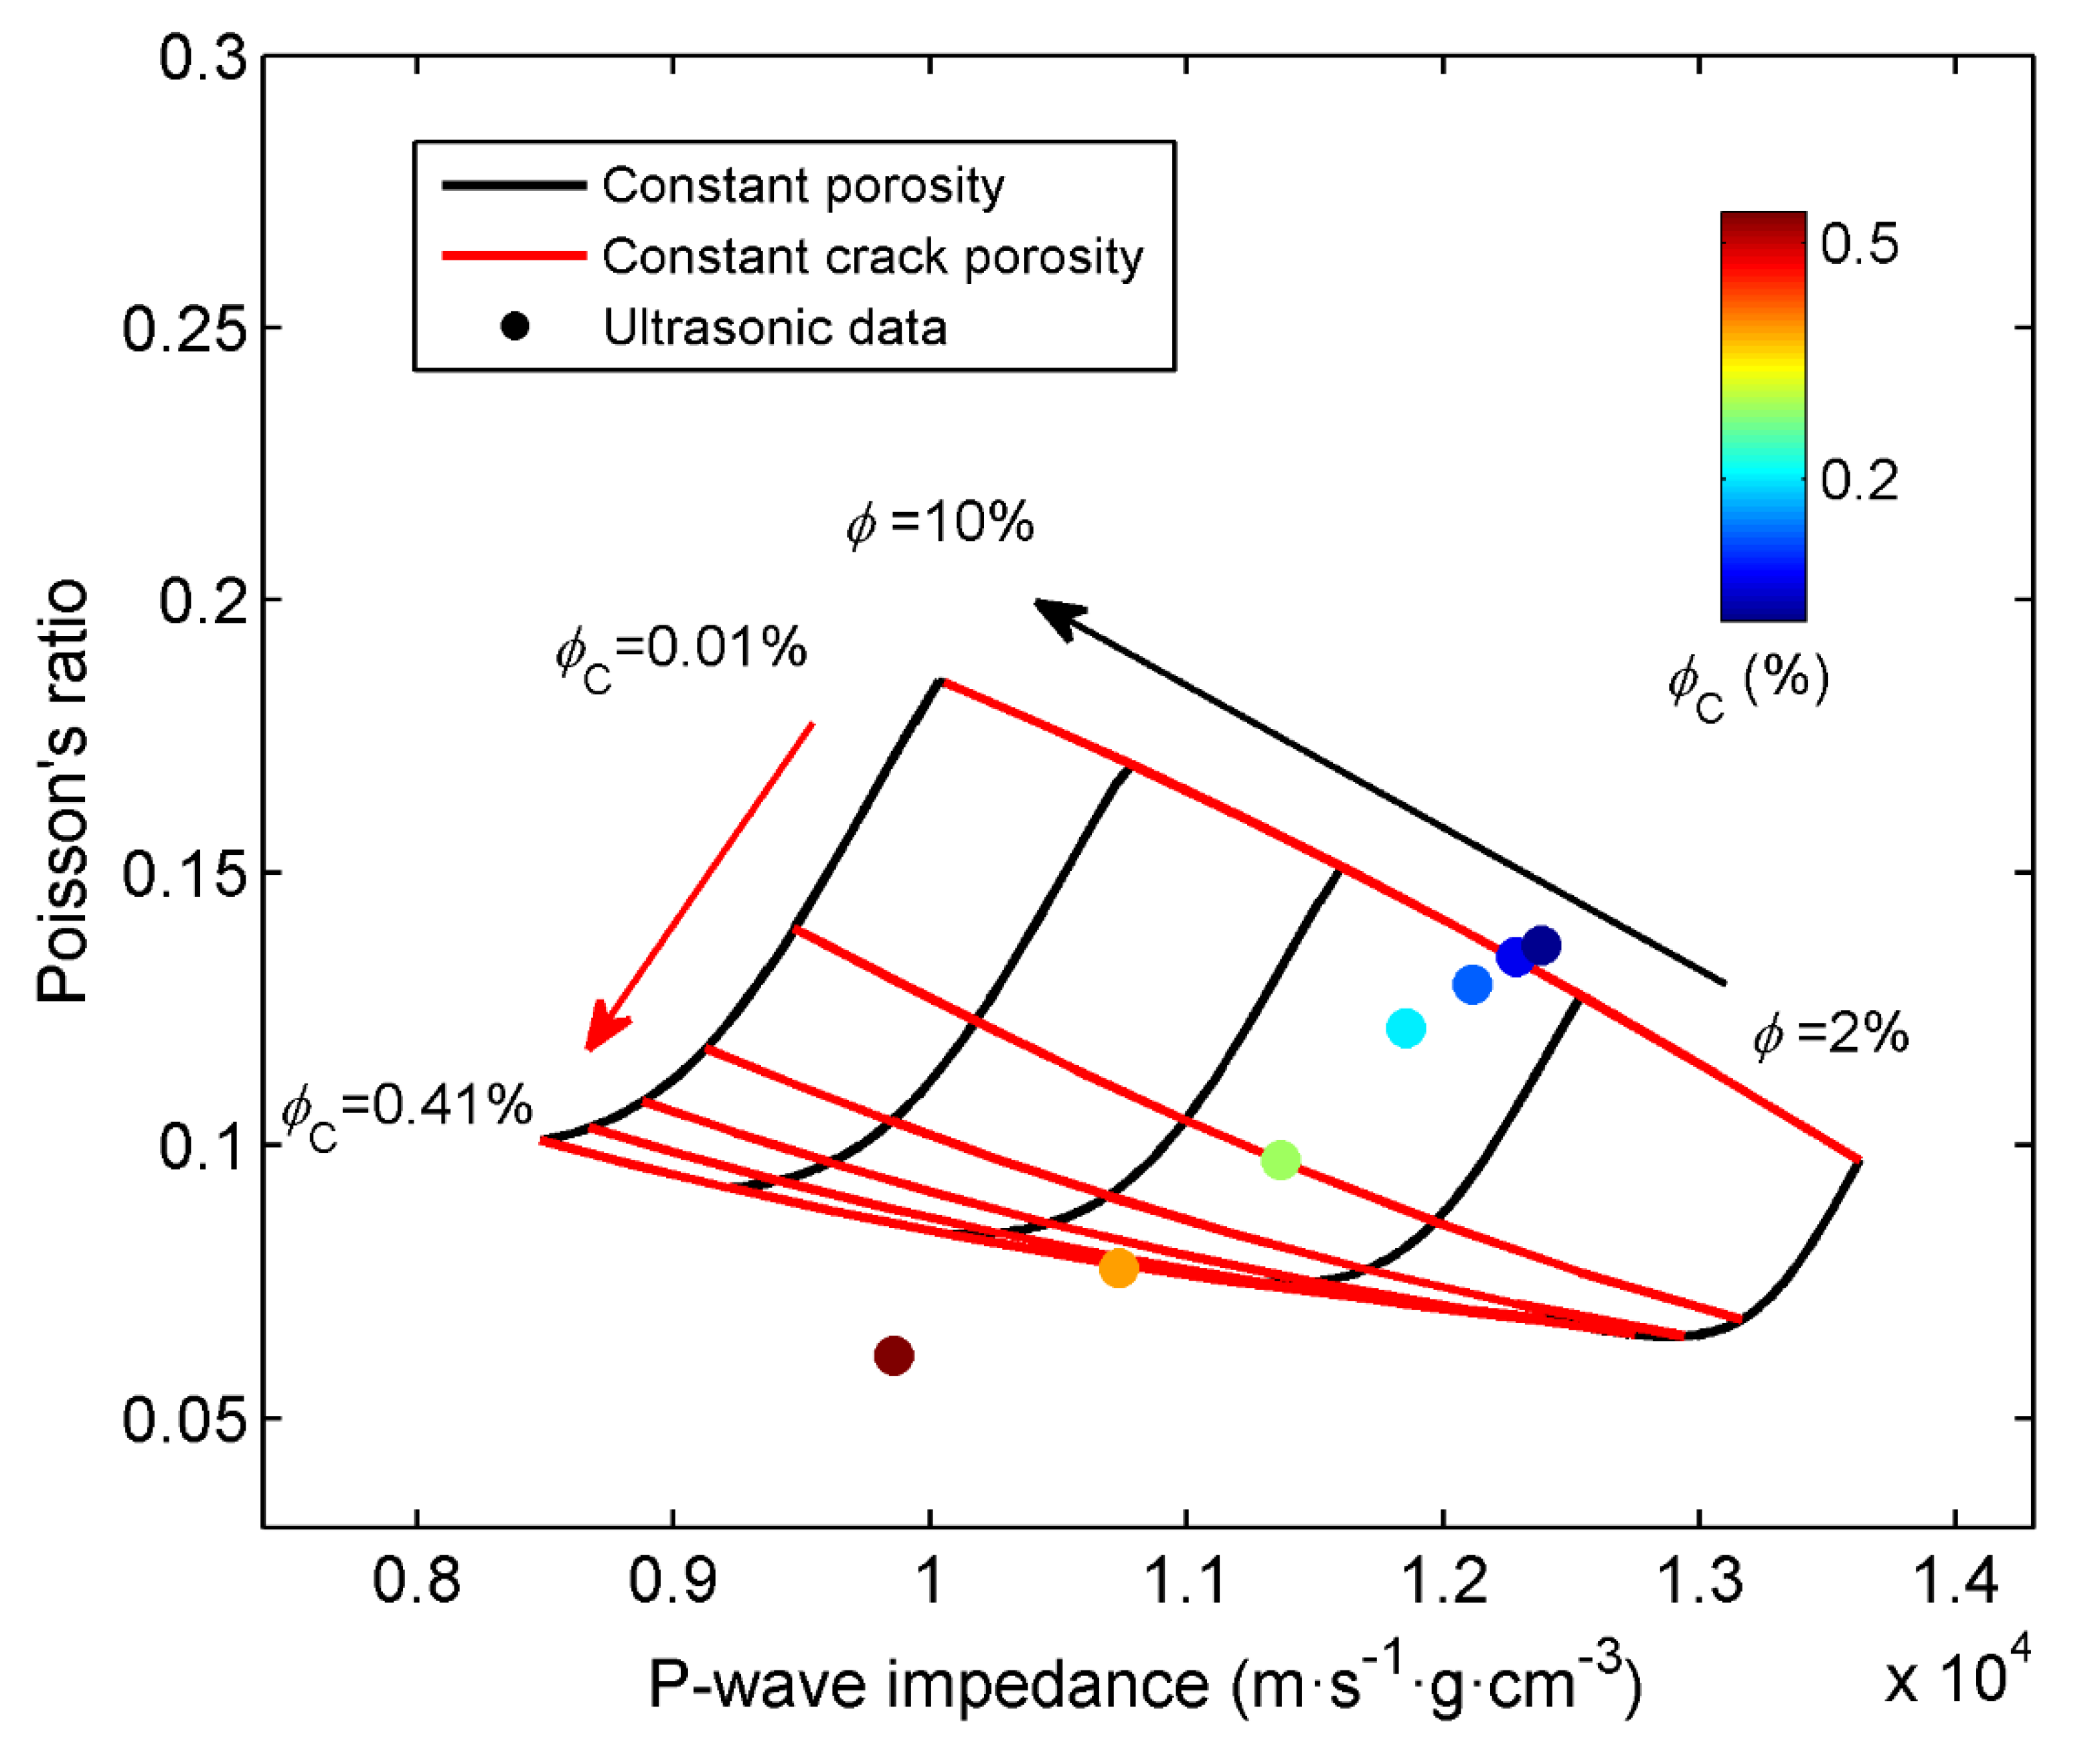
Figure 13 displays an RPT at 1 MHz and the inclusion radius of 50
, where the color of the scatters indicates microcrack porosity, and the maximum value is 0.54%. The Poisson’s ratio gradually increases with decreasing microcrack porosity; the plot shows that the template is in agreement with the ultrasonic data.
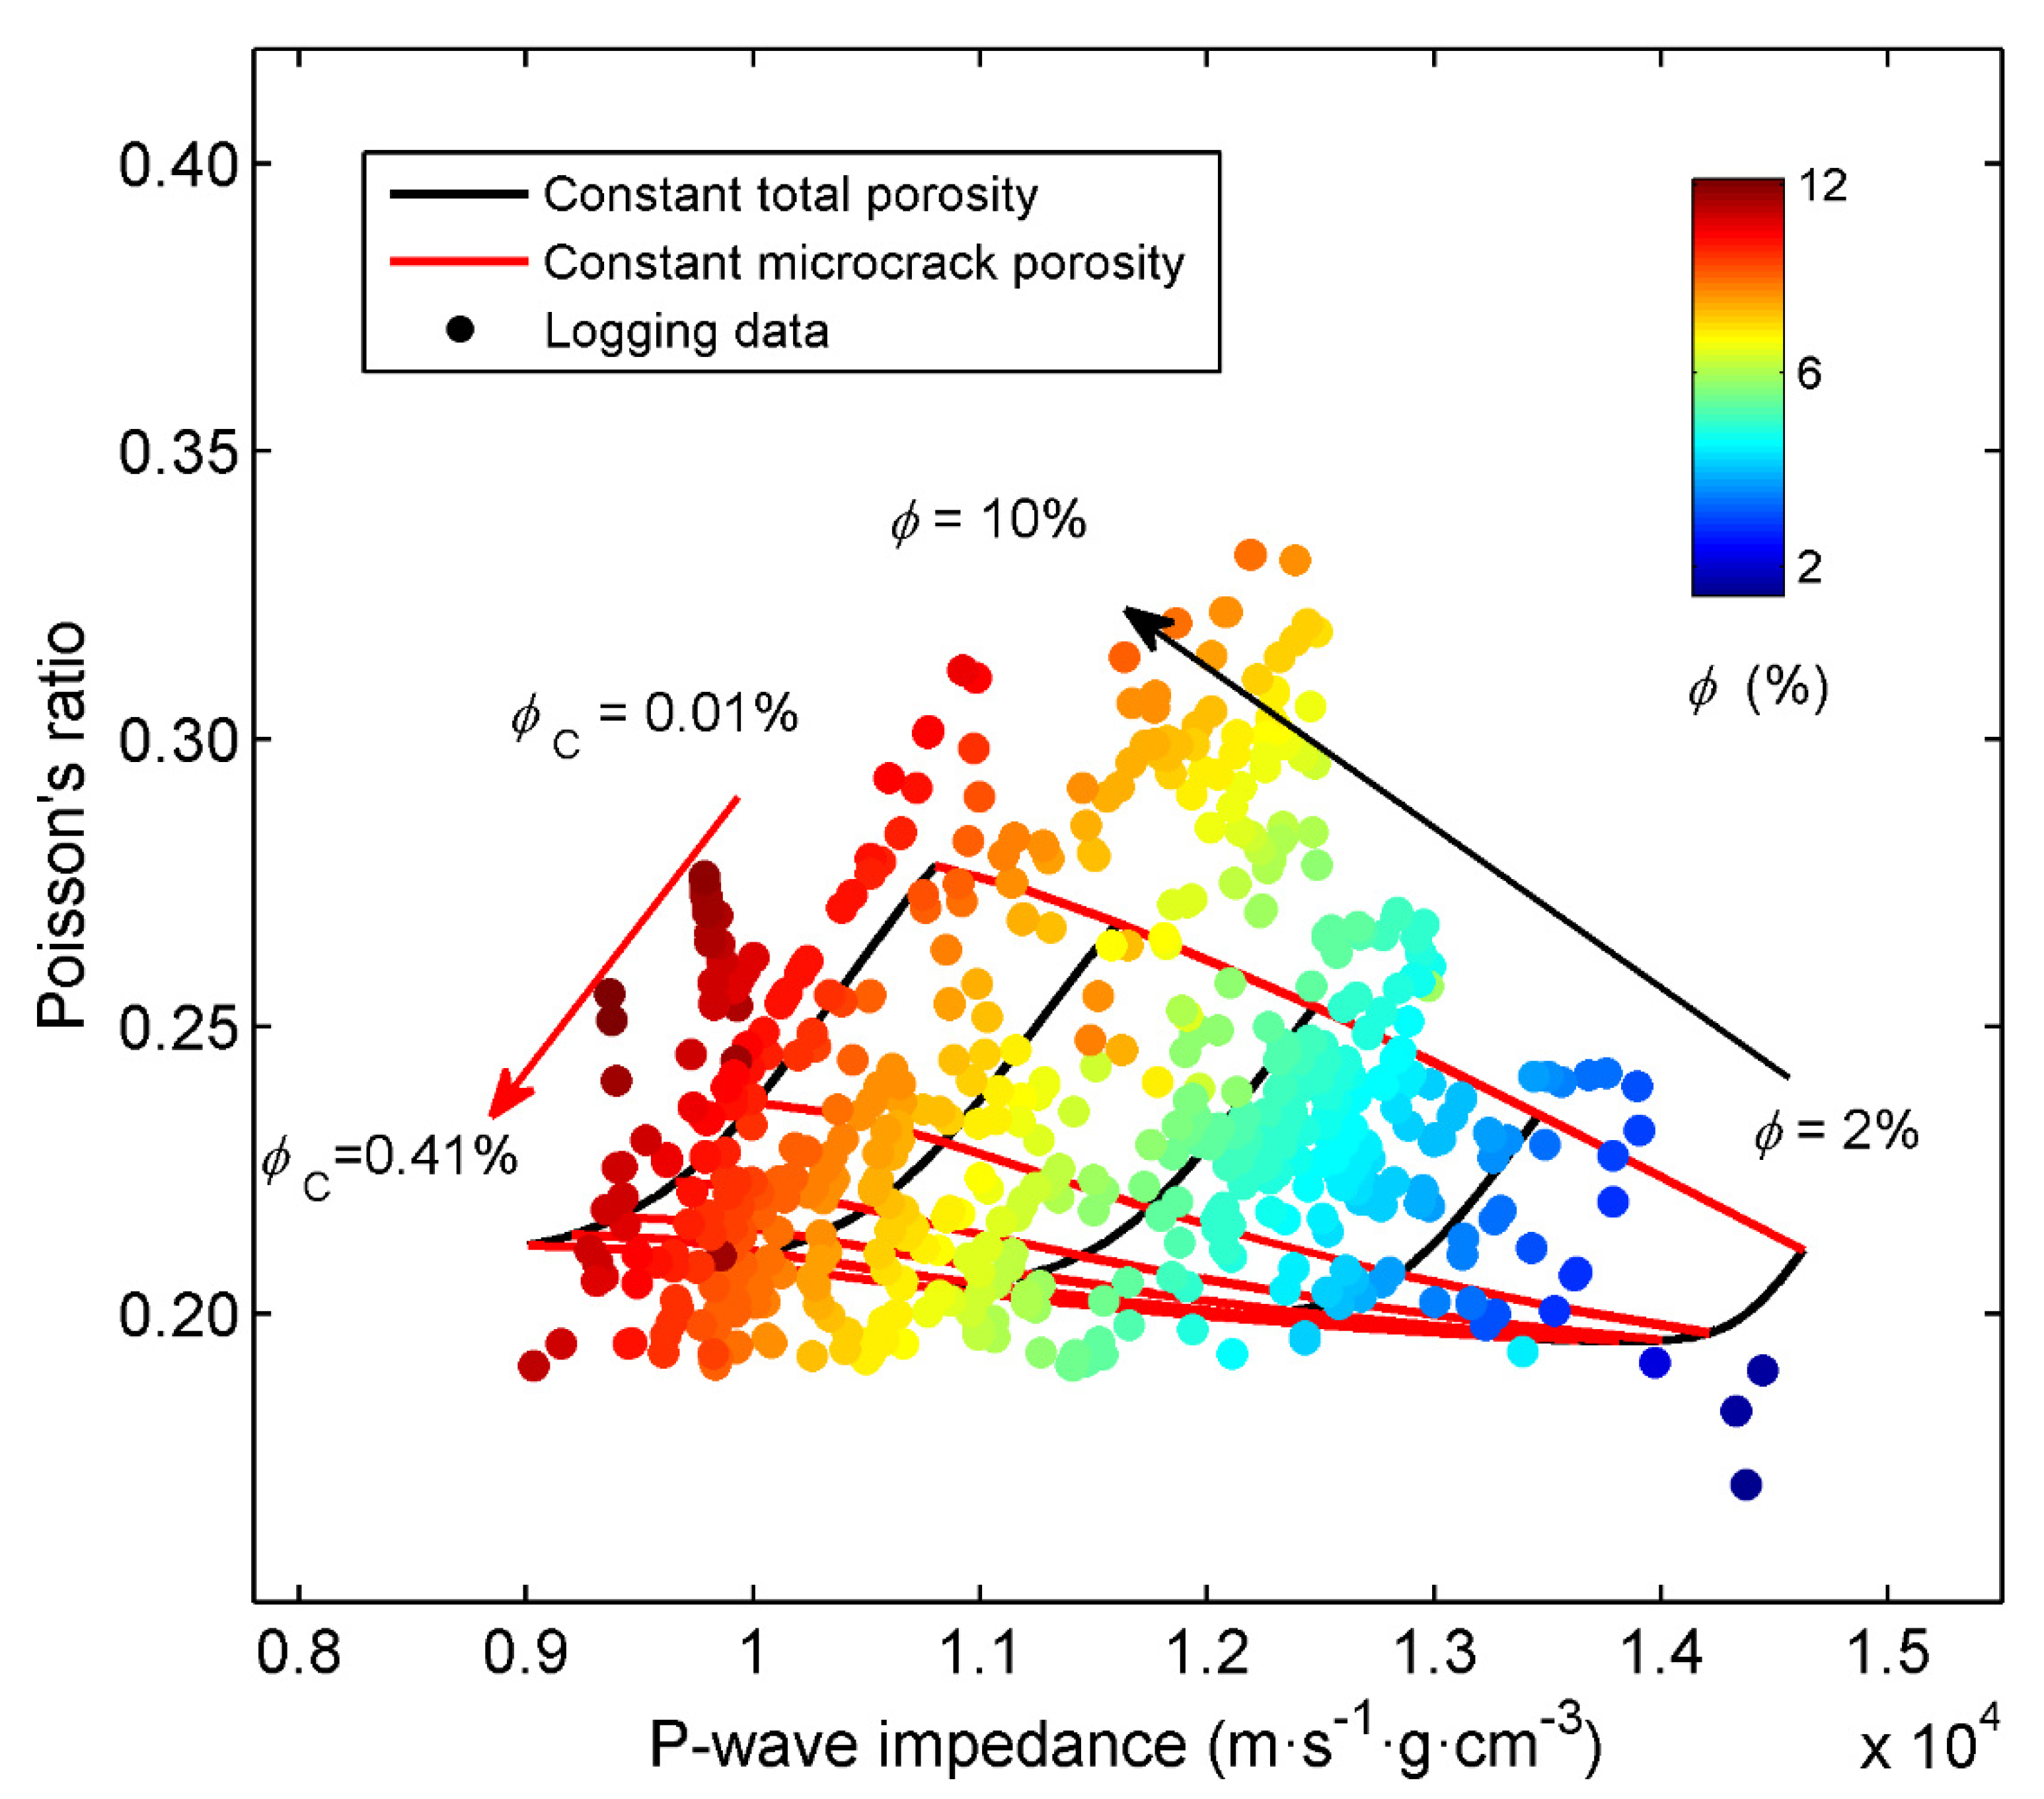
Figure 14 shows an RPT at 10 kHz and the inclusion radius of 200
, where the color bar indicates total porosity (the data are from the log data of well P). Most of the data have a porosity greater than 4%. With the increasing porosity, Poisson’s ratio increases and P-wave impedance decreases, and the agreement between data and theory is good.
6. Microcrack Estimation
Based on approximated reflection coefficients [
53], a pre-stack AVA inversion [
54,
55,
56] is adopted to obtain the Poisson ratio and P-wave impedance and build the templates. Then, the microcrack porosity is estimated, with data points outside the template considered non-reservoir.
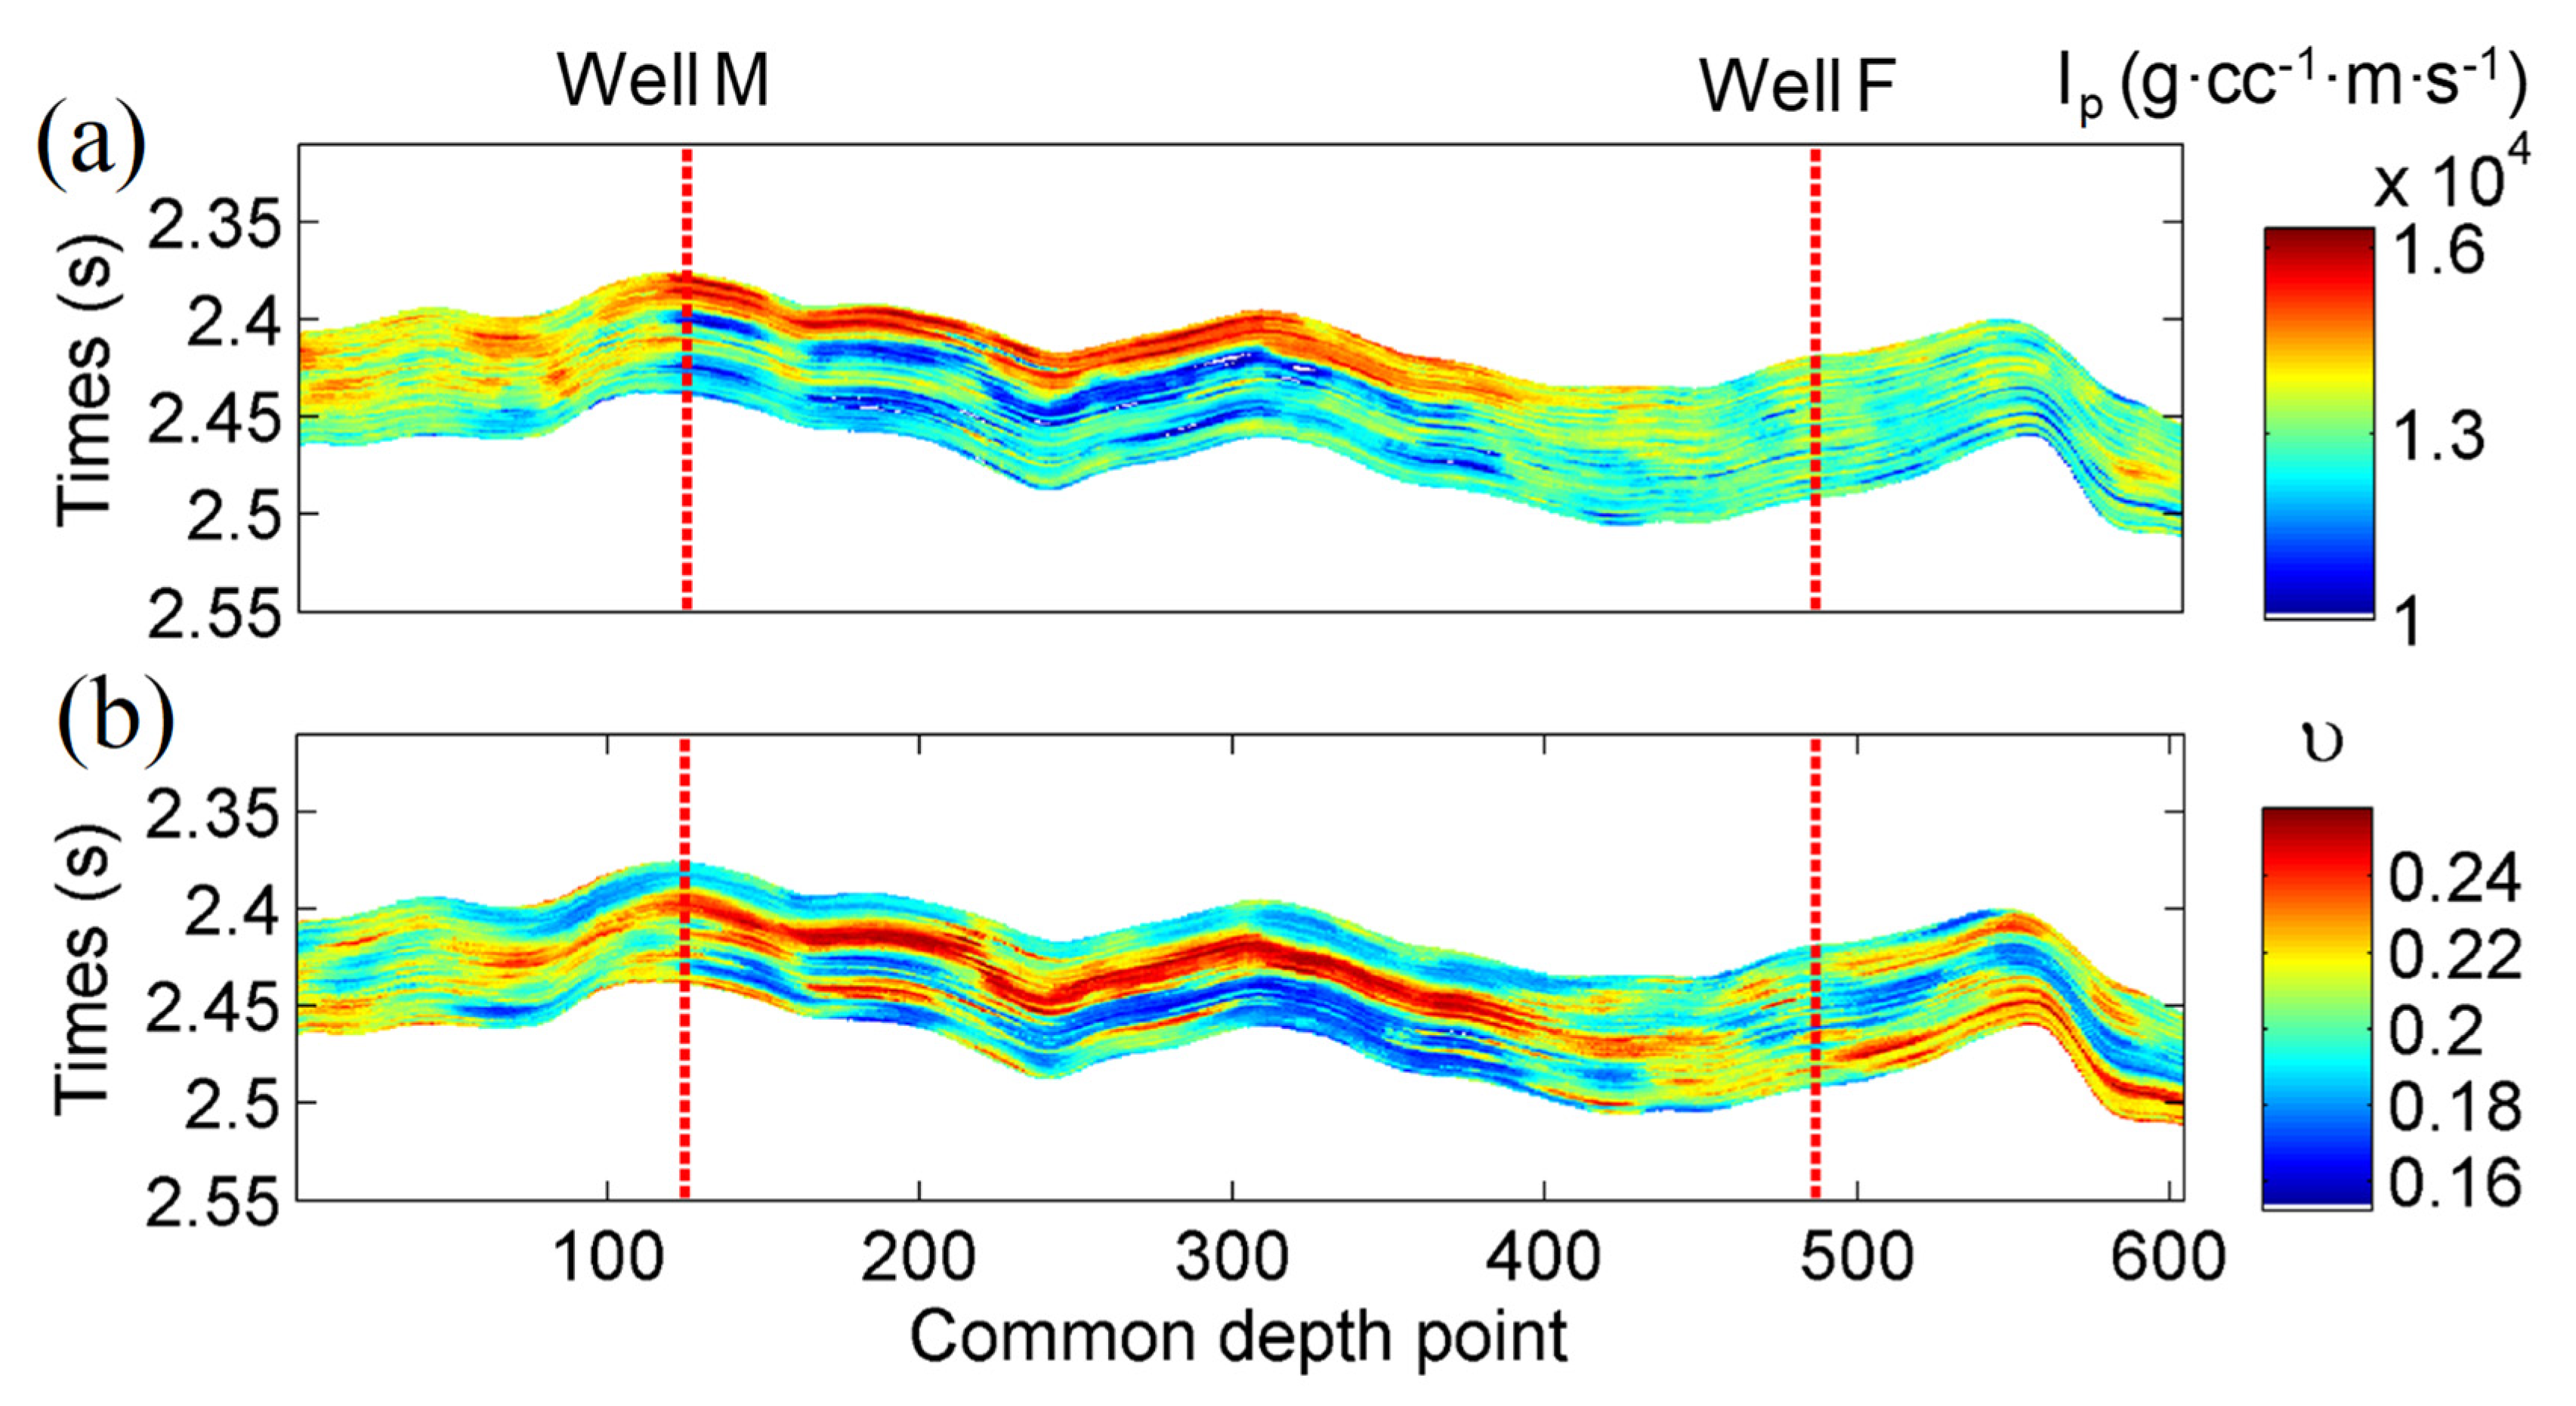
Figure 15 shows the P-wave impedance and Poisson’s ratio obtained from a seismic survey line. Well M shows high P-wave impedances at the top and low P-wave impedances at the bottom of the target layer, and high Poisson’s ratio in the middle. On the other hand, Well F shows the low impedance and Poisson’s ratio.
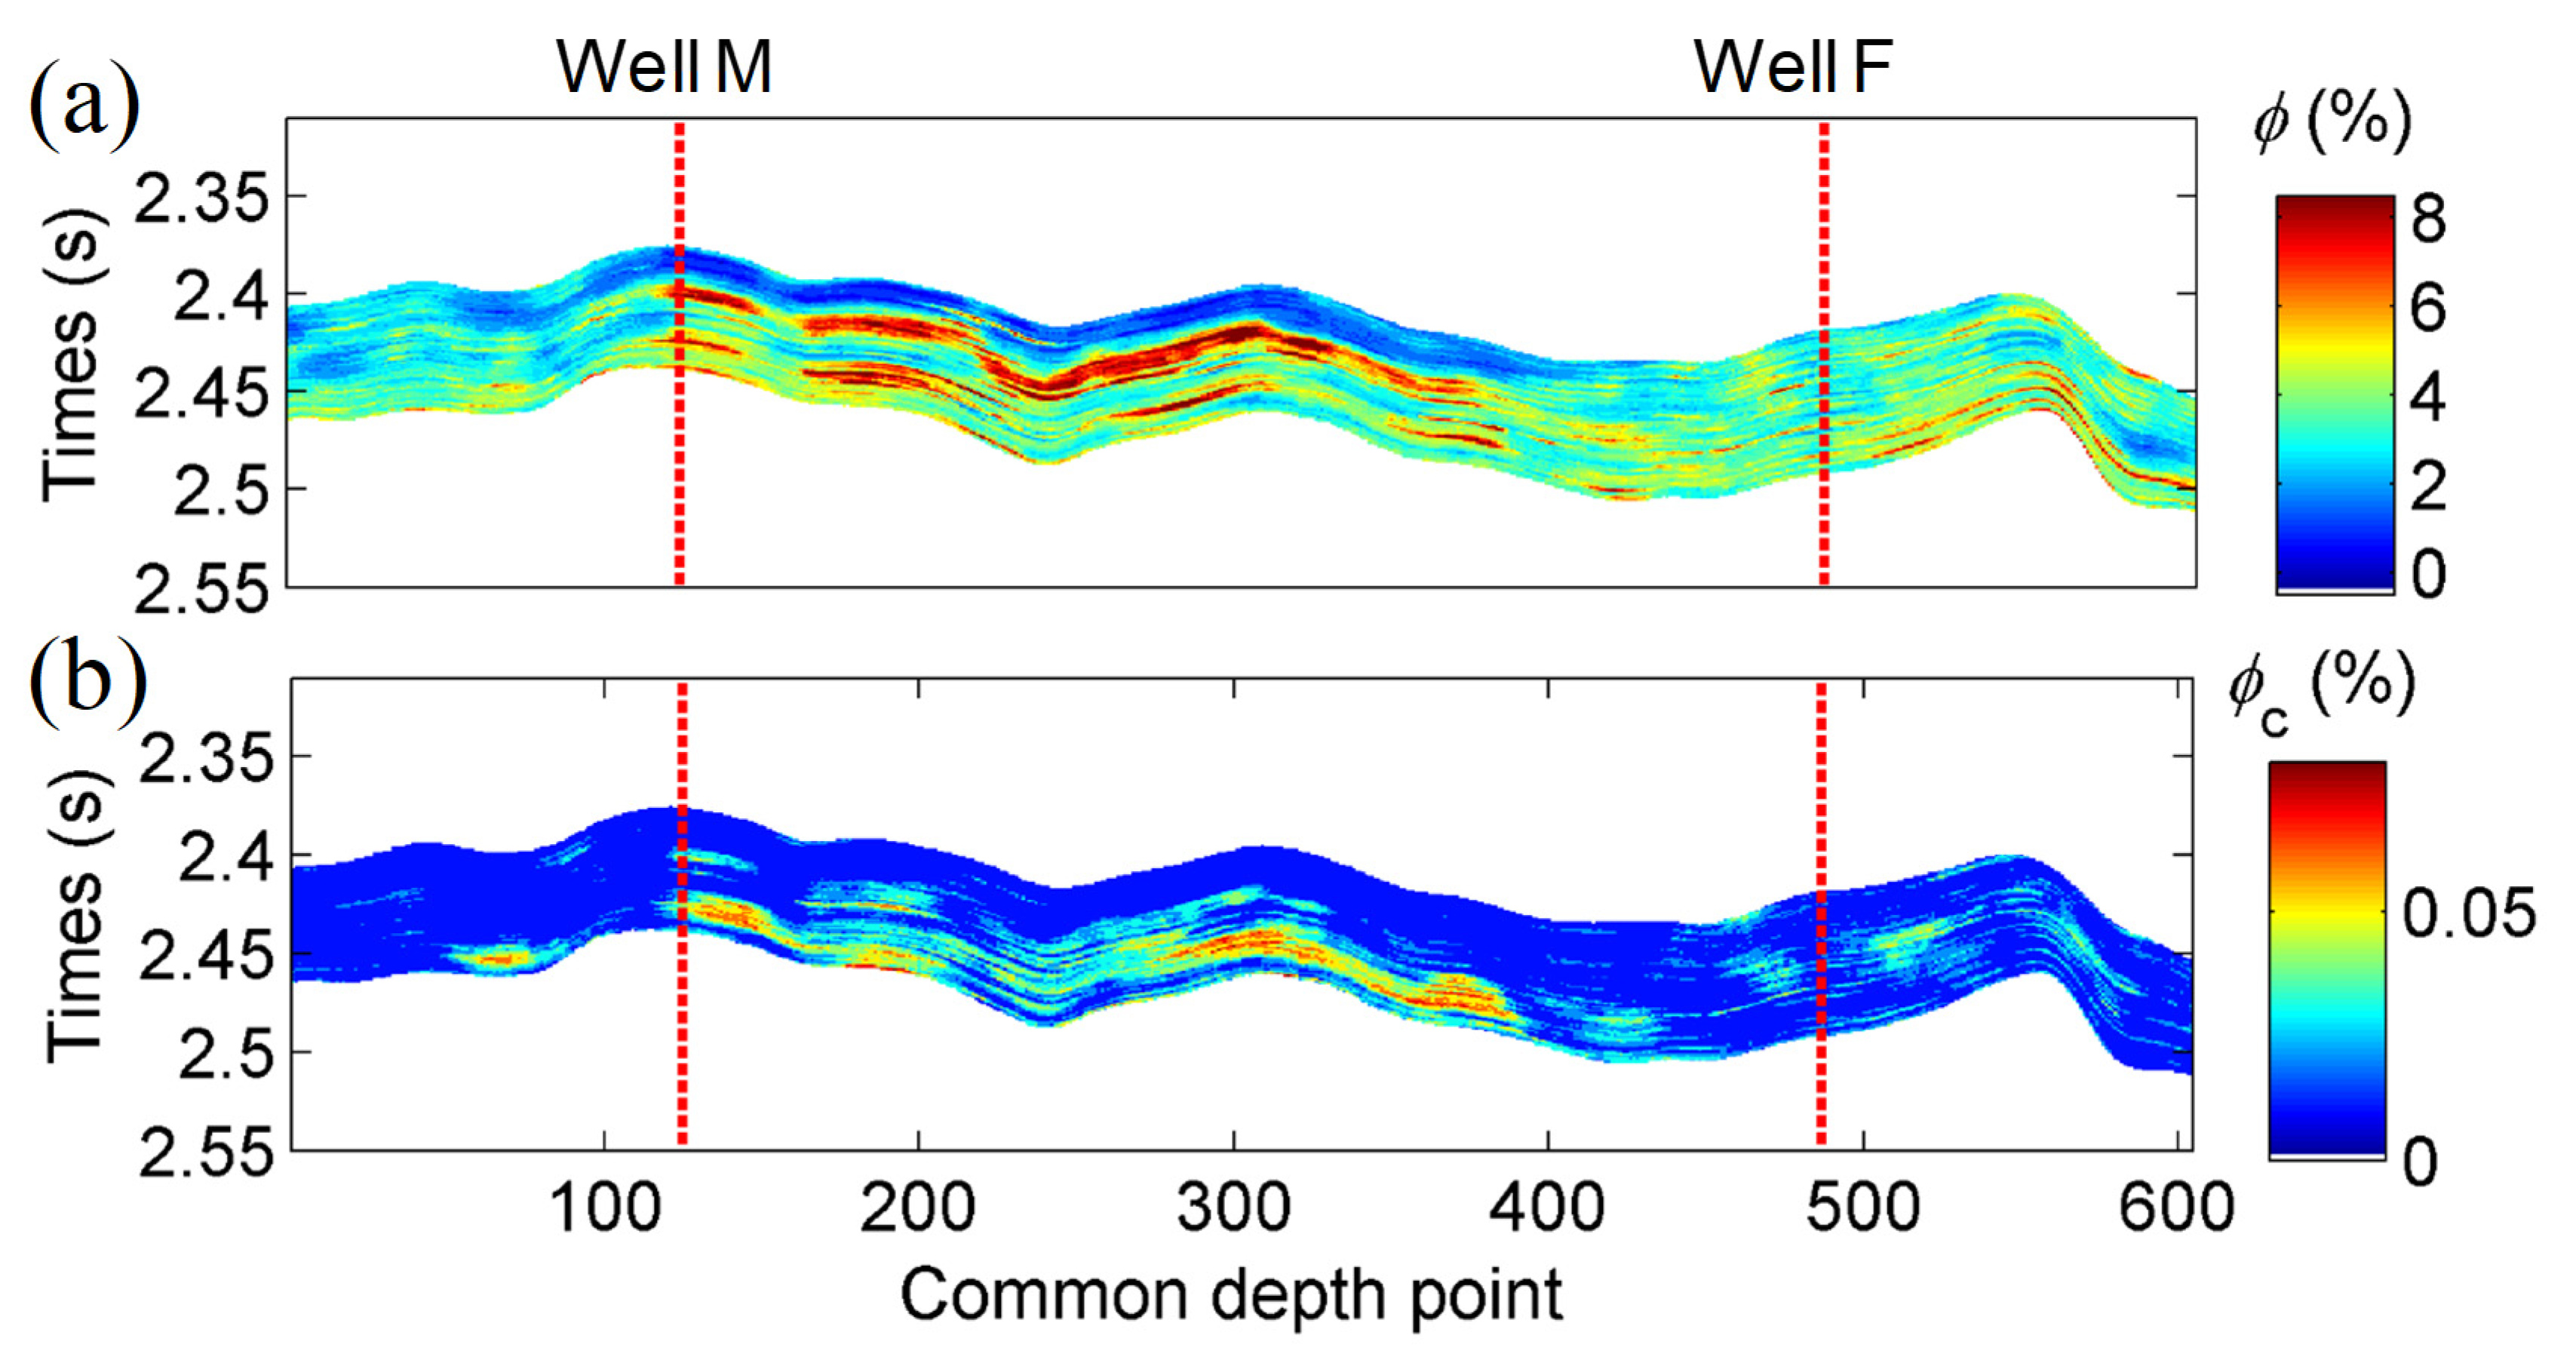
Figure 16 shows the total and microcrack porosities predicted for the survey. Both porosities are high at Well M and low at Well F. The gas production reports of wells M and F are
m
3 per day and
m
3 per day, respectively, indicating that the predictions are consistent with the reports.
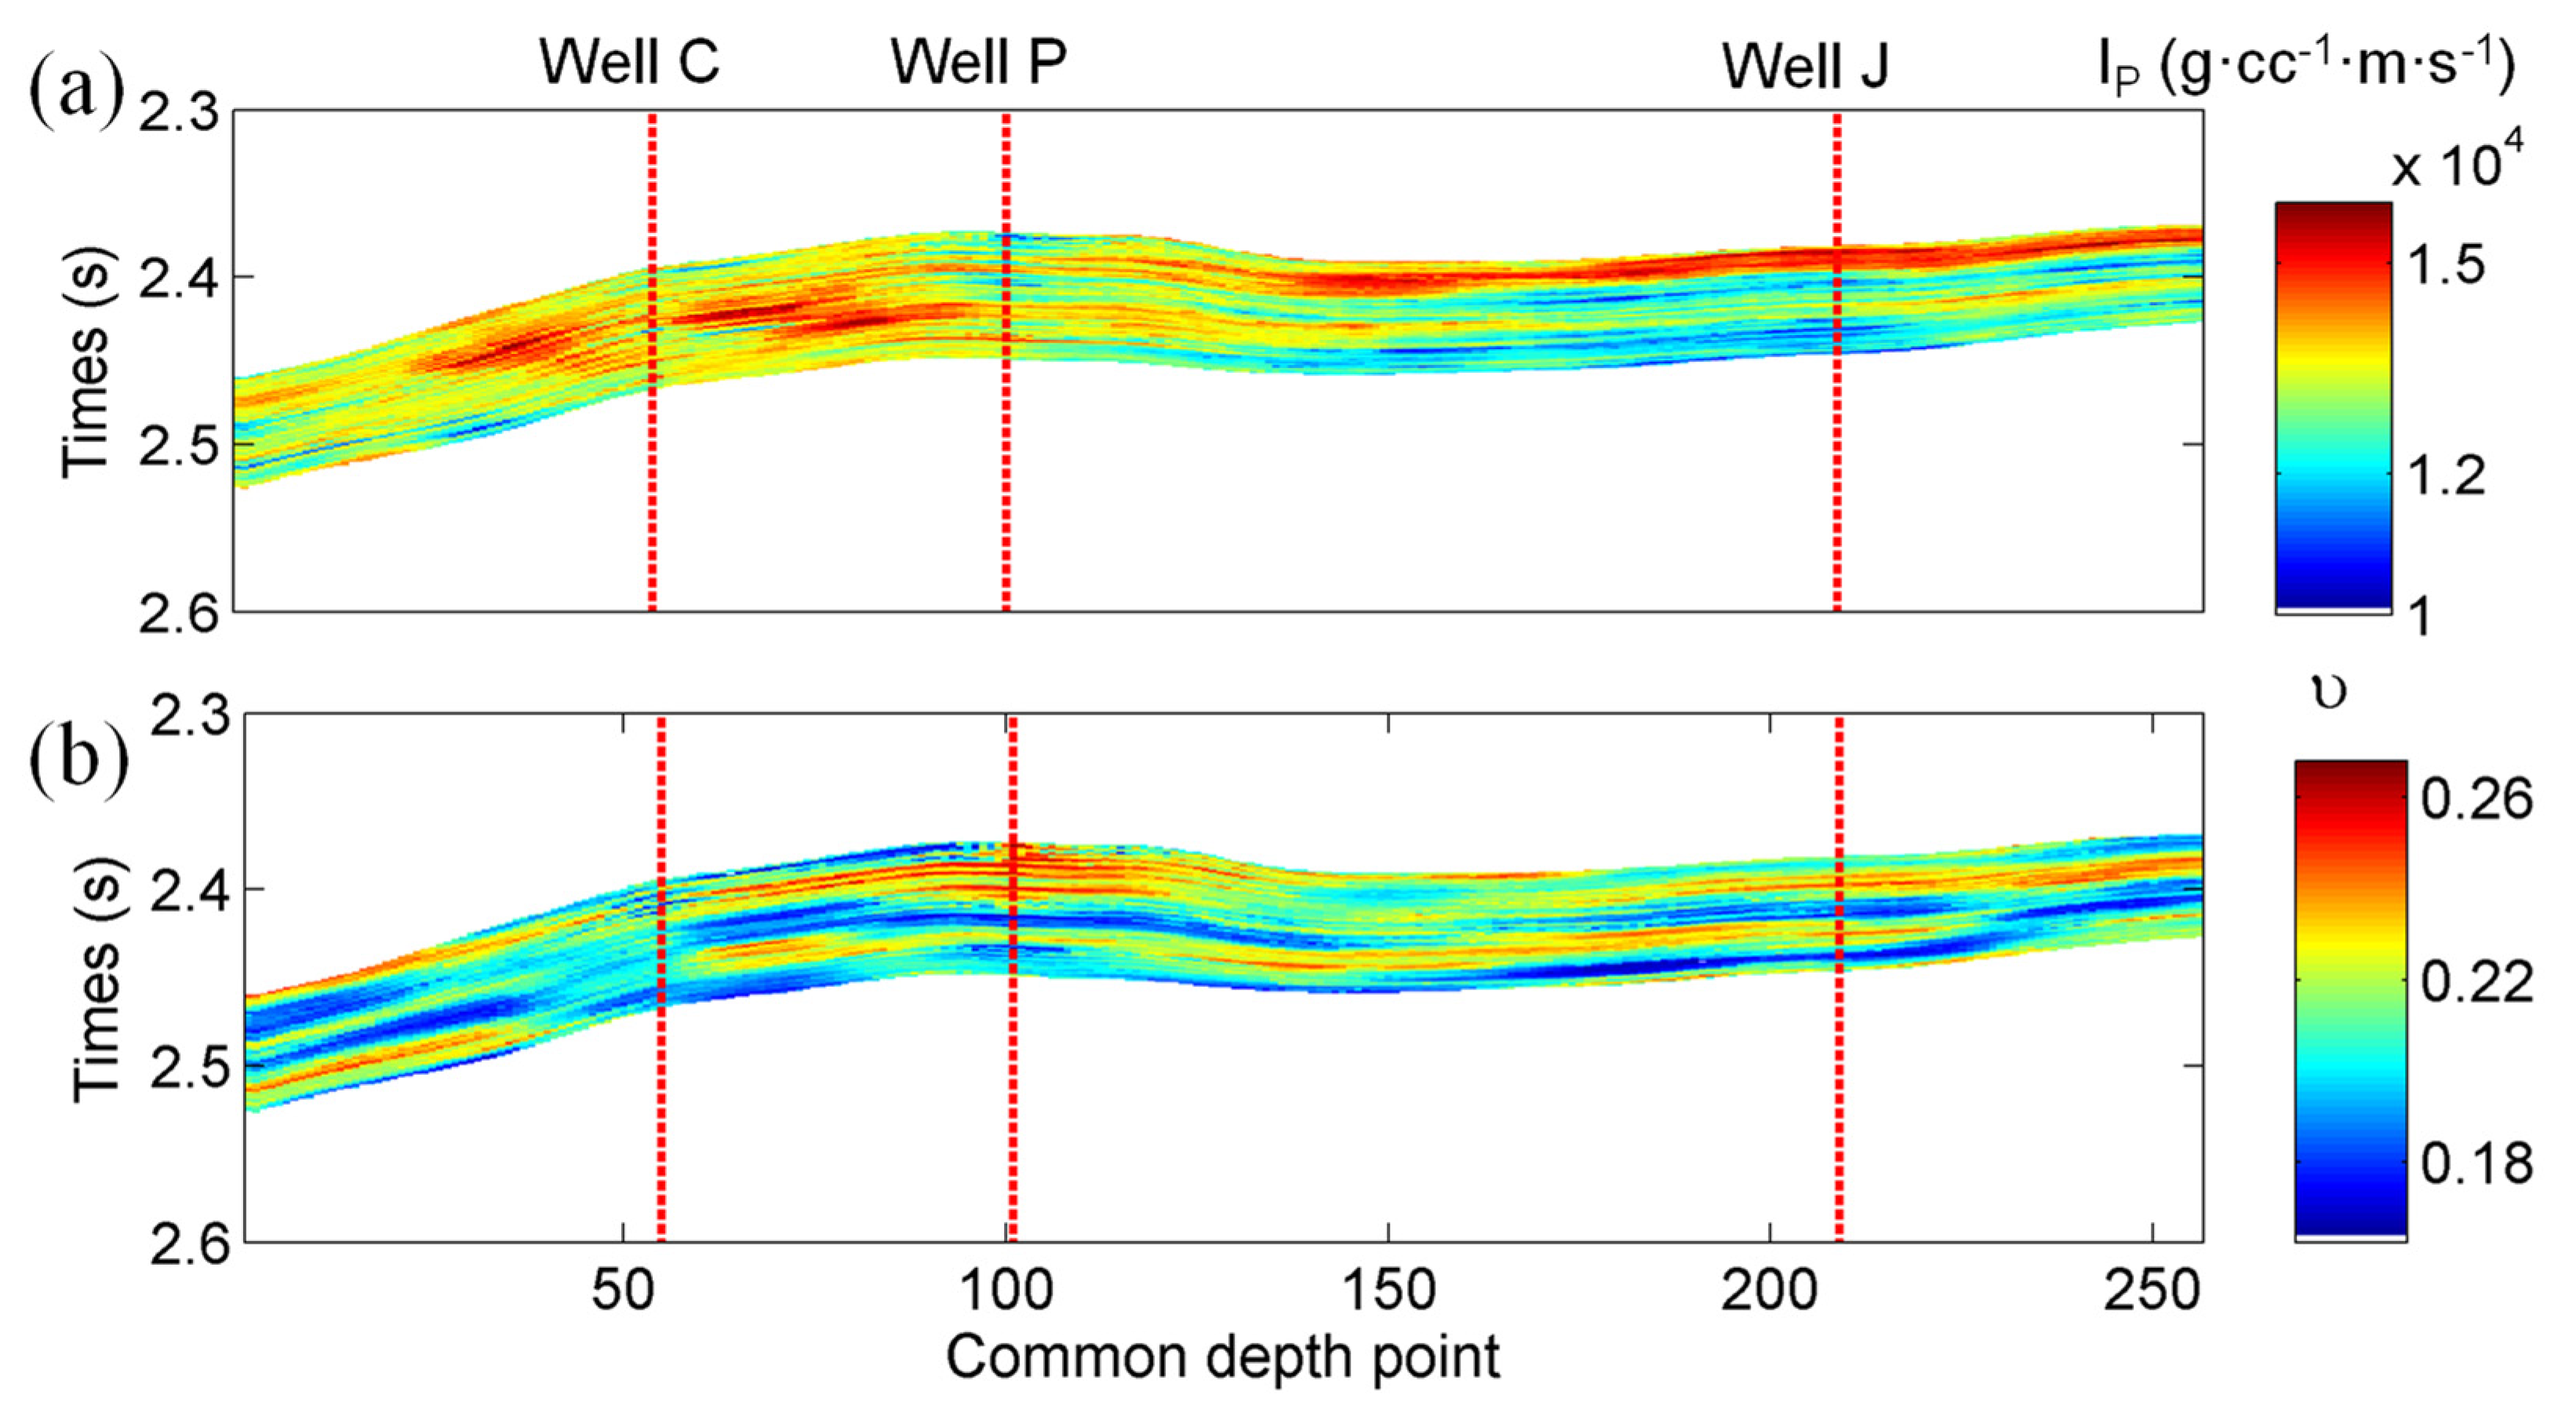
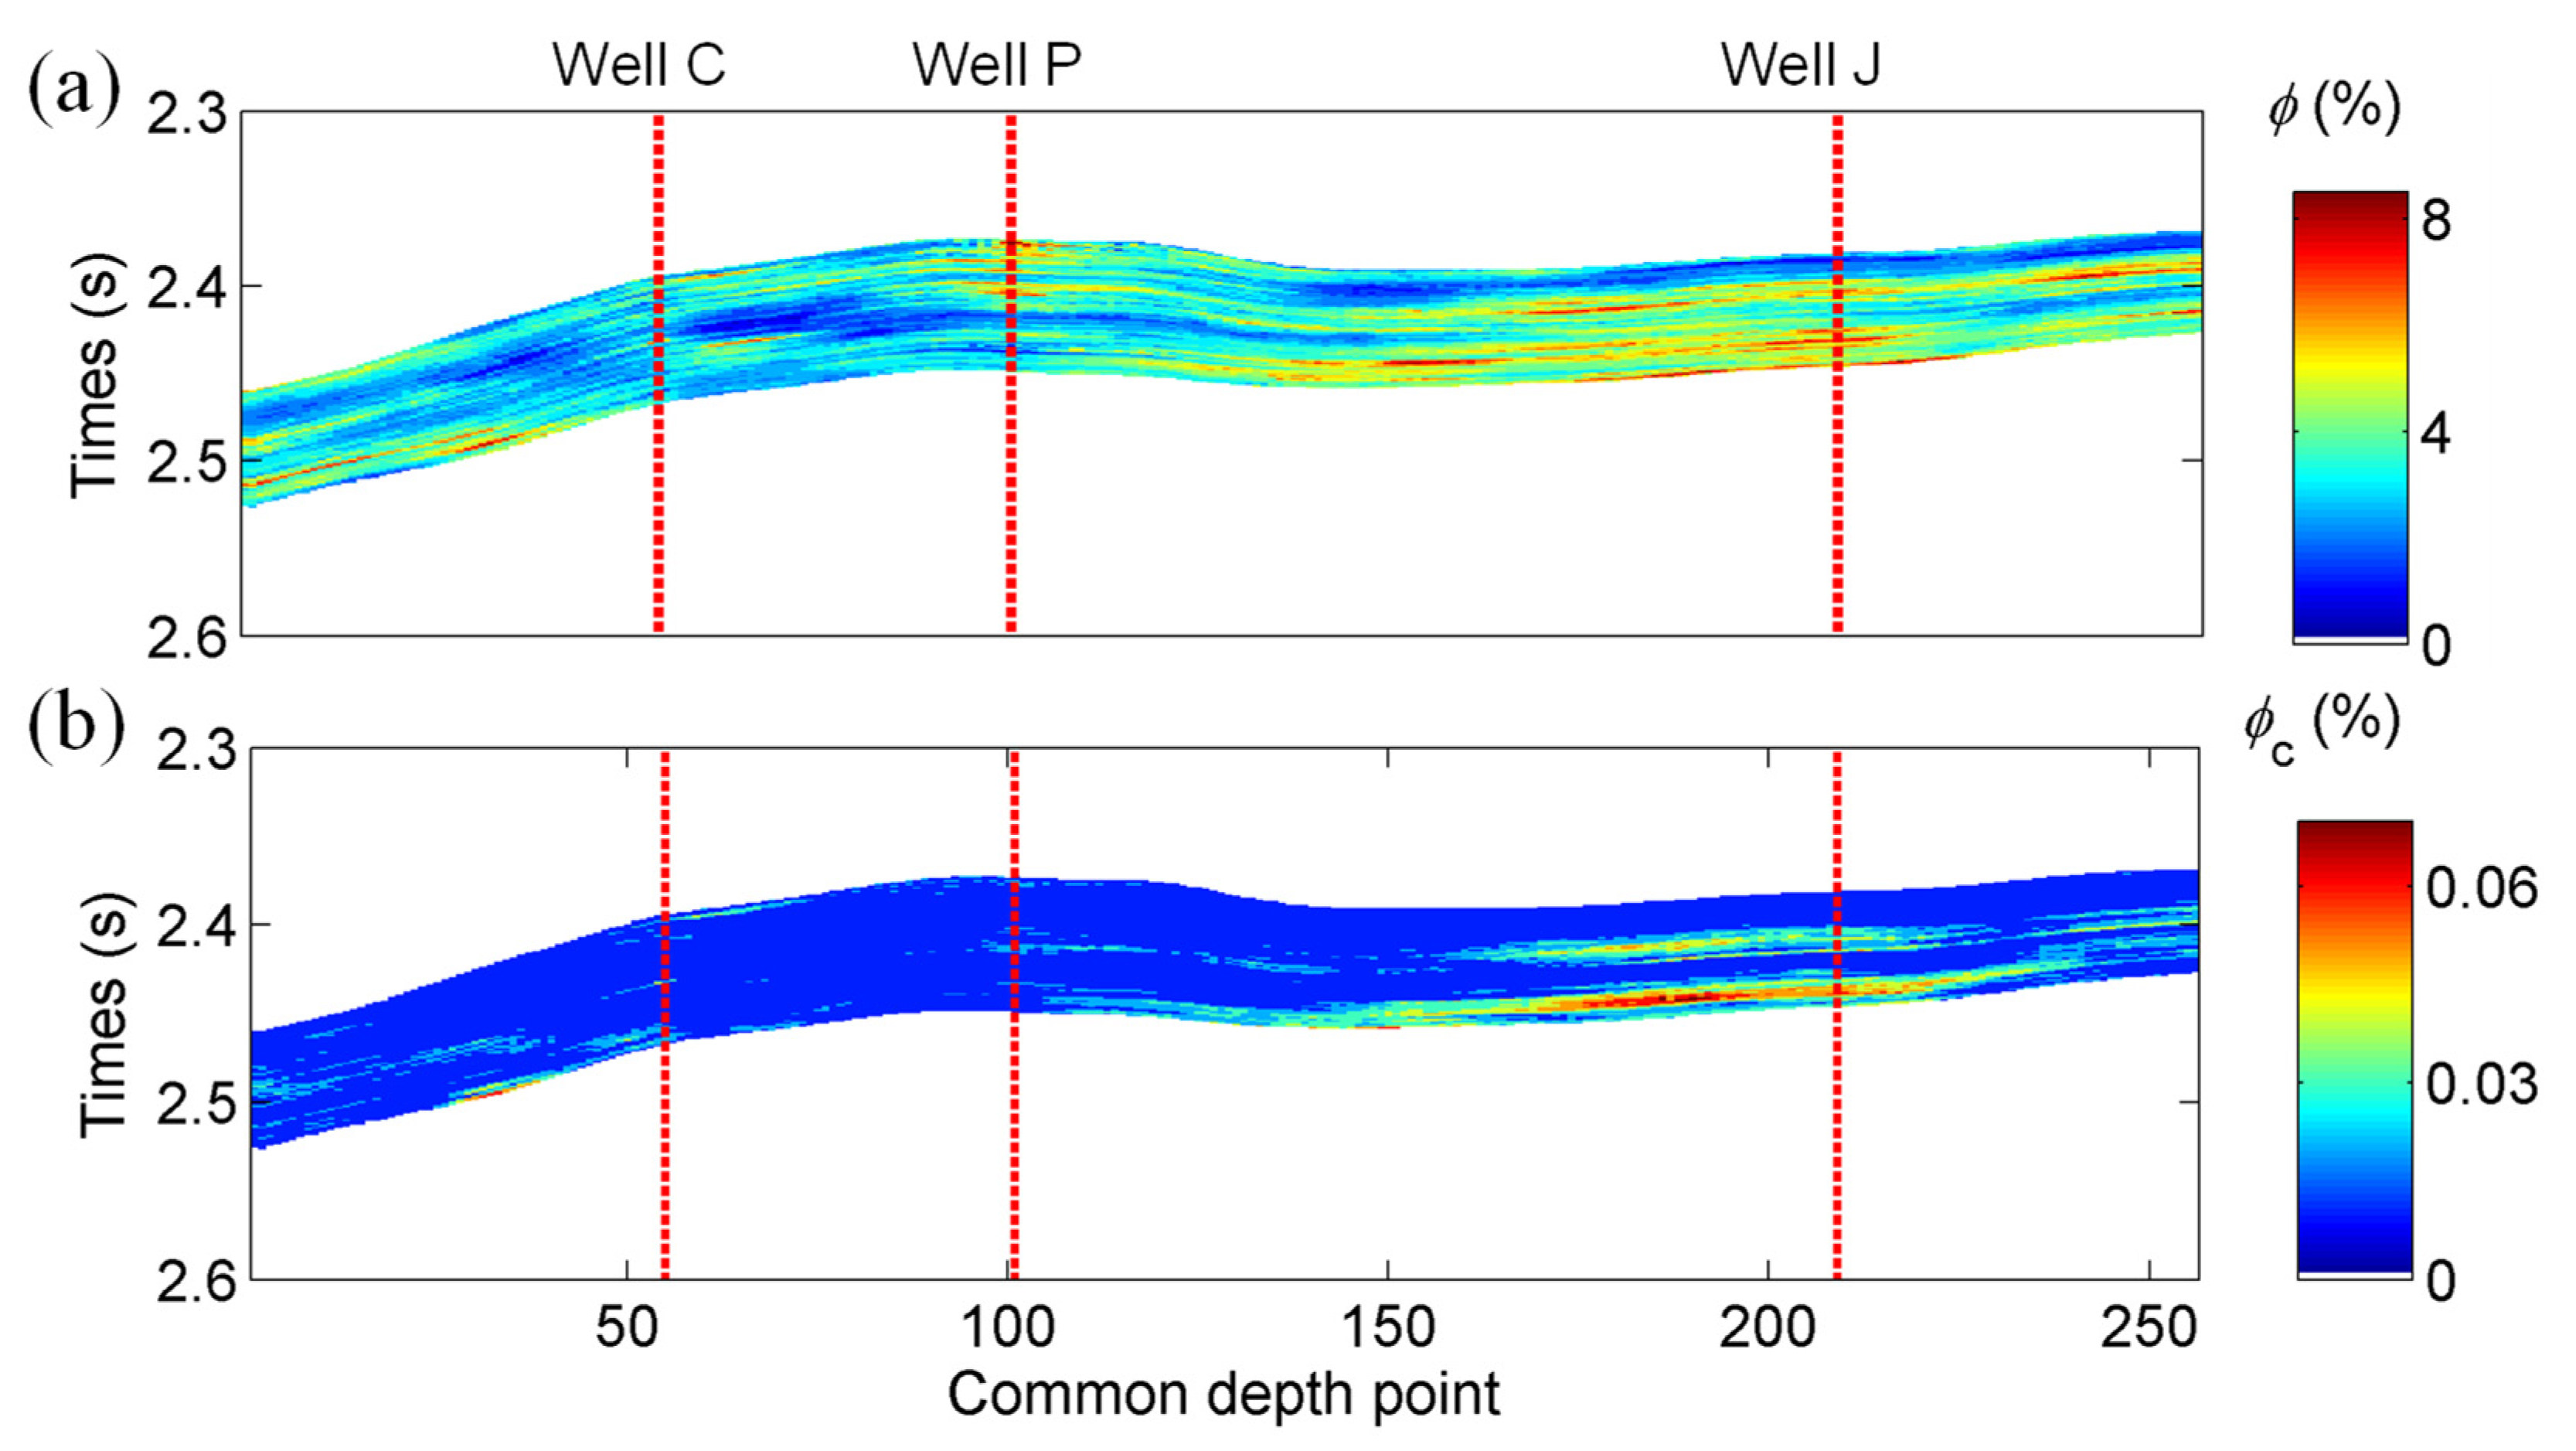
Figure 17 and
Figure 18 show results for another seismic survey line. Wells C and P show high P-wave impedances in the middle section, while Poisson’s ratio is low throughout the target layer around Well C. This well exhibits low total and microcrack porosities (see
Figure 18). Although Well P shows a higher total porosity, the microcrack porosity is low. Well J shows the best potential for gas production with high total and microcrack porosities. The reports show that Well C produced almost no gas with non-industrial gas production flow, while Wells P and J produce
and
m
3 gas per day, respectively. The predictions of the porosities are consistent with the production status.
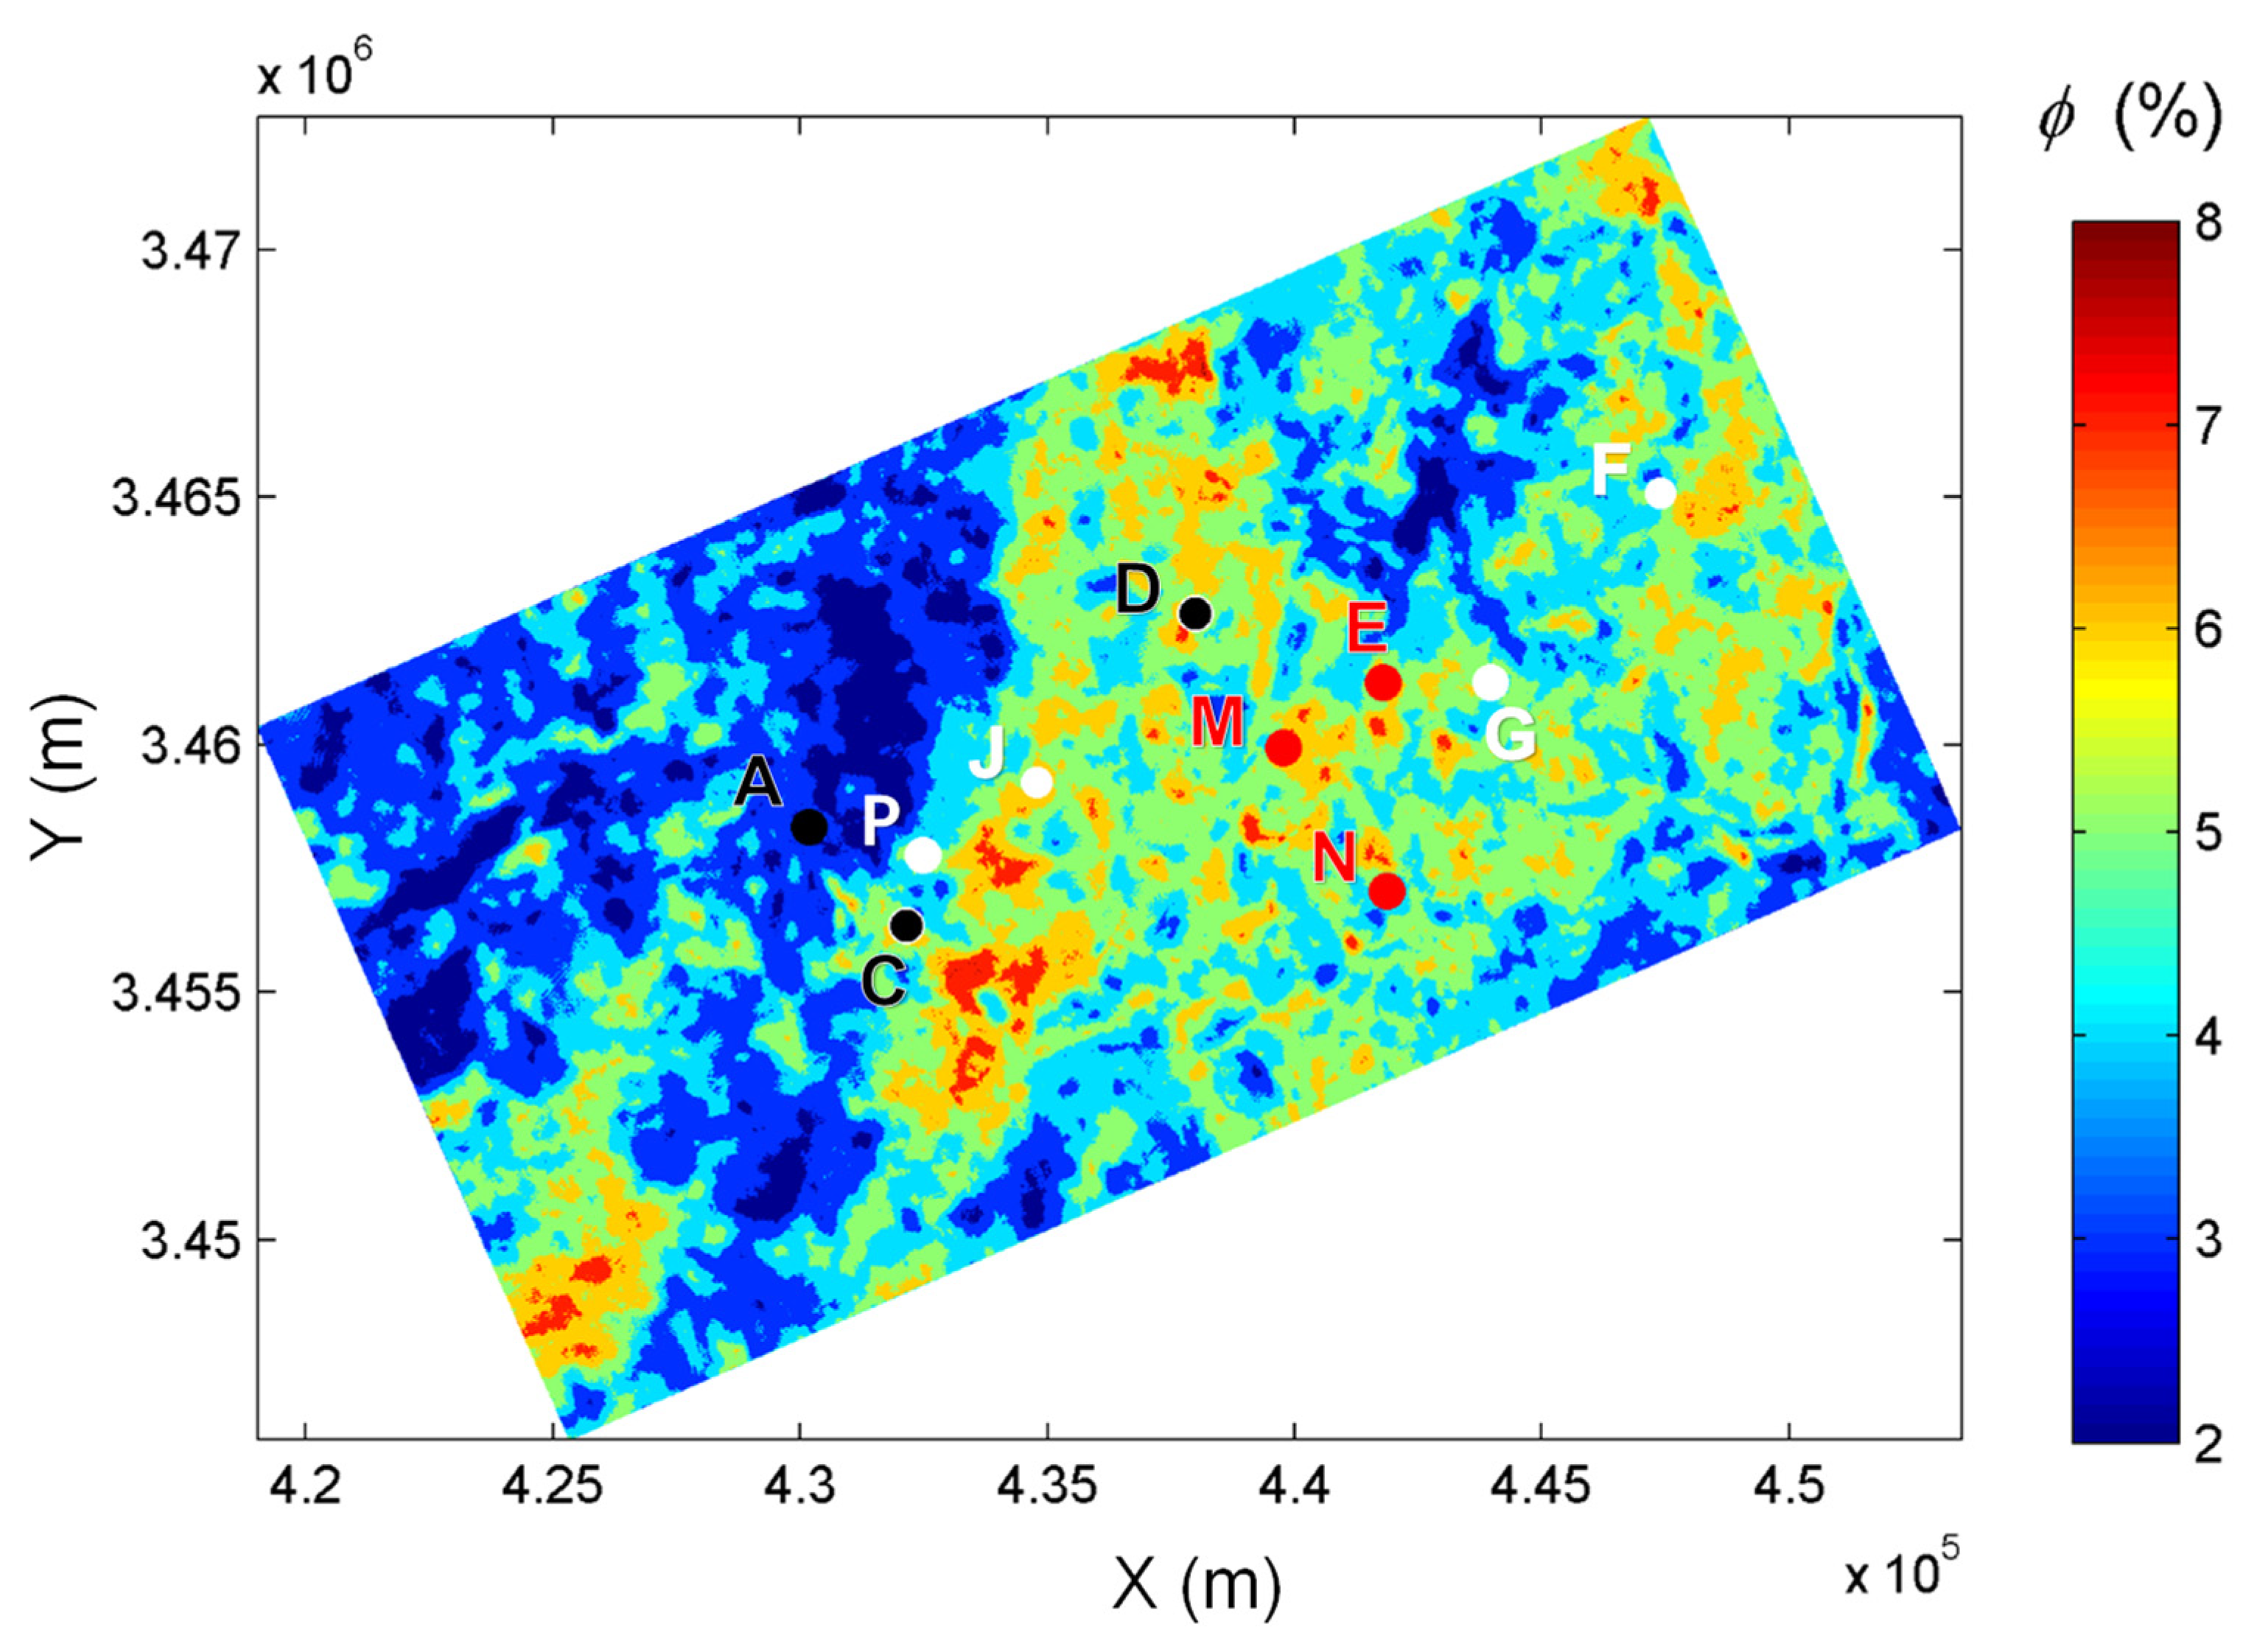
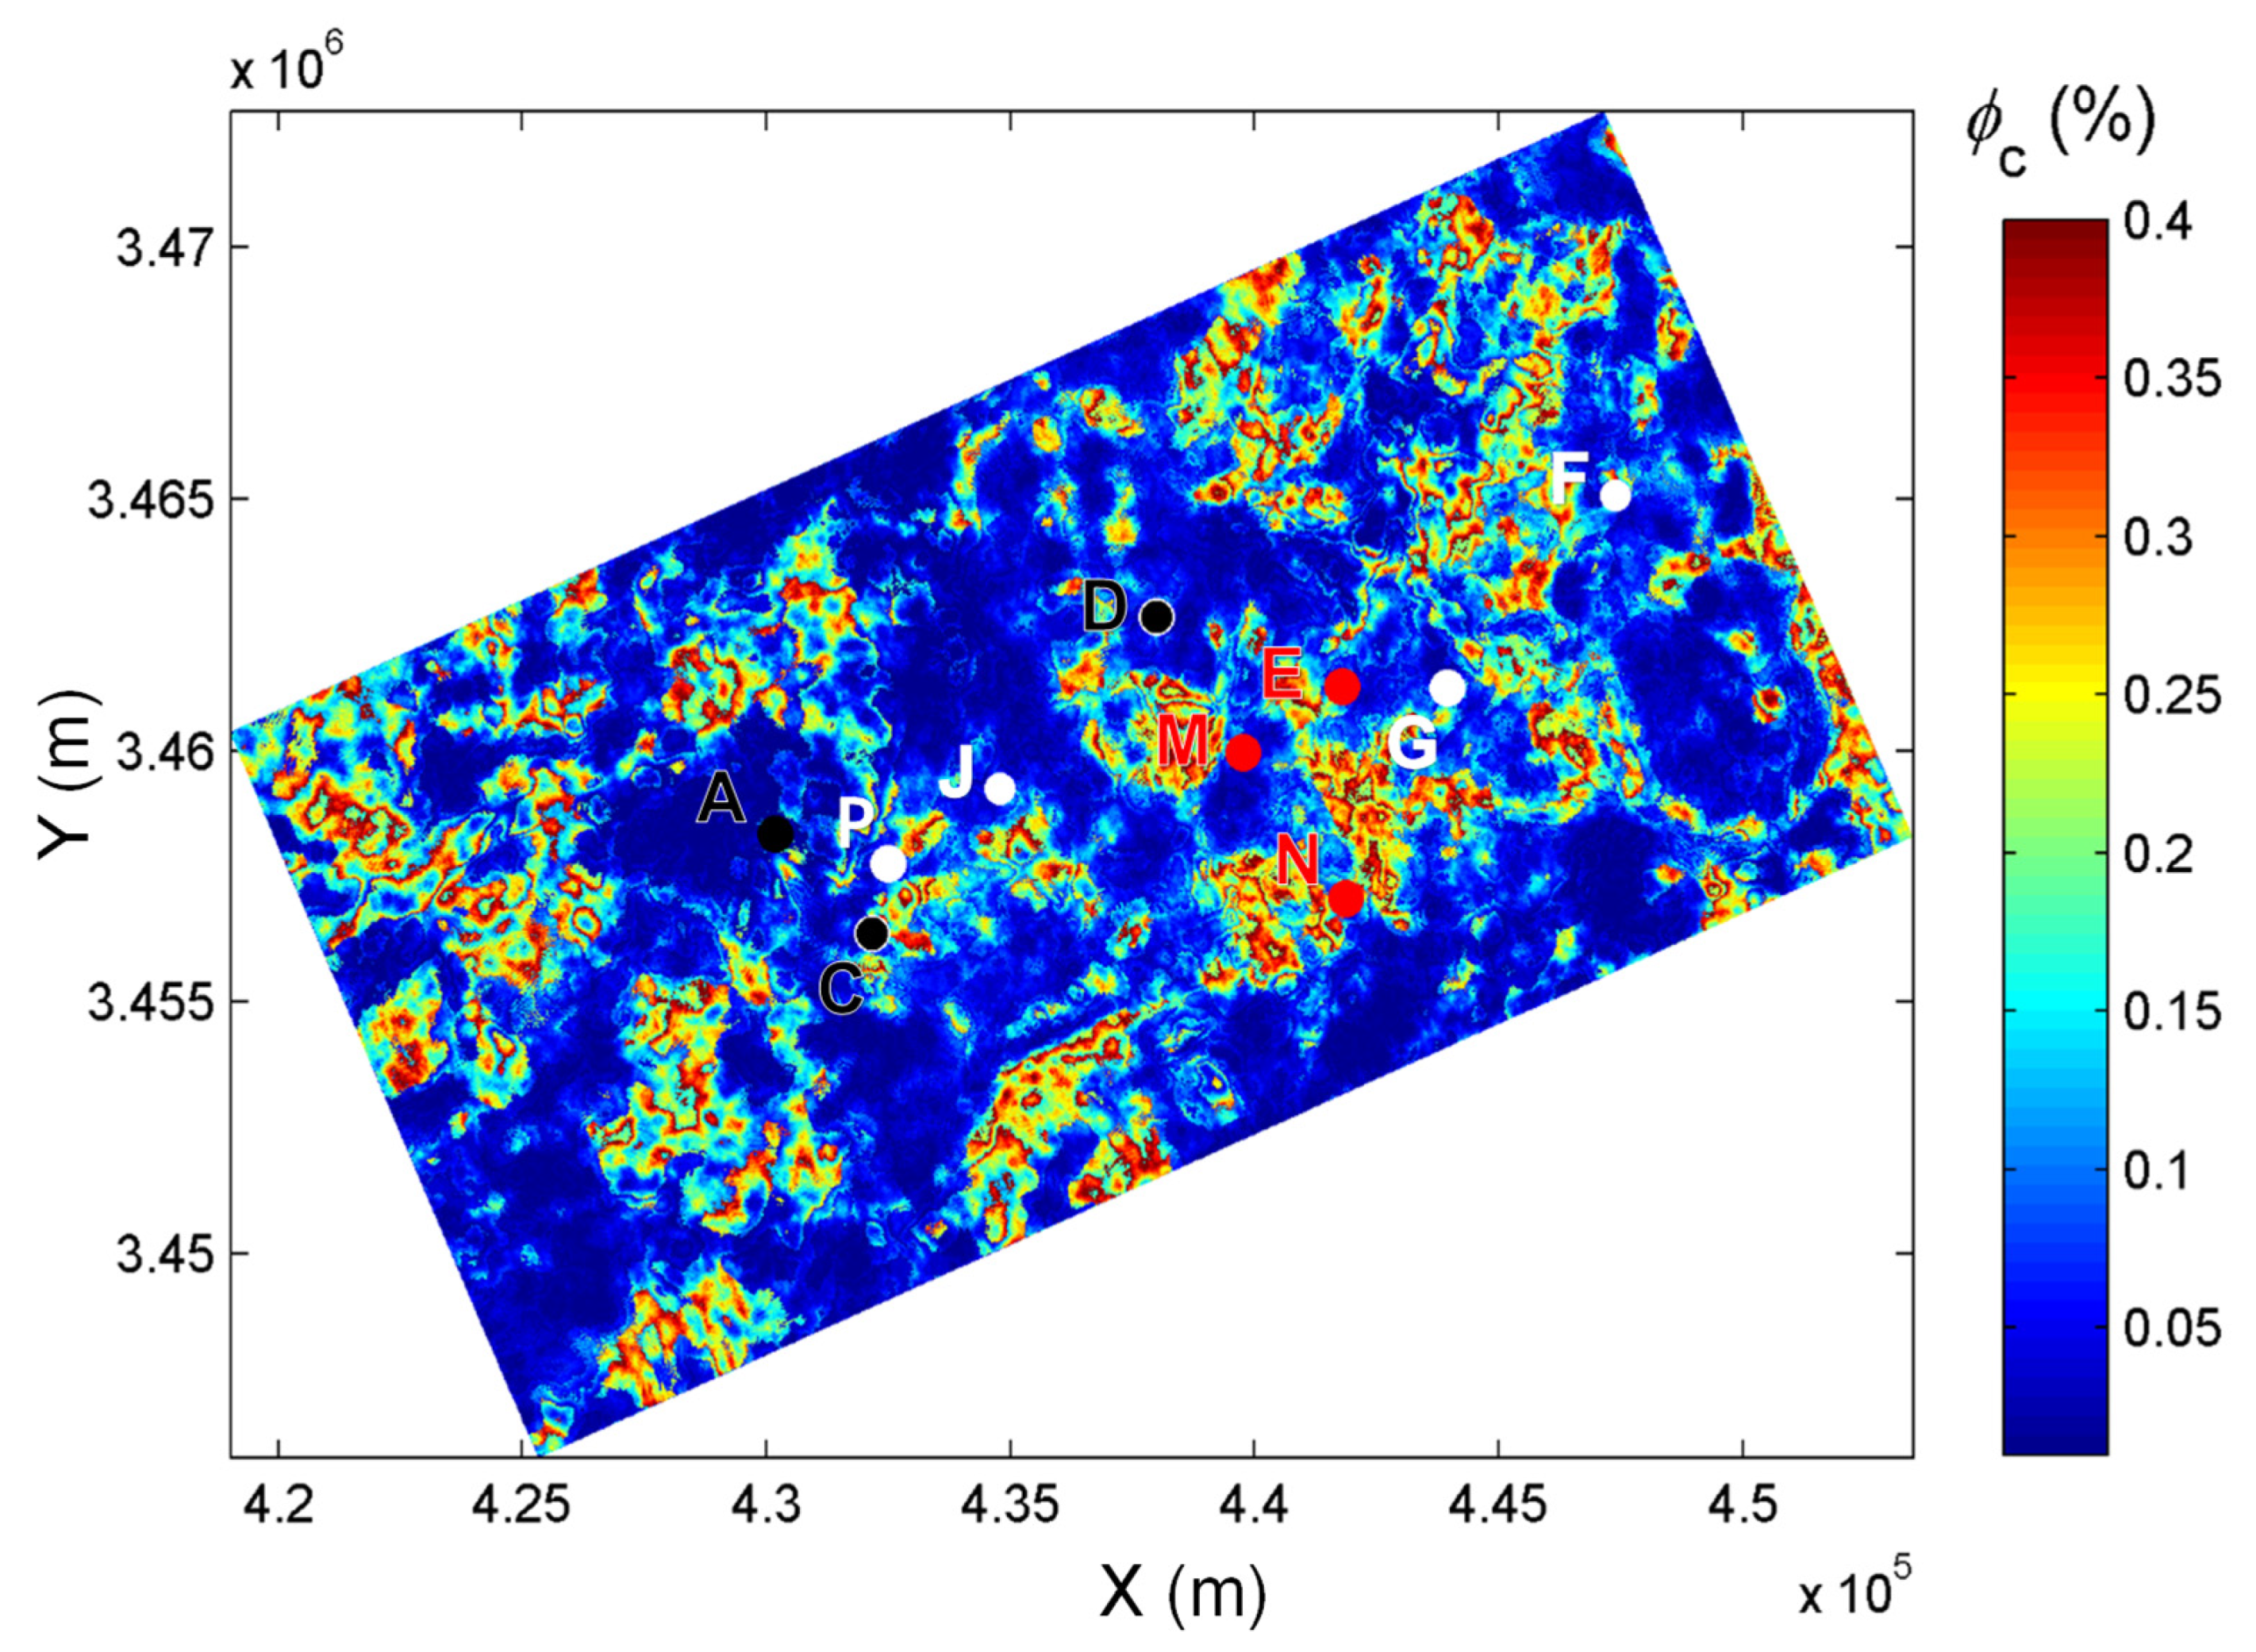
3D seismic slices of the work area of ~471 km
2 are produced from the RPTs. According to the daily gas production rate, ten wells are classified into three categories, namely, extremely low (less than
m
3), low (
m
3) and high (higher than
m
3) gas production wells.
Figure 19 and
Figure 20 show the corresponding maps of total and microcrack porosities, respectively.
The predictions show that Well A is located in an area with extremely low total and microcrack porosities. The total porosity of Wells C and D are higher than that of Well A, but their microcrack porosities are low. Wells F, G, J, and P are located in an area with low total and microcrack porosities, whereas Wells E, N, and M show high total and microcrack porosities. According to the production test report, Well A is a water well with no gas production, and Wells C and D produce almost no gas. The three wells are classified as the lowest production. Wells P, F, G, and J produce , , , and m3 gas per day, respectively, classified as low production. Wells E, N and M produce , , and m3 gas per day, respectively, and are classified as high production. The predictions basically agree with the reports, so that the RPTs can discriminate between low and high gas production reservoirs.
7. Conclusions
This study uses rock-physics templates to estimate the total and microcrack porosities of tight sandstone gas reservoirs. The models are based on the poroelasticity theory to obtain the elastic attributes at different frequency bands, namely, how Poisson’s ratio, velocity, and other relevant attributes are affected by those porosities. Ultrasonic experiments are performed under full water and gas saturations, showing that the wave velocities increase with effective pressure. When the rock is fully saturated with gas, the ratio between the P- and S-wave velocities increases with effective pressure, while for water, an opposite trend is observed.
A sensitivity analysis shows that P-wave impedance and Poisson’s ratio are most sensitive to both porosities. The attributes are considered to build the templates which are calibrated with experimental and log data. Finally, the templates are applied to seismic data to estimate the porosities, indicating that the predictions are consistent with the gas production reports.
At present, the tight sandstone gas reservoirs of Sichuan Basin have contributed to the major proportion of the total gas production output of the petroleum industries in China. However, the tight sandstone reservoirs generally exhibit the characteristics of low porosity, low permeability, high heterogeneity, and deep burial. There are difficulties in the precise prediction and detailed description of high-quality reservoirs based on the traditional geophysical exploration methods. In this work, we propose a multiscale rock physics modeling method by incorporating the effects of microcrack porosity on rock physics attributes. A workflow is presented to establish the relationships between rock physical properties and seismic wave responses, based on which the prediction of microcrack porosity is achieved in the 3D seismic survey work area. The application of the method is effective as a case study.
The proposed method can be applied in rock physics modeling based on the elastic/seismic responses of reservoir rock. It may be affected by the problem of multiplicity of solutions in the parameter inversion and reservoir prediction. Further studies may incorporate the wave attenuation in rock physics modeling, so that more attributes will be available for validating and calibrating the templates, and the influence by the multiplicity of solutions can be alleviated. Furthermore, this paper is focused on the studies on tight gas sandstone reservoirs, and for the different types of complex reservoirs, the approach should be extended and adjusted to achieve effective applications. Specifically, for those tight/shale oil reservoirs, the viscoelasticity characteristics of fluid have to be analyzed and incorporated in rock physics modeling, so that some reasonable results can be obtained.
For future studies, the different sensitivity analysis methods should be included to analyze the interactions between different attributes with respect to rock basic properties. Furthermore, the multi-phases of different types of microcracks, mesopores and fractures need be considered to establish a more realistic rock model, with which the in situ reservoirs can be better described and simulated, in combination with the latest techniques of digital rock physics.
Author Contributions
Conceptualization, J.B. and R.H.; Data curation, T.C.; Formal analysis, C.R., J.B., J.M.C. and R.H.; Funding acquisition, J.B.; Investigation, J.B., J.M.C., T.C. and R.H.; Methodology, C.R., J.B. and J.M.C.; Project administration, J.B. and T.C.; Resources, T.C.; Supervision, J.B.; Validation, C.R. and J.M.C.; Writing—original draft, C.R. and J.B.; Writing—review & editing, J.B., J.M.C. and R.H. All authors have read and agreed to the published version of the manuscript.
Funding
This research was funded by National Natural Science Foundation of China, grant number 41974123, Jiangsu Province Outstanding Youth Fund Project, grant number BK20200021, and Strategic Priority Research Program of the Chinese Academy of Sciences, grant number XDA14010303.
Institutional Review Board Statement
Not applicable.
Informed Consent Statement
Not applicable.
Data Availability Statement
The data relevant with this study can be accessed by contacting the corresponding author.
Acknowledgments
The authors are grateful to the National Natural Science Foundation of China (Grant no. 41974123), the Jiangsu Province Outstanding Youth Fund Project (Grant no. BK20200021), and the Strategic Priority Research Program of the Chinese Academy of Sciences (Grant no. XDA14010303).
Conflicts of Interest
The authors declare no conflict of interest.
Abbreviations
| AVO | Amplitude variation with offset |
| BR | Biot–Rayleigh |
| DEM | Differential equivalent medium |
| RPT | Rock physics template |
| FSI | Fluid sensitivity indicator |
Appendix A
The Biot–Rayleigh theory
The BR dispersion equation [
28] yields the complex wave number
k,
where
and
where
is the angular frequency;
and
are the local porosities of intergranular pores and microcracks, respectively; and
and
are the corresponding absolute porosities.
,
, and
are the fluid density, the fluid viscosity, and rock permeability, respectively;
,
,
,
,
, and
are elastic parameters;
is the radius of inclusion;
,
,
,
, and
are density parameters; and
and
are Biot dissipative parameters. The expressions for all these quantities can be found in [
28,
29].
References
- Yan, X.-F.; Yao, F.-C.; Cao, H.; Ba, J.; Hu, L.-L.; Yang, Z.-F. Analyzing the mid-low porosity sandstone dry frame in central Sichuan based on effective medium theory. Appl. Geophys. 2011, 8, 163–170. [Google Scholar] [CrossRef]
- Li, Y.; Tang, D.Z.; Wu, P.; Niu, X.L.; Wang, K.; Qiao, P.; Wang, Z.S. Continuous unconventional natural gas accu-mulations of Carboniferous-Permian coal-bearing strata in the Linxing area, northeastern Ordos basin, China. J. Nat. Gas Sci. Eng. 2016, 36, 314–327. [Google Scholar] [CrossRef]
- Zhu, R.; Zou, C.; Zhang, N.; Wang, X.; Cheng, R.; Liu, L.; Zhou, C.; Song, L. Diagenetic fluids evolution and genetic mechanism of tight sandstone gas reservoirs in Upper Triassic Xujiahe Formation in Sichuan Basin, China. Sci. China Ser. D Earth Sci. 2008, 51, 1340–1353. [Google Scholar] [CrossRef]
- Wang, J.L.; Feng, L.Y.; Steve, M.; Tang, X.; Gail, T.E.; Mikael, H. China’s unconventional oil: A review of its resources and outlook for long-term production. Energy 2015, 82, 31–42. [Google Scholar] [CrossRef]
- Yang, K.M.; Zhu, H.Q.; Ye, J.; Zhang, K.G.; Ke, G.M. Geological Characteristics of Tight Sandstone Gas Reservoirs in West Sichuan Basin; Science Press: Beijing, China, 2012. [Google Scholar]
- Luo, Y.; Huang, H.; Jakobsen, M.; Yang, Y.; Zhang, J.; Cai, Y. Prediction of porosity and gas saturation for deep-buried sandstone reservoirs from seismic data using an improved rock-physics model. Acta Geophys. 2019, 67, 557–575. [Google Scholar] [CrossRef]
- Carcione, J.M. Wave Fields in Real Media: Theory and Numerical Simulation of Wave Propagation in Anisotropic, Anelastic, Porous and Electromagnetic Media; Elsevier: Amsterdam, The Netherlands, 2014. [Google Scholar]
- Wang, L.; Zhao, N.; Sima, L.; Meng, F.; Guo, Y. Pore Structure Characterization of the Tight Reservoir: Systematic Integration of Mercury Injection and Nuclear Magnetic Resonance. Energy Fuels 2018, 32, 7471–7484. [Google Scholar] [CrossRef]
- Wang, X.X.; Hou, J.G.; Song, S.H.; Wang, D.M.; Gong, L.; Ma, K.; Liu, L.M.; Li, Y.Q.; Yan, L. Combining pressure-controlled porosimetry and rate-controlled porosimetry to investigate the fractal characteristics of full-range pores in tight oil reservoirs. J. Pet. Sci. Eng. 2018, 171, 353–361. [Google Scholar] [CrossRef]
- Stroker, T.M.; Harris, N.; Elliott, W.C.; Wampler, J.M. Diagenesis of a tight gas sand reservoir: Upper Cretaceous Mesaverde Group, Piceance Basin, Colorado. Mar. Pet. Geol. 2013, 40, 48–68. [Google Scholar] [CrossRef]
- Liu, L.; Tang, D.Z.; Wo, Y.J.; Liu, L.H.; Sun, W.; Liu, H.M.; Yekikang, M.Q. Favorable area prediction of tight sandstone: A case study of the He8 formation in the Kangning area, Eastern Ordos Basin, China. J. Pet. Sci. Eng. 2019, 175, 430–443. [Google Scholar]
- Vernik, L.; Kachanov, M. Modeling elastic properties of siliciclastic rocks. Geophysics 2010, 75, E171–E182. [Google Scholar] [CrossRef]
- Hudson, J.A. A higher order approximation to the wave propagation constants for a cracked solid. Geophys. J. Int. 1986, 87, 265–274. [Google Scholar] [CrossRef]
- Smith, T.M.; Sayers, C.; Sondergeld, C.H. Rock properties in low-porosity/low-permeability sandstones. Geophysics 2009, 28, 48–59. [Google Scholar] [CrossRef]
- Yoon, H.-K. Relationship between Aspect Ratio and Crack Density in Porous-Cracked Rocks Using Experimental and Optimization Methods. Appl. Sci. 2020, 10, 7147. [Google Scholar] [CrossRef]
- Cheng, W.; Ba, J.; Ma, R.P.; Zhang, L. A study on the effects of pressure and fluid on rock pore structure and anelasticity: Theoretical model and experimental measurement. Chin. J. Geophys. 2020, 63, 4517–4527. (In Chinese) [Google Scholar]
- Zhang, L.; Ba, J.; Carcione, J.M.; Fu, L.-Y. Differential poroelasticity model for wave dissipation in self-similar rocks. Int. J. Rock Mech. Min. Sci. 2020, 128, 104281. [Google Scholar] [CrossRef]
- Zhang, L.; Ba, J.; Carcione, J.M. Wave Propagation in Infinituple-Porosity Media. J. Geophys. Res. Solid Earth 2021, 126, e2020JB021266. [Google Scholar] [CrossRef]
- Avseth, P.A.; Odegaard, E. Well log and seismic data analysis using rock physics templates. First Break 2004, 22, 37–43. [Google Scholar] [CrossRef]
- Avseth, P.; Mukerji, T.; Mavko, G. Quantitative Seismic Interpretation: Applying Rock Physics Tools to Reduce Interpretation Risk; Cambridge University Press: Cambridge, MA, USA, 2005. [Google Scholar]
- Xin, G.; Han, D. Lithology and fluid differentiation using a rock physics template. Lead. Edge 2009, 28, 60–65. [Google Scholar]
- Michel, K. Rock physics driven inversion: The importance of workflow. First Break 2010, 28, 68–81. [Google Scholar]
- Gupta, S.D.; Chatterjee, R.; Farooqui, M.Y. Rock physics template (RPT) analysis of well logs and seismic data for lithology and fluid classification in Cambay Basin. Acta Diabetol. 2012, 101, 1407–1426. [Google Scholar] [CrossRef]
- Ba, J.; Cao, H.; Carcione, J.M.; Tang, G.; Yan, X.-F.; Sun, W.-T.; Nie, J.-X. Multiscale rock-physics templates for gas detection in carbonate reservoirs. J. Appl. Geophys. 2013, 93, 77–82. [Google Scholar] [CrossRef]
- Carcione, J.M.; Avseth, P. Rock-physics templates for clay-rich source rocks. Geophysics 2015, 80, D481–D500. [Google Scholar] [CrossRef]
- Liu, Q.; Yin, X.; Li, C. Fluid discrimination based on rock physics templates. J. Geophys. Eng. 2015, 12, 830–838. [Google Scholar] [CrossRef][Green Version]
- Pang, M.Q.; Ba, J.; Carcione, J.M.; Vesnaver, A.; Ma, R.P.; Chen, T.S. Analysis of attenuation rock-physics template of tight sandstones: Reservoir microcrack prediction. Chin. J. Geophys. 2020, 63, 4205–4219. [Google Scholar]
- Ba, J.; Carcione, J.M.; Nie, J.X. Biot-Rayleigh theory of wave propagation in double-porosity media. J. Geophys. Res. Space Phys. 2011, 116, 06202. [Google Scholar] [CrossRef]
- Ba, J.; Xu, W.; Fu, L.-Y.; Carcione, J.M.; Zhang, L. Rock anelasticity due to patchy saturation and fabric heterogeneity: A double double-porosity model of wave propagation. J. Geophys. Res. Solid Earth 2017, 122, 1949–1976. [Google Scholar] [CrossRef]
- Liu, J.L.; Liu, Z.Q.; Xiao, K.H.; Huang, Y.Q.; Jin, W.J. Characterization of favorable lithofacies in tight sandstone reservoirs and its significance for gas exploration and exploitation: A case study of the 2~(nd) Member of Triassic Xujiahe Formation in the Xinchang area, Sichuan Basin. Pet. Explor. Dev. 2020, 47, 50–61. [Google Scholar] [CrossRef]
- Yang, P.; Zhang, L.; Liu, K.; Cao, B.; Gao, J.; Qiu, G. Diagenetic history and reservoir evolution of tight sandstones in the second member of the Upper Triassic Xujiahe Formation, western Sichuan Basin, China. J. Pet. Sci. Eng. 2021, 201, 108451. [Google Scholar] [CrossRef]
- Wu, D.; Liu, S.; Chen, H.; Lin, L.; Yu, Y.; Xu, C.; Pan, B. Investigation and prediction of diagenetic facies using well logs in tight gas reservoirs: Evidences from the Xu-2 member in the Xinchang structural belt of the western Sichuan Basin, western China. J. Pet. Sci. Eng. 2020, 192, 107326. [Google Scholar] [CrossRef]
- Wang, Q.; Chen, D.; Gao, X.; Wang, F.; Li, J.; Liao, W.; Wang, Z.; Xie, G. Microscopic pore structures of tight sandstone reservoirs and their diagenetic controls: A case study of the Upper Triassic Xujiahe Formation of the Western Sichuan Depression, China. Mar. Pet. Geol. 2020, 113, 104119. [Google Scholar] [CrossRef]
- Liu, C.; Pei, S.J.; Guo, Z.Q.; Fu, W.; Zhang, Y.S.; Liu, X.W. Seismic AVO Simultation and Analysis in Heterogeneous Media. J. Jilin Univ. Earth Sci. Ed. 2018, 48, 1512–1521. [Google Scholar]
- Rutherford, S.R.; Williams, R.H. Amplitude-Versus-Offset Variations in gas sands. Geophysics 1989, 54, 680–688. [Google Scholar] [CrossRef]
- Castagna, J.P.; Swan, H.W. Principles of AVO cross plotting. Lead. Edge 1997, 16, 337–342. [Google Scholar] [CrossRef]
- Voigt, W. Lehrbuch der Kirstallphysik. Teubner Leipz. 1910, 1928, 739. [Google Scholar]
- Reuss, A. Calculation of the flow limits of mixed crystals on the basis of the plasticity of monocrystals. Z. Angew. Mathenatik 1929, 9, 49–58. [Google Scholar] [CrossRef]
- Hill, R. The Elastic Behaviour of a Crystalline Aggregate. Proc. Phys. Soc. Sect. A 1952, 65, 349–354. [Google Scholar] [CrossRef]
- Berryman, J.G. Single-scattering approximations for coefficients in Biot’s equations of poroelasticity. J. Acoust. Soc. Am. 1992, 91, 551–571. [Google Scholar] [CrossRef]
- Berryman, J.G. Long-wavelength propagation in composite elastic media II. Ellipsoidal inclusions. J. Acoust. Soc. Am. 1980, 68, 1820–1831. [Google Scholar] [CrossRef]
- Batzle, M.; Wang, Z. Seismic properties of pore fluids. Geophysics 1992, 57, 1396–1408. [Google Scholar] [CrossRef]
- Guo, M.-Q.; Fu, L.-Y.; Ba, J. Comparison of stress-associated coda attenuation and intrinsic attenuation from ultrasonic measurements. Geophys. J. Int. 2009, 178, 447–456. [Google Scholar] [CrossRef]
- Shapiro, S. Elastic piezosensitivity of porous and fractured rocks. Geophysics 2003, 68, 482–486. [Google Scholar] [CrossRef]
- Pervukhina, M.; Gurevich, B.; Dewhurst, D.; Siggins, A.F. Applicability of velocity-stress relationships based on the dual porosity concept to isotropic porous rocks. Geophys. J. Int. 2010, 181, 1473–1479. [Google Scholar] [CrossRef]
- Yin, H.J.; Zhao, J.G.; Tang, G.Y.; Zhao, L.M.; Ma, X.Y.; Wang, S.X. Pressure and fluid effect on frequency-dependent elastic moduli in fully saturated tight sandstone. J. Geophys. Res. Solid Earth 2017, 122, 8925–8942. [Google Scholar] [CrossRef]
- Cheng, W.; Ba, J.; Carcione, J.M.; Pang, M.; Wu, C. Estimation of the Pore Microstructure of Tight-Gas Sandstone Reservoirs with Seismic Data. Front. Earth Sci. 2021, 9, 1–12. [Google Scholar] [CrossRef]
- Amini, A.; Abdollahi, A.; Hariri-Ardebili, M.; Lall, U. Copula-based reliability and sensitivity analysis of aging dams: Adaptive Kriging and polynomial chaos Kriging methods. Appl. Soft Comput. 2021, 109, 107524. [Google Scholar] [CrossRef]
- Pei, F.-G.; Zou, C.-C.; He, T.; Shi, G.; Qiu, G.-G.; Ren, K.-Y. Fluid sensitivity study of elastic parameters in low-medium porosity and permeability reservoir rocks. Appl. Geophys. 2010, 7, 1–9. [Google Scholar] [CrossRef]
- Guo, Y.; Ma, H.; Ba, J.; Yu, H.; Long, C. Impact of data distribution on fluid sensitivity analysis: A quantitative investigation. J. Appl. Geophys. 2015, 119, 1–15. [Google Scholar] [CrossRef]
- Zeng, Q.J.; Guo, Y.; Jiang, R.; Ba, J.; Ma, H.D.; Liu, J. Fluid sensitivity of rock physics parameters in reservoirs: Quantitative analysis. J. Seism. Explor. 2017, 26, 125–140. [Google Scholar]
- Ma, R.; Ba, J.; Carcione, J.; Lebedev, M.; Wang, C. Experimental Study on Petrophysical Properties as a Tool to Identify Pore Fluids in Tight-Rock Reservoirs. Front. Earth Sci. 2021, 9, 334. [Google Scholar] [CrossRef]
- Aki, K.; Richards, P.G. Quantitative Seismology; W. H. Freeman & Co.: New York, NY, USA, 1980. [Google Scholar]
- Buland, A.; Omre, H. Bayesian linearized AVO inversion. Geophysics 2003, 68, 185–198. [Google Scholar] [CrossRef]
- Luo, C.; Ba, J.; Carcione, J.M.; Huang, G.; Guo, Q. Joint PP and PS Pre-stack Seismic Inversion for Stratified Models Based on the Propagator Matrix Forward Engine. Surv. Geophys. 2020, 41, 987–1028. [Google Scholar] [CrossRef]
- Luo, C.; Huang, G.; Chen, X.; Chen, Y. Registration-Free Multicomponent Joint AVA Inversion Using Optimal Transport. IEEE Trans. Geosci. Remote. Sens. 2021, 99, 1–13. [Google Scholar] [CrossRef]
Figure 1.
Thin section of a tight sandstone showing microcracks and a complex pore structure.
Figure 1.
Thin section of a tight sandstone showing microcracks and a complex pore structure.
Figure 2.
Log profiles of Well P. (a) P-wave velocity, (b) S-wave velocity, and (c) density.
Figure 2.
Log profiles of Well P. (a) P-wave velocity, (b) S-wave velocity, and (c) density.
Figure 3.
(a) AVO curves and (b) synthetic seismic records of the target layer.
Figure 3.
(a) AVO curves and (b) synthetic seismic records of the target layer.
Figure 4.
Scheme of tight sandstone pore structure with intergranular pores and microcrack network.
Figure 4.
Scheme of tight sandstone pore structure with intergranular pores and microcrack network.
Figure 5.
Flowchart for the prediction of the reservoir properties.
Figure 5.
Flowchart for the prediction of the reservoir properties.
Figure 6.
P-wave velocity (a) and dissipation factor (b) as a function of frequency and different total porosities.
Figure 6.
P-wave velocity (a) and dissipation factor (b) as a function of frequency and different total porosities.
Figure 7.
Effect of the total and microcrack porosities on the P-wave (a) and S-wave (b) velocities.
Figure 7.
Effect of the total and microcrack porosities on the P-wave (a) and S-wave (b) velocities.
Figure 8.
P- and S-wave velocities (a) and their ratio (b) as a function of effective pressure.
Figure 8.
P- and S-wave velocities (a) and their ratio (b) as a function of effective pressure.
Figure 9.
Total, stiff, and microcrack porosities as a function of the effective pressure.
Figure 9.
Total, stiff, and microcrack porosities as a function of the effective pressure.
Figure 10.
Sensitivity indices varying with the microcrack porosity.
Figure 10.
Sensitivity indices varying with the microcrack porosity.
Figure 11.
Sensitivity indices varying with the total porosity, based on data from Well P.
Figure 11.
Sensitivity indices varying with the total porosity, based on data from Well P.
Figure 12.
RPTs at ultrasonic (a) and sonic (b) frequencies.
Figure 12.
RPTs at ultrasonic (a) and sonic (b) frequencies.
Figure 13.
Ultrasonic data and corresponding RPT. The color bar indicates the microcrack porosity.
Figure 13.
Ultrasonic data and corresponding RPT. The color bar indicates the microcrack porosity.
Figure 14.
Log data and corresponding RPT. The color bar indicates the total porosity.
Figure 14.
Log data and corresponding RPT. The color bar indicates the total porosity.
Figure 15.
2-D seismic profiles of P-wave impedance (a) and Poisson’s ratio (b).
Figure 15.
2-D seismic profiles of P-wave impedance (a) and Poisson’s ratio (b).
Figure 16.
Inversion results of total (
a) and microcrack (
b) porosities corresponding to the data of
Figure 15.
Figure 16.
Inversion results of total (
a) and microcrack (
b) porosities corresponding to the data of
Figure 15.
Figure 17.
2-D seismic profiles of P-wave impedance (a) and Poisson’s ratio (b) corresponding to a second survey.
Figure 17.
2-D seismic profiles of P-wave impedance (a) and Poisson’s ratio (b) corresponding to a second survey.
Figure 18.
Inversion results of total (
a) and microcrack (
b) porosities, corresponding to the data of
Figure 17.
Figure 18.
Inversion results of total (
a) and microcrack (
b) porosities, corresponding to the data of
Figure 17.
Figure 19.
3D slice of reservoir total porosity. Black, white, and red circles indicate extremely low, low, and high gas production wells, respectively.
Figure 19.
3D slice of reservoir total porosity. Black, white, and red circles indicate extremely low, low, and high gas production wells, respectively.
Figure 20.
3D slice of reservoir microcrack porosity. Black, white, and red circles indicate extremely low, low, and high gas production wells, respectively.
Figure 20.
3D slice of reservoir microcrack porosity. Black, white, and red circles indicate extremely low, low, and high gas production wells, respectively.
Table 1.
Seismic properties, corresponding to the sandstone model of the Xujiahe Formation.
Table 1.
Seismic properties, corresponding to the sandstone model of the Xujiahe Formation.
| Well | Top | Target Layer | Bottom |
|---|
VP
(m/s) | Vs
(m/s) | Density
(g/cm3) | VP
(m/s) | Vs
(m/s) | Density
(g/cm3) | VP
(m/s) | Vs
(m/s) | Density
(g/cm3) |
|---|
| P | 4453 | 2812 | 2.5360 | 3956 | 2462 | 2.5298 | 4787 | 2983 | 2.5531 |
| Publisher’s Note: MDPI stays neutral with regard to jurisdictional claims in published maps and institutional affiliations. |
© 2021 by the authors. Licensee MDPI, Basel, Switzerland. This article is an open access article distributed under the terms and conditions of the Creative Commons Attribution (CC BY) license (https://creativecommons.org/licenses/by/4.0/).


