1. Introduction
Industrial process monitoring (IPM) has entered a new era through developments in root cause analysis and diagnosis techniques [
1]. IPM helps industries across the globe to maximize their profit using an efficient and safe operation [
2]. The innovations in fault-detection techniques in Industry 4.0 and the manipulation of big data and Internet of Things (IoT) are integrating process systems for an intelligent and automated operation [
3]. As the data acquisition and sensors availability have been impressively improved in the current era, the univariate approaches [
4,
5] have been evolved to multivariate ones [
6], and consequently, upgraded to high-dimensional systems [
7,
8,
9,
10]. IPM has been recognized as a well-established area and has been studied, reviewed, and improved by several researchers in the past [
11,
12,
13,
14,
15,
16].
Fired heaters are utilized in process industries to heat up the process streams or to perform reboiling tasks for a distillation column. A typical industrial fired heater consists of a radiant section, a convection section, and the stack. Radiant and convection sections have multiple tube passes, and the crude oil flows inside these tubes and absorbs the heat generated by the combustion of fuel gas [
17]. The heat liberated is mainly absorbed by the process fluid but also some part of the total heat is lost through leaks, walls, and the stack flue gases, etc. Combustion leads to the formation of hot exhaust gases that carry and transfer the heat to tube walls mainly by three heat transfer modes: convection, radiation, and conduction. When being a reboiler, a fired heater partially vaporizes the liquid from the bottom tray of the distillation column, which provides the reboiler energy necessary for a distillation process [
18,
19].
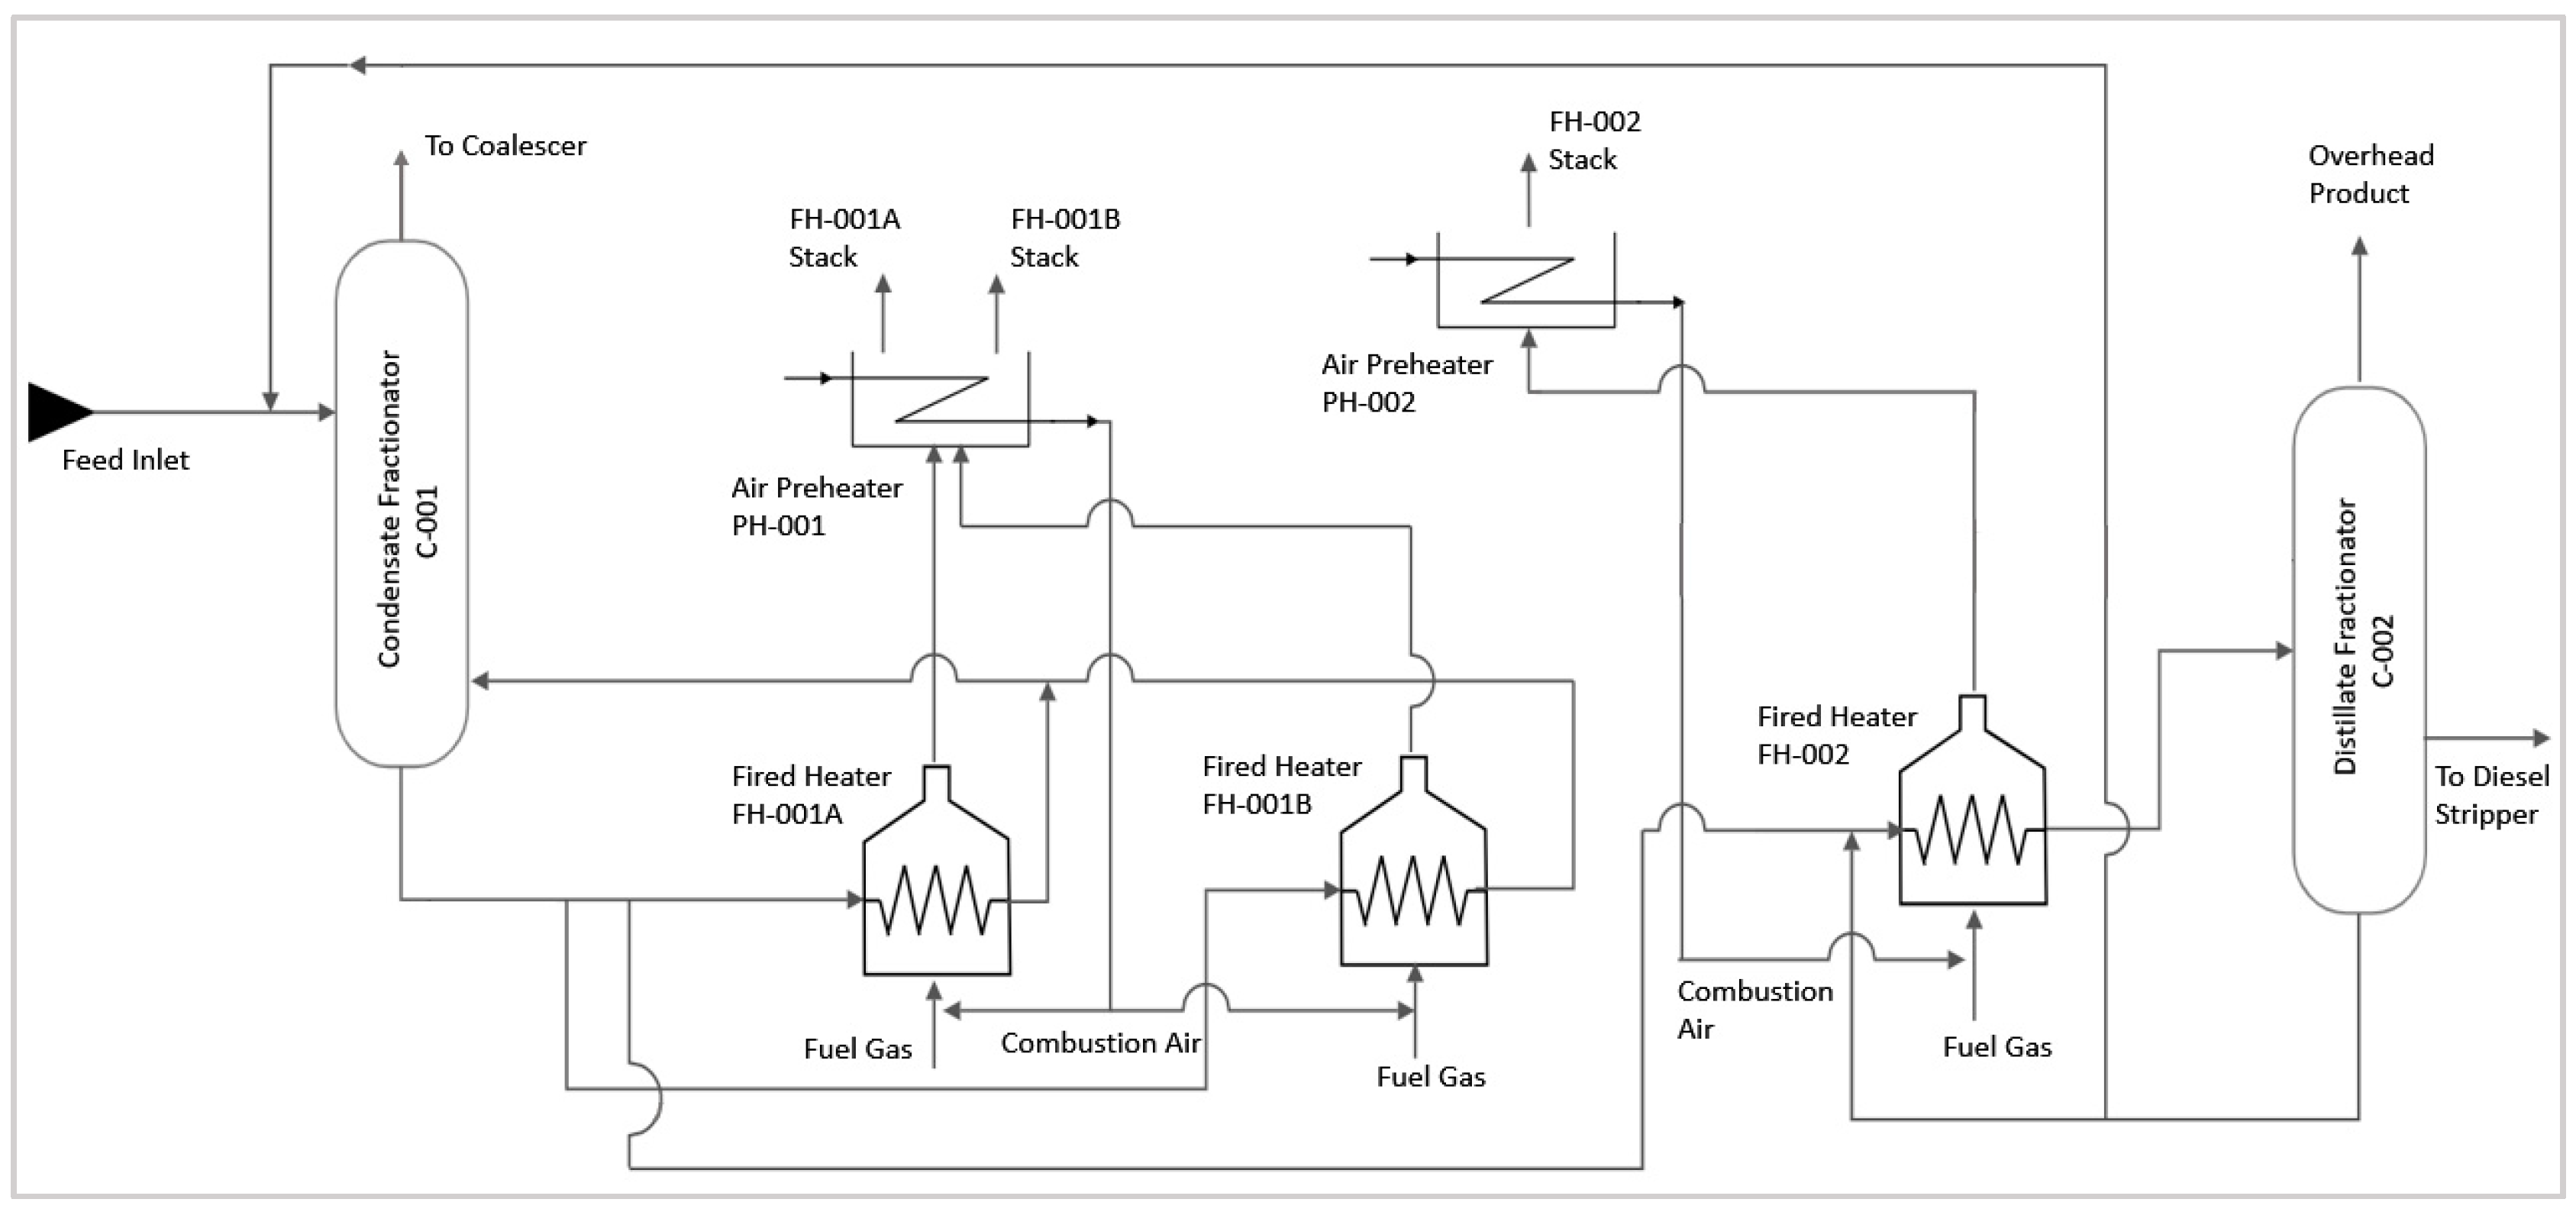
Figure 1 illustrates the process flowsheet for fired heaters’ operation in the CFU (condensate fractionation unit). The current study is focused on the three of the fired heaters in the CFU: FH-001A, FH-001B, and FH-002. FH-001A and FH-001B operate as reboilers of Condensate Fractionator C-001, while FH-002 acts as a feed preheater for Distillate Fractionator C-002. These fired heaters’ performance has a direct impact on the CFU, as small deviations in heaters’ operation may lead to large disturbances in the associated columns C-001 and C-002, and they may upset the overall CFU. For the optimum performance of the CFU, the heaters’ efficiency should be up to the mark as heaters’ low performance causes the decline in separation efficiency of columns. The bottom product of condensate fractionator C-001 is introduced to the reboilers FH-001A and FH-001B, and a part of FH-001A feed is sent to FH-002 to be preheated. The outlet from FH-002 is then introduced to Distillated Fractionator C-002. Air preheaters PH-001 and PH-002 are used to heat up the combustion air by recovering heat from the hot stack flue gases, and the preheated combustion air is then mixed with fuel gas (methane) for the combustion process. The cooled flue gases from the preheaters are then sent to the stacks.
The equipment performance monitoring system is an essential part of any chemical plant. Performance monitoring is based on fault detection models to detect abnormal conditions. The automated platform continuously monitors and alarms if the statistics exceed their control thresholds. It is estimated that the energy consumption in oil and petroleum industries in OECD (Organization for Economic Co-operation and Development) countries is more than 7% of the total consumed in all the sectors [
20]. A major part of that consumed energy is attributed to the steam boilers and process heaters [
21,
22].
This high energy demand is the driving force of finding innovative ideas to reduce operating costs and to optimize the already existing plant structure and the operation techniques [
23,
24,
25]. The published literature states that the optimization can be applied to save up to 10–20% of energy being consumed in U.S. refining facilities [
26,
27,
28,
29].
Real-time process monitoring is the area where most of the energies are placed for the sake of optimization and safety. Every manufacturing plant explores ways to detect and repair faults promptly. For example, in the case of sensor failure to measure or transmit the data, repairing or replacing the sensor takes a long time. This results in missing data and increases the probability of accidents. Another problem in the monitoring area is the false alarms that are ignored by operators in most of the cases, and they render the root cause analysis procedure ineffective.
Every unit in a refinery or petrochemical plant operates several fired heaters for heating the process streams or for reboiling operations. The fired heater is the asset that offers significant optimization scope if carefully operated, or it may be the most cost-ineffective equipment. Fuel is a very costly utility that is fired in the heater to provide heat to the process fluid passing through the tubes. Over-firing for a short period leads to a large loss of capital; in contrast, firing less than a certain threshold can lead to out-of-specification products and insufficient energy available in the heater. A high rate of firing also leads to equipment damage by creating a hot spot on the tubes. Operators and engineers in a plant engage in brainstorming on daily basis to keep these variables within a certain range to ensure an optimized and safe operation.
Apart from the efficiency or performance decline, any failure may cause an emergency shutdown of one or several units or a complete plant shutdown. Even a small deviation from a standard procedure may compromise safety across the plant, and the equipment or personnel may be in imminent danger. The United States Chemical Safety Board (CSB) has been actively investigating the plant accidents, including the Texas Refinery Explosion [
30], which occurred due to several operation deviations and a lack of a decision support system and is the most serious accident ever investigated by CSB.
Figure 2 explains the root causes and status of the standard procedures reported by the investigation team after this accident.
In the past literature, two methods have been widely used for monitoring purposes, which are data-driven and knowledge-driven. In light of the above requirements, both methods will be analyzed and integrated in this paper to explore the efficacy of both methods for abnormal condition detection in process industries.
Knowledge-driven root cause analysis is based on the experts’ knowledge, which is fed to the application to monitor the past known faults based on the complex rules. Knowledge acquisition and its deployment to the system are the two major steps in the knowledge-driven root cause analysis method. The first step, knowledge acquisition, focuses on building failure mode and effects analysis (FMEA) and fault tree analysis (FTA). FMEA deals with collecting experts’ knowledge based on past faulty data analysis or the operation insights of the experts. In contrast, FTA is the complex rule that manipulates the Boolean logic to explore the events that may lead to a prospective problem. Knowledge acquisition usually takes a significant amount of time because the experts have different interpretations during building FMEA and FTA, and additionally, the history of fault scenarios may be unreliable because of some inconsistencies and ambiguities. This step requires in-depth domain knowledge, evidence, guidelines, a thresholds database, and statistically derived features to set up the rules for the knowledge-driven approach to work perfectly. Hence, a great deal of human effort is required to implement the knowledge in the system. The knowledge-driven method has the disadvantage that the new knowledge needs to be fed manually to the system, as the previously deployed knowledge cannot detect the anomalies that are unknown or unique. In short, this method needs to be updated with the process insights, know-how of the experts, and recent operation data to the system.
Plant operation failure and its qualifications are well-studied in the past based on different perspectives. Nowlan et al. [
31] categorized failure into two kinds: functional and potential. Functional failure of a unit operation is its failure to meet a certain performance standard, whereas a physical condition that may cause a functional failure shortly is termed a potential failure. According to Badia et al. [
32], failure can be minor and catastrophic. He explained that the minor failures can be fixed with a simple repair, while the catastrophic ones need a major repairing approach. SS-EN 13306 [
33] defined failure as the termination of the ability of a unit, component, system, subsystem, device, or any part that is supposed to perform a designated operation.
Mechanical failure of a system or a unit operation may be related to its age. The age factor causes degradation of a system through wear and tear effects, which result in a decline in performance and efficiency [
34]. According to Blischke and Murthy [
35], though failure leads to a wide range of consequences, the economic impact is the most common. In process industries, equipment failure leads to many disturbances. It may cause a decline in product quality, long repairing time, high operating costs, customer dissatisfaction, and low availability of a specific unit [
36].
Risk analysis is performed to adopt the corrective actions to avoid future hazards or to minimize the future damages to be caused by an occurred incident. Pham (2011) defined risk analysis as the procedure to gain knowledge about risks, identify the threats, find the cause-and-effect relationship, and conclud the potential risks [
37]. Willquista and Torner [
38] performed the classification of safety analysis methods used in the food production plants, while Stave and Torner [
39] studied the visible as well as the invisible risk factors that cause accidents in food production processes during the operation stages.
The knowledge-based graph and causal search algorithm were proposed by Juan et al. [
40] to diagnose the anomalies in cloud applications. Zafra-Cabeza et al. [
41] developed a risk analysis procedure by analyzing the uncertainties to avoid losses caused by lack of knowledge and uncertainty. Additionally, Pluess et al. [
42] presented the laboratory assessment and risk analysis (LARA) method, which helps an untrained operator to apprehend the potential risks. Zwirglmaier et al. [
43] implemented human reliability analysis (HRA) and probabilistic risk assessment (PRA) to assess the causes of human errors by digitizing the human errors. Esmaeili et al. (2015a) [
44] studied the risk analysis approach in the construction industry, and Esmaeili et al. (2015b) presented a linear model-based risk assessment technique to estimate the type of accidents [
45].
Fault tree analysis (FTA) is an analysis method that allows the determination of the factors contributing to the occurrence of undesirable events and the probability of occurrences. Li and Gao (2020) [
46] indicated the necessity of determining the potential factors and root causes in a system using the FTA method. Liu et al. (2011) [
47] presented a methodology based on FTA to aid the decision-making in an emergency. The FMEA approach has been studied by several researchers and is considered an effective risk analysis tool [
48,
49,
50,
51,
52].
Many studies proposed the integration of FMEA and FTA methods to enhance the results’ credibility. De Queiroz Souza and Alvares (2008) [
53] studied the FTA method to find out the root causes, and their study used FMEA to calculate the risk rate. Khaiyum and Kumaraswamy [
54] manipulated FTA and FMEA to determine the root causes and the risks quantitatively. They also studied how to enhance the efficiency, reliability, and sustainability of integrated projects in the software industry [
55]. FTA and FMEA have been examined to explore the failures in pallet tools in another study [
56], where the correlation between different failures was developed to find out the root causes by FTA, and then the FMEA method was used to calculate the risk rates.
The growing digitalization and industrialization are also leading to occupational accidents every year, which cause thousands of injuries, mutilations, disabilities, and even deaths across the world [
57]. According to Rowe 1977, the risk is the potential of incidents causing negative and unfavorable consequences [
58]. Hence, the risk analysis is an essential step in the manufacturing sites to rule out all the potential causes of future unpleasant events that may result in the loss of capital, reputation, and valuable lives. Chen stated that the implementation of corrective actions is the optimum way to ensure safety at a minimum cost and within a short time [
59]. Risk analysis is being conducted using many methods, but failure mode and effects analysis (FMEA) is considered the most reliable method so far. This study also adopts FMEA to diagnose, detect, and mitigate the risks in fired heaters in a petrochemical plant. This study also combines FMEA with the fault tree analysis (FTA) algorithm to enhance the performance of root cause analysis. The proposed methodologies have been implemented into a real petrochemical plant operation to investigate its contribution to economic benefits and safety improvement.
The data-driven method for anomaly detection consists of developing machine learning models for predicting or detecting any abnormal behavior in the operation. The data-driven approach needs sufficient data, pre-processing of the raw data to rule out the shutdown or irrelevant scenarios and building the models offline, and then deploying the models to an online application for real-time diagnosis of the faulty scenarios. In this supervised monitoring approach, the data are labeled based on different classes, i.e., operating modes or faulty scenarios. For detecting abnormal conditions in a real-time process operation, different machine learning supervised methods can be used, e.g., decision tree, neural network, and support vector machine, etc.
In contrast to abnormal condition detection, RCA applications have been under-explored in the past literature [
60]. Machine learning techniques have been discussed in various past publications [
61,
62,
63]. It has been noted that Bayesian networks and the association rule mining techniques are suitable for data mining and to explore fault scenarios in historical datasets. Statistical process control techniques such as partial least square and principal component analysis are also believed to be effective for root cause analysis. Data-driven models can be trained directly from the data, so this approach can be less time-consuming than the knowledge-driven method, but still, the data-driven approach has pertinent drawbacks, of which the most significant is the lack of ability to recognize new faults that are unknown to the model. In the real-time process operation of a petrochemical plant, the data are not usually labeled, which leads to more human involvement to check and label the data manually, and eventually, the model is updated. The data go through various contexts and domain experts review to avoid any threat to process safety. Insufficient data also reduce the accuracy of detection, and the model cannot recognize the pattern that is not present in the learning data. Therefore, the grouping of similar patterns is needed to deal with unknown patterns.
Data-driven process monitoring was studied and implemented by Nayher et al. [
64], where they implemented the predictive maintenance application in a real industrial process. The data-driven approach collects the data from the real process, and the system interacts with the stored data and the databases to manage the activities defined by the user. This kind of data-driven monitoring platform was believed to be helpful for real process monitoring. The data-driven monitoring approach has been trusted for fault detection and diagnosis for the previous three decades [
65,
66,
67,
68,
69,
70,
71,
72,
73,
74,
75]. Another relevant study has been performed by Han et al. [
76], where they developed a network for intelligent fault diagnosis of rotating machinery. They implemented the developed network on the gearbox, and it was found to be better than deep models in terms of average diagnostic accuracy.
Another approach called the knowledge-based approach is also analyzed in many publications, where it is used to develop a cause-effect relationship [
77,
78,
79] and pattern recognition [
80].
In the current study, FMEA and FTA are linked in a graphical interface to aid the root cause analysis. FMEA and FTA are termed as RCA and Rules, respectively, in the developed application. Manipulating FMEA and FTA in combination offers promising results in complex detection systems. FMEA provides the failure modes and the effects while FTA exhibits a logical relationship between the failure and the high-level events, e.g., upstream or downstream problems. The FTA events are linked to the problems/failures and effects designed in the FMEA. If an event in rules is turned true, the RCA in its prediction mode helps to find out the future problems that are linked to the occurred event. RCA can act in diagnosis mode as well, where it acts in a way to find the root causes on lower levels.
It is also performed to solve the real-time process monitoring problems faced in a petrochemical plant. The study also covers many essential aspects of safe operation and answers several important questions related to anomaly detection. The developed AAA system follows the condition-based monitoring method and stores all the alarms and comprehensively organizes the triggered events based on occurrences, domain equipment, starting time and ending time of the alarm, and maximum, minimum, total, and average duration of a triggered event. The online archiver also provides an easy to configure platform where the operators can filter the alarms based on their occurrence type and minimum duration of occurrence. It helps to filter the alarms that may have occurred for a very small time and have no effect on the safety of the operation.
This system is now able to analyze the process conditions dynamically and greatly reduces false alarms. The dynamic conditions configured in the system can increase the accuracy of monitoring. The present study covers the anomaly detections of three main heaters in the condensate fractionation unit (CFU) that make sure that each scenario is operating in a safe condition. Several scenarios have been designed by the virtue of equipment design data, past knowledge, literature review, industrial best practices, literature review of heaters’ anomalies, and equipment troubleshooting guidelines. Root cause analysis systems, based on FMEA and FTA techniques, have been deployed in the application to intelligently monitor the process. This development has been proved to aid the process automation team in many aspects such as process safety, equipment safety, energy savings through optimization, and an all-in-one platform for decision support.
2. Methodology (Development of Advanced Advisory System for Anomalies)
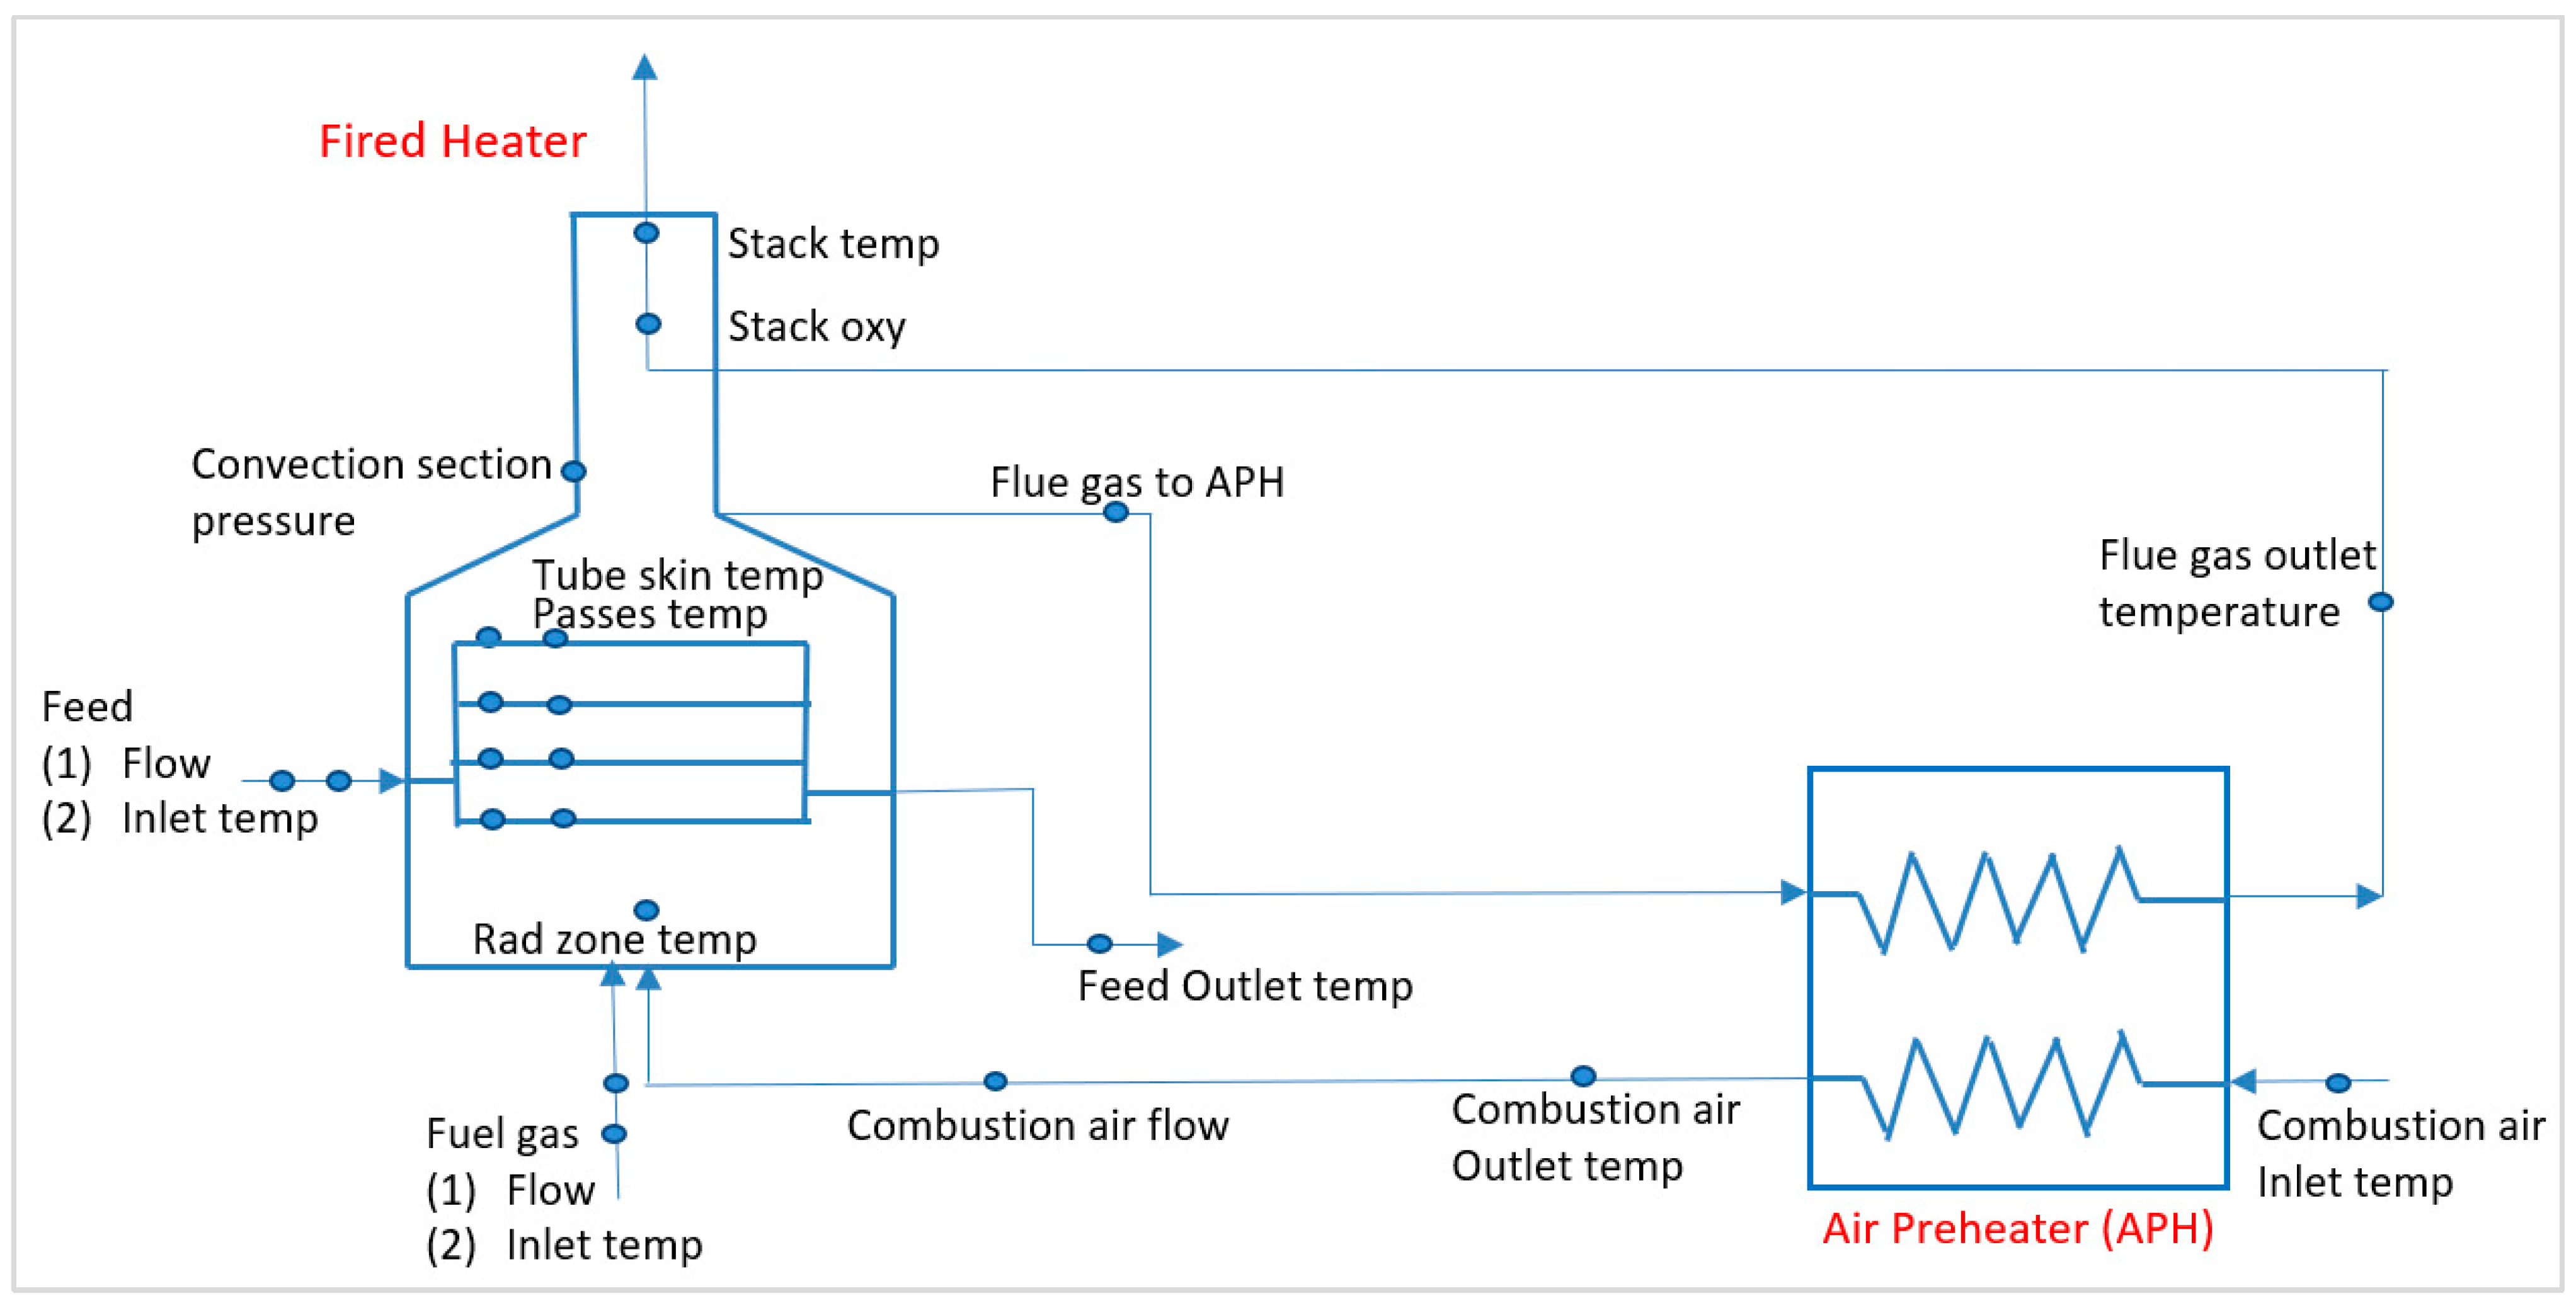
For the development of an abnormal condition management system of fired heaters, the important step is to conduct a thorough survey or building database for the collection of abnormal scenarios that occurred in the past, the process trends over an extensive period, and the monitoring points in the fired heaters.
Figure 3 exhibits the monitoring points focused on for the data analysis and preparation of the FMEA table.
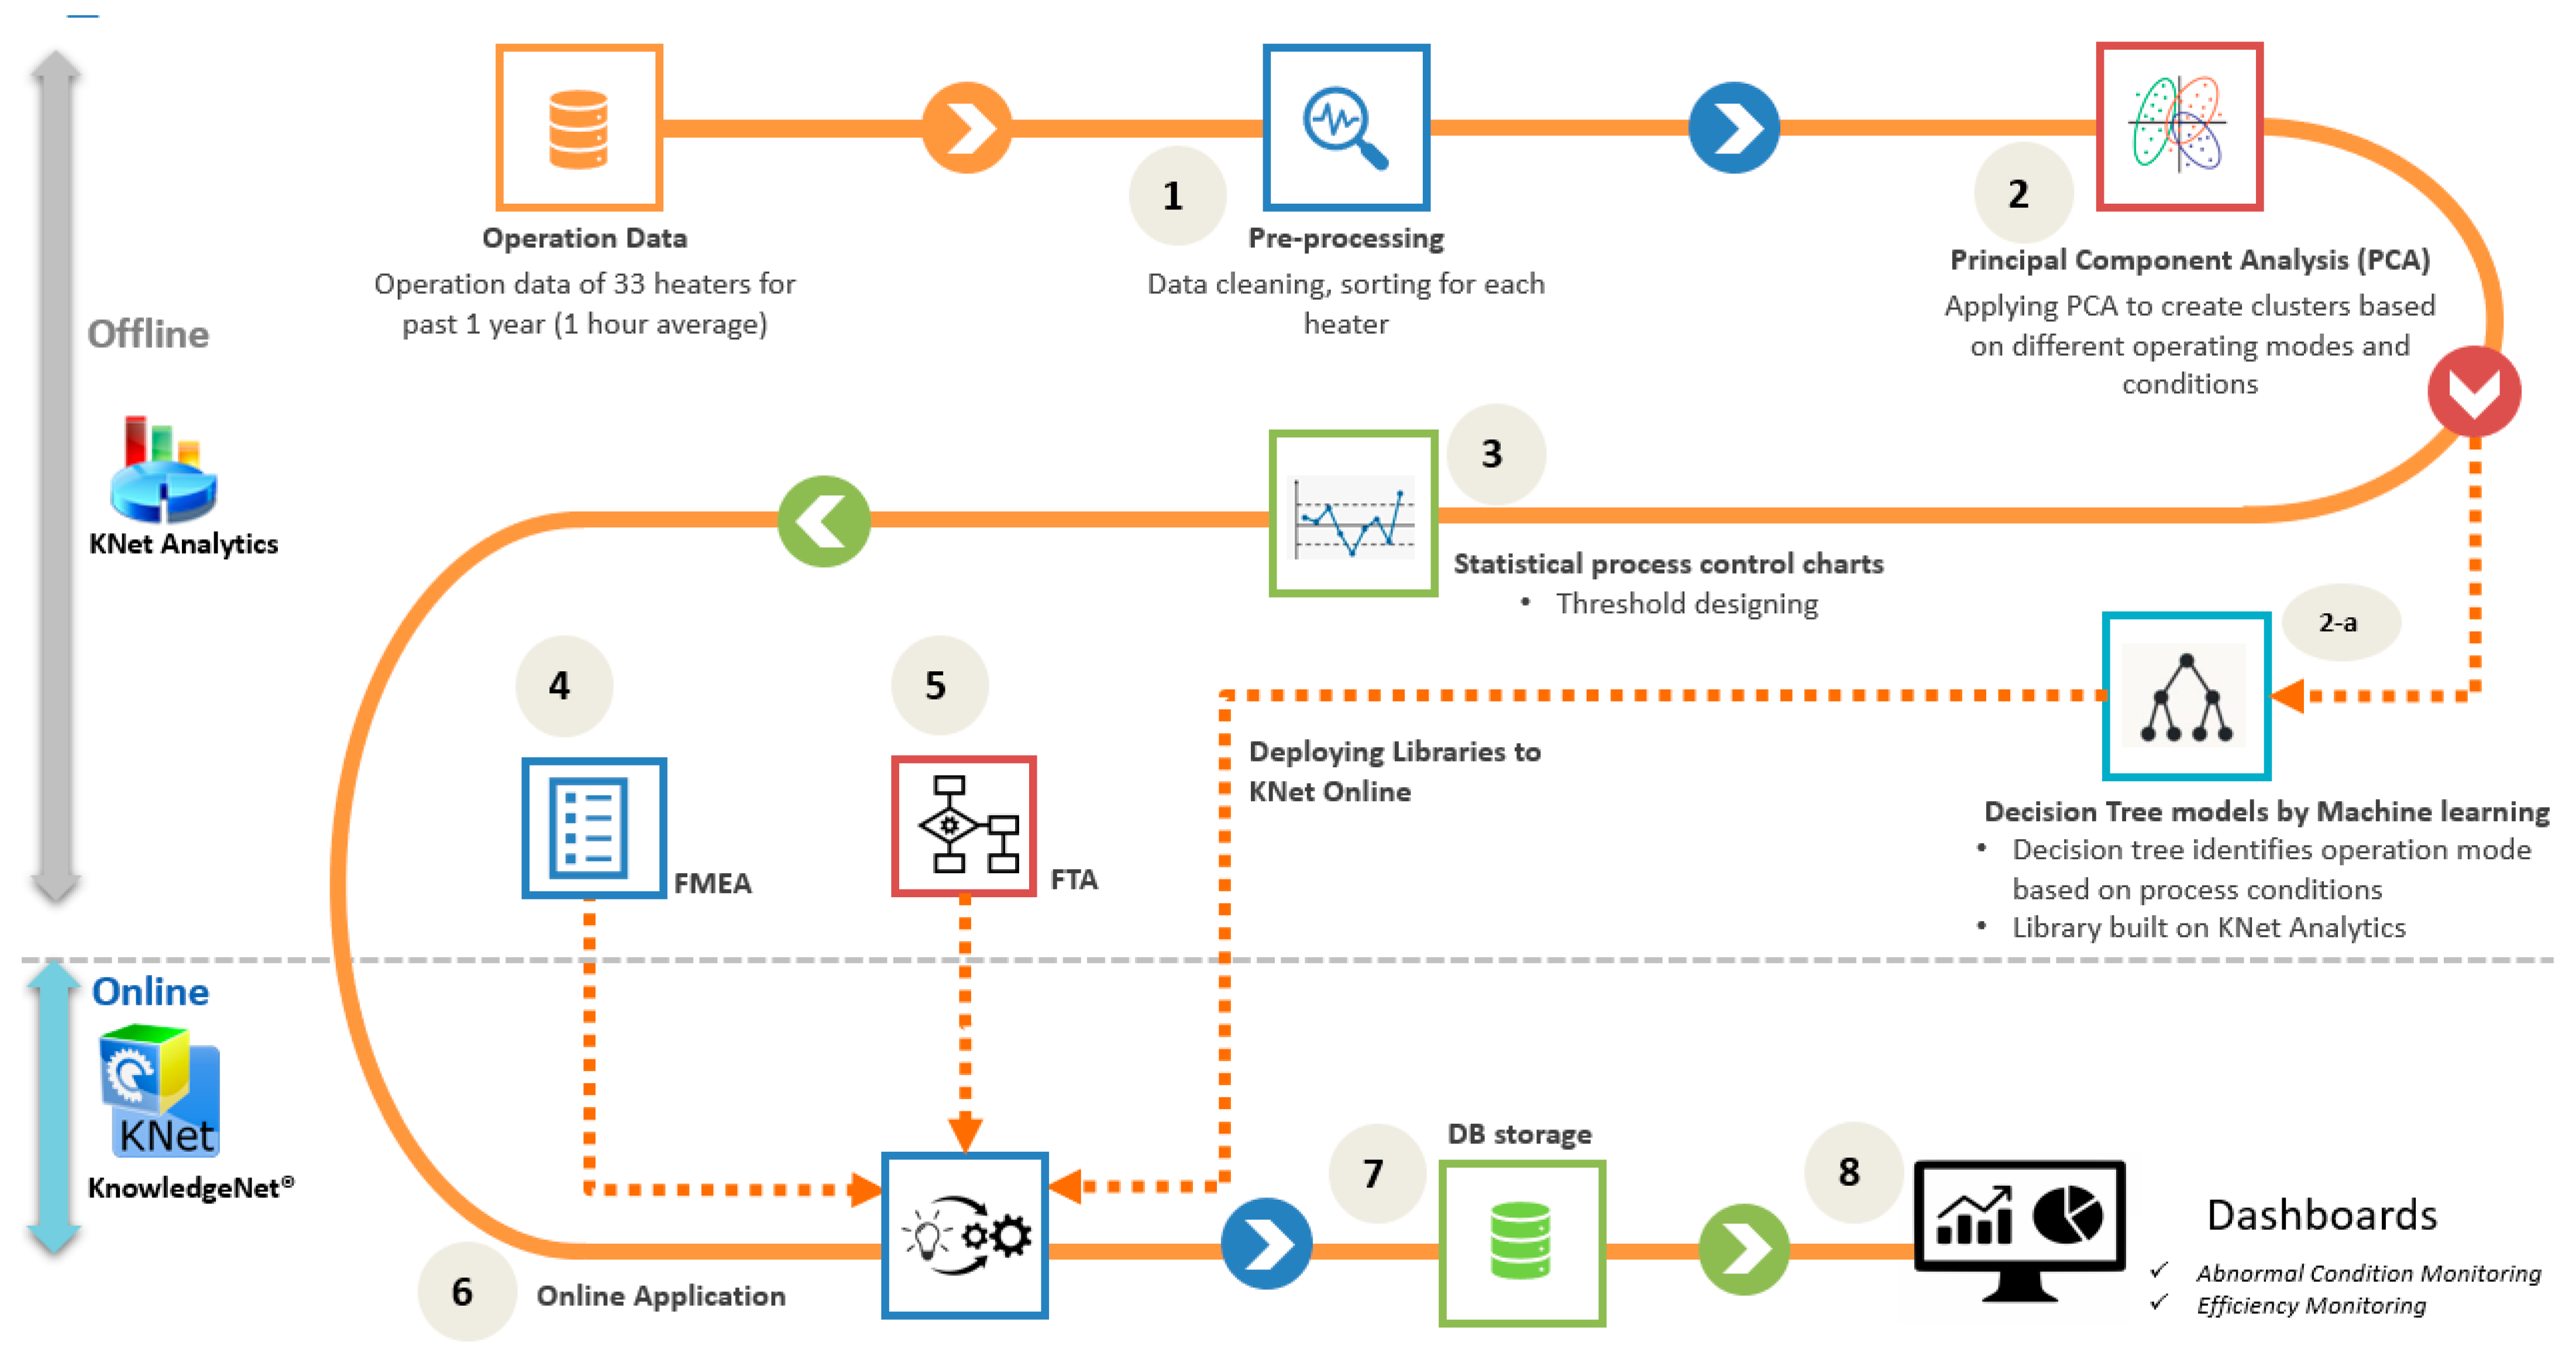
It is evident from the previous studies that the knowledge-driven and data-driven approaches, if deployed alone, cannot ensure accurate predictions. It is proposed in the current study to use both methodologies integrated to make use of the merits of both methods for the root cause analysis of fired heaters’ operation in a petrochemical plant. This integrated system with a database has been illustrated in
Figure 4. This figure explains the tasks performed and the sequence of execution for all the tasks. The system development started with the analysis of the past operation data of the fired heaters. For the data analysis, necessary data-cleaning procedures have been performed to rule out the data related to the shut-down scenarios or the sensor failures. The past operation data have also been analyzed to create the FMEA table to create the abnormal conditions’ detection rules. The FMEA table has been prepared based on expert knowledge and the abnormal process trends found in the past operation data. These data are also useful to find the various operating modes for each heater and the different feed loads based on the raw material and the product specifications. For this purpose, principal component analysis (PCA) has been applied to the cleaned data to identify different grades or modes operated. The PCA identifies the clusters from the data, and these clusters are then transformed into the decision trees for the online monitoring in the AAA system. The decision trees learn the operating modes from the learning data, and the cross-validation has first been performed on the test data before deploying it online. The algorithms within decision trees can detect the modes based on the current tags data from the historian, and this mode detection helps in decision making and deciding the thresholds for the key variables. As the nature of tag values in the process industry is dynamic based on the operating modes, the decision tree makes it efficient to reduce the false alarms by correctly identifying the mode and the boundary for safe operation. The AAA system has been fed with a dynamic set of operating ranges and limits to improve the accuracy of alarms. The dynamic operating limits ensure the process safety and efficiency improvement while needing minimal human intervention. The decision tree algorithms can run online and can interact with complex rules to identify abnormal process trends. Step 3 shows the thresholds designed by using the statistical process control charts, which help to define the dynamic limits for online deployment. Steps 4 and 5 include preparing the FMEA and FTA templates, and then the models are deployed in an online application running all the knowledge-driven and data-driven models simultaneously. Detection results are stored in the SQL database, and interactive dashboards have also been prepared to support monitoring and decision-making.
In the summary mentioned above, Steps 4 and 5 are executed in an offline manner for the preparation of FMEA and FTA. FMEA includes building RCA (root cause analysis) trees from expert knowledge, and FTA is built by the complex rules built in the Rules module of KNet application. Finally, both FMEA and FTA are integrated and deployed in the online application.
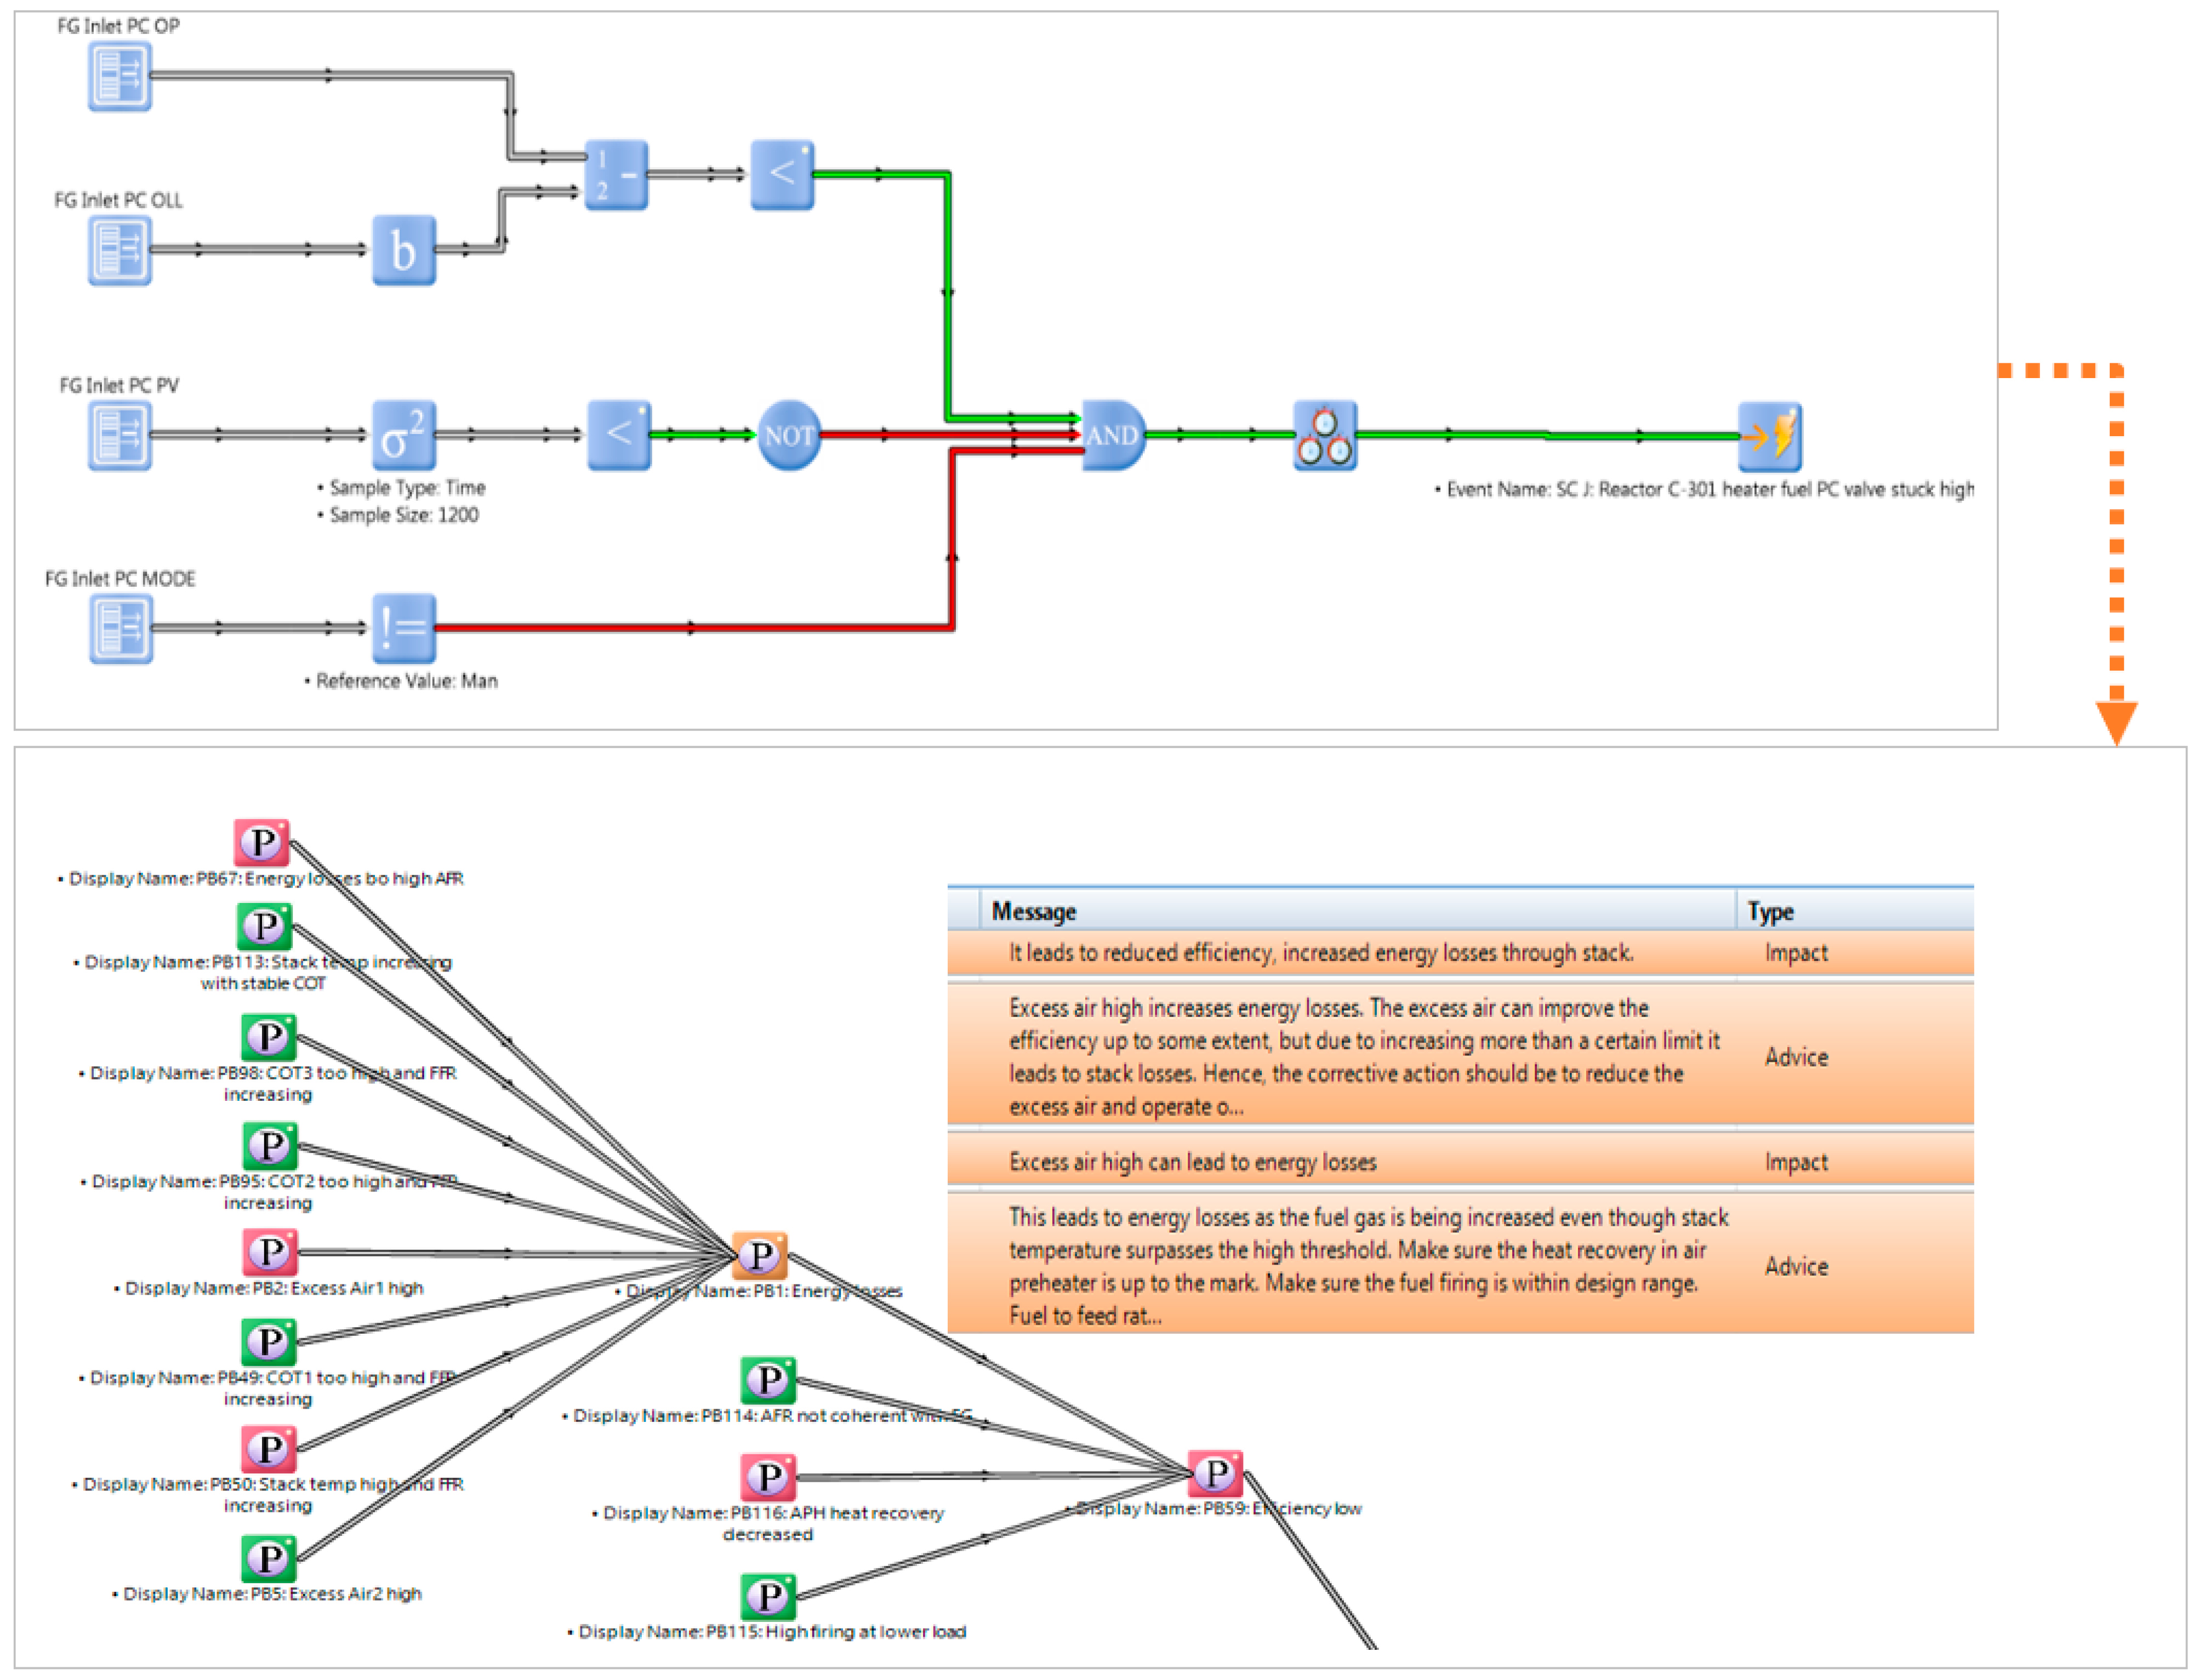
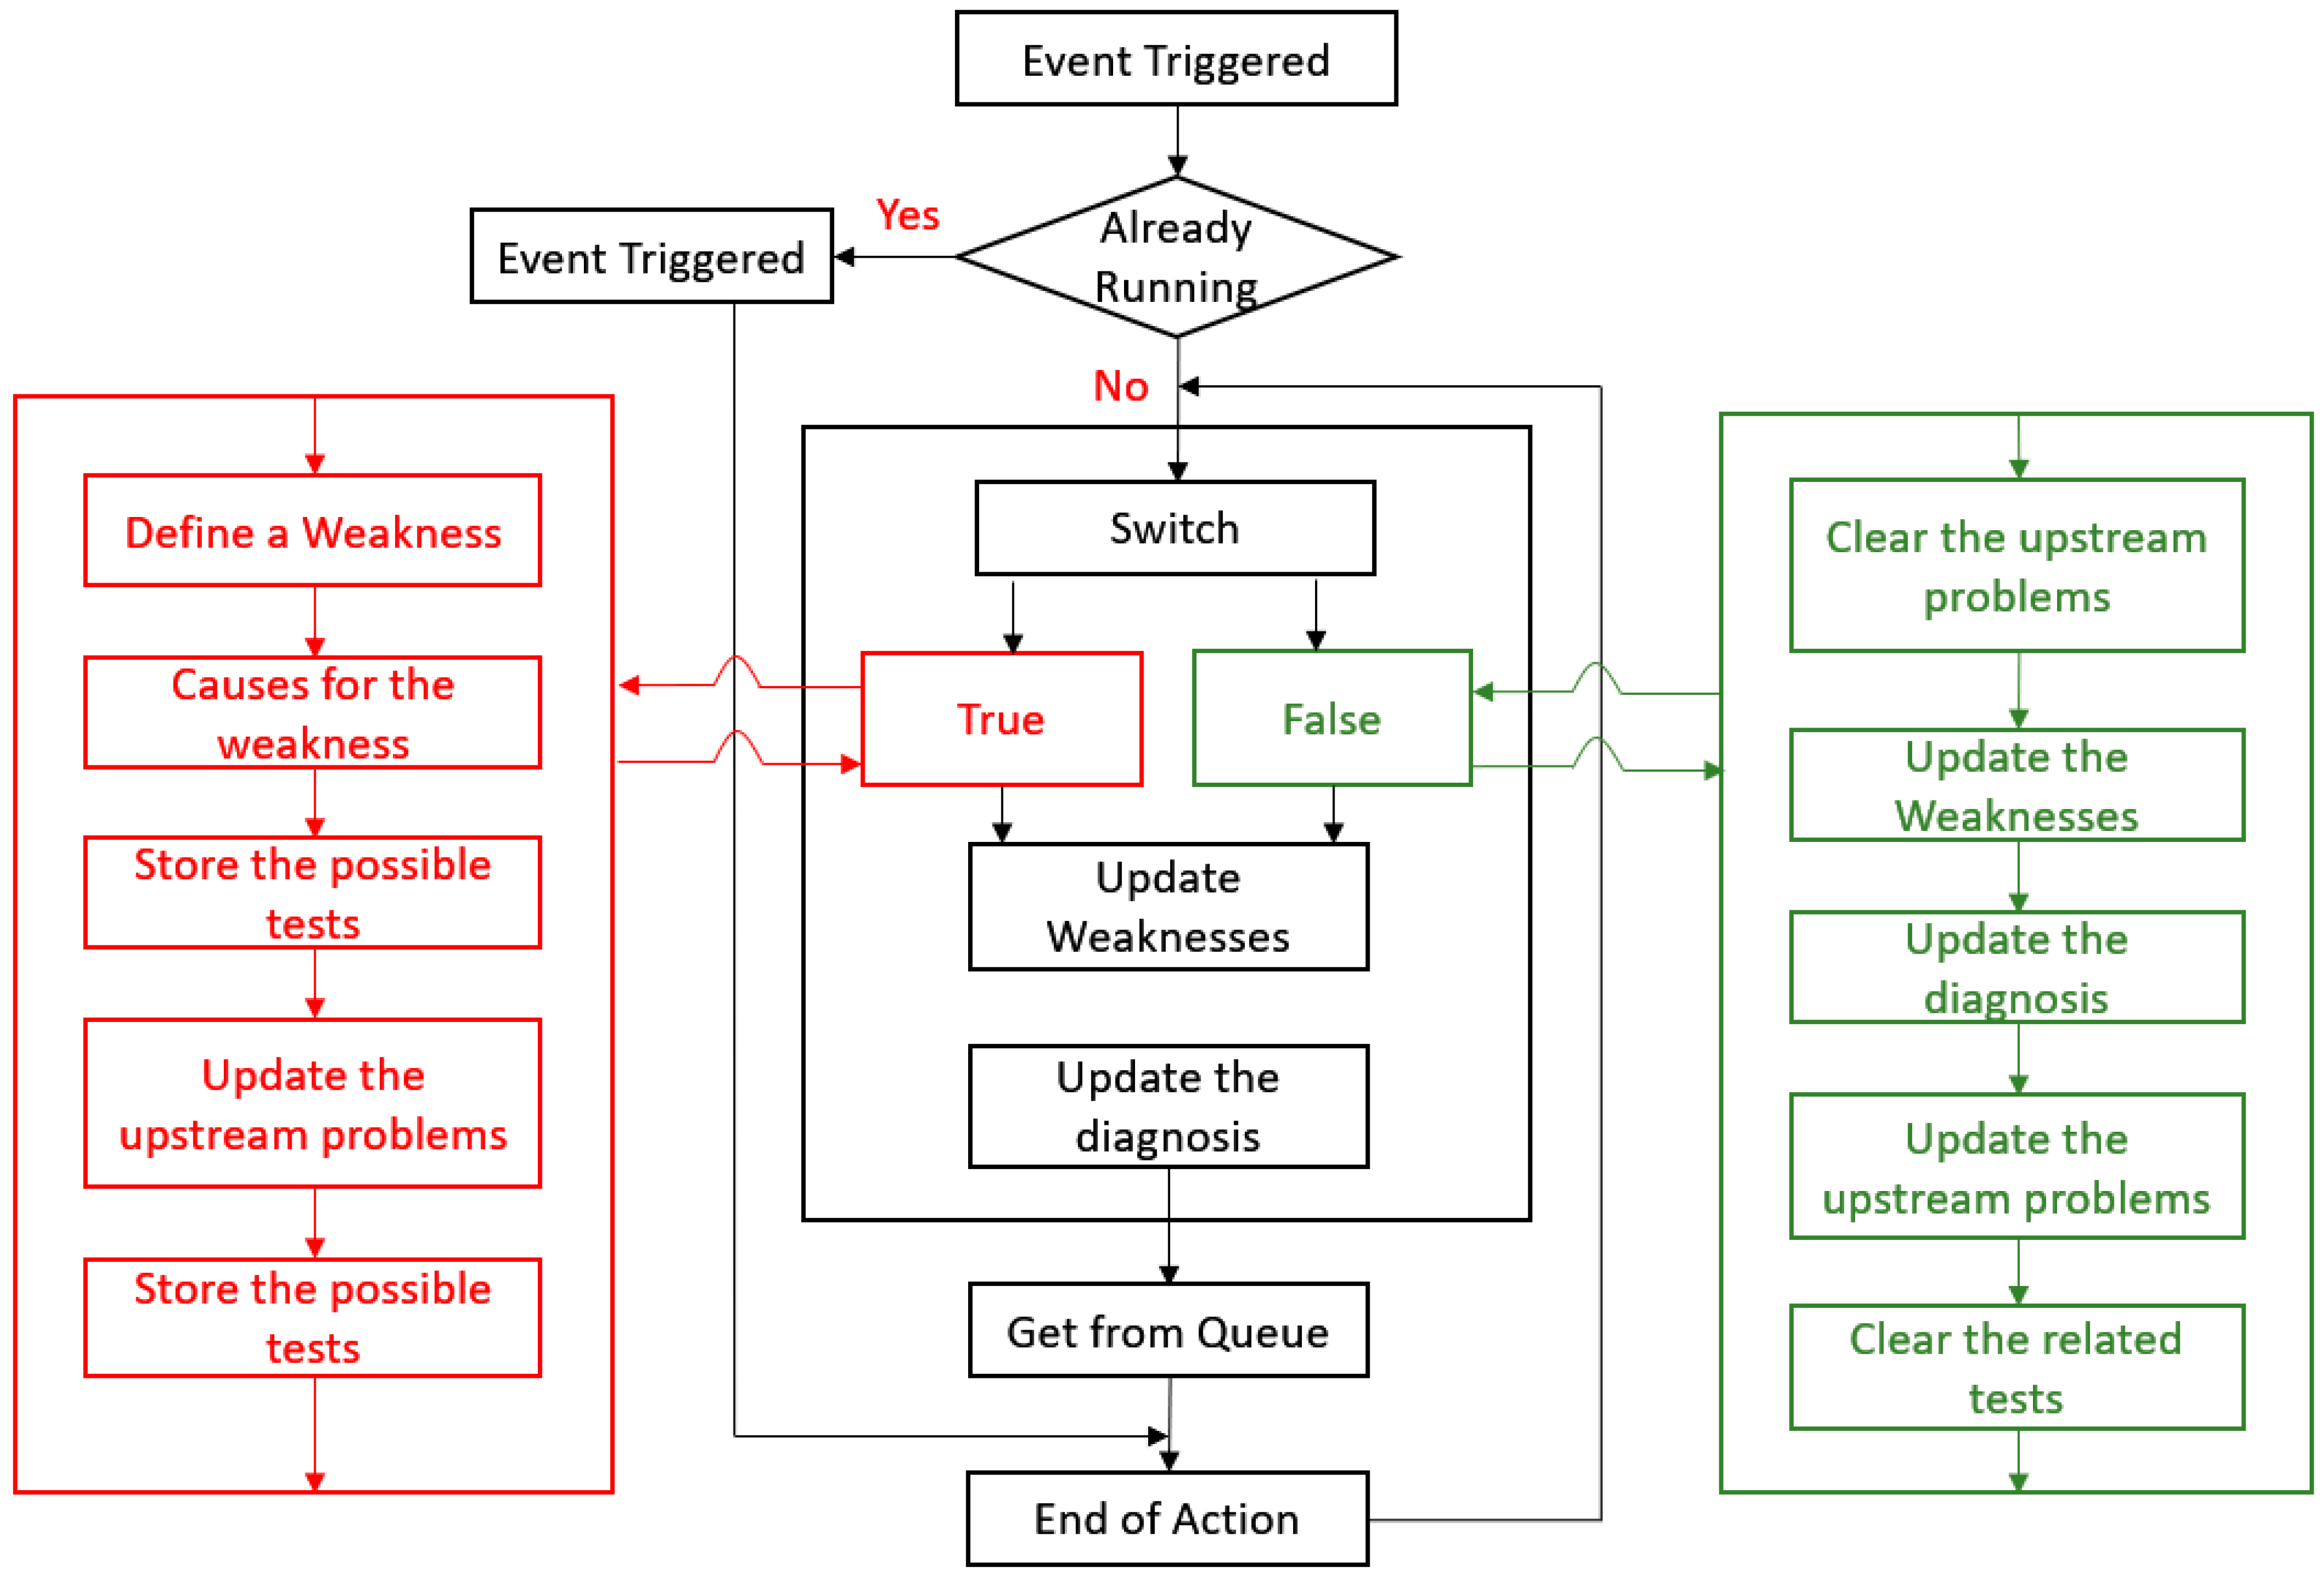
Figure 5 illustrates the procedure of triggering the events after an abnormal condition has been detected as true by the rules, and then the connected events in RCA are triggered to find the root causes and the parent problems to support the decision making promptly. This combination of FTA and FMEA speeds up the corrective actions to stabilize the process. The detection of operating modes has been illustrated in
Figure 6. The abnormal scenario or the operating modes are classified by the user, and this supervised classification is then transformed into decision tree models that possess the algorithm to define the operating mode based on the real-time operating data.
The Knowledge Net (KNet) platform used in this study is an intelligent software framework that monitors and manages complex tasks and operations in a plant and provides a decision support system to cope with emergency situations. It also helps to predict the abnormal conditions based on knowledge-based root cause analysis trees. The root cause analysis tree explores the symptoms and the root causes by using complex rules and logics. This platform can collect and interpret the process data and knowledge scattered across the plant in different automation platforms such as distributed control systems (DCS), supervisory controls and data acquisition (SCADA), laboratory information management systems (LIMS), plant data historians (PDH), alarm databases (SOE), and enterprise resource planning (ERP), etc. This application not only diagnoses the faults and deficiencies in real-time but also manages the anomalies with comprehensive decision support until the resolution of the occurred issues. It calculates the process’s key performance indicators, detects the faults, manages the plant-wide performance ensuring plant safety, and explores the areas for profitability improvement.
This study manipulates a knowledge-building platform where the root cause analysis can be employed to efficiently predict the faults and guide the operators, engineers, and managers in making the best decisions promptly. The timely actions are an important factor in plants to avoid accidents that otherwise may lead to a loss of capital and lives. The graphical views of all the information, complex rules, and workflows inside this application provide a user-friendly platform to keep knowledge easily available.
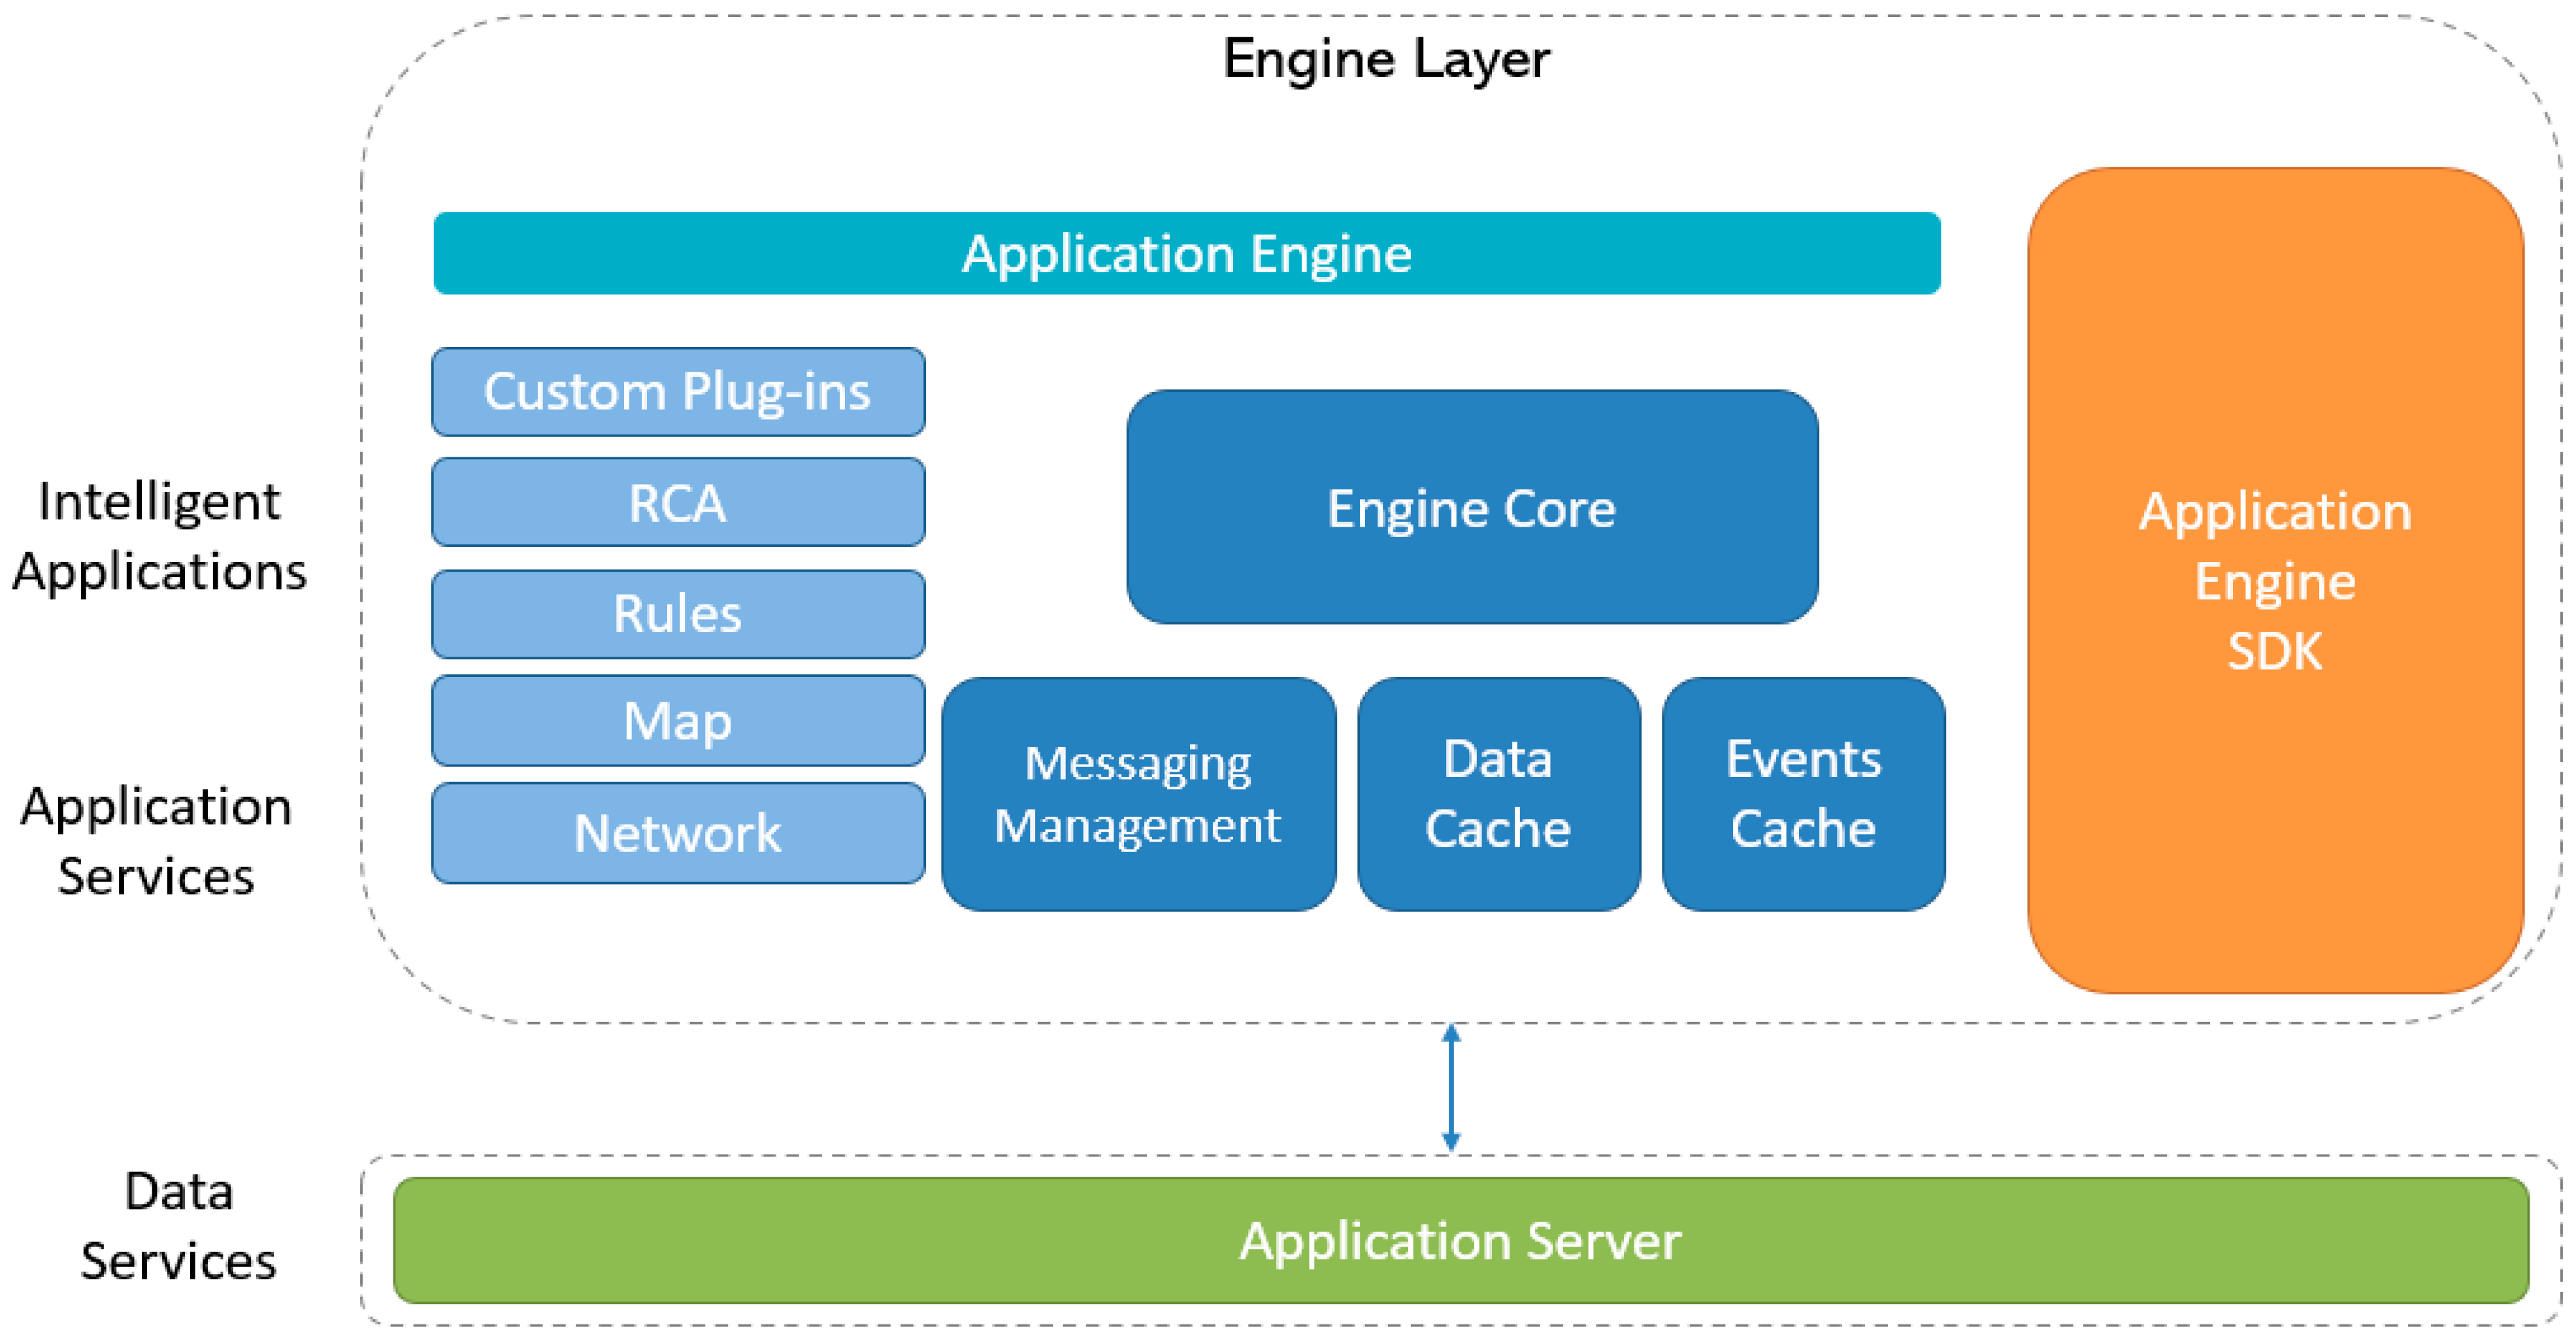
The complex rules module helps to build graphically linked rules and diagrams to collect the scattered process data and provides relevant calculations that can be manipulated in several ways. This module automatically performs calculations by collecting statistics, temporal reasoning, logic rules, and online data and detects symptoms, faults, or anomalies by using event detection diagrams. The architecture of the application engine is shown in
Figure 7. In the current study, this module has been utilized to calculate key performance indicators and to detect complex events by monitoring the heater’s process variables and the designed conditions. For this purpose, rules and equations were built based on a wide range of functions, i.e., arithmetic, data filers, logic gates, temporal gates, standard deviation, rate of change, and the data acquisition and data insert, etc.
Though the failure in a production plant cannot be utterly avoided, the cause and effects can be monitored carefully to minimize future issues or to be ready for corrective actions. The decision-making always starts from fault analysis and identifying its root causes. Without proper analysis of failures, one cannot decide the future corrective actions. Hence, the knowledge, common practices, and past failure data of any specific operating unit are important for troubleshooting the failures, classifying the root causes, and judging the criticality of an occurred event. For these purposes, a well-studied and recognized failure analysis tool called failure mode and effect analysis (FMEA) is helpful. FMEA can not only be used as predictive tool to prevent problems and to ensure reliability at the design stage [
81] but also be used in the operation phase to predict and diagnose future performance-related issues or accidents [
82].
The root cause analysis procedure has been deployed in the current study to look deeper into real-time operation to find out the root causes of an abnormal condition. It helps to establish an approach to figuring out and resolving the real causes first to ensure the plant’s safety and maximum performance. It provides a comprehensive analysis and predicts future problems if the real causes are not attended to on time. The diagnosis of the root cause and its solution is a better approach to uproot the problem as fixing only the symptom results in the problem reoccurring most of the time. Automated root cause analysis is based on the fault model technique to logically model the relationships between the events. The fault model is constructed based on cause-and-effect logic, and the fault model based on the connected events can monitor the real process operations. If an event is triggered as true, the fault model will explore the root causes by diagnosis mode. It can also operate on the prediction mode to raise an alarm for future problems beforehand. Hence, the automated root cause analysis can greatly reduce the cycle time to predict and diagnose the deviations in a real-time operation. The fault model synthesis methodology in the current study is explained in
Figure 8 below:
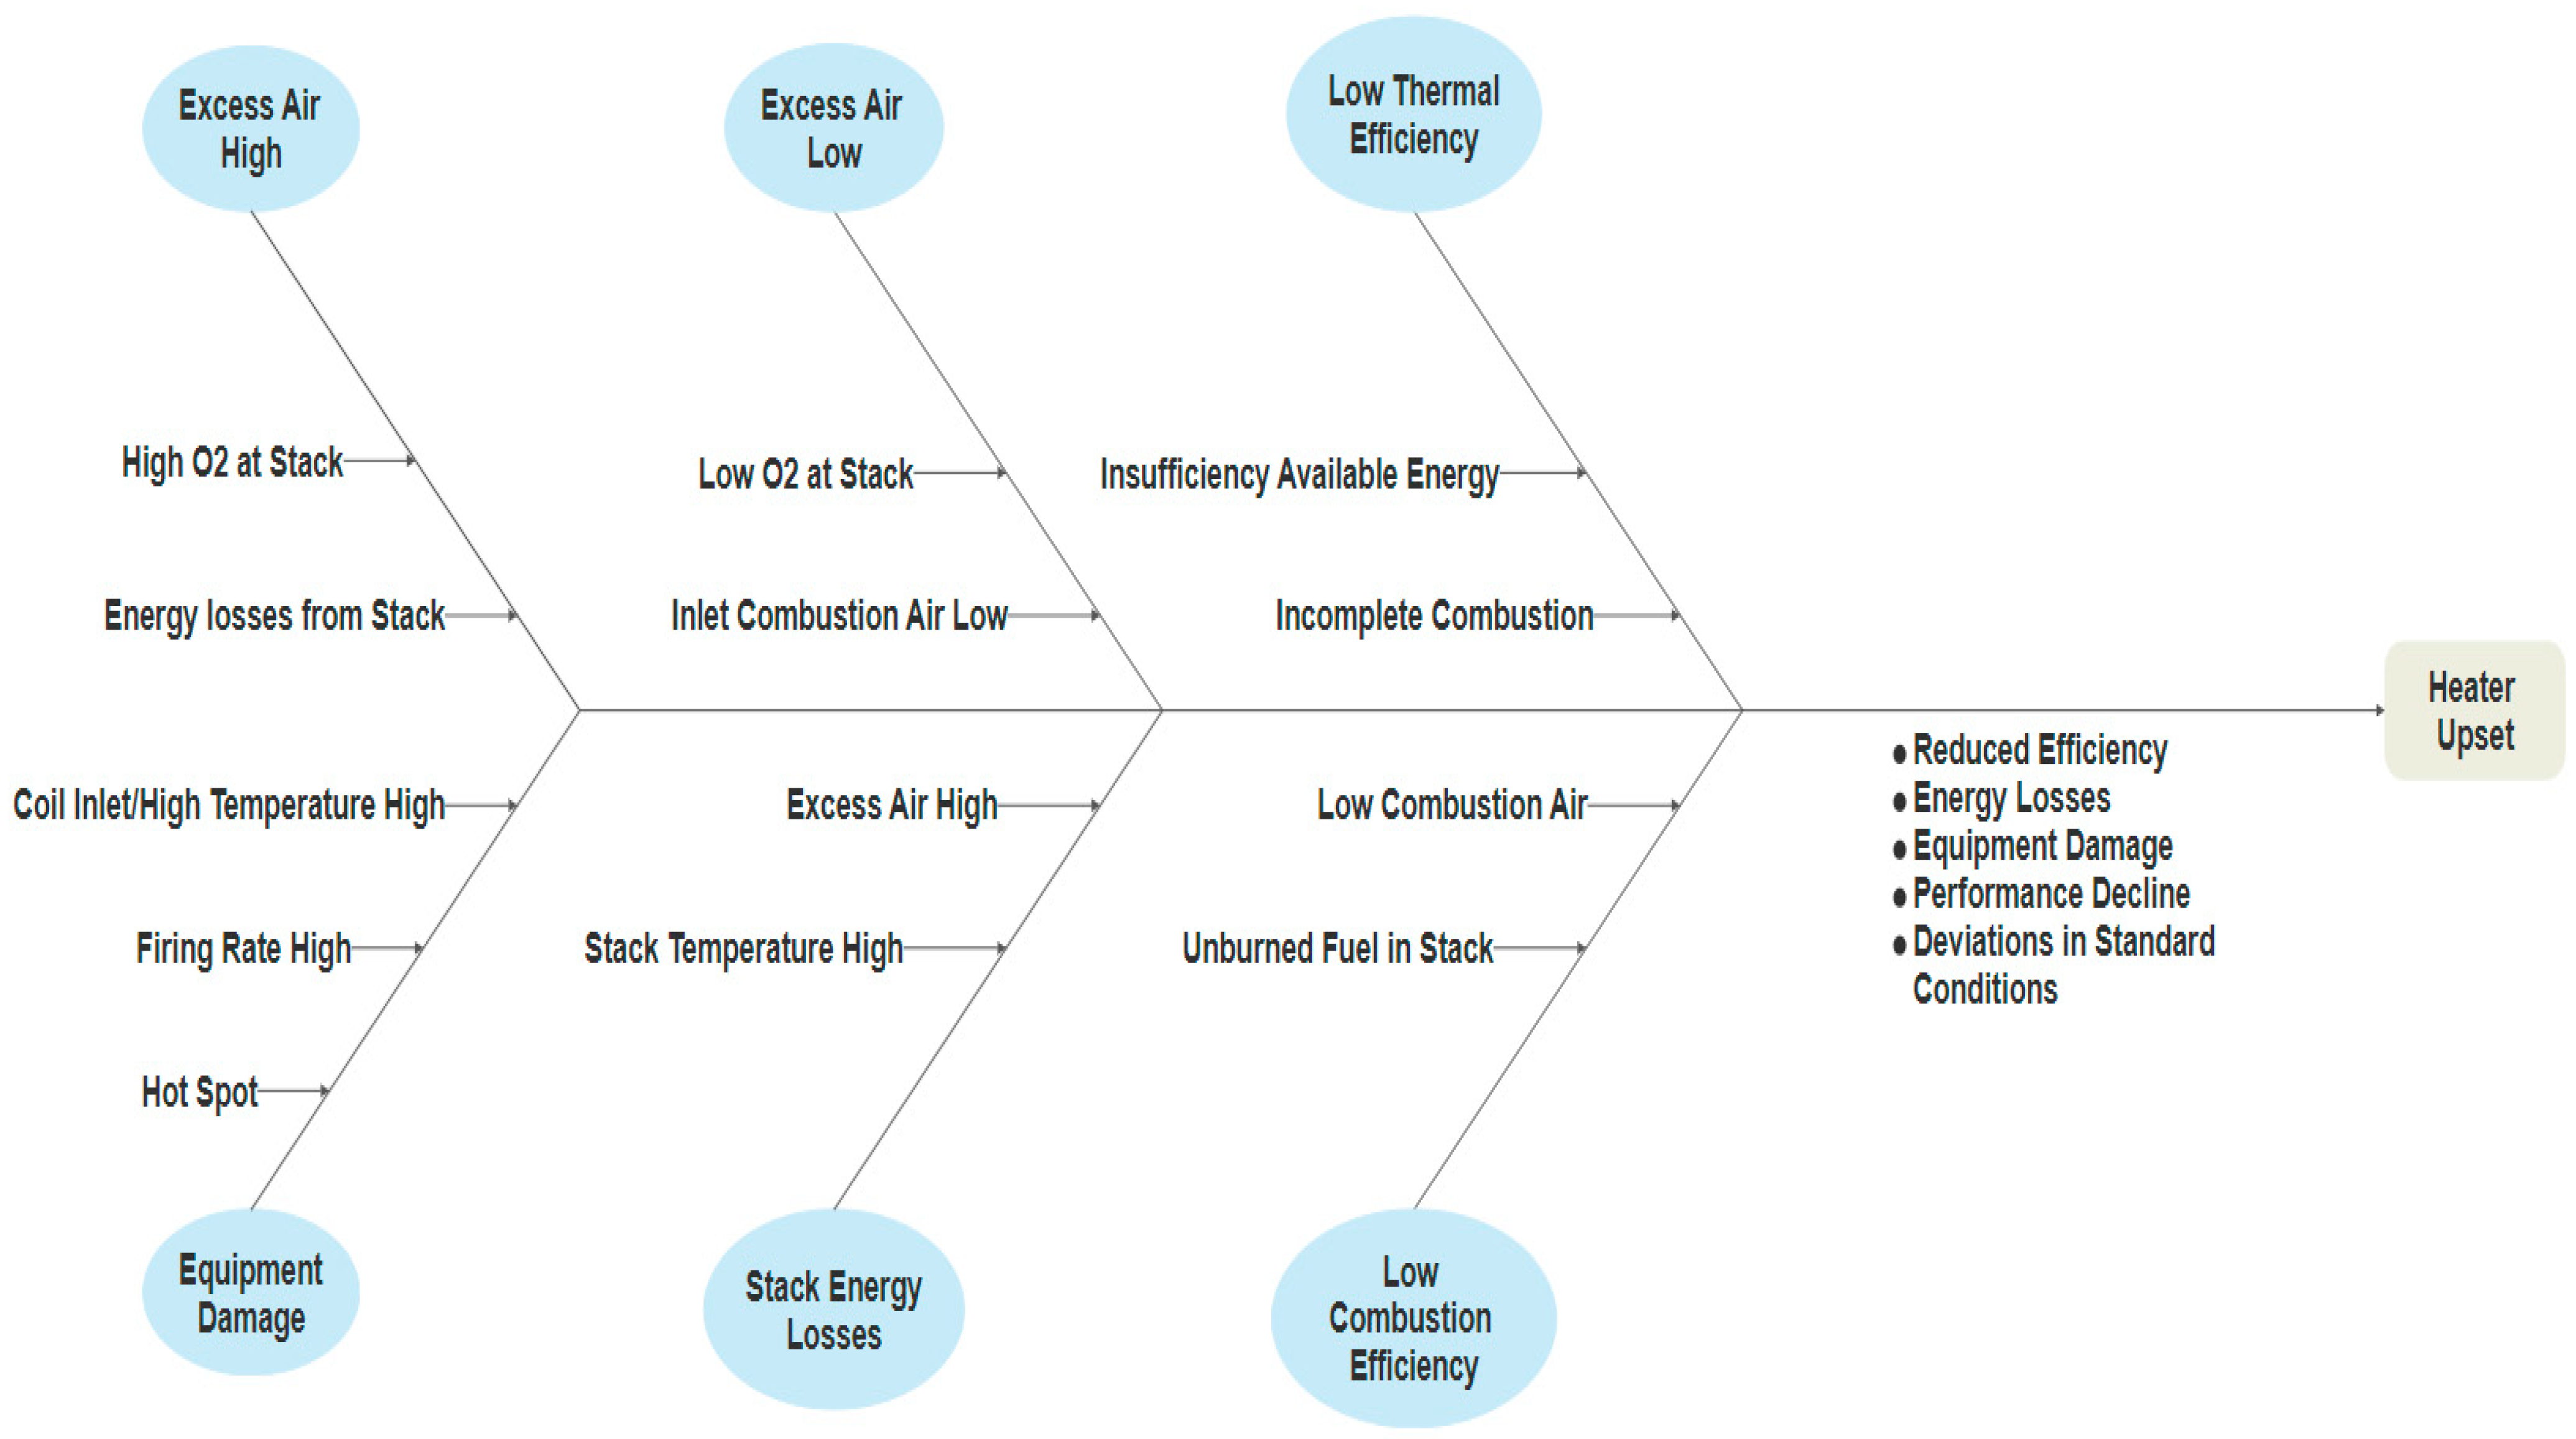
The abnormal condition diagnosis is based on a graphical tool to explore the relationship of symptoms and root causes. The cause-and-effect diagram can also be called a fishbone diagram or Ishikawa diagram due to the resemblance [
83]. The cause-and-effect diagram identifies all the problems that affect the performance of an operation [
84,
85].
This diagram summarizes all the symptoms and root causes that may occur in a plant unit operation. As this study focuses on the root cause analysis and abnormal conditions of a fired furnace, a comprehensive literature review and field study have been conducted at a petrochemical plant to explore the reasons for furnace performance decline. The abnormal conditions such as hot spots, excessive firing, incomplete combustion, unburnt fuel in the stack, forced draft pump failure, low combustion air flow, uneven heater skin temperatures, unbalanced pass flows in tubes, unbalanced heat duty of passes, excessive firing during reduced load, low/high excess air, and high stack temperature, etc., are studied, and the effect of abnormal conditions on the heater’s efficiency are analyzed. Moreover, the relationship of abnormal conditions to the KPIs (key performance indicators) of a heater is also explored to develop a monitoring platform that ensures the maximum performance of a fired furnace.
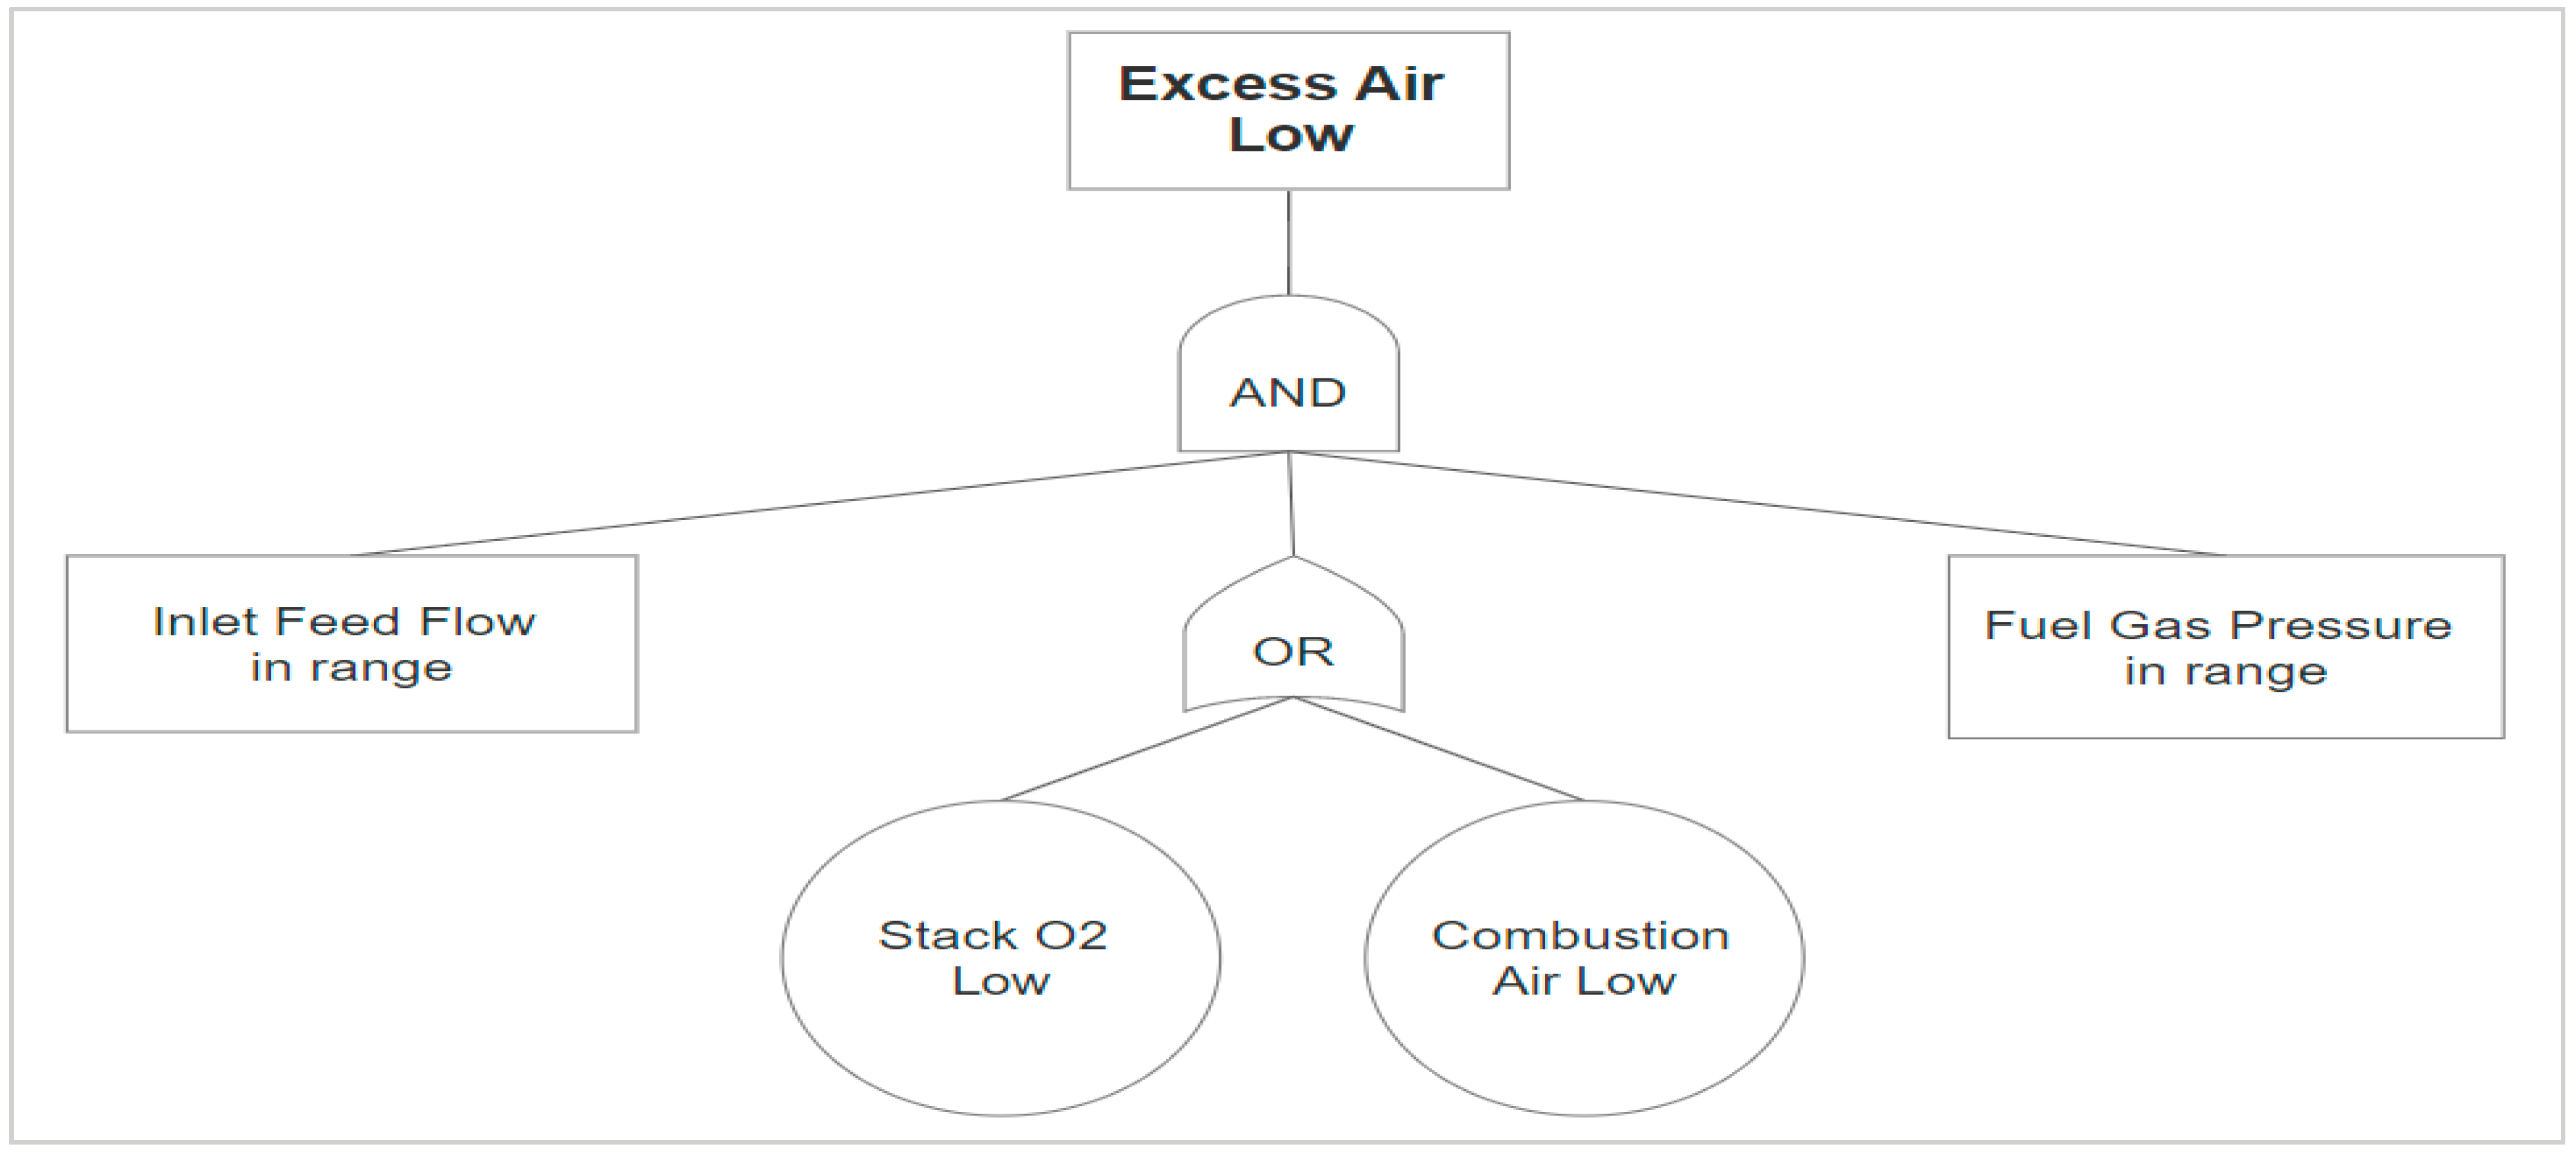
Figure 9 explains the cause-and-effect diagram designed for a fired furnace, while
Figure 10 and
Figure 11 illustrate the basic principle of designing the rules for the abnormal conditions.
Different operating limits have been defined for each fired heater as the fired heaters vary in operation based on production target, capacity, or the nature of the feed being processed.
Table 1 summarizes a sample scenario to prepare a database based on problems, related tags, or properties and their high and low limits to configure in the complex rules for online detection system.
The developed application is applicable to connect external databases and read and write whenever needed by the process engineers or operators. In the current scope, the fault events are recorded to the SQL database. The database storage makes the monitoring task much more convenient and efficient. The dashboards are designed on independent programs to see the online results. The events’ names, status, fault states, and time stamps can be recorded to a specified table and the data storage frequency or the update rate can be configured within the developed application according to the end-user requirement.
3. Results and Discussions
In the present study, fired heaters’ complex detection rules for abnormal conditions have been designed, and results are presented about the detected faults and abnormal conditions. The developed system has been implemented, validated, and tested in the petrochemical plant. After the successful connection to the servers, online data sources, and databases, this intelligent system has been run and tested for three months. The test results show that the system has been effectively detecting and predicting complex scenarios, and it aided the engineers in troubleshooting the complex events.
Table 2 summarizes the results containing the problems and their activation counts over the assessment period for a single fired heater. The dashboard for abnormal conditions is also prepared to be integrated with the database to show the event count based on the filtered status, time period, and priority of a problem to take prompt action.
Figure 12 depicts the results of efficiency analysis for all the fired heaters studied in this work. The efficiency dashboard helps the end-user to analyze the best heaters in terms of efficiency improvement, and the fired heaters with maximum efficiency decline can be monitored through the interactive dashboards. The standard deviation and range analysis for efficiency are helpful to identify the fired heaters with unstable operation.
With the given configuration, the events are activated only when the fired heater is under operation. During the plant shutdown or maintenance period of the fired heater, the developed system avoids the false alarms, as the fault tree analysis design is based on minimum flow condition, and the input conditions are configured with AND logic. Hence, if the feed flow or the fuel gas pressure is in a certain range, only then will the fault provoke an alarm. This kind of configuration is helpful to reduce the false alarms that otherwise will be a burden on an operator, and it mostly results in ignorance of very important alarms. Therefore, paying close attention to alarms and carefully handling the logics can greatly reduce the burden on operators, and it also ensures process safety.
The scenarios based on safety and efficiency are studied deeply by the collected results. The event counts have been analyzed, and the key problems have been attended to very carefully. The events such as high stack temperature, radiation zone temperature decline, high excess air, and the tube pass maldistribution are the high-priority events in the studied heaters.
Activated events have been recorded to the SQL database to take timely action and carry out alarm analysis. The high-priority events have been analyzed by an in-depth study of real operation data. The real process trends and the recorded events have been compared for the validation of the results. The data analysis shows that the recorded events by our developed AAA system are accurate and validated. The high-priority cases detected by the advisory system are high stack temperature, radiation zone temperature decreasing/incomplete combustion, excessive stack oxygen, and maldistribution in tube passes. The aforementioned problems were investigated based on real operation data, and it was confirmed that these triggered events may cause a decline in efficiency. Moreover, the safety-related cases were also closely monitored by the developed system, and it has been inferred that no safety-prone event occurred during the validation period.
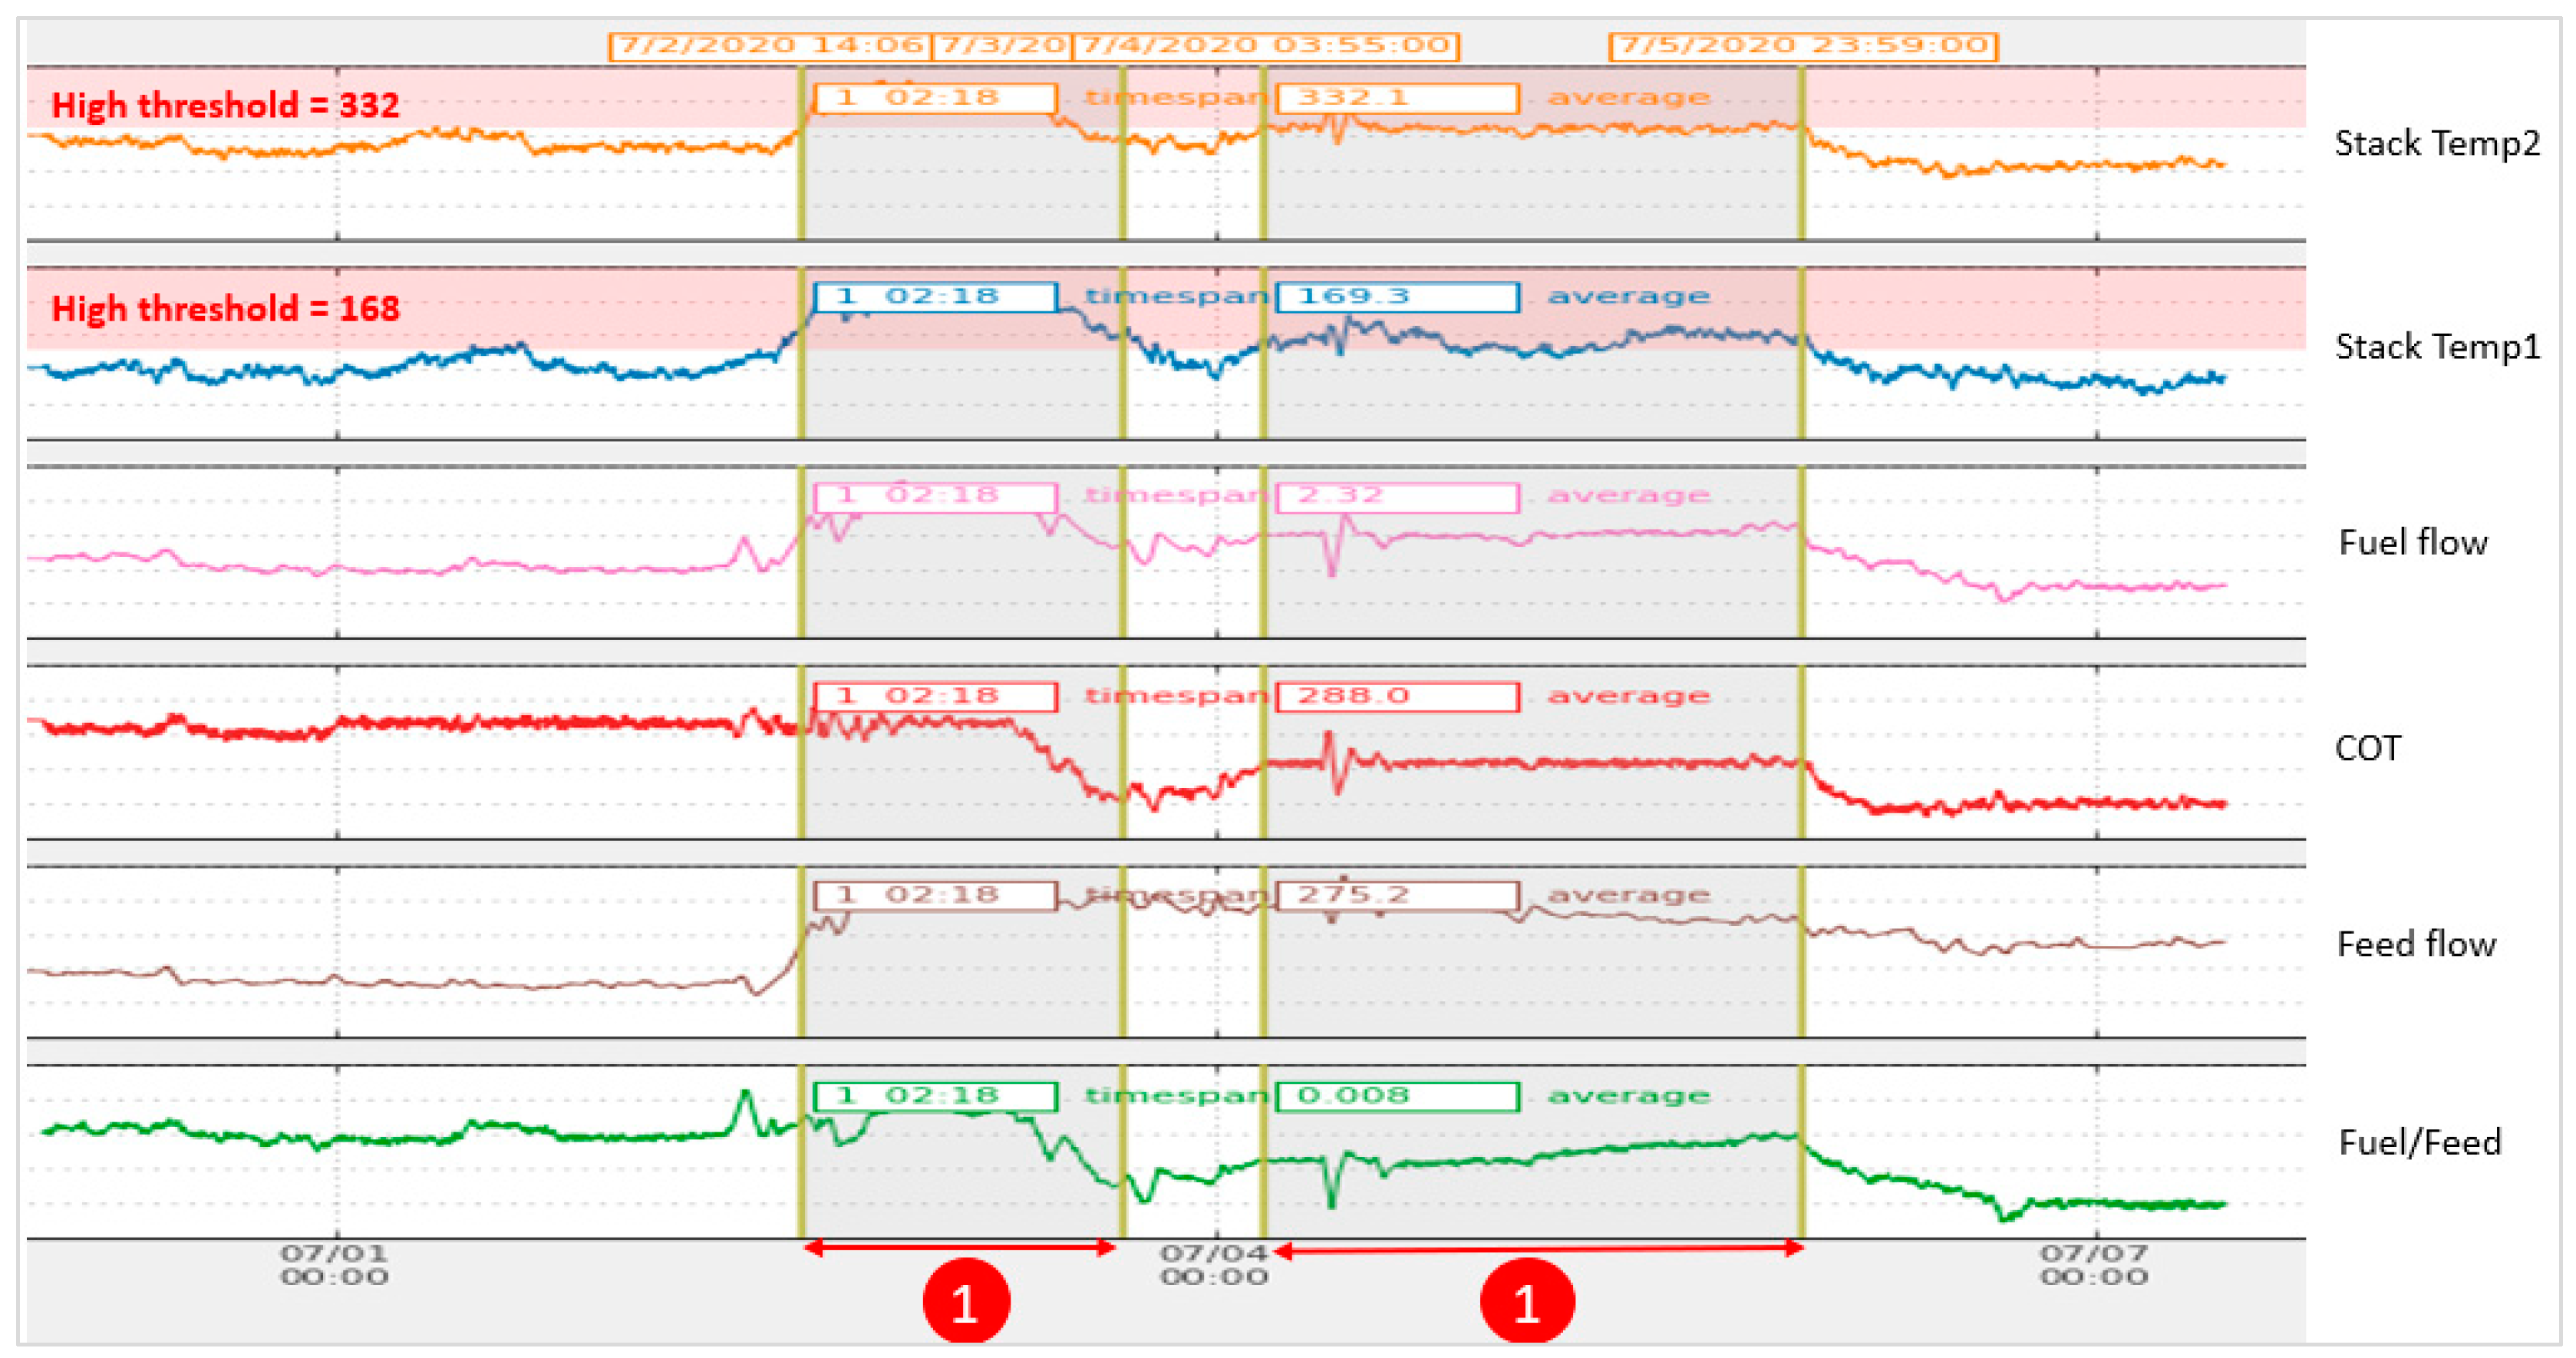
In the developed system, the stack temperature events occurred in the scenarios where the temperature exceeded the design range, and the fuel-to-feed ratio increased simultaneously for a defined amount of time. The conditional monitoring and detection mechanism is the unique capability of the developed platform. By using the conditional monitoring mechanism, the system does not respond to the exceeding threshold only; rather, the system intelligently looks for other conditions such as fuel-to-feed ratio to decide whether to alarm the situation or not. The condition monitoring greatly reduces the false alarms in a plant where the grade changes are the usual practices in daily operation, and any such grade change may lead to false alarms, as the variables exceed the defined normal range in a grade change procedure. To reduce the false alarms, additional conditions are defined based on the expert knowledge and experience of operators and engineers. The current tested application has a built-in fired heaters’ library containing additional conditions to rule out the false alarms. The conditions can also be updated in real-time operation by the user, as the application supports overwriting in runtime mode.
Operation data related to stack temperature high events are illustrated in
Figure 13. The shaded areas (indicated by number 1) highlight the data where the stack temperature exceeded the high thresholds, which are 168 and 332 °C for the first and second stack temperature, respectively. The system monitors the additional condition of fuel-to-feed ratio during these areas, and if the fuel-to-feed ratio is increased in real operation, the system raises an alarm to avoid increasing the fuel-to-feed ratio to reduce the energy losses. The increased fuel may lead to serious damage to the equipment and leads to energy losses through the stack.
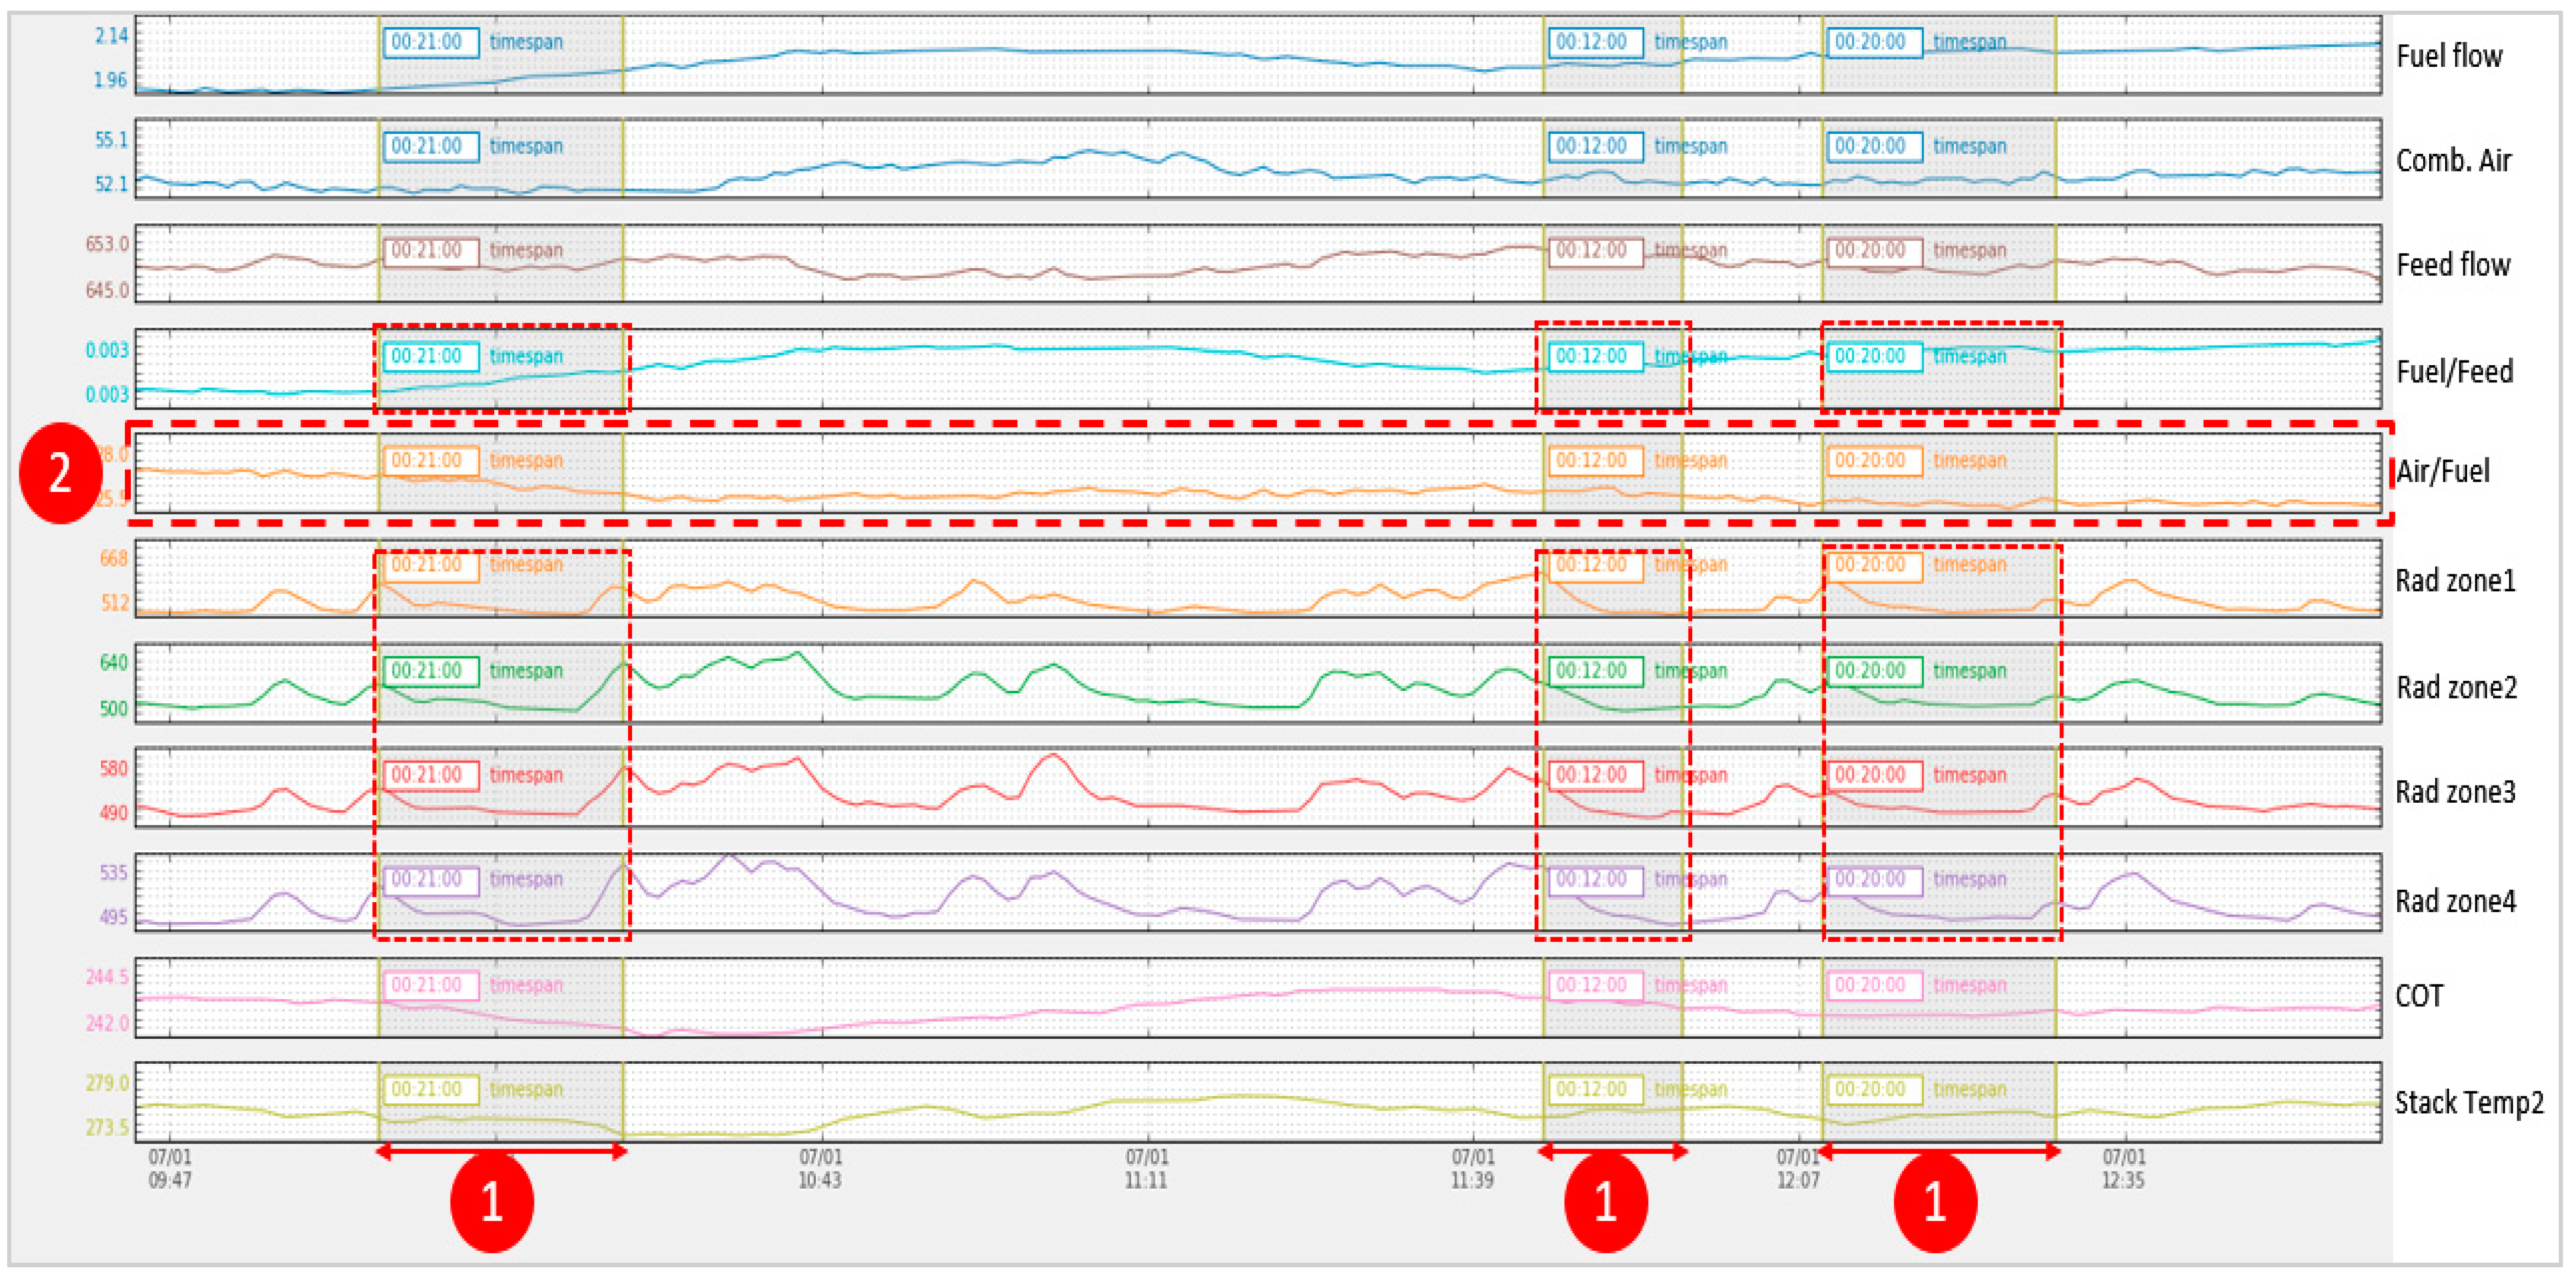
The “decreased radiation zone temperature” events are explained in
Figure 14. The detection rule is based on decreasing radiation zone despite increased fuel-to-feed ratio. Incomplete combustion is suspected to be the cause of decreasing temperature in the radiation zone. The decreasing temperature in radiation zone is a process abnormality given the fact that the fuel-to-feed ratio is increasing at the same time. The developed system in the current study has efficiently detected such events, and real-time alarms were raised to alert the management about suspected incomplete combustion. The skin temperature tags also showed the same decreasing trend following the temperature decline in the firebox.
Figure 14 shows the shaded area (indicated by number 1) that explains three of the occurred events that remained active for more than 10 min. The air-to-fuel ratio in the dashed area, indicated by number 2, proves that the decline in combustion air was the cause of the temperature decline. The increasing amount of fuel must have a correct balance with combustion air to ensure complete combustion, otherwise, incomplete combustion may occur. The incomplete combustion scenario is considered a dangerous event as the unburnt fuel may collect in the heater and may catch fire, causing serious damage to the facility. The unburnt expensive fuel leads to loss of capital and is a threat to plant safety.
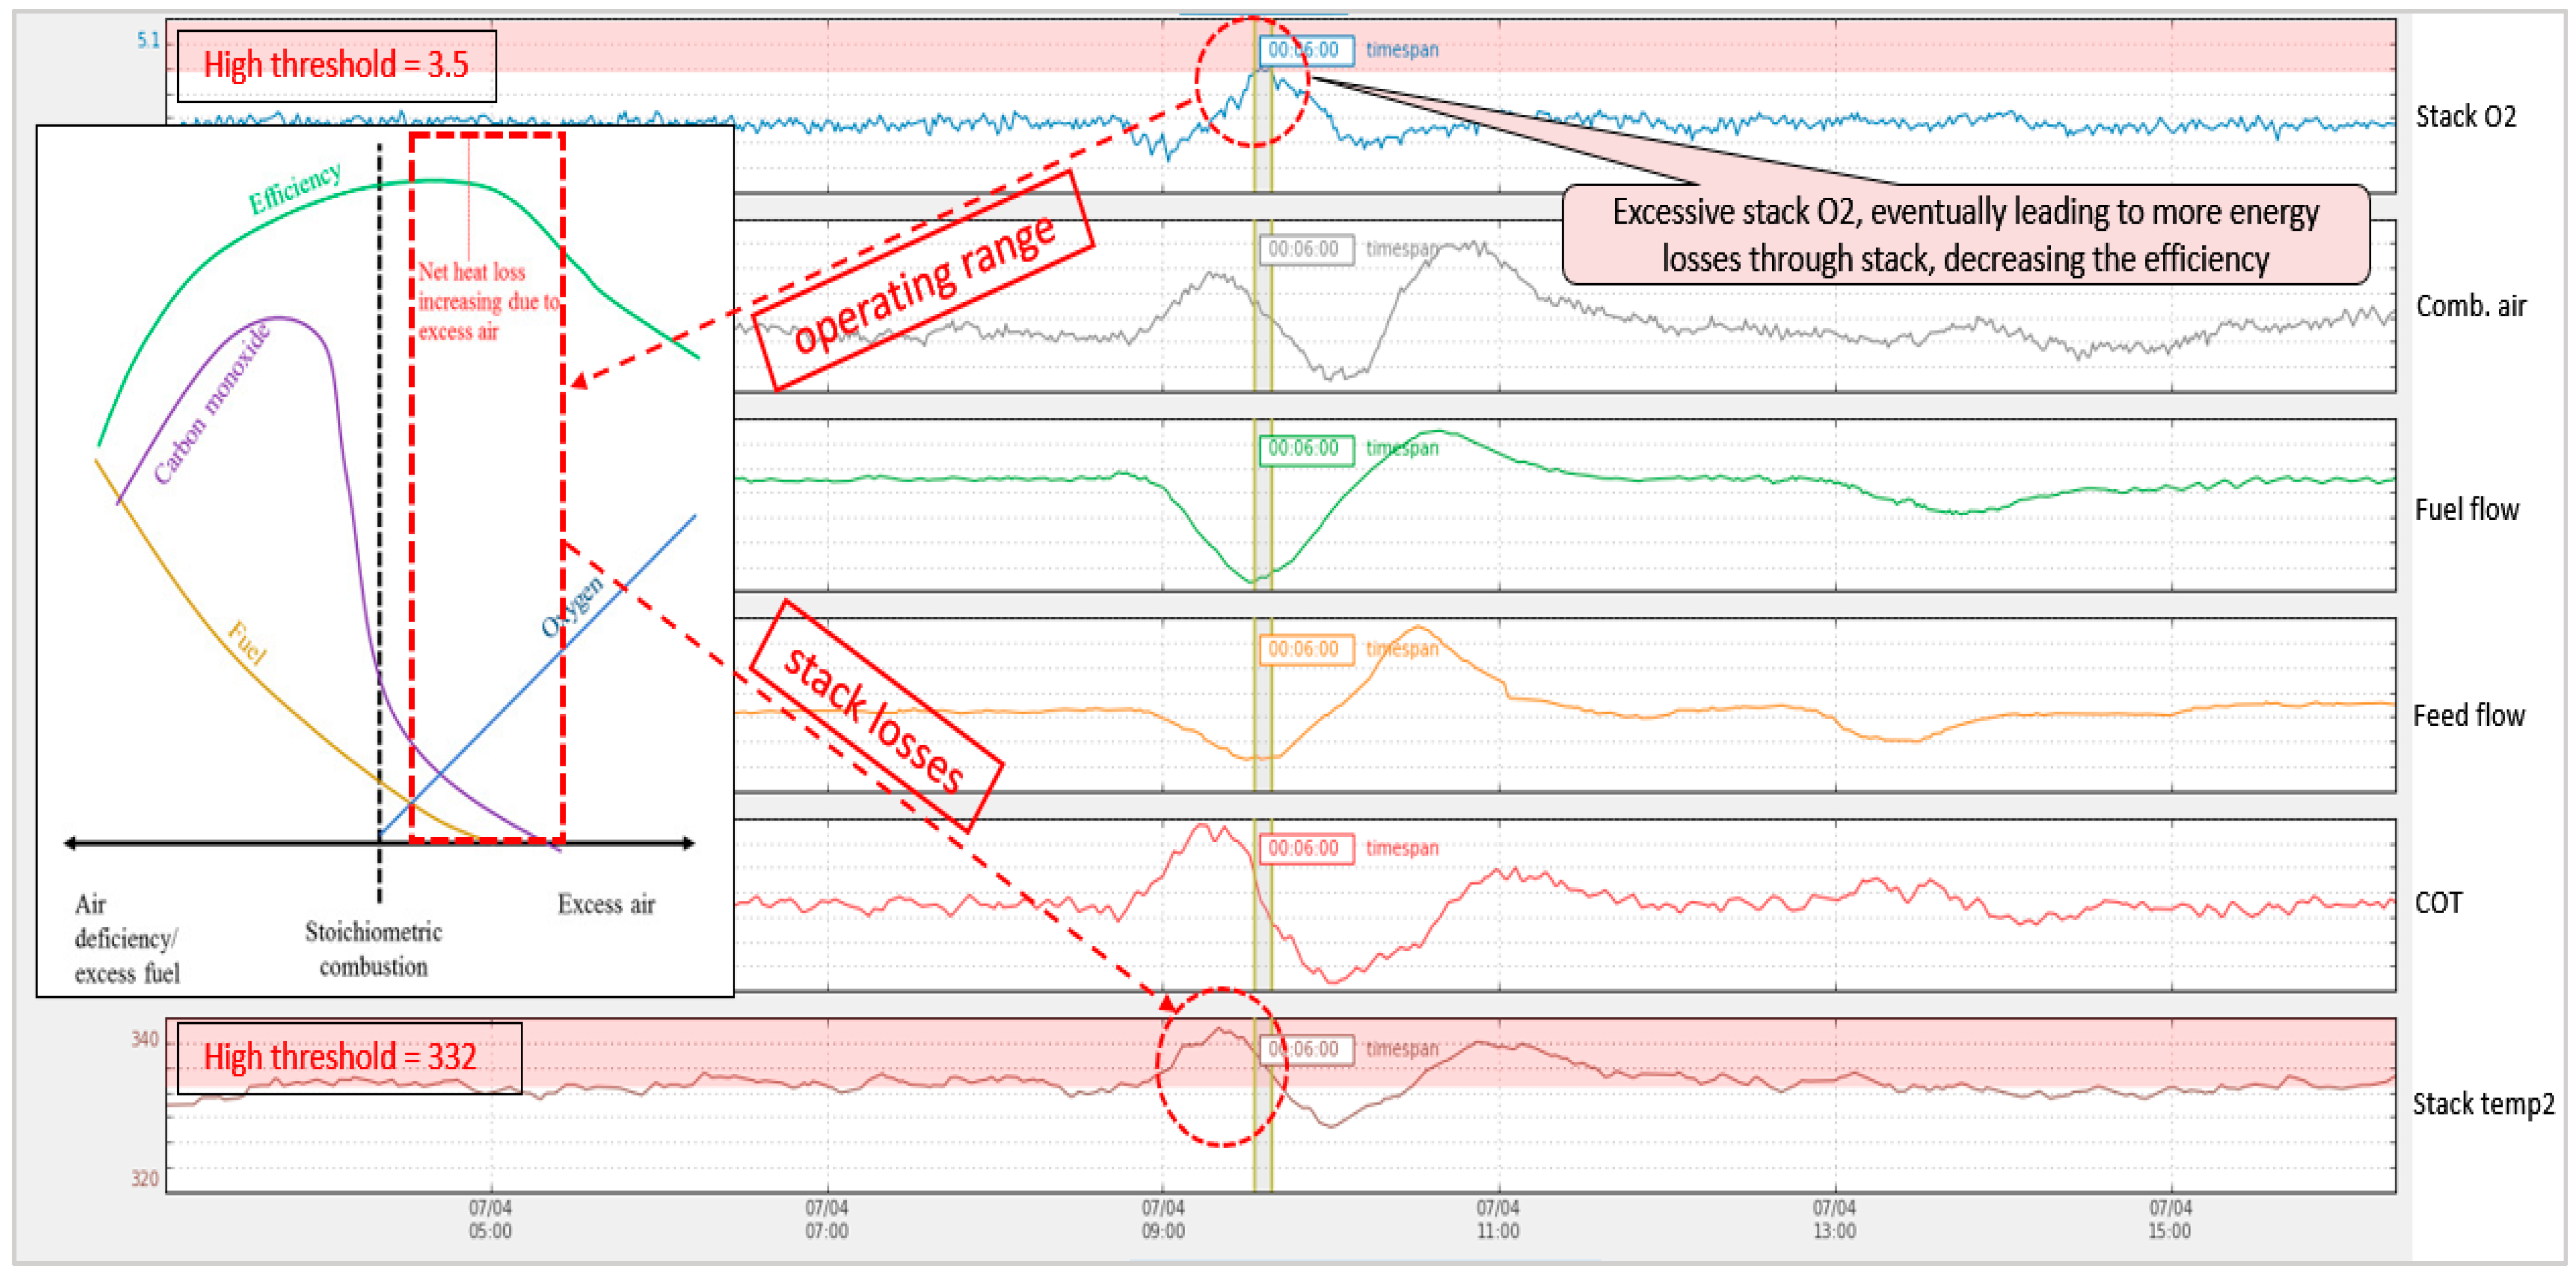
For operating the process fired heaters, controlling the excess oxygen is the most important task to ensure complete combustion and to reduce the energy losses through the stack. The developed system supports the operators in deciding the operating range based on the target efficiency while ensuring the complete combustion of the fuel. Normally, as the excess air is increased, the combustion efficiency also increases, but up to a certain extent. As the excess air reaches the heat loss point, the heat losses start to increase with increasing excess air, and the net efficiency starts to decline. Keeping in view this importance, excess air monitoring rules have been designed for continuous monitoring of the operating range.
Figure 15 illustrates the excessive air event and the related real-time operation data. The developed system has triggered this event for 5 min where stack heat losses also increased. A high threshold has been defined as 3.5% in the defined rules, and it can be observed that the stack losses increased as the operating range exceeds the threshold. Several events have been triggered, alarming the situation of excessive heat losses through the stack. It can also be observed that the fuel flow is decreased but the combustion air has not been quickly controlled to maintain an efficient air-to-fuel ratio. This kind of control lag can be monitored and alarmed in real-time by using the developed logics in this system, which makes this system very useful in operating the energy-intensive units in a chemical plant.
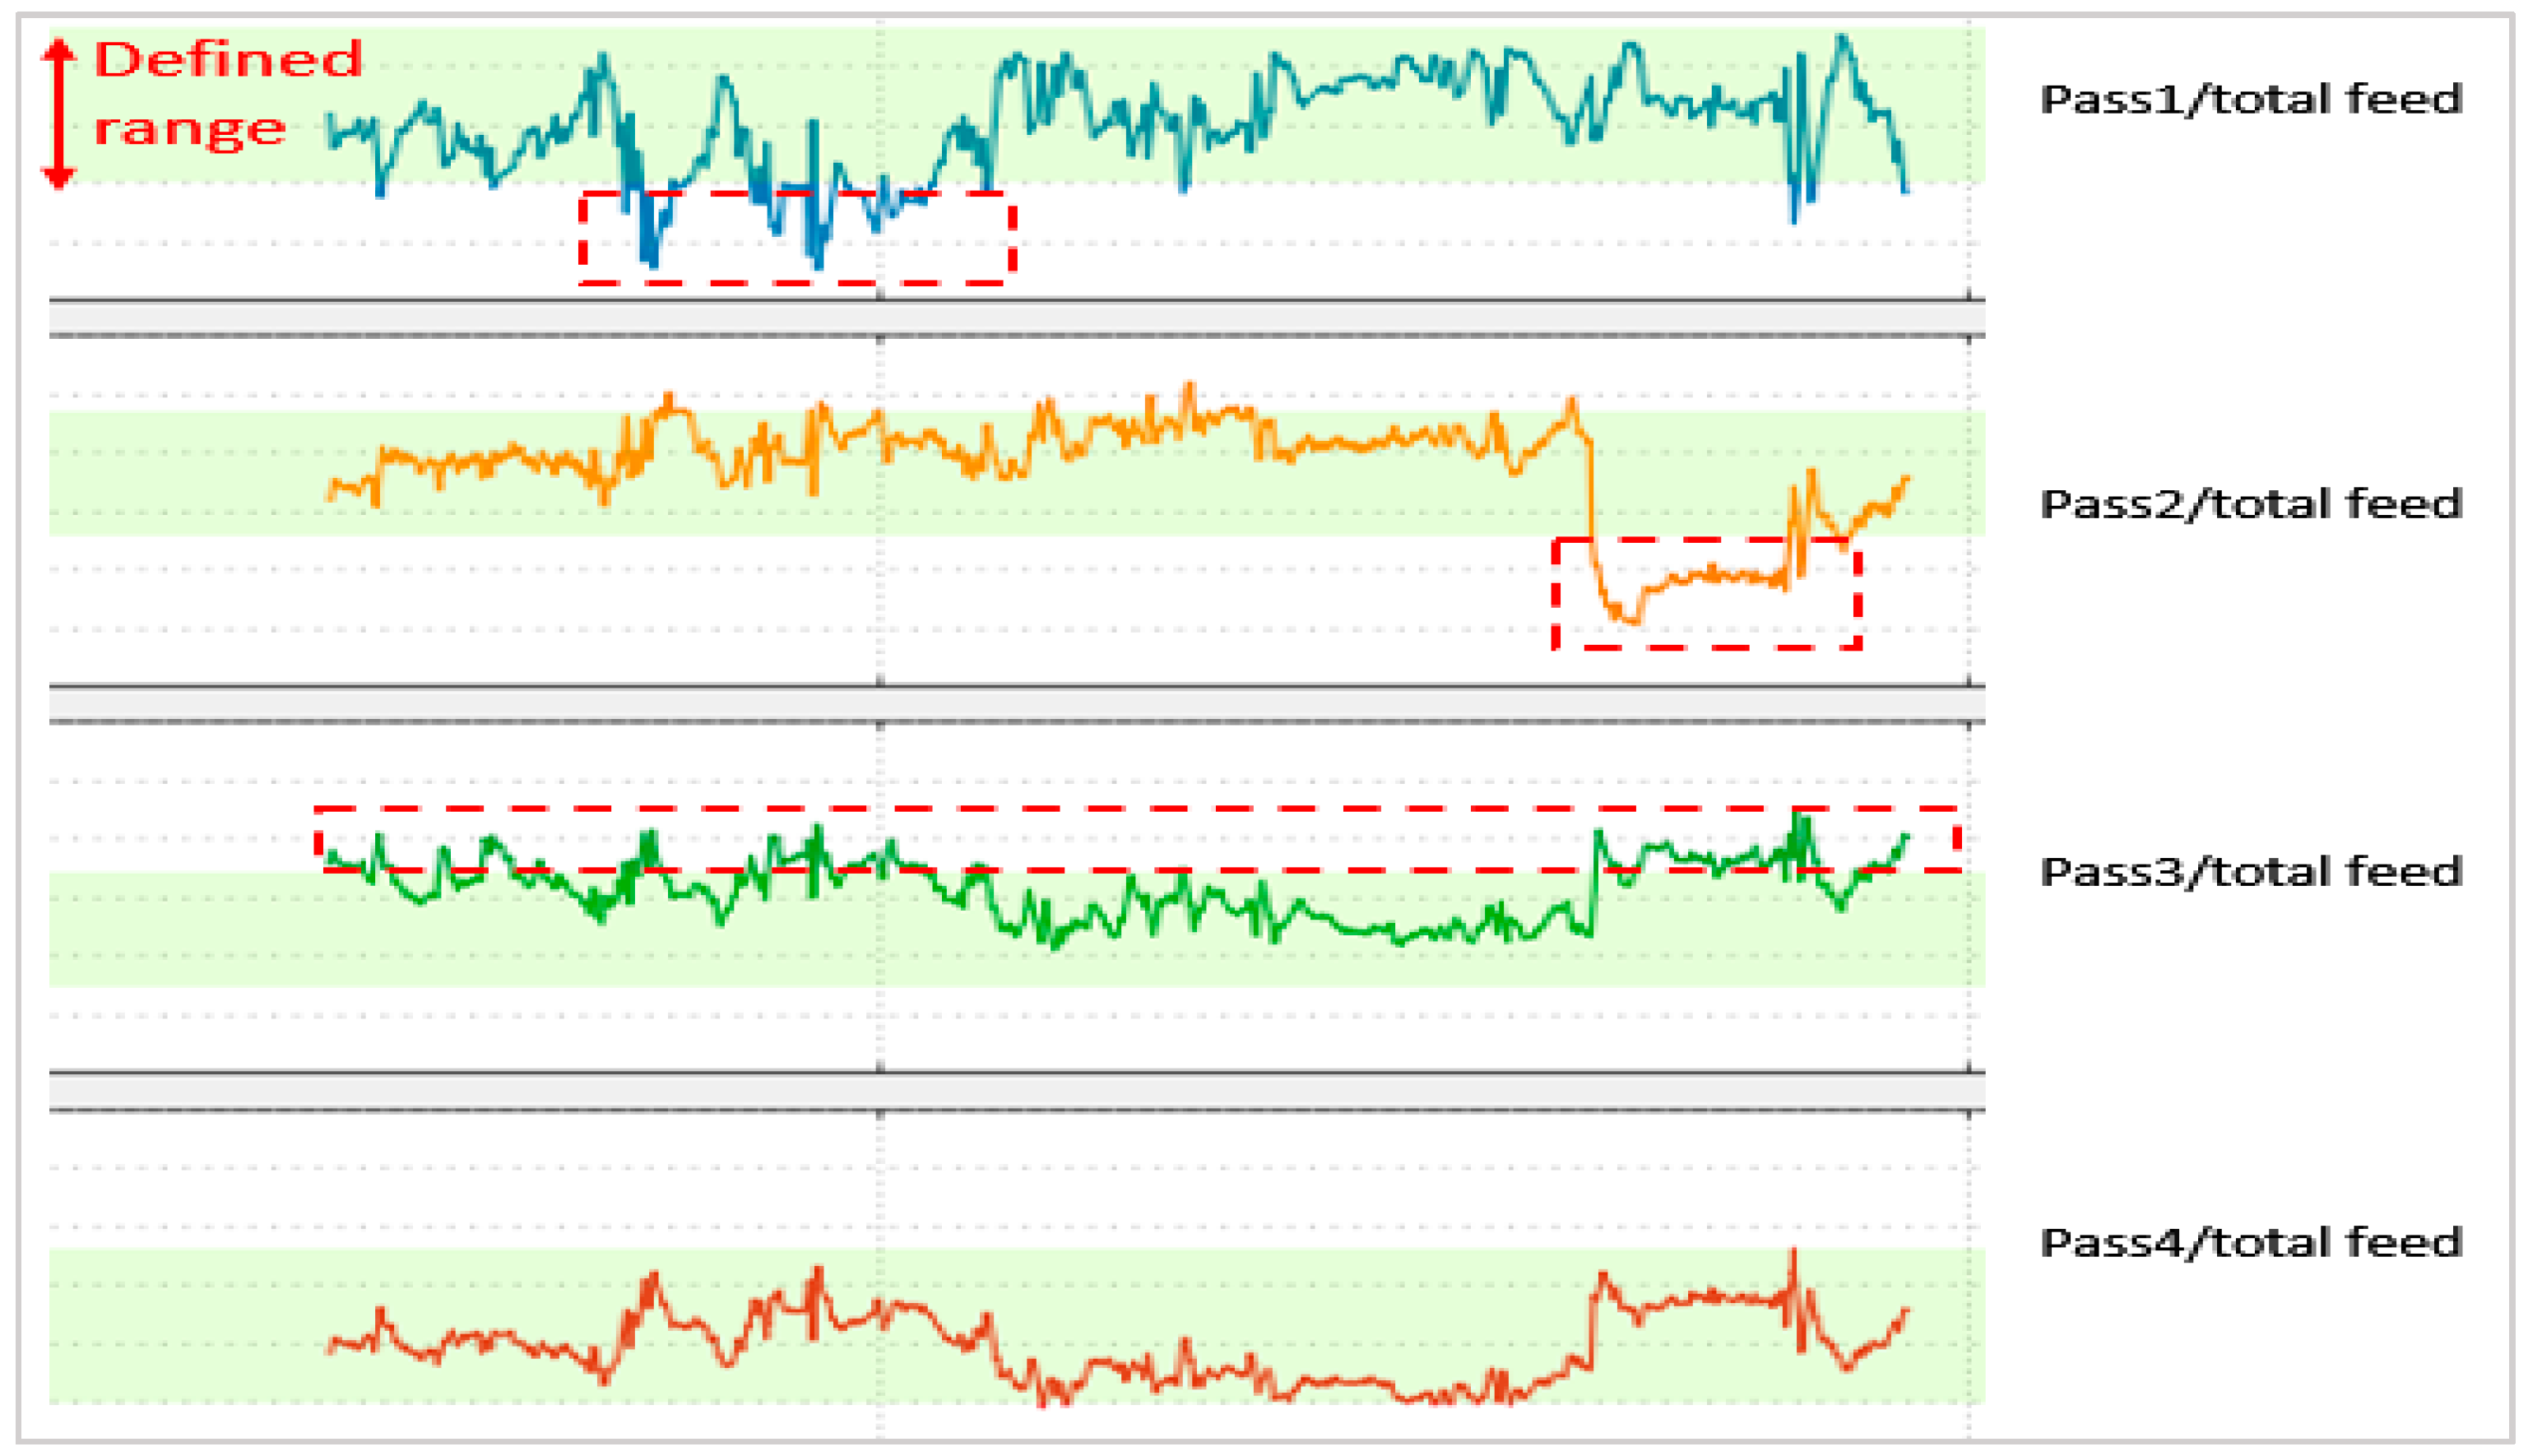
Another important case in the fired heaters’ operation is the pass flow maldistribution, which also has been validated in this study. The maldistribution may cause improper heat distribution among the tube passes and speed up the coking process. Hence, it leads to equipment damage and unbalanced heat duty of the tube passes. The normal pass flow/total feed range has been defined based on the historical data and expert knowledge. The validation of this configuration showed satisfactory results, which are shown in
Figure 16. The dashed line shows the areas where the ratio of pass flow and total flow did exceed the defined normal range. This maldistribution also resulted in the uneven heat duty in the tube passes. The system also guides the operators with comprehensive corrective actions that may be taken immediately to overcome the situation. The pressure inside the tubes might be adjusted to normalize the pass flows or, in most cases, the coking is the main culprit in uneven flow distribution. The detection of the maldistribution case also serves as the prediction of coking, so the maintenance can be carried out for cleaning of the tubes.
The efficacy of the developed system has been validated by analysis based on the requirements mentioned in
Section 2. The results exhibit that the integration of knowledge-driven and data-driven techniques leads to high precision in detecting abnormal conditions. The validation study also proved that the rules were highly effective in finding the abnormal scenarios based on the specific operating mode. The advantage of the developed application over conventional monitoring methods, knowledge-driven and data-driven, is explained in
Table 3.
The developed system has the merit of a minimal coding approach, which is an attractive feature for the process engineers and operators in a petrochemical plant. The system should be user-friendly so that the operators can interact with it and easily update it in case they want to update the monitoring approach or to deploy the application for more process units. Moreover, for the root cause analysis, the operators must be able to conveniently interact with the RCA tree, the decision trees, and the complex rules to reach a conclusion after receiving the guidelines from the advisory system associated with this developed application. The triggered scenarios have been validated with the real operation data, the results showed significant accuracy, and the condition-based rules were able to detect the dangerous scenarios, which otherwise would not be able with basic configuration in plant default control systems. The domain knowledge can be defined for a certain load or grade in the plant operation, but the frequent load change is inevitable in an operation. Therefore, the data-driven approach assists the domain knowledge in monitoring the operation based on the thresholds applicable to a specific operating mode. The operating modes are detected by the decision trees and the related thresholds are activated in the complex rules; hence, the RCA is updated according to the currently detected operating mode. The system is also highly interactable and interpretable for the operators, engineers, and plant managers.
However, data-driven models used in current work need a supervised update after a specific interval to ensure detection accuracy. The self-learning of such models in fired heaters’ operation faces a lot of challenges, for instance, careful validation of models, the accuracy of model, error, and reliability before implementing in the online system. These challenges are currently under consideration, and our future work will focus on minimal human intervention for the models’ self-learning and automatically updating in online application, which can greatly enhance the automation of fired heaters’ operation.
The alarms management is also a vital area in the daily operation of the process industry, and it should be tackled efficiently to avoid the distraction of the operators. The false alarms are greatly reduced by using this developed application. The false alarms pertinent to the shutdown scenarios or lower grade operation are not activated in this application because the application can rule out any such scenarios by monitoring the operating mode using machine learning algorithms and complex logics that make sure that the instance is running before triggering any false alarms. Hence, the novel application built in the current work can greatly reduce the alarm load on the operators, and the alarm flooding can be avoided too.
The process operation faces plenty of load changes based on the feed conditions, weather, product specifications, and any unpleasant event or accident. The monitoring system should be highly interactable with minimal human involvement for updating the models or knowledge-based rules. The developed advanced advisory system can be updated with minimal efforts by virtue of the human-friendly interface and features. The easy deployment, knowledge libraries, interactive KPI dashboards, and the integration of experts’ knowledge and operation data make this system a promising tool to ensure process safety and efficiency improvement.


