1. Introduction
Since the 1980s, many countries have liberalised their electricity sectors, changing their institutional structure. The potentially competitive segments of the sector, such as generation and supply, have been vertically separated from the natural monopolistic transmission and distribution networks. Privatisation was viewed as the answer to stop spiralling costs and improving efficiency in a currently volatile economy. However, due to the lack of competition, the transmission and distribution of electricity are subject to economic regulation in order to ensure access, security of supply, and fair prices for customers. By the late 1990s, incentive regulation was common practice in many countries aiming to promote improvements in investment and operating efficiency [
1].
Information asymmetries commonly arise in regulated industries. Firms have an informational advantage over the regulator in terms of its actual costs, production, technology, and managerial effort, and this is the main barrier to successful regulation of natural monopolies [
2,
3]. Much of the research on and application of regulation attempts to address the issues caused by information asymmetry and to reduce its negative impact on social welfare. In order to aid the assessment of firms, many regulators rely heavily on productivity and efficiency benchmarking. This type of analysis makes use of information from the regulated firms to determine their performance relative to a benchmark. The results are then applied to determine the allowed revenue of the utilities [
1]. Because of the weight put on the outcome, i.e., determining firms’ revenue, ensuring accurate estimation and measurement of productivity and efficiency is crucial.
Regulators have an important task in deciding on the regulatory framework, and this task has grown in importance due to the prominence of green transition objectives and policies [
4]. The choice of benchmarks and techniques to measure efficiency is important and must accurately reflect the environment in which the firms are working. Overall efficiency is a combination of technical efficiency and allocative efficiency. That is, to be deemed efficient, firms should move as closely as possible to the best-performance frontier by maximising output given available inputs, and firms should choose the mix of inputs which produces a given output at minimum cost [
5]. Regulators tend to focus on technical efficiency in their analysis as capital-intensive monopolistic industries are seldom able to reach allocative efficiency due to firms’ inability to individually control their input and output mixes [
6]. However, it is common to study allocative and technical inefficiency in academic research (see, e.g., [
7] for a study of the Norwegian electricity distribution).
Allowing the same utility to own two segments of an otherwise unbundled sector is justified through assumed benefits of coordination and economies of scale. The EU Third Energy Package was introduced in 2009 to further liberalise the energy sector across Europe, including unbundling of vertically integrated segments. Exceptions do however exist; for instance, when the British electricity sector was liberalised in the 1990s, the two Scottish organisations, Scottish Power Transmission (SP Transmission) and Scottish Hydro Electric Transmission (SHE Transmission), remained vertically integrated with the control of all four major segments of the sector (namely, generation, transmission, distribution, and retailing) north of the border. The two companies remain vertically integrated, albeit with strict business separation requirements to prevent unjust competitive advantage from its organisational structure. However, this excludes the distribution and transmission network businesses since there are potential efficiency gains from economies of scale which outweigh the potential disbenefits of allowing the same company to own electricity networks of different voltages.
Moreover, anticipated efficiency gains were a major driver behind the electricity sector privatisation in the UK during the 1980s and 1990s. This has been generally accepted as true, although recently challenged by the UK Labour Party, who went to election in 2017 pledging to renationalise big utilities due to the profits enjoyed by private companies [
8]. This has brought the subject of ownership structure and its impact on companies’ productivity into focus.
In this paper, we analyse two overlooked aspects of electricity distribution companies’ efficiency: vertical integration between transmission and distribution utilities (i.e., the same company owns both transmission and distribution assets) and ownership structure (private or public ownership). We use an unbalanced data set of 100 Norwegian distribution network operators (DNOs) from 2007 to 2014 to estimate the impact of the ownership structure and electricity network vertical integration on companies’ cost efficiency. We estimate a cost function using a stochastic frontier analysis (SFA) approach to model the effect of vertical integration between network levels and ownership structure on efficiency. The perceived benefits of vertical integration and private ownership in regulated networks have not been assessed in this form before.
The remainder of the paper is outlined as follows.
Section 2 provides the background of the theoretical context of regulation and benchmarking as well as a review of the existing empirical literature.
Section 3 outlines the methodology, describes the data, and presents the empirical model.
Section 4 provides a discussion of the results.
Section 5 concludes.
2. Theoretical and Practical Context
2.1. Information Asymmetry
Natural monopolistic industries are commonly regulated to evade market failures caused by poor economic performance. When a regulator implements a framework, the goals are generally expected to be increased efficiency (of costs and production) and an aim to improve social welfare. Government intervention of any sort comes at a cost, and it is therefore important to consider the costs of intervention compared to the economic gain.
Regulators have imperfect information regarding the technology, costs, and behaviour of the firms that they regulate. Firms, on the other hand, generally have more information about these attributes and can use this to gain a strategic advantage. The choice of regulatory framework thus depends on its potential to limit or mitigate asymmetric information problems.
Two issues arise from asymmetric information: adverse selection and moral hazards [
3]. Adverse selection arises when a firm is perceived to have higher costs than it actually does in order for the regulator to set higher prices. A moral hazard arises because the regulator is unable to know the managerial efforts of the firm. By increasing information availability and quality, the regulator can reduce its informational disadvantage.
2.2. Regulatory Frameworks
Traditionally, two types of regulatory frameworks have been considered when regulating privately-owned utilities: price cap and cost-of-service regulation. By setting a price cap or fixed price, firms and their managers are incentivised to exert maximum capabilities as any cost reductions remain solely with the firm. The problem of a moral hazard is thus removed. However, the costs associated with adverse selection are fully realised as firms have an incentive to exuberate their costs to maximise potential gains.
Additionally, in order for the firms to cover all their costs, the regulator, with limited information, would have to set a relatively high price. This would increase the rent available to the firm and increase social cost. Cost of service, on the other hand, is able to address adverse selection. Provided that the regulator is capable of accurately auditing the costs, the firm is guaranteed to be reimbursed for all its production costs. It has no incentive to exuberate its costs as this will be checked. Meanwhile, the managers of the firm have no incentive to increase their efforts to reduce costs either, as the full true cost will be recovered. The cost of moral hazard is thus fully realised.
Throughout the years, variations of the two traditional regulatory methods have been used, such as sliding scale and yardstick regulation, which introduces performance comparison between utilities, to better incentivise desired behaviour and improve performance. Today, regulatory frameworks tend to be a combination of methods with a relatively large reliance on some form of benchmarking [
1].
2.3. Incentive Regulation and Benchmarking
Incentive regulation makes it possible for the regulator to encourage both improvements in efficiency and desirable behaviour by rewarding good performance and penalising poor performance. Actual performance is measured against a benchmark, which will, at least partly, determine firms’ rewards (or penalties in case of two-sided incentives). The regulator has a challenging task to determine what the benchmarks should be and how performance should be measured [
1]. The application of efficiency and productivity analysis in network regulation is a response to the information asymmetries that exist between the regulator and the firms. Benchmarking of firms makes use of available information beyond what is revealed by the firm itself.
Norway introduced incentive regulation and efficiency benchmarking in 1997 and has since used data envelopment analysis (DEA) in setting the revenue caps for low-voltage (distribution) and medium-voltage (regional transmission) networks. [
1] provided an assessment of benchmarking and regulation of electricity networks and differentiated between ‘frontier benchmarking’, which identifies the efficient performance frontier from the best practice in an industry or sample, and ‘average benchmarking’, which measures average performance. In recent years, frontier benchmarking is more common and includes nonparametric methods, such as DEA; parametric methods, such as corrected ordinary least squares (COLS) and stochastic frontier analysis (SFA); or models with both components, the so-called semiparametric methods. In SFA and COLS, relative efficiency scores are estimated, with SFA recognising the possibility of random shocks when measuring firms’ performance.
In DEA, on the other hand, the efficiency of firms is computed as the distance to a piecewise linear frontier made up of the most efficient firms. That implies that a number of firms will always be considered fully efficient. An advantage of the non-parametric DEA method is that a functional form need not be specified and fewer assumptions, in terms of firms’ production technology, must be made. However, this has a disadvantage in that the method is deterministic and is unable to distinguish between random noise and inefficiency. The use of an SFA approach, on the other hand, allows for the separation of random noise from inefficiency, but estimations require the specification of a functional form, which increases the risks of estimation issues [
9].
2.4. Ownership
When considering ownership structure, privately owned, when compared to state owned, companies are often assumed to be more efficient and perform better. This has been one of the key drivers behind privatisation in the electricity market. However, empirical analyses on the matter of ownership structure on large utilities can be argued to be inconclusive. For example, when assessing factors that influence the technical efficiency of thermal power plants, [
10] found that privately-owned power plants achieve on average higher technical efficiencies compared to publicly owned power plants. Similar results are found when assessing the impact of the ownership form on European and Australian airports, where public airports operate less cost efficiently than fully private airports [
11]. Meanwhile, in a study on the US electricity utilities, [
12] showed that, on average, publicly owned and privately owned firms have the same level of cost inefficiency. This is, however, disputed when examining the efficiency of the Swedish distribution networks, where privately owned companies are relatively more efficient [
13].
Whilst the studies on electricity networks’ ownership structures and their impact on efficiency are limited and show no conclusive results, continued assessment and greater understanding can aid the regulator in reducing the informational disadvantage.
2.5. Vertical Integration
Due to its physical nature, the generation, transmission, distribution and end-use of electricity are highly interdependent. Whilst the technology of storing electricity is progressing, it is still not available on a large scale, meaning that the electricity produced and consumed must always be balanced. Both the production and delivery of electricity requires assets that are highly specialised and once the assets are in place in one area, they cannot easily be redeployed somewhere else. These characteristics indicate that vertical integration is an efficient organisational structure [
14]. There are three main attributes that explain this: (i) market distortions are eliminated by eliminating markets, (ii) coordination of investment in a complex system and (iii) risk reduction and risk management [
15].
The Third Energy Package is one of the most important legislations from the EU concerning the European gas and electricity markets. It came into force on 3 September 2009 and is mainly aimed at further liberalising the European energy markets. Under the package, energy networks are subject to unbundling requirements, which oblige member states to ensure the separation of vertically integrated energy companies. As a result, the main segments of the electricity sector (generation, transmission, distribution, and supply) should be separated. The introduction of stricter unbundling rules is a response to concerns that a vertically integrated company can obstruct competitors’ access to infrastructure, which would prevent competition and lead to higher prices for consumers [
16]. Despite the EU-wide unbundling rules, the two Scottish transmission owners (TOs) remain part of vertically integrated businesses. The circumstances in the British energy market are slightly different from other European markets with three TOs and one system operator (SO).
It is common that other markets have one, often combined, TO and SO. To ensure no unjust competitive advantage, Ofgem has stipulated business separation requirements on the companies, including rules around accounting, office space, personnel, information sharing, and Information Technology (IT) systems. The exception, however, regards the distribution and transmission network businesses, where a provision in the Electricity Directive allows for cooperation to foster the consistency of legal, regulatory, and technical frameworks in the EU single market. Vertically integrated companies are, however, required to implement a compliance programme to ensure that discriminatory and anticompetitive behaviour is prevented [
17]. Additionally, all the accounting must remain separate, and whilst regulated by the same framework, the transmission and distribution businesses’ revenues are determined separately, as is the assessment of revenue-determining incentives.
Norway has about 150 DNOs and about half of them are also involved in the operation of regional transmission networks. The accounting, revenue regulation, and reporting is kept separate, although business can benefit from economies of coordination. The Norwegian electricity networks, particularly the DNOs, receive significant attention from academics and researchers (e.g., [
18,
19,
20,
21]). The high-quality data that span many years are suitable for application in a range of studies on, for example, different models of productivity and efficiency analysis through benchmarking. This work is novel since there are different models that can be applied in regulated industries and the outcome often directly influences network companies’ revenues and therefore the price that consumers pay. An important aspect is how different sector structures influence the efficiency of network companies. One particular aspect has previously been overlooked in the literature, namely that of vertical integration between distribution and transmission networks.
In theory, allowing cooperation between network businesses operating in the same region could lead to operating and efficiency advantages, for example, by sharing staff and physical locations and certain assets, such as depots and maintenance facilities. As such, regional cooperation can benefit from economies of coordination. This is recognised in the Third Energy Package, which otherwise mainly aimed at increasing electricity sector unbundling [
17]. However, the empirical literature assessing the alleged economies of coordination and benefits of regional coordination between electricity networks are limited.
Ref. [
22] explored the arguments for and against ownership unbundling of energy transmission networks. However, the study experiences difficulty in distinguishing and assessing the impact of ownership unbundling from the general impact of electricity reform and liberalisation. Availability of appropriate data is an issue because many countries either have a limited number of network owners (e.g., Great Britain with only two vertically integrated network businesses) or adopted strict rules of network unbundling at the time of the reform, making it difficult for comparative studies.
Instead, it is more common to analyse the unbundling of competitive and monopolistic elements of the electricity supply chain. For example, [
23] showed that ownership separation of electricity generation and retail operations from the distribution network appear to have a positive effect on the cost efficiency of distribution companies in New Zealand. Additional examples can be found in [
24,
25], which show potential economies of scope between the stages of upstream generation and downstream transmission in Europe and Norway, respectively.
2.6. The Norwegian Setting
Norway was one of the first countries, following Chile and the UK, to liberalise and reform the power sector. However, unlike the market-based approach and privatisation of UK state-owned utilities, the Norwegian power industry remained mainly under state and local municipalities’ control. Following the implementation of the Norwegian Energy Act in 1991, The Norwegian Water Resources and Energy Directorate (NVE) was appointed the sector regulator. The authority was, prior to the deregulation, in charge of the oversight of the power sector as well as water resources and flood control.
The Norwegian electricity grid is divided into three levels: central network, regional network, and distribution network. State-owned Statnett owns most of the central grid (about 90%), which constitutes the bulk of the high voltage transmission grid. Statnett is also Norway’s transmission system operator (TSO), in charge of balancing the electricity supply and demand. Norway has over 150 distribution network owners, responsible for the lower voltage section of the grid. In 1997, NVE introduced an incentive-based regulatory framework to encourage utilities to reduce costs and improve efficiency which has succeeded to improve performance of the network sector [
26]. The allowed revenue is set using total cost benchmarking according to the formula in (1):
where
RCt is the revenue cap per year (
t),
Ct is the cost base (actual) for each network company and
Ct* is the cost norm (efficient) for the company.
Ct and
Ct* are both calculated using data from
t − 2 and
Ct* is obtained through DEA programmed to benchmark the companies’ costs. Ordinary least squares (OLS) is then used to correct the DEA results for environmental factors [
27]. The revenue cap is thus determined using a share of actual cost and the norm cost. The incentive power of regulation and stimulated competition among utilities to improve cost efficiency is achieved by placing a higher weight on the norm cost. That is, by placing a higher weight on the norm cost, the regulator is incentivising firms to move closer to the frontier of best performance.
The cost base is calculated as follows:
where
OM is the operation and maintenance costs,
CENS is the company’s cost of energy not supplied and
CPI is the consumer price index. Multiplying actual power loss (
PL) with the reference price of power (
P, given by a volume-weighted monthly area spot price from Nord Pool Spot) gives the cost of power losses, whilst
DEP is depreciation and
RAB is the regulatory asset base (book value plus 1% working capital).
WACC (weighted average cost of capital) is defined by NVE to calculate the capital cost of each company.
3. Methodology
The application of an SFA approach allows for the modelling of a frontier within a regression framework so that inefficiency can be estimated. This is important in the present analysis, as we are interested in measuring the effect of vertical integration between electricity networks and ownership structure on firms’ performance. This has not been done before with regards to electricity distribution networks, although, as outlined in the sections above, it is applied in the real world based on theoretical assumptions. Testing these assumptions should therefore be of interest to regulators, policymakers, and consumers alike.
Whilst the effect of vertical integration and ownership structure may be a novel incorporation, SFA has been used before by several authors to evaluate electricity network efficiency. Ref. [
28] used SFA to analyse US electricity transmission firms’ performance including environmental factors in the modelling to find that efficiency has declined and diverged over time. Ref. [
20] used Norwegian distribution network data to examine the efficiency effects of observed and unobserved heterogeneity. The results indicate that the observed environmental factors have a limited impact on firms’ average efficiency, a significant finding given the Norwegian regulator’s reliance on environmental factors in the regulatory model. Meanwhile, Ref. [
18] used an SFA approach to estimate the relationship between cost efficiency and investment among DNOs in Norway with results found to depend on the size of the network.
3.1. Model Specification
Following [
29,
30], we specify a stochastic cost frontier model with a convoluted error composed on two random terms. This is in order to capture both uncontrollable or unobservable aspects as well as deviations with respect to the frontier of best performance that can be attributed to managerial inefficiency. The general SFA model for a cost function to be estimated is presented in (3) as follows:
where
i stands for utilities,
t for time,
Cit represents utilities’ total cost,
Xit is a vector of explanatory variables that includes outputs, input prices and other control variables, whilst
α and
β are parameters to be estimated. Deviations with respect to the cost frontier are illustrated by
v and
u, where
vit is the traditional noise term and
uit captures utilities’ inefficiency. The model assumes symmetric random noise,
vit∼
N(0
), whilst the inefficiency is a positive one-sided error term that can follow distributions such as half-normal, truncated normal or exponential distributions. If we assume in Equation (3) that the inefficiency term is homoscedastic, we are unable to examine the drivers behind utilities’ performance, which might produce biased estimates of the inefficiency scores and frontier coefficients [
31].
In order to address the above issue and to allow us to examine the impact of ownership structure and vertical integration on utilities’ cost (in-) efficiency, we estimate instead a heteroscedastic stochastic frontier model that includes a set of contextual variables in the inefficiency term. These contextual variables (frequently called environmental or
z-variables) can be introduced in the model through the pre-truncation mean, the pre-truncation variance or simultaneously in both parts of the inefficiency term (see [
28]). It is common to use weather and geographic variables as inefficiency determinants in SFA models. However, through the application of a spatial econometrics approach, Ref. [
32] show that cost data from surrounding firms can be used to compensate for the lack of information on environmental factors.
In this paper, we estimate a model in which the environmental variables enter through the pre-truncation variance of the inefficiency term as proposed by [
31,
33,
34]. This type of model has an appealing economic interpretation. There is a base efficiency level of the utilities that captures things like managers’ natural skills, while how well these natural skills are exploited depends on the set of contextual variables introduced in the inefficiency term [
35].
3.2. Data
In this paper, we use an unbalanced panel dataset of 100 Norwegian DNOs provided by NVE in Excel workbooks in the format of primary data as reported by the DNOs. The data comprise economic, technical, and environmental information between 2007 and 2014 (for more information see [
36]). A number of observations were dropped from the dataset due to missing values in key variables, lack of information on contextual variables, extreme outliers in terms of size or unexplained values, such as negative or zero values for cost. Moreover, all variables are not always available for all years until present. It often depends on what NVE are actually using in their models. Therefore, it is possible to find newly published papers on the Norwegian electricity sector that use not fully updated data. e.g., [
25] used data until 2014 to analyse the existence of economies of scope and scale in the sector. Despite ending in 2014, we would like to highlight that this is a consistent dataset cleaned up by NVE that perfectly fits the purpose of the paper. This database serves to answer the raised questions, which are relevant as industrial organisation matters, regardless of the period analysed. The level of vertical integration and the ownership structure of the network utilities in the sector do not tend to change significantly in the course of a few years; hence, the results obtained here are still valid in the current context.
We specify a cost function with total cost (totex) as the dependent variable. Following NVE’s approach, we specify totex as the social cost, that is, including external (customer) quality costs. Totex is made up of capital expenditure (capex), including cost of energy not supplied (cens), operational expenditure (opex) and losses. The cost of losses is calculated by multiplying physical network energy losses with the annual average system price (Nordpool Nordic annual system spot price [
37]). Cens is calculated by multiplying the energy not served/interrupted (which includes details on length of interruptions, time, and day of the interruption and if the interruption was planned or not) with consumer willingness to pay to avoid interruptions. The current framework includes willingness to pay for six different consumer groups.
NVE introduced quality-adjusted revenue caps in 2001 with the cens arrangement to ensure that cost efficiency improvement of networks would not be achieved by reduced service quality. Including consumers in determining the cost ensures that the service quality is not improved beyond a level and cost that consumers are willing to pay for, thus providing consumers the opportunity to influence the regulatory process. Since 2001, NVE has extended the framework on a number of occasions. In 2009, NVE included interruptions longer than three minutes and the classification of customer groups [
38]. All monetary variables are measured in 1000 NOK and in 2014 real terms. Following the method applied by NVE, we use the CPI [
39] to deflate the monetary variables.
The choice of variables is an important consideration and the subject of much debate. [
1] showed this in a review of international benchmarking methodologies, indicating no clear consensus of the variables to be used to assess networks’ performance. The Norwegian regulator assesses its model regularly and calibrates to ensure best fit. We considered the utilities able to control their inputs and therefore, by using the social cost, put greater weight on quality of supply as a direct consequence of utilities’ choices. Generally, network outputs are considered more difficult for utilities to influence.
The outputs in our model are the number of network stations (substations) and the number of customers to illustrate network size. We included the variable length of network in early testing, which can be a proxy of network size, but dropped it due to its correlation with the other variables. We also used two input prices: cost of capital, which is NVE’s determined rent for cost of capital, and labour price, which is the average salary in the sector. We used the cost of capital to impose homogeneity of degree one in the input prices.
The main focus of this paper is to study the impact on efficiency of vertical integration between different network levels and ownership structure. In our model, we introduce a dummy variable to capture the impact of integration between the distribution network and the regional transmission network, that is, the same utility owns both distribution and regional transmission assets. Networks of different voltages owned by the same utility are separate from an accounting perspective, however, would in theory be able to benefit from knowledge sharing and resource optimisation (see
Section 2.5 for further discussion). If the vertical integration dummy variable takes the value 1, then the utility is the owner of both distribution and regional transmission assets. In our sample, 54% of the DNOs are also involved in operating or owning regional transmission assets.
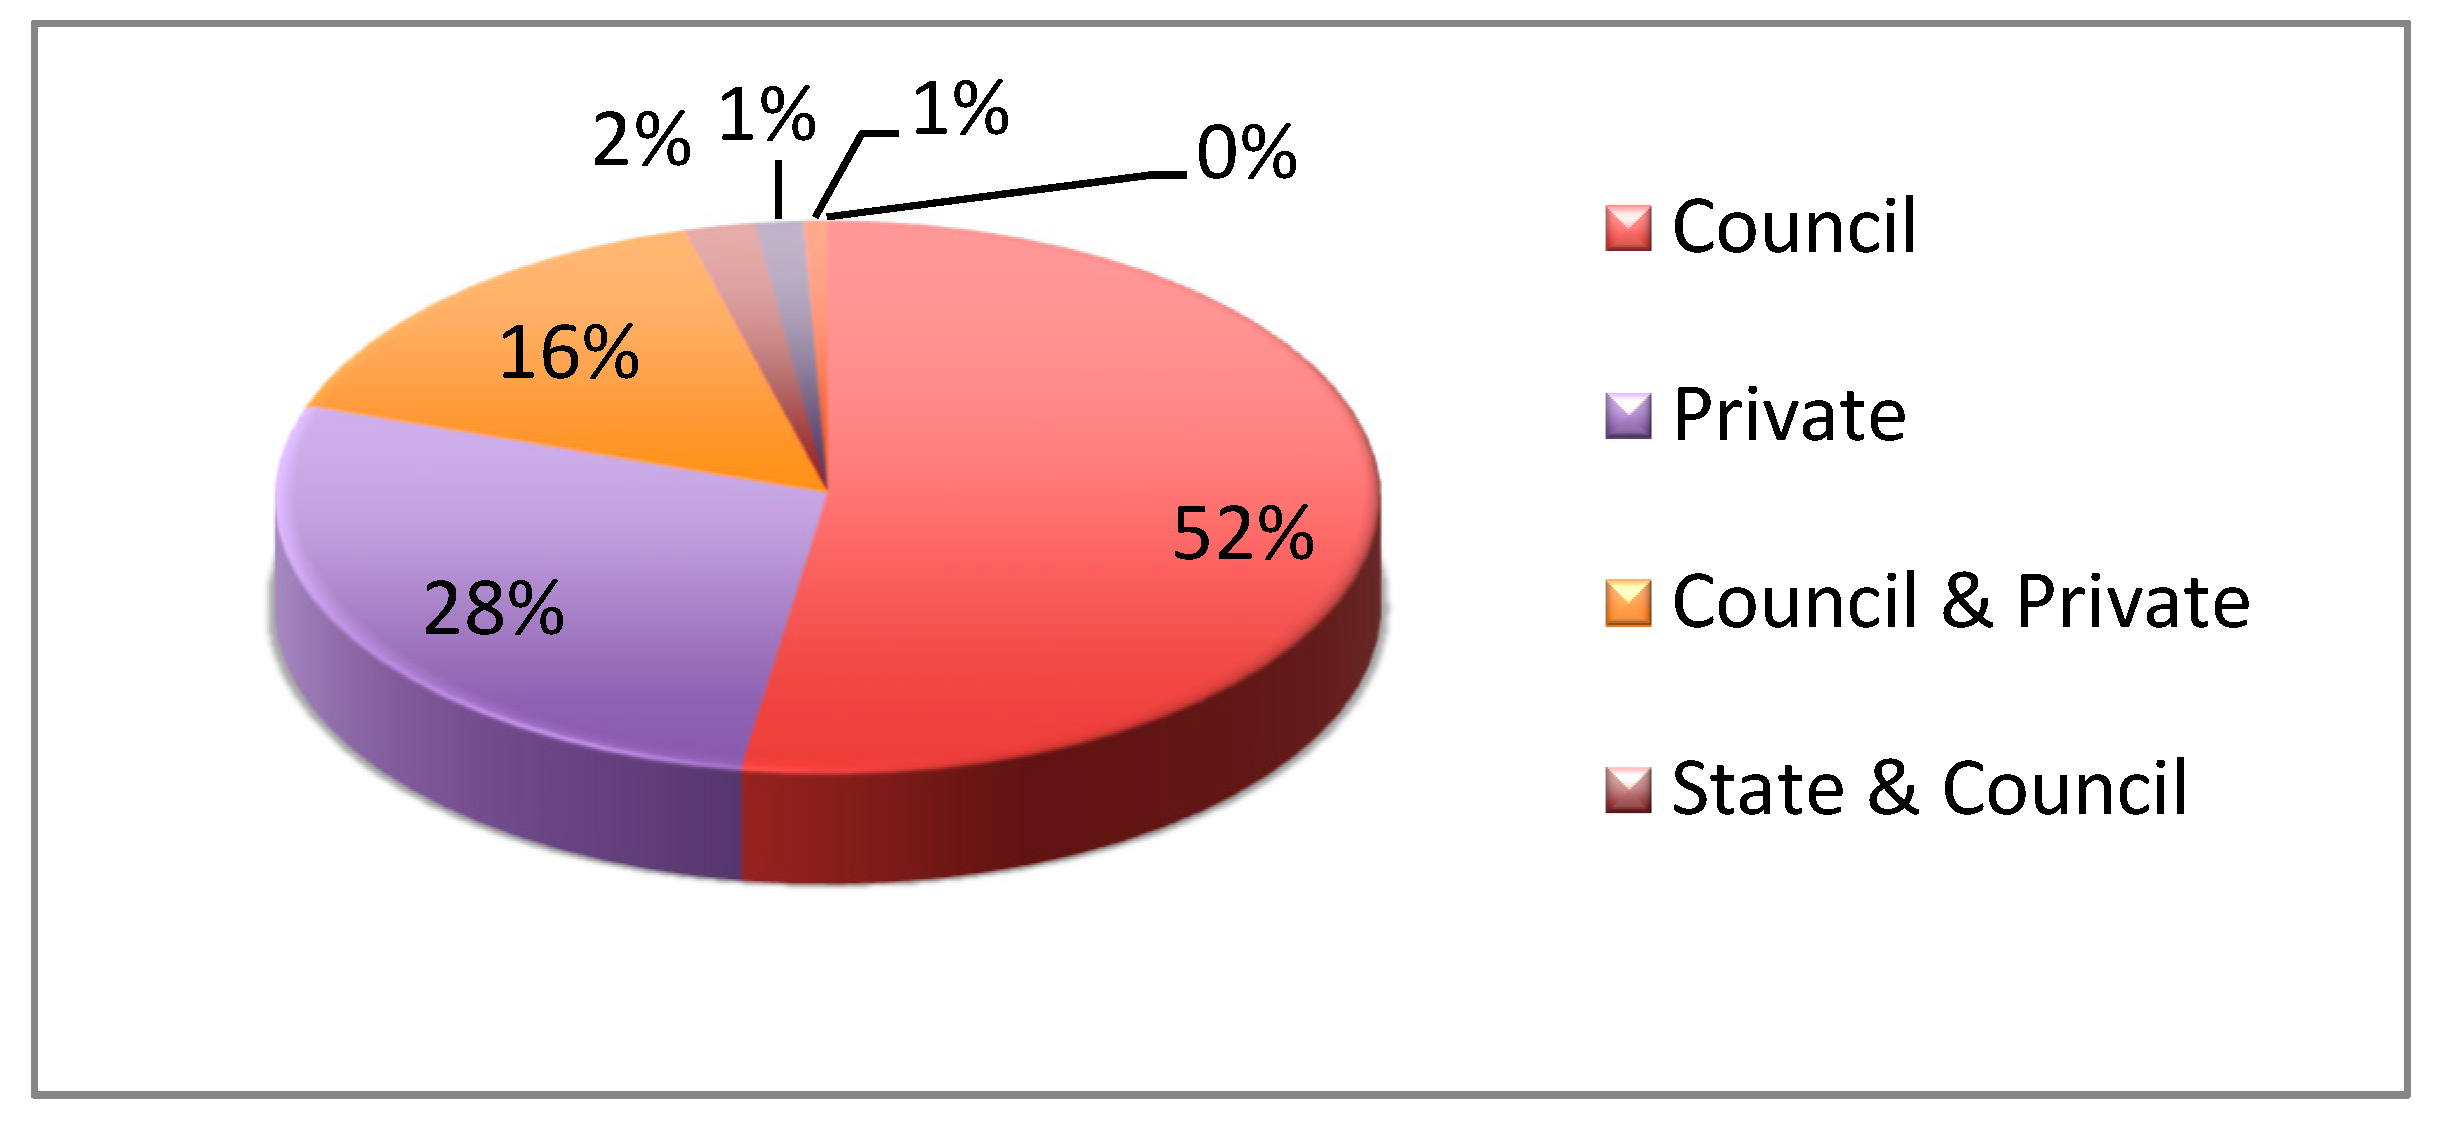
Ownership structure is presented in three different categories, each variable representing the share of ownership within a certain category: state owned, municipal/council owned, and private company owned. The network companies in the sample are either fully within one ownership category (100%) or split between two ownership categories (e.g., 75–25%).
Figure 1 shows the distribution of the different types of ownership structures. Traditionally, the lower voltage networks are owned by the council or municipality but may also have been developed by private companies to support an energy intensive industry. This is reflected in the data, where the local council or municipality is the sole owner of 52% of the DNOs, whilst 19% of DNOs are at least partly owned by the local council or municipality. DNOs owned and operated by private companies make up 28% of the sample, and the share of state-owned utilities is, as expected, marginal.
The differences in ownership structures are expected to affect utilities’ performance and are therefore, together with a variable measuring the number of islands at least 1 km from the coast within the network, included as inefficiency determinants. Whilst the number of islands within the networks service areas is likely to have an impact on DNOs costs, it is also helpful in reducing the impact on the analysis of uncontrollable characteristics of individual networks. We include a time trend to account for technical change and can capture issues such as, for example, changes in the regulatory environment.
Table 1 presents the descriptive statistics of the variables included in our analysis.
4. Results and Discussion
The specification of our main model is a translog cost function that includes a full set of interaction terms between outputs and input prices. The variables in the frontier are in logarithms except the time trend. Homogeneity of degree one in prices is imposed by normalising cost and labour price with capital price. The estimated equation is as follows:
where
kp is capital price,
lp is labour price, and
I and
t stand for the utility and year, respectively.
y stands for the vector of outputs, and
α and
β are parameters to be estimated. In addition, we also estimated a cost function using a Cobb–Douglas specification without including inefficiency determinants. The results from the estimation of these models can be found in
Table 2, whilst the result of the estimation of our preferred model (i.e., translog with inefficiency determinants) is presented in
Table 3.
The estimates display the expected signs for the coefficients of outputs and input prices in the cost frontier, with labour price as a major cost driver followed by number of network stations. The two variables used to illustrate network size both show positive signs of similar magnitude, and an increase in the price of labour is, as expected, also found to increase totex. The magnitude of the coefficients remains stable across the models, as well as the significance of the results.
Regarding the inefficiency determinants (
Table 3), the aggregation of the three ownership variables is 100%, meaning that one variable must be dropped to avoid a problem of perfect multicollinearity. Here, the State owned variable is dropped and the remaining variables, Council owned and Privately owned, are interpreted with respect to the omitted one. Our results indicate that there is no significant difference in the cost inefficiency of a utility being Privately owned or State owned. However, being Council owned implies a lower cost inefficiency with respect to being State owned.
The Norwegian electricity industry was largely developed on a regional level around small-scale hydro plants, and when the sector was unbundled, much of the network ownership remained under council ownership. It is also clear from the sample that many large industries privately own the networks supplying their businesses. This is most likely still in place from when the country was industrialised and small-scale generation was developed to provide power to factories allowing greater economic opportunities for rural areas. Only later, the large high-voltage system was developed, connecting the regional grids. The local experience and knowhow of many years may now therefore serve to benefit the efficient operation of the distribution networks. It is also possible that the state-owned lower-voltage networks are overlooked, as the state’s main interest in networks generally lies in the high-voltage central network.
Moreover, with a significant and positive coefficient, the results indicated that
vertical integration between the different network levels increases cost inefficiency. Although previous studies are limited in this area, following theoretical arguments on the potential of economies of scale and mergers for efficient resource allocation, the results may appear somewhat surprising. The Third Energy Package allows for regional cooperation between electricity networks to take advantage of perceived economies of coordination and the theoretical work on the subject by [
14] indicates that vertical integration in energy systems is an efficient organisational structure. This is, however, based on the assumption that the network businesses are located in the same region. This information is unavailable in our data, although one might assume that where utilities own assets across both distribution and regional transmission levels, these are located in the same area. However, this may not always be the case. Furthermore, Ref. [
40] showed that the estimated gains from mergers differ depending on the assumptions of the production technology made by the regulatory model.
In Great Britain, the Scottish network owners own both distribution and transmission assets in Scotland in addition to distribution networks in England. These are not physically connected to the Scottish assets. As such, with assets covering different areas, the opportunity for efficient sharing labour and other inputs are limited and, as a result, the potential efficiency gains of the same firm owning networks of different voltages are reduced. Furthermore, both in Great Britain and Norway, the revenue for electricity networks of different voltage levels is determined in separate price controls. Although similar in nature in terms of the framework, incentives and objectives, differences exist.
In Norway, part of the regulatory differences lies in the variables used in the benchmarking model, where the distribution assessment utilises inputs such as number of customers, kilometres of overhead line and number of network stations, whilst the regional transmission assessment includes weighted values of different underground and overhead lines. With heavy reliance on the benchmarking to determine utilities’ revenue, network owners may allocate costs to where overall revenue is maximised. Although the regulator will aim to prevent this kind of behaviour, its informational disadvantage will possibly act to limit its success. Information asymmetry between the regulator and the regulated firm is one the key issues in the regulation of natural monopolies.
Benchmarking is essentially a tool to reduce the firms’ informational advantage. Nevertheless, strategic behaviour or regulator gambling is possible. In a survey study of energy regulators, Ref. [
41] found that firms are gaming the regulator’s benchmarking model in ways that are contrary to the intentions of the regulator. Regulators are aware of this, and although not illegal, it leads to forgone efficiency improvements, reduced social welfare and a welfare transfer between customers and the firms. Similarly, Ref. [
42] identified gaming by firms in the water sector in regulatory frameworks applying benchmarking.
Moreover, as the number of islands at least 1 km away from the cost increases, so does utility inefficiency. This is expected, given the impact of high costs of subsea cables, maintenance, and possibly reduced reliability. This is an example of a variable that firms are unable to change to impact performance. However, with the variable being significant, it is an indication of the operational difficulties of certain regions and one that should be considered by regulators to account for performance uncontrollable factors.
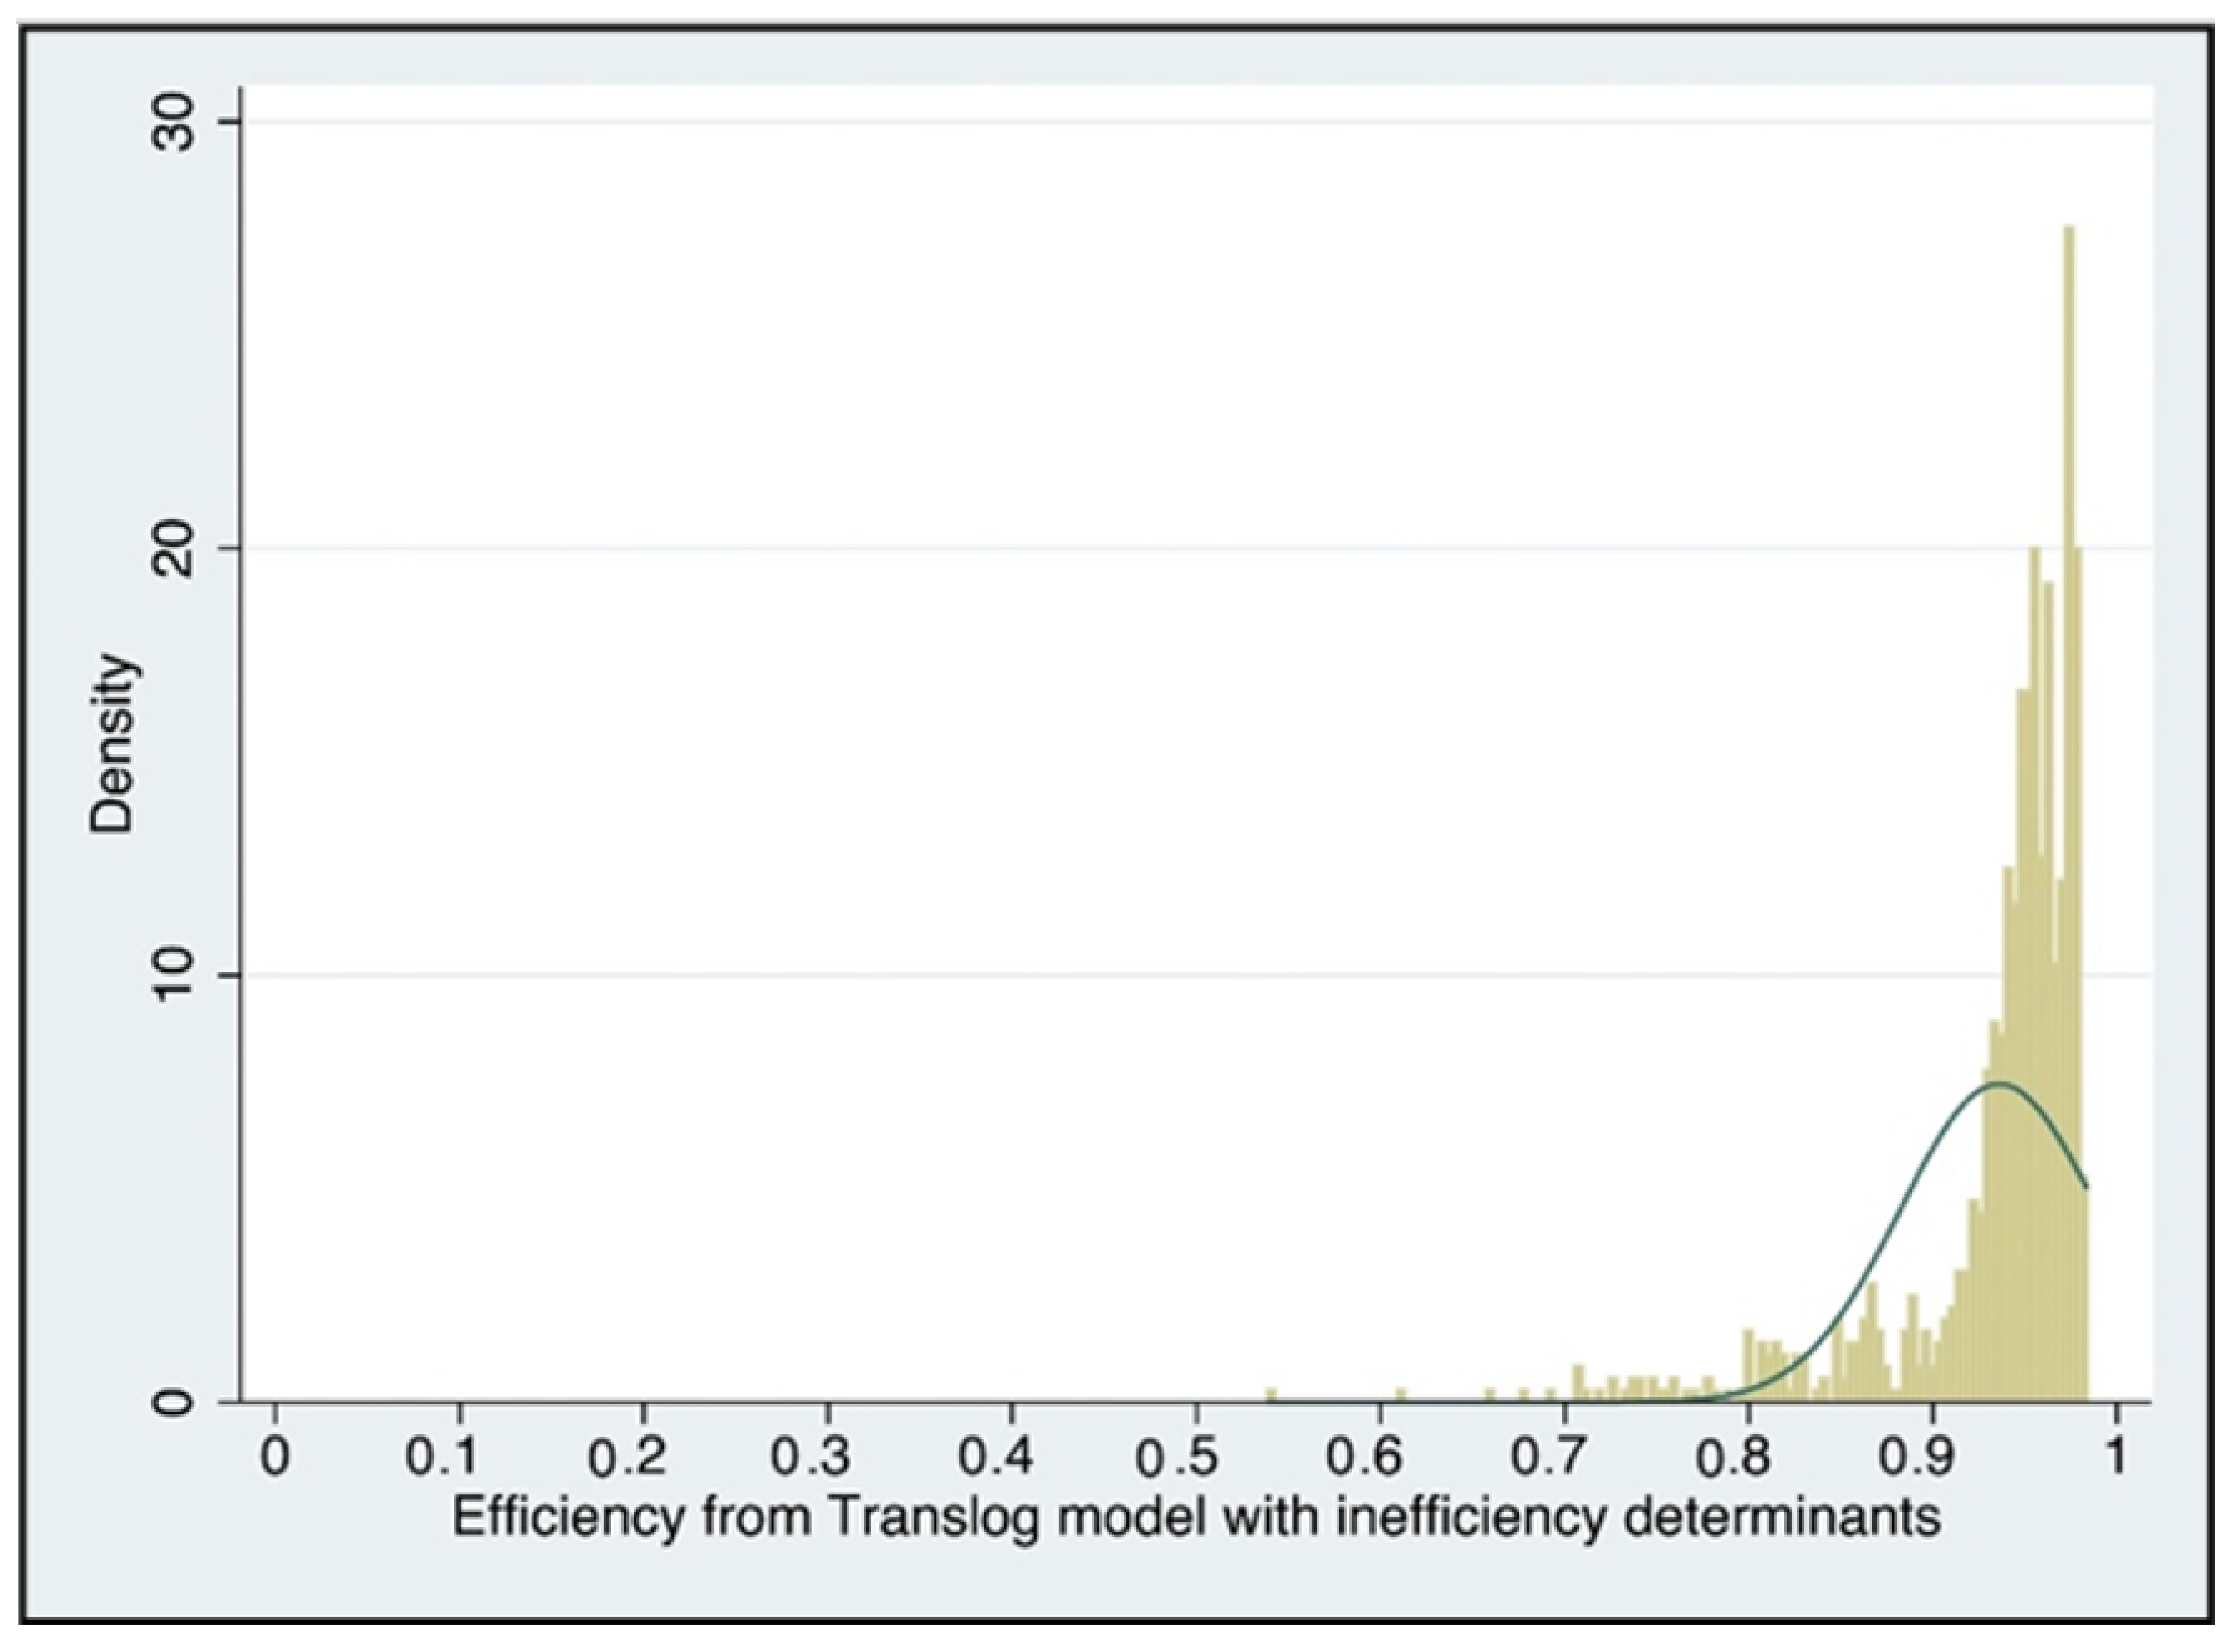
Figure 2 shows the distribution of efficiency scores for the firms using the translog specification with inefficiency determinants. The average efficiency in the sample is 93.6%, in line with previous studies of Norwegian electricity networks (see, for instance, [
26]).
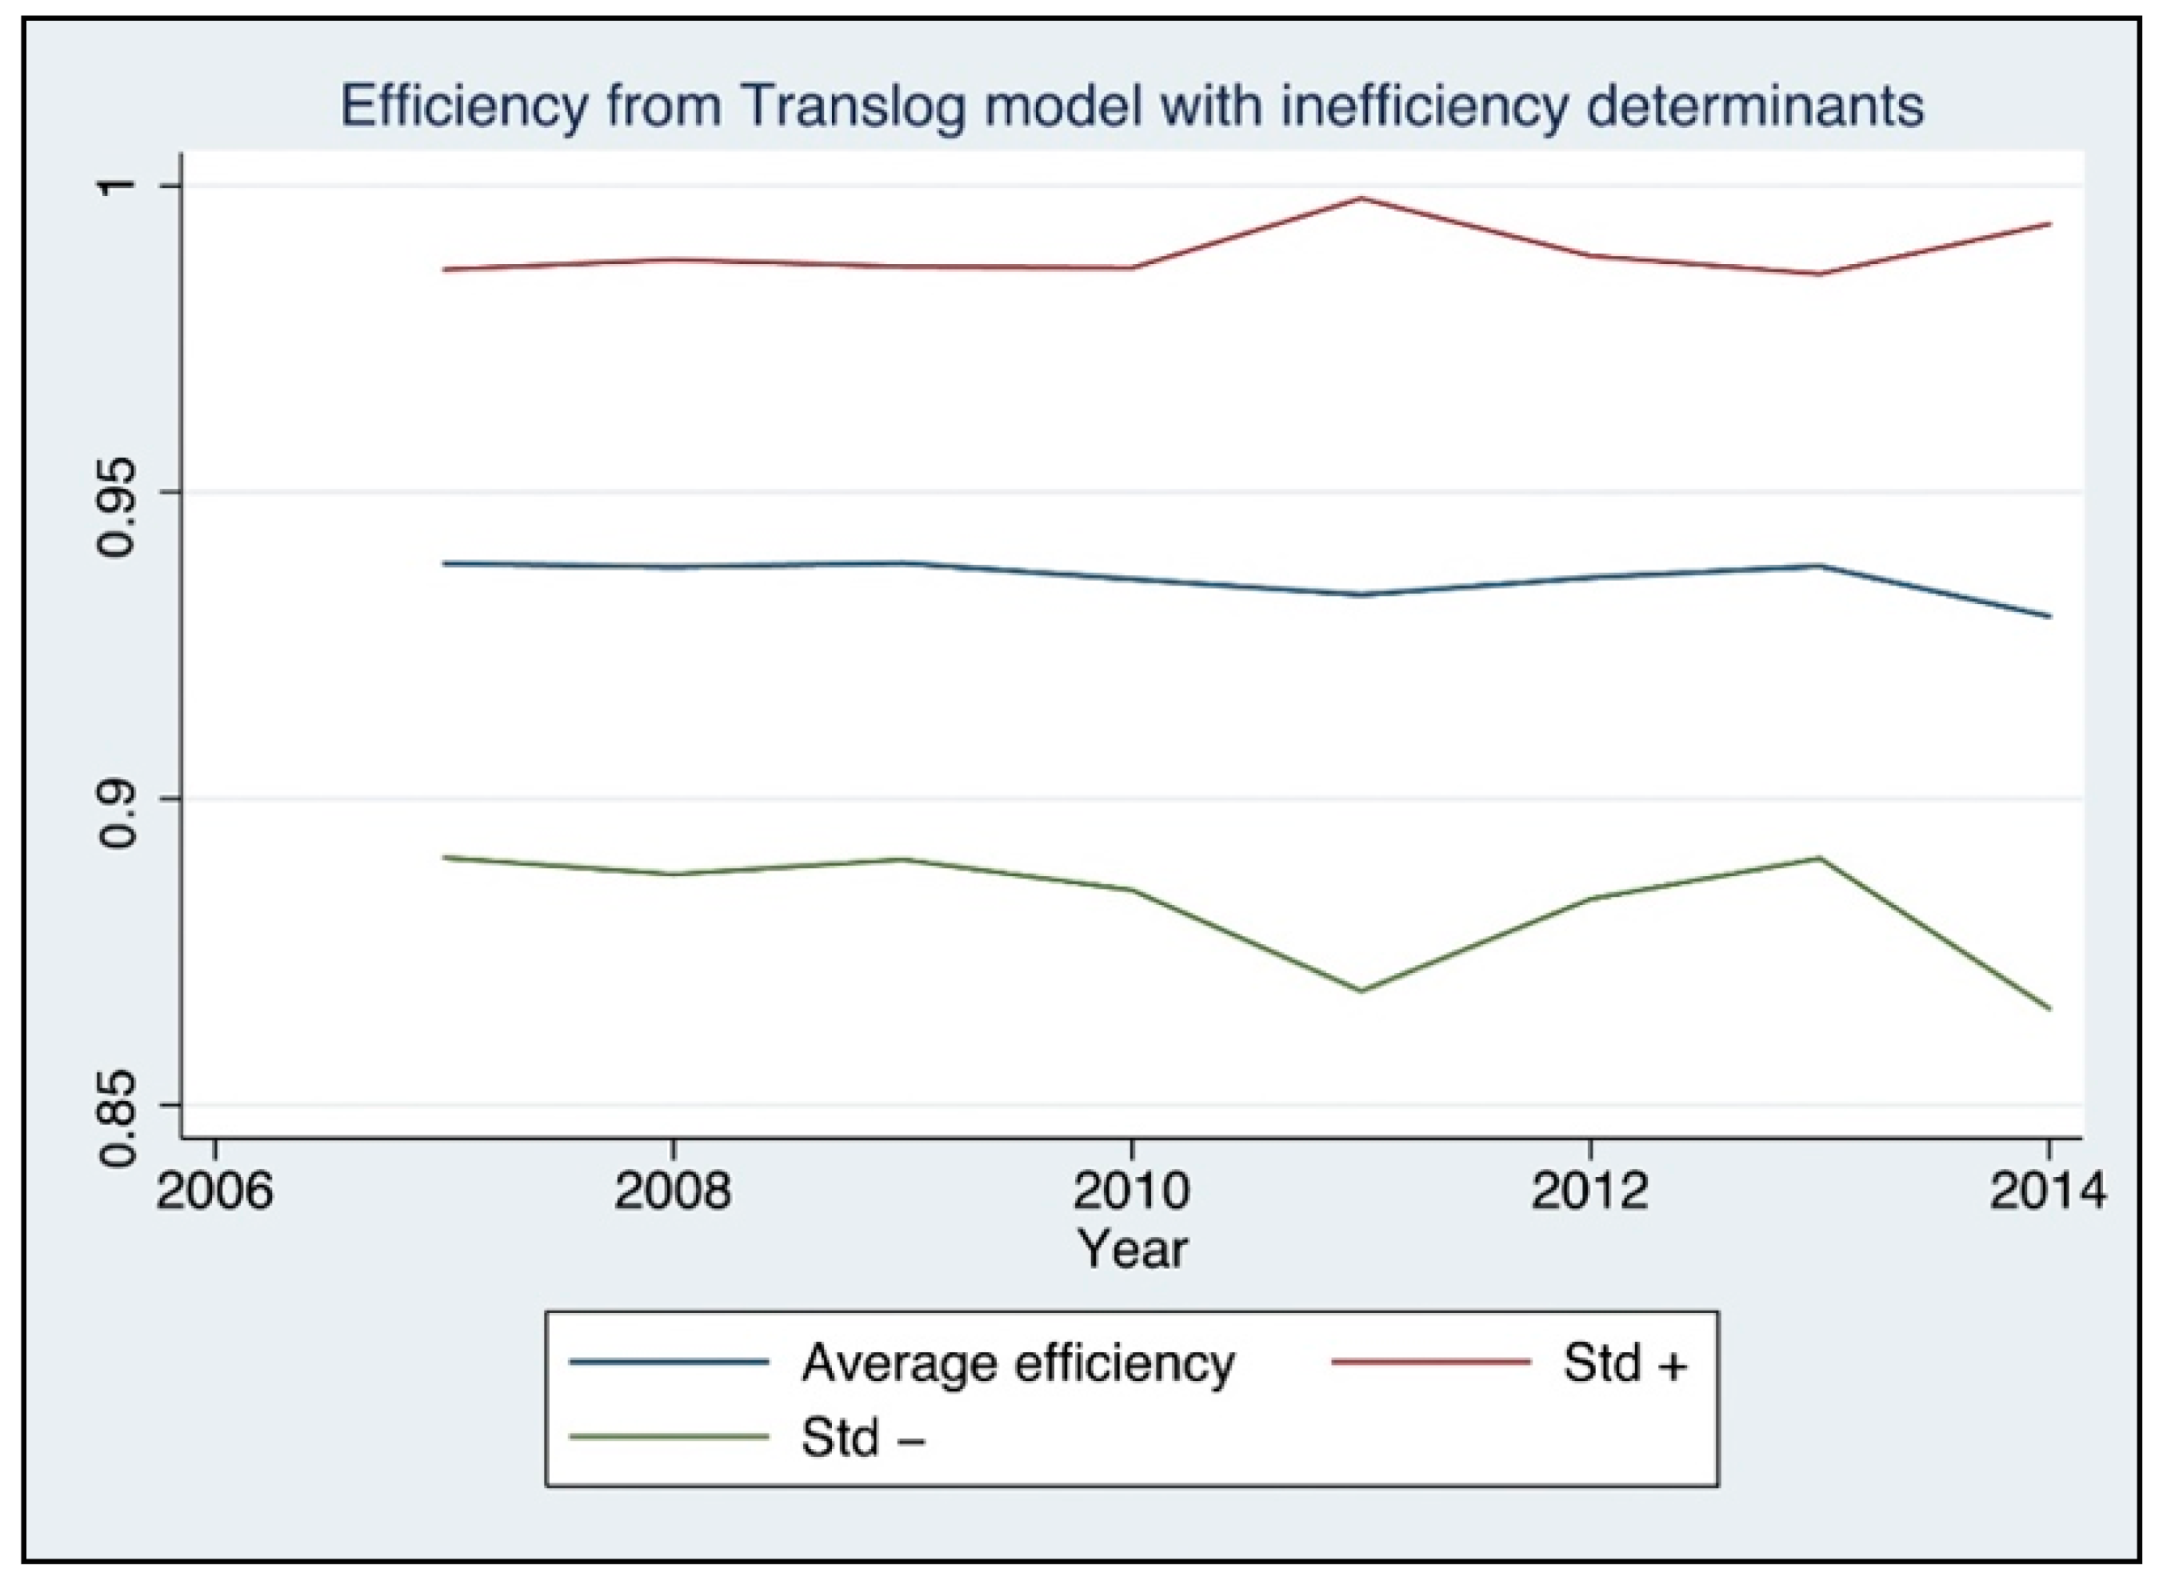
Figure 3 shows the average efficiency score for each year. It appears as though the average level of efficiency was fairly steady year on year, although possibly with a slight indication of a decrease towards the end of the sample. It also appears as though firms’ performance increasingly diverged over time. This should be of interest to the regulator and indicate that there are possible efficiency improvements possible among DNOs.
5. Conclusions
Effective economic regulation of electricity networks has been a goal of most developed countries following the energy industry liberalisation in the 1980s and 1990s. Incentivising network owners to behave in a way that mimics competition is seen as the second-best option after actual competition, which is normally not possible in natural monopolies.
Information asymmetries, where firms have an information advantage over the regulator in terms of actual costs, production, technology, and managerial effort, commonly arise in regulated industries. The regulator is at a disadvantage when determining the revenue allowances. As a result, many regulators rely on productivity and efficiency benchmarking to assess the firms’ performance. The choice of benchmarks and techniques to measure efficiency is a key factor and needs to reflect the environment in which the firms are working. If applied correctly, the regulator can reduce the information disadvantage and encourage efficiency improvement among the network utilities.
In this paper, we analyse the performance of Norwegian DNOs using data from 2007 to 2014 and a stochastic frontier analysis approach. We contribute to the literature by examining the impact of two, largely overlooked, areas in the sector: vertical integration between network levels and ownership structure. The results are interesting from a regulatory perspective. Generally, we find no real improvements in efficiency over time. Rather, we find a possible slight downward trend as well as some increase in firms’ performance divergence. This suggests that further improvements are possible. The latter finding is, however, not uncommon as some companies seem unable to catch up with the most efficient firms in the sector.
Moreover, we find that vertical integration between the DNO and regional transmission networks increases technical inefficiency, that its, network owners with an interest across different network levels are less efficient in the operation of the lower-level networks. Assumptions of vertical economies of scope and resource sharing does not seem to hold true in this instance. It may also be that the DNOs can shift some costs between the network levels depending on the regulatory framework, i.e., gaming of the regulator. Vertical integration between network levels is an area that would benefit from further research. It is noteworthy that the observed network vertical integration is not the result of vertical integration in the active sense. Rather, it mainly refers to the absence of vertical separation of the concerned network levels. In other words, the DNOs that retained an ownership interest in regional transmission networks did not perform better than the non-integrated DNOs.
The results on ownership structure indicate that an increase in Private ownership, with respect to State ownership, does not have a significant impact on inefficiency. However, an increase in Council ownership, with respect to State ownership, shows lower inefficiency. This is possibly explained by the state generally having a main interest in high-voltage electricity networks, rather than low voltage, and the decentralised model from which the now centralised system once was developed.
Finally, the choice of variables used to represent utility performance is open to discussion, and there is no consensus on the matter. The variables selected in this paper (i.e., number of substations and number of customers) are used to represent the size of the network, a common choice in benchmarking of electricity utilities. However, other variables, such as network losses or power quality indices, could be used as alternative indicators of performance and may prove to be more accurate. This was, however, not assessed as part of this paper due to a lack of data but should be considered in future studies.


