Abstract
This work presents an active thermal management system (TMS) for building a safer module of lithium-ion capacitor (LiC) technology, in which 10 LiCs are connected in series. The proposed TMS is a forced air-cooled TMS (ACTMS) that uses four axial DC 12 V fans: two fans are responsible for blowing the air from the environment into the container while two other fans suck the air from the container to the environment. An experimental investigation is conducted to study the thermal behavior of the module, and numerical simulations are carried out to be validated against the experiments. The main aim of the model development is the optimization of the proposed design. Therefore, the ACTMS has been optimized by investigating the impact of inlet air velocity, inlet and outlet positions, module rotation by 90° towards the airflow direction, gap spacing between neighboring cells, and uneven gap spacing between neighboring cells. The 3D thermal model is accurate, so the validation error between the simulation and experimental results is less than 1%. It is proven that the ACTMS is an excellent solution to keep the temperature of the LiC module in the desired range by air inlet velocity of 3 m/s when all the fans are blowing the air from both sides, the outlet is designed on top of the module, the module is rotated, and uneven gap space between neighboring cells is set to 2 mm for the first distance between the cells (d1) and 3 mm for the second distance (d2).
1. Introduction
The electric vehicle (EV) market is overgrowing due to the possibility to reduce emissions by removing the dependence of the automotive sector on traditional energy sources [1]. The main part of EVs is electrical energy storage systems (EESS) such as lithium-ion batteries (LiBs) or electric double-layer capacitors (EDLCs) [2]. LiBs feature high energy density while suffering from low power density [3]. EDLCs are perfect solutions for high power demands due to high power densities and long lifetimes. However, the drawback of limited energy density has restricted their usage for vehicular application [4]. In such respect, a hybrid EESS has emerged that combines the advantages of LiBs with EDLCs. Lithium-ion capacitor (LiC) is a promising technology that uses anode of LiBs and cathode of EDLCs [5]. Despite the high energy and power density, as well as long cycle life, LiCs’ performance strongly depends on the working temperature, especially under peak power demands [6]. Therefore, a robust thermal management system (TMS) is inevitable to extend the lifetime of LiCs while ensuring safety [7].
In general, two types of TMS are utilized to cool down the EESS such as active and passive [8,9]. Passive counts for heat sink [10], heat pipe [11], and phase change materials (PCMs) [12] while active cooling counts for forced air-cooled systems and liquid cooling techniques [13,14]. PCM is a material with the high latent heat of fusion capable of storing high amounts of heat by absorbing the heat loss of the cell [15,16]. However, PCM suffers from low thermal conductivity [17], which is its primary problem to remove the absorbed heat efficiently [18]. Therefore, a secondary material is required to enhance PCM’s capability to reject the absorbed heat to the environment by improving its thermal conductivity. Such a secondary system can be aluminum mesh [19], copper foam [20], nanofluids [21], nanomaterials, graphite, or heat pipes [22]. Heat pipes are superconductors with high thermal conductivity that generally comprise three sections: condenser, evaporator, and adiabatic [23]. The significant drawbacks of heat pipes are their dependency on gravity [24], their complex design [25], and low heat removal capability in high power applications.
On the other hand, liquid-based cooling systems have a high thermal capability with susceptibility to leaks [26,27]. In addition, due to having moving parts, the maintenance cost of liquid cooling systems is relatively high, which makes them a more costly solution. Noise is another drawback when high pumping speed is needed [28]. Air-based cooling systems are noise-free and less complex than liquid cooling, making them a good candidate when the ambient temperature is not high [29]. Although the heat transfer coefficient of air-based cooling systems is lower than liquid-based systems [30], air cooling usage is logical if the system is well structured and the inlet–outlet positions are adequately designed to remove the excess heat from the system to the environment [31]. A comparative study between air-based and liquid-based cooling methods is presented by Akbarzadeh et al. [32] for a 48 V LiB module. Wang et al. [33] optimized an air cooling system in which the cooling efficiency of the proposed system was enhanced using parallel plates. They investigated the position of the inlet and outlet and found that, in the best case after optimization of the system, the maximum temperature and temperature difference were reduced by around 6% and 91%, respectively. Kausthubharam et al. [34] investigated the cooling performance of an air-based cooling system numerically for a cylindrical LiB module. The inlet air velocity correlates to the power consumption and temperature of the module directly. Additionally, they found that the generated heat of the module is proportional to its discharge potential. Li et al. [35] modeled an air-based cooling system for a LiB pack and optimized the configuration of the proposed design and the flow velocity. Xu et al. [36] optimized an air-based cooling system and showed that the system with double-layer plates diminishes the module’s temperature by 11% while reducing the temperature uniformity by 31.5%. Karimi et al. [37] designed an air based TMS for a LiC cell in which the cell’s temperature was reduced by 14% compared to the natural convection case study.
Based on the literature, and to the authors’ knowledge, the only published work in LiC’s air cooling topology is Soltani et al. [38], in which they investigated an air cooling system for a LiC module and proved that side cooling system with air velocity of 5 m/s and gap spacing of 5 mm would be optimum design. Nevertheless, they investigated the LiC temperature under 100 A that cannot be considered a current power that diminishes the lifetime of the LiC [39], as it generates low heat loss around 8 W per cell, the maximum temperature of the cell would be around 40 °C, in the worst scenario. Such a temperature range can be reduced by a simple passive cooling system, which does not need any active cooling system with moving parts and maintenance costs. The present work aims to work with LiC technology under harsh conditions where very high power loads are applied to the module. The driving profile of this work is 150 A continuous current rate without any pause that generates more than double heat loss that was generated from the same LiC in the work of Soltani et al. [38]. Therefore, the novelty of this work lies in designing a forced air-cooled TMS (ACTMS) with four axial DC fans capable of cooling the LiC technology under very high power demand. Without a robust TMS, the operation of the LiC will be limited to below 500 s and will jeopardize its life span.
Moreover, a precise model is required to model the thermal behavior of the module [40]. Therefore, an accurate 3D thermal model is designed at the module level thanks to the COMSOL Multiphysics® software package. In the proposed TMS (ACTMS), two fans are responsible for blowing the air from the environment into the LiC module container while two other fans are sucking the air from the container to the environment. Experimental tests are conducted to study the thermal behavior of the module, and numerical simulations are carried out to be validated against the experiments. The main aim of the model development is the optimization of the proposed design. Therefore, the ACTMS has been optimized by investigating the impact of inlet air velocity, fan position, gap spacing between neighboring cells, and uneven gap spacing between neighboring cells.
2. Numerical Solution
This paper presents a 3D thermal model to validate and optimize a forced air-cooled TMS (ACTMS). Computational fluid dynamics (CFD) techniques and codes were performed to design, analyze, and optimize fluid flow processes/equipment. In this experimental and numerical study, the 3D numerical simulation analysis has been performed using COMSOL Multiphysics® software package. The proposed ACTMS is responsible for cooling down the LiC 2300 F in high-power applications. The characteristics of the target cell are listed in Table 1.

Table 1.
Specifications of the lithium-ion capacitor.
2.1. 3D Thermal Model
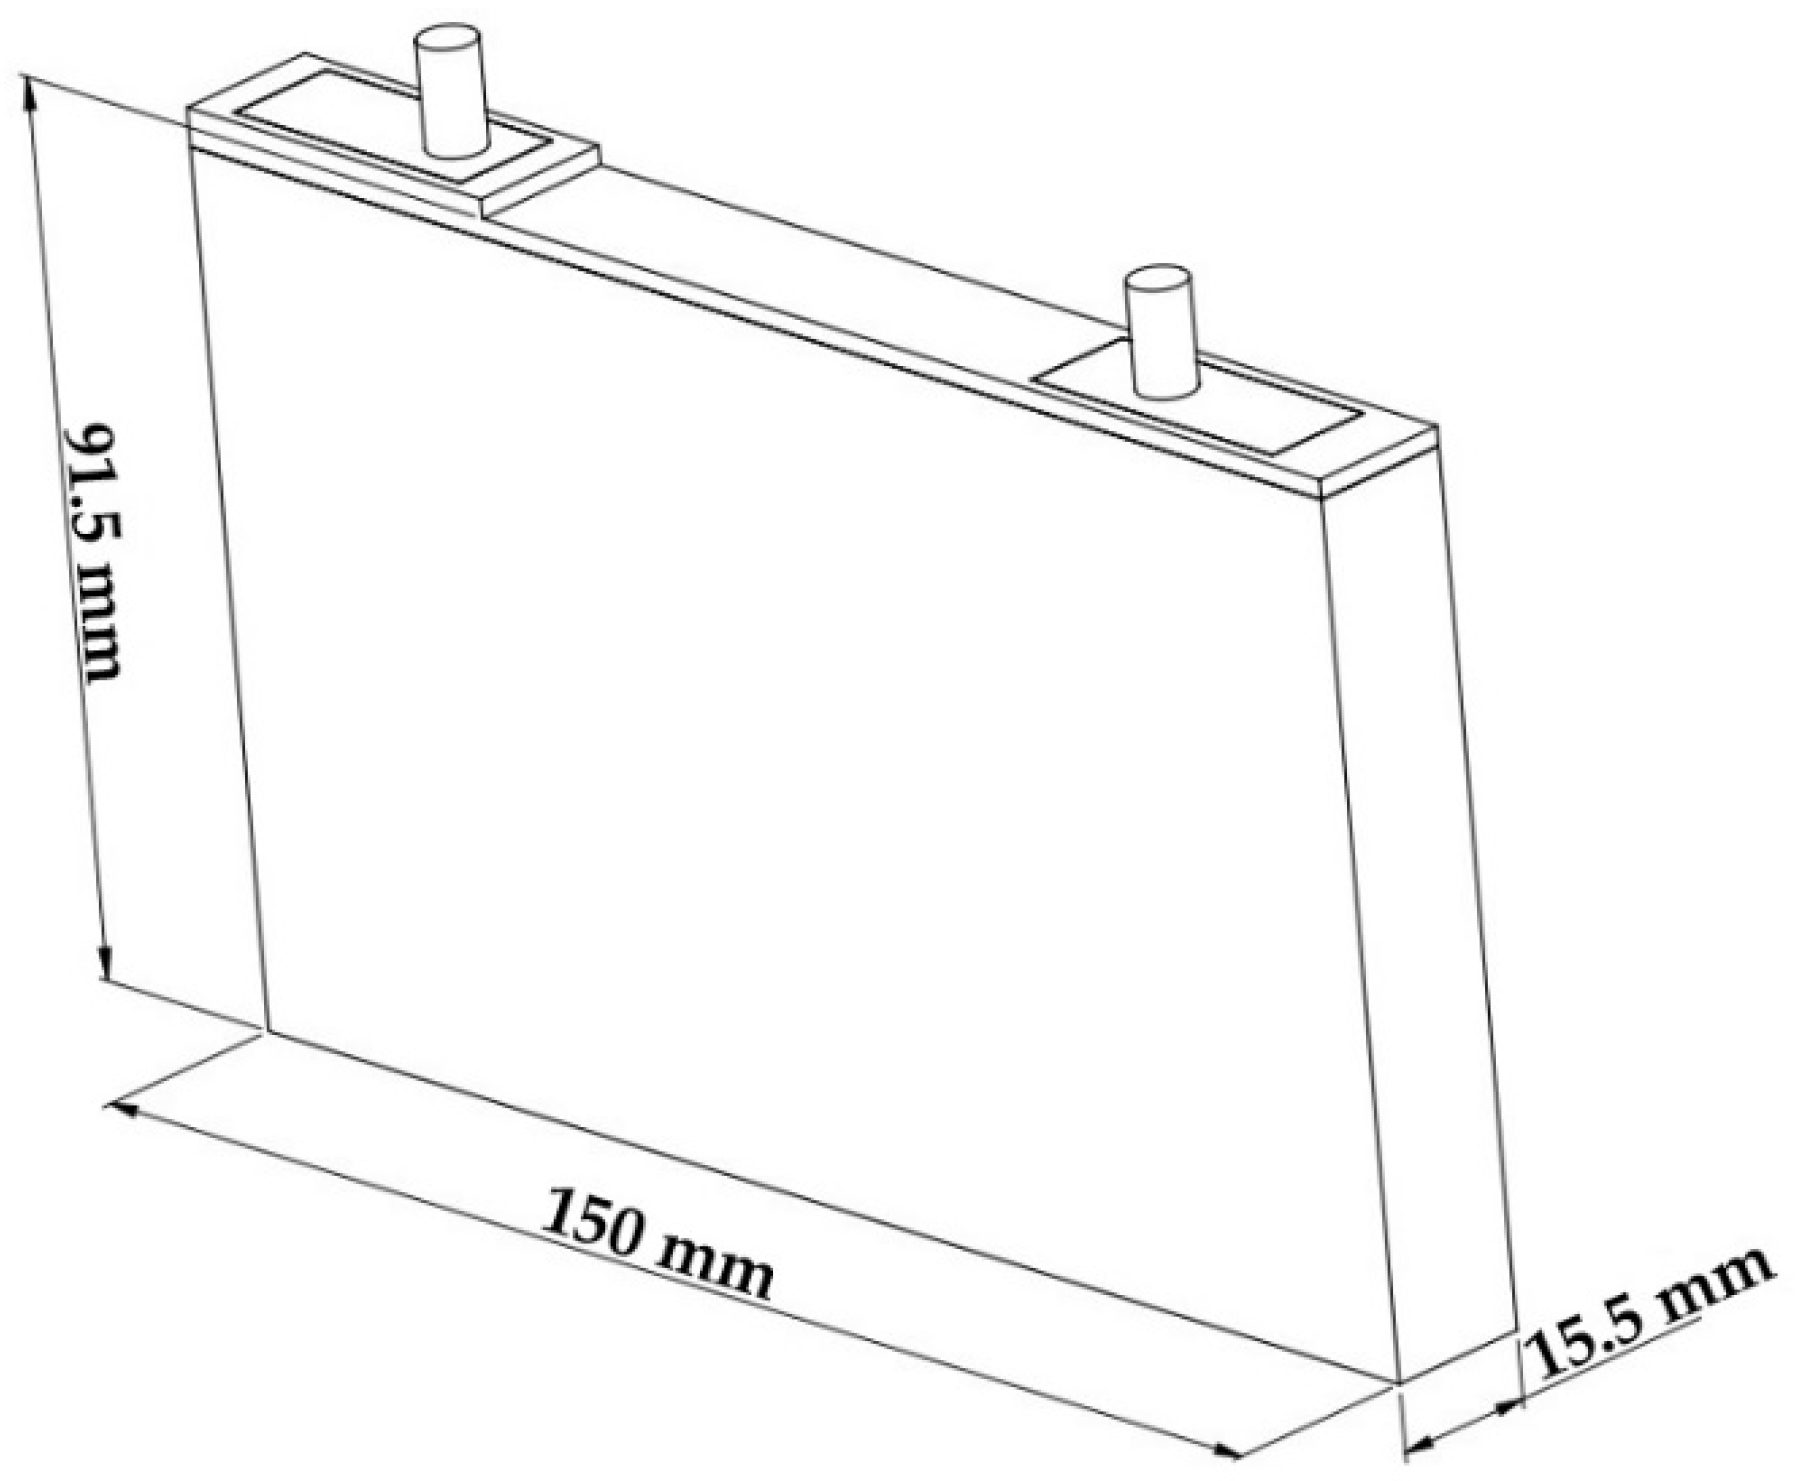
The 3D thermal model focuses on the ACTMS for a LiC module containing 10 LiC cells in series, that is charged and discharged under an aggressive current profile. The current profile continuously charges/discharges the cells in 1400 s without any rest between the charges and discharges, which is more aggressive than other current profiles with only one discharge with a high current rate. The 3D representation of the 2300 F LiC cell is shown in Figure 1. The geometry of the LiC is designed in Autodesk INVENTOR, and then the cell is extended to a module of 10 cells in series in the next sub-section. Finally, the ACTMS with the proper inlet and outlets are designed and assembled.

Figure 1.
Dimensions of the target LiC cell.
After designing the cell/module, the model is imported into COMSOL Multiphysics to numerically analyze its thermal behavior using two modules, including heat transfer in the solids and fluid flow modules. The CFD model has different materials with different thermal characteristics for the tab, electrode, and container domains. The tab domain contains negative and positive tabs with copper and aluminum materials, respectively. Additionally, the container domain is made of Polyvinyl Chloride (PVC) with very low thermal conductivity to insulate the module inside. This method is a perfect condition to check the thermal performance and robustness of the ACTMS for high power applications where high peak power is requested from the driver in an electric vehicle. As shown in Table 2 for the thermal conductivity, two directions have the same thermal conductivity, while x-direction has lower thermal conductivity than y- and z-directions. The reason for this lies in many single layers in this direction inside the cell [41].
Table 2.
Characteristics of different domains of the LiC cell.
2.2. Governing Equations
2.2.1. Heat Generation Model for the LiC
The designed geometry developed in the previous section is used for thermal analysis, composed of 10 LiC cells in series. Such a module design boosts the voltage from 22 V to 38 V, with the same capacity. The 3D thermal model is solved for the module to investigate the thermal behavior of the module under natural convection (NC). This method helps to understand the impact of the designed TMS by comparing its temperature contour with the NC case. Two heat sources are contributing to generate the power loss of the LiC are internal and external. The chemical reactions inside the cell are internal, while the external heat source is mainly in the tab domains. These two heat sources are inserted in the CFD software to investigate the temperature evolution of the LiC during the 1400 s current profile.
The main governing equation that should be solved for the heat generation of each LiC cell under the NC case study is the first law of thermodynamics, that is, the energy balance equation [42]:
where (kg/m3) and Cp (J/kg·K) represent the density and heat capacity of the LiC. Additionally, T (K), λ (W/m·K), and (W/m3) denote the temperature, thermal conductivity, and generated heat of the LiC, respectively.
As explained in detail, the temperature distribution of the LiC is not uniform. Therefore, the generated heat loss () for the heat sources is divided into cell and tab domains [43]:
, , , and represent the cell, tab, irreversible, and reversible heat generations, respectively. Additionally, (Ωm), (m), and (m2) are the resistivity, length, and the cross-sectional area, respectively.
The convective heat transfer forms the transferred heat from the cell to the surrounding, which is explained as:
where (W/m2), (K), and (K) denote the convective heat transfer coefficient, the ambient temperature, and the LiC temperature, respectively.
2.2.2. Forced Air-Cooled Model
Regarding the governing equations for the heat generation of the cell and the convective heat transfer, the coefficient of convection for the ACTMS is different from the NC case study. Therefore, the CFD software sets the convective heat transfer coefficient regarding the air properties, air inlet flow rate, and gap spacing between the cells. In this regard, the energy conversion equations are combined with the flow conservation equations. The equations that are considered in the 3D CFD model to calculate the flow field and temperature distribution of the module are continuity, energy conservation, and momentum conservation equations for the air-cooled module [44]:
where (m/s), (kg/m3), (J/kg·K), (W/m.K), (kg/m.s), P (Pa), and (K) denote the inlet air’s velocity, mass density, specific heat, thermal conductivity, dynamic viscosity, pressure, and temperature, respectively.
The inlet velocity (V) for the main case study is set to 3 m/s, and the gap spacing between the neighboring cells is considered zero, meaning that the cells are stuck to each other without any space. In the first step, the inlet Reynolds number should be calculated to understand whether the flow is laminar or turbulent:
The density of the air () is 1.184 kg/m3, and its dynamic viscosity () is 1.86 × 10⁻⁵ kg/m.s. The hydraulic diameter () of the inlet is 0.12 m for each of the four fans. The flow state, even for one inlet fan, is turbulent (Re ≈ 22,916). Therefore, turbulent model should be considered for the numerical simulations. The turbulent governing equations are explained as [45]:
where , , , , , , , , , , , , and represent the turbulent kinetic energy, turbulent dissipation rate, the component of the velocity vector, molecular dynamic viscosity coefficient, turbulent dynamic viscosity coefficient, turbulent kinetic energy generation result of mean velocity, turbulent kinetic energy caused by buoyancy effects, contribution of fluctuating dilatation incompressible turbulent to the total dissipation rate, source term of , source term of , inverse effective Prandtl number for , inverse effective Prandtl number for , and empirical parameters, respectively. As was mentioned, COMSOL Multiphysics is utilized for solving the equations in numerical simulations.
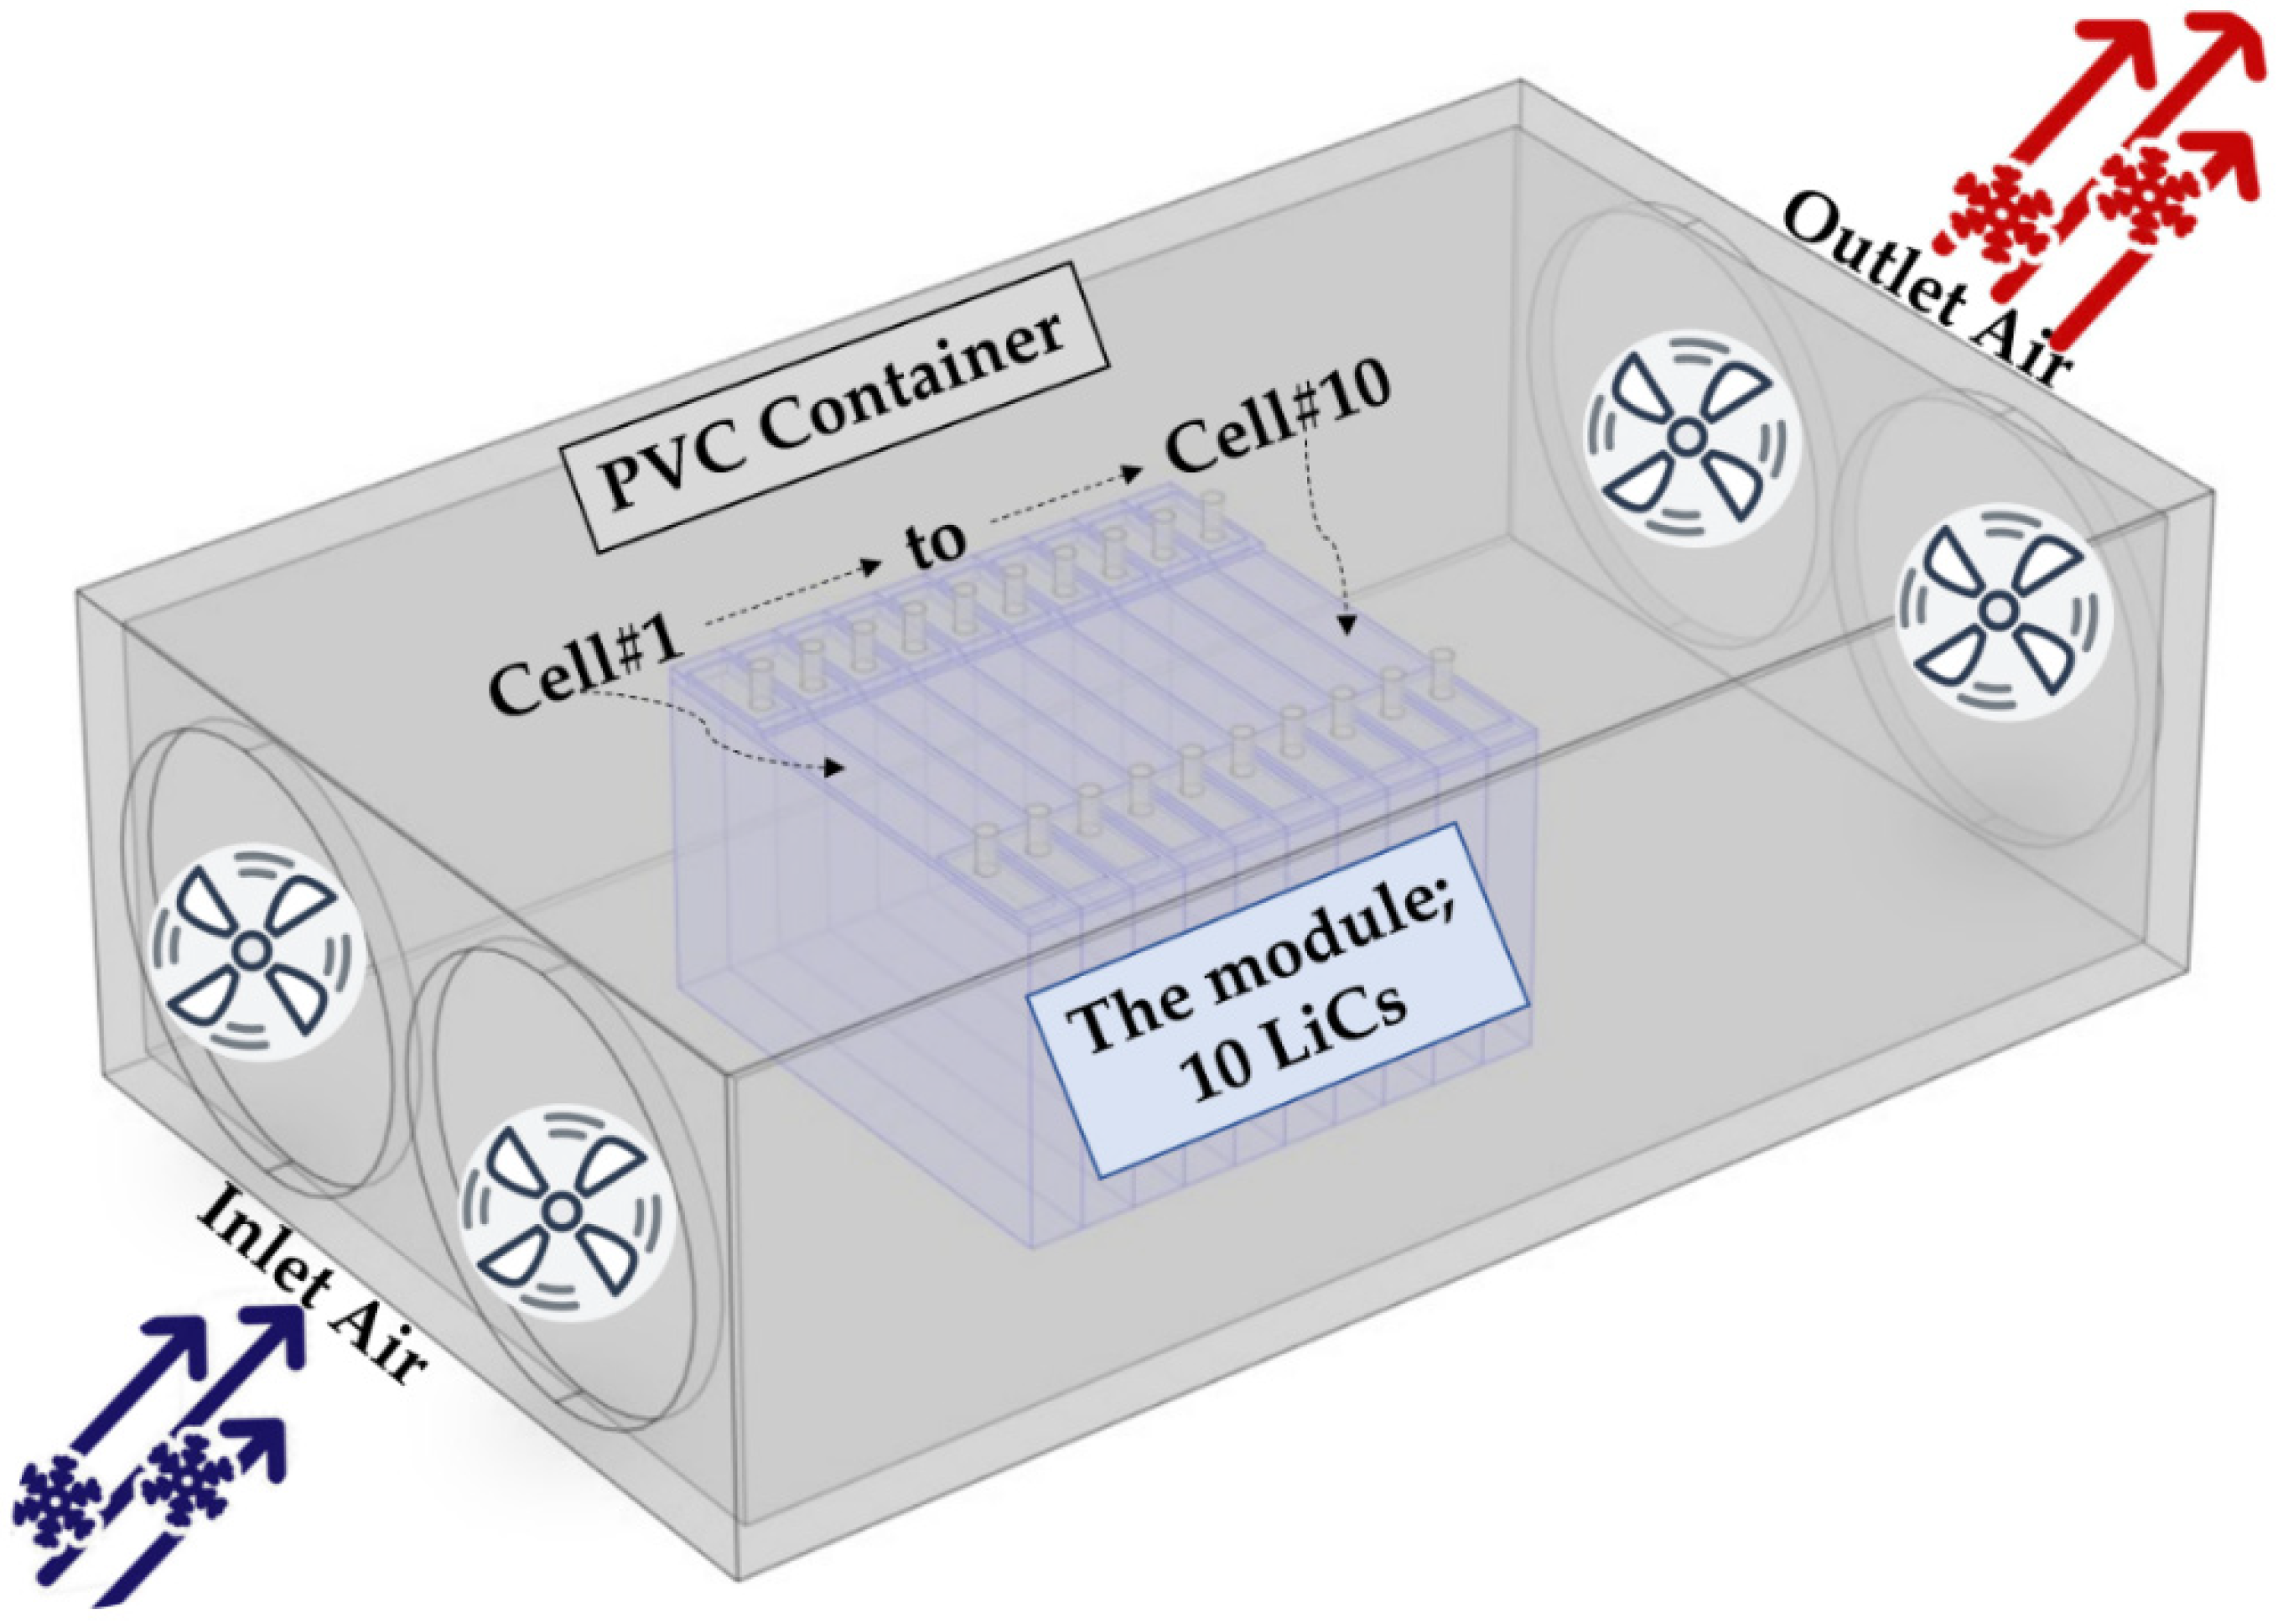
The graphical view of the LiC module and the ACTMS in the CFD software is depicted in Figure 2, in which two fans are mounted on each side of the container to blow the air on the module and to suck the air from the module to the surrounding.
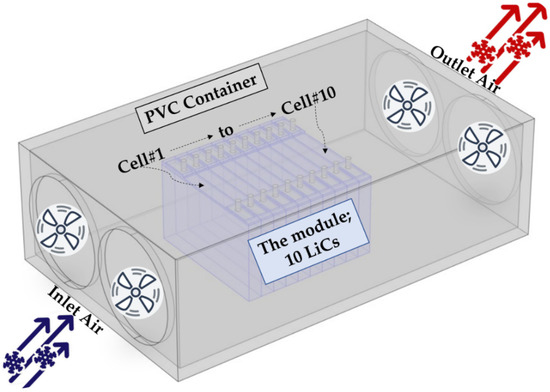
Figure 2.
Schematic of the LiC module and the ACTMS in the CFD software.
The conditions that are used to run the simulation should also be added to the CFD software. All the initial conditions and boundaries that are set to COMSOL Multiphysics are listed in Table 3.
Table 3.
Initial conditions and boundaries of the CFD model.
The precision of the results strongly depends on the selected solver and type/number of mesh elements. The simulation process for the ACTMS was time-consuming due to various scales of geometry and equations’ non-linearity. The mesh independence analysis has been applied to this model with different mesh sizes. Finally, the maximum number of helpful mesh to solve the finite elements analysis (FEA) model using the CFD software was selected. Based on the grid density tests, an appropriate grid system of 163,562 mesh elements over the entire domain is considered the maximum number of elements to save time and memory. In addition, testing the time step on the solution results in using 1 s step time to integrate the governing equations.
The forced cooling strategy is simulated, and thermal analysis for the ACTMS is conducted after designing the system and setting the initial and boundary conditions. After verifying the model with experimental tests, it can be further optimized to enhance its thermal performance. The most vital parameters to investigate the cooling system’s thermal performance and compare it with the NC case study are the maximum temperature of the module and the temperature difference between coldest and hottest cells. The module’s maximum temperature can be considered the hottest zone in one of the cells regarding the position of thermocouples. The direction of the air is considered parallel to the largest surface of the LiC to extract the heat more effectively.
3. Experimental Test Bench
A real-life experimental test bench is needed to investigate the proposed ACTMS model accurately. In such context, a module of 10 LiC cells is designed in series connection and built in the laboratory of Mobility, Logistic, and Automotive research center (MOBI), Vrije Universiteit Brussel (VUB).
3.1. Test Bench Setup
A forced ACTMS is employed to control the temperature of the LiC module through four axial DC fans. The employed facilities are the PEC battery tester with 12 channels for cycling the module, a computer to control the battery tester, a data logger, and K-type thermocouples to receive the temperature data. The data logger is PICO TS08 with ±0.2% of reading temperature accuracy. Its overvoltage protection is ±30 V with 2 MΩ input impedance. As can be seen from Figure 3, the LiC module is surrounded by the PVC container. Four axial DC fans (two on each side) with a nominal voltage of 12 V are responsible for blowing the ambient fresh air into the container and sucking the hot air from the container to the environment.
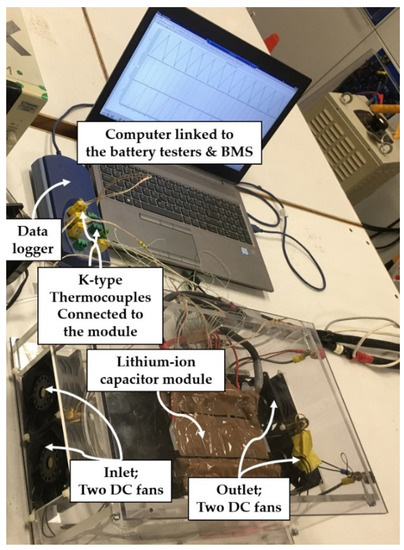
Figure 3.
The forced ACTMS experimental test bench for the LiC module.
3.2. Experimental Results
The results of cycling the LiC module under 150 A continuous fast charging/discharging without rest are explained in this section. The thermocouples receive the temperature of the cells and send the temperature profile through the link between the data logger and the computer. The maximum temperature of the module under the NC case study without using any TMS is around 70 °C, which is harmful for the capacity degradation of LiC cells, the reasons for which are explained in detail in our previous published work [39]. The temperature of the hottest cell using the proposed cooling solution (the forced ACTMS) decreases sharply by 37%, which is quite good for such a harsh driving profile. The experimental results of the module when employing the forced ACTMS as a cooling solution are depicted in Figure 4. As is seen, the temperature difference between the hottest cell (43.7 °C) and the coldest cell (34.7 °C) is 9 °C. In the next section, the numerical analysis aids in optimizing the design and geometry of the system as well as the initial and boundary conditions to conclude with the most optimum forced air-cooling solution for high power applications.
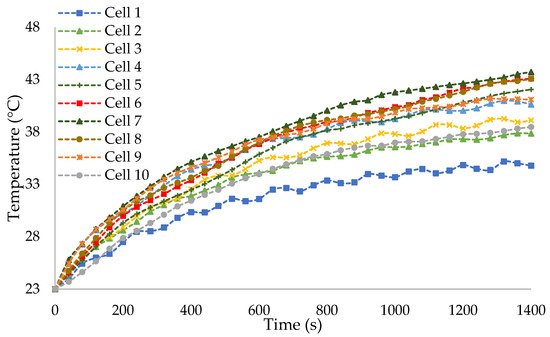
Figure 4.
The experimental results of the module when using ACTMS as a cooling solution.
4. Validation Results
This section deals with the numerical analysis and simulation of the proposed forced air-cooled solution to validate the experimental results. After verification, the initial and boundary conditions of the ACTMS, as well as its geometry and design, will be further optimized.
4.1. Forced Air-Cooled Simulation Results
The topology explained in the previous sections is analyzed numerically in this section using the COMSOL Multiphysics software package. In such a context, the heat transfer module and fluid flow module are employed. The initial and boundary conditions and the thermal parameters required to run the 3D CFD model are listed in Table 2 and Table 3. The air inlet velocity is set to 3 m/s in the main model. Additionally, there is no gap spacing between neighboring cells in the main model. The inlet air velocity and gap spacing between neighboring cells will be optimized in the optimization section.
Based on the exhibited simulation results of Figure 5, by checking the temperature of all the LiC cells in the module, it is evident that cell number 1 at the beginning of the module and in front of two fans has the lowest temperature at around 34.8 °C. The position of thermocouples for all the cells is close to the positive tab made of aluminum. The reason is that the positive tab is hotter than the negative tab for the LiC cell. Cell number 7 is the hottest cell among the 10 cells, as it is in between the cells far from the fans. Additionally, conduction between cells is a significant reason for the accumulation of hot spots in the middle of the module. It is worth mentioning that gap spacing between the neighboring cells is a determining factor for accumulating hot spots in the middle of the module. In this design, cells number 1, 2, and 3 are the coldest cells with the temperature of 34.8 °C, 37.8 °C, and 38.5 °C, respectively. Additionally, cells number 6 and 8 are the hottest cells after cell number 7, at 43 °C and 43.1 °C, respectively. The position of fans is a significant factor for removing the hot spots from the middle of the module, which will be studied in the optimization section.
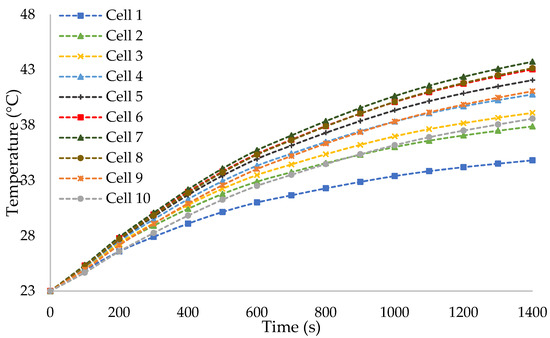
Figure 5.
The simulation results of the module when using ACTMS as a cooling solution, this is the main case study with inlet air velocity of V = 3 m/s, no gap spacing between the neighboring cells, inlet air temperature of 23 °C, and environment temperature of 23 °C.
4.2. Validation
The experimental results should be compared with the simulation results to validate the numerical analysis of the 3D CFD model. The maximum temperature of the module, surface temperature of each cell, and temperature difference between the coldest and hottest points on the cell surfaces are investigated by running the 3D CFD model, which is used for comparison analysis. As shown in Figure 5, for inlet air velocity of 3 m/s when there is no gap space between neighboring cells, the temperature difference between the hottest cell (43.7 °C) and the coldest cell (34.8 °C) is 8.9 °C, in the numerical simulation. Comparing the simulation and experimental results where this temperature difference was 9 °C shows that the simulation error is around 1% that is unique. It is evident that the numerical simulations are in an excellent match with the experimental results, proving the accuracy of the 3D CFD model.
5. Optimization of the ACTMS
5.1. Impact of the Inlet Air Velocity
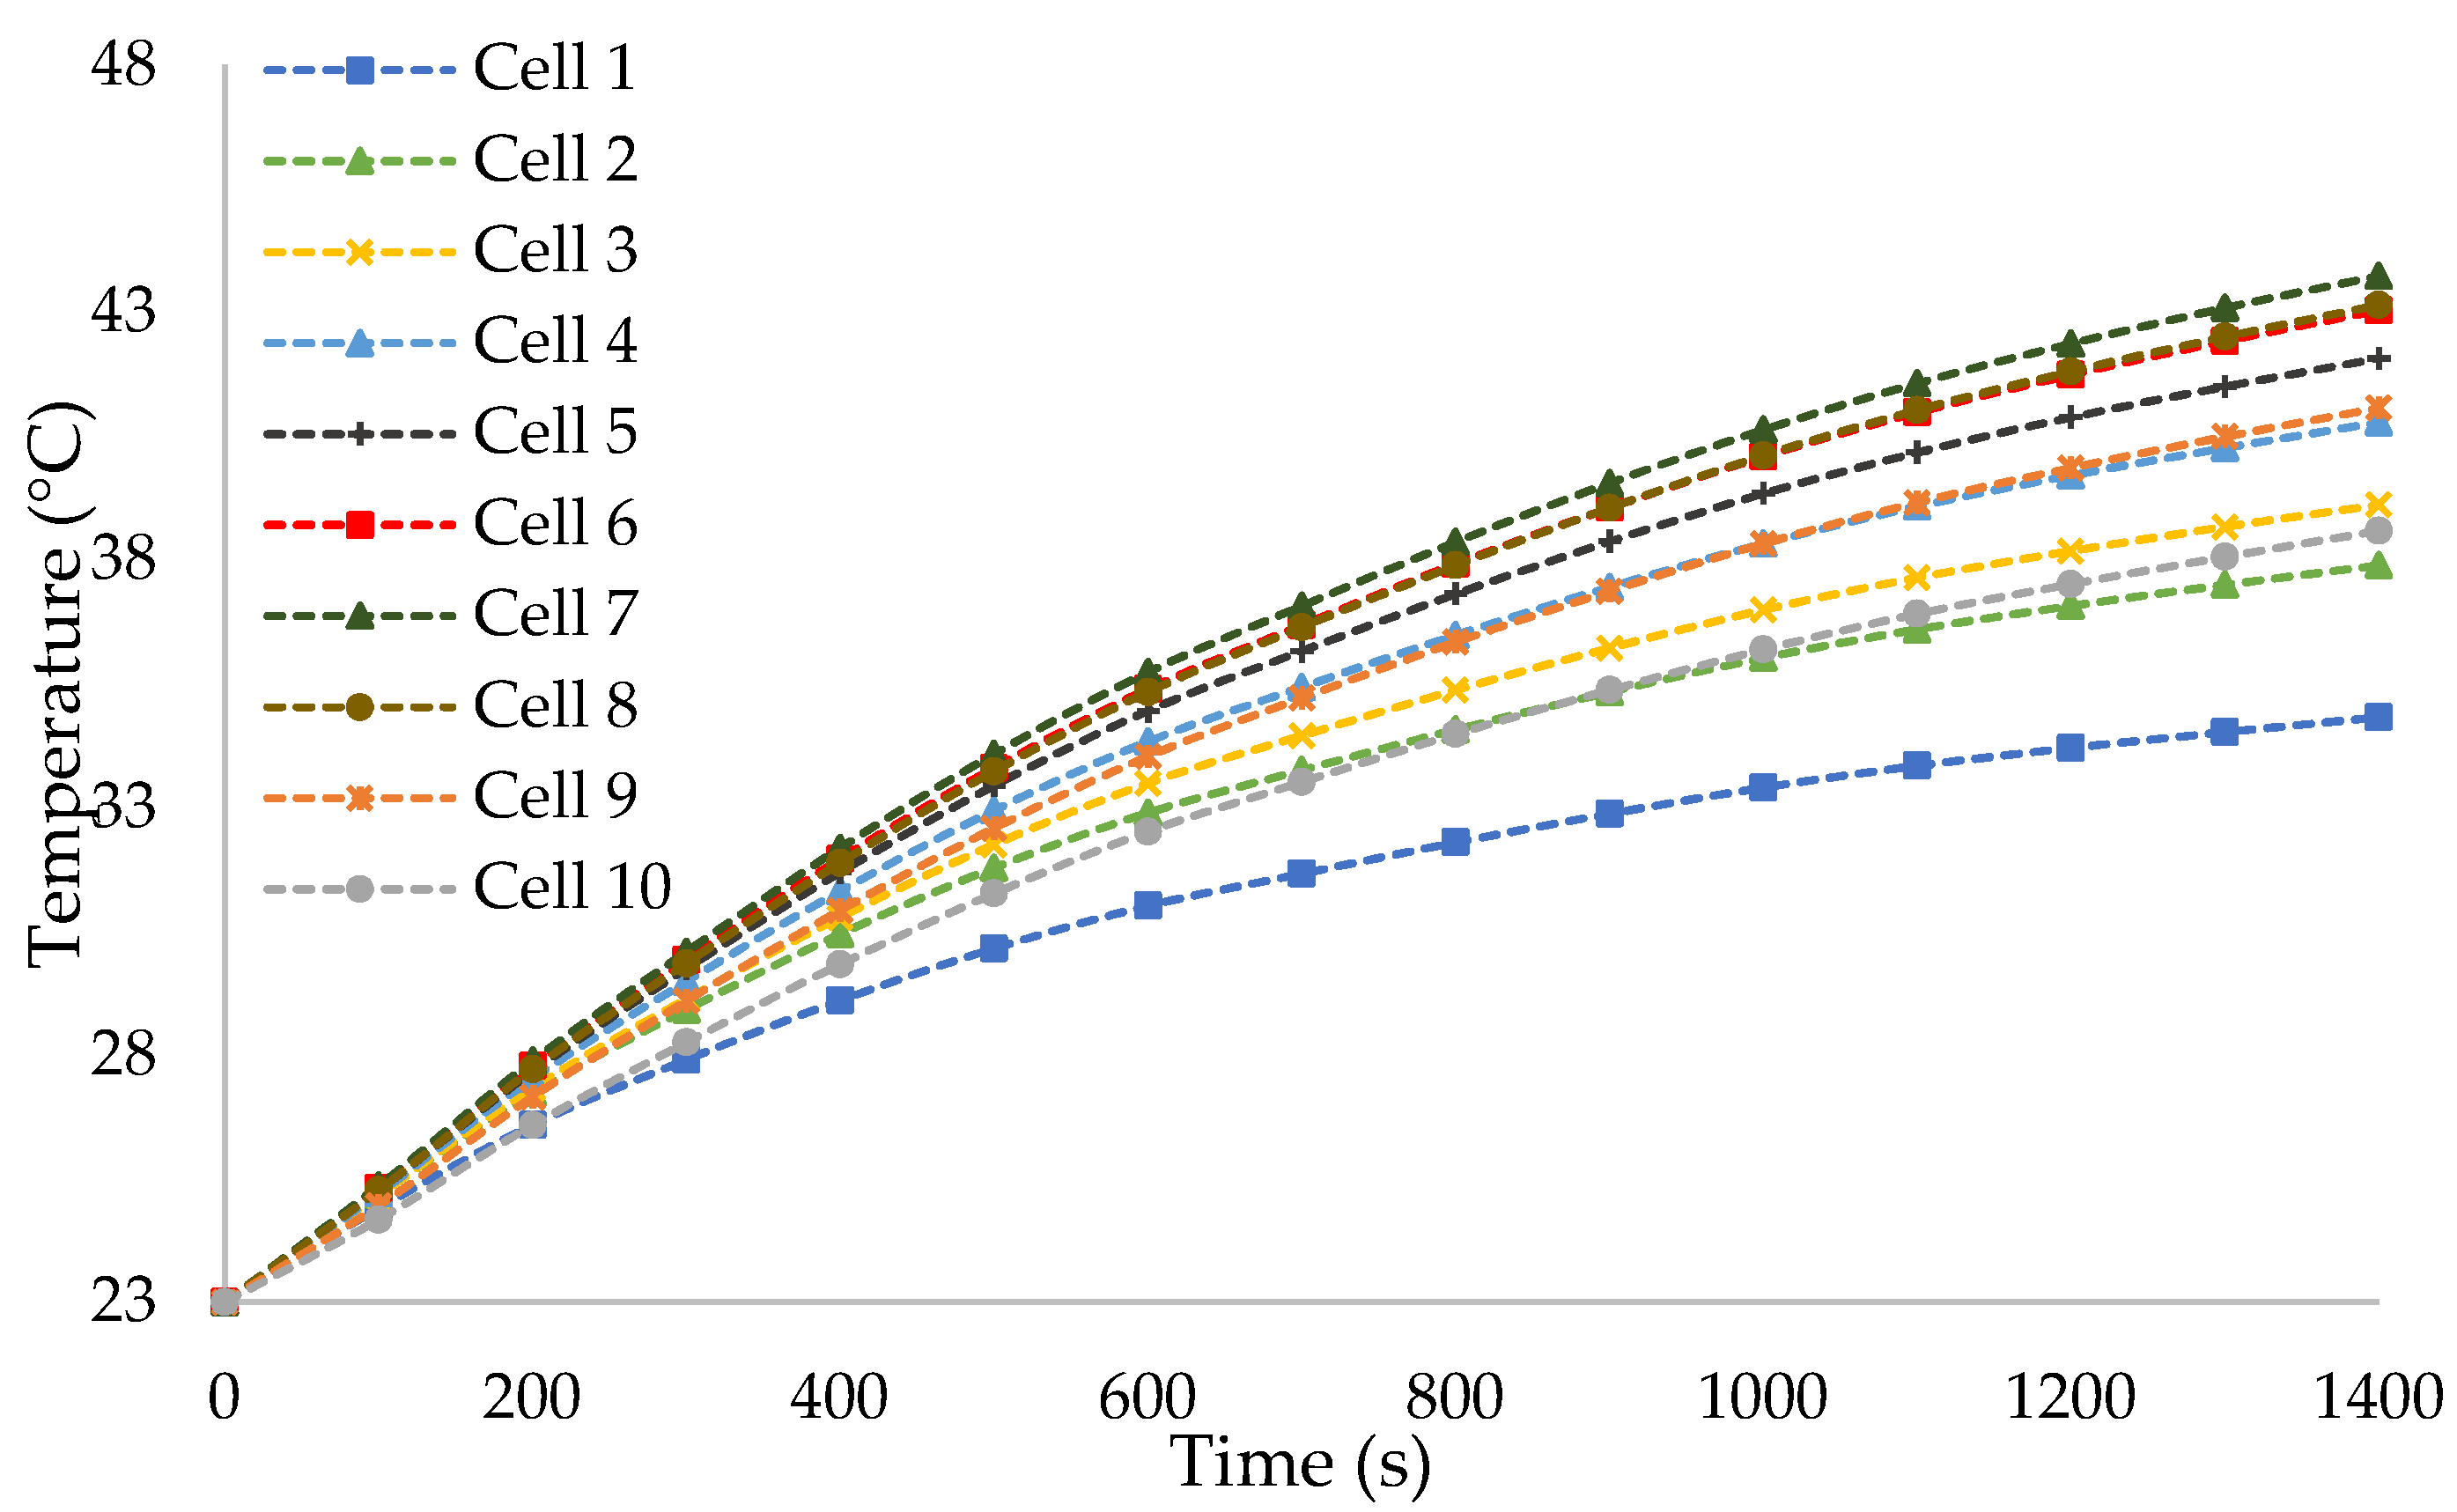
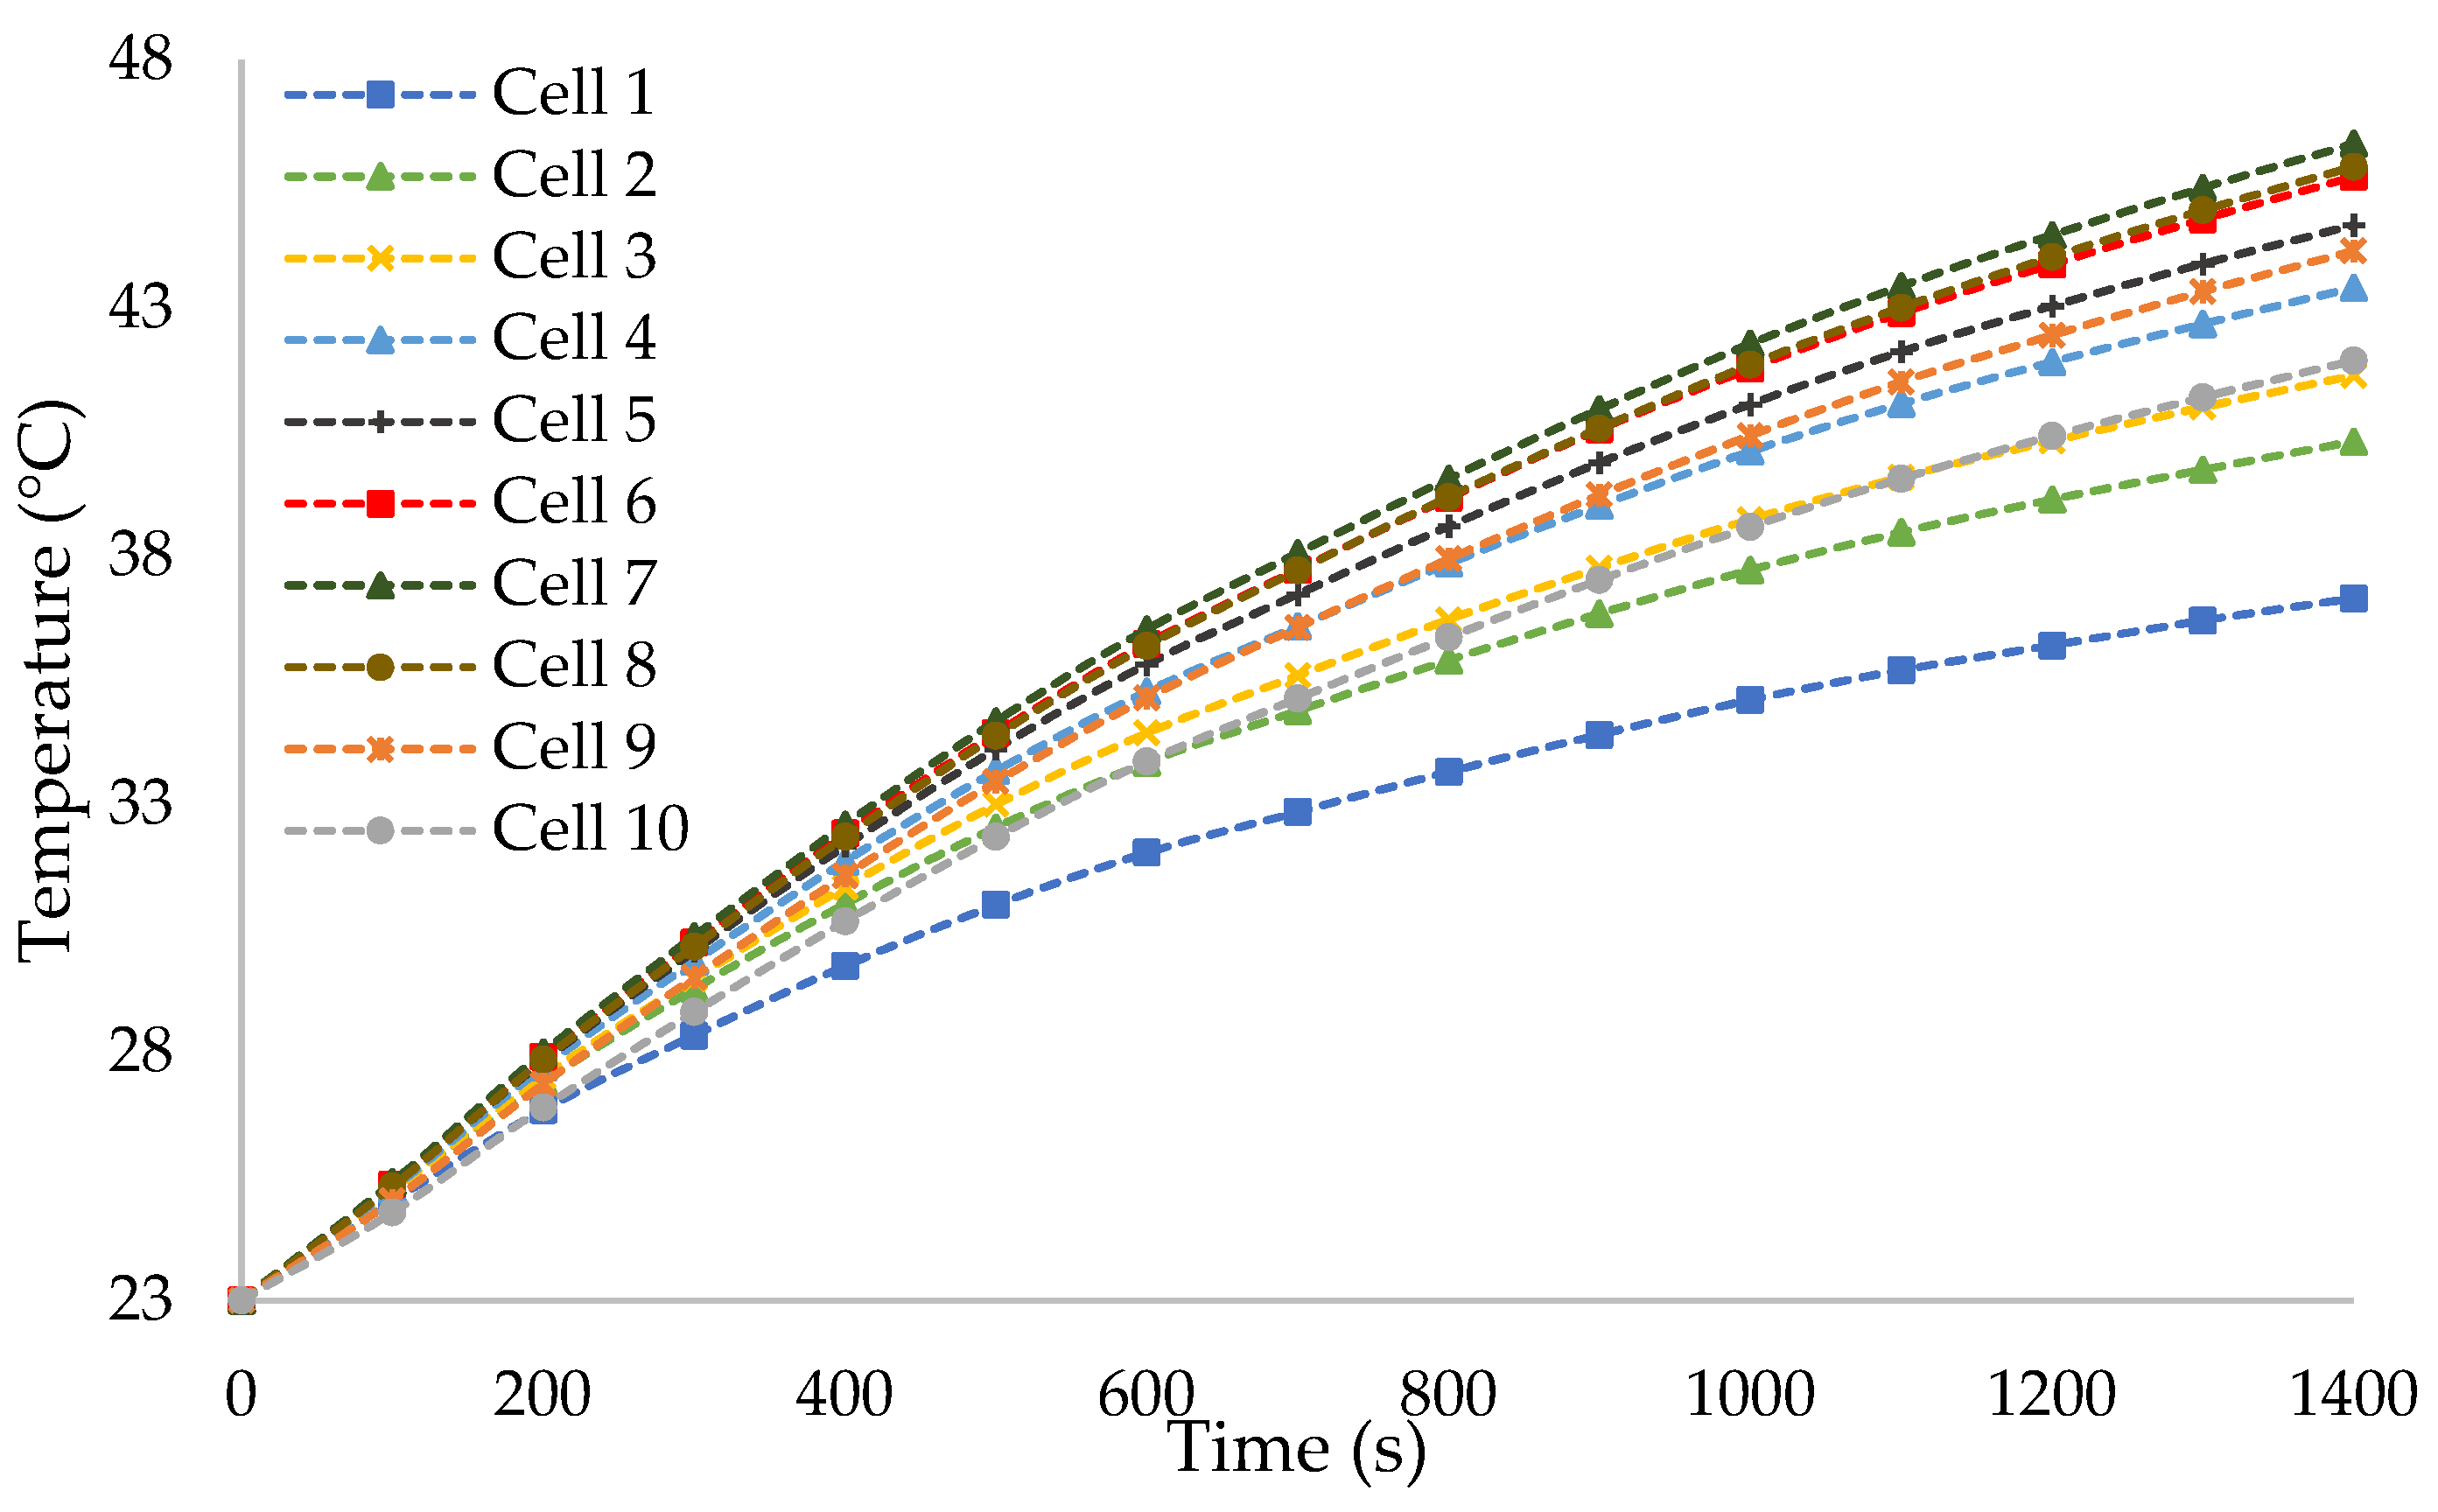
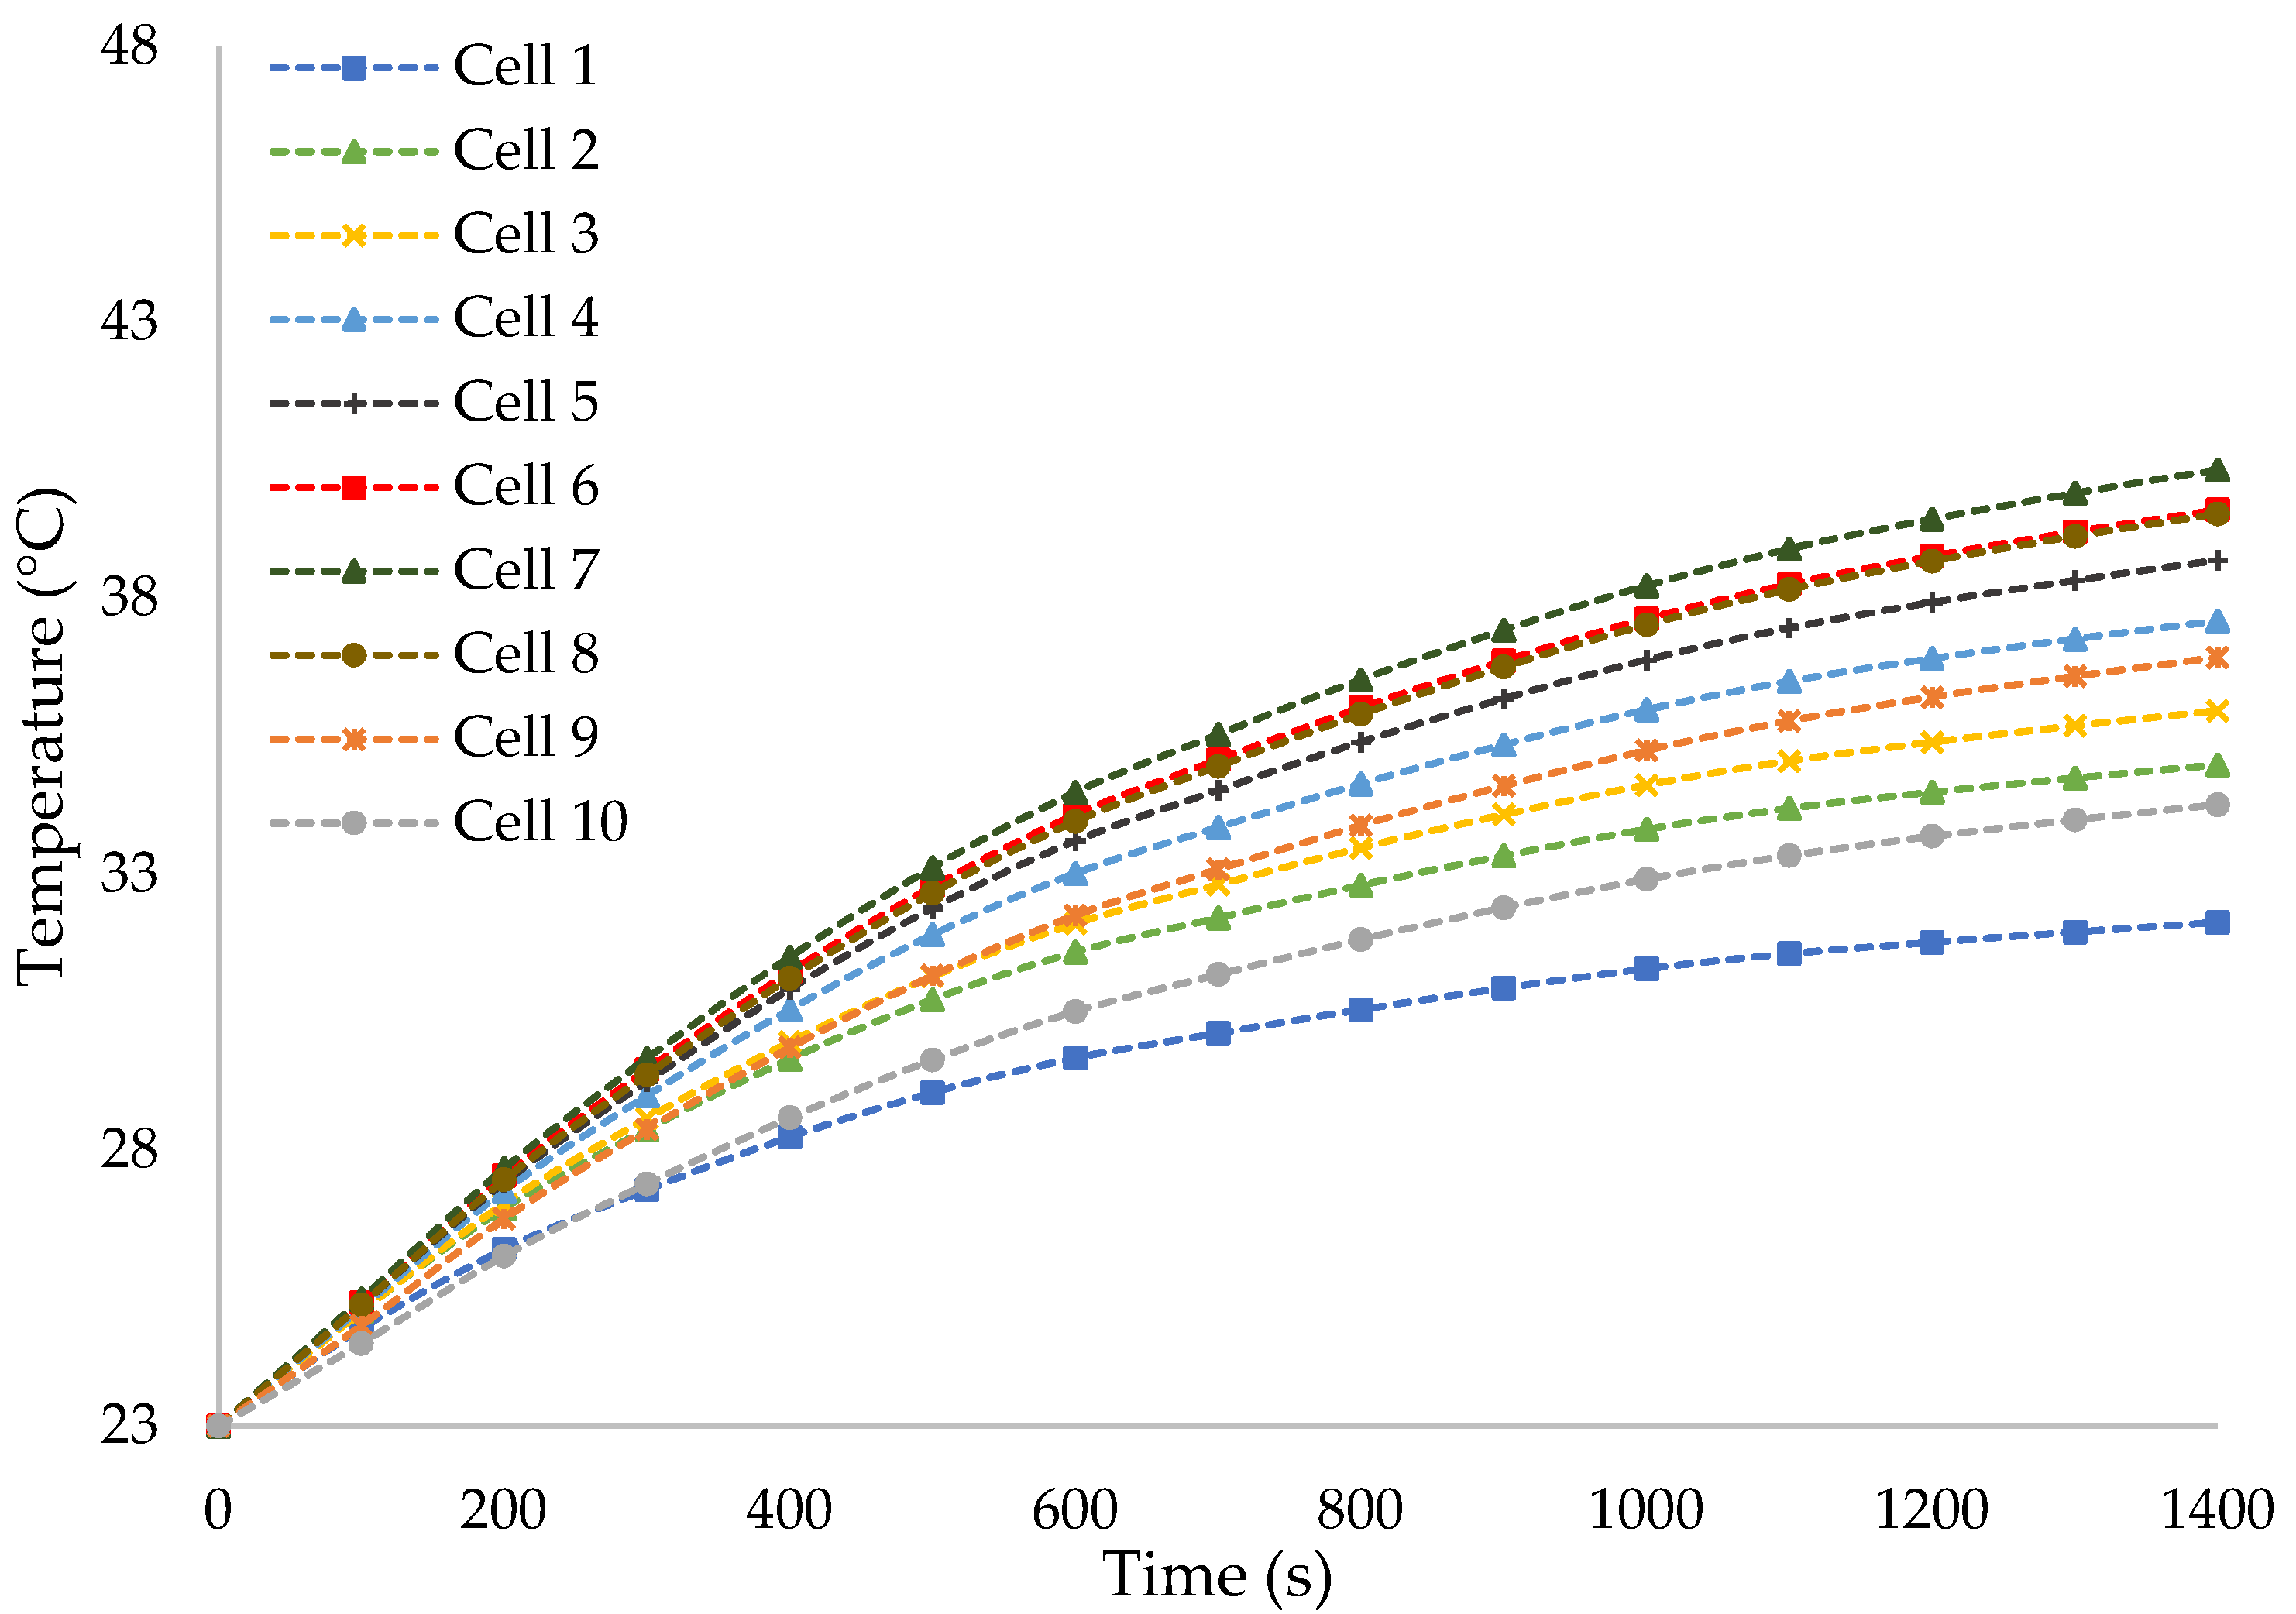
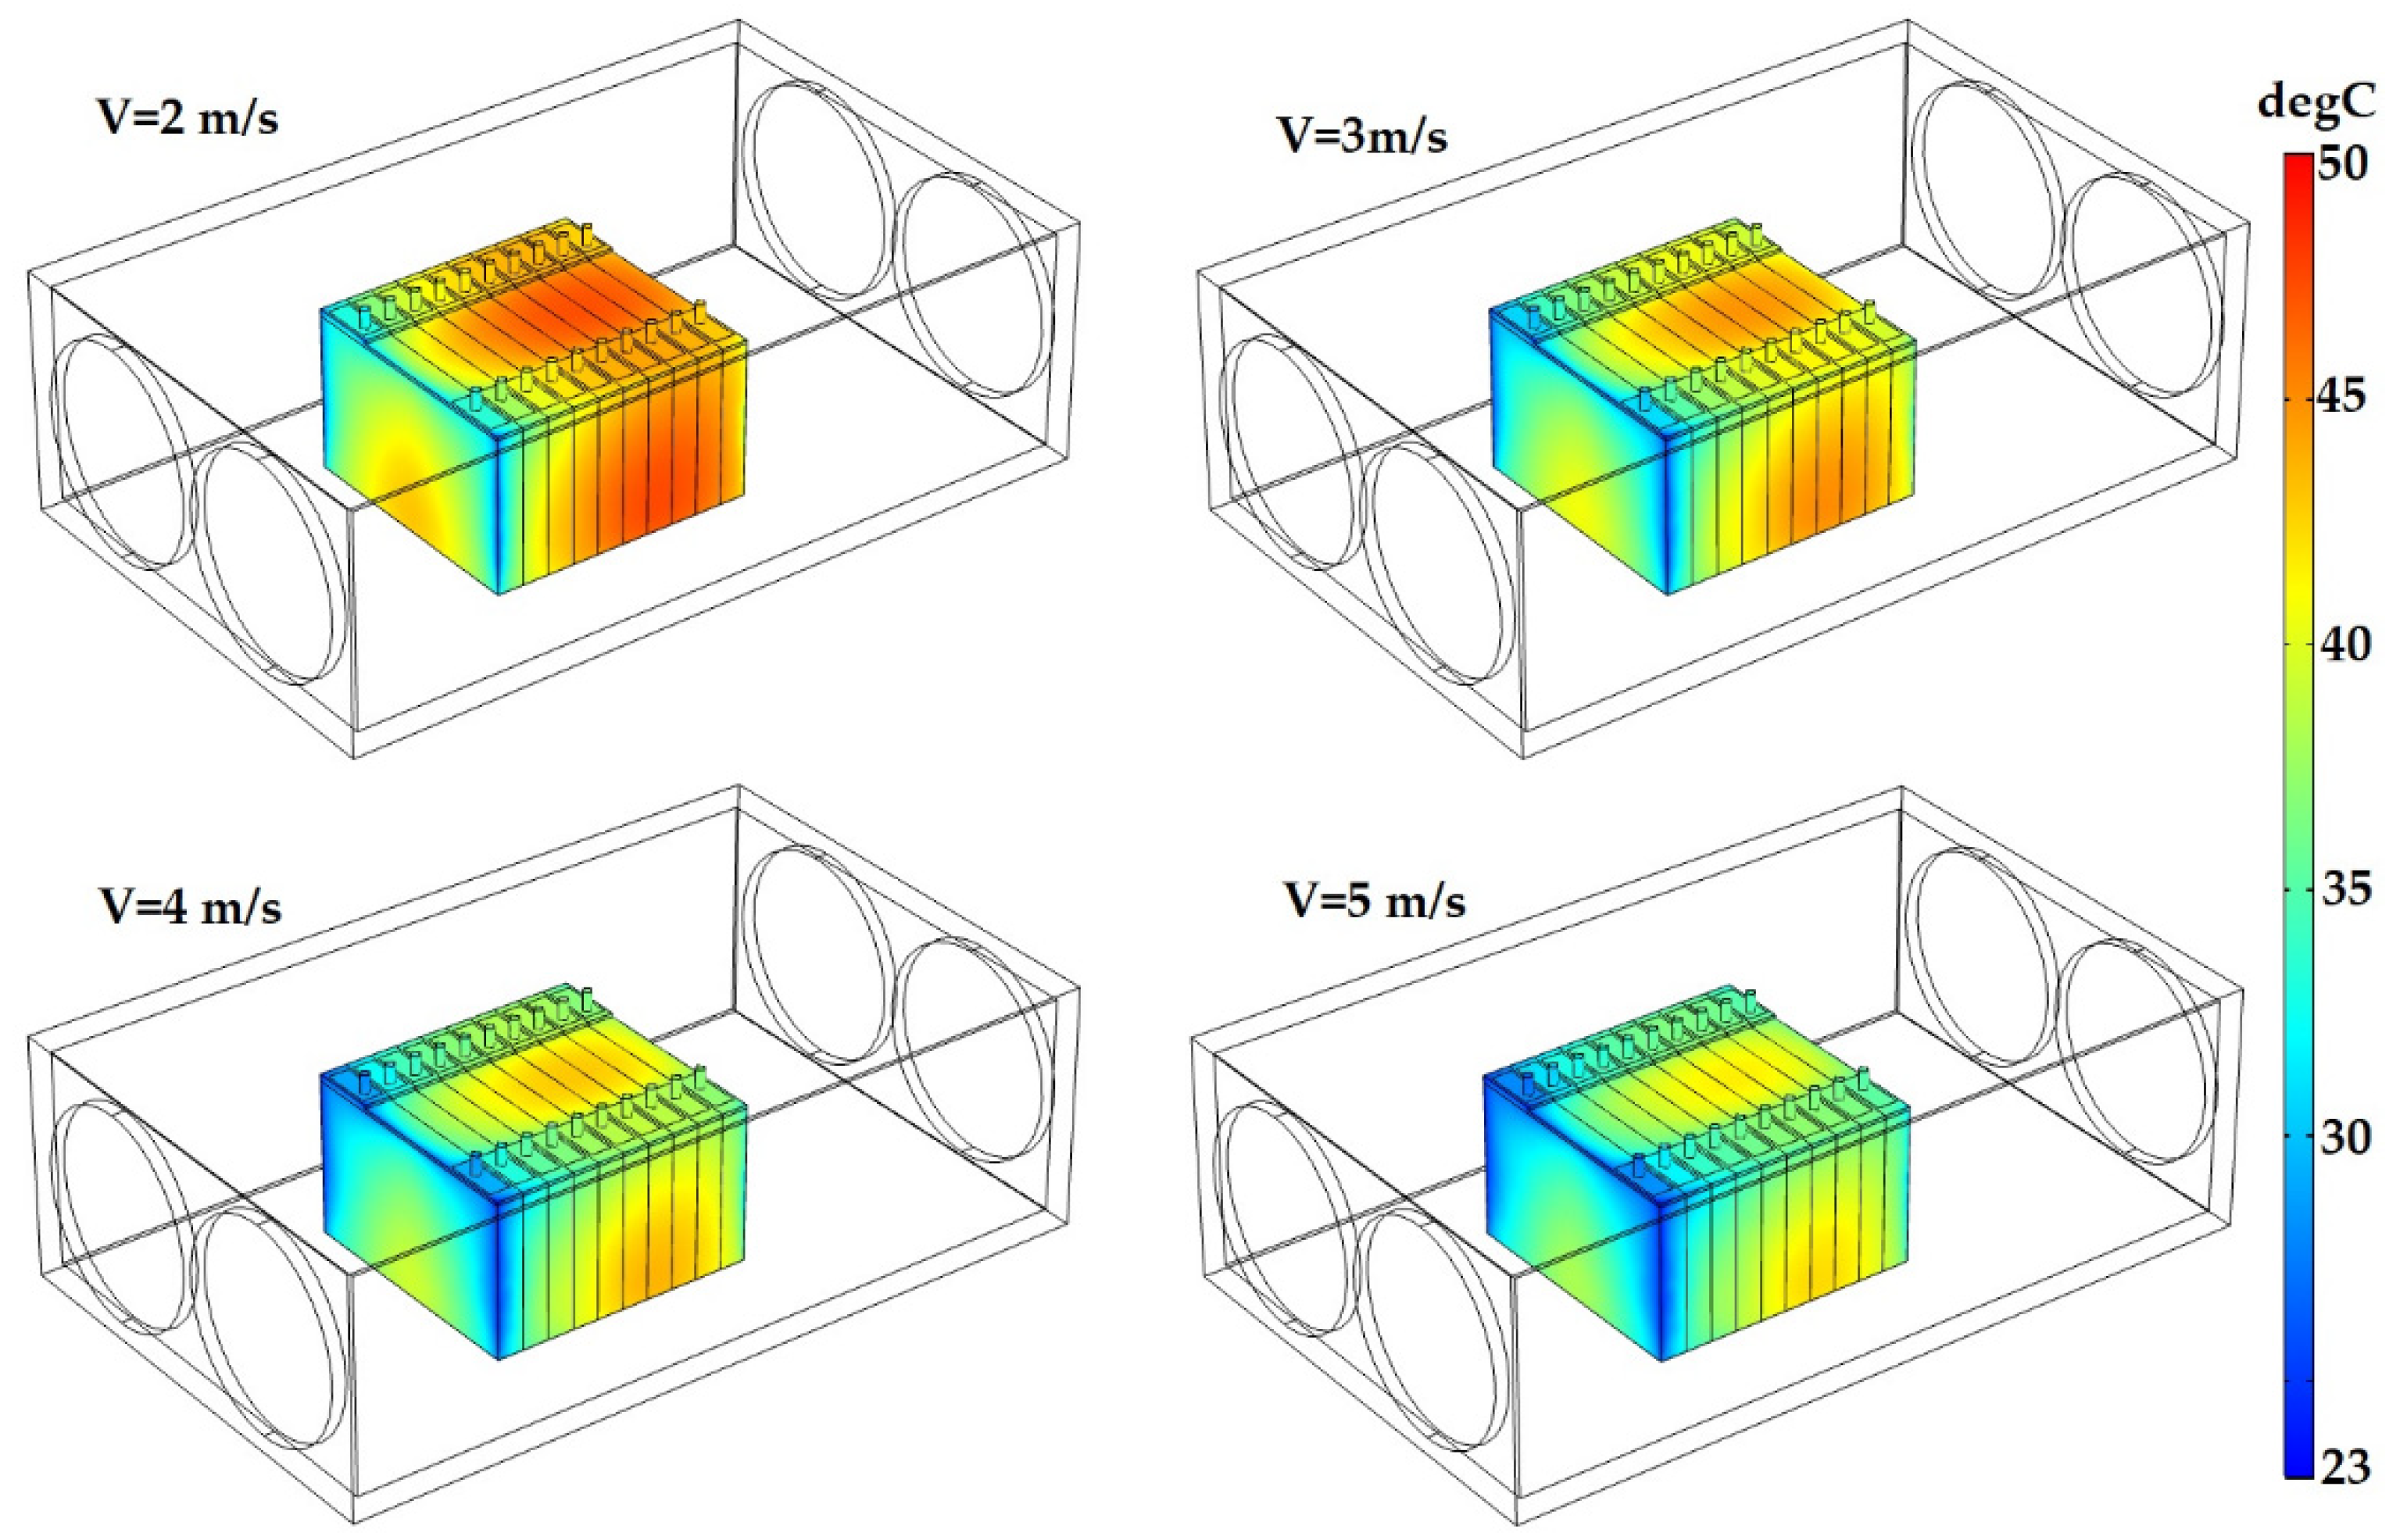
In the main case study, the inlet air velocity can be examined when the gap spacing is fixed at its original value of zero-spacing between neighboring cells. The inlet velocity of the cooling air for the main case study is set to 3 m/s, but the optimization analysis is reduced (2 m/s) or increased (4 m/s and 5 m/s). It is worth mentioning that the inlet velocity of zero corresponds to natural convection or no-forced cooling. The simulated 3D CFD temperature distribution within the module after 1400 s for the different inlet air velocities is illustrated in Figure 6 for V = 2 m/s, Figure 7 for V = 4 m/s, and in Figure 8 for V = 5 m/s. The comparison study (3D analysis figure) is depicted in Figure 9 for all the case studies to understand temperature distribution alongside the module better. Increasing the fans’ velocity significantly reduces the temperature rise within the LiC cell in the module. For instance, for V = 5 m/s, the temperature contour falls mainly into the yellow and green areas of the temperature color legend, meaning that the coldest cell (number 1) reaches 32.1 °C and the hottest cell (number 7) reaches 40.3 °C. The temperature difference along the module for this case study (V = 5 m/s) is 8.2 °C. Furthermore, compared to the main case of V = 3 m/s, the maximum temperature rise decreases by 3.4 °C. For V = 2 m/s (the least value), higher temperatures can be observed in the middle of the LiC module so the maximum temperature rise is around 46.3 °C, while the temperature difference between the coldest cell (number 1) and the hottest cell (number 7) is around 9.16 °C. Therefore, increasing the inlet air velocity from 2 m/s to 5 m/s decreases the maximum temperature of the hottest cell (number 7) by around 6 °C. Figure 10 illustrates the velocity field for these four case studies.
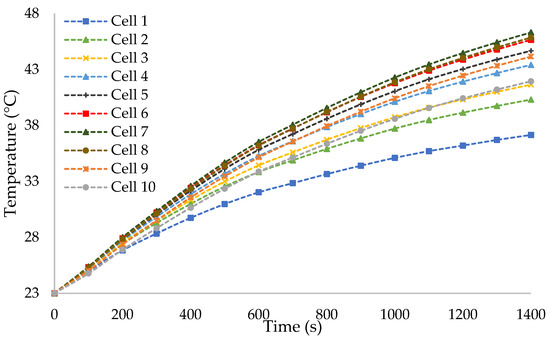
Figure 6.
Temperature curves of all the LiCs in the module with inlet air velocity of V = 2 m/s.
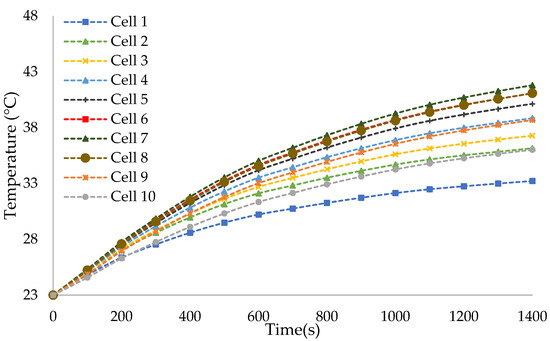
Figure 7.
Temperature curves of all the LiCs in the module with inlet air velocity of V = 4 m/s.
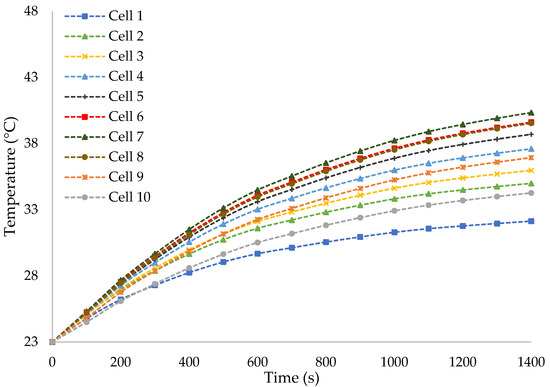
Figure 8.
Temperature curves of all the LiCs in the module with inlet air velocity of V = 5 m/s.
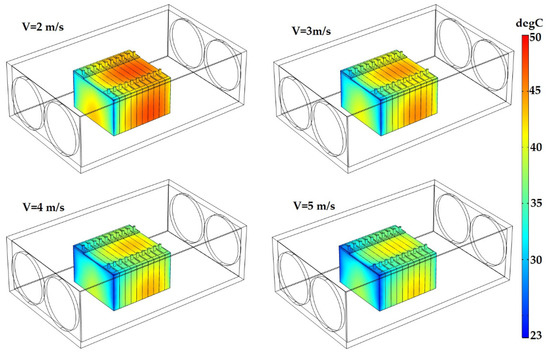
Figure 9.
Temperature distribution of the LiC module for different inlet air velocities.
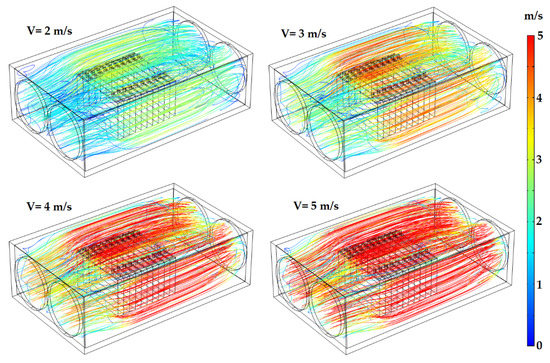
Figure 10.
Velocity streamlines for four inlet air velocity case studies.
5.2. Impact of Inlet and Outlet Positions
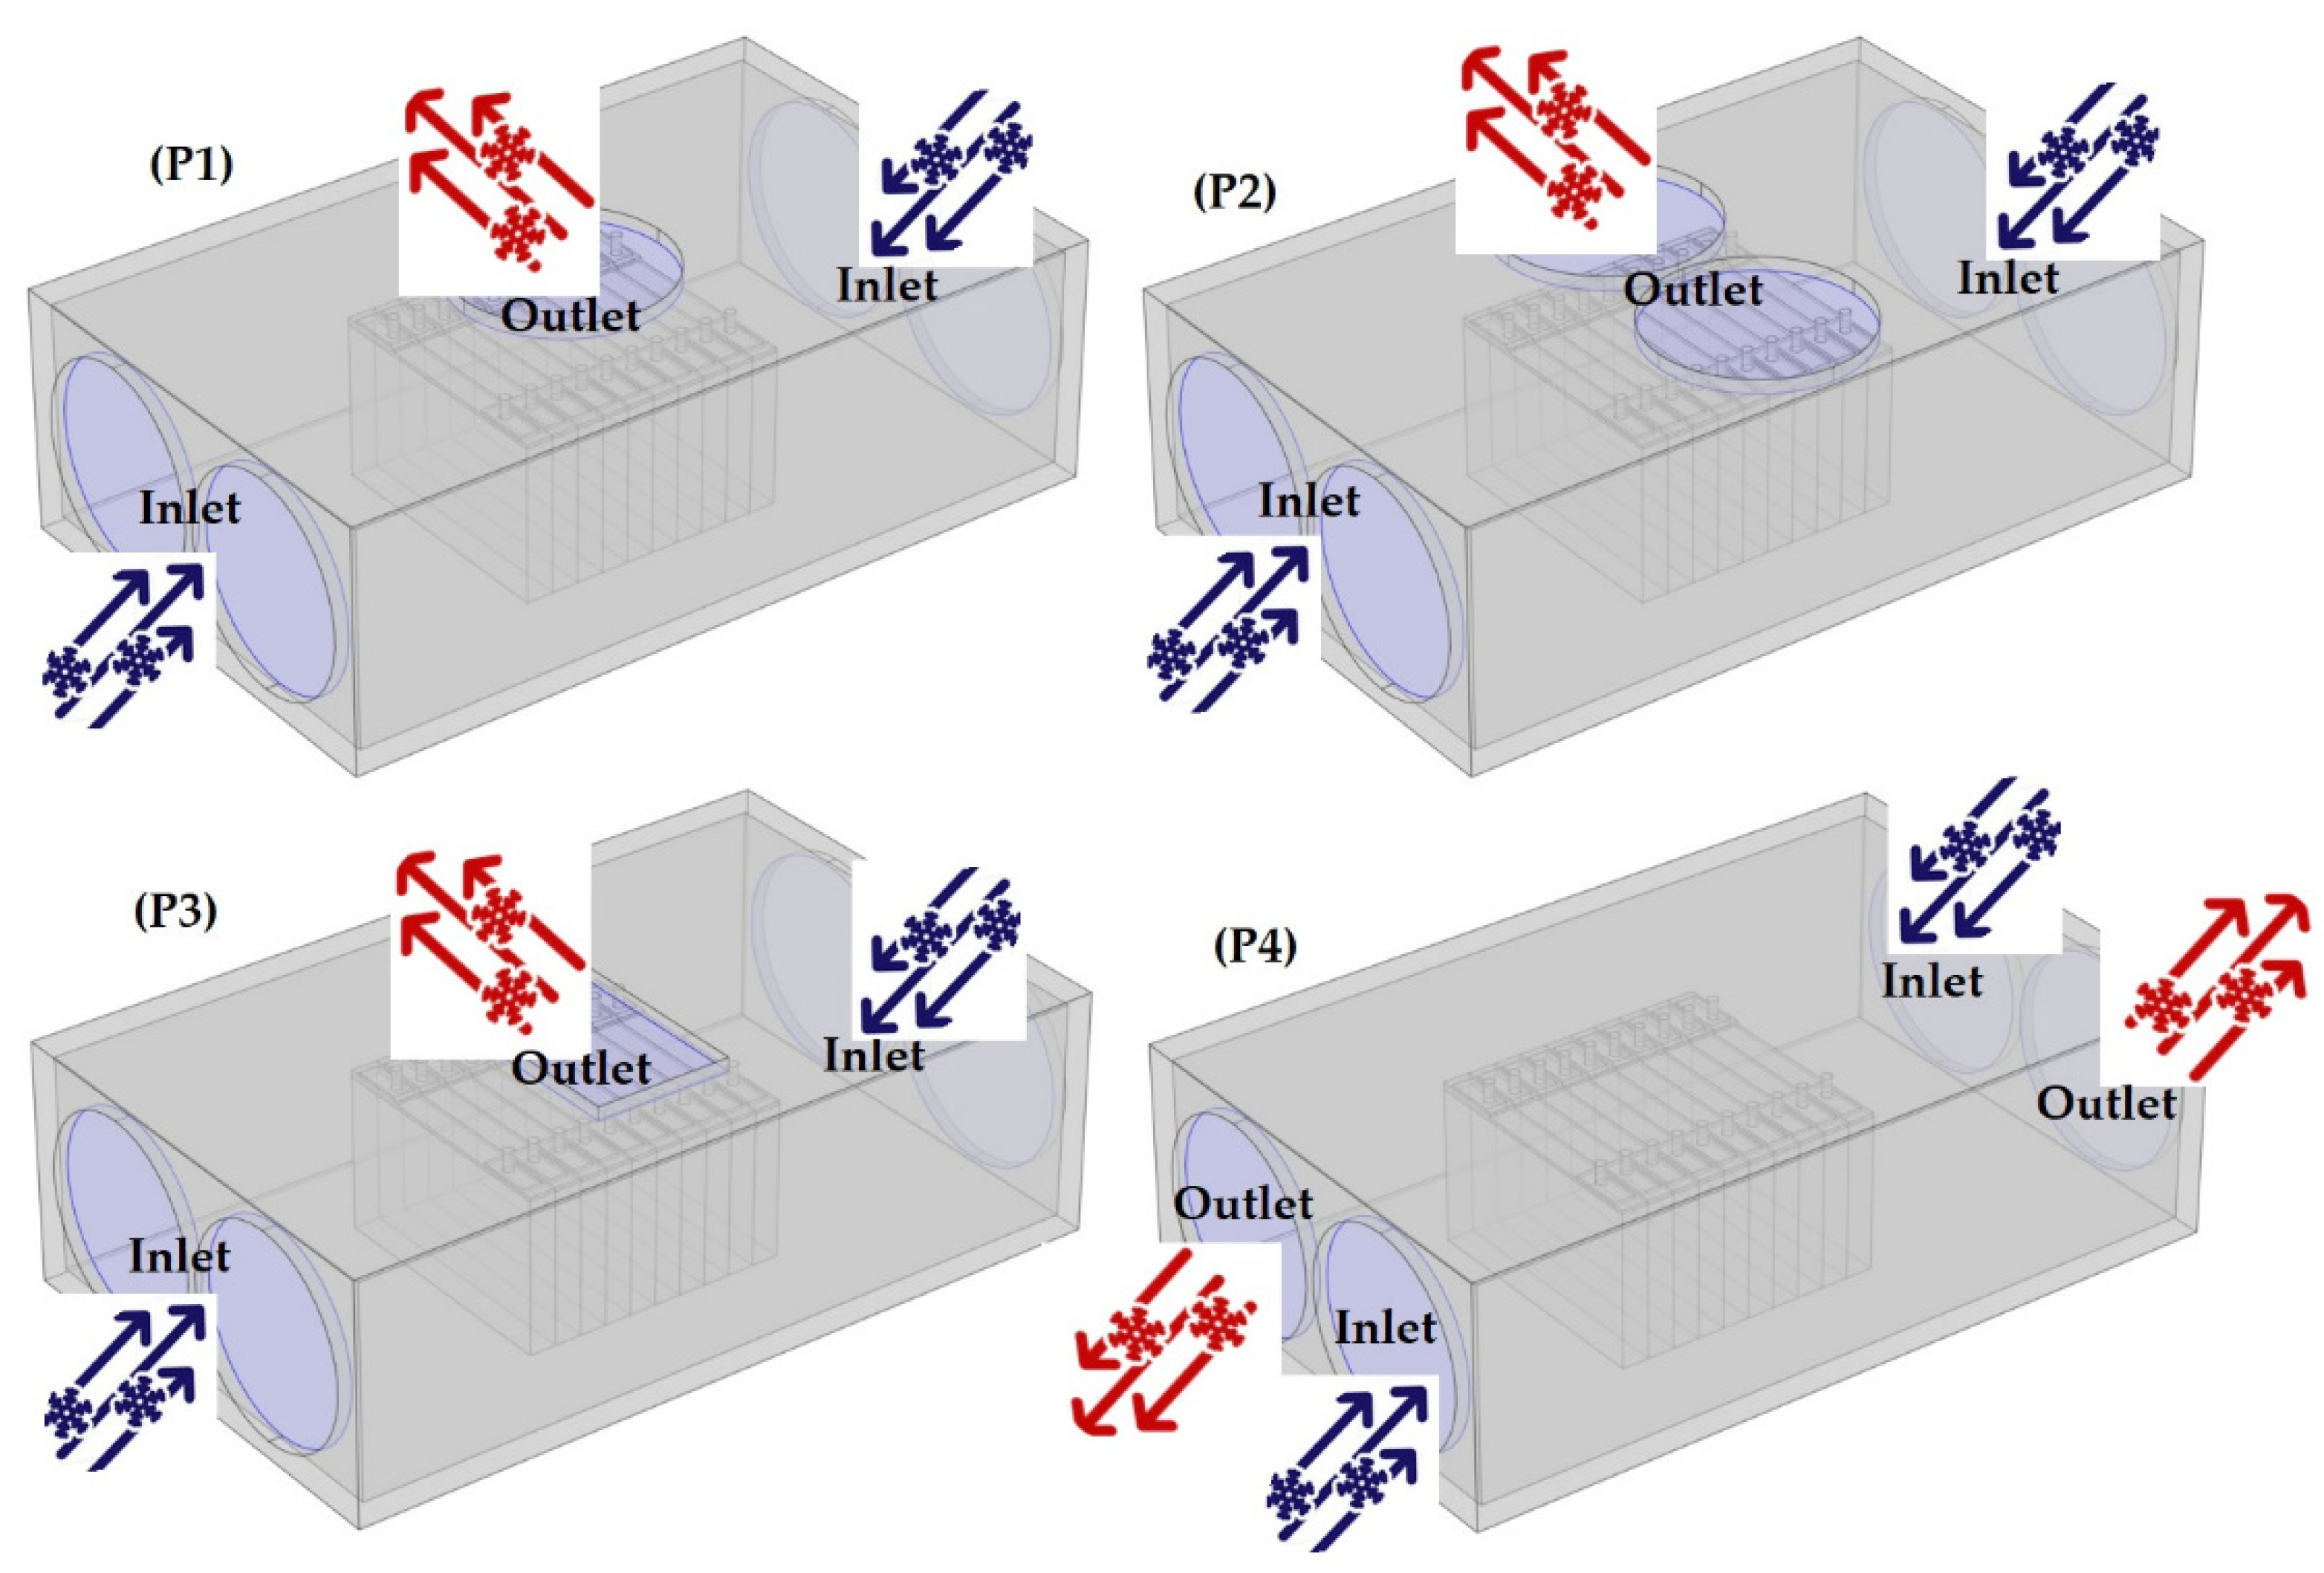
Four different air inlet and outlet positions are proposed in this section to assess the airflow direction impact on the thermal behavior of the module. In the main case study, the fan positions are designed so two fans from one side blow the air and two fans from the other side suck the air to the environment (Figure 2). As is depicted in Figure 11, four various positions include: (P1) four blowing fans from both sides and one circular outlet is designed on the top surface, (P2) four blowing fans from both sides and two circular outlets is designed on the top surface, (P3) four blowing fans from both sides, and one rectangular outlet is designed on the top surface, and (P4) one fan from the right side and one fan from the left side are blowing, and one other fan from left and the other one from right sides are sucking the air. The simulation analysis results prove that the best case among the four simulated case studies is P1, as it can better remove the excess generated heat from the module. The P1 case study reduces the maximum module’s temperature by 26.5% compared to the main case study.

Figure 11.
Four different inlet and outlet positions for the forced ACTMS; (P1) four blowing fans from both sides and one circular outlet on the top surface; (P2) four blowing fans from both sides and two circular outlets on the top surface; (P3) four blowing fans from both sides, and one rectangular outlet on the top surface; and (P4) one fan from the right side and one fan from the left side are blowing, and one other fan from left and the other one from right sides are sucking the air.
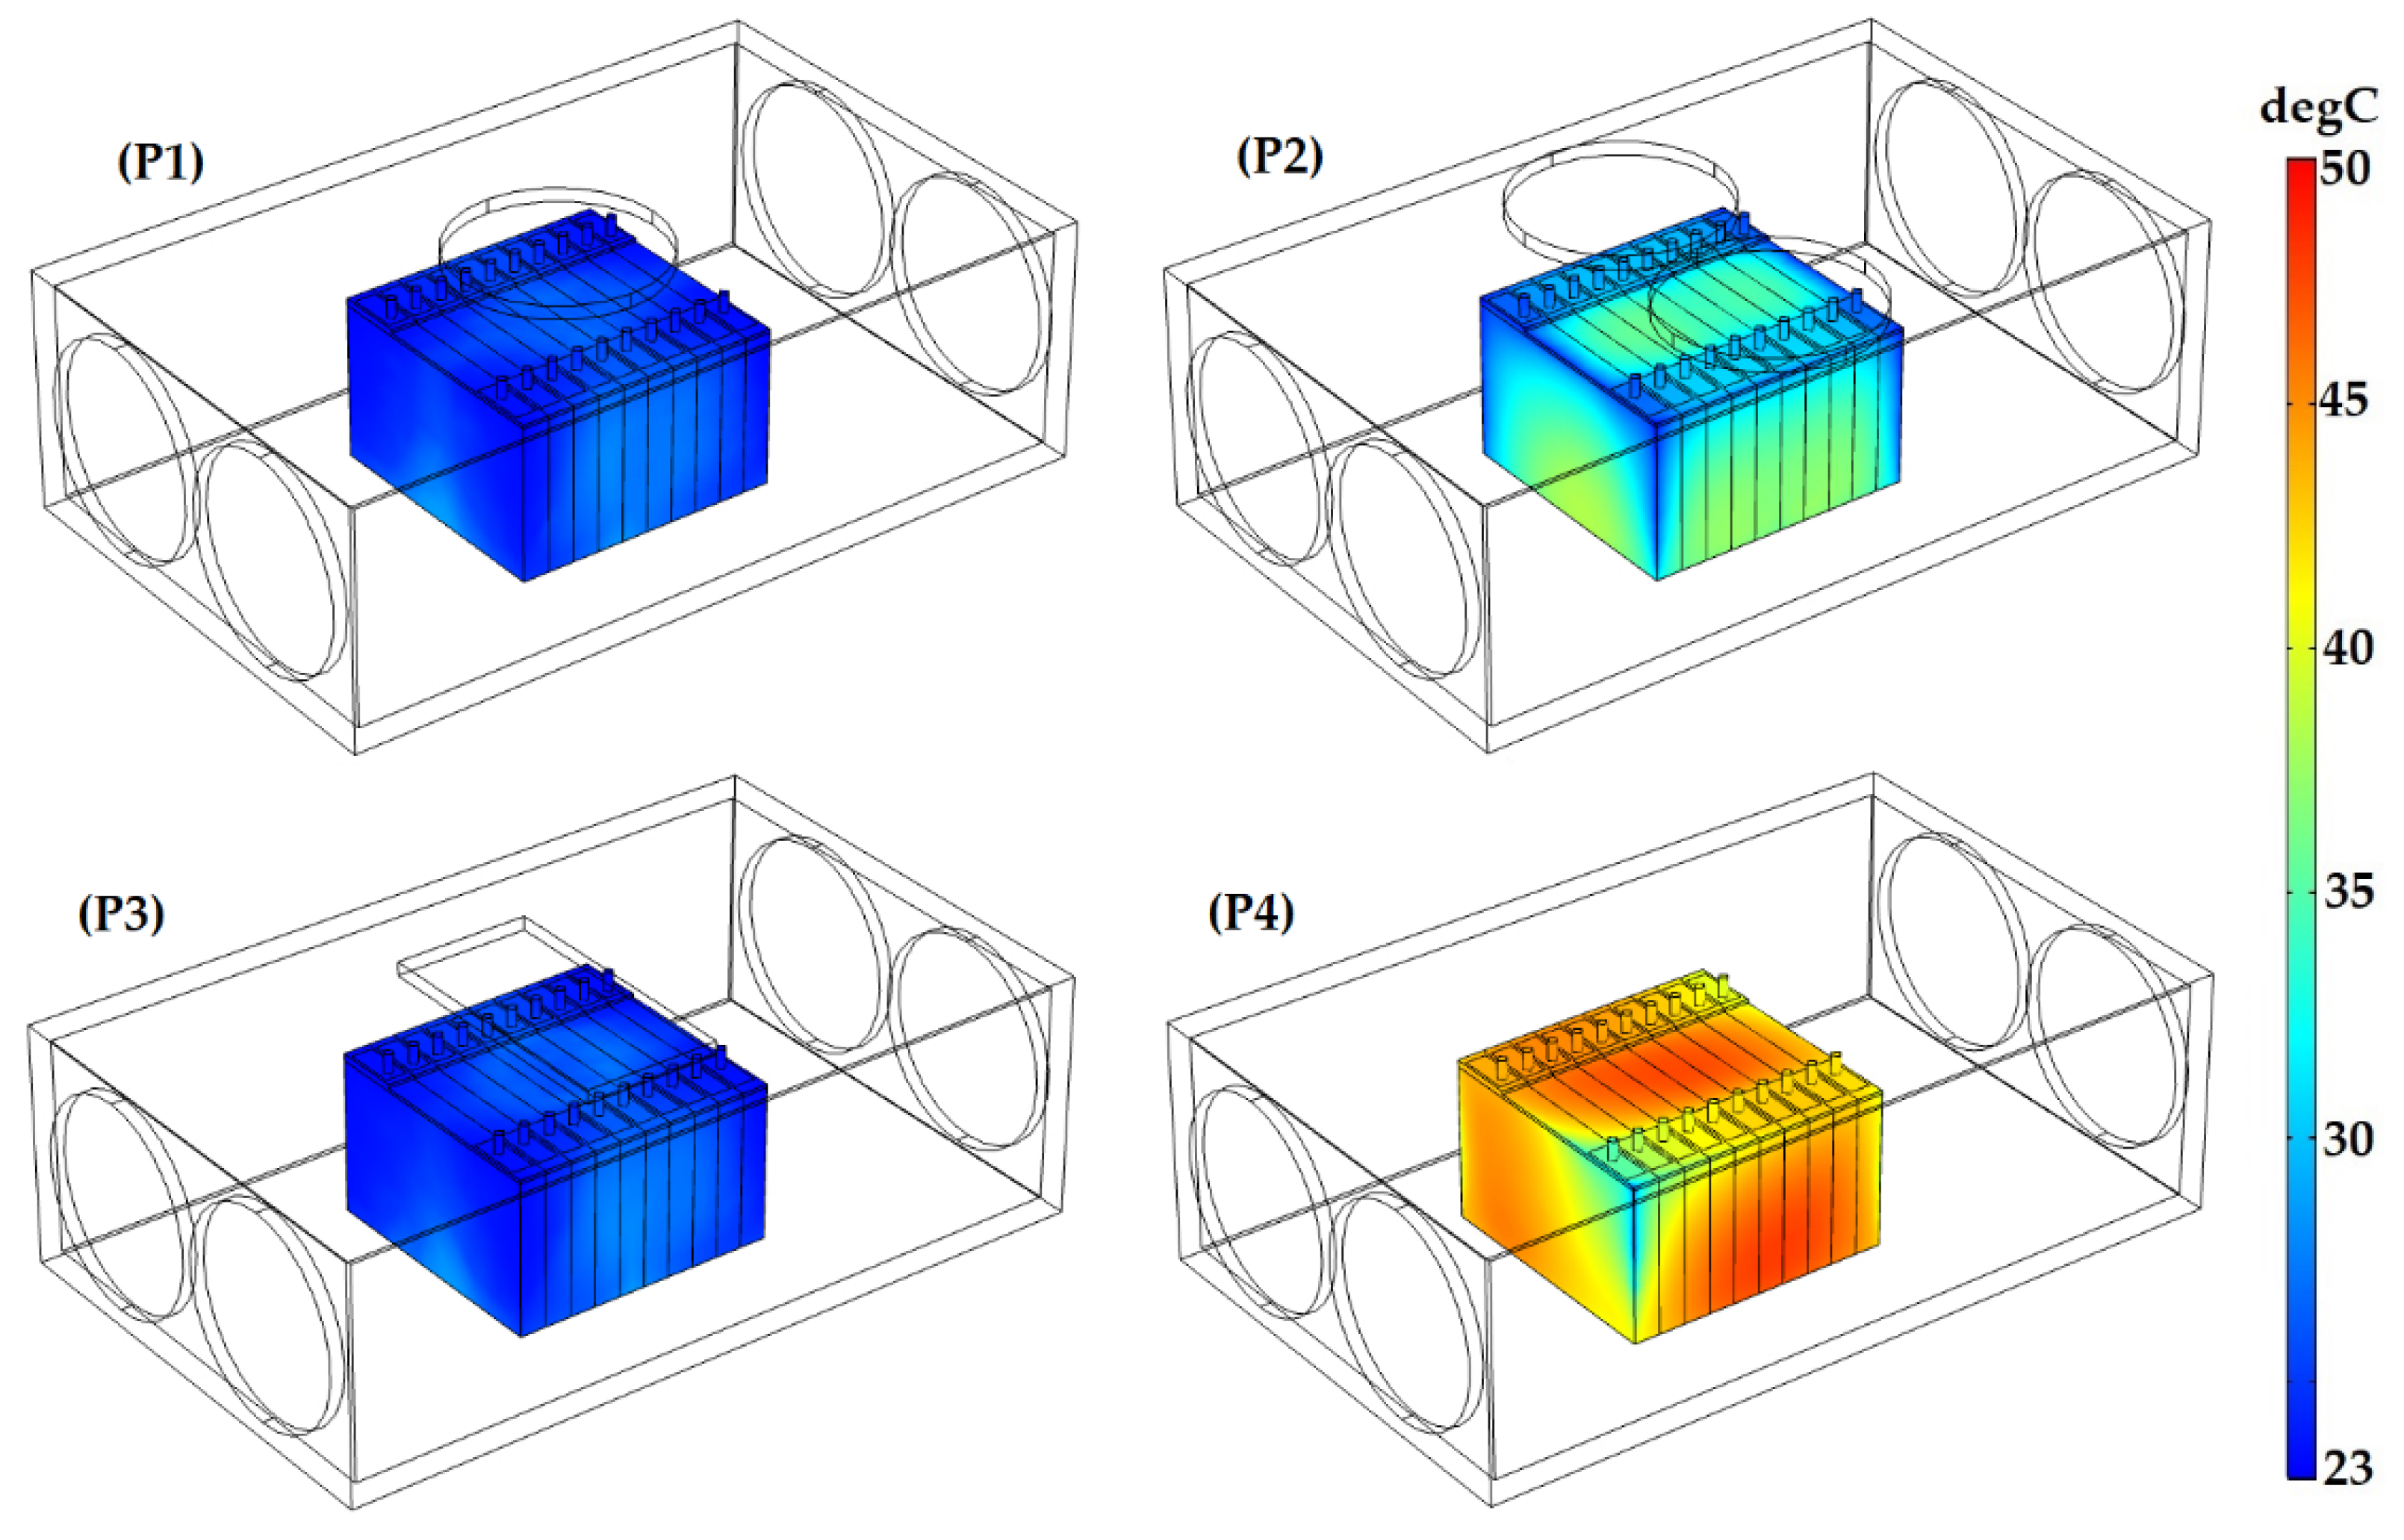
The simulation results are depicted in Figure 12, showing that increasing the number of outlets from one circular outlet (P1) to two circular outlets (P2) leads to the worse temperature removal from the container to the environment. Based on the depicted results, the P2 case worsens the temperature by around −17% compared to the P1 case study. The possible reason would also be the position of the P2 outlets in which the top surface of the cells is not entirely empty to let the hot air passes the top surface of the module and continue to the environment. In addition, changing the outlet position from the circle (P1) to the rectangle (P3) does not affect the temperature even 1 °C, proving that the impact of shape and edges of the outlet should be neglected in the design of the air cooling system. Finally, the last case in this section (P4) shows that blowing from two sides and at the same time, sucking the air to the environment from the same sides is not logical, as the maximum temperature of the module, in this case, will be increased by around 5% compared to the main case study (V3), in which blowing happens from one side and sucking from the other side.
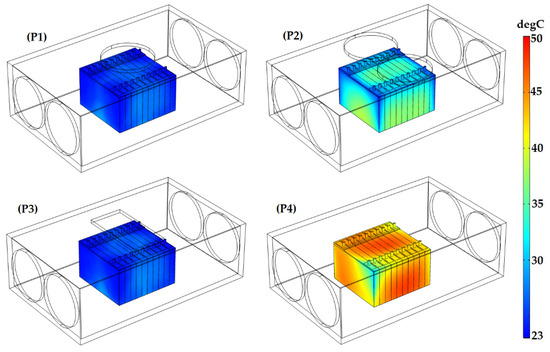
Figure 12.
Temperature distribution of the LiC module regarding four inlet/outlet positions.
5.3. Impact of Gap Spacing between Neighboring Cells
By fixing the fan’s supply air velocity at V = 3 m/s (main case study—V3), the impact of the gap spacing (d) on the maximum module’s temperature is parametrically analyzed. The gap spacing between the neighboring cells in the main case study is zero and increased to d = 1, 2, 3, and 4 mm in this section. It is worth mentioning that changing the gap spacing would not change the inlet Reynolds number, so the flow remains turbulent. Utilizing the same temperature scale (color legend), the simulated 3D temperature distribution within the module after 1400 s are compared in Figure 13 for four gap spacing values (d = 1 for the G1 case, d = 2 for the G2 case, d = 3 for the G3 case, and d = 4 for the G4 case studies). The temperature scale for G1 to G4 gap spacing values are between 49.3 °C to 47.1 °C. As can be seen, gap spacing is slightly affecting the temperature. This is due to the position of the fans inside the module. As the gap spaces are perpendicular to the airflow, a very small portion of air passes through the gaps. Therefore, increasing the gap spaces improves not only the temperature but also has a reverse influence.
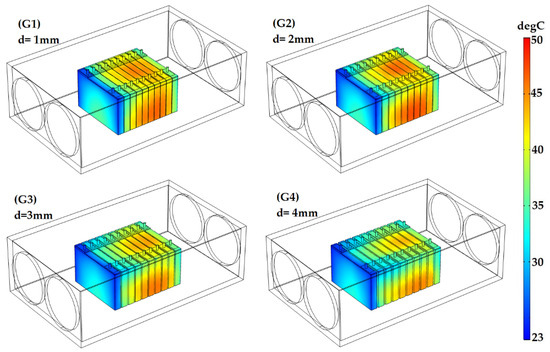
Figure 13.
Temperature distribution of the LiC module for various gap spacings between the neighboring LiCs.
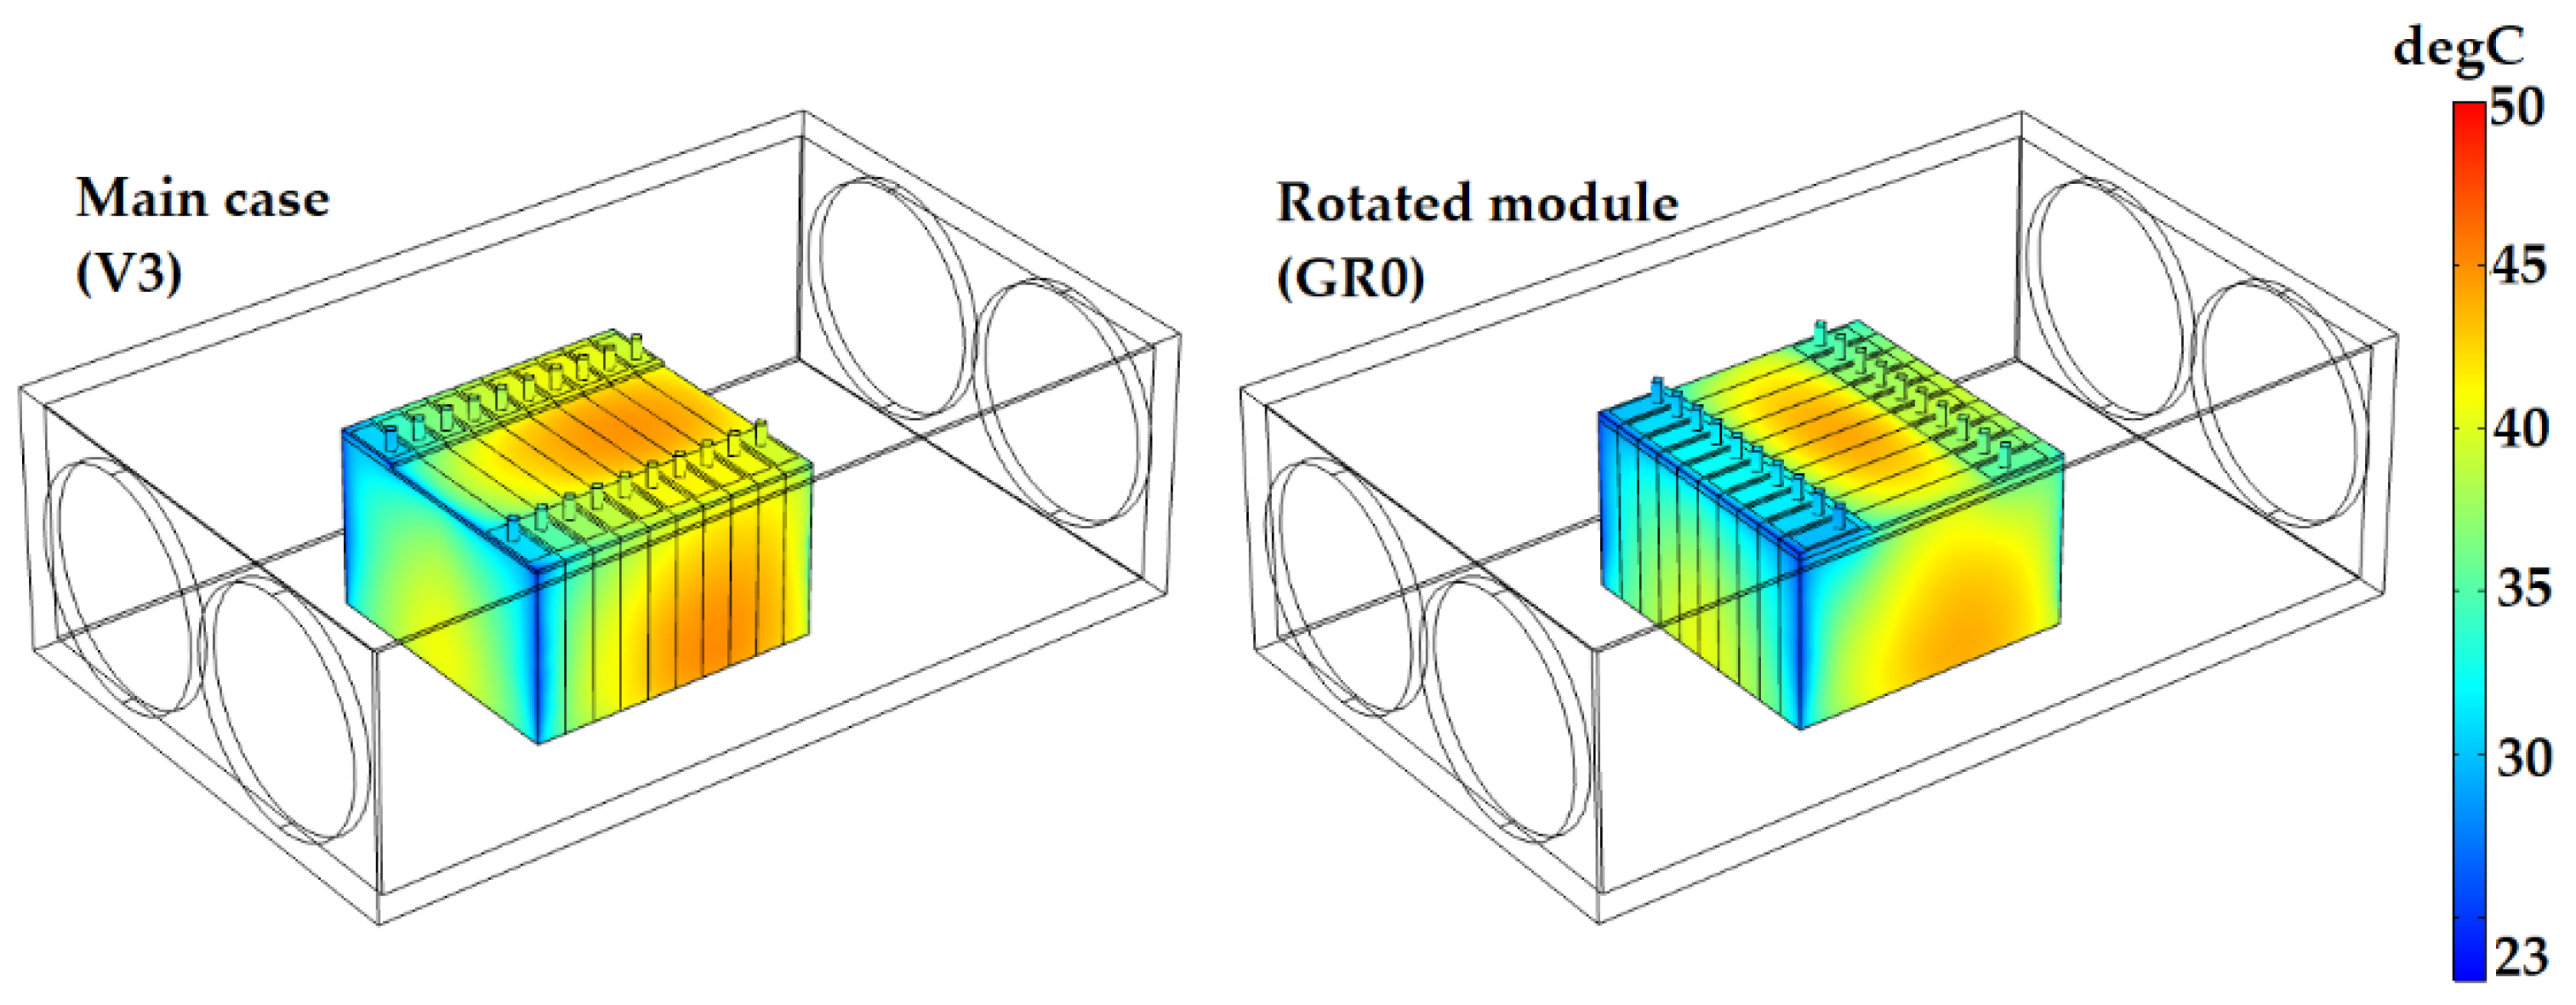
In this case, the temperature would be worsening by increasing the gap spacing due to lowering the contact surface between neighboring cells. Therefore, the first cell’s temperature will be far lower than the other cells, as it does not take the temperature of the neighboring cells. At the same time, the first cell behaves as a barrier and stands in front of the inlet air. The possible solution to solve this problem is rotating the module by 90°, based on Figure 14. GR0 case study is the rotated module compared to the main case study (V3). As is seen, the maximum temperature of the module is decreased by around 2% by rotating the module. Therefore, this position is better than the main case study to control the maximum temperature of the LiC cells within a module.
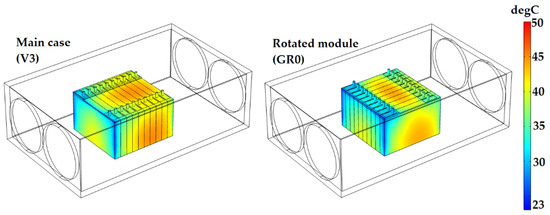
Figure 14.
Temperature distribution of the LiC module for the rotated module compared to the main case study.
5.4. Impact of Rotating the Position of the Module 90 Degrees (Side Cooling)
In this section, the module is rotated 90°, and the temperature distribution is evaluated for four different gap spacings between neighboring cells. In this regard, the gap spacing in the main case (V3) was zero, in the rotated main case (GR0) was also zero, but in this section is set to d = 1 mm for the GR1 case, d = 2 mm for the GR2 case, d = 3 mm for the GR3 case, and d = 4 mm for the GR4 case studies. Figure 15 illustrates the defined case studies with the same color legend for the minimum and maximum temperatures to compare the cases. The lower limit of the color legend (23 °C) corresponds to the initial temperature of the module, while the upper limit (50 °C) denotes a maximum temperature to have an insight for comparison.
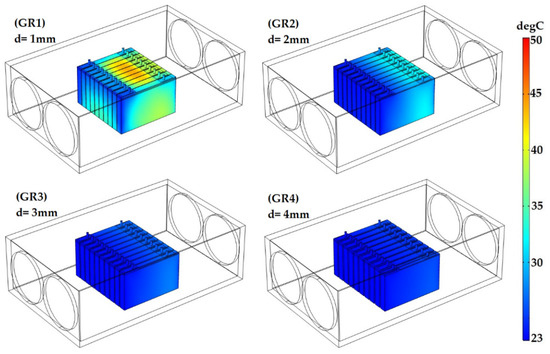
Figure 15.
Temperature distribution of the LiC module for the rotated module for various gap spacings between the neighboring LiCs.
Obviously, the maximum observed temperature of the module in the rotated cases is for the GR1 case study with 1 mm gap spacing and maximum observed temperature of 46.2 °C, which is only 0.1 °C lower than the GR0 case study. Therefore, 1 mm gap spacing does not help the ACTMS cooling system. On the other hand, increasing the gap from 1 mm to 2 mm decreases the temperature by 11.9 °C (25.7%) compared to the GR0 case study. In addition, increasing the gap to 3 mm and 4 mm reduces the maximum temperature of the module by 40.6% and 43.6% compared to the GR0 case, respectively.
It can be concluded that increasing the gap spacing by more than 2 mm would reduce the maximum module’s temperature, so the observed temperature of the module never attains the red region in the temperature color legend. Additionally, the maximum temperature difference between the coldest and hottest cells for the GR0, GR1, GR2, GR3, and GR4 case studies is 22.6 °C, 23.1 °C, 14.4 °C, 4.5 °C, and 3.1 °C, respectively.
5.5. Impact of Uneven Gap Spacing between Neighboring Cells
The gap spacing between neighboring cells is an essential factor based on the previous simulated case studies. Therefore, the impact of uneven gap spacing is introduced in this section, as Figure 16 shows. In the even gap spacing, the gap distance between all the cells within the module was the same (d1), but the d1 and d2 gaps are different in an uneven gap spacing. This will help to reduce the volume of the module, leading to optimizing the size of EVs.
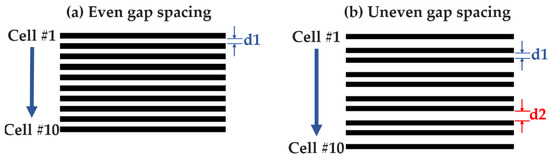
Figure 16.
Schematic diagram of the (a) even gap spacing—original use case—and (b) uneven gap spacing—the proposed design.
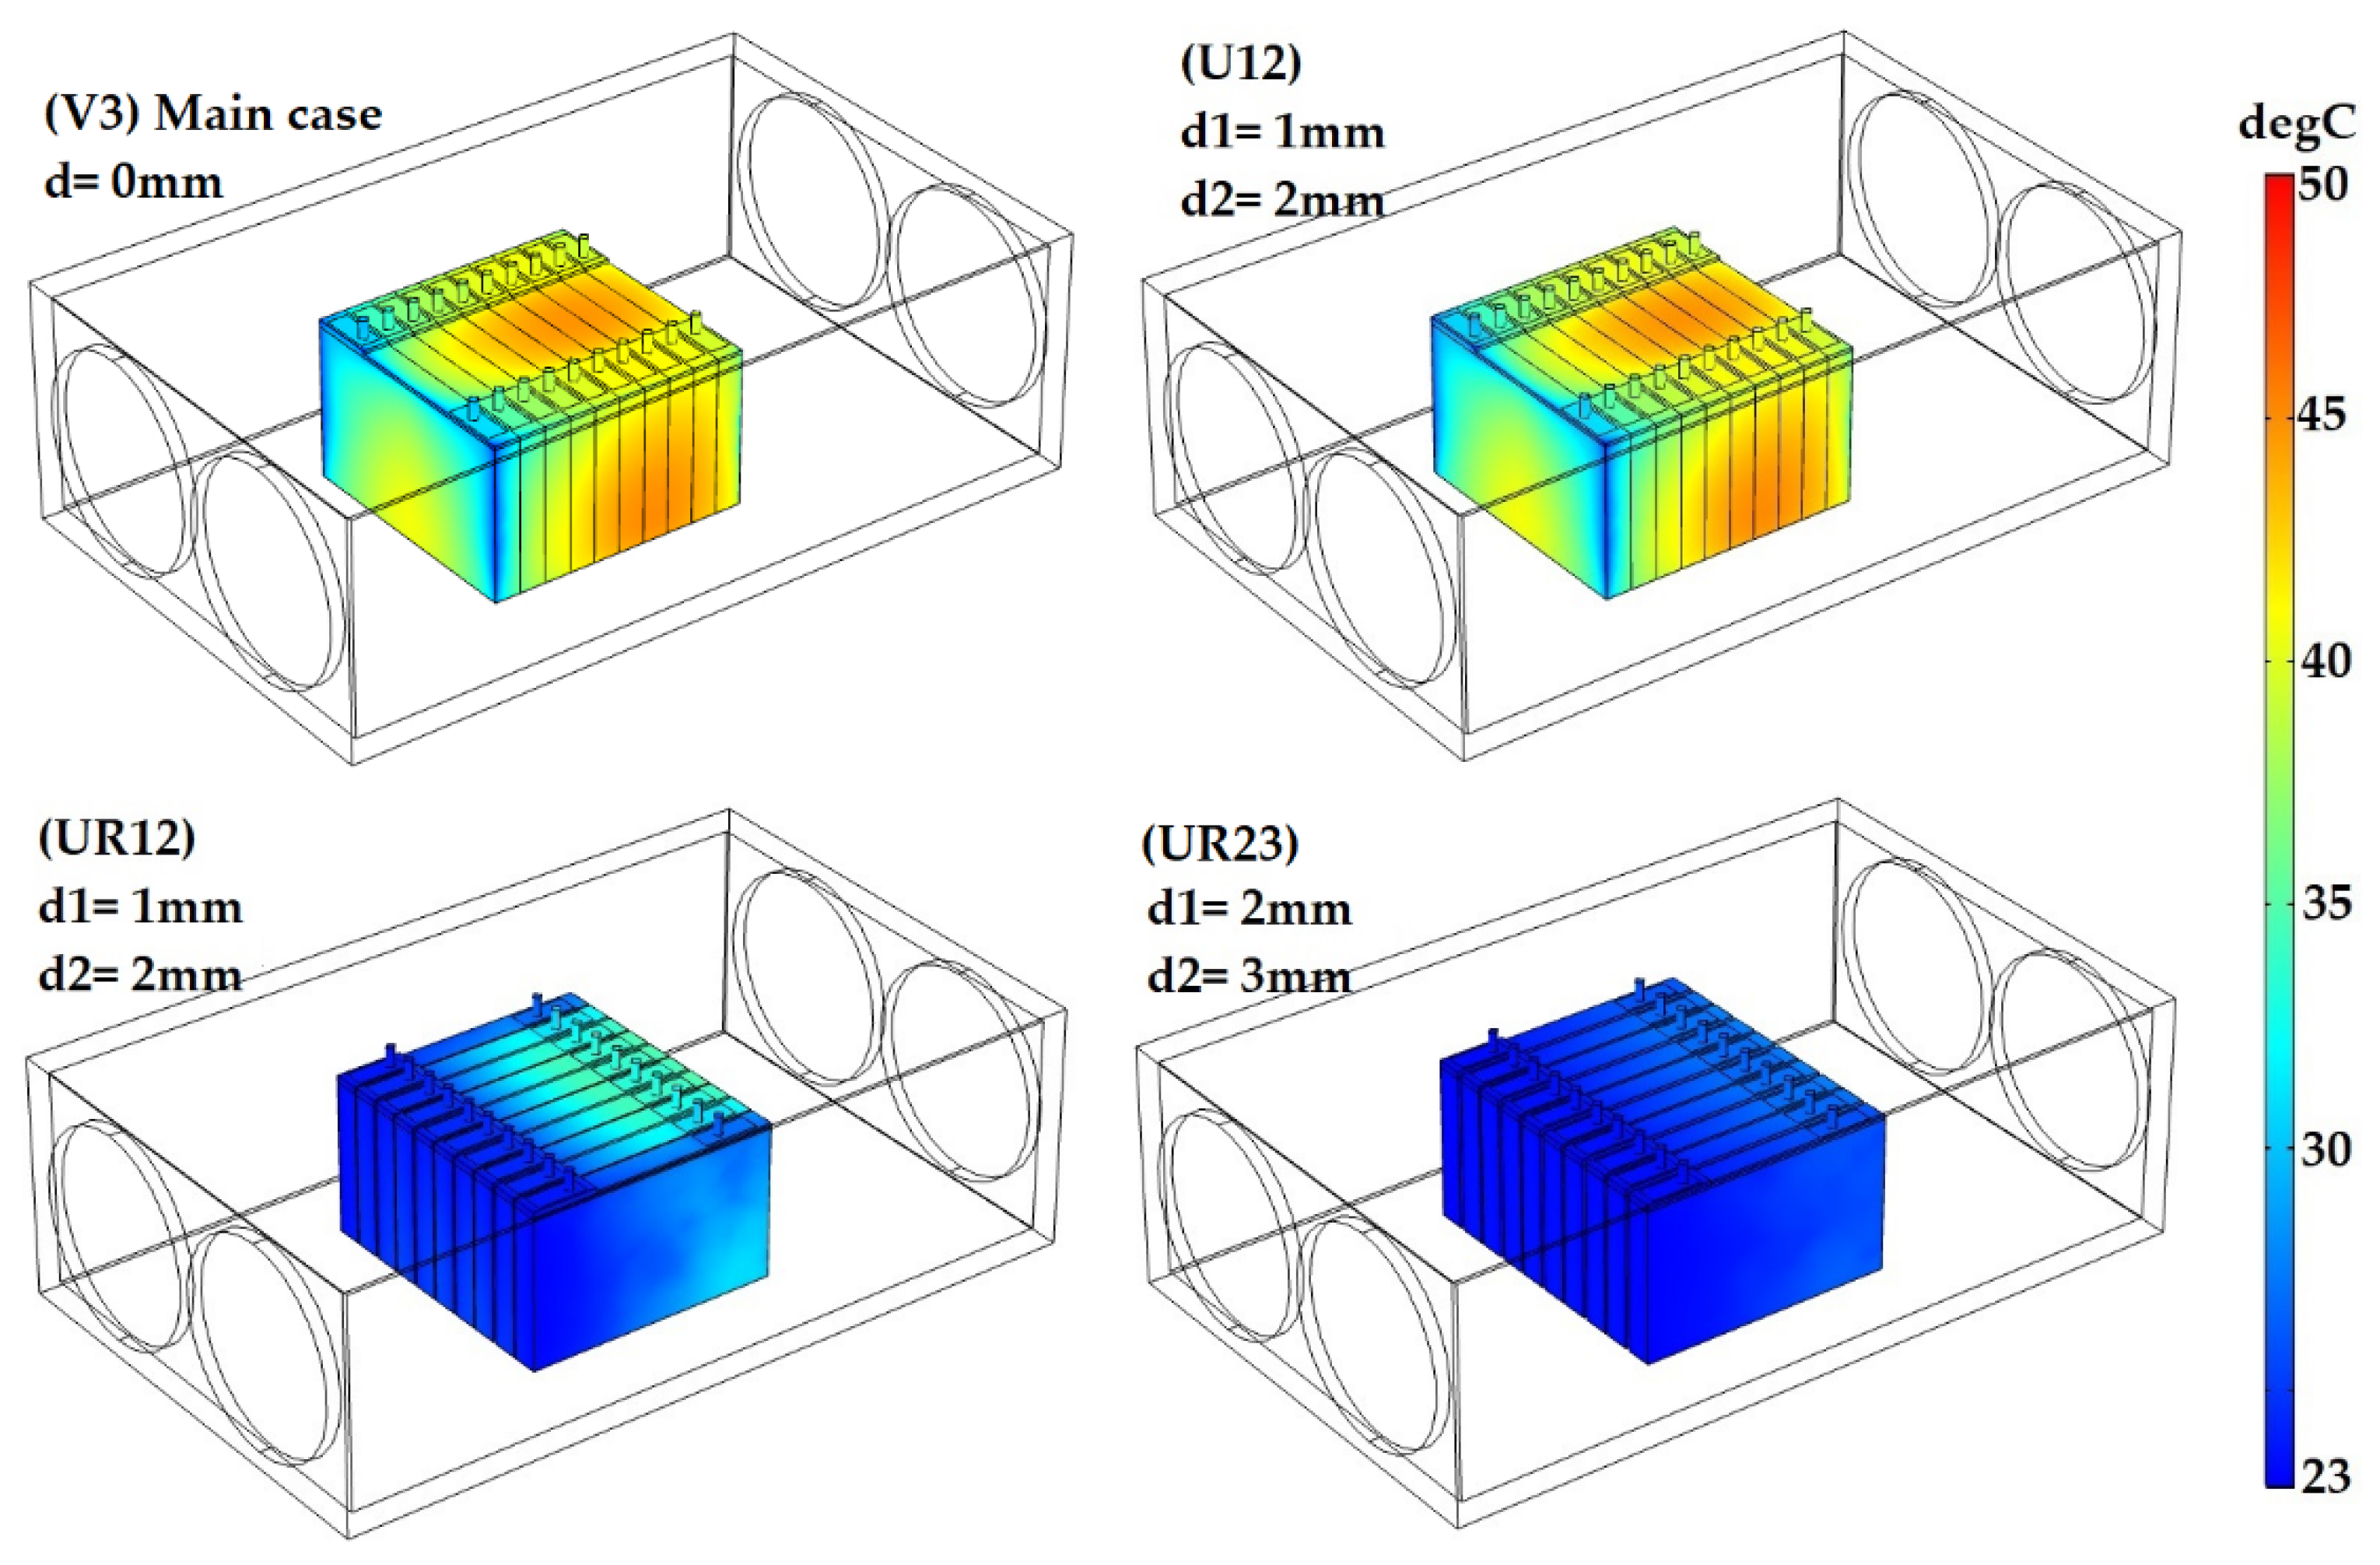
Figure 17 illustrated the temperature distribution of the LiC module for the main case study (V3), the uneven gap spacing of d1 = 1 mm and d2 = 2 mm (U12), the uneven gap spacing of d1 = 1 mm and d2 = 2 mm for the rotated module (UR12), and the uneven gap spacing of d1 = 2 mm and d2 = 3 mm for the rotated module. The uneven gap spacing is expected to uniformize the temperature of the middle cells of the module more effectively. It is observed that, even though the maximum temperature of the U12 case study is the same as the V3 case study (where the gap spacing is zero), the maximum temperature difference of the U12 case improved by 53.2% (around 12.4 °C) compared to the main case study, which is of high importance. The UR12 case is the result of rotating the U12 case, in which the UR12 reduces the maximum temperature by 19.1% (around 9 °C) compared to both cases of U12 and V3. Moreover, the maximum temperature difference of the UR12 case is around 15.1 °C, while the temperature difference for the U12 and V3 cases is 10.9 °C and 23.3 °C, respectively. In addition, the UR23 case improves the maximum temperature difference within the module to 5.5 °C, showing 49.5% and 76.4% improvement compared to the U12 and V3 cases, respectively.

Figure 17.
Temperature distribution of the LiC module for uneven gap spacings between the neighboring LiCs; V3: main case study, U12: even spacing with direction the same as the main case study, UR12: uneven gap spacing of 1 mm and 2 mm, UR23: uneven gap spacing of 2 mm and 3 mm.
5.6. Comparison of the Optimization Results
The simulation results for all the cases used are summarized in Table 4, for comparison. As can be seen, by rotating the LiC module and increasing the gap spacing between neighboring cells, the maximum temperature and temperature difference can be controlled by the ACTMS properly. In addition, uneven gap spacing reduces the size of the module with the possibility of better controlling the temperature uniformity and maximum temperature of the module.
Table 4.
Comparison of the optimization studies with the main case study.
6. Conclusions
In this work, a module of 10 LiC cells was the target energy storage system, in which the effect of forced air-cooled TMS (ACTMS) was investigated experimentally and numerically. The impact of inlet air velocity, inlet and outlet position of the fans, gap spacing between the neighboring cells, and uneven gap spacing have been examined. The concluding remarks are drawn:
- Without a proper TMS and under natural convection, the temperature rise of the module is extremely high, and will result in thermal runaway.
- The 3D CFD model can predict the temperature values of the LiC module with a deficient error of calculation (less than 1%).
- With a constant gap between the cells, increasing the inlet air velocity of fans reduces the maximum temperature of the module and temperature uniformity. The first cells have a lower temperature rise compared to those in the middle. For the V = 4 m/s and 5 m/s, the maximum temperature of the module was reduced by 2.5% and 4.9% compared to the main case study with V = 3 m/s, respectively.
- Changing the inlet and outlet position led to different scenarios. The best scenario was using four fans from the left and right sides to blow the air into the module’s surface and designing the outlet on top of the cells. This reduced the maximum temperature and temperature uniformity by 26.5% and 37.3%, respectively.
- Rotating the module by 90° decreases the module’s maximum temperature and temperature uniformity by around 2% and 3% compared to the main case study, respectively.
- Increasing the gap spacing of the rotated module results in better temperature distribution, as the fans are blowing to the side surface of the LiCs with the same gap spacing. For the 1 mm, 2 mm, 3 mm, and 4 mm gap spacing for the rotated module, the maximum temperature decreased by 2%, 26.9%, 41.6%, and 44.6% compared to the main case study, respectively. For the mentioned gap spacings, the temperature difference compared to the main case reduced by 1%, 38.2%, 80.1%, and 86.7%, respectively.
- Uneven gap spacing can optimize the volume of the module, so by setting the d1 = 1 mm and d2 = 2 mm, the maximum temperature stays almost the same. However, the temperature difference was reduced by 53.2% compared to the main case study. After rotating the module and setting d1 = 1 mm and d2 = 2 mm, the maximum temperature and temperature uniformity decreased by 19.1% and 35.1% compared to the main case. By setting d1 = 2 mm and d2 = 3 mm, 5.5 °C temperature difference was achieved. In this case, the maximum temperature and temperature difference were reduced by 39.4% and 76.3% compared to the main study, respectively.
The future work would be proposing a hybrid TMS to decrease the power consumption of the air cooling system. Therefore, a passive system can be added to the ACTMS to reduce the temperature uniformity and minimize power consumption.
Author Contributions
Conceptualization, methodology, software, validation, formal analysis, investigation, and writing—original journal draft by D.K., writing—review and editing by H.B. and M.A., and supervision, review, and editing by J.V.M. and M.B. All authors have read and agreed to the published version of the manuscript.
Funding
This research received no external funding.
Institutional Review Board Statement
Not applicable.
Informed Consent Statement
Not applicable.
Data Availability Statement
Not applicable.
Acknowledgments
This research is based on work supported by JSR Micro NV and Flanders Make.
Conflicts of Interest
The authors declare no conflict of interest.
References
- Soltani, M.; Beheshti, S.H. A comprehensive review of lithium ion capacitor: Development, modelling, thermal management and applications. J. Energy Storage 2020, 34, 102019. [Google Scholar] [CrossRef]
- Jaguemont, J.; Karimi, D.; van Mierlo, J. Investigation of a Passive Thermal Management System for Lithium-Ion Capacitors. IEEE Trans. Veh. Technol. 2019, 68, 10518–10524. [Google Scholar] [CrossRef]
- Khaleghi, S.; Karimi, D.; Beheshti, S.H.; Hosen, S.; Behi, H.; Berecibar, M.; van Mierlo, J. Online health diagnosis of lithium-ion batteries based on nonlinear autoregressive neural network. Appl. Energy 2021, 282, 116159. [Google Scholar] [CrossRef]
- Omar, N.; Daowd, M.; Hegazy, O.; al Sakka, M.; Coosemans, T.; van den Bossche, P.; van Mierlo, J. Assessment of lithium-ion capacitor for using in battery electric vehicle and hybrid electric vehicle applications. Electrochim. Acta 2012, 86, 305–315. [Google Scholar] [CrossRef]
- Soltani, M.; Ronsmans, J.; Kakihara, S.; Jaguemont, J.; van den Bossche, P.; van Mierlo, J.; Omar, N. Hybrid battery/lithium-ion capacitor energy storage system for a pure electric bus for an urban transportation application. Appl. Sci. 2018, 8, 1176. [Google Scholar] [CrossRef] [Green Version]
- Berckmans, G.; Samba, A.; Omar, N.; Ronsmans, J.; Soltani, M.; Firouz, Y.; van den Bossche, P.; van Mierlo, J. Lithium ion capacitor—Optimization of thermal management from cell to module level. In Proceedings of the 2016 IEEE Vehicle Power and Propulsion Conference (VPPC), Hangzhou, China, 17–20 October 2016; pp. 1–6. [Google Scholar] [CrossRef]
- Karimi, D.; Behi, H.; Jaguemont, J.; Berecibar, M.; van Mierlo, J. A refrigerant-based thermal management system for a fast charging process for lithium-ion batteries. In Proceedings of the International Conference on Renewable Energy Systems and Environmental Engineering (IRESE), Global Publisher, Brussels, Belgium, 18 December 2020; pp. 1–6. [Google Scholar]
- Behi, H.; Karimi, D.; Jaguemont, J.; Gandoman, F.H.; Kalogiannis, T.; Berecibar, M.; van Mierlo, J. Novel thermal management methods to improve the performance of the Li-ion batteries in high discharge current applications. Energy 2021, 224, 120165. [Google Scholar] [CrossRef]
- Karimi, D.; Behi, H.; Akbarzadeh, M.; van Mierlo, J.; Berecibar, M. Holistic 1D Electro-Thermal Model Coupled to 3D Thermal Model for Hybrid Passive Cooling System Analysis in Electric Vehicles. Energies 2021, 14, 5924. [Google Scholar] [CrossRef]
- Karimi, D.; Behi, H.; Jaguemont, J.; Berecibar, M.; van Mierlo, J. Investigation of extruded heat sink assisted air cooling system for lithium-ion capacitor batteries. In Proceedings of the International Conference on Renewable Energy Systems and Environmental Engineering (IRESE), Brussels, Belgium, 18 October 2020; pp. 1–6. [Google Scholar]
- Behi, H.; Behi, M.; Karimi, D.; Jaguemont, J.; Ghanbarpour, M.; Behnia, M.; Berecibar, M.; van Mierlo, J. Heat pipe air-cooled thermal management system for lithium-ion batteries: High power applications. Appl. Therm. Eng. 2020, 183, 116240. [Google Scholar] [CrossRef]
- Karimi, D.; Hosen, M.S.; Behi, H.; Khaleghi, S.; Akbarzadeh, M.; van Mierlo, J.; Berecibar, M. A hybrid thermal management system for high power lithium-ion capacitors combining heat pipe with phase change materials. Heliyon 2021, 7, e07773. [Google Scholar] [CrossRef]
- Akbarzadeh, M.; Jaguemont, J.; Kalogiannis, T.; Karimi, D.; He, J.; Jin, L.; Xie, P.; van Mierlo, J.; Berecibar, M. A novel liquid cooling plate concept for thermal management of lithium-ion batteries in electric vehicles. Energy Convers. Manag. 2021, 231, 113862. [Google Scholar] [CrossRef]
- Möller, S.; Karimi, D.; Vanegas, O.; el Baghdadi, M.; Kospach, A.; Lis, A.; Hegazy, O.; Abart, C.; Offenbach, Â.B.Â. Application Considerations for Double Sided Cooled Modules in Automotive Environment. 2020. Available online: https://ieeexplore.ieee.org/document/9097721 (accessed on 16 November 2020).
- Karimi, D.; Jaguemont, J.; Behi, H.; Berecibar, M.; van den Bossche, P.; van Mierlo, J. Passive cooling based battery thermal management using phase change materials for electric vehicles. In Proceedings of the EVS33—33nd Electric Vehicle Symposium, Portland, OR, USA, 14–17 June 2020; pp. 1–12. [Google Scholar]
- Behi, M.; Mirmohammadi, S.A.; Ghanbarpour, M.; Behi, H.; Palm, B. Evaluation of a novel solar driven sorption cooling/heating system integrated with PCM storage compartment. Energy 2018, 164, 449–464. [Google Scholar] [CrossRef]
- Behi, H. Experimental and Numerical Study on Heat Pipe Assisted PCM Storage System. Master’s Thesis, School of Industrial Engineering and Management, Stockholm, Sweden, 2015. [Google Scholar]
- Behi, H.; Karimi, D.; Youssef, R.; Patil, M.S.; van Mierlo, J.; Berecibar, M. Comprehensive Passive Thermal Management Systems for Electric Vehicles. Energies 2021, 14, 3881. [Google Scholar] [CrossRef]
- Karimi, D.; Behi, H.; Jaguemont, J.; Sokkeh, M.A.; Kalogiannis, T.; Hosen, M.S.; Berecibar, M.; van Mierlo, J. Thermal performance enhancement of phase change material using aluminum-mesh grid foil for lithium-capacitor modules. J. Energy Storage 2020, 30, 101508. [Google Scholar] [CrossRef]
- Pu, L.; Zhang, S.; Xu, L.; Ma, Z.; Wang, X. Numerical study on the performance of shell-and-tube thermal energy storage using multiple PCMs and gradient copper foam. Renew. Energy 2021, 174, 573–589. [Google Scholar] [CrossRef]
- Behi, M.; Shakorian-poor, M.; Mirmohammadi, S.A.; Behi, H.; Rubio, J.I.; Nikkam, N.; Farzaneh-Gord, M.; Gan, Y.; Behnia, M. Experimental and numerical investigation on hydrothermal performance of nanofluids in micro-tubes. Energy 2020, 193, 116658. [Google Scholar] [CrossRef]
- Behi, H.; Karimi, D.; Behi, M.; Jaguemont, J.; Ghanbarpour, M.; Behnia, M.; Berecibar, M.; van Mierlo, J. Thermal management analysis using heat pipe in the high current discharging of lithium-ion battery in electric vehicles. J. Energy Storage 2020, 32, 101893. [Google Scholar] [CrossRef]
- Behi, H.; Ghanbarpour, M.; Behi, M. Investigation of PCM-assisted heat pipe for electronic cooling. Appl. Therm. Eng. 2017, 127, 1132–1142. [Google Scholar] [CrossRef]
- Behi, H.; Karimi, D.; Jaguemont, J.; Berecibar, M.; van Mierlo, J. Experimental study on cooling performance of flat heat pipe for lithium-ion battery at various inclination angels. Energy Perspect. 2020, 1, 77–92. [Google Scholar]
- Behi, H.; Karimi, D.; Gandoman, F.H.; Akbarzadeh, M.; Khaleghi, S.; Kalogiannis, T.; Hosen, M.S.; Jaguemont, J.; van Mierlo, J.; Berecibar, M. PCM assisted heat pipe cooling system for the thermal management of an LTO cell for high-current profiles. Case Stud. Therm. Eng. 2021, 25, 100920. [Google Scholar] [CrossRef]
- Karimi, D.; Behi, H.; Hosen, M.S.; Jaguemont, J.; Berecibar, M.; van Mierlo, J. A compact and optimized liquid-cooled thermal management system for high power lithium-ion capacitors. Appl. Therm. Eng. 2021, 185, 116449. [Google Scholar] [CrossRef]
- Karimi, D.; Behi, H.; Jaguemont, J.; el Baghdadi, M.; van Mierlo, J.; Hegazy, O. Thermal Concept Design of MOSFET Power Modules in Inverter Subsystems for Electric Vehicles. In Proceedings of the 2019 9th International Conference on Power and Energy Systems (ICPES), Perth, WA, Australia, 10–12 December 2019. [Google Scholar] [CrossRef]
- He, A.; Shao, C. Study on the induced noise of gas–liquid two-phase flow in a centrifugal pump. Appl. Acoust. 2021, 176, 107892. [Google Scholar] [CrossRef]
- Behi, H.; Karimi, D.; Behi, M.; Ghanbarpour, M.; Jaguemont, J.; Sokkeh, M.A.; Gandoman, F.H.; Berecibar, M.; van Mierlo, J. A new concept of thermal management system in Li-ion battery using air cooling and heat pipe for electric vehicles. Appl. Therm. Eng. 2020, 174, 115280. [Google Scholar] [CrossRef]
- Behi, H.; Karimi, D.; Jaguemont, J.; Gandoman, F.H.; Khaleghi, S.; van Mierlo, J.; Berecibar, M. Aluminum heat sink assisted air-cooling thermal management system for high current applications in electric vehicles. In Proceedings of the 2020 AEIT International Conference of Electrical and Electronic Technologies for Automotive (AEIT AUTOMOTIVE), Turin, Italy, 18–20 November 2020. [Google Scholar] [CrossRef]
- Kalbasi, R. Introducing a novel heat sink comprising PCM and air—Adapted to electronic device thermal management. Int. J. Heat Mass Transf. 2021, 169, 120914. [Google Scholar] [CrossRef]
- Akbarzadeh, M.; Kalogiannis, T.; Jaguemont, J.; Jin, L.; Behi, H.; Karimi, D.; Beheshti, H.; van Mierlo, J.; Berecibar, M. A comparative study between air cooling and liquid cooling thermal management systems for a high-energy lithium-ion battery module. Appl. Therm. Eng. 2021, 198, 117503. [Google Scholar] [CrossRef]
- Wang, M.; Teng, S.; Xi, H.; Li, Y. Cooling performance optimization of air-cooled battery thermal management system. Appl. Therm. Eng. 2021, 195, 117242. [Google Scholar] [CrossRef]
- Kausthubharam; Koorata, P.K.; Chandrasekaran, N. Numerical investigation of cooling performance of a novel air-cooled thermal management system for cylindrical Li-ion battery module. Appl. Therm. Eng. 2021, 193, 116961. [Google Scholar] [CrossRef]
- Li, X.; Zhao, J.; Yuan, J.; Duan, J.; Liang, C. Simulation and analysis of air cooling configurations for a lithium-ion battery pack. J. Energy Storage 2021, 35, 102270. [Google Scholar] [CrossRef]
- Xu, Y.; Zhang, H.; Xu, X.; Wang, X. Numerical analysis and surrogate model optimization of air-cooled battery modules using double-layer heat spreading plates. Int. J. Heat Mass Transf. 2021, 176, 121380. [Google Scholar] [CrossRef]
- Karimi, D.; Behi, H.; Jaguemont, J.; Berecibar, M.; van Mierlo, J. Optimized air-cooling thermal management system for high power lithium-ion capacitors. Energy Perspect. 2020, 1, 93–105. [Google Scholar]
- Soltani, M.; Berckmans, G.; Jaguemont, J.; Ronsmans, J.; Kakihara, S.; Hegazy, O.; van Mierlo, J.; Omar, N. Three dimensional thermal model development and validation for lithium-ion capacitor module including air-cooling system. Appl. Therm. Eng. 2019, 153, 264–274. [Google Scholar] [CrossRef]
- Karimi, D.; Khaleghi, S.; Behi, H.; Beheshti, H.; Hosen, M.S.; Akbarzadeh, M.; van Mierlo, J.; Berecibar, M. Lithium-ion capacitor lifetime extension through an optimal thermal management system for smart grid applications. Energies 2021, 14, 2907. [Google Scholar] [CrossRef]
- Hosen, M.S.; Karimi, D.; Kalogiannis, T.; Pirooz, A. Electro-aging model development of nickel-manganese-cobalt lithium-ion technology validated with light and heavy-duty real-life profiles. J. Energy Storage 2020, 28, 101265. [Google Scholar] [CrossRef]
- Jaguemont, J.; Nikolian, A.; Omar, N.; Goutam, S.; van Mierlo, J.; van den Bossche, P. Development of a Two-Dimensional-Thermal Model of Three Battery Chemistries. IEEE Trans. Energy Convers. 2017, 32, 1447–1455. [Google Scholar] [CrossRef]
- Soltani, M. Advanced Modelling Techniques for Lithium-ion Capacitor Technology. Ph.D. Thesis, Vrije Universiteit Brussel (VUB), Brussels, Belgium, 2020. [Google Scholar]
- Soltani, M.; Jaguemont, J.; Boninsegna, M.; Berckmans, G.; Abdel-monem, M. Thermal Management System for a Lithium-Ion Capacitor Module with Air Cooling Strategy. In Proceedings of the International Electric Vehicle Symposium and Exhibition (EVS), Stuttgart, Germany, 9–11 October 2017; pp. 1–10. [Google Scholar]
- Li, W.; Xiao, M.; Peng, X.; Garg, A.; Gao, L. A surrogate thermal modeling and parametric optimization of battery pack with air cooling for EVs. Appl. Therm. Eng. 2019, 147, 90–100. [Google Scholar] [CrossRef]
- Zhang, F.; Lin, A.; Wang, P.; Liu, P. Optimization design of a parallel air-cooled battery thermal management system with spoilers. Appl. Therm. Eng. 2021, 182, 116062. [Google Scholar] [CrossRef]


Publisher’s Note: MDPI stays neutral with regard to jurisdictional claims in published maps and institutional affiliations. |
© 2021 by the authors. Licensee MDPI, Basel, Switzerland. This article is an open access article distributed under the terms and conditions of the Creative Commons Attribution (CC BY) license (https://creativecommons.org/licenses/by/4.0/).