Article

Application of the Sinusoidal Voltage for Detection of the Resonance in Inductive Voltage Transformers

Institute of Mechatronics and Information Systems, Lodz University of Technology, 90-924 Lodz, Poland
*
Author to whom correspondence should be addressed.
Energies 2021, 14(21), 7047; https://doi.org/10.3390/en14217047
Submission received: 1 September 2021 / Revised: 21 October 2021 / Accepted: 25 October 2021 / Published: 28 October 2021
(This article belongs to the Special Issue Development of Voltage and Current Transformers in Power System)

Abstract

:
In the case of the inductive voltage transformer (VT), the resonance phenomenon may be the main reason for its poor transformation accuracy of the non-sinusoidal voltage. This problem mainly results from the leakage inductance and the parasitic capacitance of its primary winding. The application of the sinusoidal voltage with a frequency from 20 Hz to 20 kHz presented in this study ensures proper identification of the resonance frequencies of the medium-voltage (MV) inductive VTs. The results are consistent with the values obtained in the reference condition at their nominal primary voltage. Therefore, it is proven that the proposed solution is effective in all cases. The influence of the main frequency variation of the non-sinusoidal primary voltage on the resonance properties of the inductive VT is also studied. Moreover, the tests indicate that the capacitance of the load of the secondary winding may cause a decrease in their resonance frequency.

Graphical Abstract

1. Introduction

The resonance phenomena that comes from the simultaneous existence of inductance and capacitance in the primary winding causes the inductive VTs poor transformation accuracy of higher harmonics [1,2,3,4,5]. Moreover, the slow and the fast front transient phenomena may be the reason for overvoltages on their secondary windings [2,6]. The inductive VTs are the nonlinear devices due to the nonlinear B(H) curve (relation of the magnetic flux density to the magnetic field strength) of their magnetic core [7]. If the inductive VTs are used, this may cause deterioration of the measurement accuracy of power quality, harmonic synchrophasors, and residual voltage [8,9,10,11,12,13]. To detect this problem, their transformation accuracy of higher harmonics is examined. Of course, voltage dividers and electronic VT may be used in the power grid, but still, the inductive VTs are most common [14,15,16]. There are the methods proposed in the literature for such an evaluation [10,17,18,19,20,21]. In the edition of the IEC 61,869 standard from the year 2007, there are no requirements to test the inductive instrument transformers’ accuracy at higher harmonics [22,23]. However, in its latest draft, the optional requirements for transformation accuracy of higher harmonics for inductive VT are proposed. Typically, inductive VT transformation accuracy of harmonics is evaluated with the reference to the wideband voltage divider [17,18,19,20,21]. Secondary voltages are compared using two synchronous A/D converters. The FFT conversion is applied to calculate the RMS values of harmonics and their phase angle. To increase the accuracy of the method, differential voltage between high potential terminals of the VT secondary winding and output of divider can be measured [17]. In the paper [20], the sinusoidal voltage is used for their wideband characterization of transformation accuracy. However, the problem caused by the self-generation of the low-frequency harmonics into the secondary voltage due to the nonlinearity of the magnetization characteristic of the magnetic core is not considered [2]. This phenomenon is much less important than in the case of the inductive CT, but still, the change in the determined values of ratio error and phase displacement with the phase angle of the transformed higher harmonic in relation to the main harmonic of distorted primary voltage may be significant [24,25]. Therefore, up to 650 Hz, such an approach is not accurate and may introduce significant measurement uncertainty of the values of voltage error and phase displacement.
The presented study concerns the application of sinusoidal voltage of the RMS value equal to 100 V to determine the resonance frequency(ies) of the VTs as a simultaneous peak of the values of voltage error and phase displacement. These are very high values and, therefore, easily measurable, which is significant to ensure the high reliability of the proposed method. The novelty and contribution of this work is to present the simplified solution to detect the resonance frequency and to show the low accuracy of this approach in determining the transformation accuracy of inductive VTs for higher harmonics of distorted primary voltage. The results of the sinusoidal approximation of the transformation characteristics of harmonics are compared with the values obtained from the reference method, when the transformation accuracy of VT for the non-sinusoidal voltage at a nominal RMS value is evaluated. The values of voltage error and phase displacement determined for transformation of the sinusoidal voltage and harmonics of the distorted voltage at its rated RMS value are different due to the nonlinearity of the B(H) curve of the inductive VT. It is proven that the proposed solution is effective in the case of all tested inductive VTs, since the resonance phenomenon is caused by the parasitic capacitance and the leakage inductance of the primary winding, which are independent of the applied voltage [1,2,4]. The influence of the main frequency variation of the non-sinusoidal primary voltage on the transformation accuracy of harmonics is also tested. If the frequency of the higher harmonic is close to the resonance frequency of inductive VT, where the maximum values of voltage error and phase displacement are obtained, it causes significant change in its transformation accuracy. The frequency of the higher harmonic may not be exactly the same as the resonance frequency. Therefore, the values of voltage error and phase displacement measured for the higher harmonic of distorted primary voltages with a different main frequency obtain various values close to the resonance frequency detected by the sinusoidal test. Furthermore, this research indicates that the capacitance of the load of the secondary winding may decrease the first resonance frequency of the MV inductive VT. Moreover, the harmonics transformation accuracy of two manufactured units of the inductive VTs with the same voltage ratio and nominal frequency 50 Hz was compared. The highest values of the difference in transformation accuracy were obtained for 3rd-, 5th-, and 7th-order harmonics and at their highest tested frequency up to 5 kHz. At low frequencies, it results from the self-generation of these harmonics. At high frequencies, it is the effect of the different values of the primary windings parasitic capacitances of tested VTs. The most important factors causing the limitation of the frequency band of operation of the inductive VT are the high values of the parasitic capacitance and the leakage inductance of its primary winding. Therefore, if more turns of the primary winding are required, the frequency of resonance is lower.

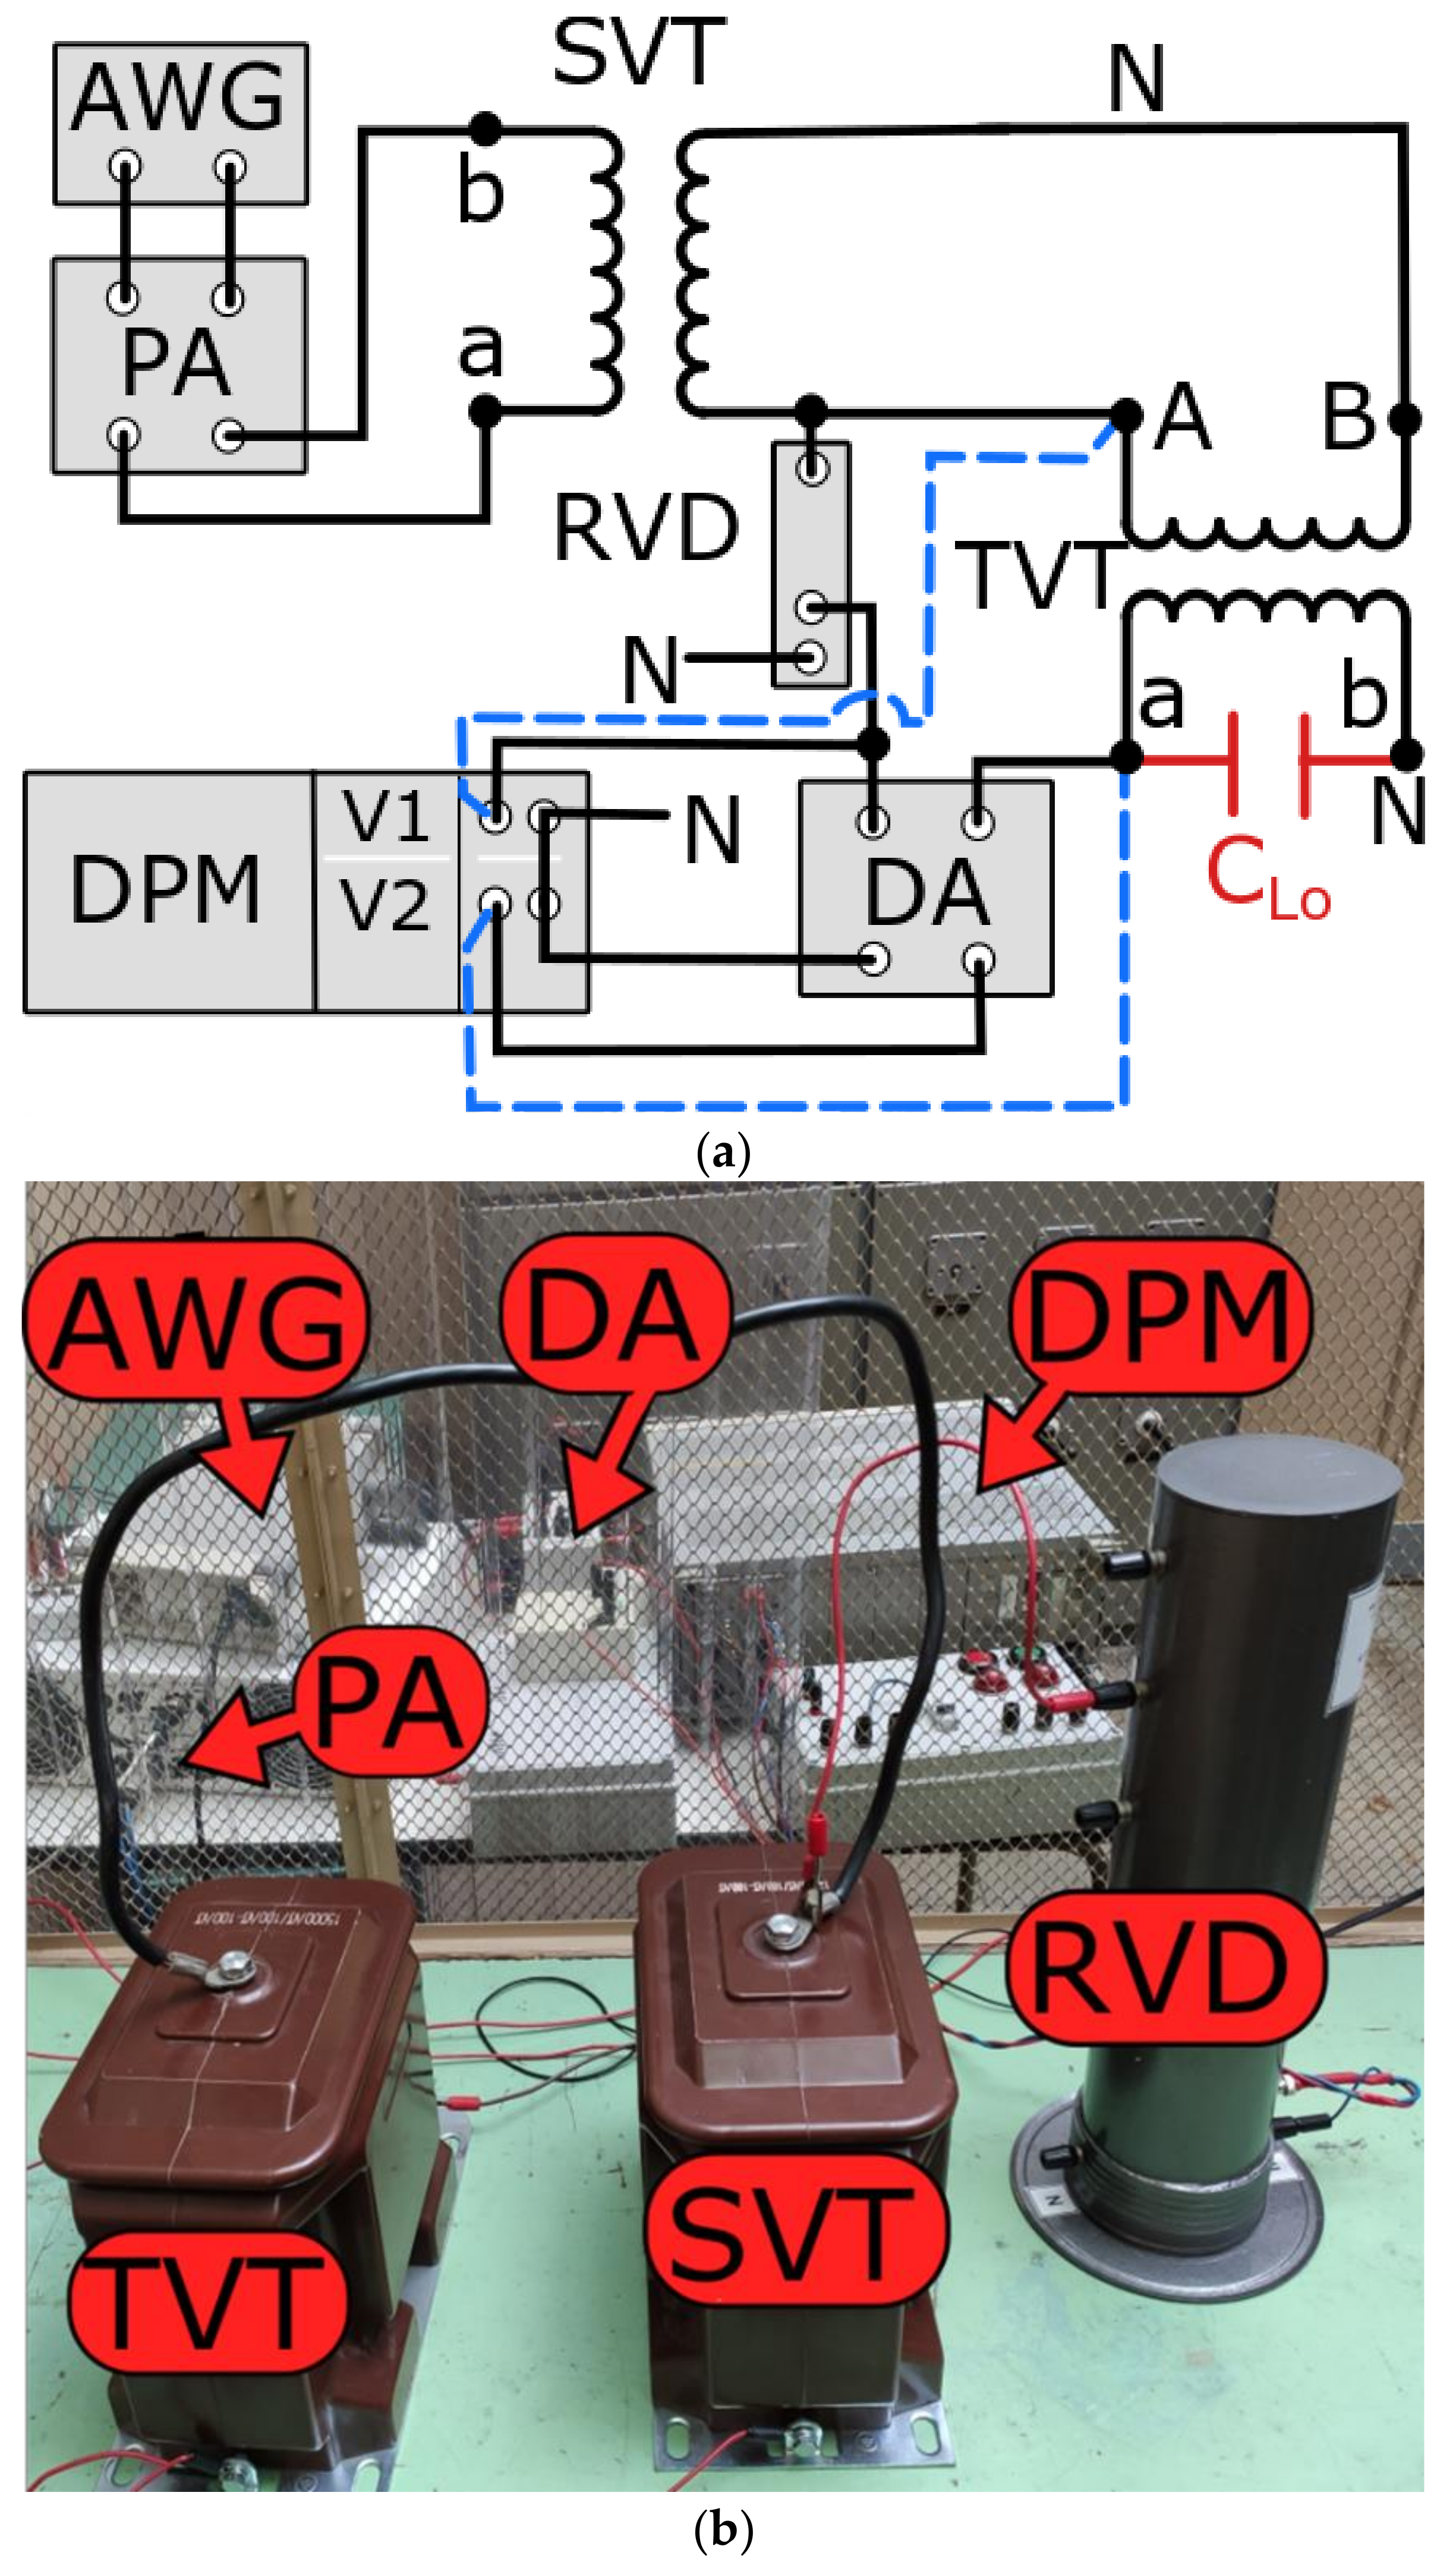
2. The Laboratory Setup and Tests Conditions

During the research, the inductive VTs with the nominal primary voltage: (15/√3) kV, 15 kV, (20/√3) kV, and 20 kV were tested. Their nominal secondary voltage was equal to (100/√3) V or 100 V, respectively. Accuracy class of tested inductive VTs was 0.5. The measurement system that was used is shown in Figure 1.
In Figure 1, the following abbreviations are used: AWG—arbitrary waveform generator, PA—power amplifier, DA—differential amplifier, DPM—digital power meter, RVD—reference voltage divider, TVT—tested voltage transformer, SVT—step-up voltage transformer, and CLo—load capacitor.
The laboratory setup presented in Figure 1 has two configurations. The first one (black solid lines, Figure 1a) is used for evaluation of the transformation accuracy of the non-sinusoidal voltage by tested VT (TVT). The measurement uncertainty of this developed differential method for testing the transformation accuracy of harmonics of distorted voltage by medium-voltage instrument transformers is discussed in the paper [17]. The expanded combined measurement uncertainties of the values of ratio error and phase displacement with the coverage factor equal to 2 (level of confidence of about 95%) determined in this case for ±0.1%\±0.1° are equal to [17]:
  • 50 Hz: ±0.015%\±0.013°;
  • 5 kHz: ±0.071%\±0.137°.
The expanded combined measurement uncertainties of ratio error and phase displacement when differential measuring system are used, and the determined values equal to ±5.0%\±5.0° are:
  • 50 Hz: ±0.104%\±0.171°;
  • 5 kHz: ±0.216%\±0.338°.
In this case, the source of uncertainty results from the accuracy of used equipment including the RVD and the DPM and, additionally, from the DA.
The second configuration (blue dashed lines, Figure 1a) is used for testing the transformation accuracy of sinusoidal voltage. The expanded combined measurement uncertainties of the values of ratio error and phase displacement with the coverage factor equal to 2 (level of confidence of about 95%) determined in this case irrespective of the measured values are equal to [17]:
  • 50 Hz: ±0.507%\±0.535°;
  • 5 kHz: ±0.178%\±2.160°.
The source of uncertainty results from the accuracy of used equipment the RVD and the DPM. The differential method is characterized by the lower expanded combined measurement uncertainties in relation to the used method for sinusoidal voltages where two values from two channels of DPM are compared. Therefore, the results from this method are used as reference values for measurements with the sinusoidal voltage applied for the detection of the resonance in inductive VTs.
Optionally, if required by the test procedure the capacitor (CLo) is connected to its secondary winding (red solid lines, Figure 1a). The value 1 μF is chosen in order to cause the change in the resonance frequency of tested VT in an analyzed range up to 5 kHz. To generate non-sinusoidal supply voltage with an adjustable level of harmonics, the power amplifier (PA) with the arbitrary waveform generator (AWG) is used [26,27]. To step-up the non-sinusoidal voltage, one unit of the inductive VT (SVT) is used [17]. The non-sinusoidal voltage during the test is composed of the main component of frequency 50 Hz and a single higher frequency harmonic up to 5 kHz. The percentage value of the higher harmonic is equal to 10% of the main component for all tested frequencies. Its phase angle with respect to the main component is equal to 0, but for the harmonics up to the frequency of 650 Hz, it is changed in 10° steps [17]. The differential amplifier (DA) is used to convert the differential voltage between TVT and the reference voltage divider (RVD) to the single-ended voltage [28,29,30,31]. The measurements are made by the digital power meter (DPM). The voltage error [%] is defined by the following equation [23]:
Δ U = U T V T U R V D U R V D × 100 %
UTVT/URVD—the RMS value of the sinusoidal voltage or a harmonic of the non-sinusoidal voltage in the secondary/output voltage of the TVT/RVD.
Phase displacement [°] is defined by the following equation [23]:
φ U = ψ U T V T ψ U R V D
ψUTVT—the phase angle of sinusoidal voltage or a harmonic component in the secondary voltage of TVT with respect to the reference sinusoidal voltage from RVD or the main component of the non-sinusoidal voltage.
ψURVD—the phase angle of sinusoidal voltage or a harmonic in the output of RVD with respect to its main component.

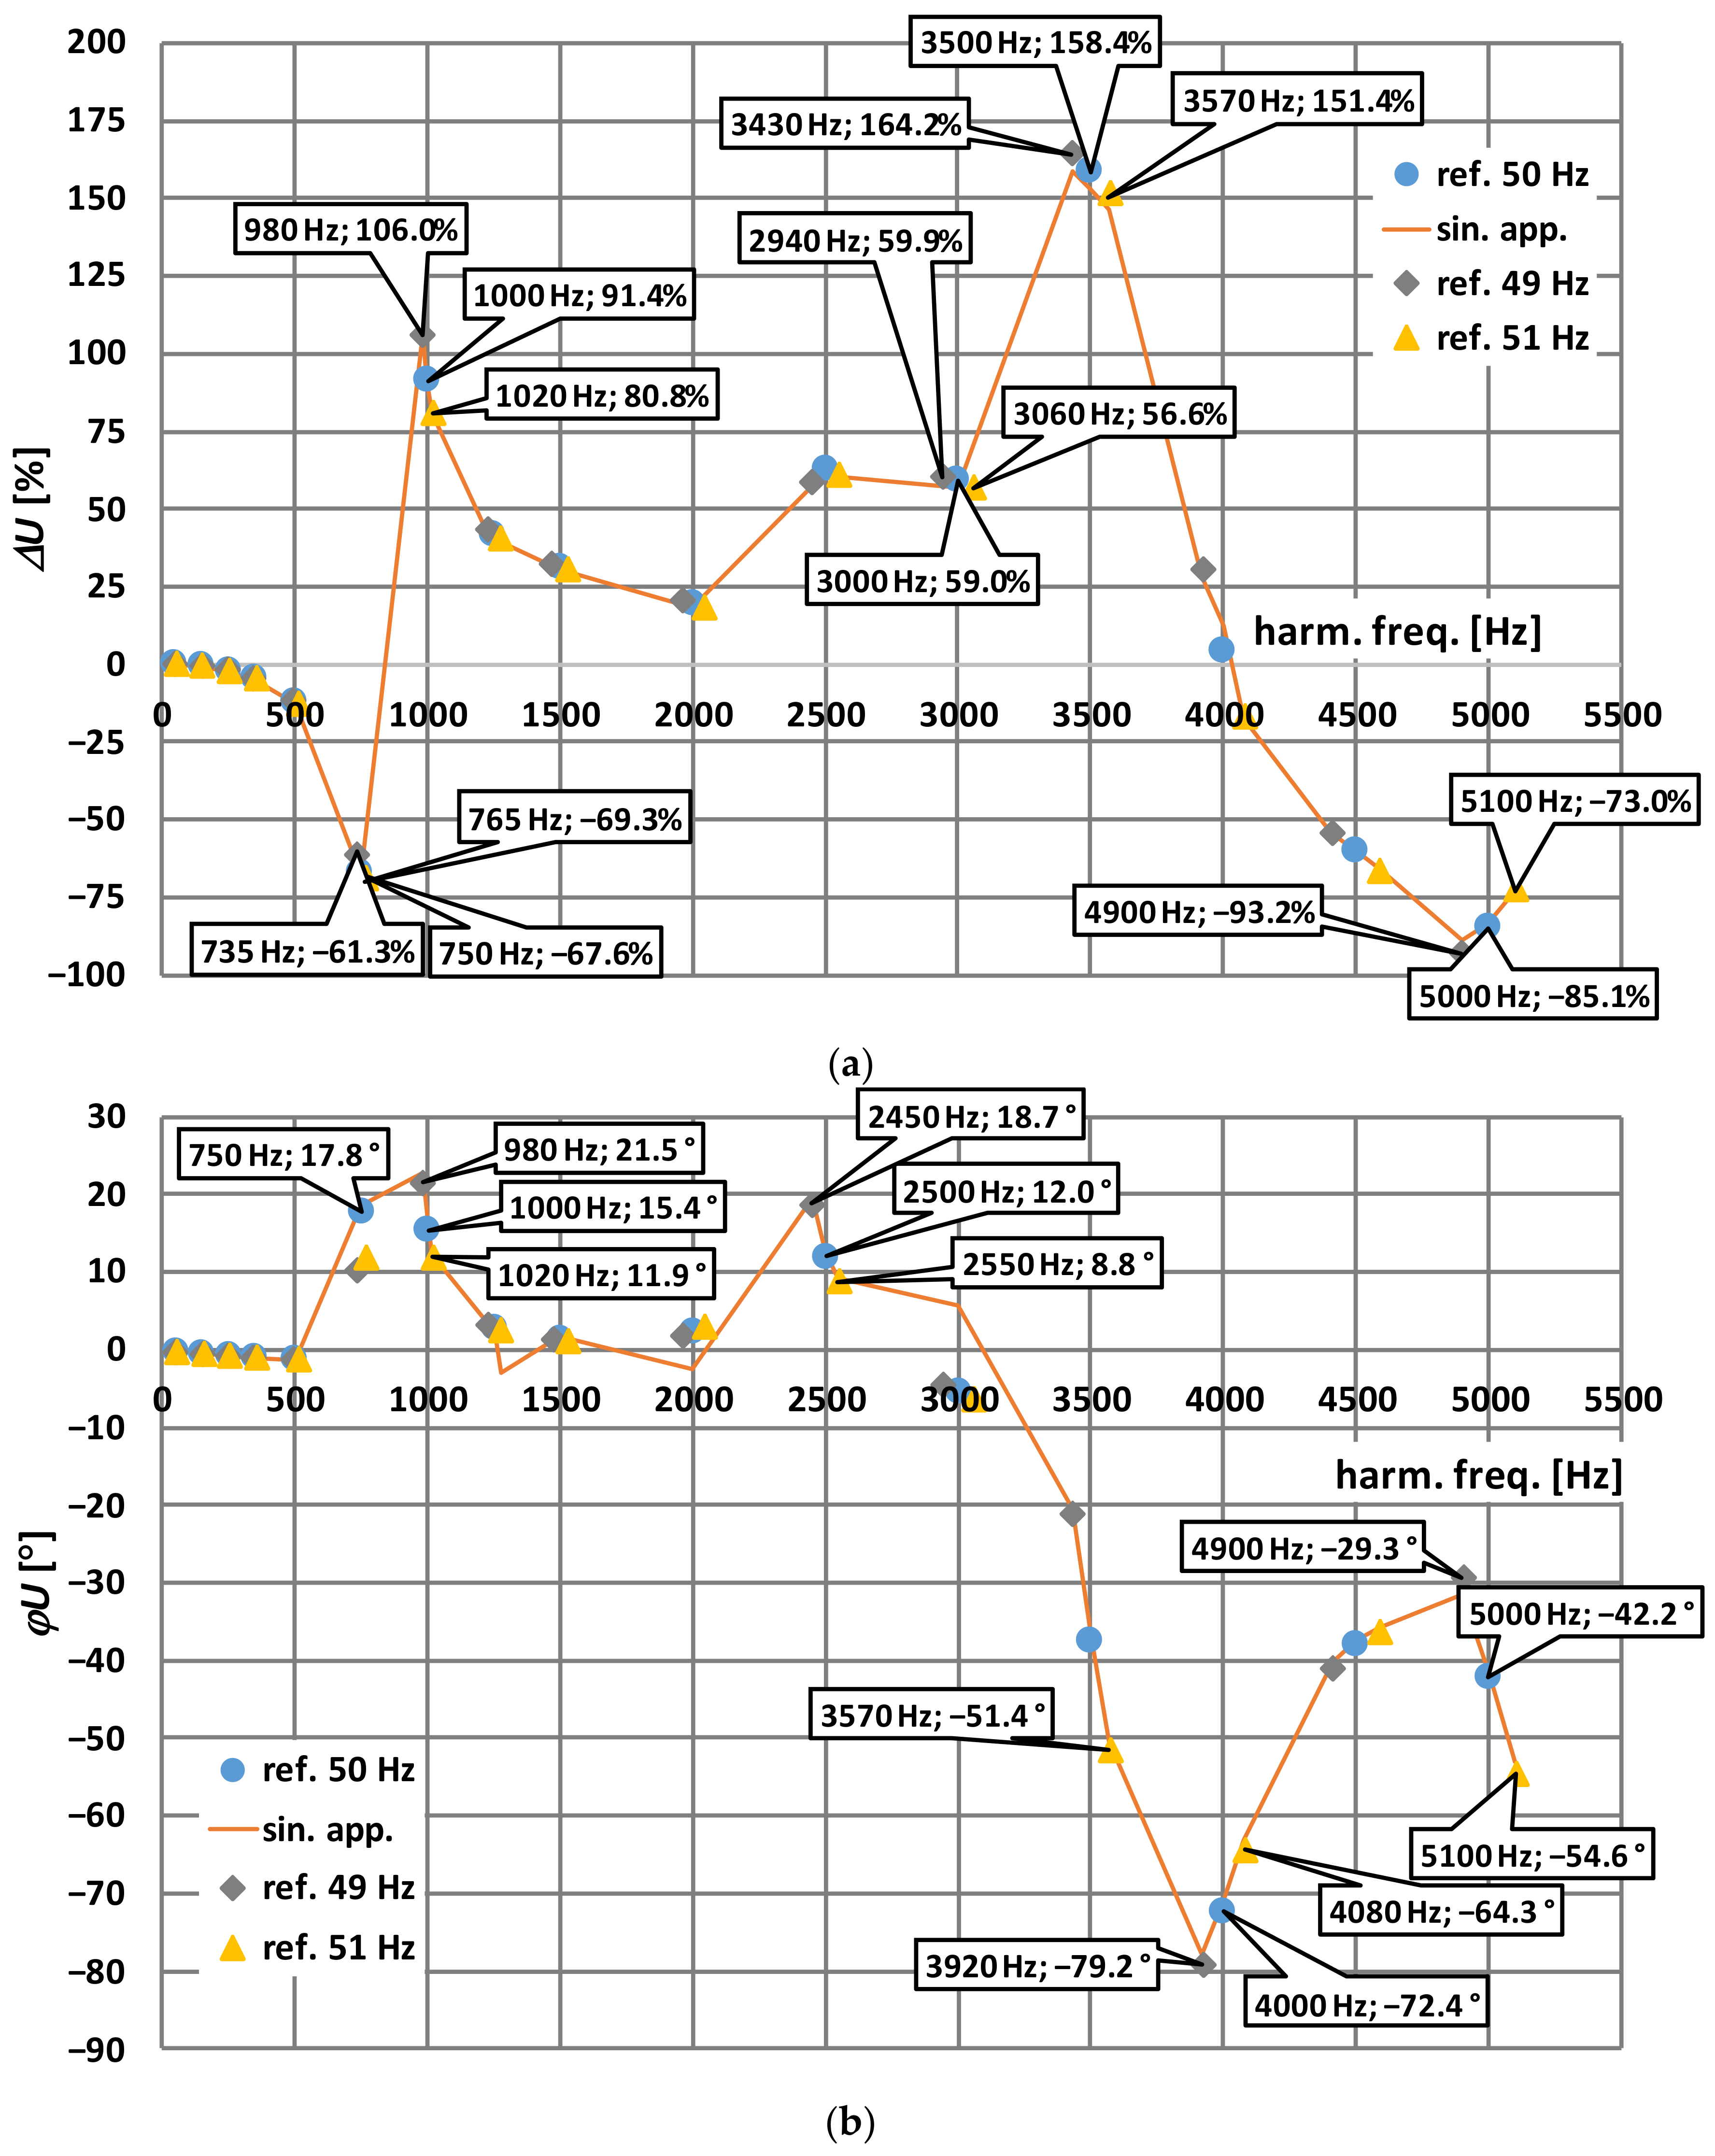
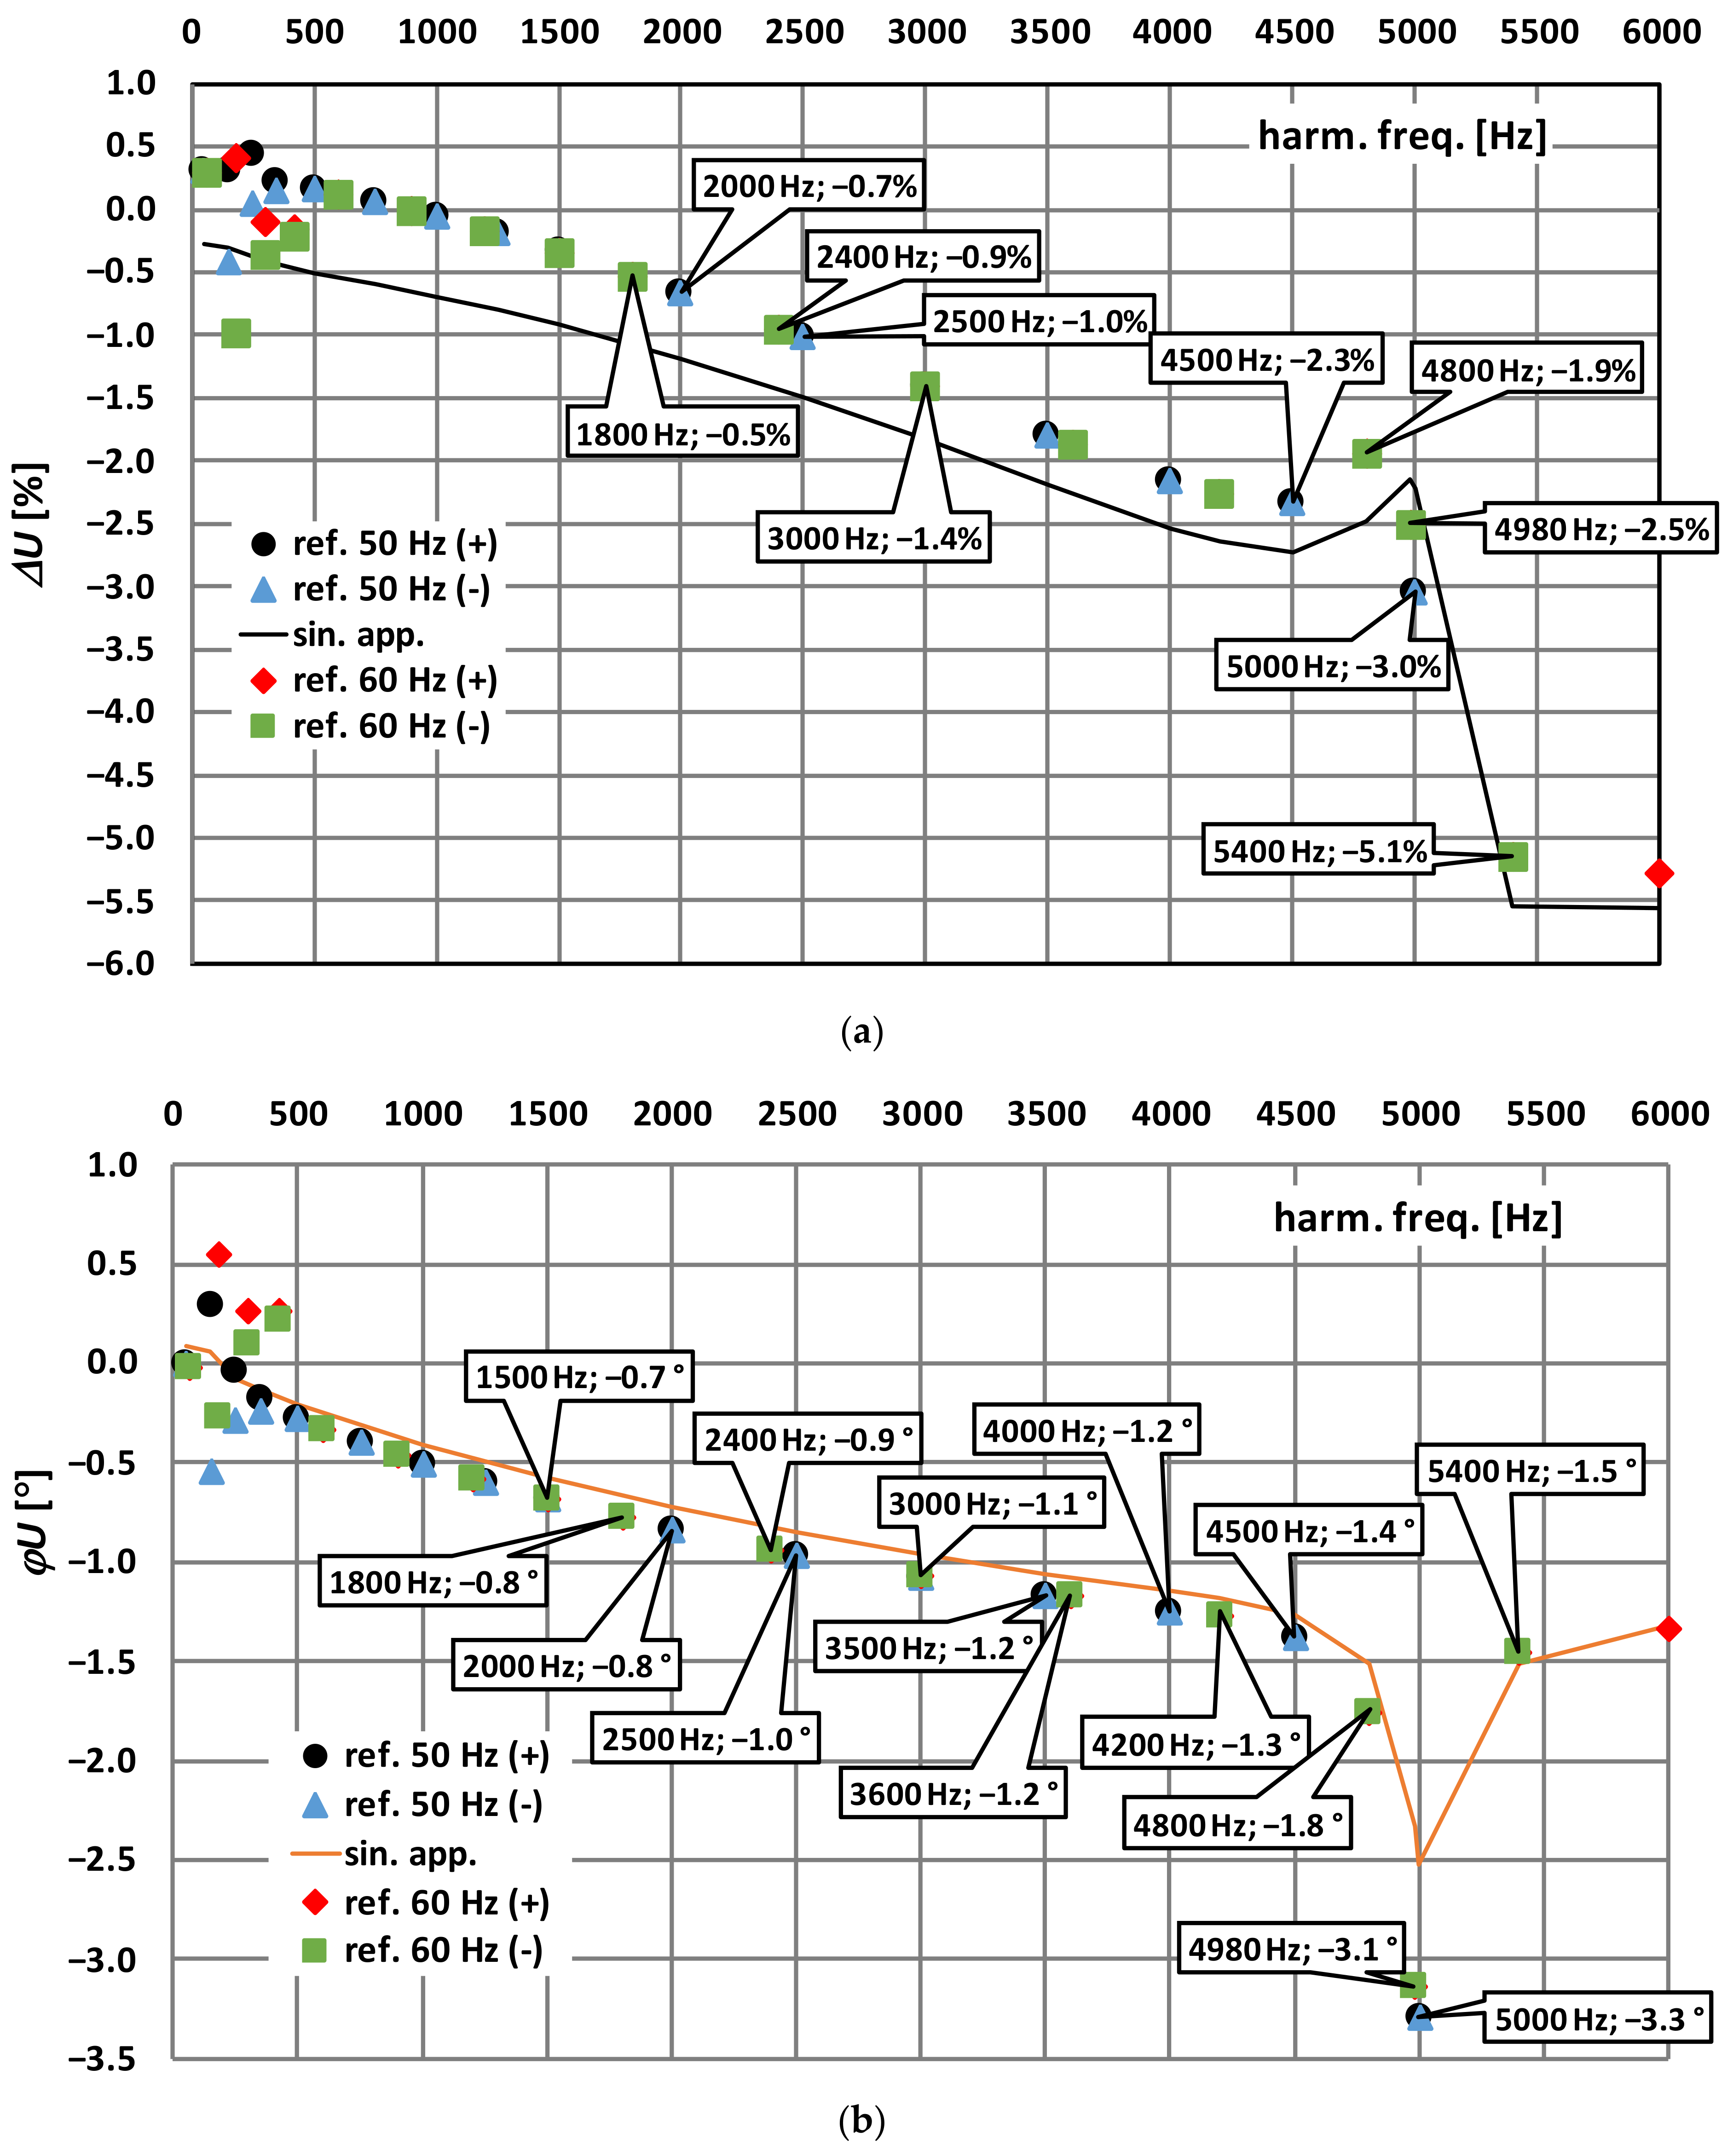
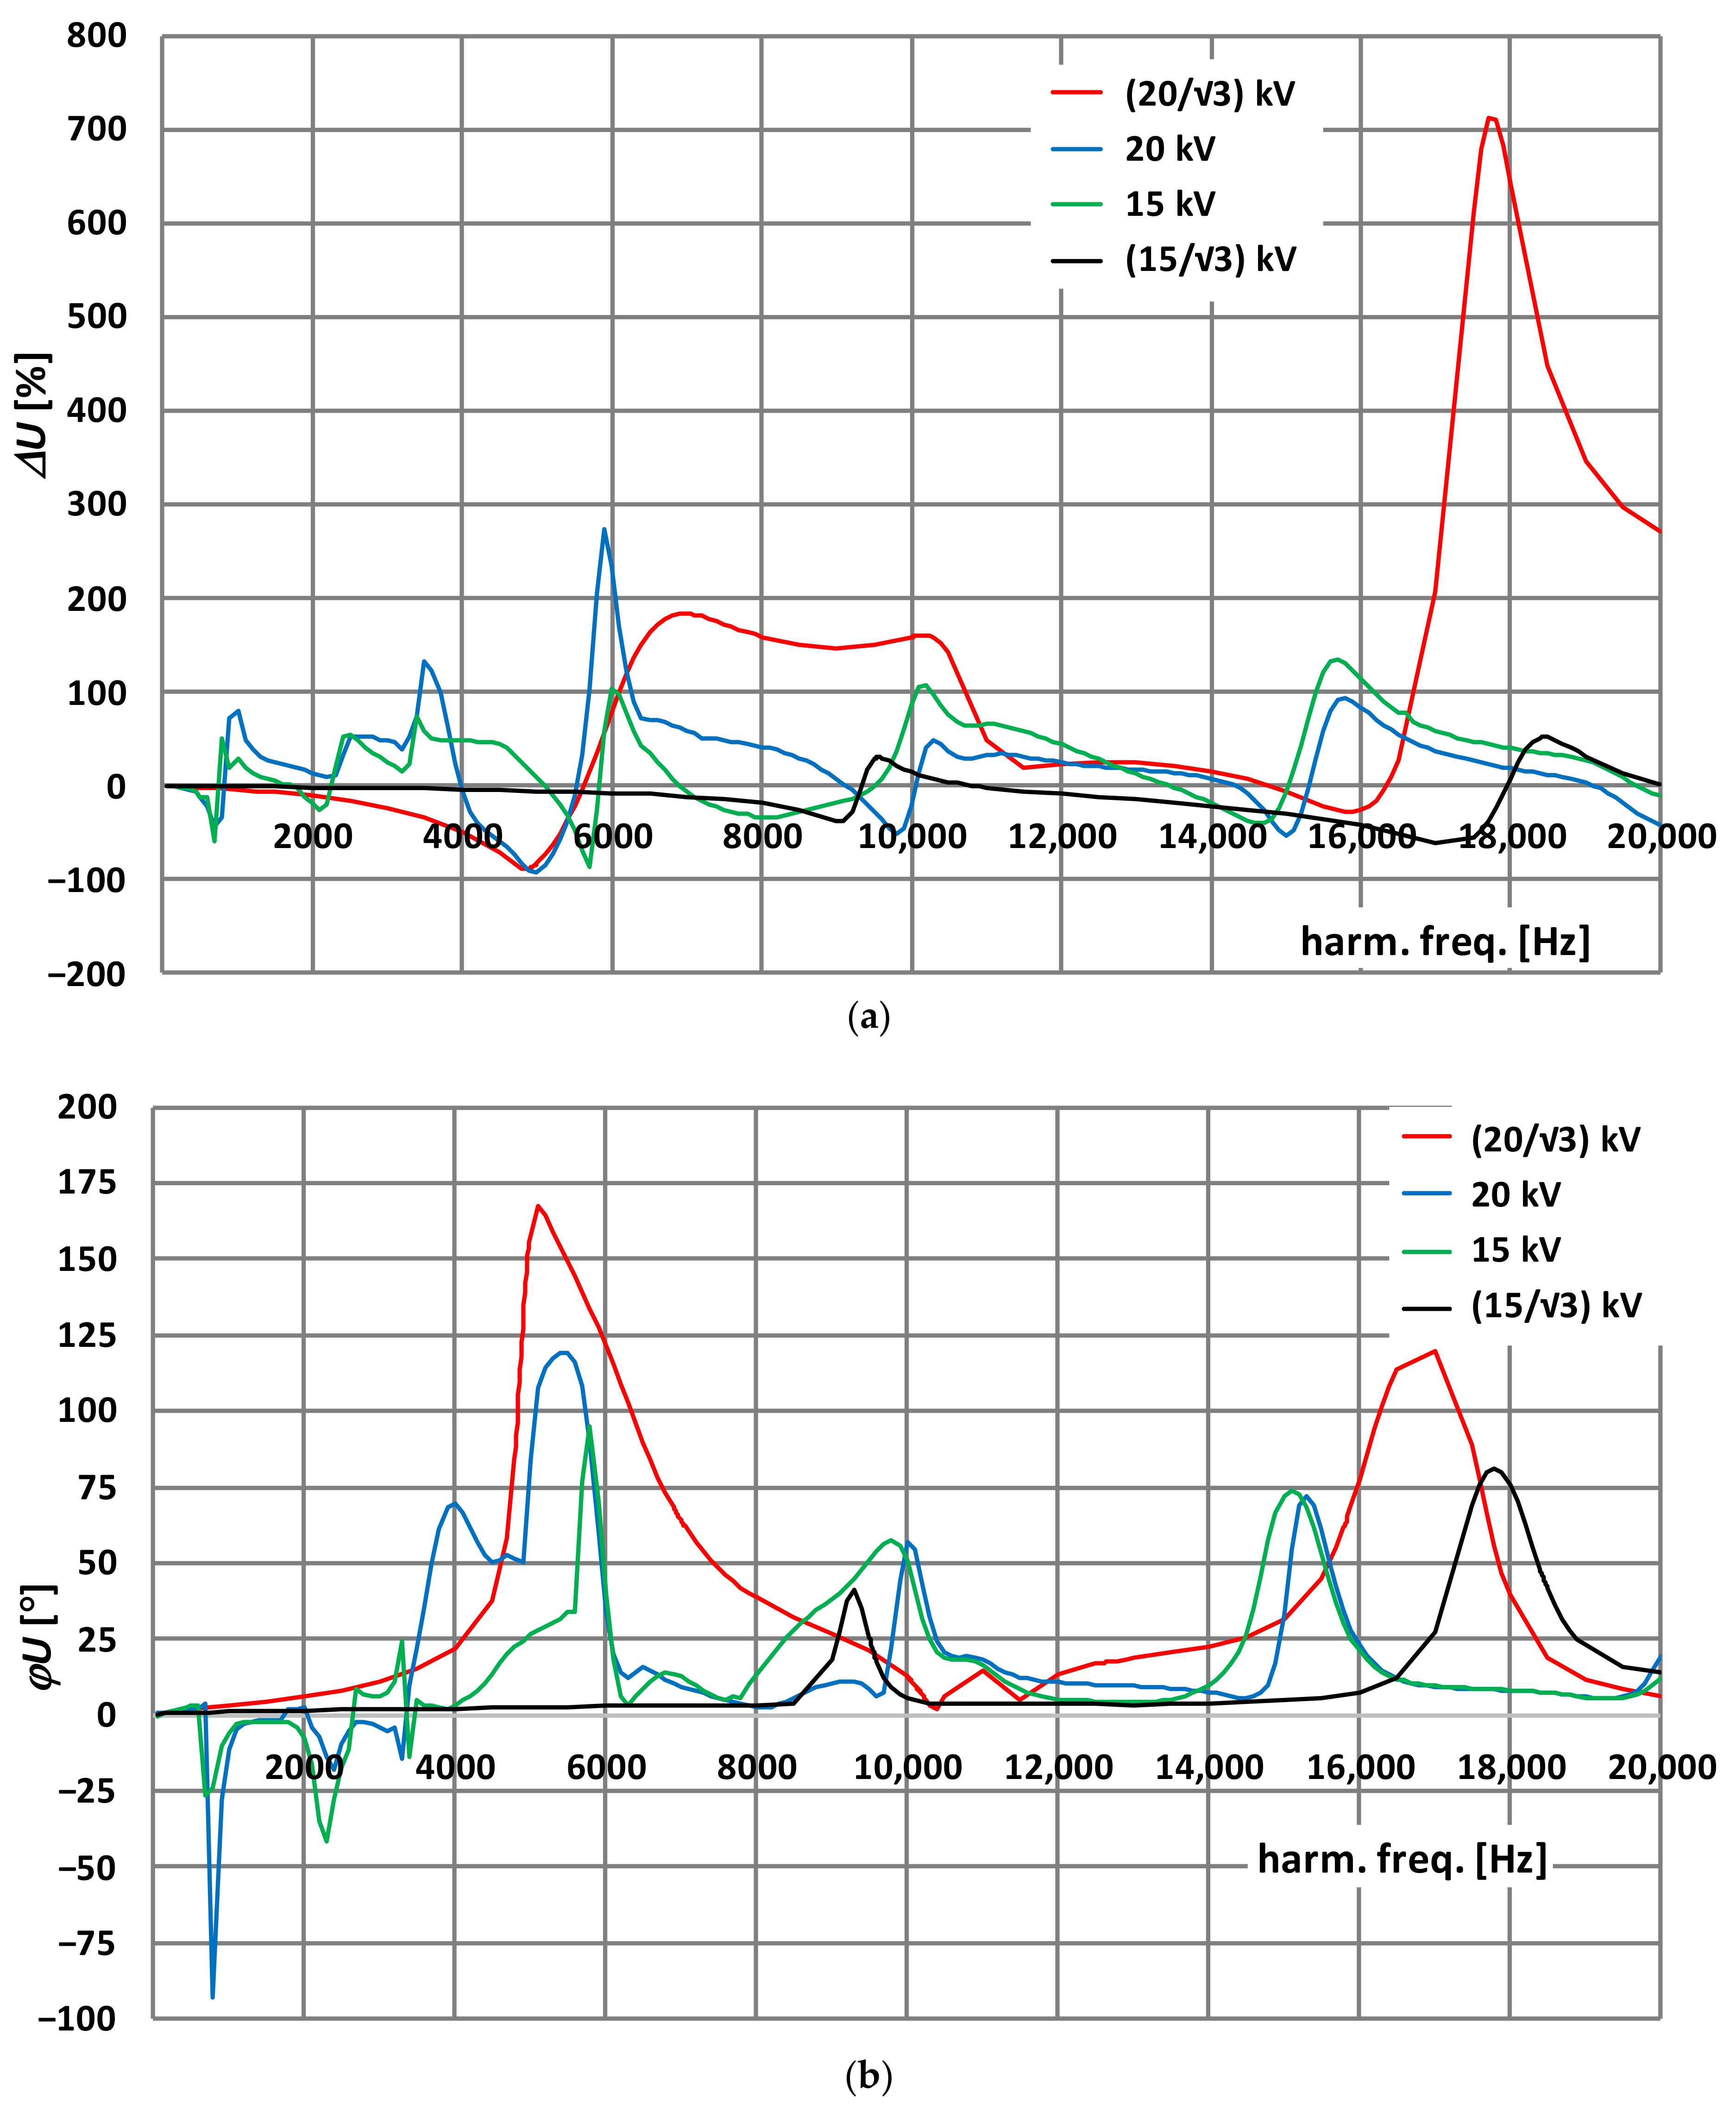
3. The Results of the Research

In Figure 2, the comparison of the transformation accuracy determined for harmonics of the non-sinusoidal primary voltage and sinusoidal voltage in the case of TVT with the nominal 20 kV primary voltage is presented.
In Figure 2, the dots labeled “50 Hz”, “49 Hz”, and “51 Hz” present the results of the transformation accuracy of a given harmonic with the main component of frequencies 50 Hz, 49 Hz, and 51 Hz, respectively. If the 1st harmonic frequency is equal to 50 Hz, the frequency of the 10th harmonic is equal to 500 Hz, while if it is equal to 51 Hz or 49 Hz, it is equal to 510 Hz or 490 Hz. The curve labeled “sin. app.” concerns sinusoidal approximation of transformation accuracy for harmonics of distorted voltage determined for the transformation of sinusoidal primary voltage. Consistency of the results for the harmonic of non-sinusoidal voltage and sinusoidal voltage confirms the effectiveness of proposed solution to determine resonance frequencies of medium-voltage inductive VTs. Furthermore, the successful implementation of this low-voltage solution demonstrates that the issue is caused by the existence of capacitances and inductances in the primary winding and does not concern the magnetic core and its nonlinear B(H) curve [1,2,32].
In Figure 3, the comparison of the values of voltage error and phase displacement determined for harmonics of the non-sinusoidal primary voltage and sinusoidal voltage in the case of the VT with the 15 kV nominal primary voltage is presented.
The change in the frequency of the higher harmonic resulting from the variation of the frequency of the main component of non-sinusoidal voltage in the case of resonance causes a significant change in its transformation accuracy. This is due to the high slope of the curves in Figure 3. However, the application of the sinusoidal voltage enables us to accurately determine the maximum values of voltage error and phase displacement with 10 Hz steps.
In Figure 4, the comparison of the values of voltage error and phase displacement determined for harmonics of the non-sinusoidal primary voltage and sinusoidal voltage in the case of the inductive VT with the (20/√3) kV nominal primary voltage is presented.
In Figure 4, the dots labeled “50 Hz (+)” and “50 Hz (−)” present the results of transformation accuracy of a given harmonic with the main component of frequency 50 Hz. The notation (+) means that the maximum positive values of voltage error and phase displacement are determined. While, the notation (−) means that the maximum negative values of voltage error and phase displacement are determined. The difference in these values results from the nonlinear B(H) curve of tested inductive VT magnetic core and self-generation of low-order higher harmonics to its secondary voltage. Therefore, it is required that, in this case, in the frequency range up to 500 Hz, the results were analyzed in more detail (Figure 5).
It results from Figure 5 that self-generation of the harmonics by this inductive VT causes significant changes in its transformation accuracy up to 500 Hz. The values of voltage error and phase displacement vary about 0.4%/°. Moreover, the results of the measurements for the sinusoidal voltage are inaccurate. In this case, the difference in the value of voltage error reached about 1.0%, while the value of phase displacement reached 0.7°. Therefore, the sinusoidal approximation should be used only for the detection of resonance, even if it is obtained for low-order higher harmonics.
In Figure 6, the comparison of the values of voltage error and phase displacement determined for harmonics of the non-sinusoidal primary voltage and sinusoidal voltage in the case of the inductive VT with the (15/√3) kV nominal primary voltage is presented.
It results from Figure 6 that nonlinear properties of the inductive VT again cause significant changes in its transformation accuracy up to 500 Hz. The values of voltage error and phase displacement are changing about 1.5%/1°. Therefore, the results measured for transformation of the sinusoidal voltage do not reflect the real operation conditions. This also concerns the higher frequency range. The differences in the values of voltage error or phase displacement reached about 1.0%/1.0°.
In Figure 7, the comparison of the values of voltage error and phase displacement is presented when the secondary winding of the inductive VT with the (20/√3) kV nominal primary voltage (Figure 4) is additionally loaded with 1 µF capacitance (CLo is connected).
If the secondary winding of tested inductive VT with nominal primary voltage (20/√3) kV is additionally loaded with 1 µF capacitance, resonance occurs. Therefore, the change in the frequency of the higher harmonic resulting from the variation of the frequency of the main component of non-sinusoidal voltage causes a significant change in the values of voltage error and phase displacement. However, the application of the sinusoidal voltage again enables accurate determination of the resonance frequency.
In Figure 8, the comparison of the values of voltage error and phase displacement is presented when the secondary winding of the inductive VT with the (15/√3) kV nominal primary voltage (Figure 6) is additionally loaded with 1 µF capacitance.
The 1 µF capacitance in the secondary winding of this inductive VT with the nominal primary voltage (15/√3) kV also causes the resonance as in the case of the previously tested VT. The application of the sinusoidal voltage again enables accurate determination of its frequency. The change in the frequency of the main component of non-sinusoidal voltage causes a significant change in the values of voltage error and phase displacement, as the frequency for the same order of the higher harmonic is different.
In Figure 9, the comparison of the values of voltage error and phase displacement at harmonics determined between two units of the (15/√3) kV inductive VTs is presented.
In this case, two units of the inductive VTs with voltage ratio (15/√3) kV\(100/√3) V were compared. In the differential system from Figure 1, instead, the RVD second unit of inductive VT was connected. Therefore, the differences between their values of voltage error and phase displacement were directly measured. The highest values of the difference in transformation accuracy between the units manufactured by the same company were obtained at 3rd, 5th, and 7th low-order higher harmonics and at high-frequency higher harmonics, e.g., 5 kHz. This results from the fact that self-generation by each unit of inductive VT of the low-frequency higher harmonics to the secondary voltage is similar, but it occurs at different phase angles with respect to the main component of transformed non-sinusoidal primary voltage. In Figure 9, the maximum values obtained in this case for 30° are presented. The problem at higher-frequency higher harmonics results from the different values of the parasitic capacitance in the primary windings of tested VTs.
In Figure 10, the application of sinusoidal voltage of frequencies from 20 Hz to 20 kHz and an RMS value equal to 100 V to determine the resonance frequency(ies) of all tested inductive VTs is presented.
It can be seen from Figure 10 that the resonance is detected as a simultaneous peak of the values of voltage error and phase displacement. Moreover, these high values are easily measurable. The operation frequency of inductive VT is limited by the first resonance. These high values of voltage error and phase displacement are changing rapidly near the resonance frequency due to the high slope of the curves in Figure 10. The most important factors causing the limitation of the frequency band of operation of the inductive VT are high values of the parasitic capacitance and leakage inductance of the primary winding. Therefore, inductive VTs with a higher nominal RMS value of the non-sinusoidal primary voltage have the first resonance at a lower frequency, since their primary windings have more turns. In all the tested inductive VTs, the multi-resonance circuit is present.

4. Conclusions

In case of the tested medium-voltage inductive voltage transformers, the resonance phenomenon is the main reason for their poor transformation accuracy of non-sinusoidal voltage. In this paper, it was proven that the frequency sweep of sinusoidal voltage may be applied to determine their resonance frequency(ies). Moreover, in such conditions, the tests indicate that the variation of the frequency of the main component of transformed non-sinusoidal voltage cause a significant change in transformation accuracy at a given higher harmonic. However, the sinusoidal approximation may not be used to accurately determine the values of voltage error and phase displacement for the transformation of harmonics at rated RMS value of the non-sinusoidal primary voltage. This problem mainly concerns their range of frequencies below 650 Hz. It results from the nonlinearity of the B(H) curve of the magnetic core that causes additional distortion of the secondary voltage. The self-generation of the low-order higher harmonics by tested inductive voltage transformer must be considered to accurately determine their transformation accuracy. Furthermore, the capacitance of the load of the secondary winding equal to about 1 µF may significantly decrease the first resonance frequency.

Author Contributions

Conceptualization, M.K. and E.S.; methodology, M.K.; validation, M.K. and E.S.; formal analysis, M.K.; investigation, M.K. and E.S; resources, M.K. and E.S; data curation, M.K. and E.S; writing—original draft preparation, M.K.; writing—review and editing, M.K. and E.S; visualization, E.S.; supervision, M.K. and E.S. All authors have read and agreed to the published version of the manuscript.

Funding

This research received no external funding.

Institutional Review Board Statement

Not applicable.

Informed Consent Statement

Not applicable.

Data Availability Statement

The data presented in this study are available on request from the corresponding author. Computer data is not publicly available because it is not suitable for use by another researcher.

Conflicts of Interest

The authors declare no conflict of interest.

Abbreviations

(−)the maximum negative values of voltage error and phase displacement
(+)the maximum positive values of voltage error and phase displacement
ΔUvoltage error
ψURVDthe phase angle of sinusoidal voltage or a harmonic in the output of RVD with respect to its main component
ψUTVTthe phase angle of sinusoidal voltage or a harmonic component in the secondary voltage of TVT with respect to the reference sinusoidal voltage from RVD or the main component of the non-sinusoidal voltage
“50 Hz”, “49 Hz” and “51 Hz” dotspresents the results of the transformation accuracy of a given harmonic with main component of frequency 50 Hz, 49 Hz, and 51 Hz, respectively
AWGarbitrary waveform generator
B(H) curvemagnetization characteristic of magnetic core
CLoload capacitor
DAdifferential amplifier
DPMdigital power meter
MVmedium voltage
PApower amplifier
RMSroot mean square
RVDreference voltage divider
sin. app.sinusoidal approximation of transformation accuracy for harmonics of distorted voltage determined for transformation of sinusoidal primary voltage
SVTstep-up voltage transformer
TVTtested voltage transformer
UTVT/URVDthe RMS value of the sinusoidal voltage or a harmonic of the non-sinusoidal voltage in the secondary/output voltage of the TVT/RVD
VTvoltage transformer
φUphase displacement

References

  1. Kaczmarek, M.; Stano, E. Why Should We Test the Wideband Transformation Accuracy of Medium Voltage Inductive Voltage Transformers? Energies 2021, 14, 4432. [Google Scholar] [CrossRef]
  2. Kaczmarek, M.; Brodecki, D. Transformation of Transient Overvoltages by Inductive Voltage Transformers. Sensors 2021, 21, 4167. [Google Scholar] [CrossRef] [PubMed]
  3. Buchhagen, C.; Fischer, M.; Hofmann, L.; Daumling, H. Metrological determination of the frequency response of inductive voltage transformers up to 20 kHz. In Proceedings of the 2013 IEEE Power & Energy Society General Meeting, Vancouver, BC, Canada, 21–25 July 2013; pp. 1–5. [Google Scholar] [CrossRef]
  4. Buchhagen, C.; Reese, C.; Hofmann, L.; Daumling, H. Calculation of the frequency response of inductive medium voltage transformers. In Proceedings of the 2012 IEEE International Energy Conference and Exhibition (ENERGYCON), Florence, Italy, 9–12 September 2012; pp. 794–799. [Google Scholar] [CrossRef]
  5. Zhao, S.; Li, H.; Crossley, P.; Ghassemi, F. Test and analysis of harmonic responses of high voltage instrument voltage transformers. In Proceedings of the 12th IET International Conference on Developments in Power System Protection (DPSP 2014), Copenhagen, Denmark, 31 March–3 April 2014; pp. 1–6. [Google Scholar] [CrossRef]
  6. Lamedica, R.; Pompili, M.; Sangiovanni, S.; Calcara, L.; Ruvio, A.; Cauzillo, B.A. Transient-state analysis of MV instrument transformers. Electr. Power Syst. Res. 2019, 168, 162–168. [Google Scholar] [CrossRef]
  7. Faifer, M.; Laurano, C.; Ottoboni, R.; Toscani, S.; Zanoni, M. Nonlinear Behavioral Modeling of Voltage Transformers in the Frequency Domain: Comparing Different Approaches. IEEE Trans. Instrum. Meas. 2020, 69, 8137–8145. [Google Scholar] [CrossRef]
  8. Mingotti, A.; Baldi, A.; Peretto, L.; Tinarelli, R. A General Easy-to-Use Expression for Uncertainty Evaluation in Residual Voltage Measurement. IEEE Trans. Instrum. Meas. 2019, 69, 1576–1584. [Google Scholar] [CrossRef]
  9. Dirik, H.; Duran, I.U.; Gezegin, C. A Computation and Metering Method for Harmonic Emissions of Individual Consumers. IEEE Trans. Instrum. Meas. 2019, 68, 412–420. [Google Scholar] [CrossRef]
  10. Castello, P.; Laurano, C.; Muscas, C.; Pegoraro, P.A.; Toscani, S.; Zanoni, M. Harmonic Synchrophasors Measurement Algorithms with Embedded Compensation of Voltage Transformer Frequency Response. IEEE Trans. Instrum. Meas. 2021, 70, 9001310. [Google Scholar] [CrossRef]
  11. Moghbel, M.; Masoum, M.A.S.; Fereidouni, A.; Deilami, S. Optimal sizing, siting and operation of custom power devices with STATCOM and APLC functions for real-time reactive power and network voltage quality control of smart grid. IEEE Trans. Smart Grid 2018, 9, 5564–5575. [Google Scholar] [CrossRef]
  12. Elphick, S.; Gosbell, V.; Smith, V.; Perera, S.; Ciufo, P.; Drury, G. Methods for Harmonic Analysis and Reporting in Future Grid Applications. IEEE Trans. Power Deliv. 2017, 32, 989–995. [Google Scholar] [CrossRef]
  13. Lipsky, A.; Miteva, N.; Lokshin, E. Errors in measuring of high voltage harmonics in the medium voltage power networks. In Proceedings of the 2014 IEEE International Energy Conference (ENERGYCON), Cavtat, Croatia, 13–16 May 2014; pp. 153–156. [Google Scholar] [CrossRef]
  14. Garnacho, F.; Khamlichi, A.; Rovira, J. The design and characterization of a prototype wideband voltage sensor based on a resistive divider. Sensors 2017, 17, 2657. [Google Scholar] [CrossRef] [Green Version]
  15. Liu, X.; Hu, B.; Tong, Y.; Yuan, T.; Yang, F. Characteristic study of electronic voltage transformers’ accuracy on harmonics. In Proceedings of the 2016 China International Conference on Electricity Distribution (CICED), Xi’an, China, 10–13 August 2016; pp. 1–6. [Google Scholar] [CrossRef]
  16. Zucca, M.; Modarres, M.; Giordano, D.; Crotti, G. Accurate Numerical Modelling of MV and HV Resistive Dividers. IEEE Trans. Power Deliv. 2017, 32, 1645–1652. [Google Scholar] [CrossRef]
  17. Kaczmarek, M.; Stano, E. Measuring system for testing the transformation accuracy of harmonics of distorted voltage by medium voltage instrument transformers. Measurement 2021, 181, 109628. [Google Scholar] [CrossRef]
  18. Letizia, P.S.; Crotti, G.; Giordano, D.; Delle Femine, A.; Gallo, D.; Landi, C.; Luiso, M. Low cost procedure for frequency characterization of voltage instrument transformers. In Proceedings of the 2019 IEEE International Instrumentation and Measurement Technology Conference (I2MTC), Auckland, New Zealand, 20–23 May 2019; pp. 1–6. [Google Scholar] [CrossRef]
  19. Gianesini, B.M.; Brito, V.H.F.; Lima, R.N.C.; Santos, I.N. Frequency response test of MV inductive voltage transformers for power quality applications. Renew. Energy Power Qual. J. 2020, 18, 556–561. [Google Scholar] [CrossRef]
  20. Crotti, G.; Giordano, D.; D’Avanzo, G.; Letizia, P.S.; Luiso, M. A New Industry-Oriented Technique for the Wideband Characterization of Voltage Transformers. Meas. J. Int. Meas. Confed. 2021, 182, 109674. [Google Scholar] [CrossRef]
  21. Stiegler, R.; Meyer, J.; Kilter, J.; Konzelmann, S. Assessment of voltage instrument transformers accuracy for harmonic measurements in transmission systems. In Proceedings of the 2016 17th International Conference on Harmonics and Quality of Power (ICHQP), Belo Horizonte, Brazil, 16–19 October 2016; pp. 152–157. [Google Scholar] [CrossRef]
  22. IEC 61869-1. Instrument transformers–Part 1: General Requirements; International Electrotechnical Commission: Geneva, Switzerland, 2007. [Google Scholar]
  23. IEC 61869-3. Instrument transformers–Part 3: Additional Requirements for Inductive Voltage Transformers; International Electrotechnical Commission: Geneva, Switzerland, 2011. [Google Scholar]
  24. Kaczmarek, M.; Stano, E. Nonlinearity of Magnetic Core in Evaluation of Current and Phase Errors of Transformation of Higher Harmonics of Distorted Current by Inductive Current Transformers. IEEE Access 2020, 8, 118885–118898. [Google Scholar] [CrossRef]
  25. Stano, E.; Kaczmarek, M. Wideband self-calibration method of inductive cts and verification of determined values of current and phase errors at harmonics for transformation of distorted current. Sensors 2020, 20, 2167. [Google Scholar] [CrossRef] [Green Version]
  26. Brodecki, D.; Stano, E.; Andrychowicz, M.; Kaczmarek, P. Emc of wideband power sources. Energies 2021, 14, 1457. [Google Scholar] [CrossRef]
  27. Kaczmarek, M.L.; Stano, E. Application of the inductive high current testing transformer for supplying of the measuring circuit with distorted current. IET Electr. Power Appl. 2019, 13, 1310–1317. [Google Scholar] [CrossRef]
  28. IEC 61869-11. Instrument transformers–Part 11: Additional Requirements for Low Power Passive Voltage Transformers; International Electrotechnical Commission: Geneva, Switzerland, 2017. [Google Scholar]
  29. Kaczmarek, M. Development and application of the differential voltage to single-ended voltage converter to determine the composite error of voltage transformers and dividers for transformation of sinusoidal and distorted voltages. Meas. J. Int. Meas. Confed. 2017, 101, 53–61. [Google Scholar] [CrossRef]
  30. Kaczmarek, M. The effect of distorted input voltage harmonics rms values on the frequency characteristics of ratio error and phase displacement of a wideband voltage divider. Electr. Power Syst. Res. 2019, 167, 1–8. [Google Scholar] [CrossRef]
  31. Kaczmarek, M.; Szatilo, T. Reference voltage divider designed to operate with oscilloscope to enable determination of ratio error and phase displacement frequency characteristics of MV voltage transformers. Meas. J. Int. Meas. Confed. 2015, 68, 22–31. [Google Scholar] [CrossRef]
  32. Lesniewska, E.; Kaczmarek, M.; Stano, E. 3D Electromagnetic Field Analysis Applied to Evaluate the Accuracy of a Voltage Transformer under Distorted Voltage. Energies 2021, 14, 136. [Google Scholar] [CrossRef]
Figure 1. The laboratory setup: (a) diagram, (b) photo.
Energies 14 07047 g001
Figure 2. Comparison of the transformation accuracy of the 20 kV VT for harmonics of the non-sinusoidal and sinusoidal primary voltage: (a) voltage error, (b) phase displacement.
Energies 14 07047 g002
Figure 3. Comparison of the transformation accuracy of the 15 kV VT for harmonics of the non-sinusoidal and sinusoidal primary voltage: (a) voltage error, (b) phase displacement.
Energies 14 07047 g003aEnergies 14 07047 g003b
Figure 4. Comparison of the transformation accuracy of the (20/√3) kV VT for harmonics of the non-sinusoidal and sinusoidal primary voltage: (a) voltage error, (b) phase displacement.
Energies 14 07047 g004aEnergies 14 07047 g004b
Figure 5. Comparison of the transformation accuracy up to 500 Hz of the (20/√3) kV VT for harmonics of the non-sinusoidal and sinusoidal primary voltage: (a) voltage error, (b) phase displacement.
Energies 14 07047 g005aEnergies 14 07047 g005b
Figure 6. Comparison of the transformation accuracy of the (15/√3) kV VT for harmonics of the non-sinusoidal and sinusoidal primary voltage: (a) voltage error, (b) phase displacement.
Energies 14 07047 g006
Figure 7. Comparison of the transformation accuracy of the (20/√3) kV VT when its secondary winding is loaded with 1 µF capacitance: (a) voltage error, (b) phase displacement.
Energies 14 07047 g007
Figure 8. Comparison of the transformation accuracy of the (15/√3) kV VT when its secondary winding is loaded with 1 µF capacitance: (a) voltage error, (b) phase displacement.
Energies 14 07047 g008
Figure 9. Comparison of the transformation accuracy of harmonics determined between two units of the (15/√3) kV inductive VTs: (a) voltage error, (b) phase displacement.
Energies 14 07047 g009
Figure 10. Application of sinusoidal voltage of frequency from 20 Hz to 20 kHz to determine the resonance frequency(ies) of all tested VTs: (a) voltage error, (b) phase displacement.
Energies 14 07047 g010
Publisher’s Note: MDPI stays neutral with regard to jurisdictional claims in published maps and institutional affiliations.

