
Review of Renewable Energy Potentials in Indonesia and Their Contribution to a 100% Renewable Electricity System


Abstract
1. Introduction
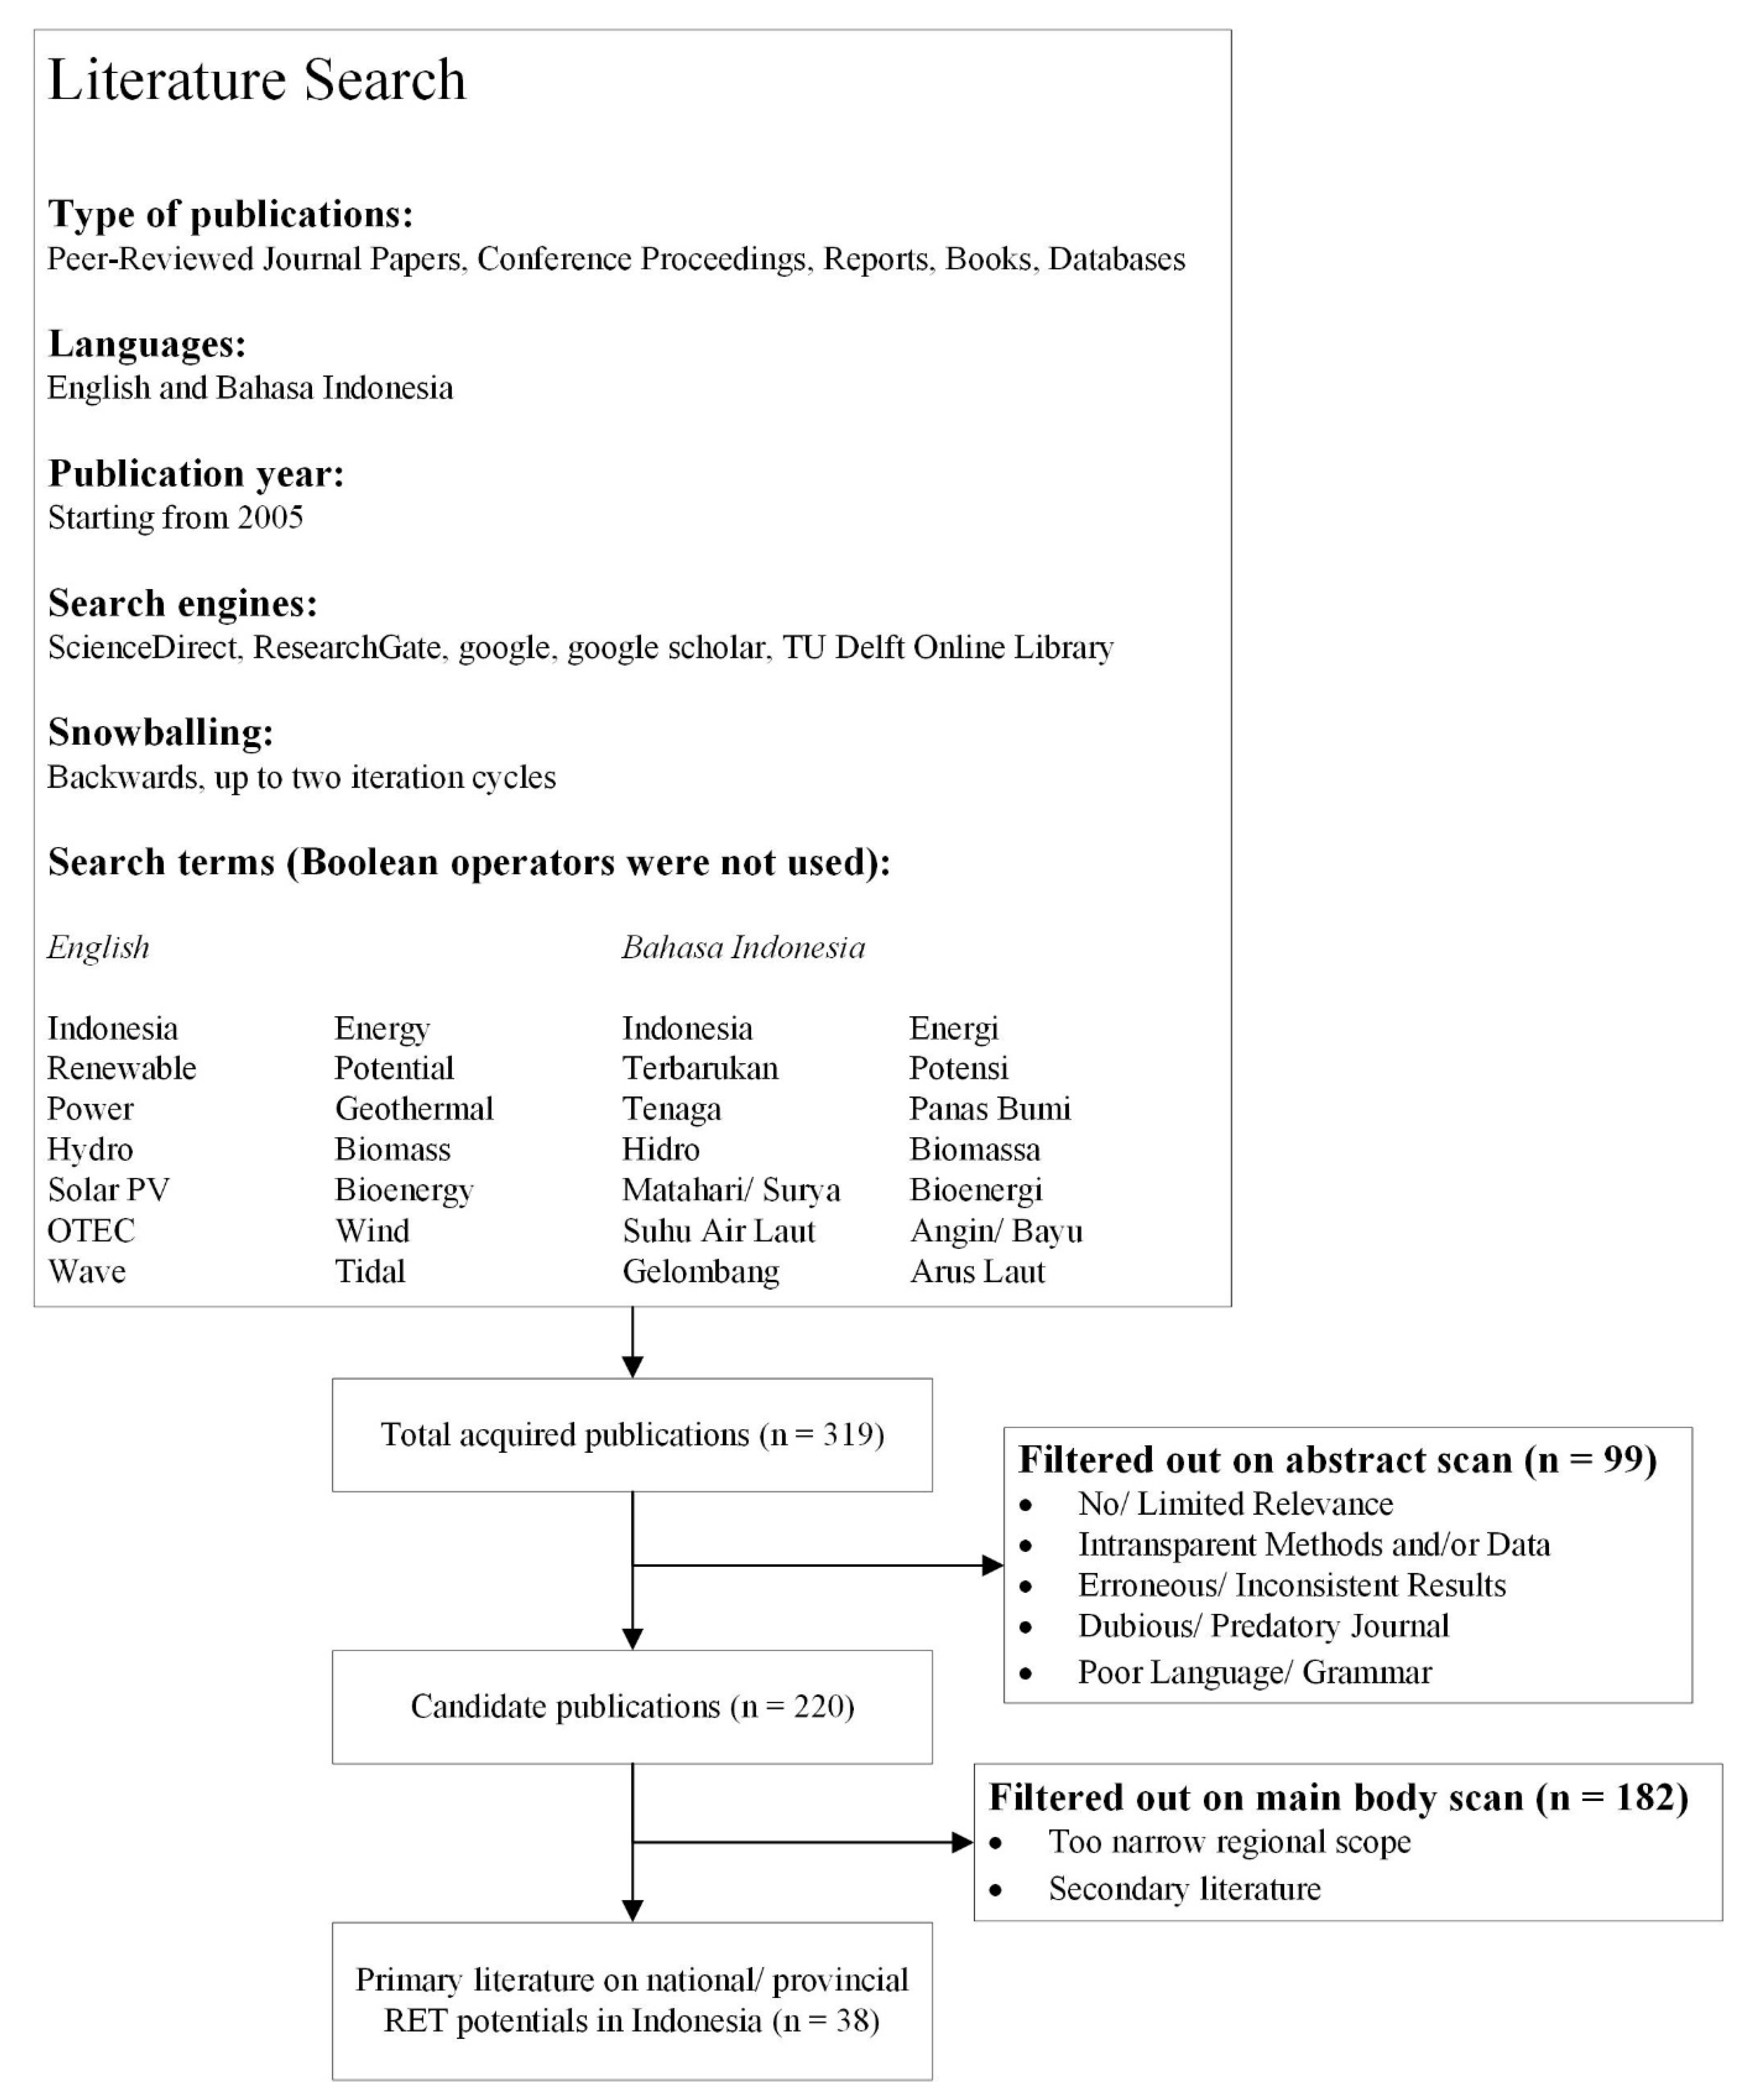
2. Materials and Methods
3. Results
3.1. RET in Indonesia and Development Plans
3.2. Geothermal
3.3. Hydropower
3.3.1. Large Hydropower
3.3.2. Small Hydropower
3.4. Biomass
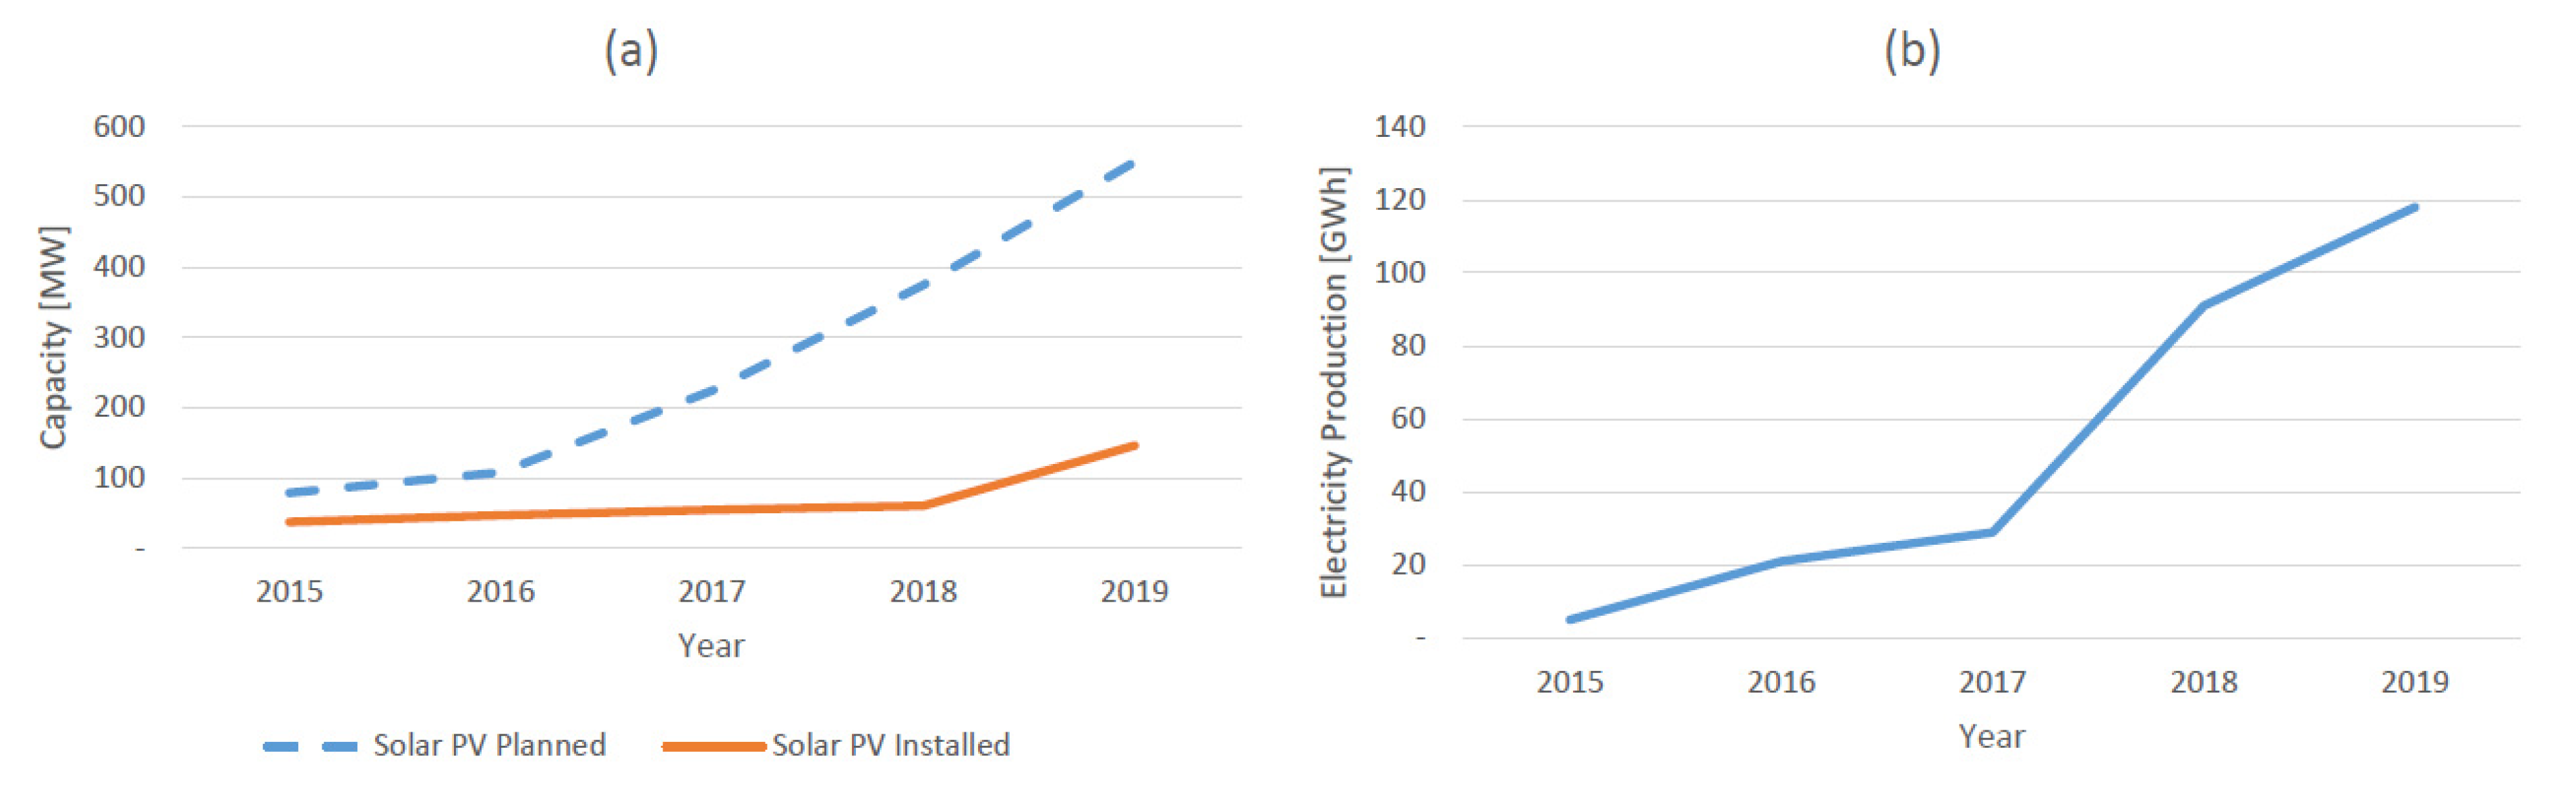
3.5. Solar PV
3.6. Wind Power
3.7. Ocean Energy
3.7.1. OTEC
3.7.2. Tidal Power
3.7.3. Wave Energy Conversion
3.8. Potential Overview and 100% RET Scenario
4. Discussion
4.1. Limitations
4.2. Knowledge Gaps
5. Conclusions
6. Recommendations
- 1.
- Assessment of RET Potentials Beyond the Technical Level
- 2.
- Aggregation and Spatial Mapping of Potentials of Several RET
- 3.
- Utilisation of Simulation and Forecast Models for an Initial Potential Estimation
- 4.
- Re-shape provincial and national targets for RET implementation until 2050
Author Contributions
Funding
Institutional Review Board Statement
Informed Consent Statement
Data Availability Statement
Acknowledgments
Conflicts of Interest
Abbreviations
| Abbreviation | Meaning |
| ASELI | Asosiasi Energi Laut Indonesia (Indonesian Ocean Energy Association) |
| EEZ | Exclusive Economic Zones |
| ESDM | Kementerian Energi dan Sumber Daya Mineral (Ministery of Energy and Mineral Resources) |
| IESR | Institute for Essential Services Reform |
| LCOE | Levelized Cost of Electricity |
| OTEC | Ocean Thermal Energy Conversion |
| PLN | Perusahaan Listrik Negara (State Electricity Company) |
| PV | Photovoltaic |
| RUEN | Rencana Umum Energi Nasional (National Energy Plan) |
References
- Hawksworth, J.; Audino, H.; Clarry, R. The Long View: How Will the Global Economic Order Change by 2050? Price Waterhouse and Coopers: London, UK, 2017; pp. 1–72. [Google Scholar]
- ESDM. Handbook of Energy & Economic Statistics of Indonesia 2019; ESDM: Jakarta, Indonesia, 2020. [Google Scholar]
- ESDM. 2010 Handbook of Energy & Economic Statistics of Indonesia; ESDM: Jakarta, Indonesia, 2010. [Google Scholar]
- International Energy Agency. World Energy Balances 2020; International Energy Agency: Paris, France, 2020. [Google Scholar]
- Presiden Republik Indonesia. Rencana Umum Energi Nasional; Presiden Republik Indonesia: Jakarta, Indonesia, 2017. [Google Scholar]
- Burke, P.J.; Widnyana, J.; Anjum, Z.; Aisbett, E.; Resosudarmo, B.; Baldwin, K.G.H. Overcoming barriers to solar and wind energy adoption in two Asian giants: India and Indonesia. Energy Policy 2019, 132, 1216–1228. [Google Scholar] [CrossRef]
- Kennedy, S.F. Indonesia’s energy transition and its contradictions: Emerging geographies of energy and finance. Energy Res. Soc. Sci. 2018, 41, 230–237. [Google Scholar] [CrossRef]
- Setyowati, A.B. Mitigating energy poverty: Mobilizing climate finance to manage the energy trilemma in Indonesia. Sustainability 2020, 12, 1603. [Google Scholar] [CrossRef]
- Maulidia, M.; Dargusch, P.; Ashworth, P.; Ardiansyah, F. Rethinking renewable energy targets and electricity sector reform in Indonesia: A private sector perspective. Renew. Sustain. Energy Rev. 2019, 101, 231–247. [Google Scholar] [CrossRef]
- Chaurey, A.; Ranganathan, M.; Mohanty, P. Electricity access for geographically disadvantaged rural communities-technology and policy insights. Energy Policy 2004, 32, 1693–1705. [Google Scholar] [CrossRef]
- Dóci, G.; Vasileiadou, E. “Let’s do it ourselves” Individual motivations for investing in renewables at community level. Renew. Sustain. Energy Rev. 2015, 49, 41–50. [Google Scholar] [CrossRef]
- Deng, Y.Y.; Haigh, M.; Pouwels, W.; Ramaekers, L.; Brandsma, R.; Schimschar, S.; Grözinger, J.; de Jager, D. Quantifying a realistic, worldwide wind and solar electricity supply. Glob. Environ. Chang. 2015, 31, 239–252. [Google Scholar] [CrossRef]
- Handayani, K.; Krozer, Y.; Filatova, T. From fossil fuels to renewables: An analysis of long-term scenarios considering technological learning. Energy Policy 2019, 127, 134–146. [Google Scholar] [CrossRef]
- Purwanto, W.W.; Pratama, Y.W.; Nugroho, Y.S.; Warjito; Hertono, G.F.; Hartono, D.; Deendarlianto; Tezuka, T. Multi-objective optimization model for sustainable Indonesian electricity system: Analysis of economic, environment, and adequacy of energy sources. Renew. Energy 2015, 81, 308–318. [Google Scholar] [CrossRef]
- Blok, K.; Nieuwlaar, E. Introduction to Energy Analysis, 3rd ed.; Taylor and Francis: Abingdon, UK, 2021. [Google Scholar]
- Prabowo, H. Atlas Potensi Energi Laut. Maj. Miner. Energi 2012, 10, 65–71. [Google Scholar]
- Hoogwijk, M.; de Vries, B.; Turkenburg, W. Assessment of the global and regional geographical, technical and economic potential of onshore wind energy. Energy Econ. 2004, 26, 889–919. [Google Scholar] [CrossRef]
- Directorate General of Renewable Energy and Energy Conservation (EBTKE). Rencana Strategis 2020–2024; EBTKE: Jakarta, Indonesia, 2020. [Google Scholar]
- Dewan Energi Nasional. Indonesia Energy Outlook 2019; Dewan Energi Nasional: Jakarta, Indonesia, 2019. [Google Scholar]
- Langer, J.; Quist, J.; Blok, K. Upscaling scenarios for ocean thermal energy conversion with technological learning in Indo-nesia and their global relevance. Renew. Sustain. Energy Rev. 2021. submitted. [Google Scholar]
- Institute for Essential Services Reform. Levelized Cost of Electricity in Indonesia; Institute for Essential Services Reform: Jakarta, Indonesia, 2019. [Google Scholar]
- Nasruddin, M.; Alhamid, M.I.; Daud, Y.; Surachman, A.; Sugiyono, A.; Aditya, H.B.; Mahlia, T.M.I. Potential of geothermal energy for electricity generation in Indonesia: A review. Renew. Sustain. Energy Rev. 2016, 53, 733–740. [Google Scholar] [CrossRef]
- Setiawan, H. Geothermal Energy Development in Indonesia: Progress, Challenges and Prospect. Int. J. Adv. Sci. Eng. Inf. Technol. 2014, 4, 224. [Google Scholar] [CrossRef]
- Richter, A. Global Geothermal Capacity Reaches 14,900 MW—New Top 10 Ranking of Geothermal Countries, 2019. ThinkGeoEnergy. Available online: https://www.thinkgeoenergy.com/global-geothermal-capacity-reaches-14900-mw-new-top10-ranking/ (accessed on 9 November 2020).
- Fauzi, A. Geothermal resources and reserves in Indonesia: An updated revision. Geotherm. Energy Sci. 2015, 3, 1–6. [Google Scholar] [CrossRef]
- Pambudi, N.A. Geothermal power generation in Indonesia, a country within the ring of fire: Current status, future development and policy. Renew. Sustain. Energy Rev. 2018, 81, 2893–2901. [Google Scholar] [CrossRef]
- Suharmanto, P.; Fitria, A.N.; Ghaliyah, S. Indonesian Geothermal Energy Potential as Source of Alternative Energy Power Plant. KnE Energy 2015, 1, 119. [Google Scholar] [CrossRef]
- Royal Dutch Shell Global Energy Resources Database. Available online: https://www.shell.com/energy-and-innovation/the-energy-future/scenarios/shell-scenarios-energy-models/energy-resource-database.html#iframe=L3dlYmFwcHMvRW5lcmd5UmVzb3VyY2VEYXRhYmFzZS8 (accessed on 2 December 2020).
- Price Waterhouse and Coopers (PwC) Indonesia. Power in Indonesia; Price Waterhouse and Coopers: Jakarta, Indonesia, 2018. [Google Scholar]
- Breeze, P. Hydropower; Academic Press: Cambridge, MA, USA, 2018; pp. 53–62. ISBN 9780128129067. [Google Scholar]
- Hoes, O.A.C.; Meijer, L.J.J.; Van Der Ent, R.J.; Van De Giesen, N.C. Systematic high-resolution assessment of global hydropower potential. PLoS ONE 2017, 12, e171844. [Google Scholar] [CrossRef]
- Directorate General of Renewable Energy and Energy Conservation (EBTKE). Renstra (Rencana Strategis) Ditjen EBTKE 2015–2019; EBTKE: Jakarta, Indonesia, 2016. [Google Scholar]
- Directorate General of Renewable Energy and Energy Conservation (EBTKE). Statistik EBTKE 2016; EBTKE: Jakarta, Indonesia, 2016. [Google Scholar]
- Persero (PLN). Electric Power Supply Business Plan (2019–2028); PLN: Jakarta, Indonesia, 2019. [Google Scholar]
- Koei, N. Project for the Master Plan Study of Hydropower Development in Indonesia; Japan International Cooperation Agency Nippon Koei Co., Ltd.: Tokyo, Japan, 2011. [Google Scholar]
- Amin, A.Z.; Gielen, D.; Saygin, D.; Rigter, J. Renewable Energy Prospects: Indonesia, a REmap Analysis; IRENA: Abu Dhabi, UAE, 2017. [Google Scholar]
- Pontoiyo, F.; Sulaiman, M.; Budiarto, R.; Novitasari, D. Sustainability Potential for Renewable Energy System in Isolated Area that Supports Nantu Boliyohuto Wildlife Reserve. IOP Conf. Ser. Earth Environ. Sci. 2020, 520, 012026. [Google Scholar] [CrossRef]
- Ratnata, I.W.; Surya, S.W.; Somantri, M. Analisis Potensi Pembangkit Energi Listrik Tenaga Air Di Saluran Air Sekitar Universitas Pendidikan Indonesia. In Proceedings of the FPTK Expo—UPI., Bandung, Indonesia, 13–14 November 2013; pp. 254–261. [Google Scholar]
- Subekti, R.A. Survey Potensi Pembangkit Listrik Tenaga Mikro Hidro di Kuta Malaka Kabupaten Aceh Besar Propinsi Nanggroe Aceh Darussalam. J. Mechatron. Electr. Power Veh. Technol. 2010, 1, 5–12. [Google Scholar] [CrossRef]
- Sulaeman; Jaya, R.A. Perencanaan pembangunan sistem pembangkit listrik tenaga mikro hidro (pltmh) di kinali pasaman barat. J. Tek. Mesin 2014, 4, 90–96. [Google Scholar]
- Darmawi; Sipahutar, R.; Bernas, S.M.; Imanuddin, M.S. Renewable energy and hydropower utilization tendency worldwide. Renew. Sustain. Energy Rev. 2013, 17, 213–215. [Google Scholar] [CrossRef]
- Anugrah, P.; Setiawan, A.A.; Budiarto, R. Sihana Evaluating Micro Hydro Power Generation System under Climate Change Scenario in Bayang Catchment, Kabupaten Pesisir Selatan, West Sumatra. Energy Procedia 2015, 65, 257–263. [Google Scholar] [CrossRef]
- Blum, N.U.; Sryantoro Wakeling, R.; Schmidt, T.S. Rural electrification through village grids—Assessing the cost competitiveness of isolated renewable energy technologies in Indonesia. Renew. Sustain. Energy Rev. 2013, 22, 482–496. [Google Scholar] [CrossRef]
- Suntana, A.S.; Vogt, K.A.; Turnblom, E.C.; Upadhye, R. Bio-methanol potential in Indonesia: Forest biomass as a source of bio-energy that reduces carbon emissions. Appl. Energy 2009, 86, S215–S221. [Google Scholar] [CrossRef]
- Simangunsong, B.C.H.; Sitanggang, V.J.; Manurung, E.G.T.; Rahmadi, A.; Moore, G.A.; Aye, L.; Tambunan, A.H. Potential forest biomass resource as feedstock for bioenergy and its economic value in Indonesia. For. Policy Econ. 2017, 81, 10–17. [Google Scholar] [CrossRef]
- Khalil, M.; Berawi, M.A.; Heryanto, R.; Rizalie, A. Waste to energy technology: The potential of sustainable biogas production from animal waste in Indonesia. Renew. Sustain. Energy Rev. 2019, 105, 323–331. [Google Scholar] [CrossRef]
- Jaung, W.; Wiraguna, E.; Okarda, B.; Artati, Y.; Goh, C.S.; Syahru, R.; Leksono, B.; Prasetyo, L.B.; Lee, S.M.; Baral, H. Spatial assessment of degraded lands for biofuel production in Indonesia. Sustainability 2018, 10, 4595. [Google Scholar] [CrossRef]
- Sharma, R.; Wahono, J.; Baral, H. Bamboo as an alternative bioenergy crop and powerful ally for land restoration in Indonesia. Sustainability 2018, 10, 4367. [Google Scholar] [CrossRef]
- De Jong, W.; Van Ommen, J.R. (Eds.) Biomass as a Sustainable Energy Source for the Future: Fundamentals of Conversion Processes; Wiley: Hoboken, NJ, USA, 2014; ISBN 9781118304914. [Google Scholar]
- Nijsen, M.; Smeets, E.; Stehfest, E.; van Vuuren, D.P. An evaluation of the global potential of bioenergy production on degraded lands. GCB Bioenergy 2012, 4, 130–147. [Google Scholar] [CrossRef]
- Anshar, M.; Ani, F.N.; Kader, A.S.; Mechanics, F.; Centre, M.T. The Energy Potential of Municipal Solid Waste for Power Generation in Indonesia. J. Mek. 2014, 37, 42–54. [Google Scholar]
- Obidzinski, K.; Andriani, R.; Komarudin, H.; Andrianto, A. Environmental and social impacts of oil palm plantations and their implications for biofuel production in Indonesia. Ecol. Soc. 2012, 17. [Google Scholar] [CrossRef]
- Milbrandt, A.; Overend, R.P. Assessment of Biomass Resources from Marginal Lands in APEC Economies; National Renewable Energy Lab. (NREL): Golden, CO, USA, 2009; p. 52. [Google Scholar]
- Pirard, R.; Bär, S.; Dermawan, A. Challenges and opportunities of bioenergy development in Indonesia. In Proceedings of the A synthesis of the workshop co-organized by Ministry of National Development Planning/Bappenas and CIFOR, Jakarta, Indonesia, 31 May 2016. [Google Scholar]
- International Energy Agency. World Energy Outlook 2017; International Energy Agency: Paris, France, 2017. [Google Scholar]
- ESDM. Successful Co-firing at PLTU Ropa and PLTU Bolok. Available online: https://www.esdm.go.id/en/media-center/news-archives/terus-didorong-ini-hasil-uji-coba-co-firing-di-pltu-ropa-dan-pltu-bolok- (accessed on 1 December 2020).
- Miller, B. Fuel Considerations and Burner Design for Ultra-Supercritical Power Plants; Woodhead Publishing Limited: Cambridge, UK, 2013; ISBN 9780857091161. [Google Scholar]
- P3TKEBTKE. Peta Potensi Energi Surya Indonesia. Available online: https://twitter.com/p3tkebtke/status/857400607522422784?lang=sk (accessed on 5 February 2021).
- Statista. Cumulative solar photovoltaic capacity in Germany from 2013 to 2019. Available online: https://www.statista.com/statistics/497448/connected-and-cumulated-photovoltaic-capacity-in-germany/ (accessed on 22 March 2021).
- World Bank Group. Solar Resource and Photovoltaic Power Potential of Indonesia; World Bank Group: Washington, DC, USA, 2017. [Google Scholar]
- Statistik, B.P. Statistik Indonesia 2020; Badan Pusat Statistik: Jakarta, Indonesia, 2020. [Google Scholar]
- Institute for Essential Services Reform. Beyond 207 Gigawatts: Unleashing Indonesia’s Solar Potential; Institute for Essential Services Reform: Jakarta, Indonesia, 2021. [Google Scholar]
- Veldhuis, A.J.; Reinders, A.H.M.E. Reviewing the potential and cost-effectiveness of grid-connected solar PV in Indonesia on a provincial level. Renew. Sustain. Energy Rev. 2013, 27, 315–324. [Google Scholar] [CrossRef]
- Veldhuis, A.J.; Reinders, A.H.M.E. Reviewing the potential and cost-effectiveness of off-grid PV systems in Indonesia on a provincial level. Renew. Sustain. Energy Rev. 2015, 52, 757–769. [Google Scholar] [CrossRef]
- Kunaifi, K.; Veldhuis, A.J.; Reinders, A.H.M.E. The Electricity Grid in Indonesia: The Experiences of End-Users and Their Attitudes toward Solar Photovoltaics; Springer: Berlin, Germany, 2020; ISBN 9783030383411. [Google Scholar]
- Sunarso, A.; Ibrahim-Bathis, K.; Murti, S.A.; Budiarto, I.; Ruiz, H.S. GIS-Based Assessment of the Technical and Economic Feasibility of Utility-Scale Solar PV Plants: Case Study in West Kalimantan Province. Sustainability 2020, 12, 6283. [Google Scholar] [CrossRef]
- Ruiz Rondan, H.S.; Sunarso, A.; Ibrahim-Bathis, K.; Murti, S.A.; Budiarto, I. GIS-AHP Multi-Decision-Criteria-Analysis for the optimal location of solar energy plants at Indonesia. Energy Rep. 2020, 6, 3249–3263. [Google Scholar] [CrossRef]
- Syanalia, A.; Winata, F. Decarbonizing Energy in Bali With Solar Photovoltaic: GIS-Based Evaluation on Grid-Connected System. Indones. J. Energy 2018, 1, 5–20. [Google Scholar] [CrossRef]
- Sah, B.P.; Wijayatunga, P. Geographic Information System-Based Decision Support System for Renewable Energy Development an Indonesian Case Study; Asian Development Bank: Manila, Philippines, 2017. [Google Scholar]
- Sambodo, M.T.; Novandra, R. The state of energy poverty in Indonesia and its impact on welfare. Energy Policy 2019, 132, 113–121. [Google Scholar] [CrossRef]
- P3TKEBTKE. Peta Potensi Energi Angin Indonesia. Available online: https://twitter.com/P3TKEBTKE/status/857401162617634816/photo/1 (accessed on 5 February 2021).
- Bosch, J.; Staffell, I.; Hawkes, A.D. Temporally explicit and spatially resolved global offshore wind energy potentials. Energy 2018, 163, 766–781. [Google Scholar] [CrossRef]
- Pratama, O. Konservasi Perairan Sebagai Upaya Menjaga Potensi Kelautan dan Perikanan Indonesia. Available online: https://kkp.go.id/djprl/artikel/21045-konservasi-perairan-sebagai-upaya-menjaga-potensi-kelautan-dan-perikanan-indonesia (accessed on 22 March 2021).
- Gernaat, D.E.H.J.; Van Vuuren, D.P.; Van Vliet, J.; Sullivan, P.; Arent, D.J. Global long-term cost dynamics of offshore wind electricity generation. Energy 2014, 76, 663–672. [Google Scholar] [CrossRef]
- Fios, F. Mapping the potential of green energy to border societies of Indonesia and Timor Leste (a preliminary study). MATEC Web Conf. 2018, 197, 1–4. [Google Scholar] [CrossRef][Green Version]
- Putro, W.S.; Prahmana, R.A.; Yudistira, H.T.; Darmawan, M.Y.; Triyono, D.; Birastri, W. Estimation Wind Energy Potential Using Artificial Neural Network Model in West Lampung Area. IOP Conf. Ser. Earth Environ. Sci. 2019, 258, 012006. [Google Scholar] [CrossRef]
- Sari, D.P.; Kusumaningrum, W.B. A technical review of building integrated wind turbine system and a sample simulation model in central java, Indonesia. Energy Procedia 2014, 47, 29–36. [Google Scholar] [CrossRef][Green Version]
- Kamal, S. Studi Potensi Energi Angin Daerah Pantai Purworejo Untuk Mendorong Penyediaan Listrik menggunakan Sumer Energi Terbarukan Yang Ramah Lingkungan. J. Mns. Lingkung. 2007, 14, 26–34. [Google Scholar]
- Soeprino, M.; Ibrochim, M. Analisa Potensi Energi Angin dan Estimasi Energi Output Turbin Angin di Lebak Banten. J. Teknol. Dirgantara 2009, 7, 51–59. [Google Scholar]
- Bachtiar, A.; Hayyatul, W. Analisis Potensi Pembangkit Listrik Tenaga Angin PT. Lentera Angin Nusantara (LAN) Ciheras. J. Tek. Elektro ITP 2018, 7, 34–45. [Google Scholar] [CrossRef]
- Quirapas, M.A.J.R.; Lin, H.; Abundo, M.L.S.; Brahim, S.; Santos, D. Ocean renewable energy in Southeast Asia: A review. Renew. Sustain. Energy Rev. 2015, 41, 799–817. [Google Scholar] [CrossRef]
- Aprilia, E.; Aini, A.; Frakusya, A.; Safril, A. Potensi Panas Laut Sebagai Energi Baru Terbarukan Di Perairan Papua Barat Dengan Metode Ocean Thermal Energy Conversion (Otec). J. Meteorol. Klimatologi Geofis. 2019, 6, 7–14. [Google Scholar] [CrossRef][Green Version]
- Anggraini, D.; Ihsan Al Hafiz, M.; Fathin Derian, A.; Alfi, Y. Quantitative Analysis of Indonesian Ocean Wave Energy Potential Using Oscillating Water Column Energy Converter. MATTER Int. J. Sci. Technol. 2015, 1, 228–239. [Google Scholar] [CrossRef]
- Vega, L.A. Economics of Ocean Thermal Energy Conversion (OTEC): An Update. In Proceedings of the Offshore Technology Conference, Houston, TX, USA, 16–19 August 2010; pp. 3–6. [Google Scholar] [CrossRef]
- IRENA. Ocean Thermal Energy Conversion: Technology Brief; IRENA: Abu Dhabi, UAE, 2014. [Google Scholar]
- Bluerise Offshore OTEC. Feasibility Study of a 10 MW Installation; Bluerise Offshore OTEC: Delft, The Netherlands, 2014; p. 63. [Google Scholar]
- Langer, J.; Cahyaningwidi, A.A.; Chalkiadakis, C.; Quist, J.; Hoes, O.; Blok, K. Plant siting and economic potential of ocean thermal energy conversion in Indonesia a novel GIS-based methodology. Energy 2021, 224, 120121. [Google Scholar] [CrossRef]
- Langer, J.; Quist, J.; Blok, K. Harnessing the economic potential of ocean thermal energy conversion in upscaling scenarios: Methodological progress illustrated for Indonesia. In Proceedings of the 20th European Roundtable on Sustainable Consumption and Production, Graz, Austria, 8–10 September 2021. [Google Scholar]
- Asian Development Bank. Wave Energy Conversion and Ocean Thermal Energy Conversion Potential in Developing Member Countries; Asian Development Bank: Manila, Philippines, 2014; ISBN 978-92-9254-530-7. [Google Scholar]
- Langer, J.; Cahyaningwidi, A.A.; Chalkiadakis, C.; Quist, J.; Hoes, O.A.C.; Blok, K. Practical Sites for OTEC Deployment in Indonesia; 4TU.ResearchData: Delft, The Netherlands, 2021. [Google Scholar]
- IRENA. Renewable Energy Prospects: Indonesia; IRENA: Abu Dhabi, UAE, 2017. [Google Scholar]
- Rachmayani, R.; Atma, G.; Suprijo, T.; Sari, N. Marine Current Potential Energy for Environmental Friendly Electricity Generation in Bali, Lombok and Makassar Straits. In Proceedings of the Environmental Technology Management Conference, Zurich, Switzerland, 29–30 July 2006. [Google Scholar]
- Ajiwibowo, H.; Lodiwa, K.S.; Pratama, M.B.; Wurjanto, A. Field measurement and numerical modeling of tidal current in larantuka strait for renewable energy utilization. Int. J. Geomate 2017, 13, 124–131. [Google Scholar] [CrossRef]
- Ribal, A.; Amir, A.K.; Toaha, S.; Kusuma, J.; Khaeruddin, K. Tidal current energy resource assessment around Buton Island, Southeast Sulawesi, Indonesia. Int. J. Renew. Energy Res. 2017, 7, 857–865. [Google Scholar]
- Orhan, K.; Mayerle, R. Assessment of the tidal stream power potential and impacts of tidal current turbines in the Strait of Larantuka, Indonesia. Energy Procedia 2017, 125, 230–239. [Google Scholar] [CrossRef]
- Orhan, K.; Mayerle, R.; Narayanan, R.; Pandoe, W. Investigation of the Energy Potential From Tidal Stream Currents in Indonesia. Coast. Eng. Proc. 2017, 10. [Google Scholar] [CrossRef]
- Yuningsih, A. Potensi Arus Laut Untuk Pembangkit Energi Baru Terbarukan Di Selat Pantar, Nusa Tenggara Timur. Maj. Miner. Energi 2011, 9, 61–72. [Google Scholar]
- Blunden, L.S.; Bahaj, A.S.; Aziz, N.S. Tidal current power for Indonesia? An initial resource estimation for the Alas Strait. Renew. Energy 2013, 49, 137–142. [Google Scholar] [CrossRef]
- Orhan, K.; Mayerle, R.; Pandoe, W.W. Assesment of Energy Production Potential from Tidal Stream Currents in Indonesia. Energy Procedia 2015, 76, 7–16. [Google Scholar] [CrossRef]
- Babarit, A. A database of capture width ratio of wave energy converters. Renew. Energy 2015, 80, 610–628. [Google Scholar] [CrossRef]
- Ribal, A.; Babanin, A.V.; Zieger, S.; Liu, Q. A high-resolution wave energy resource assessment of Indonesia. Renew. Energy 2020, 160, 1349–1363. [Google Scholar] [CrossRef]
- Cornett, A.M. A Global Wave Energy Resource Assessment. In Proceedings of the Proceedings of the 18th International Offshore and Polar Engineering Conference, Vancover, BC, Canada, 6–11 July 2008. [Google Scholar]
- Mørk, G.; Barstow, S.; Kabuth, A.; Pontes, M.T. Assessing the global wave energy potential. Proc. Int. Conf. Offshore Mech. Arct. Eng.-OMAE 2010, 3, 447–454. [Google Scholar] [CrossRef]
- Safitri, L.E.; Jumarang, M.I.; Apriansyah, A. Studi Potensi Energi Listrik Tenaga Gelombang Laut Sistem Oscillating Water Column (OWC) di Perairan Pesisir Kalimantan Barat. Positron 2016, 6, 8–16. [Google Scholar] [CrossRef]
- Zikra, M. Preliminary Assessment of Wave Energy Potential around Indonesia Sea. Appl. Mech. Mater. 2017, 862, 55–60. [Google Scholar] [CrossRef]
- Rizal, A.M.; Ningsih, N.S. Ocean wave energy potential along the west coast of the Sumatra island, Indonesia. J. Ocean Eng. Mar. Energy 2020, 6, 137–154. [Google Scholar] [CrossRef]
- Wijaya, I.W.A. Teknologi Oscilating Water Column Di Perairan Bali. Teknol. Elektro 2010, 9, 165–174. [Google Scholar]
- Sugianto, D.N.; Purwanto, P.; Handoyo, G.; Prasetyawan, I.B.; Hariyadi, H.; Alifdini, I. Identification of wave energy potential in Sungai Suci Beach Bengkulu Indonesia. ARPN J. Eng. Appl. Sci. 2017, 12, 4877–4886. [Google Scholar]
- Alifdini, I.; Iskandar, N.A.P.; Nugraha, A.W.; Sugianto, D.N.; Wirasatriya, A.; Widodo, A.B. Analysis of ocean waves in 3 sites potential areas for renewable energy development in Indonesia. Ocean Eng. 2018, 165, 34–42. [Google Scholar] [CrossRef]
- Simaremare, A.A.; Bruce, A.; Macgill, I. Least Cost High Renewable Energy Penetration Scenarios in the Java Bali Grid Least Cost High Renewable Energy Penetration Scenarios in the Java Bali Grid System. In Proceedings of the Asia Pacific Solar Research Conference, Melbourne, Australia, 5–7 December 2017. [Google Scholar]
- Günther, M. Challenges of a 100% renewable energy supply in the Java-Bali grid. Int. J. Technol. 2018, 9, 257–266. [Google Scholar] [CrossRef]
- Günther, M.; Eichinger, M. Cost optimization for the 100% renewable electricity scenario for the Java-Bali grid. Int. J. Renew. Energy Dev. 2018, 7, 269–276. [Google Scholar] [CrossRef]
- IESR; Agora Energiewende; LUT University. Deep Decarbonization of Indonesia’s Energy System Deep Decarbonization of Indonesia’s Energy System: A Pathway to Zero Emissions; IESR: Jakarta Selatan, Indonesia, 2021. [Google Scholar]
- Hasan, M.H.; Mahlia, T.M.I.; Nur, H. A review on energy scenario and sustainable energy in Indonesia. Renew. Sustain. Energy Rev. 2012, 16, 2316–2328. [Google Scholar] [CrossRef]
- Kumar, S. Assessment of renewables for energy security and carbon mitigation in Southeast Asia: The case of Indonesia and Thailand. Appl. Energy 2016, 163, 63–70. [Google Scholar] [CrossRef]
- Purba, N.P.; Kelvin, J.; Sandro, R.; Gibran, S.; Permata, R.A.I.; Maulida, F.; Martasuganda, M.K. Suitable Locations of Ocean Renewable Energy (ORE) in Indonesia Region-GIS Approached. Energy Procedia 2015, 65, 230–238. [Google Scholar] [CrossRef]
- Danish Energy Agency. Kalimantan Regional Energy Outlook; Danish Energy Agency: København, Denmark, 2019. [Google Scholar]
- Martosaputro, S.; Murti, N. Blowing the wind energy in Indonesia. Energy Procedia 2014, 47, 273–282. [Google Scholar] [CrossRef]
- Rumbayan, M.; Nagasaka, K. Assessment of Wind Energy Potential in Indonesia Using Weibull Distribution Function. Int. J. Electr. Power Eng. 2011, 5, 229–235. [Google Scholar] [CrossRef]
- Simanjuntak, J.S. Techno-Economic and Institutional Assessment of Wind Energy in Indonesia; Delft University of Technology: Delft, The Netherlands, 2021. [Google Scholar]
- Straatman, P.J.T.; van Sark, W.G.J.H.M. A new hybrid ocean thermal energy conversion-Offshore solar pond (OTEC-OSP) design: A cost optimization approach. Sol. Energy 2008, 82, 520–527. [Google Scholar] [CrossRef]
- Malik, M.Z.; Musharavati, F.; Khanmohammadi, S.; Baseri, M.M.; Ahmadi, P.; Nguyen, D.D. Ocean thermal energy conversion (OTEC) system boosted with solar energy and TEG based on exergy and exergo-environment analysis and multi-objective optimization. Sol. Energy 2020, 208, 559–572. [Google Scholar] [CrossRef]
- Reuters. Indonesian State Utility to Retire Coal Plants Gradually. Available online: https://www.reuters.com/article/indonesia-coal-idUSL3N2NE3FM (accessed on 7 July 2021).


| Academic and Industrial Literature [15,16,17] (Terminology Used in This Study) | Reports by ESDM [18] | |
|---|---|---|
| Theoretical Potential | Potential restricted by physical limits (e.g., Carnot efficiency for thermal power plants, Betz limit for wind turbines, etc.) | Potential based on field data via a modelling system |
| Technical Potential | Potential restricted by technical limits (e.g., geo- and oceanographic restrictions, electrical and mechanical efficiencies, etc.) | Identified potential that can be implemented at a certain location |
| Practical Potential | Potential restricted by non-technical limits (e.g., protection zones and tourist areas) | Identified potential that can be implemented at a certain location based on long-term data |
| Acceptable Potential | - | Potential that considers demand, infrastructure, and communal approval |
| Economic Potential | Potential with unit costs equal to or lower than benchmark (e.g., wholesale electricity price) | Potential that can be actually utilised |
| Technology | Levelized Cost of Electricity [US¢/kWh] |
|---|---|
| Open-Cycle Gas Turbine | 9.2–12.94 |
| Combined-Cycle Gas Turbine | 6.69–8.93 |
| Coal Mine Mouth | 5.01–7.31 |
| Coal Sub Critical | 6.11–8.41 |
| Coal Super Critical | 5.77–8.05 |
| Coal Ultra Super Critical | 5.83–8.38 |
| Onshore Wind | 7.39–16.1 |
| Utility Scale Solar | 5.84–10.28 |
| Geothermal | 4.56–8.7 |
| Biomass | 4.68–11.4 |
| Ocean Thermal Energy Converson (Commecial Large-scale plant after 30 years of modelled upscaling.) | 6.2–16.8 |
| Potential | ||||||
|---|---|---|---|---|---|---|
| Ref. | Type of Biomass | Origin of Biomass | Type of Potential | Original Unit(s) | Thermal Energy [PJth] | Capacity [GWe] |
| Solid Biomass | ||||||
| [32] | Primary & Secondary | Agriculture | Theoretical | 28.0 GWe | 1940 * | 28.0 |
| [45] | Primary & Secondary | Industrial forestry | Technical | 132.2 PJth | 132.2 | 1.9 * |
| [47] | Energy Crops | Degraded land | Theoretical | 1105 PJth | 1105 | 15.9 * |
| [50] | Energy Crops | Degraded land | Theoretical | 5000–7000 PJth | 5000–7000 | 71.9–100.7 * |
| [28] | Energy Crops, Primary & Secondary | Industrial forestry and agriculture | Practical | 1225 PJth | 1225 | 17.6 * |
| Biogas | ||||||
| [32] | Secondary | Manure | Theoretical | 535 MWe | 8.3 ** | 0.5 |
| [46] | Secondary | Livestock farming | Theoretical Technical | 9597.4 Mm3/year 1.7 × 10¹⁰ kWhe/year | 159.4 ** | 10.3 ** |
| Waste-to-Energy | ||||||
| [18] | Tertiary | Agriculture | Theoretical | 2.1 GWe | 145.7 * | 2.1 |
| [51] | Tertiary | Households, industry, etc. | Theoretical Technical | 2992 GWhth/year 1172 GWhe/year 343 MWe | 10.8 | 0.3 |
| Bio-Methanol | ||||||
| [44] | Primary & Secondary | Natural and industrial forestry | Technical | 40–169 × 109 L 42–176 Whe/year 10–42 GWe | 730–3040 *** | 10–42 |
| Region | BPS [61] | ESDM | Own Estimation | |
|---|---|---|---|---|
| Land Area (Excl. Forest, Water, and Conservation Area) [km2] | Tech. Potential [GWp] | Total Area Coverage for ESDM Potentials [%] | Tech. Potential with Land Area [GWp] | |
| Sumatera | 251,603 | 69 | 0.070 | 37,740 |
| Java | 96,312 | 32 | 0.032 | 14,447 |
| Bali, East & West Nusa Tenggara | 43,870 | 19 | 0.019 | 6581 |
| Kalimantan | 176,921 | 53 | 0.053 | 26,538 |
| Sulawesi | 53,422 | 23 | 0.023 | 8013 |
| Maluku & North Maluku | 14,547 | 5 | 0.005 | 2182 |
| Papua & West Papua | 20,991 | 8 | 0.008 | 3149 |
| Total | 657,666 | 208 | 0.21 | 98,650 |
| Ref. | Publication Type | Regional Scope | Potential | |||
|---|---|---|---|---|---|---|
| Theoretical | Technical | Practical | Economic | |||
| [62] | Report | National | - | 20,000 | 3400 | - |
| [28] | Database | National | - | - | 1300 | - |
| [63] | Journal Paper | On-Grid National | - | 1100 | 27 | 0.4 |
| [64] | Journal Paper | Off-Grid National | - | - | 0.8 | - |
| [65] | Journal Paper | National | - | 3200 (on-grid) 45,900 (off-grid) | 73.3 (on-grid) 0.4 (off-grid) | - |
| [66] | Journal Paper | West Kalimantan | - | 148 | - | - |
| [67] | Journal Paper | West Kalimantan | - | 2.0 | - | - |
| [68,69] | Report | Bali | - | 80 | - | - |
| Technology | National Potential [GWe] | Installed Capacity 2019 [GWe] | Planned until 2050 [GWe] | Demand Coverage in 2050 [%] (Pract. Potential) | |||||||||
|---|---|---|---|---|---|---|---|---|---|---|---|---|---|
| Theoretical | Technical | Practical | Economic | ||||||||||
| ESDM (Theo) | Rest | ESDM (Tech + Pract) | Rest | ESDM (Accep) | Rest | ESDM (Eco) | Rest | ||||||
| Hydro | Large | 75 | 241 | - | - | - | 26 | 15 | - | - | 5.6 | 38 | 3 |
| Small | 19 | - | - | 0.4 | 7 | ||||||||
| Biomass | Solid | 28 | 16–101 | - | 2 | - | 18 | - | - | 1.8 | 26 | 6 | |
| Waste | 2.1 | - | - | 0.3 | - | - | - | - | - | ||||
| Methanol | - | - | - | 10–42 | - | - | - | - | - | ||||
| Biogas | 0.5 | - | - | 10 | - | - | - | - | - | ||||
| Solar PV | 1360–3551 | - | 208–533 | 1100–19,835 | - | 28–3397 | - | 0.4 | 0.15 | 45 | 2–229 | ||
| Wind | 61–114 | - | 18–72 | 4668 | - | 1254–2976 | - | - | 0.15 | 28 | 193–406 | ||
| Ocean | OTEC | 288 | - | - | - | 102 | - | 6–41 | - | 6.1 | 40 | ||
| Tidal | - | 18–72 | - | - | - | - | - | - | |||||
| Wave | - | - | - | - | - | - | - | ||||||
| Resources | Reserves | ||||||||||||
| Speculative | Hypothetical | Possible | Probable | Proven | |||||||||
| Geothermal | ESDM | 6 GWth | 3 GWth | 10 GWth | 2 GWth | 3 GWth | 2.1 | 17.5 | - | ||||
| Rest | - | - | 42 GWe | 14 | |||||||||
| 100% RET System in 2050 (with Electricity Demand of 2,046,000 GWh [5,19]) | ||||||
|---|---|---|---|---|---|---|
| RET | Potential (Type) [GWe] | Potential Electricity Production [GWh/Year] | Share of Practical Potential [%] | Deployed Capacity [GWe] | Annual Electricity Production [GWh/Year] | Share of Electricity Generation [%] |
| Geothermal | 42 (pract) | 279,619 | 100% | 42 | 279,619 | 14% |
| Large Hydro | 38 (RUEN) | 143,138 | 100% | 38 | 143,138 | 7% |
| Small Hydro | 7 (RUEN) | 26,368 | 100% | 7 | 26,368 | 1% |
| Biomass | 18 (pract) | 115,324 | 100% | 18 | 115,324 | 6% |
| Solar PV | 3397 (pract) | 4,677,669 | 14% | 491 | 676,306 | 33% |
| Wind Energy | 2976 (pract) | 8,318,237 | 7% | 214 | 676,306 | 33% |
| OTEC | 102 (pract) | 339,045 | 16% | 16 | 128,940 | 6% |
| Total | 6580 | 13,899,400 | - | 826 | 2,046,000 | 100% |
Publisher’s Note: MDPI stays neutral with regard to jurisdictional claims in published maps and institutional affiliations. |
© 2021 by the authors. Licensee MDPI, Basel, Switzerland. This article is an open access article distributed under the terms and conditions of the Creative Commons Attribution (CC BY) license (https://creativecommons.org/licenses/by/4.0/).
Share and Cite
Langer, J.; Quist, J.; Blok, K. Review of Renewable Energy Potentials in Indonesia and Their Contribution to a 100% Renewable Electricity System. Energies 2021, 14, 7033. https://doi.org/10.3390/en14217033
Langer J, Quist J, Blok K. Review of Renewable Energy Potentials in Indonesia and Their Contribution to a 100% Renewable Electricity System. Energies. 2021; 14(21):7033. https://doi.org/10.3390/en14217033
Chicago/Turabian StyleLanger, Jannis, Jaco Quist, and Kornelis Blok. 2021. "Review of Renewable Energy Potentials in Indonesia and Their Contribution to a 100% Renewable Electricity System" Energies 14, no. 21: 7033. https://doi.org/10.3390/en14217033
APA StyleLanger, J., Quist, J., & Blok, K. (2021). Review of Renewable Energy Potentials in Indonesia and Their Contribution to a 100% Renewable Electricity System. Energies, 14(21), 7033. https://doi.org/10.3390/en14217033