
Comparison of Long-Term Bioenergy with Carbon Capture and Storage to Reference Power Generation Technologies Using CO2 Avoidance Cost in the U.S.

 , , , ,
  and
and
Abstract
1. Introduction
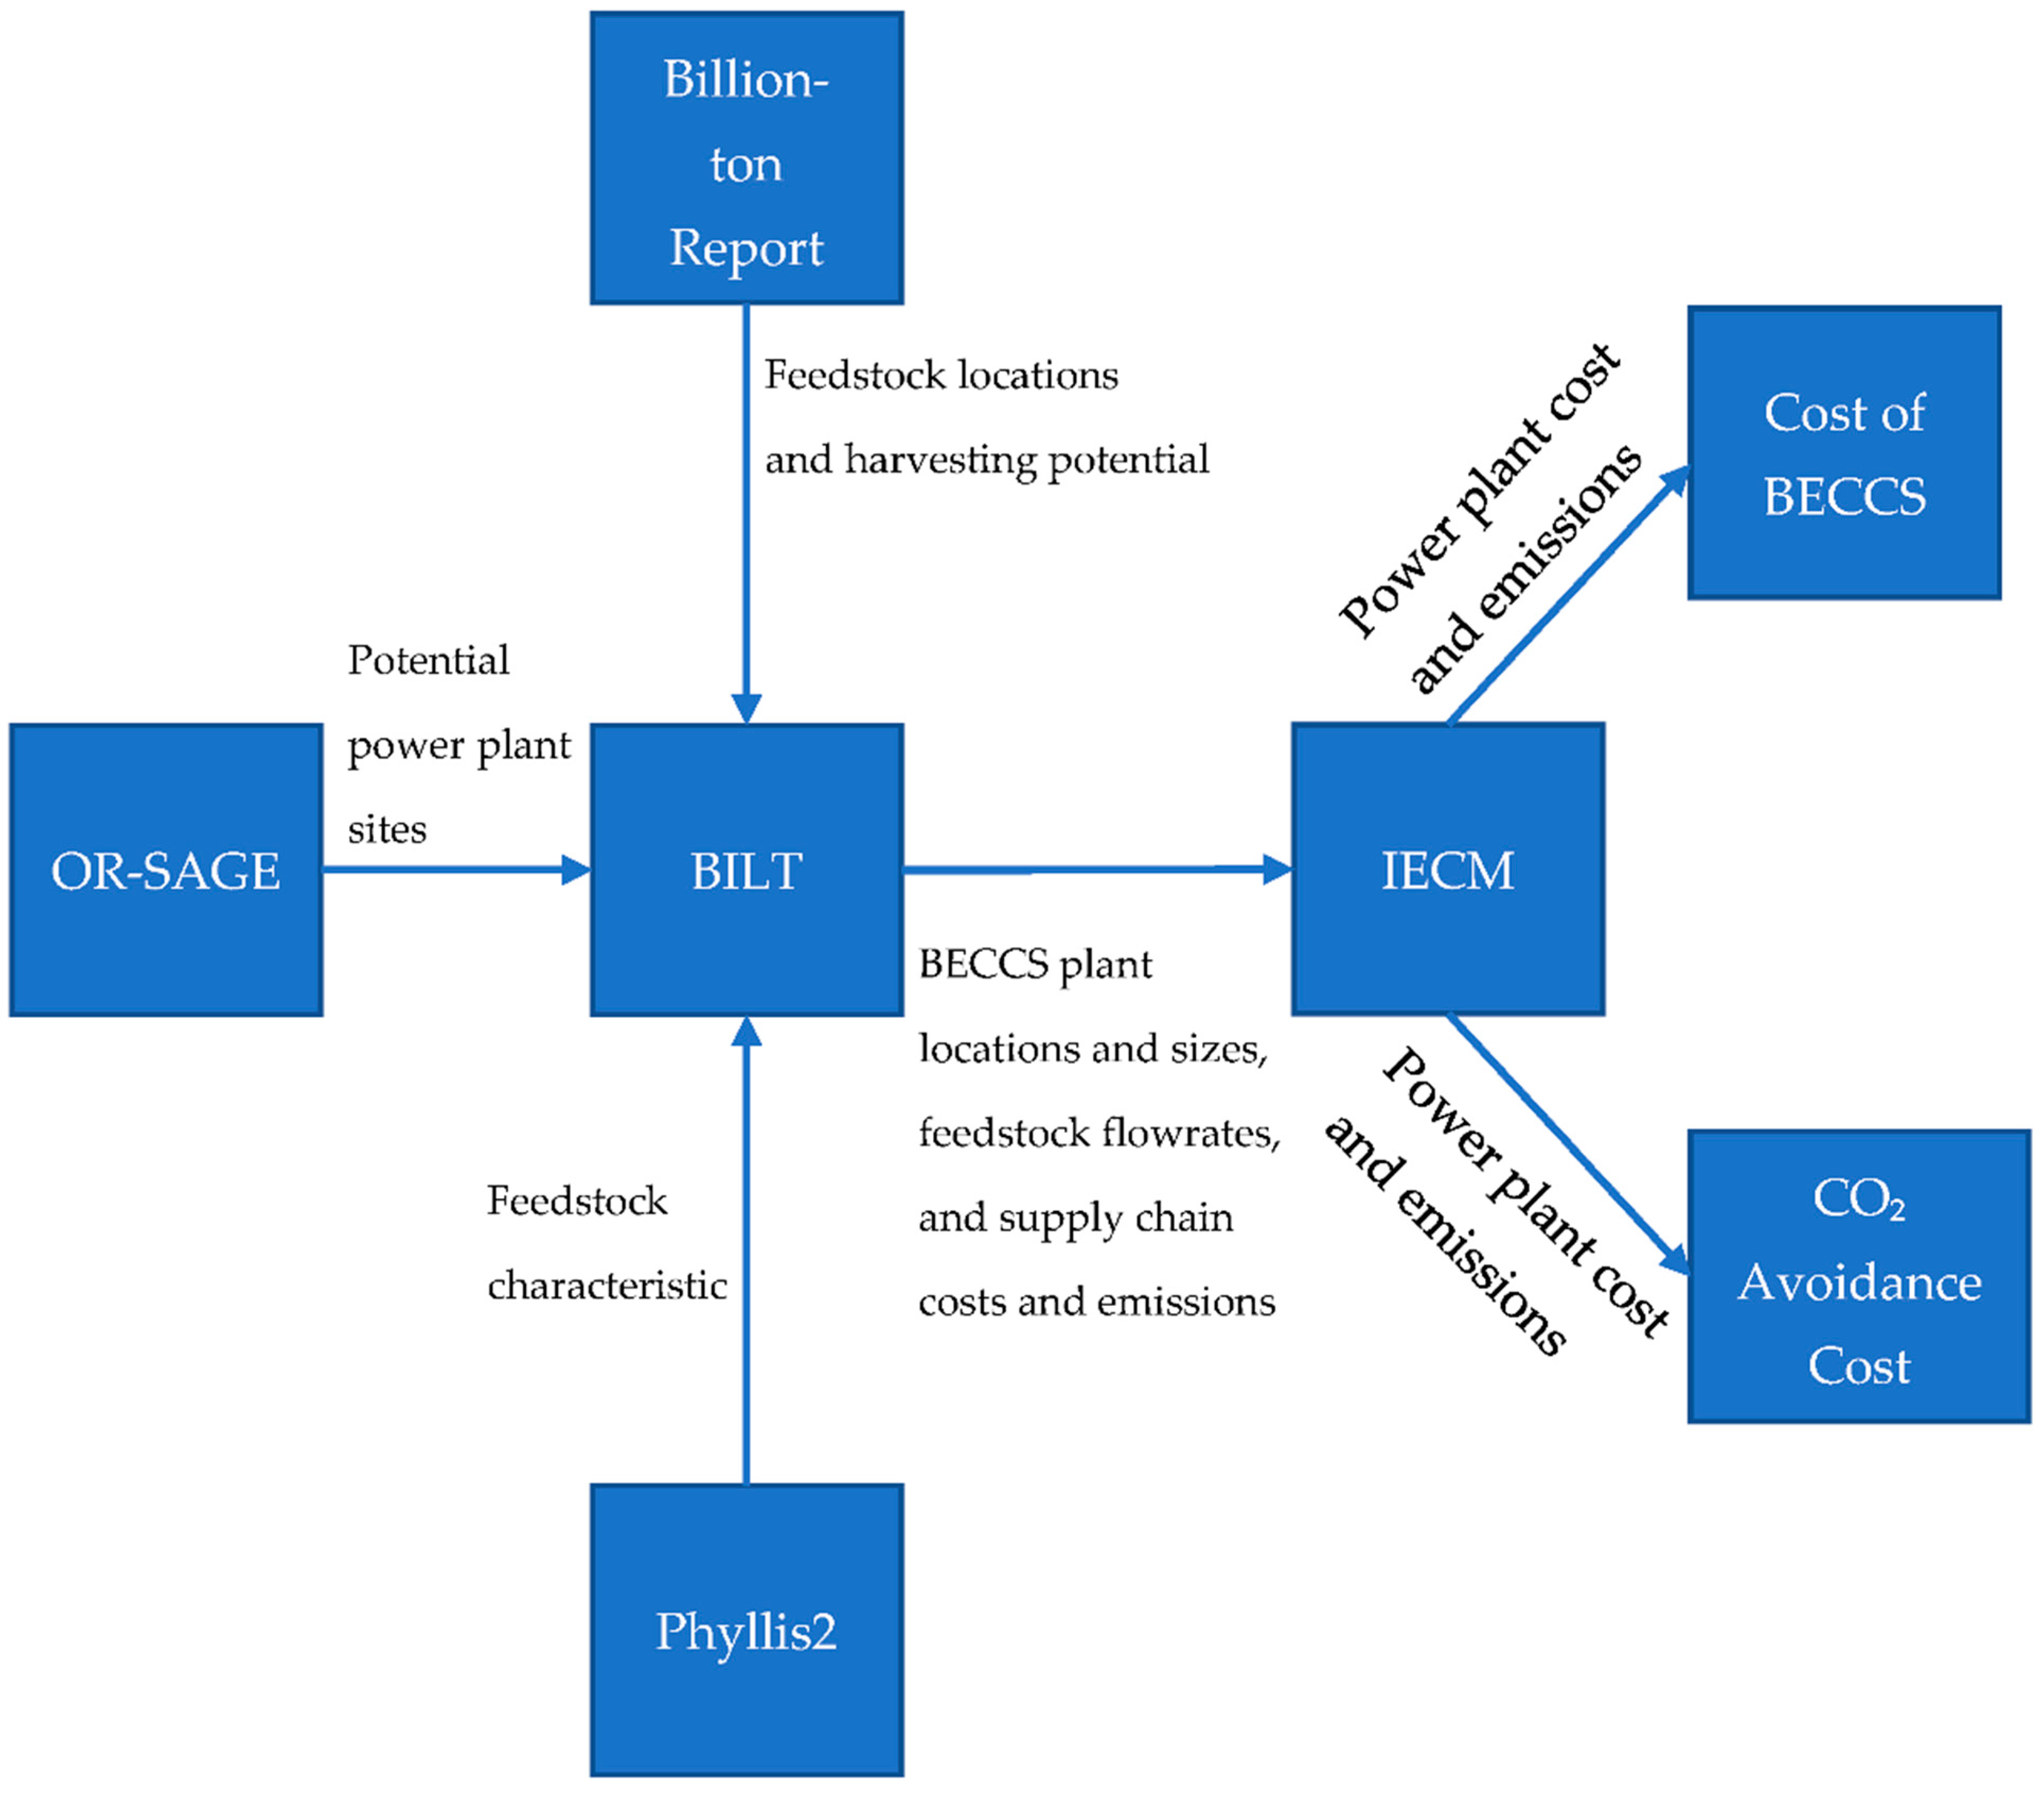
2. Materials and Methods
2.1. Power Plant Siting (OR-SAGE)
2.2. Feedstock Composition
2.3. Feedstock Costs and Supply Chain
2.4. Power Plant Modeling
2.5. BECCS Scenarios
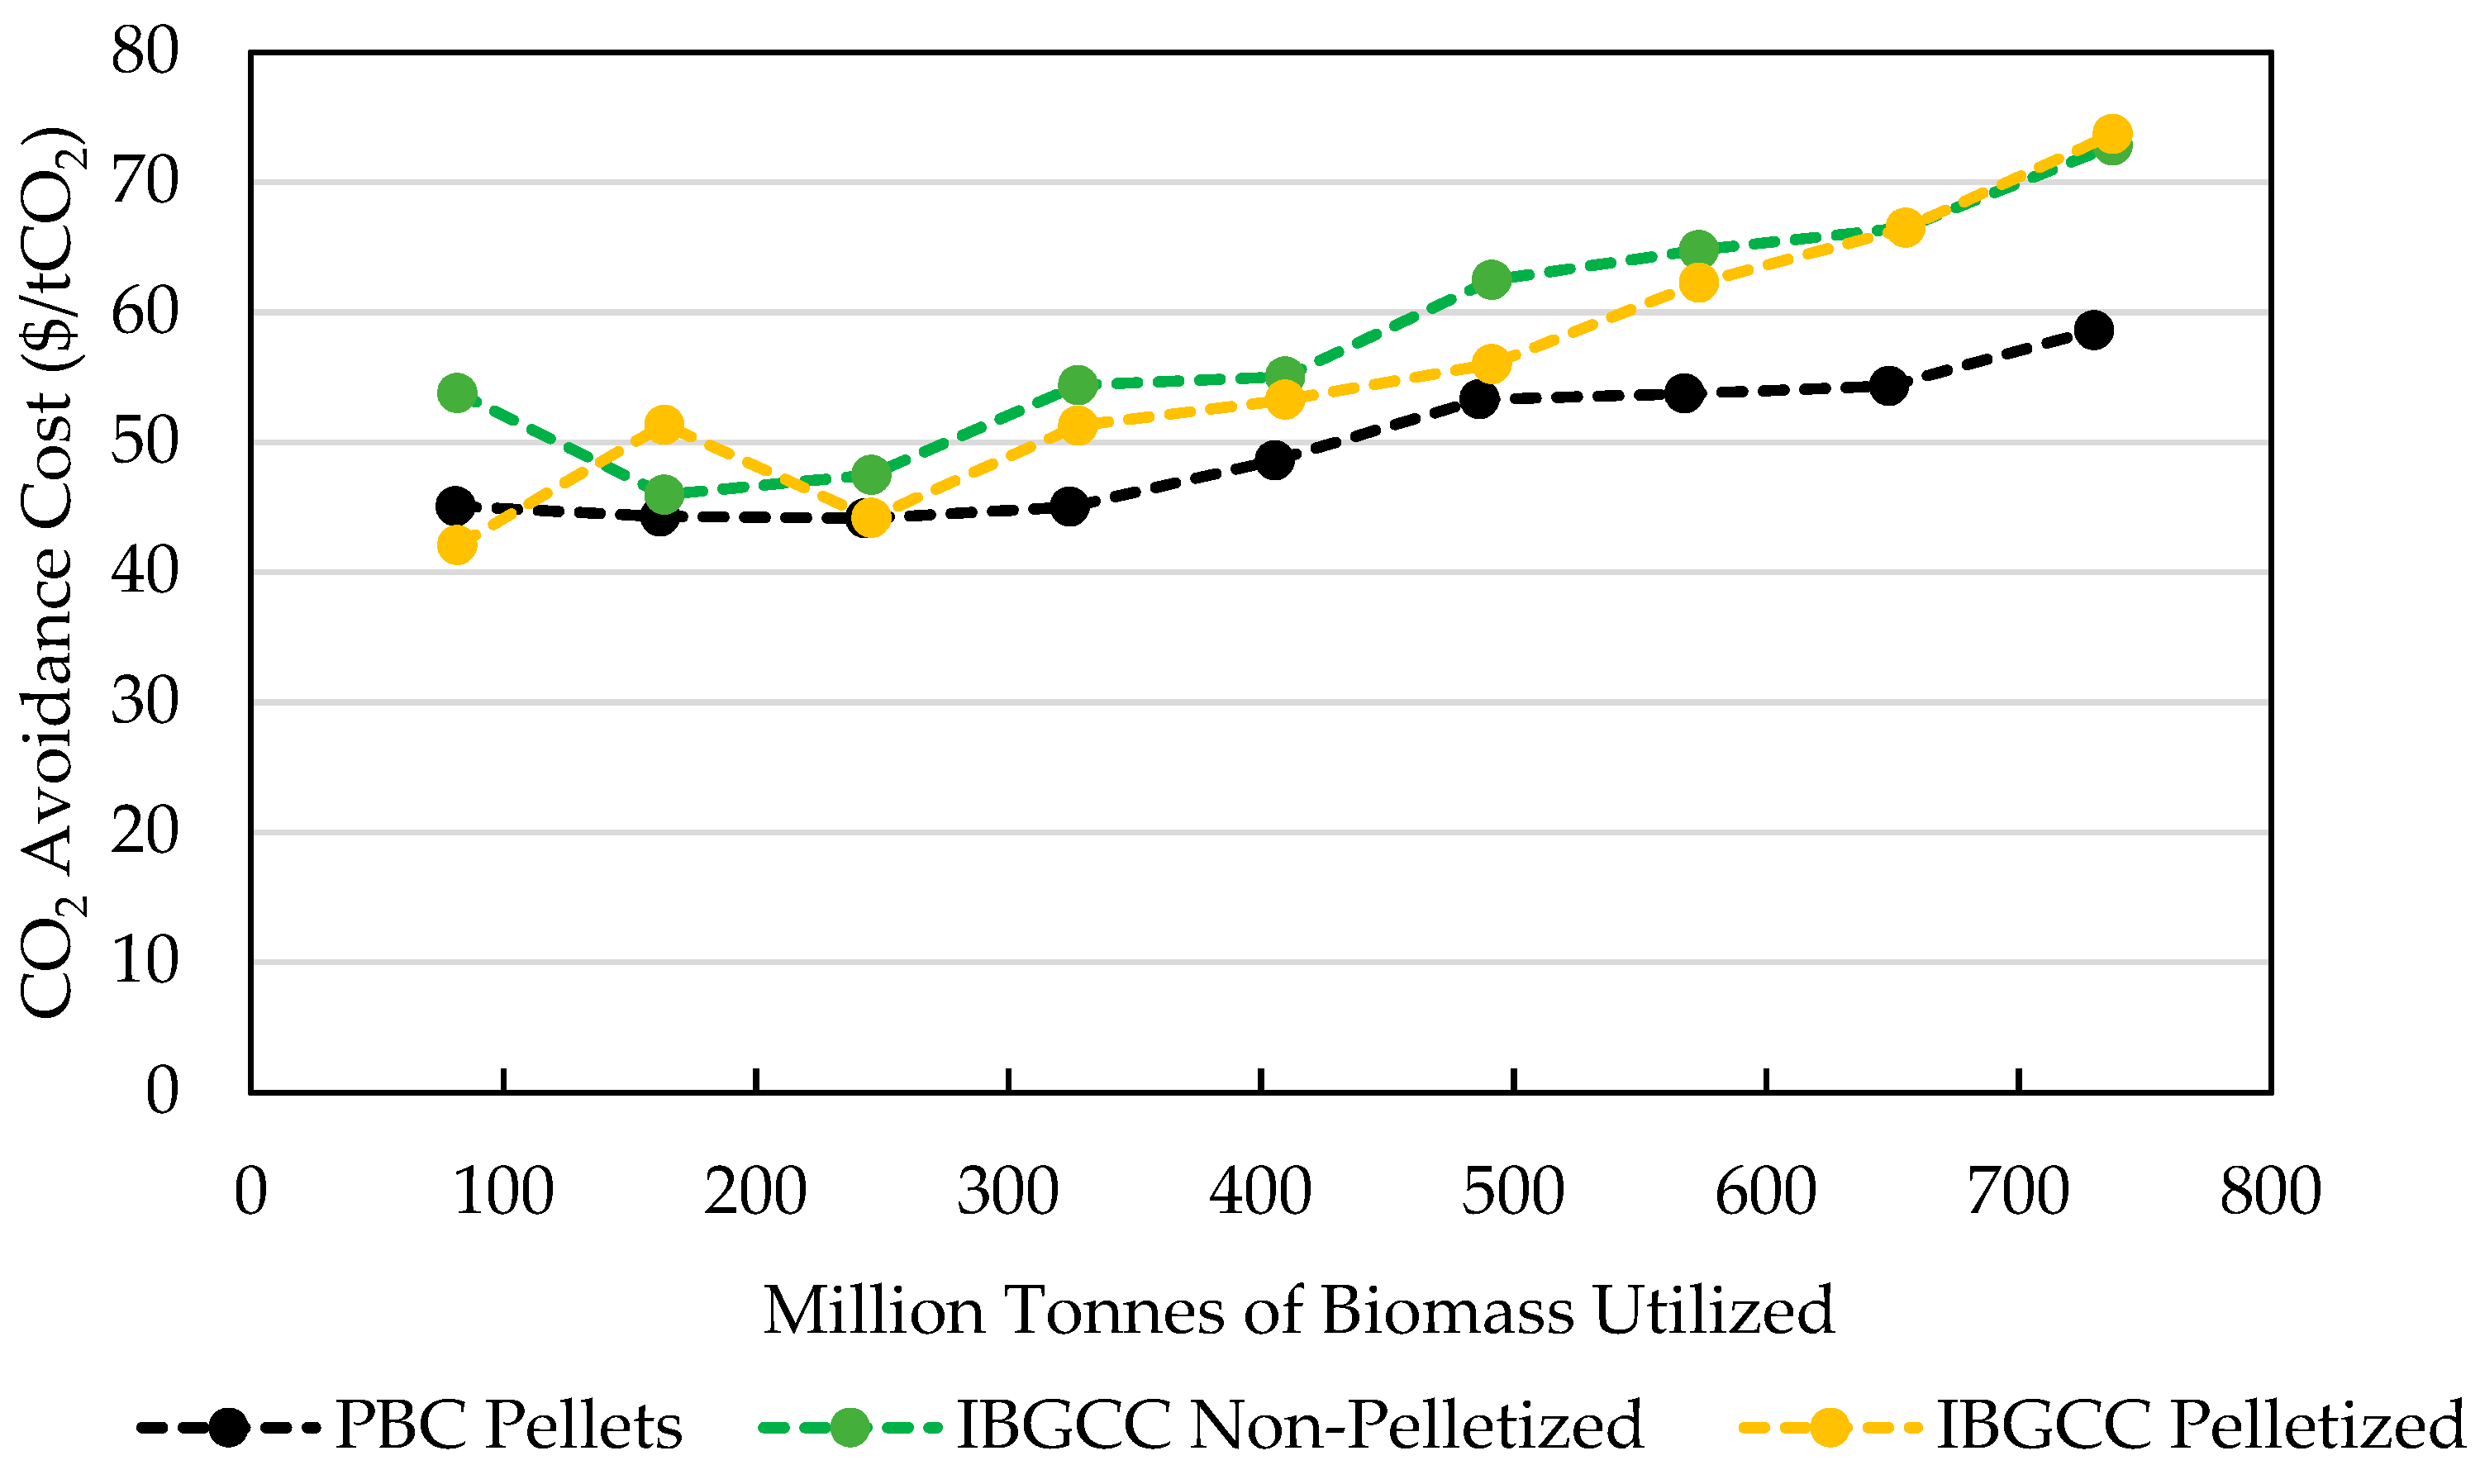
2.6. CO2 Avoidance Cost
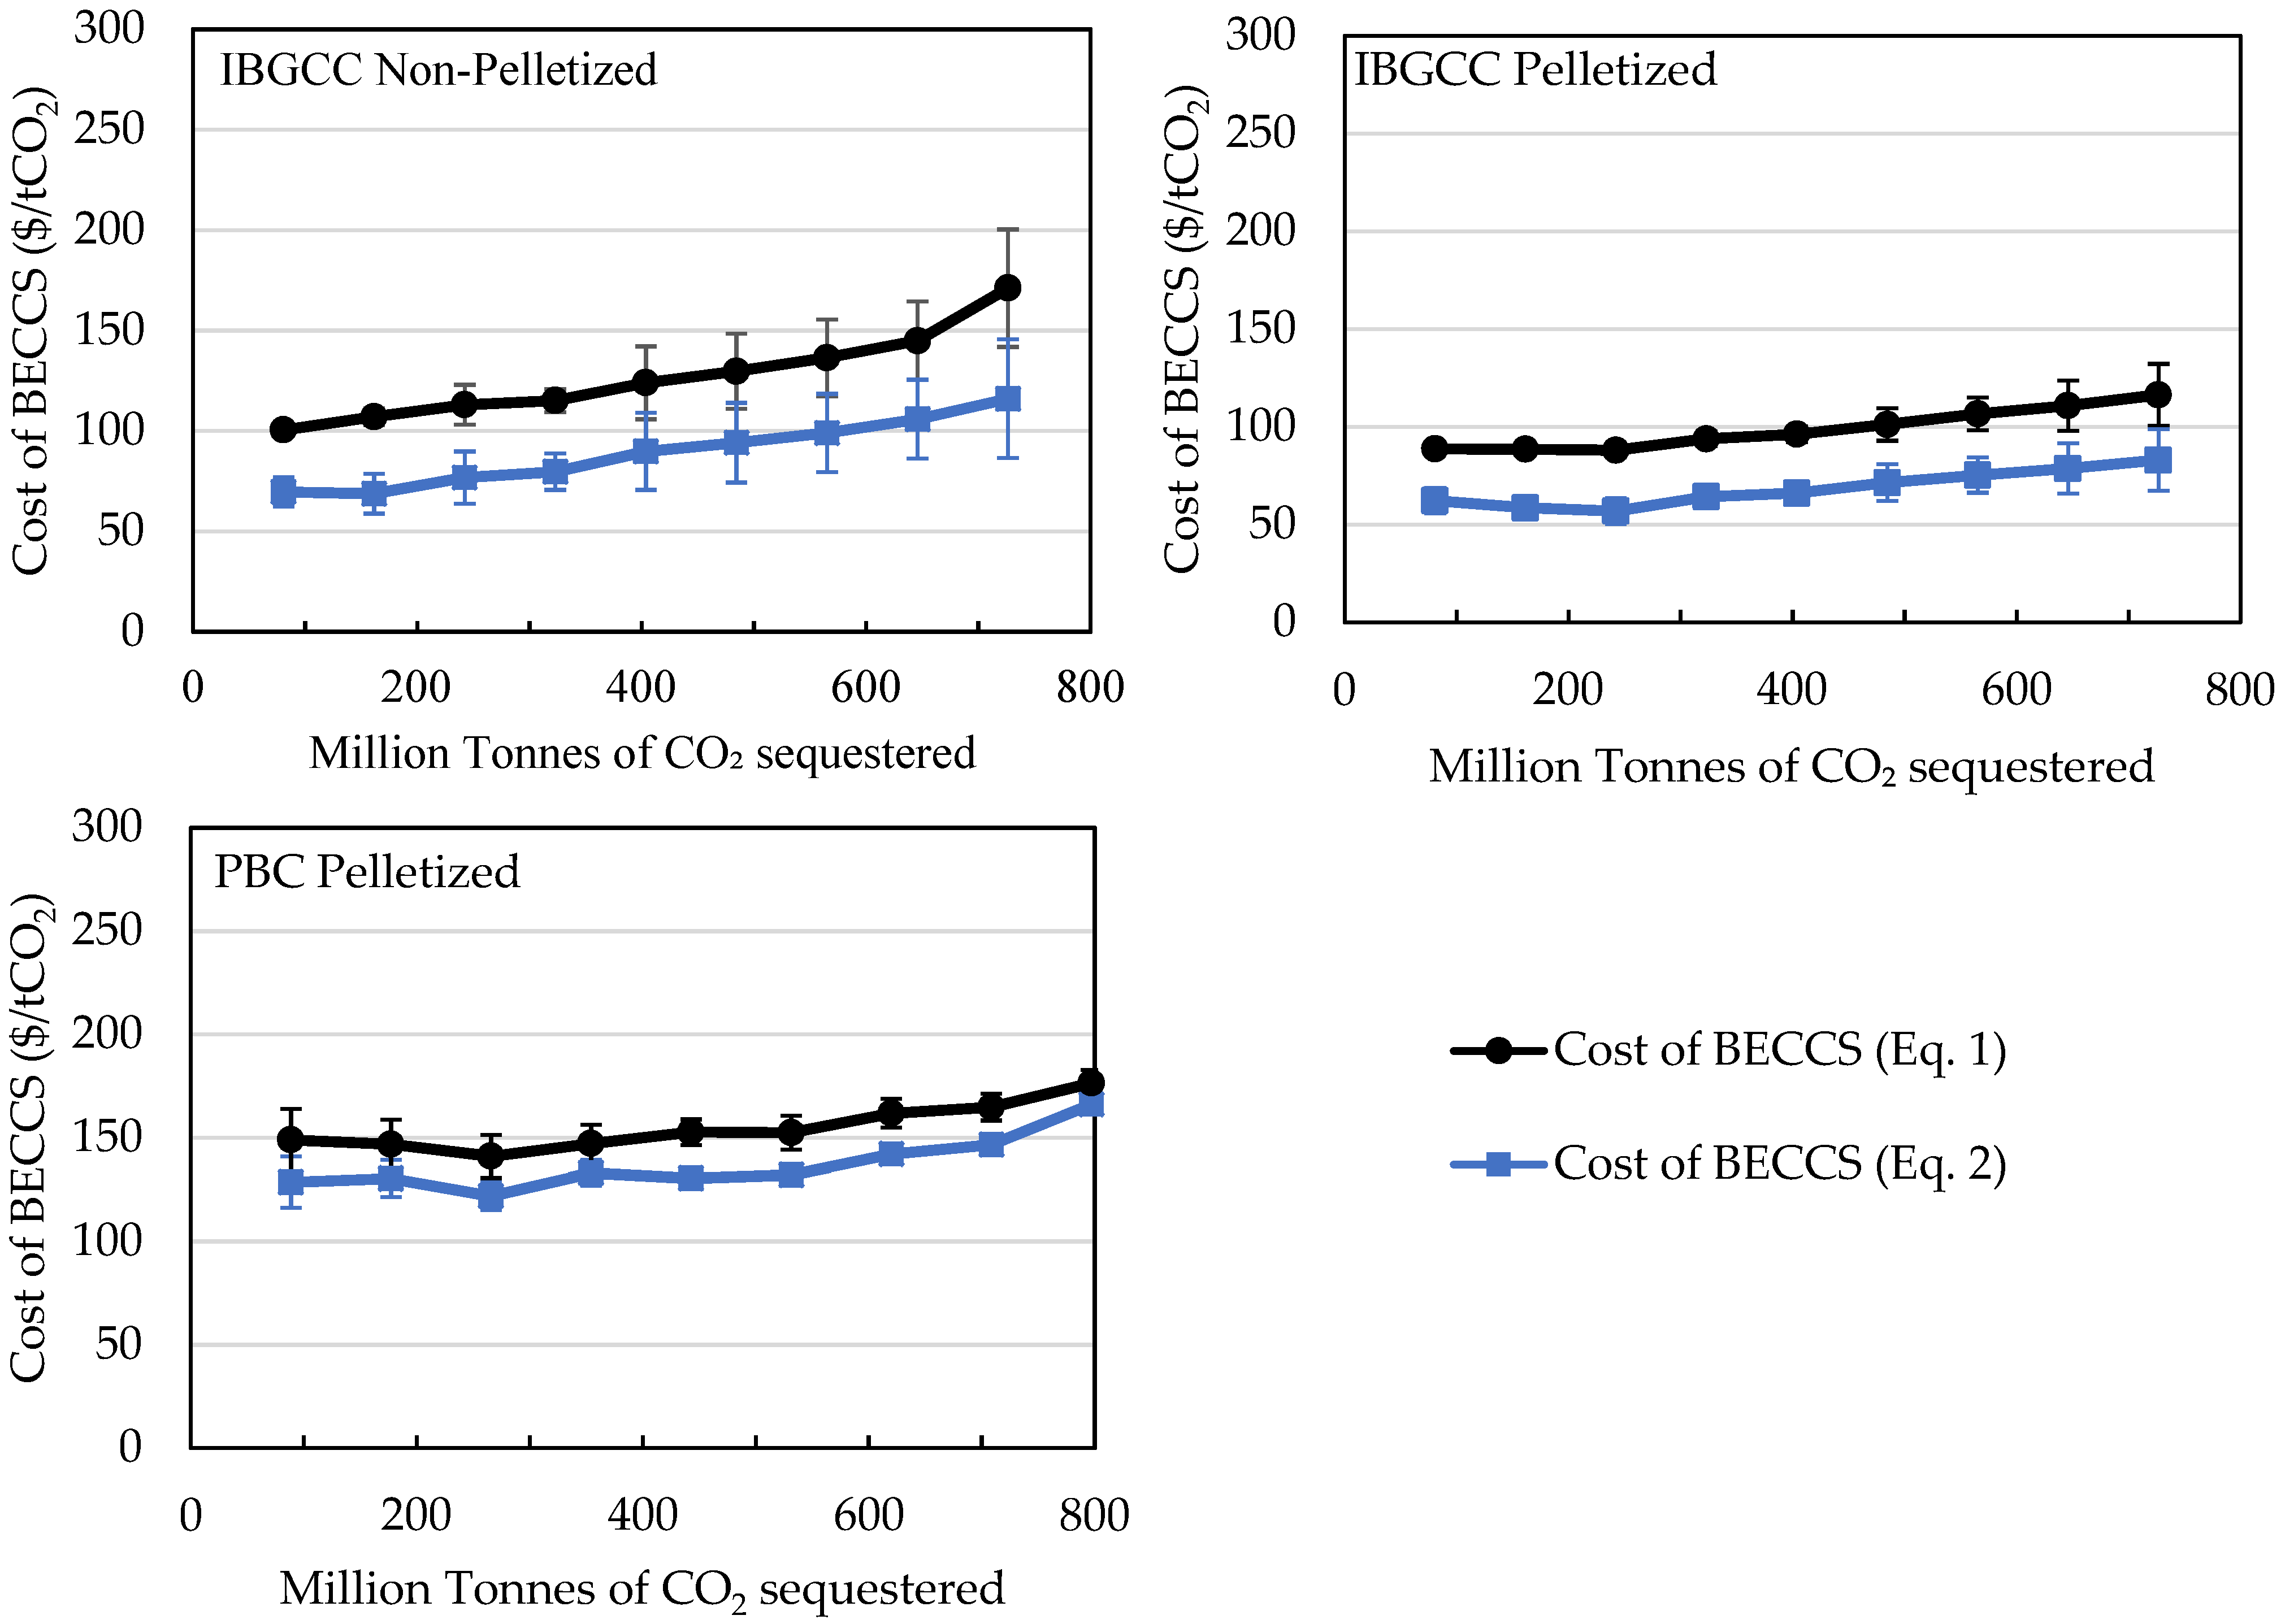
2.7. Cost of BECCS Equations
2.8. Comparative Analysis Using CAC
3. Results
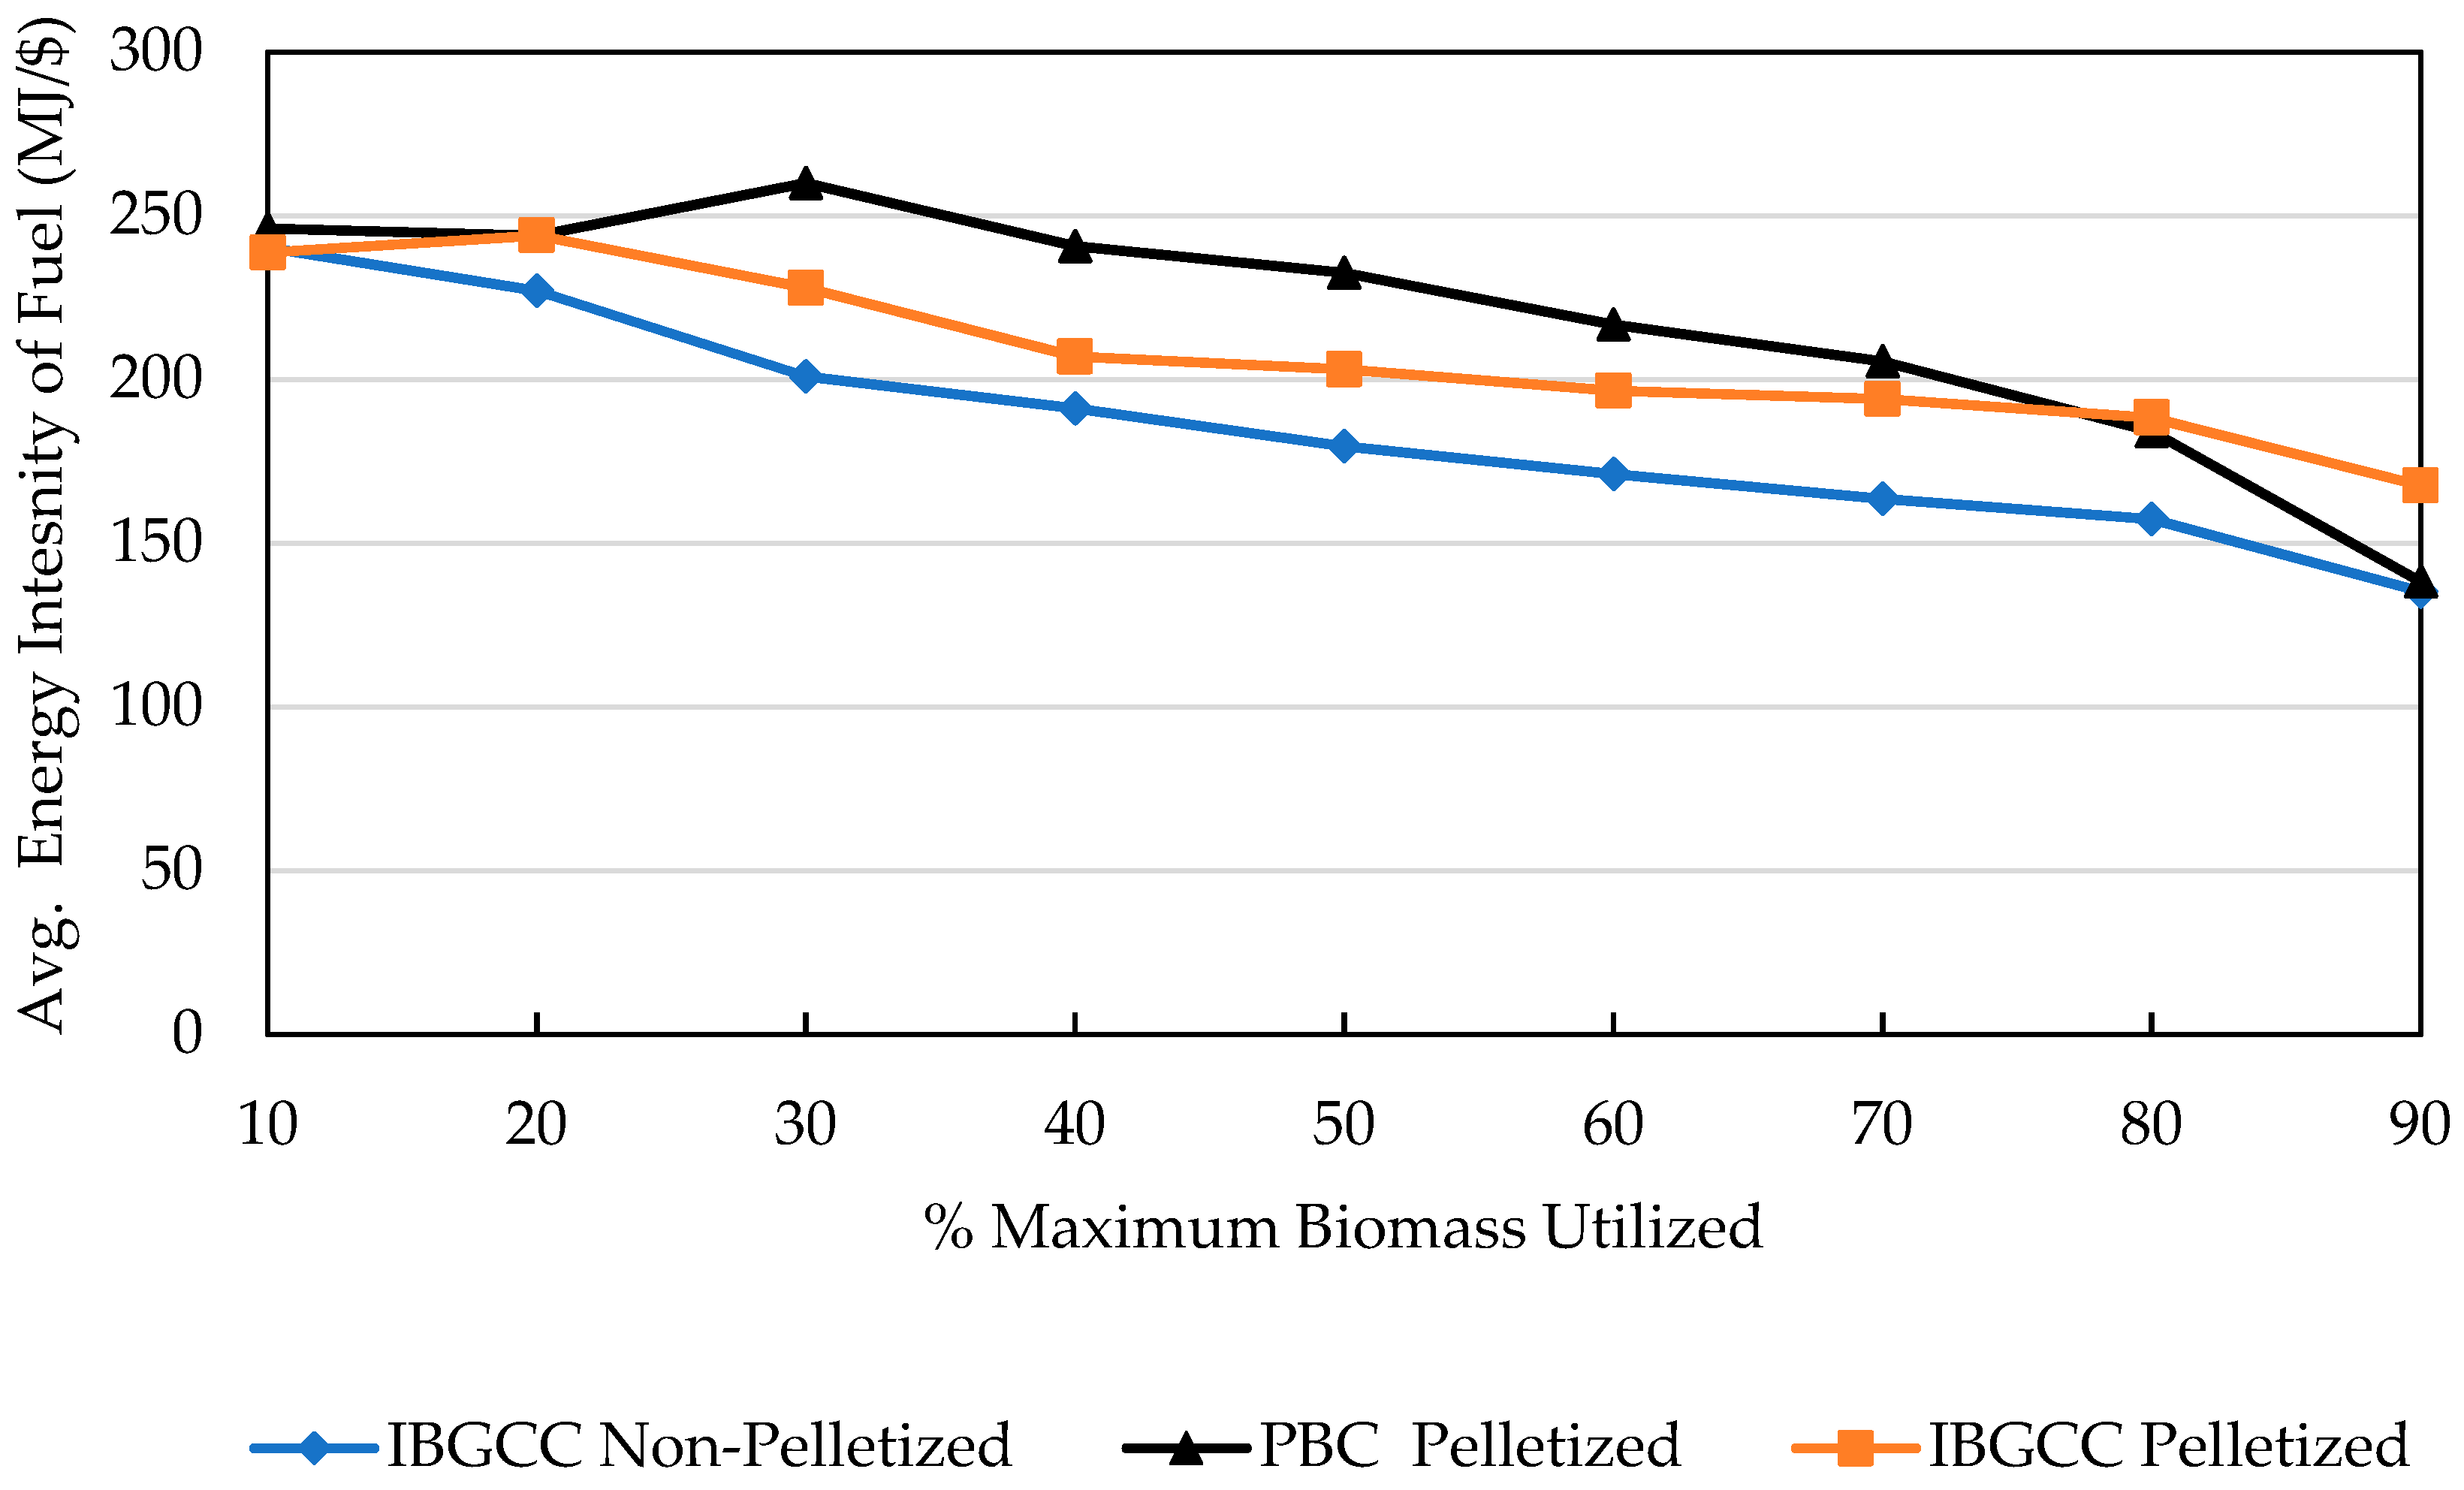
3.1. Cost of BECCS
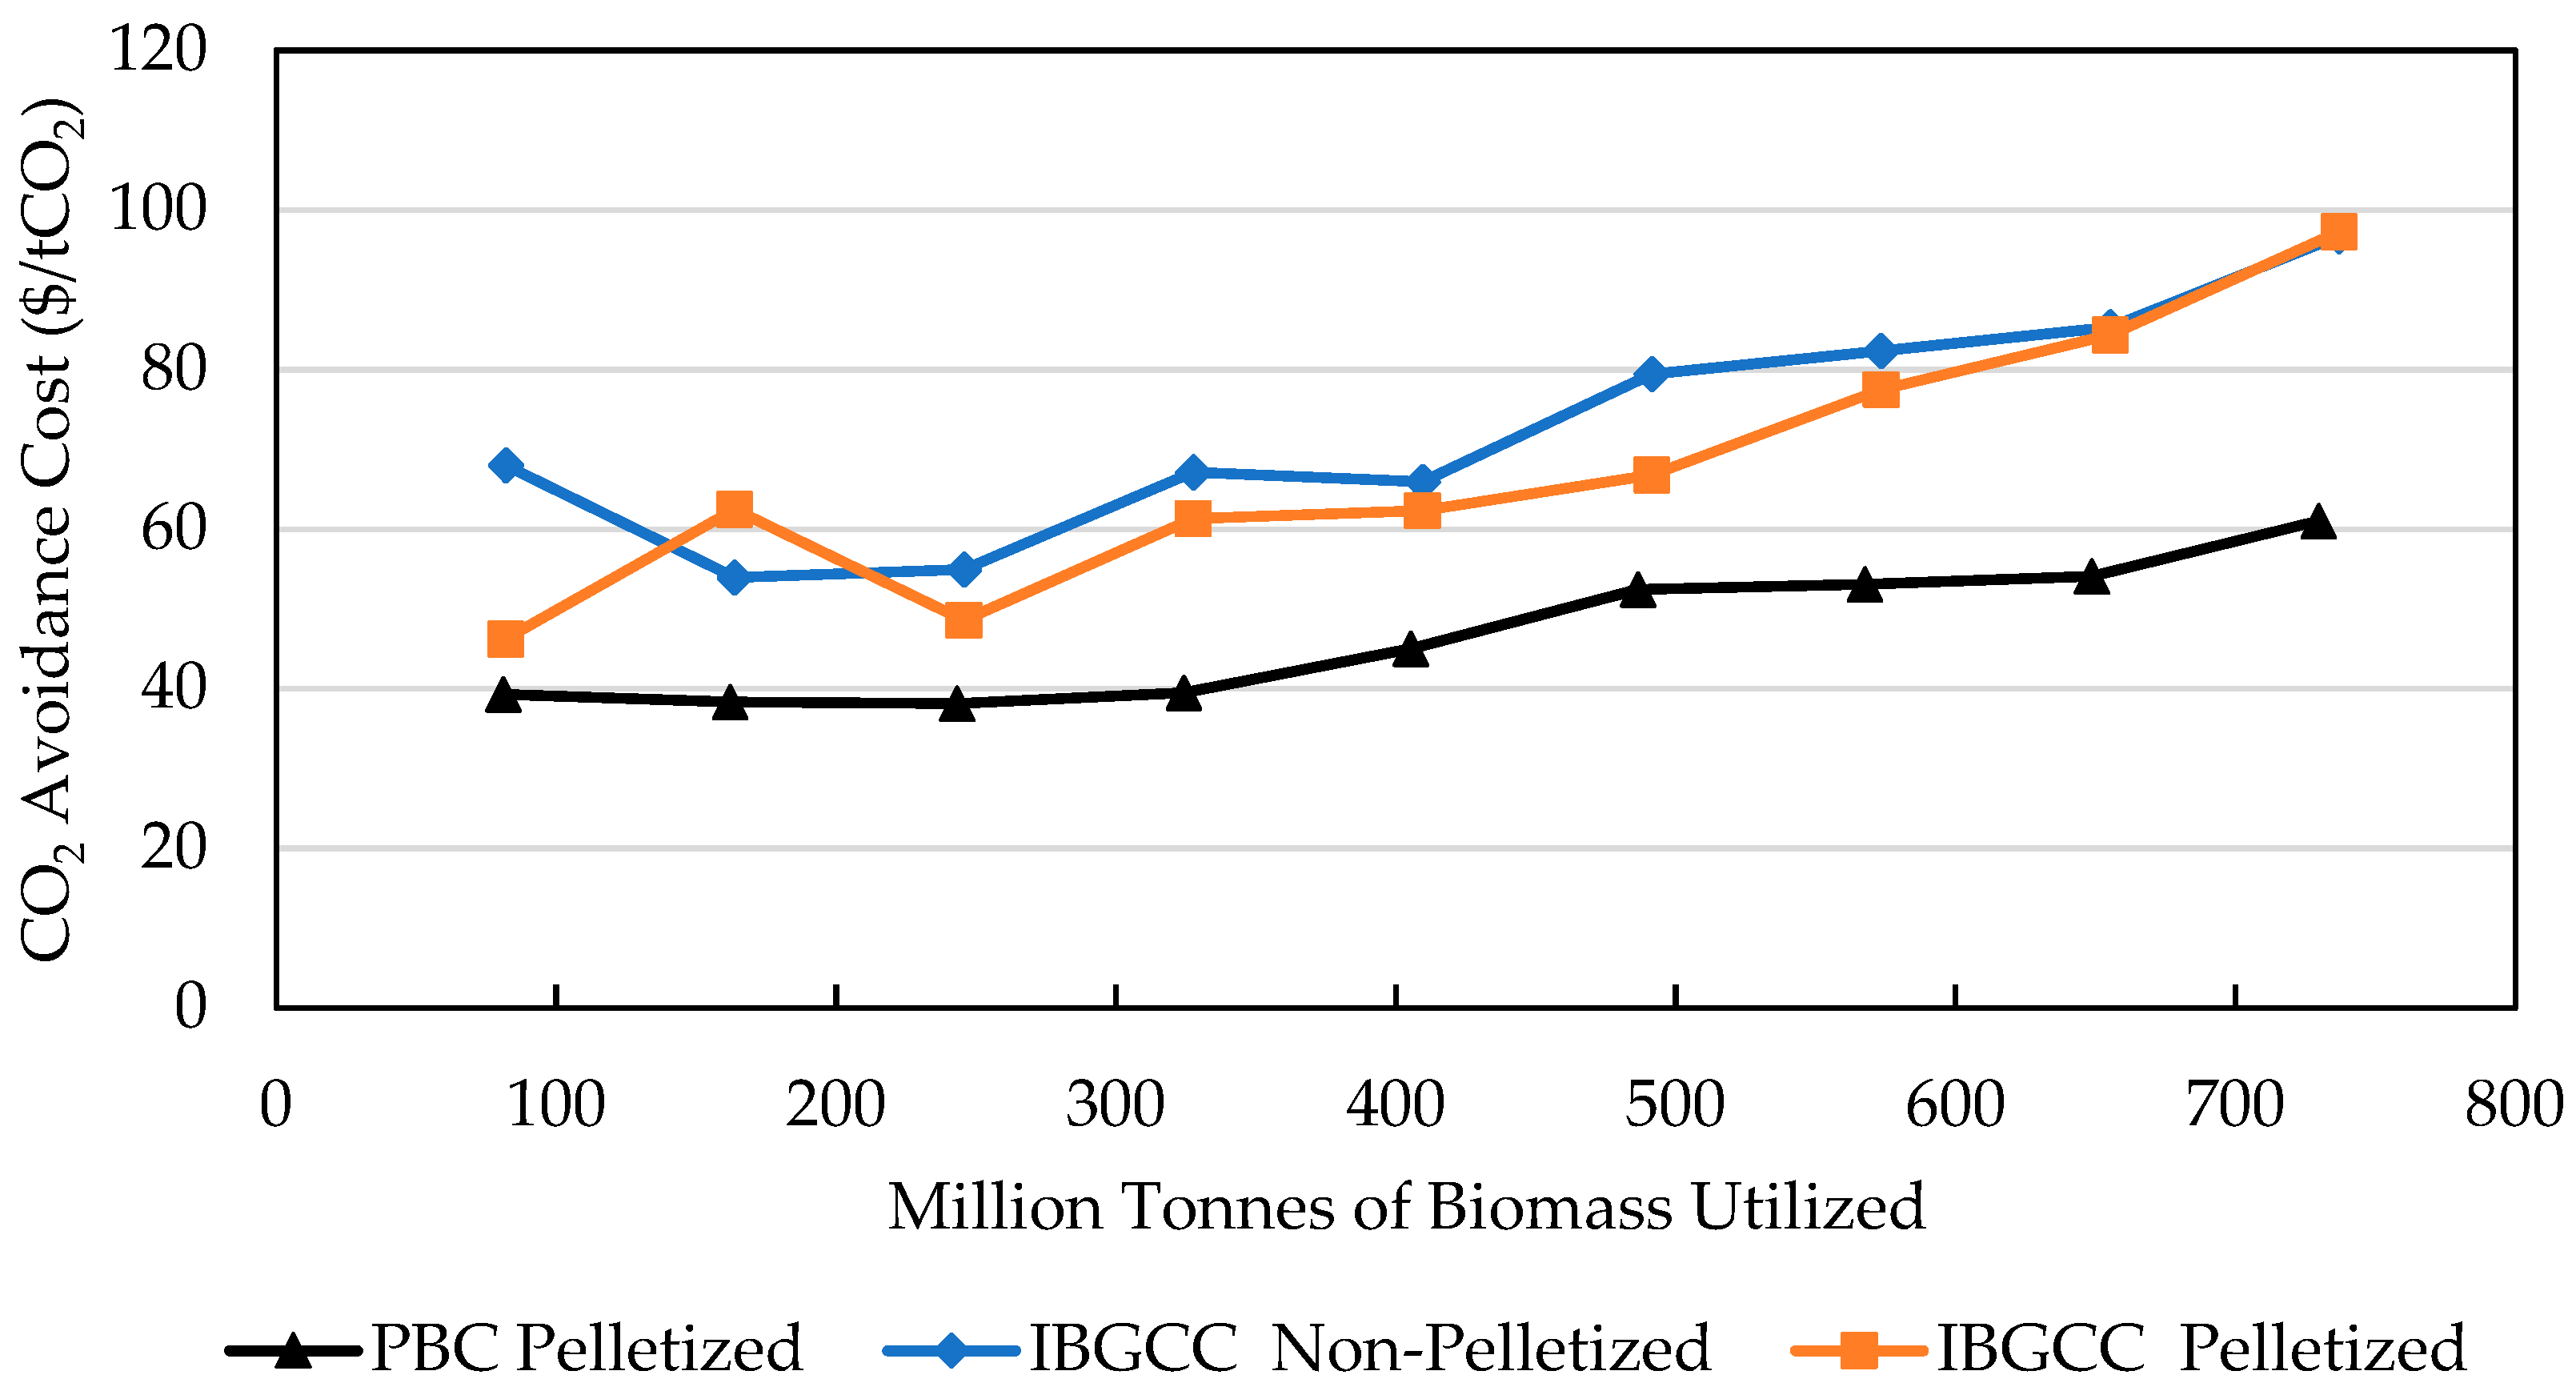
3.2. CAC Calculations Using PC Powerplants with Coal
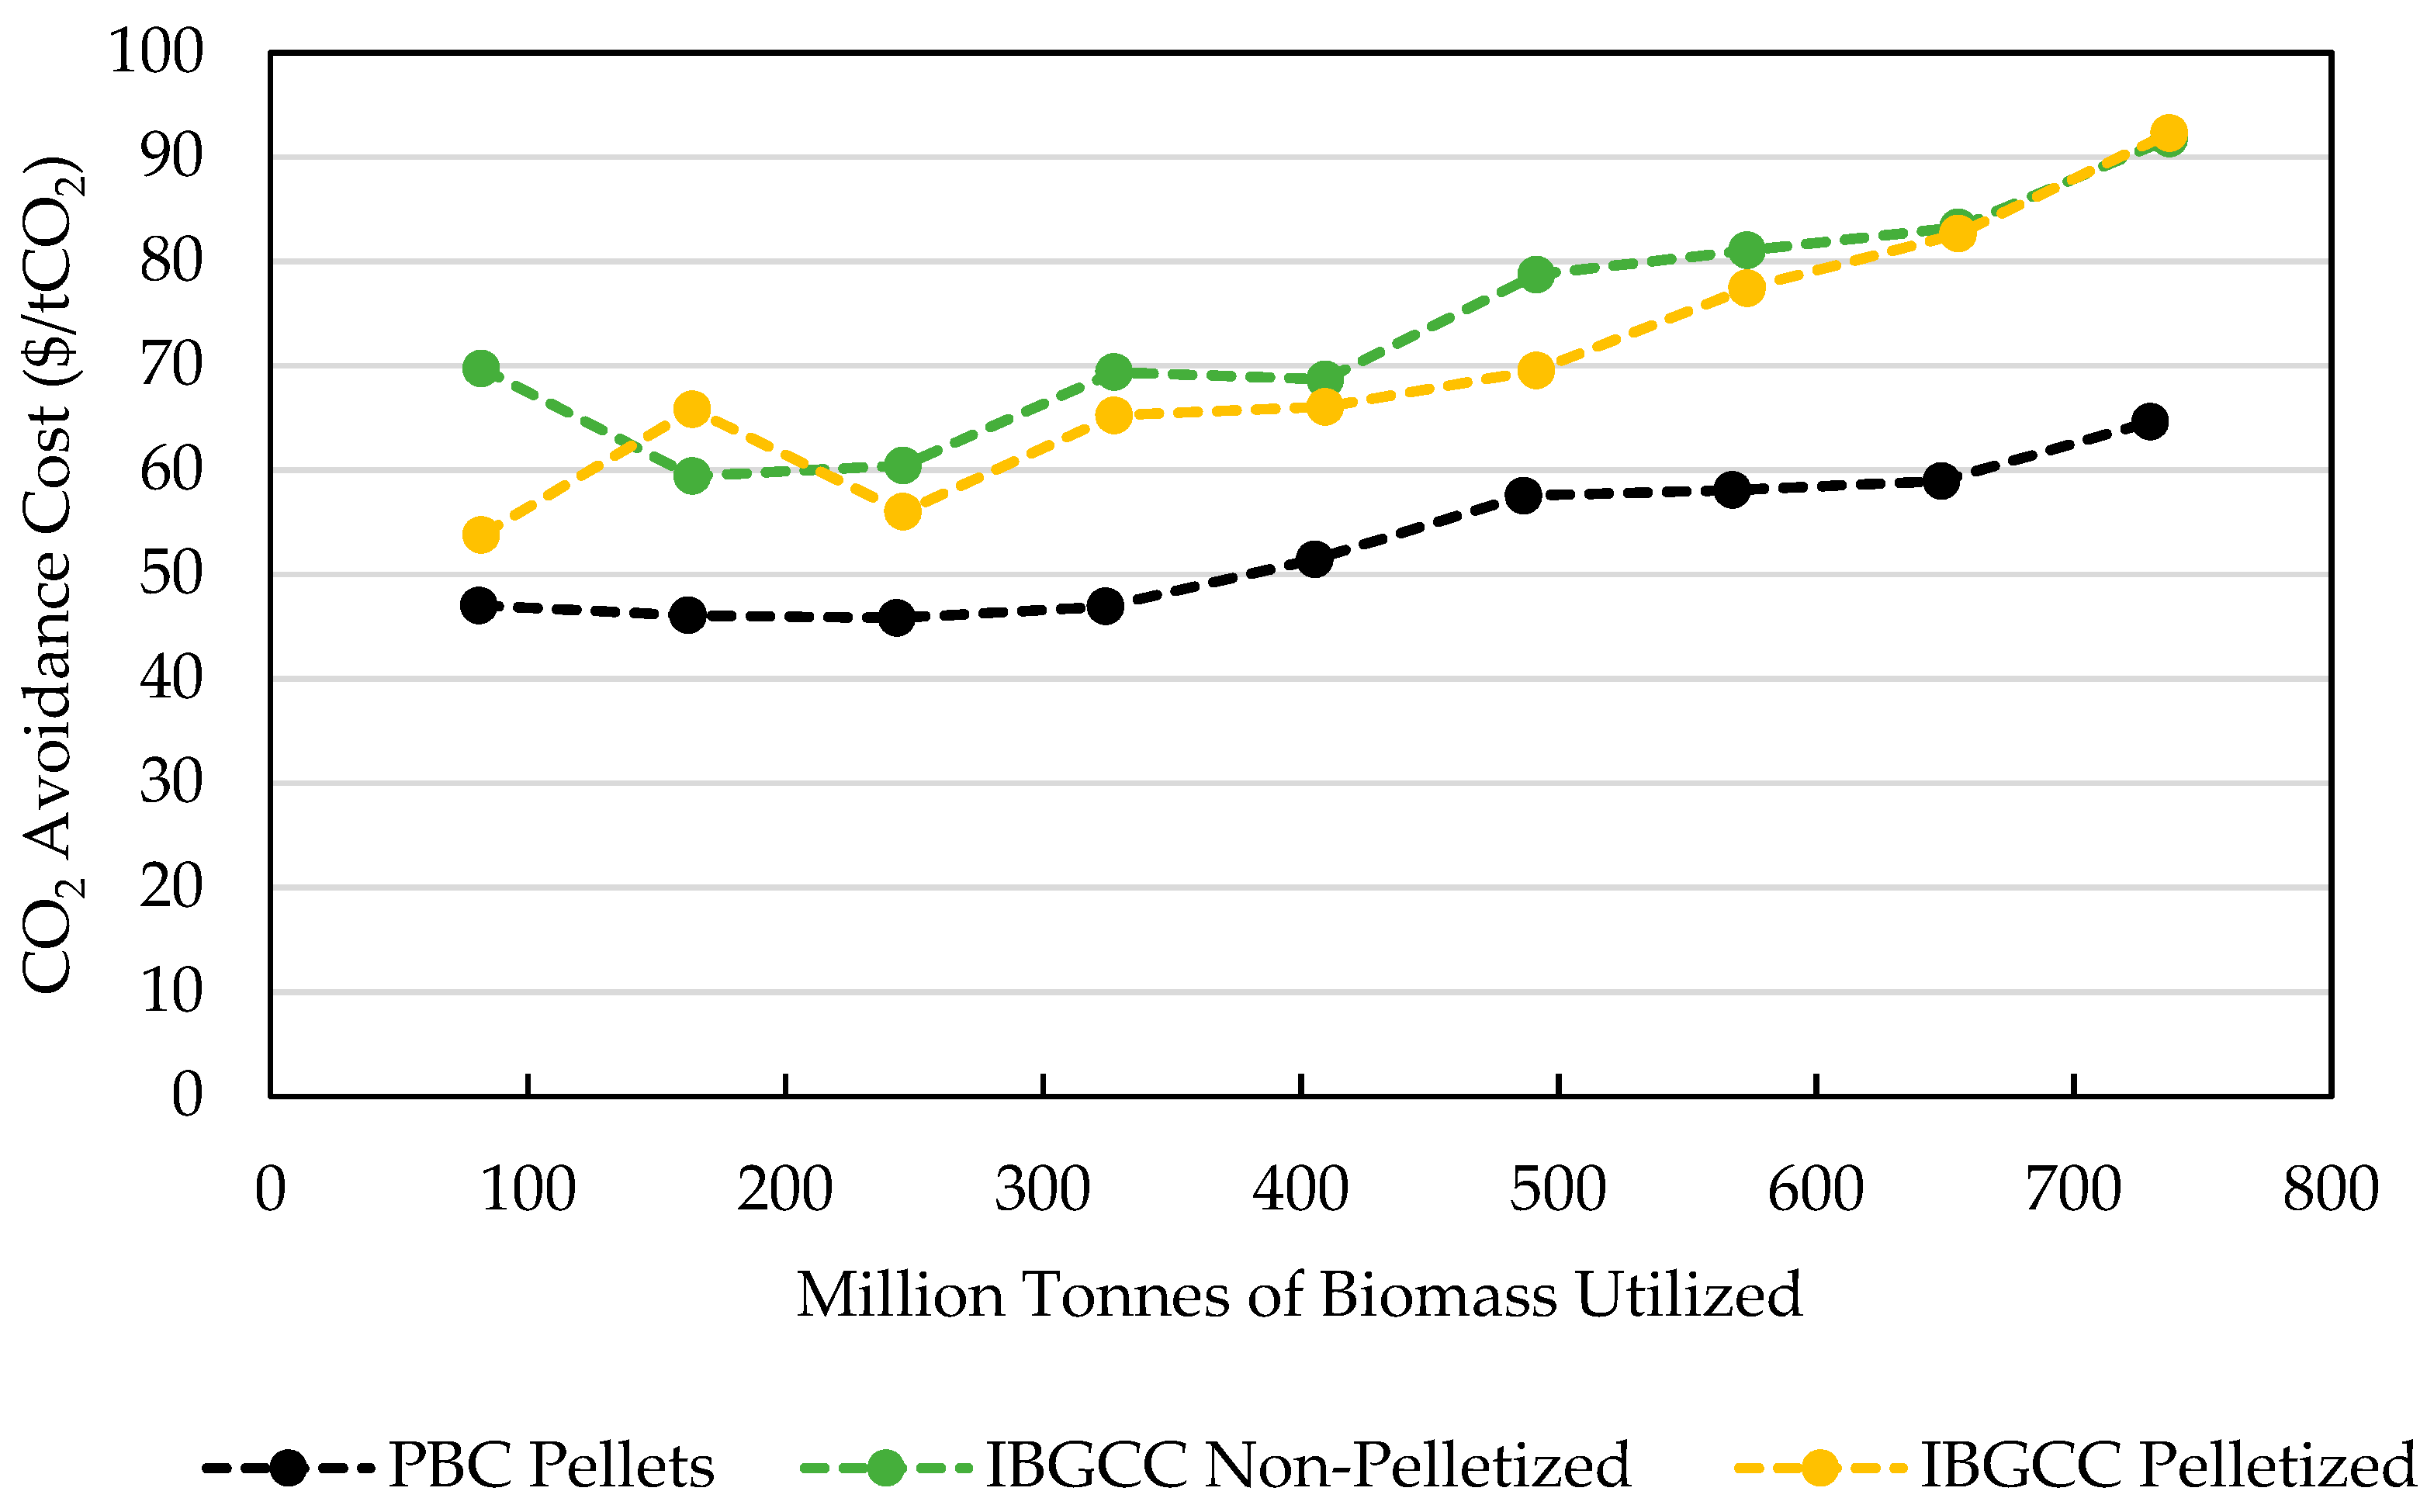
3.3. CAC Calculations Using NGCC Power Plants for Reference
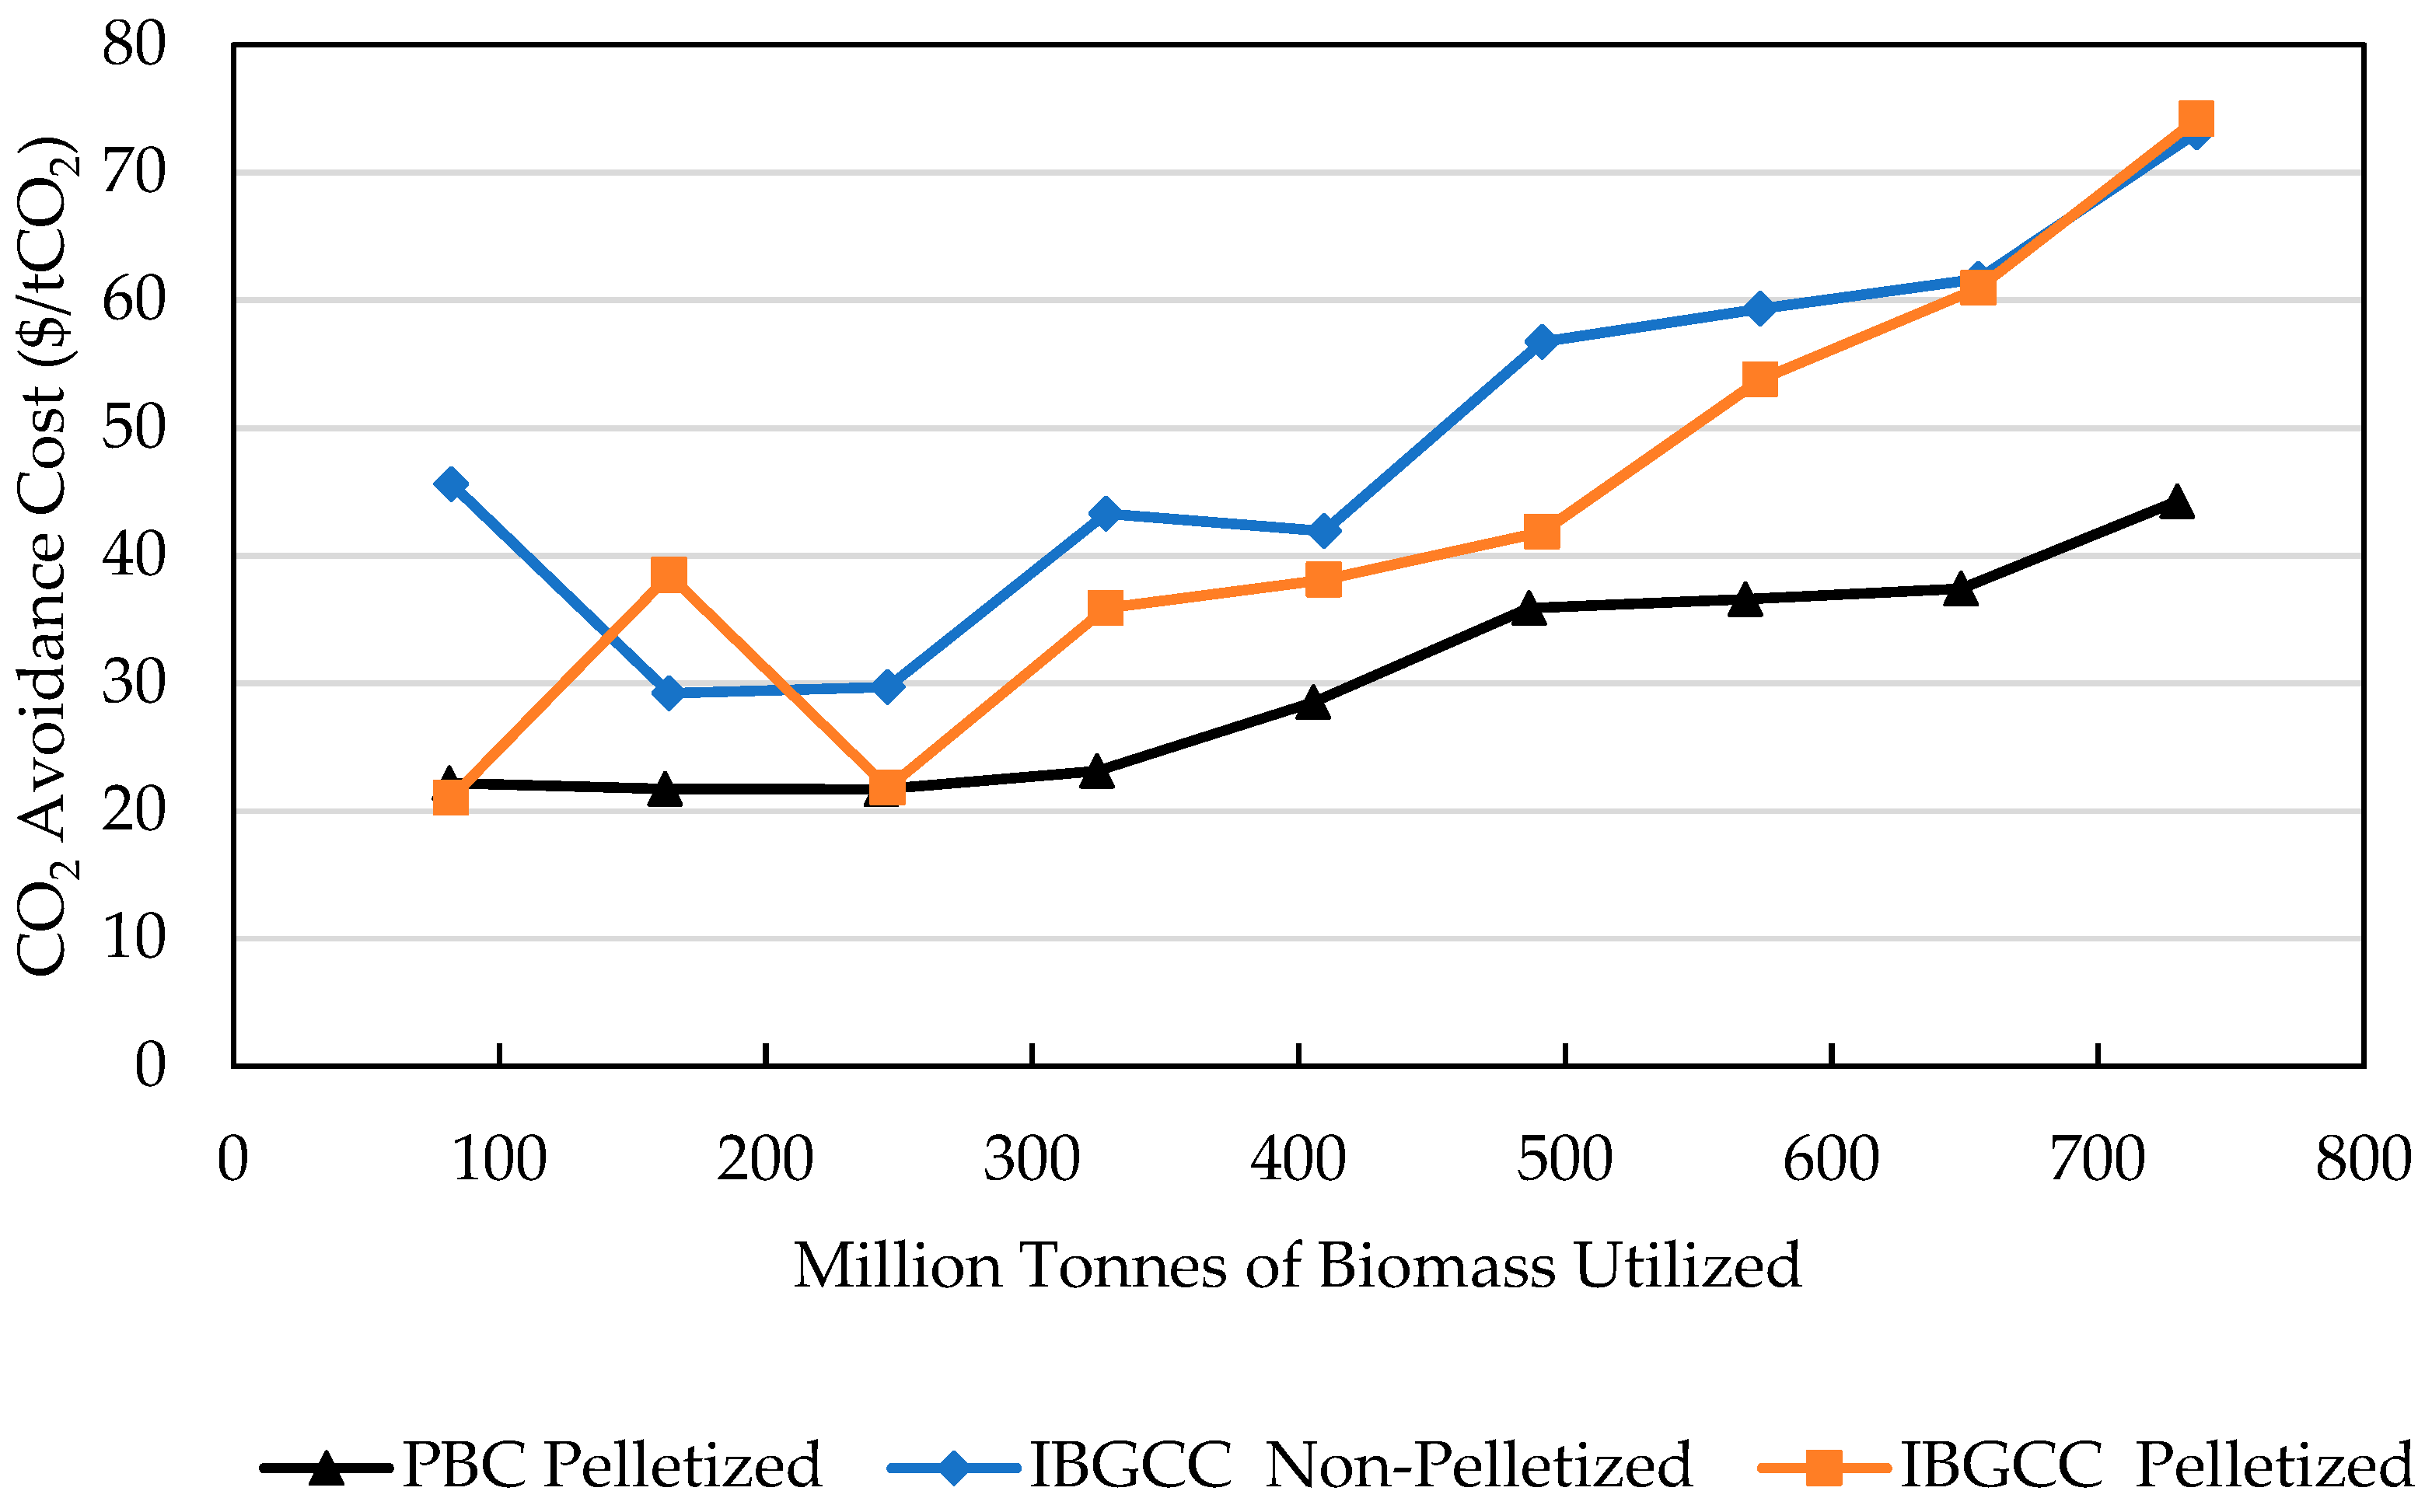
3.4. CAC Calculations Using Biomass References
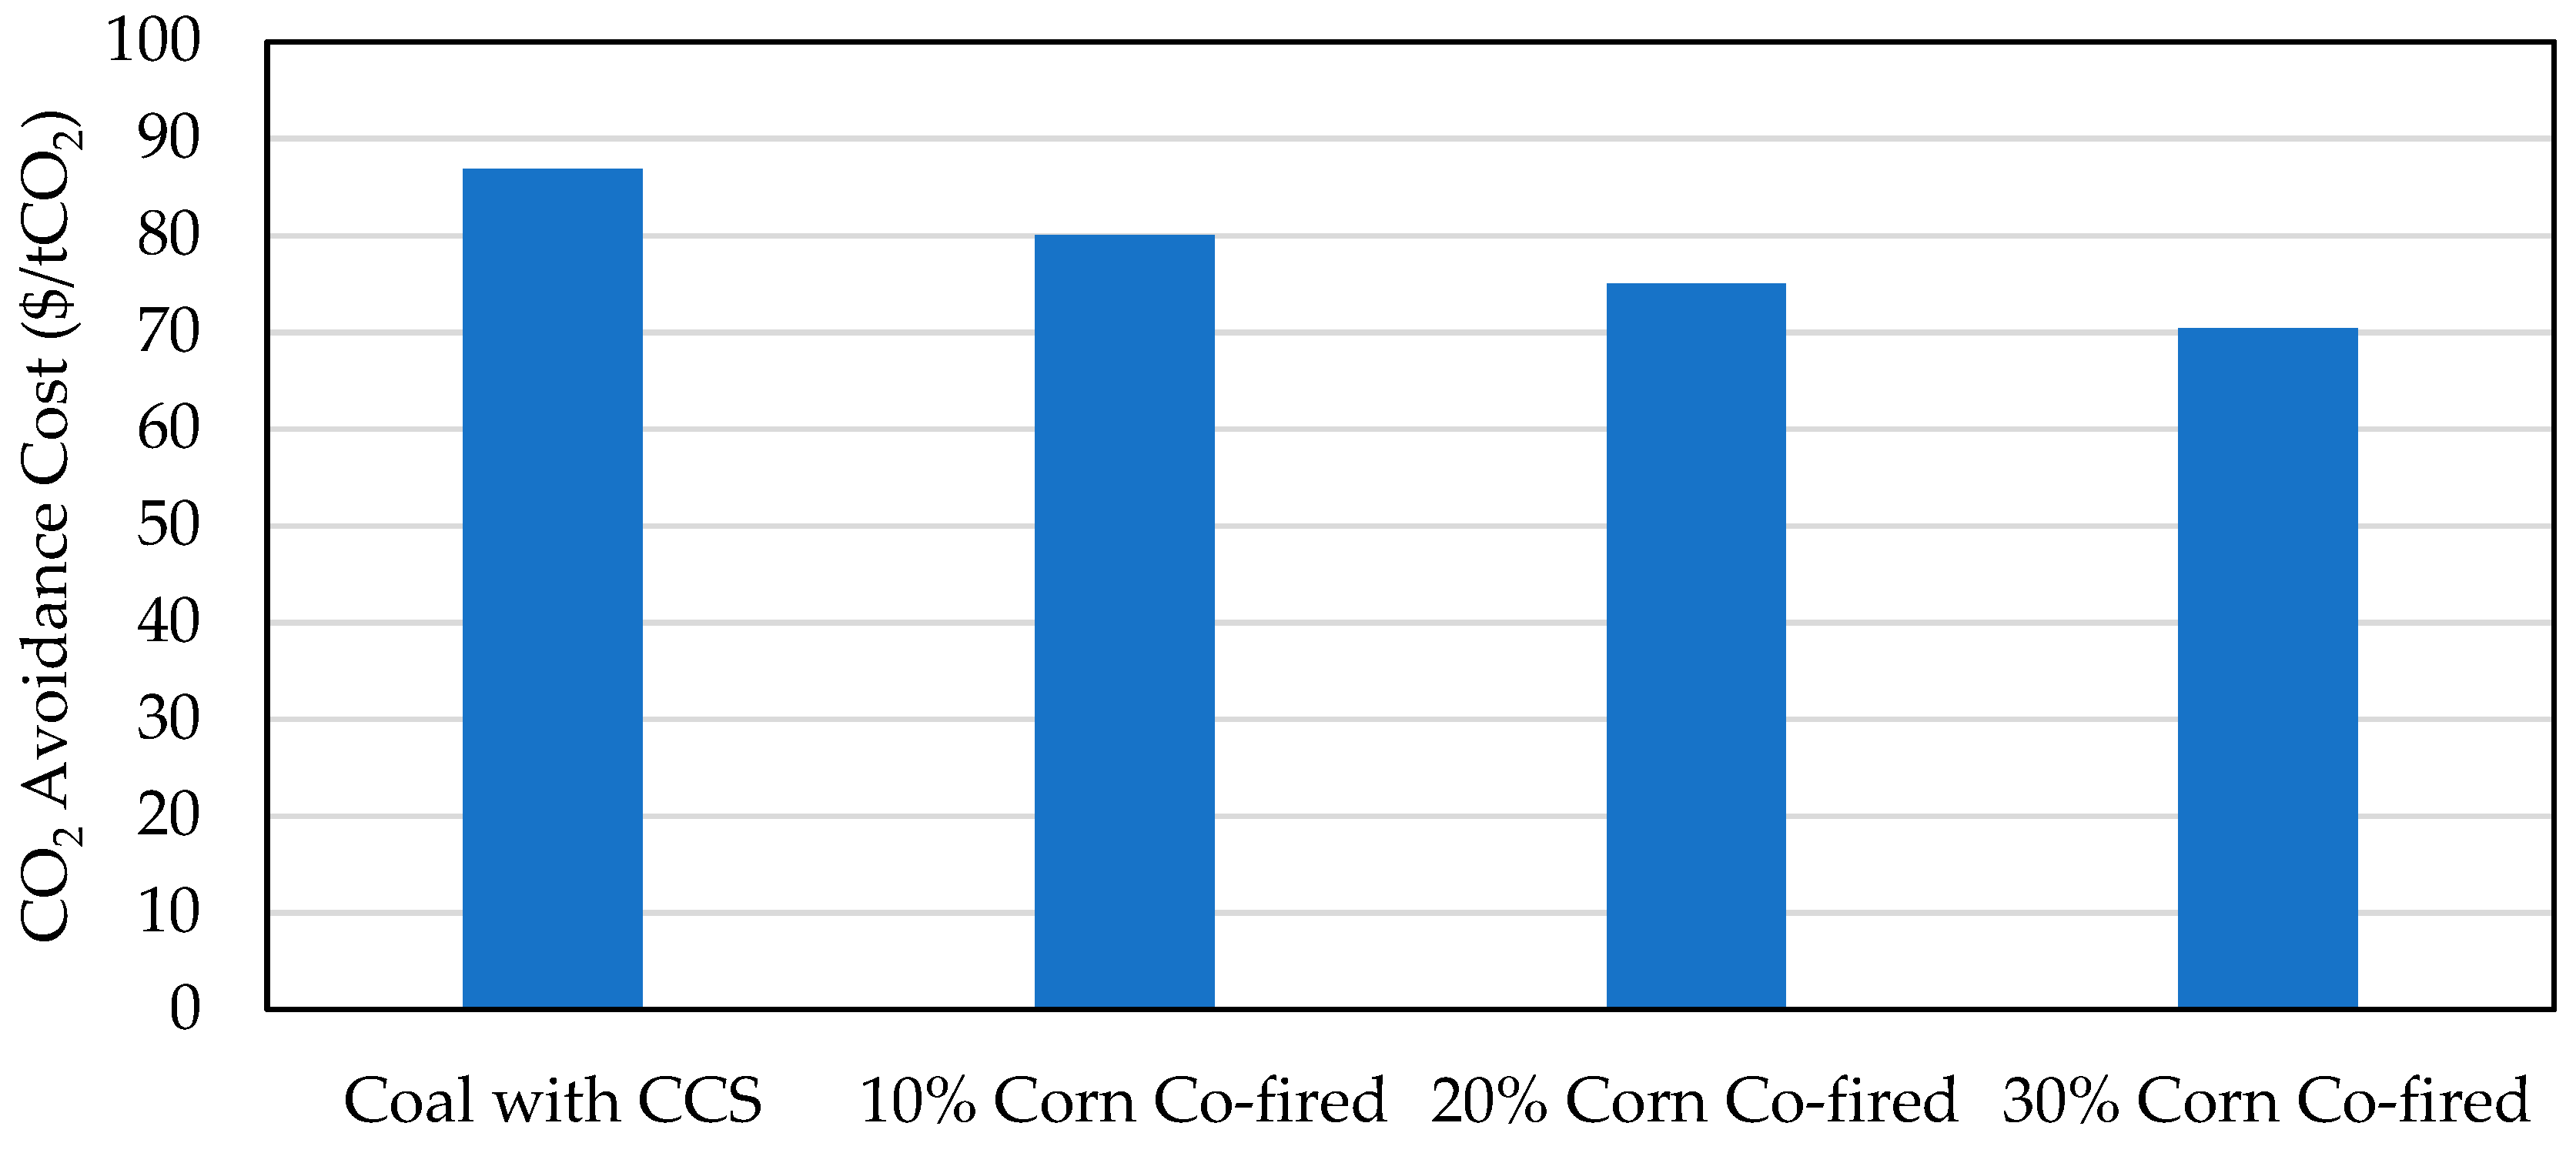
3.5. Corn Stover Co-Firing
3.6. Poplar-Derived Bio-SNG Co-Firing
3.7. Comparing BECCS Power Plants to PCC Power Plants with CCS
3.8. Summarized Results
3.9. Future Work
4. Conclusions
Author Contributions
Funding
Institutional Review Board Statement
Informed Consent Statement
Data Availability Statement
Conflicts of Interest
Appendix A. Fuel and Syngas Compositions

| C2H4 | C2H6 | C3H6 | C3H8 | CH4 | CO | CO2 | H2 | O2 | |
|---|---|---|---|---|---|---|---|---|---|
| Barley Straw | 0.0 | 0.0 | 0.0 | 0.0 | 0.7 | 51.8 | 1.0 | 43.9 | 0.0 |
| Corn Stover | 4.2 | 0.0 | 0.1 | 0.4 | 15.3 | 27.2 | 23.7 | 26.9 | 0.0 |
| Hardwood | 0.0 | 0.0 | 0.0 | 0.0 | 3.1 | 46.9 | 28.3 | 21.7 | 1.7 |
| Miscanthus | 0.0 | 0.0 | 0.0 | 0.0 | 9.3 | 25.6 | 23.4 | 41.7 | 0.0 |
| Mixedwood | 1.2 | 0.0 | 0.0 | 0.0 | 8.5 | 27.8 | 17.0 | 45.6 | 0.8 |
| Oats straw | 0.7 | 2.9 | 1.0 | 0.0 | 20.3 | 33.9 | 20.4 | 20.7 | 0.0 |
| Pine | 0.0 | 0.0 | 0.0 | 0.0 | 11.4 | 35.3 | 33.8 | 19.5 | 0.0 |
| Poplar | 1.9 | 0.1 | 0.0 | 0.0 | 8.6 | 23.2 | 20.8 | 45.4 | 0.0 |
| Softwood | 2.3 | 0.0 | 0.0 | 0.0 | 14.0 | 8.6 | 5.6 | 69.5 | 0.0 |
| Sorghum | 0.0 | 1.0 | 0.0 | 0.0 | 9.8 | 41.8 | 33.5 | 12.5 | 0.0 |
| Switchgrass | 0.0 | 0.0 | 0.0 | 0.0 | 9.3 | 25.6 | 23.4 | 41.7 | 0.0 |
| Wheat straw | 4.3 | 0.0 | 0.1 | 0.8 | 16.3 | 29.0 | 22.0 | 25.4 | 0.0 |
| Willow | 0.1 | 0.2 | 0.0 | 0.1 | 3.4 | 62.5 | 8.6 | 18.9 | 6.1 |
| Component | H2O (%) | Ash (%) | C (%) | H (%) | N (%) | S (%) | O (%) | Cl (%) | LHV (kJ/kg) | HHV (kJ/kg) |
|---|---|---|---|---|---|---|---|---|---|---|
| Barley Straw | 10.0 | 4.5 | 41.9 | 5.0 | 0.5 | 0.1 | 37.5 | 0.5 | 15,300.0 | 16,646.7 |
| Corn stover | 20.0 | 4.8 | 36.5 | 4.6 | 0.5 | 0.1 | 33.2 | 0.0 | 13,113.3 | 14,424.7 |
| Hardwood | 50.0 | 1.1 | 26.2 | 3.1 | 0.1 | 0.0 | 19.9 | 0.0 | 8946.7 | 10,816.7 |
| Mixedwood | 50.0 | 1.4 | 26.2 | 3.0 | 0.2 | 0.0 | 19.3 | 0.0 | 8790.0 | 10,658.3 |
| Oats Straw | 10.0 | 6.2 | 42.3 | 4.8 | 0.5 | 0.1 | 37.0 | 0.7 | 15,365.0 | 16,665.0 |
| Pine | 40.0 | 2.4 | 31.2 | 3.4 | 0.2 | 0.0 | 22.8 | 0.0 | 10,672.0 | 12,272.8 |
| Poplar | 40.0 | 1.1 | 29.3 | 3.6 | 0.2 | 0.0 | 25.9 | 0.0 | 10,036.0 | 11,541.4 |
| Softwood | 50.0 | 1.7 | 26.2 | 3.0 | 0.3 | 0.1 | 18.7 | 0.0 | 8633.3 | 10,500.0 |
| Sorghum | 20.0 | 5.6 | 36.7 | 4.0 | 0.6 | 0.0 | 32.8 | 0.2 | 13,103.3 | 14,466.7 |
| Switchgrass | 15.0 | 6.1 | 40.2 | 4.9 | 0.6 | 0.1 | 32.9 | 0.0 | 14,160.0 | 16,284.0 |
| Miscanthus | 15.0 | 6.1 | 40.2 | 4.9 | 0.6 | 0.1 | 32.9 | 0.0 | 14,160.0 | 16,284.0 |
| Wheat Straw | 10.0 | 5.0 | 41.4 | 5.1 | 1.0 | 0.1 | 36.8 | 0.3 | 15,866.7 | 17,293.3 |
| Willow | 50.0 | 0.8 | 24.8 | 3.1 | 0.3 | 0.0 | 21.1 | 0.0 | 9683.3 | 9950.0 |
| Component | H2O (%) | Ash (%) | C (%) | H (%) | N (%) | S (%) | O (%) | Cl (%) | LHV (kJ/kg) | HHV (kJ/kg) |
|---|---|---|---|---|---|---|---|---|---|---|
| Barley Straw | 10.0 | 4.5 | 41.9 | 5.0 | 0.5 | 0.1 | 37.5 | 0.0 | 15,300.0 | 16,830.0 |
| Corn Stover | 10.0 | 5.4 | 41.1 | 5.1 | 0.5 | 0.1 | 37.3 | 0.0 | 15,060.0 | 16,566.0 |
| Hardwood | 10.0 | 1.4 | 47.1 | 5.6 | 0.2 | 0.0 | 35.8 | 0.0 | 18,060.0 | 19,866.0 |
| Miscanthus | 9.0 | 6.6 | 43.0 | 5.3 | 0.6 | 0.1 | 35.3 | 0.0 | 15,330.0 | 16,863.0 |
| Mixedwood | 10.0 | 2.2 | 47.1 | 5.4 | 0.4 | 0.1 | 34.8 | 0.0 | 17,776.7 | 19,554.3 |
| Oats Straw | 10.0 | 6.2 | 42.3 | 4.8 | 0.5 | 0.1 | 37.0 | 0.0 | 15,365.0 | 16,901.5 |
| Pine | 10.0 | 3.6 | 46.8 | 5.1 | 0.3 | 0.0 | 34.2 | 0.0 | 17,100.0 | 18,810.0 |
| Poplar | 10.0 | 1.6 | 43.9 | 5.4 | 0.2 | 0.0 | 38.8 | 0.0 | 16,274.0 | 17,901.4 |
| Softwood | 10.0 | 3.1 | 47.2 | 5.3 | 0.6 | 0.2 | 33.7 | 0.0 | 17,493.3 | 19,242.7 |
| Sorghum | 10.0 | 6.3 | 41.3 | 4.5 | 0.7 | 0.0 | 36.9 | 0.0 | 15,043.3 | 16,547.7 |
| Switchgrass | 9.0 | 6.6 | 43.0 | 5.3 | 0.6 | 0.1 | 35.3 | 0.0 | 15,330.0 | 16,863.0 |
| Wheat Straw | 10.0 | 5.0 | 41.4 | 5.1 | 1.0 | 0.1 | 36.8 | 0.0 | 15,866.7 | 17,453.3 |
| Willow | 10.0 | 1.4 | 44.6 | 5.5 | 0.5 | 0.0 | 38.0 | 0.0 | 15,973.3 | 17,570.7 |
Appendix B. CO2 Avoidance Cost Information
| PBC Pellets | PC Coal no CCS (Ref) | NGCC no CCS (Ref) | PC Biomass no CCS (Ref) | IGCC Biomass no CCS (Ref) | ||||||||||
|---|---|---|---|---|---|---|---|---|---|---|---|---|---|---|
| tCO2 | LCOECCS | ECCS | LCOEref | Eref | ESupply Chain | LCOEref | Eref | ESupply Chain | LCOEref | Eref | ESupply Chain | LCOEref | Eref | ESupply Chain |
| 81 | 144.49 | −1.37 | 43.00 | 0.82 | 0.06 | 61.96 | 0.36 | 0.02 | 88.36 | 0 | 0.06 | 112.8 | 0 | 0.06 |
| 162 | 144.71 | −1.41 | 43.23 | 0.82 | 0.06 | 61.96 | 0.36 | 0.02 | 88.36 | 0 | 0.06 | 112.8 | 0 | 0.06 |
| 243 | 145.04 | −1.42 | 43.12 | 0.82 | 0.06 | 61.96 | 0.36 | 0.02 | 88.36 | 0 | 0.06 | 112.8 | 0 | 0.06 |
| 324 | 147.24 | −1.43 | 43.05 | 0.82 | 0.06 | 61.96 | 0.36 | 0.02 | 88.36 | 0 | 0.06 | 112.8 | 0 | 0.06 |
| 405 | 155.10 | −1.42 | 43.00 | 0.82 | 0.06 | 61.96 | 0.36 | 0.02 | 88.36 | 0 | 0.06 | 112.8 | 0 | 0.06 |
| 487 | 165.75 | −1.41 | 43.18 | 0.82 | 0.06 | 61.96 | 0.36 | 0.02 | 88.36 | 0 | 0.06 | 112.8 | 0 | 0.06 |
| 568 | 166.89 | −1.42 | 43.17 | 0.82 | 0.06 | 61.96 | 0.36 | 0.02 | 88.36 | 0 | 0.06 | 112.8 | 0 | 0.06 |
| 649 | 167.50 | −1.40 | 43.33 | 0.82 | 0.06 | 61.96 | 0.36 | 0.02 | 88.36 | 0 | 0.06 | 112.8 | 0 | 0.06 |
| 730 | 177.30 | −1.40 | 43.80 | 0.82 | 0.06 | 61.96 | 0.36 | 0.02 | 88.36 | 0 | 0.06 | 112.8 | 0 | 0.06 |
| 803 | 194.56 | −1.35 | 43.00 | 0.82 | 0.06 | 61.96 | 0.36 | 0.02 | 88.36 | 0 | 0.06 | 112.8 | 0 | 0.06 |
| 811 | 195.29 | −1.34 | 43.03 | 0.82 | 0.06 | 61.96 | 0.36 | 0.02 | 88.36 | 0 | 0.06 | 112.8 | 0 | 0.06 |
| IBGCC Non-Pellets | PC Coal no CCS (Ref) | NGCC no CCS (Ref) | PC Biomass no CCS (Ref) | IGCC Biomass no CCS (Ref) | ||||||||||
|---|---|---|---|---|---|---|---|---|---|---|---|---|---|---|
| tCO2 | LCOECCS | ECCS | LCOEref | Eref | ESupply Chain | LCOEref | Eref | ESupply Chain | LCOEref | Eref | ESupply Chain | LCOEref | Eref | ESupply Chain |
| 82 | 157.57 | −0.96 | 58.40 | 0.83 | 0.06 | 63.76 | 0.36 | 0.02 | 88.36 | 0 | 0.06 | 112.8 | 0 | 0.02 |
| 164 | 139.39 | −0.88 | 57.95 | 0.83 | 0.06 | 63.71 | 0.36 | 0.02 | 88.36 | 0 | 0.06 | 112.8 | 0 | 0.02 |
| 246 | 139.19 | −0.86 | 56.07 | 0.83 | 0.06 | 63.51 | 0.36 | 0.02 | 88.36 | 0 | 0.06 | 112.8 | 0 | 0.02 |
| 328 | 152.78 | −0.90 | 55.69 | 0.83 | 0.06 | 63.47 | 0.36 | 0.02 | 88.36 | 0 | 0.06 | 112.8 | 0 | 0.02 |
| 410 | 151.35 | −0.89 | 53.32 | 0.83 | 0.06 | 63.21 | 0.36 | 0.02 | 88.36 | 0 | 0.06 | 112.8 | 0 | 0.02 |
| 491 | 166.83 | −0.93 | 53.55 | 0.83 | 0.06 | 63.24 | 0.36 | 0.02 | 88.36 | 0 | 0.06 | 112.8 | 0 | 0.02 |
| 573 | 168.10 | −0.91 | 51.91 | 0.82 | 0.06 | 63.05 | 0.36 | 0.02 | 88.36 | 0 | 0.06 | 112.8 | 0 | 0.02 |
| 655 | 168.60 | −0.88 | 51.16 | 0.82 | 0.06 | 62.97 | 0.36 | 0.02 | 88.36 | 0 | 0.06 | 112.8 | 0 | 0.02 |
| 737 | 177.73 | −0.86 | 50.41 | 0.82 | 0.06 | 62.88 | 0.36 | 0.02 | 88.36 | 0 | 0.06 | 112.8 | 0 | 0.02 |
| 82 | 157.57 | −0.96 | 58.40 | 0.83 | 0.06 | 63.76 | 0.36 | 0.02 | 88.36 | 0 | 0.06 | 112.8 | 0 | 0.02 |
| 164 | 139.39 | −0.88 | 57.95 | 0.83 | 0.06 | 63.71 | 0.36 | 0.02 | 88.36 | 0 | 0.06 | 112.8 | 0 | 0.02 |
| IBGCC Pellets | PC Coal no CCS (Ref) | NGCC no CCS (Ref) | PC Biomass no CCS (Ref) | IGCC Biomass no CCS (Ref) | ||||||||||
|---|---|---|---|---|---|---|---|---|---|---|---|---|---|---|
| tCO2 | LCOECCS | ECCS | LCOEref | Eref | ESupply Chain | LCOEref | Eref | ESupply Chain | LCOEref | Eref | ESupply Chain | LCOEref | Eref | ESupply Chain |
| 82 | 131.80 | −0.88 | 57.53 | 0.83 | 0.06 | 63.67 | 0.36 | 0.02 | 88.36 | 0 | 0.06 | 112.8 | 0 | 0.02 |
| 164 | 148.42 | −0.90 | 56.65 | 0.83 | 0.06 | 63.57 | 0.36 | 0.02 | 88.36 | 0 | 0.06 | 112.8 | 0 | 0.02 |
| 246 | 131.26 | −0.82 | 55.81 | 0.83 | 0.06 | 63.48 | 0.36 | 0.02 | 88.36 | 0 | 0.06 | 112.8 | 0 | 0.02 |
| 328 | 144.16 | −0.85 | 55.17 | 0.83 | 0.06 | 63.42 | 0.36 | 0.02 | 88.36 | 0 | 0.06 | 112.8 | 0 | 0.02 |
| 410 | 147.72 | −0.89 | 53.04 | 0.83 | 0.06 | 63.18 | 0.36 | 0.02 | 88.36 | 0 | 0.06 | 112.8 | 0 | 0.02 |
| 491 | 149.73 | −0.86 | 52.07 | 0.82 | 0.06 | 63.07 | 0.36 | 0.02 | 88.36 | 0 | 0.06 | 112.8 | 0 | 0.02 |
| 573 | 161.96 | −0.89 | 51.45 | 0.82 | 0.06 | 63.00 | 0.36 | 0.02 | 88.36 | 0 | 0.06 | 112.8 | 0 | 0.02 |
| 649 | 167.50 | −1.40 | 43.33 | 0.82 | 0.06 | 61.96 | 0.36 | 0.02 | 88.36 | 0 | 0.06 | 112.8 | 0 | 0.06 |
| 730 | 177.30 | −1.40 | 43.80 | 0.82 | 0.06 | 61.96 | 0.36 | 0.02 | 88.36 | 0 | 0.06 | 112.8 | 0 | 0.06 |
| 803 | 194.56 | −1.35 | 43.00 | 0.82 | 0.06 | 61.96 | 0.36 | 0.02 | 88.36 | 0 | 0.06 | 112.8 | 0 | 0.06 |
| 811 | 195.29 | −1.34 | 43.03 | 0.82 | 0.06 | 61.96 | 0.36 | 0.02 | 88.36 | 0 | 0.06 | 112.8 | 0 | 0.06 |
Appendix C. Biomass Resources Information
| Resource Category | Resource | $44 | $66 | $88 | $110 |
|---|---|---|---|---|---|
| Crop residues | Barley straw | 3.82 × 10⁵ | 5.16 × 10⁵ | 5.67 × 10⁵ | 5.88 × 10⁵ |
| Corn stover | 4.03 × 10⁷ | 1.40 × 10⁸ | 1.51 × 10⁸ | 1.50 × 10⁸ | |
| Oats straw | 6.02 × 10³ | 7.39 × 10³ | 6.90 × 10³ | 6.85 × 10³ | |
| Wheat straw | 1.11 × 10⁷ | 1.89 × 10⁷ | 1.79 × 10⁷ | 1.80 × 10⁷ | |
| Sorghum stubble | 7.72 × 10⁵ | 9.56 × 10⁵ | 1.05 × 10⁶ | 9.80 × 10⁵ | |
| Herbaceous energy | Energy cane | 0 | 3.03 × 10⁵ | 1.52 × 10⁶ | 4.03 × 10⁶ |
| crops | Miscanthus | 5.90 × 10⁶ | 1.45 × 10⁸ | 2.66 × 10⁸ | 2.98 × 10⁸ |
| Biomass sorghum | 8.11 × 10⁵ | 1.75 × 10⁷ | 5.28 × 10⁷ | 8.67 × 10⁷ | |
| Switchgrass | 2.45 × 10⁷ | 1.46 × 10⁸ | 1.25 × 10⁸ | 1.10 × 10⁸ | |
| Logging residues | Hardwood, lowland logging residues | 4.21 × 10⁶ | 4.21 × 10⁶ | 4.21 × 10⁶ | 4.21 × 10⁶ |
| Hardwood, upland logging residues | 3.09 × 10⁶ | 3.09 × 10⁶ | 3.09 × 10⁶ | 3.09 × 10⁶ | |
| Mixedwood logging residues | 2.45 × 10⁶ | 2.45 × 10⁶ | 2.45 × 10⁶ | 2.45 × 10⁶ | |
| Softwood, natural logging residues | 7.43 × 10⁶ | 7.43 × 10⁶ | 7.43 × 10⁶ | 7.43 × 10⁶ | |
| Softwood, planted logging residues | 1.68 × 10⁶ | 1.68 × 10⁶ | 1.68 × 10⁶ | 1.68 × 10⁶ | |
| Hardwood, lowland whole trees | 0 | 8.31 × 10⁶ | 2.20 × 10⁷ | 2.20 × 10⁷ | |
| Hardwood, upland whole trees | 0 | 1.42 × 10⁷ | 2.73 × 10⁷ | 2.73 × 10⁷ | |
| Whole trees | Mixedwood whole trees | 3.45 × 10⁴ | 2.16 × 10⁶ | 2.33 × 10⁶ | 2.33 × 10⁶ |
| Softwood, natural whole trees | 0 | 1.55 × 10⁷ | 1.98 × 10⁷ | 1.98 × 10⁷ | |
| Softwood, planted whole trees | 0 | 1.49 × 10⁷ | 1.49 × 10⁷ | 1.49 × 10⁷ | |
| Eucalyptus | 0 | 8.50 × 10⁵ | 5.67 × 10⁵ | 4.70 × 10⁵ | |
| Woody energy | Pine | 0 | 1.08 × 10⁵ | 1.55 × 10⁴ | 3.47 × 10³ |
| crops | Poplar | 7.69 × 10⁶ | 4.07 × 10⁷ | 3.75 × 10⁷ | 4.22 × 10⁷ |
| Willow | 6.55 × 10⁶ | 2.28 × 10⁷ | 1.28 × 10⁷ | 6.95 × 10⁶ |
| Feedstock | Production and Harvest | Power Generation | Transportation | Form |
|---|---|---|---|---|
| Barley straw | 73 | 133.9 | 0.1587 | Pellet |
| 0.1785 | Raw | |||
| Biomass sorghum | 107.7 | 133.9 | 0.1587 | Pellet |
| 0.1785 | Raw | |||
| Corn stover | 54.3 | 133.9 | 0.1587 | Pellet |
| 0.1785 | Raw | |||
| Hardwood, lowland logging | 5.2 | 107.4 | 0.1586 | Pellet |
| residues | 0.238 | Raw | ||
| Hardwood, lowland whole | 14.4 | 107.4 | 0.1586 | Pellet |
| trees | 0.238 | Raw | ||
| Hardwood, upland logging | 5.3 | 107.4 | 0.1586 | Pellet |
| residues | 0.238 | Raw | ||
| Hardwood, upland whole | 14.7 | 107.4 | 0.1586 | Pellet |
| trees | 0.238 | Raw | ||
| Miscanthus | 84.9 | 147.4 | 0.1569 | Pellet |
| 0.168 | Raw | |||
| Mixedwood logging residues | 5.2 | 107.4 | 0.1586 | Pellet |
| 0.238 | Raw | |||
| Mixedwood whole trees | 15.2 | 107.4 | 0.1586 | Pellet |
| 0.238 | Raw | |||
| Pine | 123.5 | 191 | 0.1586 | pellet |
| 0.238 | raw | |||
| Poplar | 64.1 | 107.4 | 0.1586 | pellet |
| 0.238 | raw | |||
| Softwood, natural logging | 5.2 | 107.4 | 0.1586 | pellet |
| residues | 0.238 | raw | ||
| Softwood, natural whole | 14.7 | 107.4 | 0.1586 | pellet |
| trees | 0.238 | raw | ||
| Softwood, planted logging | 5.4 | 107.4 | 0.1586 | pellet |
| residues | 0.238 | raw | ||
| Softwood, planted whole | 16.6 | 107.4 | 0.1586 | pellet |
| trees | 0.238 | raw | ||
| Sorghum stubble | 60.5 | 133.9 | 0.1587 | pellet |
| 0.1785 | raw | |||
| Switchgrass | 61.3 | 147.4 | 0.1569 | pellet |
| 0.168 | raw | |||
| Wheat straw | 47.8 | 133.9 | 0.1587 | pellet |
| 0.1785 | raw | |||
| Willow | 129.5 | 107.4 | 0.1586 | pellet |
| 0.238 | raw |
Appendix D. OR-SAGE Model
| Criteria | Exclusion Value |
|---|---|
| Population Density | >195 per km2 |
| Wetlands | No |
| Open Water | No |
| Protected lands | No |
| Slope | >12% |
| Landslide Hazards (moderate or high) | No |
| 100-year floodplain | No |
| Cooling water within 32km | 473,000 L per min |
| Geological formations | Outside saline basin |
| Non-Attainment Areas (EPA) | No |

Appendix E. IECM Model Parameters
| Plant Section | Parameter | Value |
|---|---|---|
| Base Plant | Gross MW | 100 MW to 1500 MW |
| Unit Type | Supercritical | |
| Steam Cycle Heat Rate | 1.047 × 10⁴ kJ/kWh | |
| Boiler Firing Type | Tangential | |
| Boiler Efficiency | 87.5% | |
| Excess Air for Furnace | 20% | |
| Leakage Air at Preheater | 10% | |
| NOx Control | In-Furnace Controls | LNB |
| LNB Actual NOx Removal Efficiency (%) | 44.39% | |
| Hot Side SCR NOx Removal Efficiency | 50% | |
| SO2 Control | Reagent | Limestone |
| Scrubber SO2 Removal Efficiency | 98% | |
| Scrubber SO3 Removal Efficiency | 50% | |
| Particulate Removal Efficiency | 50% | |
| Reagent Stoichiometry | 1.03 mol Ca/mol S | |
| Reagent Purity | 92.4% | |
| CO2 Capture, Transport and Storage | System Used | MEA |
| Compressor Type | 6-stage | |
| CO2 Removal Efficiency | 90% | |
| Sorbent Concentration | 30% | |
| Lean CO2 Loading | 0.2 mol CO2/mol MEA | |
| Sorbent Losses | 2.25 kg/tCO2 | |
| Sorbent Recovered | 0.1985 kg/tCO2 | |
| Liquid to Gas Ratio | 3.29 | |
| Regeneration Heat Requirement | 4529 kJ/kg CO2 | |
| Regeneration Steam Heat Content | 3194 kJ/kg steam | |
| Heat-to-Electricity Efficiency | 18.7% | |
| CO2 Product Pressure | 13.79 MPa | |
| CO2 Compressor Efficiency | 80% | |
| CO2 Unit Compression Energy | 117.9 kWh/tCO2 | |
| CO2 Transport Method | Pipeline | |
| CO2 Storage Method | Geologic | |
| Pipeline Length | 100 m | |
| Booster Pump Efficiency | 75% | |
| Min Outlet Pressure | 10.39 | |
| Reservoir Depth | 1219 m | |
| Reservoir Thickness | 304 m | |
| Reservoir Horizontal Permeability | 100 mD | |
| Reservoir Porosity | 12% | |
| Performance Model | Law and Bachu |
| Plant Section | Parameter | Value |
|---|---|---|
| Overall Plant | Number of Turbines | 1 to 5 |
| Capacity Factor | 90% | |
| Ambient Air Temperature | 18.89 °C | |
| Air Separation Unit | Oxidation O2% | 95% |
| Oxidation Ar% Efficiency | 4.24% | |
| Oxidation N2% | 0.76% | |
| Unit Separation Energy | 6860 kWh/tonne | |
| Gasifier Area | Gasifier Temperature | 1343 °C |
| Gasifier Pressure | 44.24 MPa | |
| Total Water Input | 1.274 mol H2O/mol C | |
| Carbon in Slag | 3% | |
| Sulfur Removal | COS to H2S Conversion Efficiency | 98.5% |
| H2S removal Efficiency | 98% | |
| COS Removal Efficiency | 33% | |
| CO2 Removal Efficiency | 0% | |
| Claus Plant S Removal Efficiency | 95% | |
| Claus Plant S capacity | 4.5 tonne/hr | |
| Claus Plant Power Required | 0.7% MWgross | |
| Tailgas S Recovered | 99% | |
| Tailgas Power Required | 0.2% MWgross | |
| CO2 Capture, Transport and Storage | WGSR CO to CO2 Conversion | 95% |
| WGSR COS to H2S Conversion | 98.5% | |
| WGSR Steam Added | 0.99 mol H2O/mol CO | |
| WGSR Capacity | 140 tonne CO2/h | |
| WGSR Thermal Energy Credit | 117.9 kWh/tCO2 | |
| Selexol CO2 Removal Efficiency | 95% | |
| Selexol H2S Removal Efficiency | 94% | |
| Syngas Capacity | 287 tonne CO2/h | |
| CO2 Product Pressure | 13.79 MPa | |
| CO2 Compressor Efficiency | 80% | |
| CO2 Unit Compression Energy | 117.9 kWh/tCO2 | |
| CO2 Transport Method | Pipeline | |
| CO2 Storage Method | Geologic | |
| Pipeline Length | 100 m | |
| Booster Pump Efficiency | 75% | |
| Min Outlet Pressure | 10.39 | |
| Reservoir Depth | 1219 m | |
| Reservoir Thickness | 304 m | |
| Reservoir Horizontal Permeability | 100 mD | |
| Reservoir Porosity | 12% | |
| Performance Model | Law and Bachu | |
| Power Block | Gas Turbine Model | GE 7FB |
| Number of Gas Turbines | 1–5 | |
| Flue Gas Moisture Content | 33% | |
| Turbine Inlet Temperature | 1371 °C | |
| Air Compressor Pressure Ratio | 18.5 (outlet:inlet) | |
| Air Compressor Adiabatic Compressor Efficiency | 87.5% | |
| Combustor Inlet Pressure | 1.875 MPa |
References
- Aaron, D.; Tsouris, C. Separation of CO2 from flue gas: A review. Sep. Sci. Technol. 2005, 40, 321–348. [Google Scholar] [CrossRef]
- Bolton, S.; Kasturi, A.; Palko, S.; Lai, C.; Love, L.; Parks, J.; Xin, S.; Tsouris, C. 3D printed structures for optimized carbon capture technology in packed bed columns. Sep. Sci. Technol. 2019, 54, 2047–2058. [Google Scholar] [CrossRef]
- EPA. Sources of Greenhouse Gas Emissions. Agency. 2019. Available online: https://www.epa.gov/ghgemissions/sources-greenhouse-gas-emissions (accessed on 1 March 2021).
- U.S. Energy Information Administration (EIA). U.S. Energy-Related Carbon Dioxide Emissions; U.S. Energy Information Administration (EIA): Washington, DC, USA, 2019.
- EPA. Inventory of US Greenhouse Emissions and Sinks. Agency. 2019. Available online: https://www.epa.gov/ghgemissions/inventory-us-greenhouse-gas-emissions-and-sinks-1990-2019 (accessed on 1 March 2021).
- DOE. Iron and Steel Sector (NAICS 3311 and 3312) Energy and GHG Combustion Emissions Profile; US Department of Energy: Washington, DC, USA, 2012.
- IPCC. Special Report on Global Warming of 1.5 °C; Intergovernmental Panel on Climate Change: Geneva, Switzerland, 2019. [Google Scholar]
- Fajardy, M.; Mac Dowell, N. Can BECCS deliver sustainable and resource efficient negative emissions? Energy Environ. Sci. 2017, 10, 1389–1426. [Google Scholar] [CrossRef]
- Emenike, O.; Michailos, S.; Finney, K.N.; Hughes, K.J.; Ingham, D.; Pourkashanian, M. Initial techno-economic screening of BECCS technologies in power generation for a range of biomass feedstock. Sustain. Energy Technol. Assess. 2020, 40, 100743. [Google Scholar] [CrossRef]
- Strauss, W. Industrial wood pellet fuel in pulverized coal power plants a rational, pragmatic, and easy to implement solution for transitioning toward a zero coal future in Alberta. In Proceedings of the Compliance Strategies and New Development Opportunities, Calgary, AB, Canada, 26–27 September 2016. [Google Scholar]
- Langholtz, M.; Busch, I.; Kasturi, A.; Hilliard, M.; McFarlane, J.; Tsouris, C.; Mukherjee, S.; Omitaomu, O.; Kotikot, S.; Allen-Dumas, M.; et al. The economic accessibility of CO2 sequestration through bioenergy with carbon capture and storage (BECCS) in the US. Land 2020, 9, 299. [Google Scholar] [CrossRef]
- Baik, E.; Sanchez, D.L.; Turner, P.A.; Mach, K.J.; Field, C.B.; Benson, S.M. Geospatial analysis of near-term potential for carbon-negative bioenergy in the United States. Proc. Natl. Acad. Sci. USA 2018, 115, 3290–3295. [Google Scholar] [CrossRef] [PubMed]
- Köberle, A.C. The value of BECCS in IAMs: A review. Curr. Sustain. Energy Rep. 2019, 6, 107–115. [Google Scholar] [CrossRef]
- Shahbaz, M.; AlNouss, A.; Ghiat, I.; Mckay, G.; Mackey, H.; Elkhalifa, S.; Al-Ansari, T. A comprehensive review of biomass based thermochemical conversion technologies integrated with CO2 capture and utilisation within BECCS networks. Resour. Conserv. Recycl. 2021, 173, 105734. [Google Scholar] [CrossRef]
- Inayat, M.; Sulaiman, S.A.; Shahbaz, M.; Bhayo, B.A. Application of response surface methodology in catalytic co-gasification of palm wastes for bioenergy conversion using mineral catalysts. Biomass-Bioenergy 2020, 132, 105418. [Google Scholar] [CrossRef]
- Chan, Y.H.; Cheah, K.W.; How, B.S.; Loy, A.C.M.; Shahbaz, M.; Singh, H.K.G.; Yusuf, N.R.; Shuhaili, A.F.A.; Yusup, S.; Ghani, W.A.W.A.K.; et al. An overview of biomass thermochemical conversion technologies in Malaysia. Sci. Total. Environ. 2019, 680, 105–123. [Google Scholar] [CrossRef] [PubMed]
- Puig-Arnavat, M.; Bruno, J.C.; Coronas, A. Review and analysis of biomass gasification models. Renew. Sustain. Energy Rev. 2010, 14, 2841–2851. [Google Scholar] [CrossRef]
- Basu, P. Biomass Gasification and Pyrolysis: Practical Design and Theory; Academic Press: Cambridge, MA, USA, 2010. [Google Scholar]
- Fajardy, M.; Morris, J.; Gurgel, A.; Herzog, H.; Mac Dowell, N.; Paltsev, S. The economics of bioenergy with carbon capture and storage (BECCS) deployment in a 1.5 °C or 2 °C world. Glob. Environ. Chang. 2021, 68, 102262. [Google Scholar] [CrossRef]
- Mays, G.T.; Belles, R.; Blevins, B.R.; Hadley, S.W.; Harrison, T.J.; Jochem, W.C.; Neish, B.S.; Omitaomu, O.A.; Rose, A.N. Application of Spatial Data Modeling and Geographical Information Systems (GIS) for Identification of Potential Siting Options for Various Electrical Generation Sources ORNL/TM-2011/157; Oak Ridge National Laboratory: Oak Ridge, TN, USA, 2012.
- Phyllis, E.C.N. Database for Biomass and Waste; Energy Research Centre: Petten, The Netherlands, 2012. [Google Scholar]
- Lautala, P.T.; Hilliard, M.R.; Webb, E.; Busch, I.; Hess, J.R.; Roni, M.S.; Hilbert, J.; Handler, R.; Bittencourt, R.; Valente, A.; et al. Opportunities and challenges in the design and analysis of biomass supply chains. Environ. Manag. 2015, 56, 1397–1415. [Google Scholar] [CrossRef] [PubMed]
- CMU. Integrated Environmental Control Model (IECM). 2020. Available online: https://www.cmu.edu/epp/iecm/ (accessed on 1 March 2020).
- Simbeck, D.; Beecy, D. The CCS paradox: The much higher CO2 avoidance costs of existing versus new fossil fuel power plants. Energy Procedia 2011, 4, 1917–1924. [Google Scholar] [CrossRef][Green Version]
- Xu, G.; Jin, H.; Yang, Y.; Xu, Y.; Lin, H.; Duan, L. A comprehensive techno-economic analysis method for power generation systems with CO2 capture. Int. J. Energy Res. 2010, 34, 321–332. [Google Scholar] [CrossRef]
- Metz, B. Carbon Dioxide Capture and Storage: IPCC Special Report. Summary for Policymakers, a Report of Working Group III of the IPCC; and, Technical Summary, a Report Accepted by Working Group III of the IPCC But Not Approved in Detail; World Meteorological Organization: Geneva, Switzerland, 2006. [Google Scholar]
- Rubin, E.S. Understanding the pitfalls of CCS cost estimates. Int. J. Greenh. Gas. Control. 2012, 10, 181–190. [Google Scholar] [CrossRef]
- EPA. Emerging Technologies for Reducing Greenhouse Gas Emissions from Coal-Fired Electric Generating Units; EPA: Triangle Park, NC, USA, 2010; p. 27711.
- Irlam, L. The Costs of CCS and Other Low-Carbon Technologies in the United States: 2015 Update Report; Global Carbon Capture and Storage Institute: Canberra, Australia, 2015; p. 19. [Google Scholar]
- Peng, J.; Bi, X.; Sokhansanj, S.; Lim, C. Torrefaction and densification of different species of softwood residues. Fuel 2013, 111, 411–421. [Google Scholar] [CrossRef]
- Carbo, M.C.; Smit, R.; van der Drift, B.; Jansen, D. Bio energy with CCS (BECCS): Large potential for BioSNG at low CO2 avoidance cost. Energy Procedia 2011, 4, 2950–2954. [Google Scholar] [CrossRef]
- Yang, L.; Ge, X. Chapter three-biogas and syngas upgrading. In Advances in Bioenergy; Li, Y., Ge, X., Eds.; Elsevier: Amsterdam, The Netherlands, 2016; Volume 1, pp. 125–188. [Google Scholar]
- Grubert, E. Fossil electricity retirement deadlines for a just transition. Science 2020, 370, 1171–1173. [Google Scholar] [CrossRef] [PubMed]


| Scenario | Name | Power Generation | Feedstock Type |
|---|---|---|---|
| 1 | PBC Pelletized | PC | Pelletized |
| 2 | IBGCC Non-pelletized | IGCC | Non-pelletized |
| 3 | IBGCC Pelletized | IGCC | Pelletized |
| Scenario | Name | Power Generation |
|---|---|---|
| 1 | PCC | Cost and efficiency losses of adding BECCS to a PCC power plant that does not previously have CCS. |
| 2 | NGCC | Cost and efficiency losses of changing power generation technologies and adding BECCS to a natural gas power plant that does not formerly have CCS. |
| 3 | PBC | Cost of implementing CCS in PBC plants. The feedstocks used by the reference case plant and BECCS plant have identical rates of atmospheric CO2 fixation. |
| 4 | IBGCC | Cost of adding CCS to IBGCC. The timescale for feedstock CO2 sequestration is the same for both cases. |
| Neutral Emissions Technology | Estimated Cost ($/tonne of CO2) |
|---|---|
| Wind Onshore | −16–19 |
| Geothermal | −31–66 |
| Nuclear | 8–28 |
| Coal with CCS | 48–109 |
| Wind offshore | 96–177 |
| Solar Photovoltaic | 101–205 |
| Solar Thermal | 108–181 |
| Reference Case | Power Generation Technology (without CCS) | Range of CAC ($ per tonne of CO2) |
|---|---|---|
| 1 | PCC | IBGCC Pelletized: 42–73 IBGCC Non-pelletized: 45–73 PBC Pelletized: 45–58 |
| 2 | NGCC | IBGCC Pelletized: 53–93 IBGCC Non-pelletized: 59–93 PBC Pelletized: 47–64 |
| 3 | PBC | IBGCC Pelletized: 46–97 IBGCC Non-pelletized: 53–97 PBC Pelletized: 39–61 |
| 4 | IBGCC | IBGCC Pelletized: 21–74 IBGCC Non-pelletized: 29–73 PBC Pelletized: 21–44 |
Publisher’s Note: MDPI stays neutral with regard to jurisdictional claims in published maps and institutional affiliations. |
© 2021 by the authors. Licensee MDPI, Basel, Switzerland. This article is an open access article distributed under the terms and conditions of the Creative Commons Attribution (CC BY) license (https://creativecommons.org/licenses/by/4.0/).
Share and Cite
Kasturi, A.; Yiacoumi, S.; Langholtz, M.; McFarlane, J.; Busch, I.; Hilliard, M.; Tsouris, C. Comparison of Long-Term Bioenergy with Carbon Capture and Storage to Reference Power Generation Technologies Using CO2 Avoidance Cost in the U.S. Energies 2021, 14, 7026. https://doi.org/10.3390/en14217026
Kasturi A, Yiacoumi S, Langholtz M, McFarlane J, Busch I, Hilliard M, Tsouris C. Comparison of Long-Term Bioenergy with Carbon Capture and Storage to Reference Power Generation Technologies Using CO2 Avoidance Cost in the U.S. Energies. 2021; 14(21):7026. https://doi.org/10.3390/en14217026
Chicago/Turabian StyleKasturi, Abishek, Sotira Yiacoumi, Matthew Langholtz, Joanna McFarlane, Ingrid Busch, Michael Hilliard, and Costas Tsouris. 2021. "Comparison of Long-Term Bioenergy with Carbon Capture and Storage to Reference Power Generation Technologies Using CO2 Avoidance Cost in the U.S." Energies 14, no. 21: 7026. https://doi.org/10.3390/en14217026
APA StyleKasturi, A., Yiacoumi, S., Langholtz, M., McFarlane, J., Busch, I., Hilliard, M., & Tsouris, C. (2021). Comparison of Long-Term Bioenergy with Carbon Capture and Storage to Reference Power Generation Technologies Using CO2 Avoidance Cost in the U.S. Energies, 14(21), 7026. https://doi.org/10.3390/en14217026