Article

Analysis of the Possibilities of Selective Detection of a Single Line-to-Ground Fault in a Medium Voltage Network with Isolated Neutral

1
Department of Fundamental Physics for Engineers, Politehnica University, 300006 Timisoara, Romania
2
Department of Computer Sciences and Electrical Engineering, Lucian Blaga University, 550024 Sibiu, Romania
*
Author to whom correspondence should be addressed.
Energies 2021, 14(21), 7019; https://doi.org/10.3390/en14217019
Submission received: 14 September 2021 / Revised: 9 October 2021 / Accepted: 21 October 2021 / Published: 26 October 2021

Abstract

:
The paper analyses how the characteristics of the medium-voltage network with insulated neutral and the conditions under which the single line-to-ground fault occurs (insulation condition and value of the fault resistance) influence the zero-sequence components of the voltage of the transformer station medium-voltage bus bar, the fault current, the currents of the faulted line and the currents of the other non-faulted power lines connected to the transformer station bus bars. Assuming the waveform of the medium voltage bus voltages in the transformer station is known, the influence of the fault resistance on the total distortion coefficient of the fault current is analysed. This establishes the conditions under which a single line-to-ground fault can be detected by controlling the total distortion coefficient of the fault current and the currents of the fault-free lines. It also examines the conditions under which a single line-to-ground fault can be selectively detected by checking the effective value and direction of flow of the zero-sequence currents of the medium-voltage lines during the fault. The results obtained by the calculation were verified experimentally in the medium voltage network considered in the study. The acceptable differences, considering the degree of accuracy with which the parameters of a medium voltage network are known, between the results obtained by calculation and those obtained experimentally show that the simplifying assumptions accepted for the mathematical models used in the calculation are correct.

1. Introduction

Medium-voltage power grids extend over long distances, which is why the number of faults in these grids is very high. Most faults in medium-voltage electrical networks are single line-to-ground type [1,2,3,4,5]. In [6] it is stated that 70–90% of the total faults are single line-to-ground faults and in [7,8] it is stated that 80% of the total faults are single line-to-ground faults. This justifies the fact that the possibility of selective detection of this type of fault is discussed in many papers. The detection of a single line-to-ground fault in a medium voltage network with isolated neutral is most often performed using a voltage relay which controls the effective value of the zero-sequence voltage of the medium voltage bars in the transformer station. The detection of the medium voltage line on which the defect is made is performed by the consecutive disconnection of the medium voltage lines from the source. This process is complicated and requires many circuit breaker actuations, especially when the number of medium voltage lines connected to the same bus-bar system is large. During an ideal single line-to-ground fault (the value of the resistance at the fault location is zero) the voltage of the fault-free phases increases √3 times, which is why there is a risk that the fault will turn into a multiple fault with important consequences on the network but also on continuity of the supply to consumers. For this reason it is important that the detection of such a defect be done selectively and in a short time. Various methods for selective detection of such a defect that are based on signal processing methods are presented in the literature (Fourier transform, wavelet transform, analysis of the transient regime caused by the fault, etc). In previous works [9,10,11], protection schemes using a wavelet transform are proposed for the analysis of the time-varying shape of voltages and currents during the fault duration, and in [12] a centralized protection scheme that controls the harmonic content of the zero-sequence component of the medium voltage bus voltage and zero-sequence currents of medium voltage power lines is proposed. In [13] the transient regime caused by the fault is analysed for single line-to-ground fault detection.
From the point of view of the operation of medium-voltage electrical networks, it is very important that these faults be detected at an early stage when the resistance at the fault site is high. In this regard, in [14,15,16] the possibilities of selective detection of a single line-to-ground fault in the case where the resistance at the fault site has a large value are analysed, highlighting the difficulties of this approach. In [17] the possibility of detecting a single line-to-ground fault in a medium voltage network is investigated by comparing the waveform of the faulted phase current with the waveforms of the non-faulted phase currents. Using this method, it is possible to detect faults where the resistance at the fault site has a value less than 2000 Ω. In [18,19] multicriteria algorithms for selective phase-to-ground fault line detection in medium voltage networks having isolated neutral are presented. The wide variety of solutions designed for single line-to-ground fault detection reveals the importance of solving this problem from the point of view of the operation of medium-voltage electrical networks, as well as the fact that the solutions presented in the literature do not fully meet the requirements of the protections used for single line-to-ground fault detection.
The aim of the paper is to prove that the protections of medium voltage networks with isolated neutral that use as parameter for the selective detection of a single phase-to-ground fault the harmonic content of the fault current (total distortion coefficient of the fault current) for the analysis of the transient regime caused by the fault do not have operating conditions when the value of the resistance at the fault location is high (over 1000 Ω) and the protection that selectively detects such a fault using as control quantity the actual value and direction of zero sequence current of the connected lines at the medium voltage bar in the transformer station can detect such a fault and if the value of the resistance at the fault location is 10,000 Ω. This paper proposes a method for selective detection of the single line-to-ground faults which consists in controlling the effective value and the direction of the zero sequence currents of the medium voltage lines connected to the medium voltage bus-bars of the transformer station. Using this method the detection of the fault is safe because the direction of the zero sequence currents of the fault-free lines is inverse than in the direction of the zero-sequence current of the line with fault. For this analysis, a 20 kV electrical network was considered, a network in which experimental determinations were performed to verify the results obtained by calculation. In the study, a medium voltage network with isolated neutral with a total capacitive current ( I c 0 ) of 18.15 A (experimentally determined value) was considered. Figure 1 shows a simplified schematic of the medium voltage network under analysis. The meaning of the notations in Figure 1 is presented in Table 1.
In Figure 1, the resistances R i s 2 ,   R i s 3 ,   R i s 4 , and the capacitances C p h 2 ,   C p h 3 ,   C p h 4 have not been represented because they are connected in the same way as the resistor R i s 1 , respectively capacitance C p h 1 .
The paper analyzes how the total distortion coefficient of the fault current is influenced by the value of the resistance at the fault location ( R t ). The value of the resistance at the fault site changes during the fault. Usually this resistance has a high value at the beginning of the defect and decreases as it develops. For this reason, it is desirable that the fault be selectively detected or at least initially detected in order to intervene before the resistance at the fault site obtains a very low value. As the resistance at the fault site decreases, the voltage of the without fault phases increases, which can lead to the transformation of the fault into a multiple one, with important consequences on the medium voltage network and on the supply of power to consumers. The maximum value of the resistance at the fault location at which the protection must function correctly is not unique. This depends on the value of the resistance equivalent to the losses of active power in the insulation of the medium voltage network (resistance Ris1, …, Ris5 in Figure 1). Thus in [20] this value is 1000 Ω, in [17] the value is 2000 Ω, in [21] 5000 Ω, and in [22] 100,000 Ω. Considering the fact that in the case of the network analyzed in the paper, the value of the resistance equivalent to the resistances Ris1, …, Ris5 in Figure 1 is 19,829 Ω, we considered the maximum value of the resistance at the fault location 10,000 Ω. Resistance values at the fault location are 3.5 Ω, 50 Ω, 100 Ω, 1000 Ω, 5000 Ω and 10,000 Ω. The value of 3.5 Ω of the resistance at the fault location was chosen because the safety earth terminal of the pole at which the fault was caused in the 20 kV network had this value. In the experimental determinations, resistances of 5000 Ω and 10,000 Ω were introduced at the fault site, respectively, which is why these values were taken into account in the calculations performed. Thus, the results obtained by calculation could be compared with those obtained by measurements in the 20 kV network. This analysis allows us to ascertain the conditions under which the protections that analyze the waveform of voltages and currents and establish that the transient regimes caused by a single line-to-ground fault have correct operation conditions, respectively. It also analyzes how the state of the insulation of the medium voltage network influences the phase-to-earth fault current. To characterize the insulation state, the insulation loss angle (δ) [23] is used, for which the values δ = 0 (perfect insulation) and δ = 5.12⁰ (experimentally determined value for the analyzed medium voltage network) were considered. The paper also analyzes the dependence of the grid equivalent impedance of 20 kV as a function of frequency (f) and the resistance to switch to the fault location ( R t ). It is considered that the frequency varies from 0 to 1000 Hz, so harmonics of order greater than 20 are neglected.
Concerning the main criteria that should be taken into account when establishing a solution for neutral grounding of medium voltage networks, the regulation adopted in Romania is presented in [24,25].
When special consumers, which do cannot tolerate electric power supply interruptions, are connected to the network, the solutions for neutral grounding should allow, in case of single phase-to-ground fault, the operation of the network on a limited period of time, necessary for consumers to take appropriate measures to eliminate the possible consequences of the interruptions. Accordingly, depending on the value of the short-circuit current, there are two options to be taken into consideration: isolated neutral or arc-suppression coil grounding. If the ground fault capacitive current does not exceed 10 A, the network can operate with isolated neutral. On the other hand, if the ground fault capacitive current exceeds 10 A, the solution of the neutral grounding via resistor or arc-suppression coil grounding.

2. Materials and Methods

Numerical models for the analysis of transient regimes caused by a phase-to-earth fault in a medium voltage network are presented in [8,26]. Because the aperiodic component that intervenes in the waveforms of voltages and currents is damped after 10–30 ms (depending on the characteristics of the network and the value of resistance at the fault location), and the disconnection from the source the fault line is made after 0.5–1 s from the occurrence of the defect, the waveforms of voltages and currents become sinusoidal, so the defect can be analyzed using the method of symmetrical components.
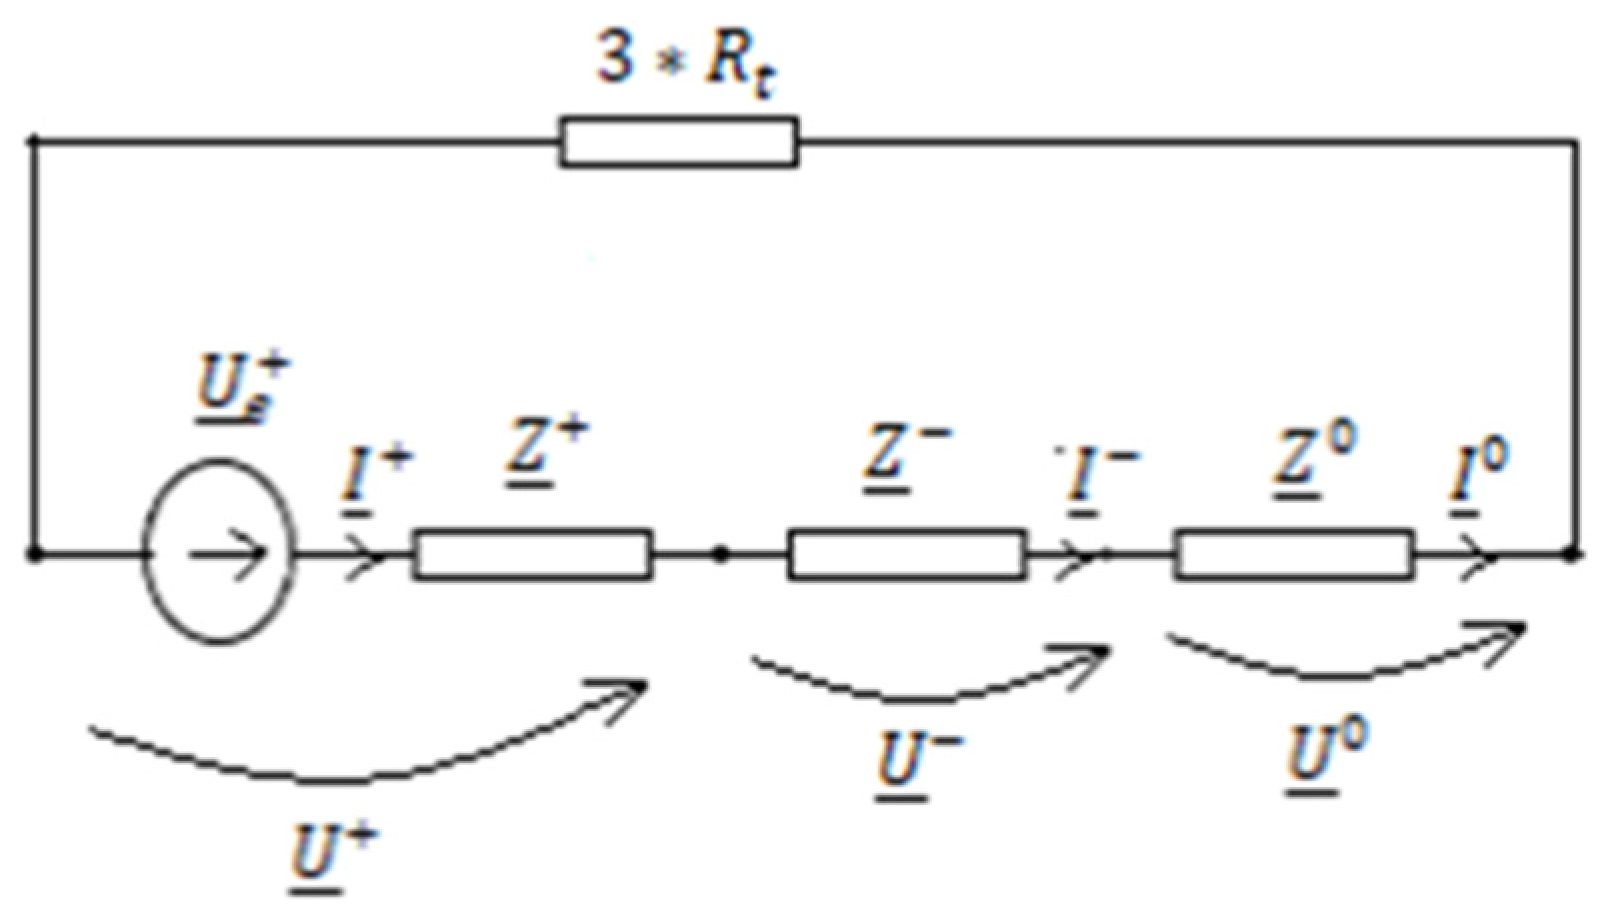
In the case of the line-to-ground fault the sequence networks are connected in series ([24], pp. 373–334, [27], pp. 421–471, [28], pp. 474–507).
It follows from the conditions imposed at the fault site that the sequence components of the currents at the fault site satisfy the relationship (1):
I _ 0 = I _ + = I _
The equivalent diagram of the medium voltage network in which the single line-to-ground fault occurs is shown in Figure 2.
The meaning of the notations in Figure 1 is presented in Table 1. U _ e + —represents the positive-sequence component of the three-phase system voltages at the fault location in the absence of the fault;   Z _ + —represents the positive-sequence impedance seen from the fault location in the absence of the fault; Z _ —represents the negative-sequence impedance seen from the fault location in the absence of the fault; Z _ 0 —represents the zero-sequence impedance seen from the fault location in the absence of the fault.
In the literature it is accepted (in most cases) that the three-phase system of voltages at the fault site in the absence of the fault is symmetrical, so the zero-sequence component of the three-phase system of voltages is equal to the phase voltage. As a result the following relationship is satisfied:
U _ e + = U _ p h = U p h
The scheme shown in Figure 2 gives the sequence current expressions:
I _ 0 = I _ + = I _ = U _ e + Z _ + + Z _ + Z _ 0 + 3 × R t = U p h Z _ + + Z _ + Z _ 0 + 3 × R t
I _ d = 3 × I _ 0
As a result, the value of the fault current is inversely proportional to the equivalent impedance of the three series-connected sequence impedances seen from the fault site (Figure 2). Figure 3 shows the equivalent circuit diagram in symmetrical components of the 20 kV medium voltage network from Figure 1. The meaning of the notations in Figure 3 is presented in Table 2.
From Figure 3 for the sequence impedances the following expressions are obtained:
Z _ + = Z _ L 5 + + Z _ T r + × Z _ U T + Z _ T r + + Z _ U T +
Z _ = Z _ L 5 + Z _ T r × Z _ U T Z _ T r + Z _ U T +
Z _ 0 = Z _ L 5 0 + R i s × ( j X c 0 ) R i s j X c 0
The equivalent impedance ( Z _ e ) of the circuit in Figure 3 with respect to the source terminals is expressed by the following relation:
Z _ e = Z _ + + Z _ + Z _ 0 + 3 × R t Z _ e = Z _ L 5 + + Z _ T r + × Z _ U T + Z _ T r + + Z _ U T + + Z _ L 5 + Z _ T r × Z _ U T Z _ T r + Z _ U T + + Z _ L 5 0 + R i s × ( j X c 0 ) R i s j X c 0 + 3 × R t
The expression of sequence impedances as a function of frequency are:
Z _ + ( f ) = R L 5 + j 2 π f × L L 5 + ( R T r + j 2 π f × L T r ) × ( R U T + j 2 π f × L U T ) R T r + R U T + j 2 π f ( L T r + L U T )
Z _ ( f ) = R L 5 + j 2 π f × L L 5 + ( R T r + j 2 π f × L T r ) × ( R U T + j 2 π f × L U T ) R T r + R U T + j 2 π f ( L T r + L U T )
Z _ 0 ( f ) = R L 5 0 + j 2 π f × L L 5 0 + R i s ( 1 j 2 π f × 3 × C p h ) R i s + 1 j 2 π f × 3 × C p h
The equivalent impedance expression as a function of frequency is:
Z _ e ( f ) = Z _ + ( f ) + Z _ ( f ) + Z _ 0 ( f ) + 3 R t
The zero-sequence voltage of the 20 kV bus bars in the transformer station (Figure 1) is expressed by the following relation:
U _ b 0 = R i s ( 1 j 2 π f × 3 × C p h ) R i s + 1 j 2 π f × 3 × C p h × I _ 0
The zero-sequence currents closing through fault-free medium-voltage lines are expressed by the following relations:
I _ 1 0 = U _ b 0 R i s 1 ( 1 j 2 π f × 3 × C p h 1 ) R i s 1 + 1 j 2 π f × 3 × C p h 1 ;             I _ 1 = 3 × I _ 1 0
I _ 2 0 = U _ b 0 R i s 2 ( 1 j 2 π f × 3 × C p h 2 ) R i s 2 + 1 j 2 π f × 3 × C p h 2 ;             I _ 2 = 3 × I _ 2 0
I _ 3 0 = U _ b 0 R i s 3 ( 1 j 2 π f × 3 × C p h 3 ) R i s 3 + 1 j 2 π f × 3 × C p h 3 ;             I _ 3 = 3 × I _ 3 0
I _ 4 0 = U _ b 0 R i s 4 ( 1 j 2 π f × 3 × C p h 4 ) R i s 4 + 1 j 2 π f × 3 × C p h 4 ;             I _ 4 = 3 × I _ 4 0
Knowing the values of the parameters involved in relations (4)–(11), the equivalent impedance ( Z _ e ), the fault current, the zero-sequence currents of the fault-free lines, currents in medium voltage lines without fault during fault ( I _ 1 ,   I _ 2 ,   I _ 3 ,   I _ 4 ) and the zero-sequence voltage of the 20 kV bus bars in the transformer station are calculated. Also, from relation (11) and from relations (8)–(10), the dependence of the equivalent impedance ( Z _ e ) and sequence impedances ( Z _ + ,   Z _ ,   Z _ 0 ) on frequency is determined.

3. Numerical Results

Calculation of sequence impedances, currents I _ 0 —zero sequence current of faulted line L 5 —from Figure 1, I _ 1 0 —zero sequence current of non-faulted line L 1 from Figure 1, I _ 2 0 —zero sequence current of non-faulted line L 2 from Figure 1, I _ 3 0 —zero sequence current of non-faulted line L 3 from Figure 1, I _ 4 0 —the zero sequence current of the fault-free line L 4 in Figure 1, and the voltage U _ b 0 —the zero sequence voltage of the 20 kV busbar in the transformer station in Figure 1, requires knowledge of the values of the sequence parameters of the elements involved in the scheme in Figure 2. Knowing the zero sequence currents, the fault current ( I _ d ) is calculated, respectively the currents flowing through the fault-free lines during the fault ( I _ 1 ,   I _ 2 ,   I _ 3 ,   I _ 4 ) . The values of these parameters are shown in Table 3 and Table 4, respectively.

3.1. Dependence of Equivalent Impedance ( Z _ e ) on Frequency

The dependence of equivalent impedance ( Z _ e ) on frequency is expressed by the relation (11). The dependence of sequence impedances on frequency is expressed by relations (8)—for the positive-sequence, (9)—for the negative-sequence, (10)—for the zero-sequence. To analyse the influence of frequency on the equivalent impedance ( Z _ e ), the frequency is assumed to range from 0 to 1000 Hz, i.e., harmonics up to order 20 are considered.
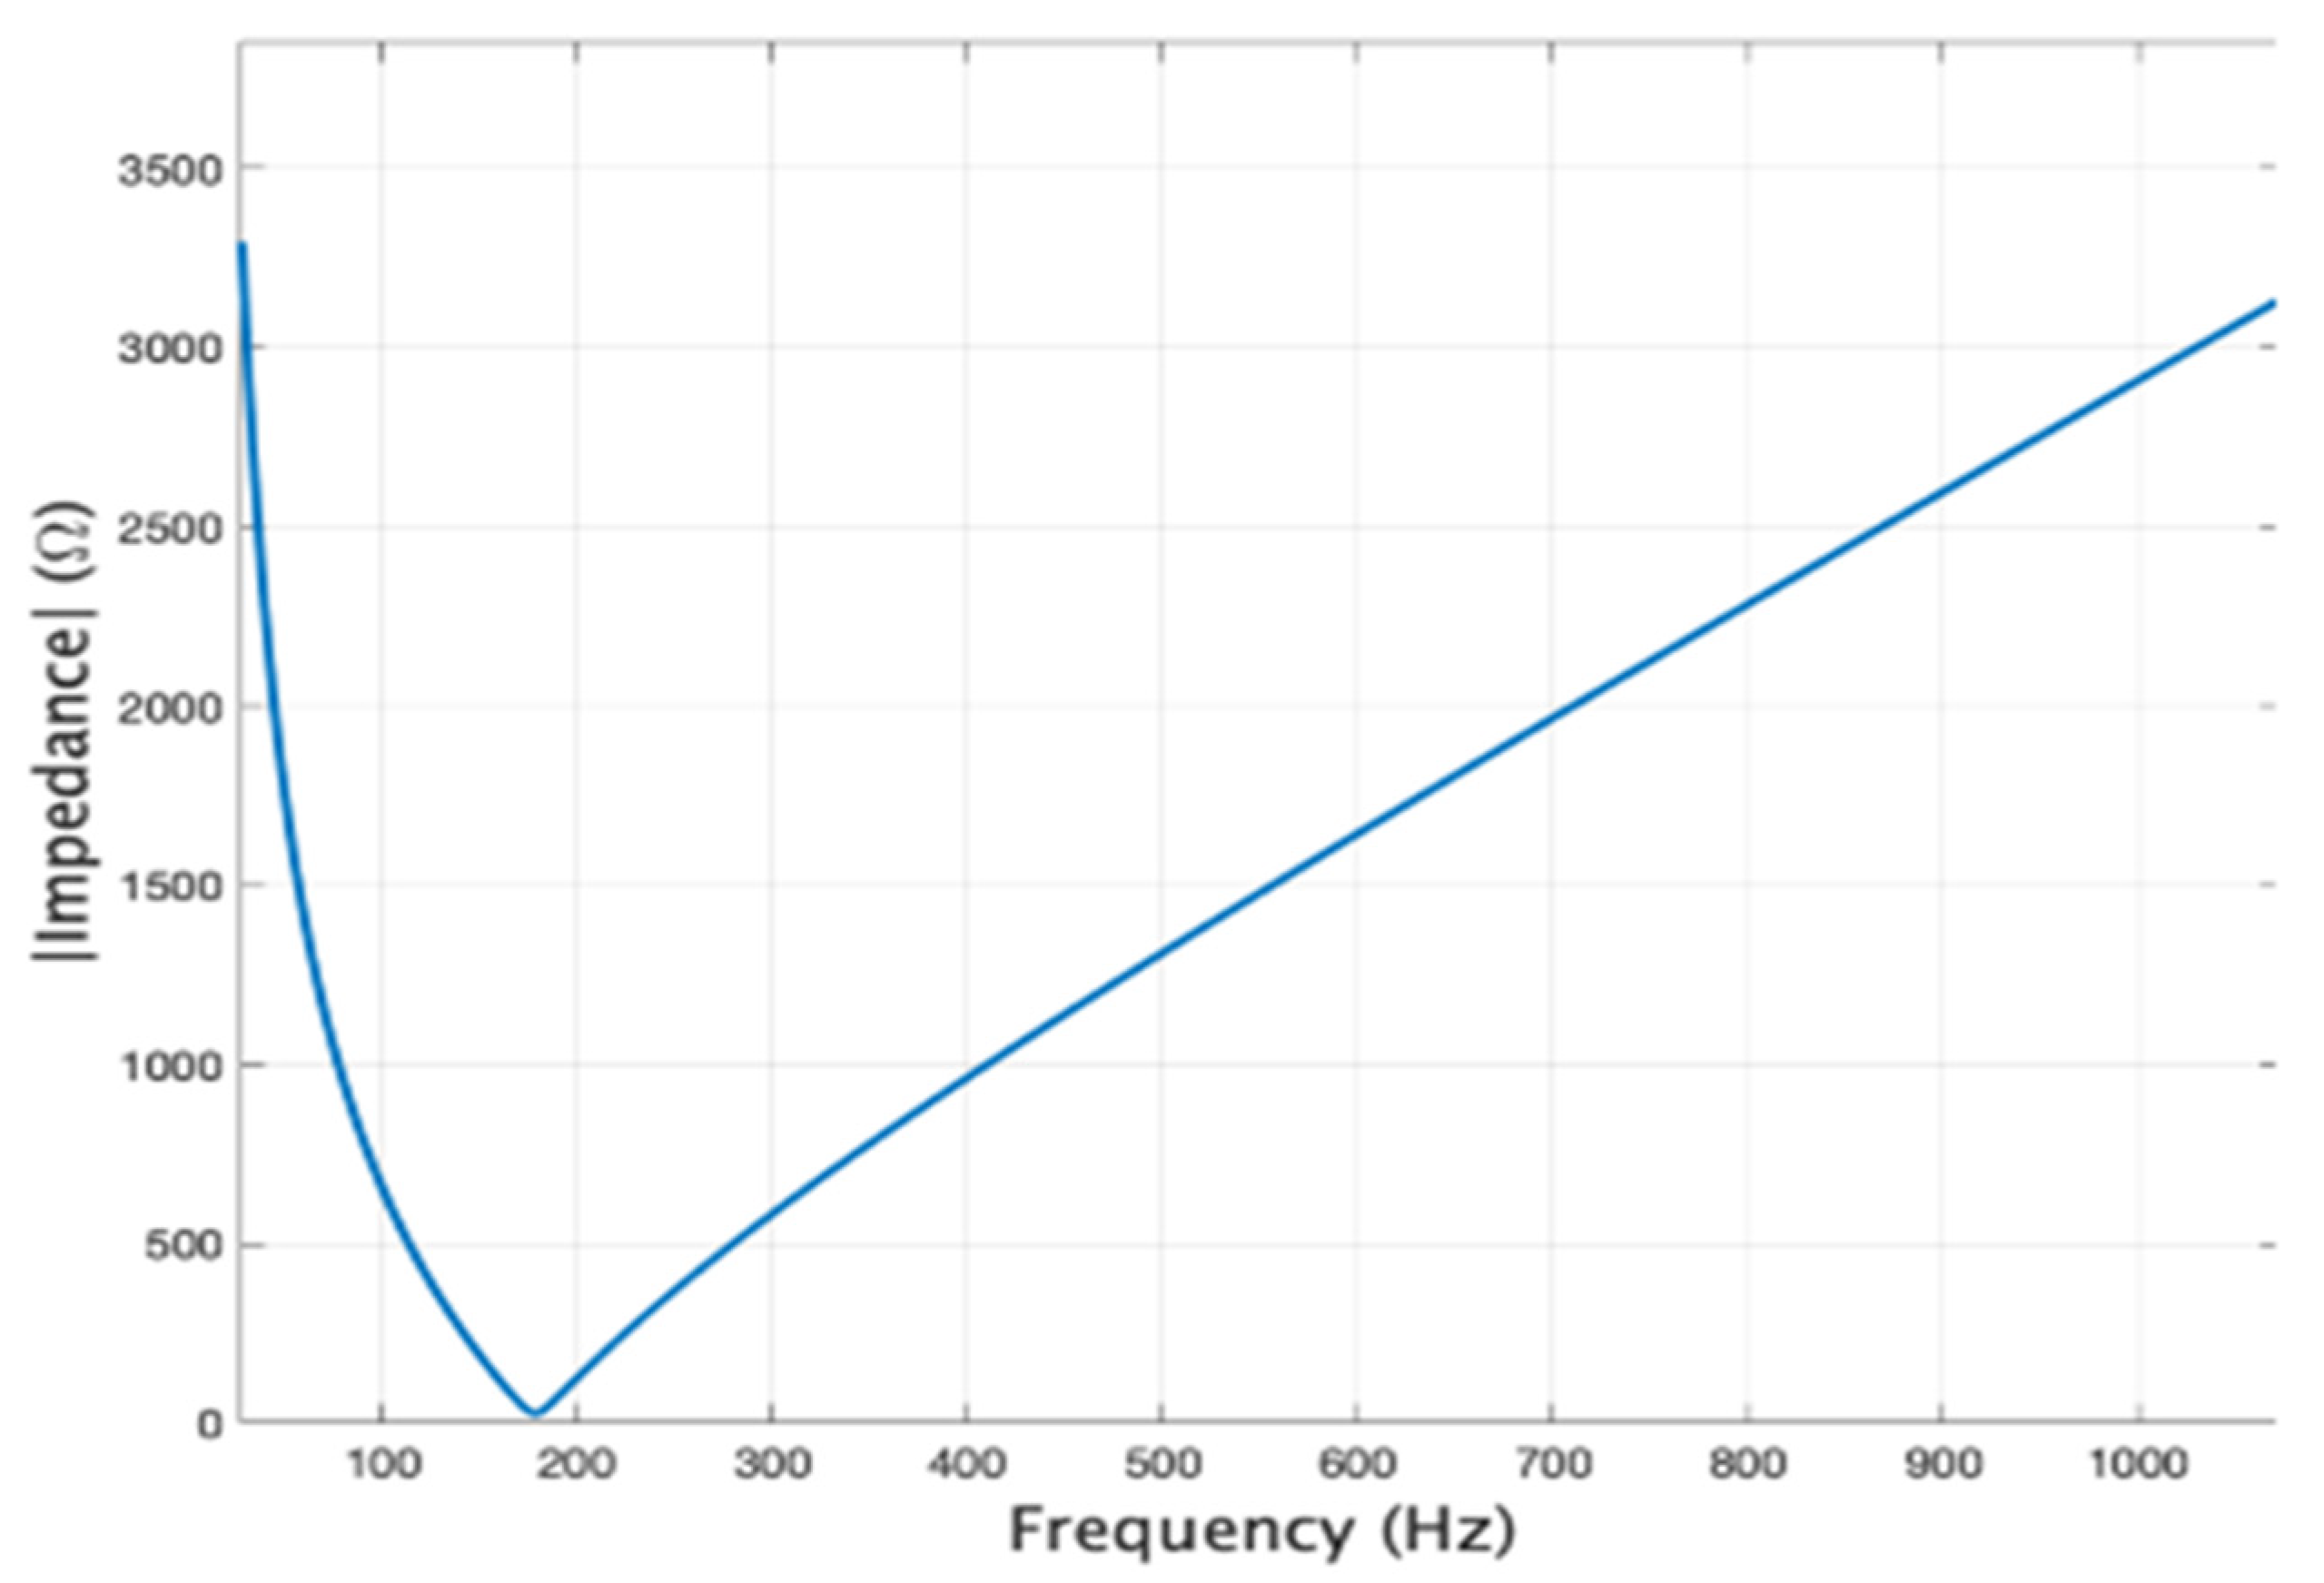
Using the MATLAB programming environment, the dependence of the equivalent impedance value ( Z _ e ) as a function of frequency was plotted by considering different values for the fault site resistance ( R t ): 3.5 Ω (
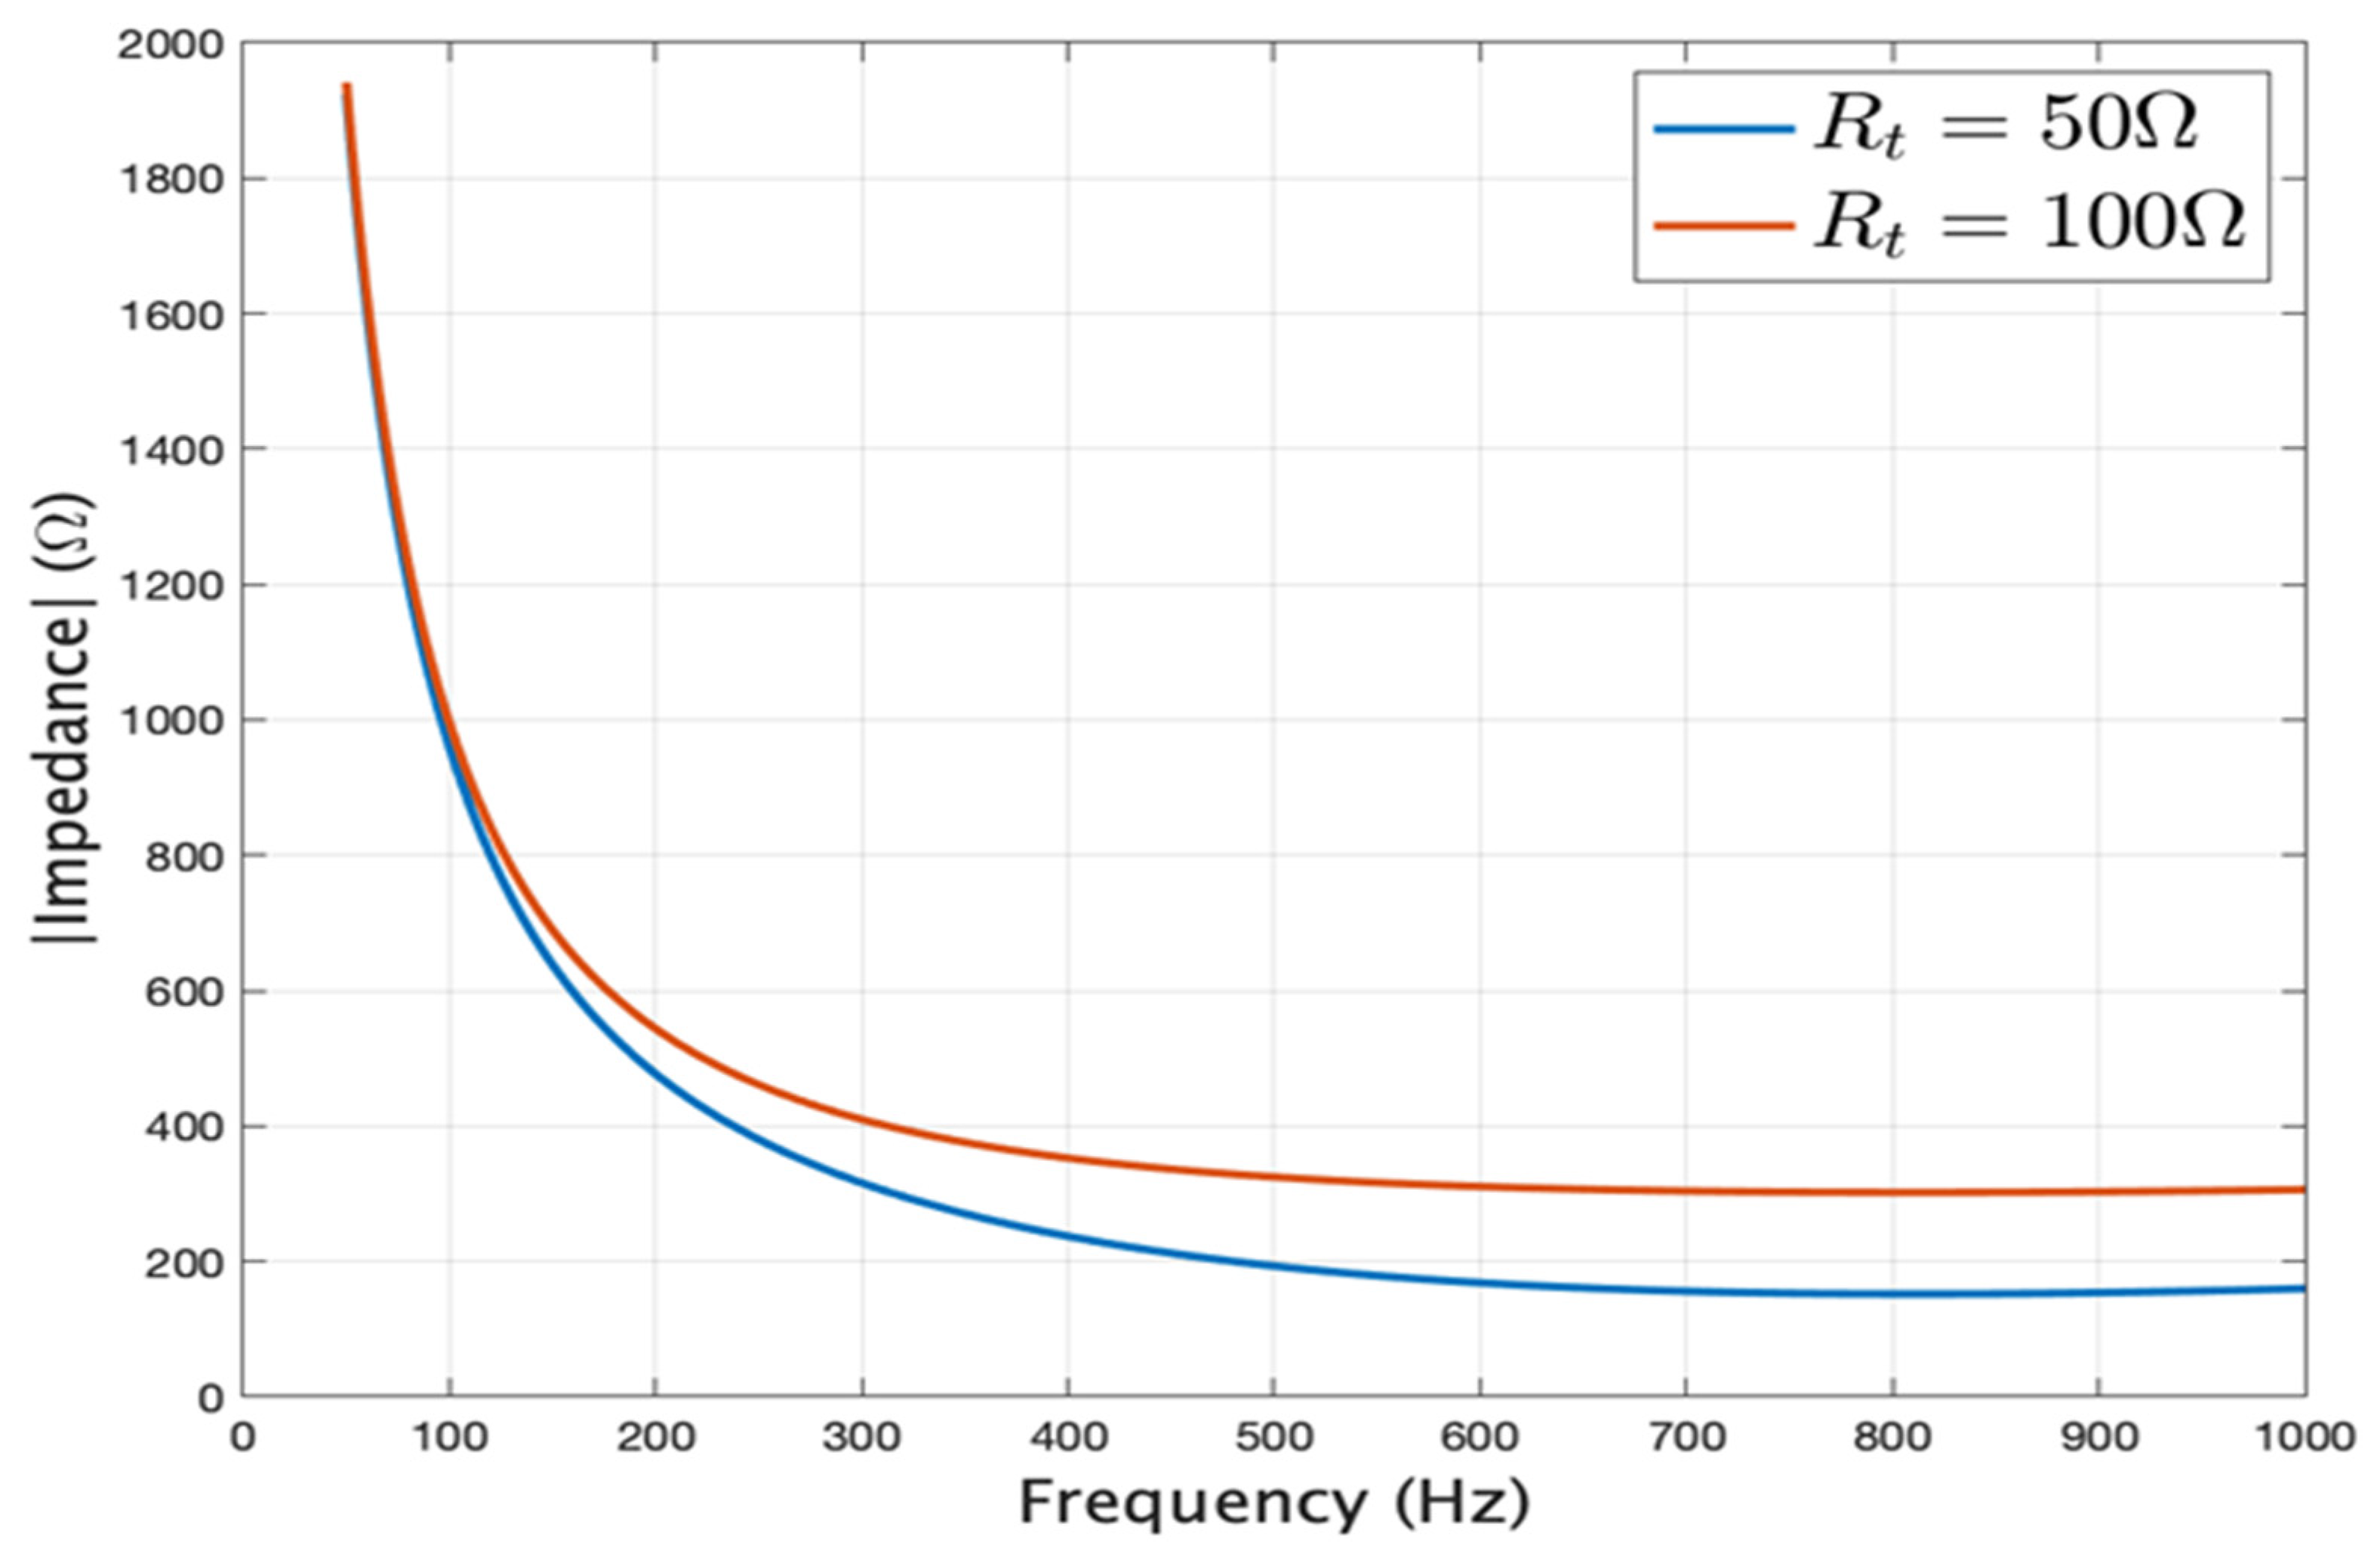
Figure 4), 50 Ω and 100 Ω (
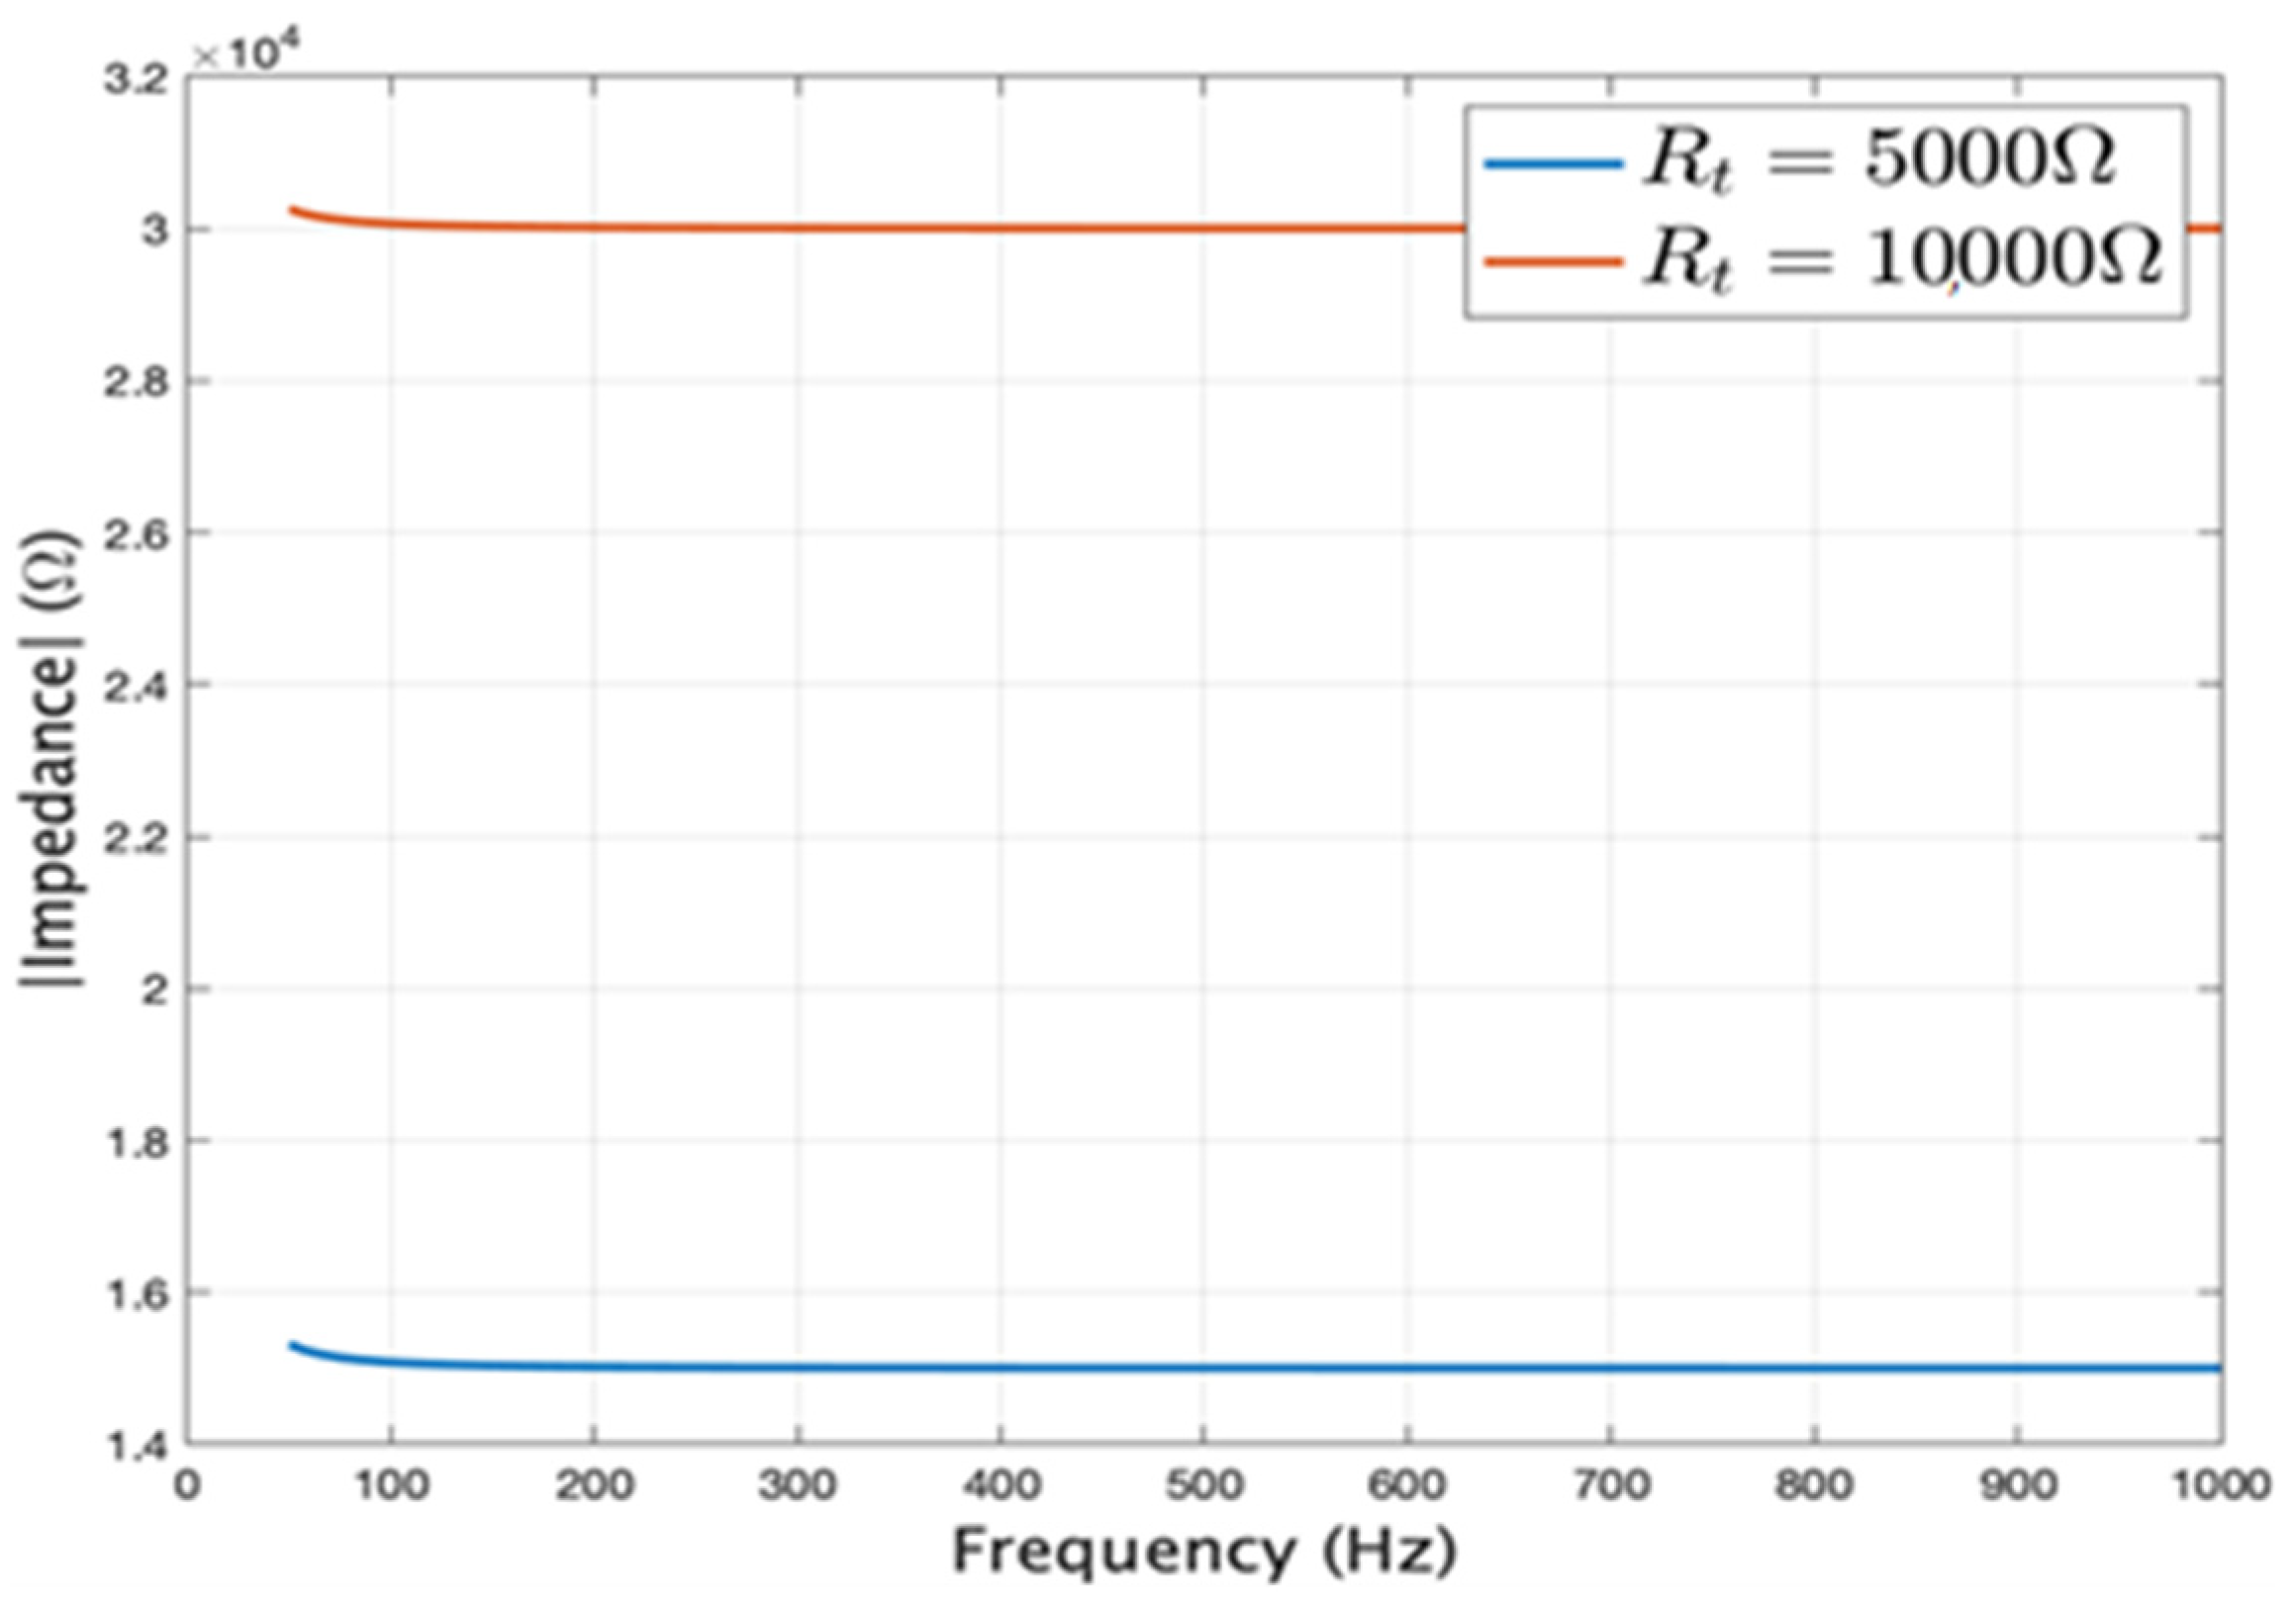
Figure 5), 5000 Ω and 10,000 Ω (Figure 6).
It was also analysed how the state of the insulation changes the value of the equivalent impedance considering the odd harmonics (from 3 to 15). The results obtained are shown in Table 5, Table 6, Table 7, Table 8, Table 9 and Table 10. These tables show the ratio of harmonic impedance values ( Z e ( k ) )—where k is the order of the harmonic and the impedance value for the fundamental ( Z e ( 1 ) ). Also, for the insulation loss angle of the 20 kV network, values of 0 (perfect insulation) and δ = 5.12⁰ (the value of the insulation loss angle of the 20 kV network analysed) were considered.
Table 5 shows the values of the equivalent impedance (relation (11)) as a function of frequency (degree of harmonics) if the resistance at the fault location is 3.5 Ω, considering the 20 kV network with perfect insulation (active power in the network insulation is zero—insulation loss angle δ = 0), i.e., insulation loss angle δ = 5.12⁰ (experimentally determined value in the 20 kV network).
Table 8, Table 9 and Table 10 show that the ratio of the harmonic impedance values to the fundamental impedance value is practically constant, being above 0.8 when R t =   1000 Ω, above 0.98 when R t =   5000 Ω, and above 0.99 when R t = 10 , 000   Ω . Under these conditions the total distortion coefficient of the fault current is practically equal to the total distortion coefficient of the voltages U p h . As a result, in this situation the single line-to-ground fault cannot be detected by checking the harmonic content of the fault current or by analysing the transient regime caused by the fault in the medium voltage network.

3.2. Calculation of Zero Sequence Current of Faulted and Non-Faulted Lines and Zero Sequence Voltage of Medium Voltage Busbars

For the calculation of the zero-sequence current of the faulted line, the zero-sequence currents of the non-faulted lines and the zero-sequence voltage of the 20 kV bus bars in the transformer substation, the sequence impedances in Figure 3 and the reference phase voltage must be known. Since the line voltage of the medium voltage network is 20 kV, the phase voltage has the following value:
U p h = U e + = 20 , 000 3 = 11 , 547   V
For the calculation of the current ( I _ 0 ,   I _ d )   relation (3) is used, for the calculation of the voltage ( U _ b 0 ) relation (12), for the calculation of the current ( I _ 1 0 ,   I _ 1 )   of line L 1 relation (13), for the calculation of the current ( I _ 2 0 ,   I _ 2 ) of line L 2 relation (14), for the calculation of the current ( I _ 3 0 ,   I _ 3 ) of line L 3 relation (15), and for the calculation of the current ( I _ 4 0 ,   I _ 4 )   of line L 4 relation (16) is used.
The following values were considered for the fault site resistance ( R t ) : 3.5; 50; 100; 1000; 5000 and 10,000 Ω. The calculation of the specified quantities was made considering the insulation of the 20 kV network as being without active power losses, i.e., the equivalent electrical resistance of the insulation is considered to be infinite. The results obtained are shown in Table 11.
From Table 11 it can be seen that if the value of the resistance at the fault site is 10,000 Ω the effective value of the fault current is 1185 A and the effective value of the zero-sequence voltage of the 20 kV bus bar is 725.4 V. Given that the transformation ratio of the current transformers related to the faulted line is 20, it follows that in the secondary of the zero-sequence current filter the effective value of the fault current is 59.25 mA. The effective zero sequence voltage value of the 20 kV bus bar in the secondary of the zero-sequence filter for voltage is 6.28 V. So, to selectively sense a single line-to-ground fault requires that the value of the current relay drive current is less than 59.25 mA and the voltage relay drive voltage is less than 6.25 V.

4. Experimental Results

Verification of the results obtained by calculation, using mathematical models presented in the literature, was carried out by experimentally determining the calculated quantities in the 20 kV network analysed. The experimental determination of voltages and currents was carried out by recording them with a transient event recorder in electrical networks. Figure 7 shows how the transient event recorder is connected to the secondary circuits in the 110/20 kV transformer station. In the secondary of the zero-sequence voltage filter the maximum voltage relay noted (VR) in Figure 7 is connected. The operating voltage of this relay is 2 V. The normally open contact of this relay is marked a1 in Figure 7. The state of this contact is recorded by the event recording equipment. Also connected to the secondary of the zero-sequence current filter is the current directional relay marked (DCR) in Figure 7. The operating current of the directional relay is 25 mA. The normally open contact of the directional relay is marked as a 2 in Figure 7. The state of this contact is recorded by the transient event recorder equipment.
The fault is caused on line L 5 in Figure 7. The circuit-breaker switching command of the line on which the fault is caused is performed by a special device designed to perform measurements in 20 kV installations. To avoid fault extension during the experiments, the control device also generates the impulse for disconnecting the circuit breaker of the faulted line if the protections of this line do not detect the fault. Also, in case of refusal of the disconnection of the circuit breaker of the faulted line, the controller generates an impulse to command the disconnection of the BCS longitudinal coupling circuit breaker in Figure 7.
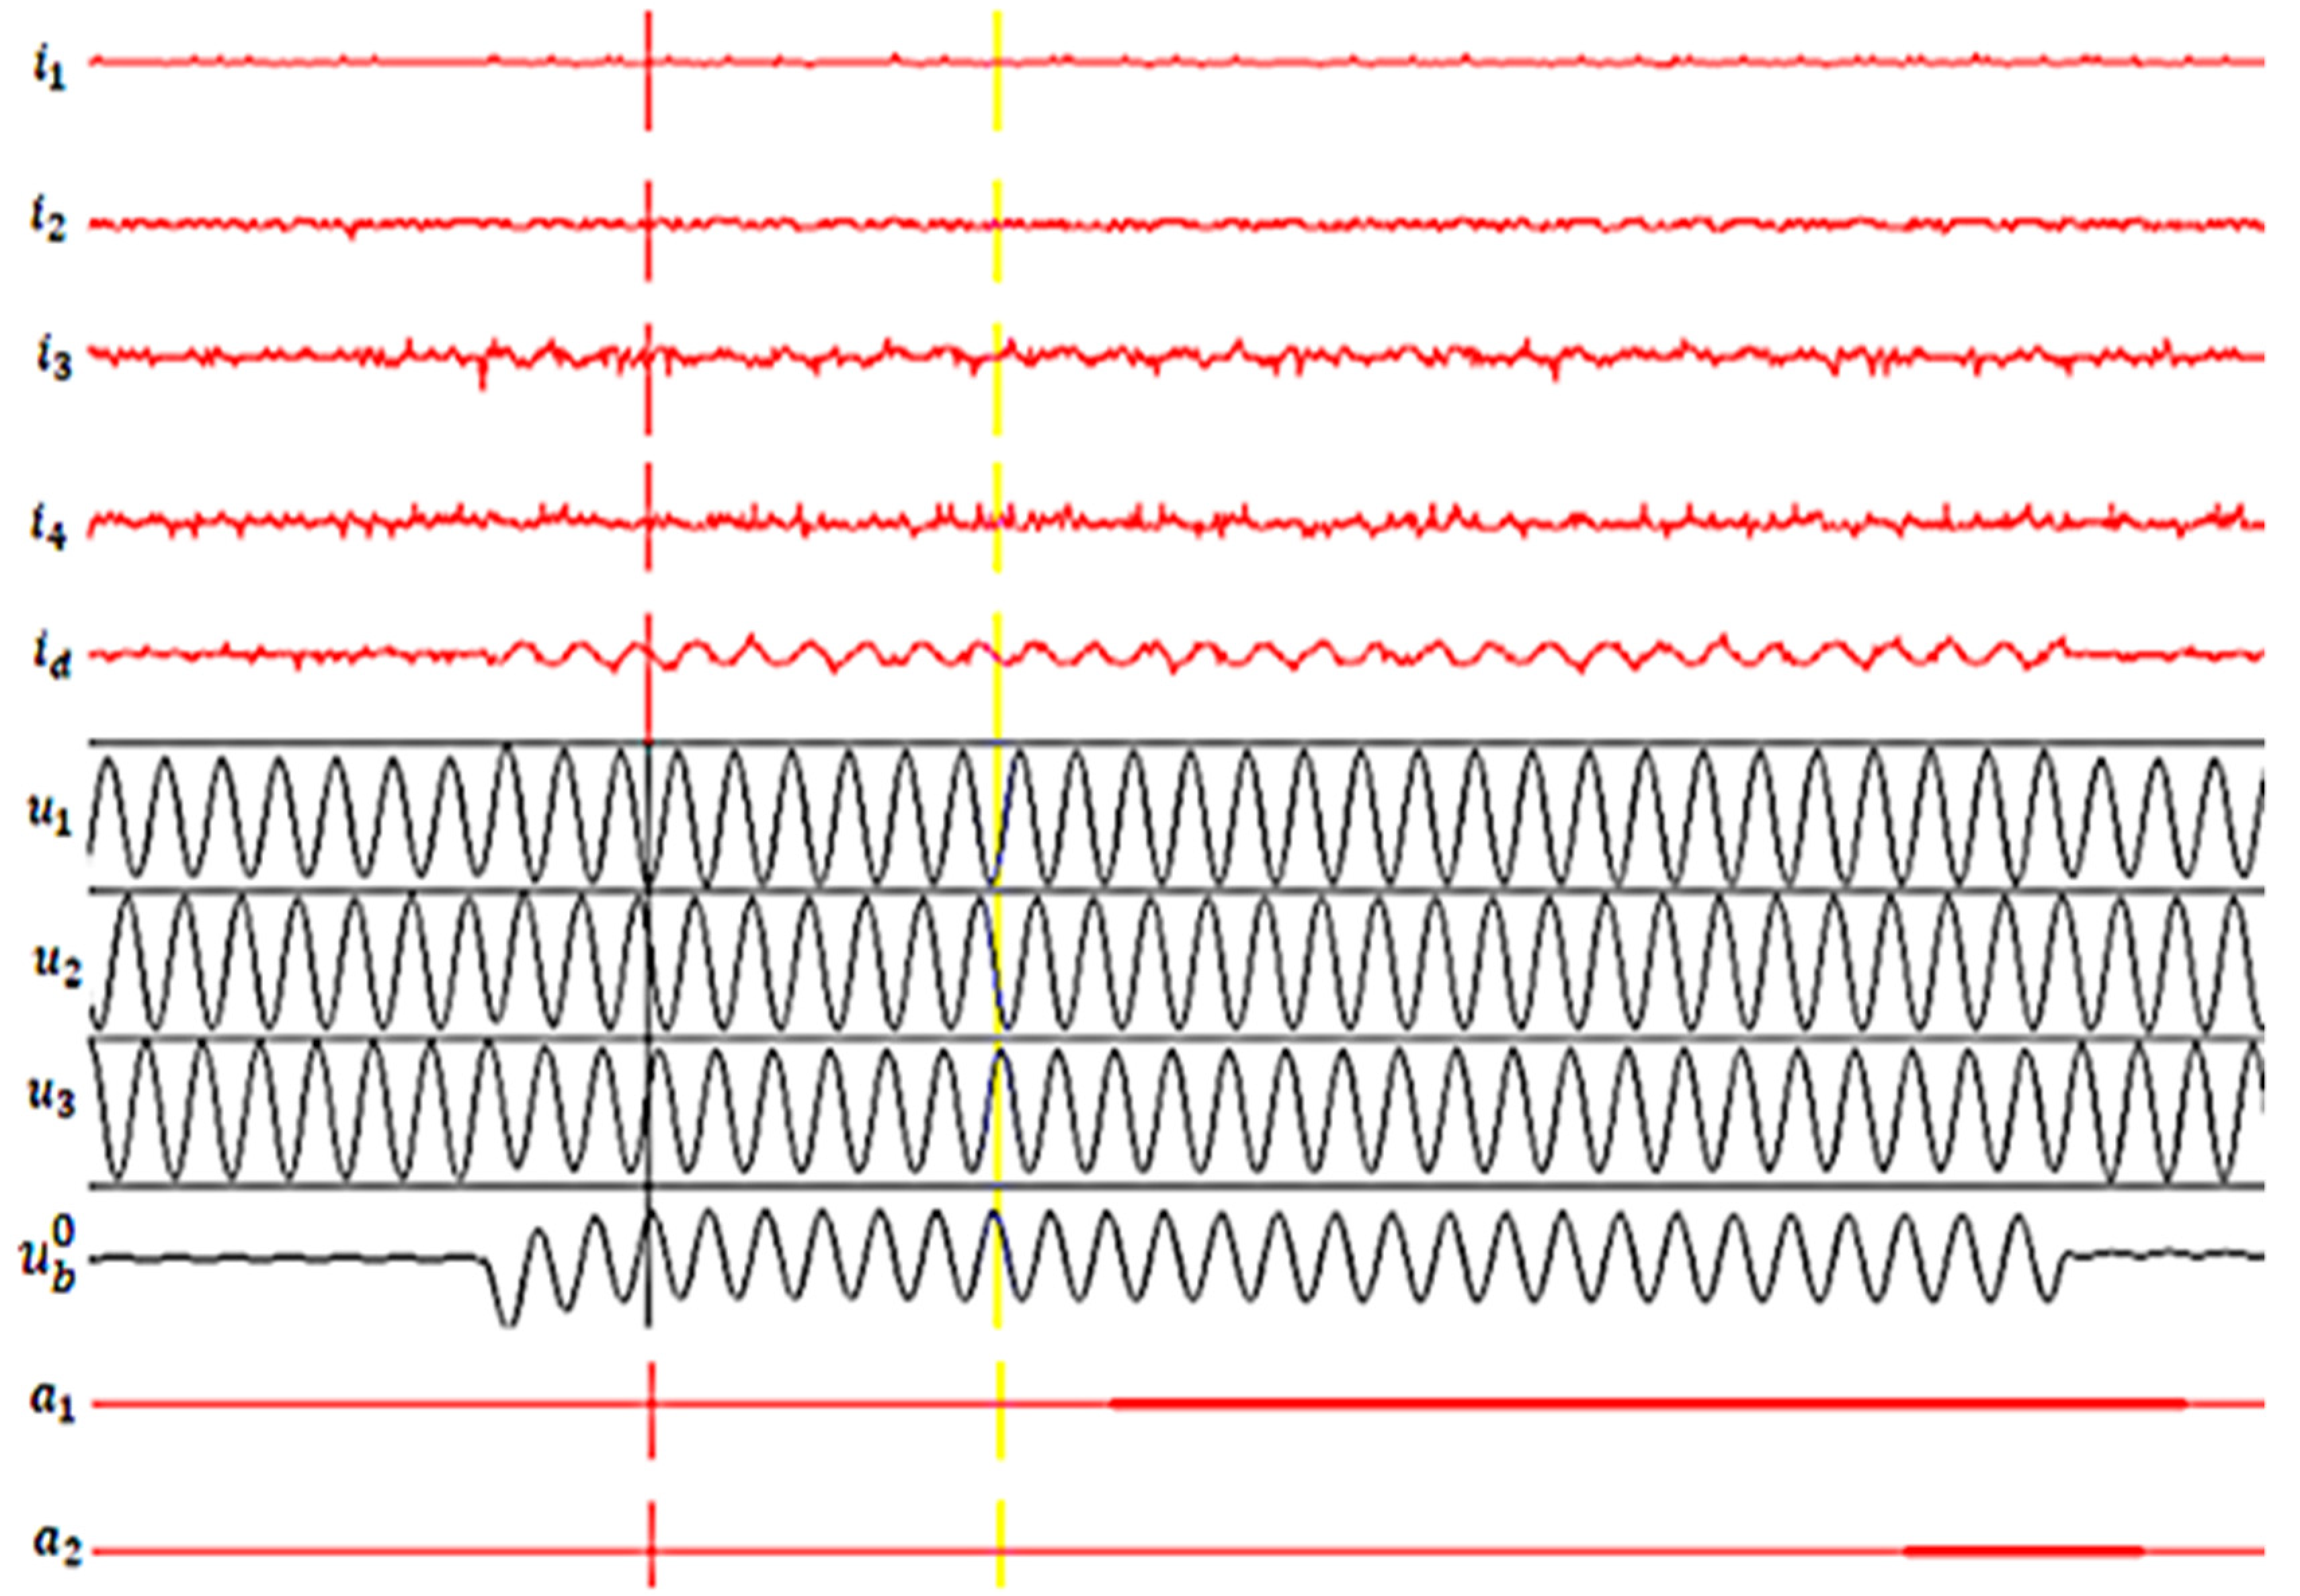
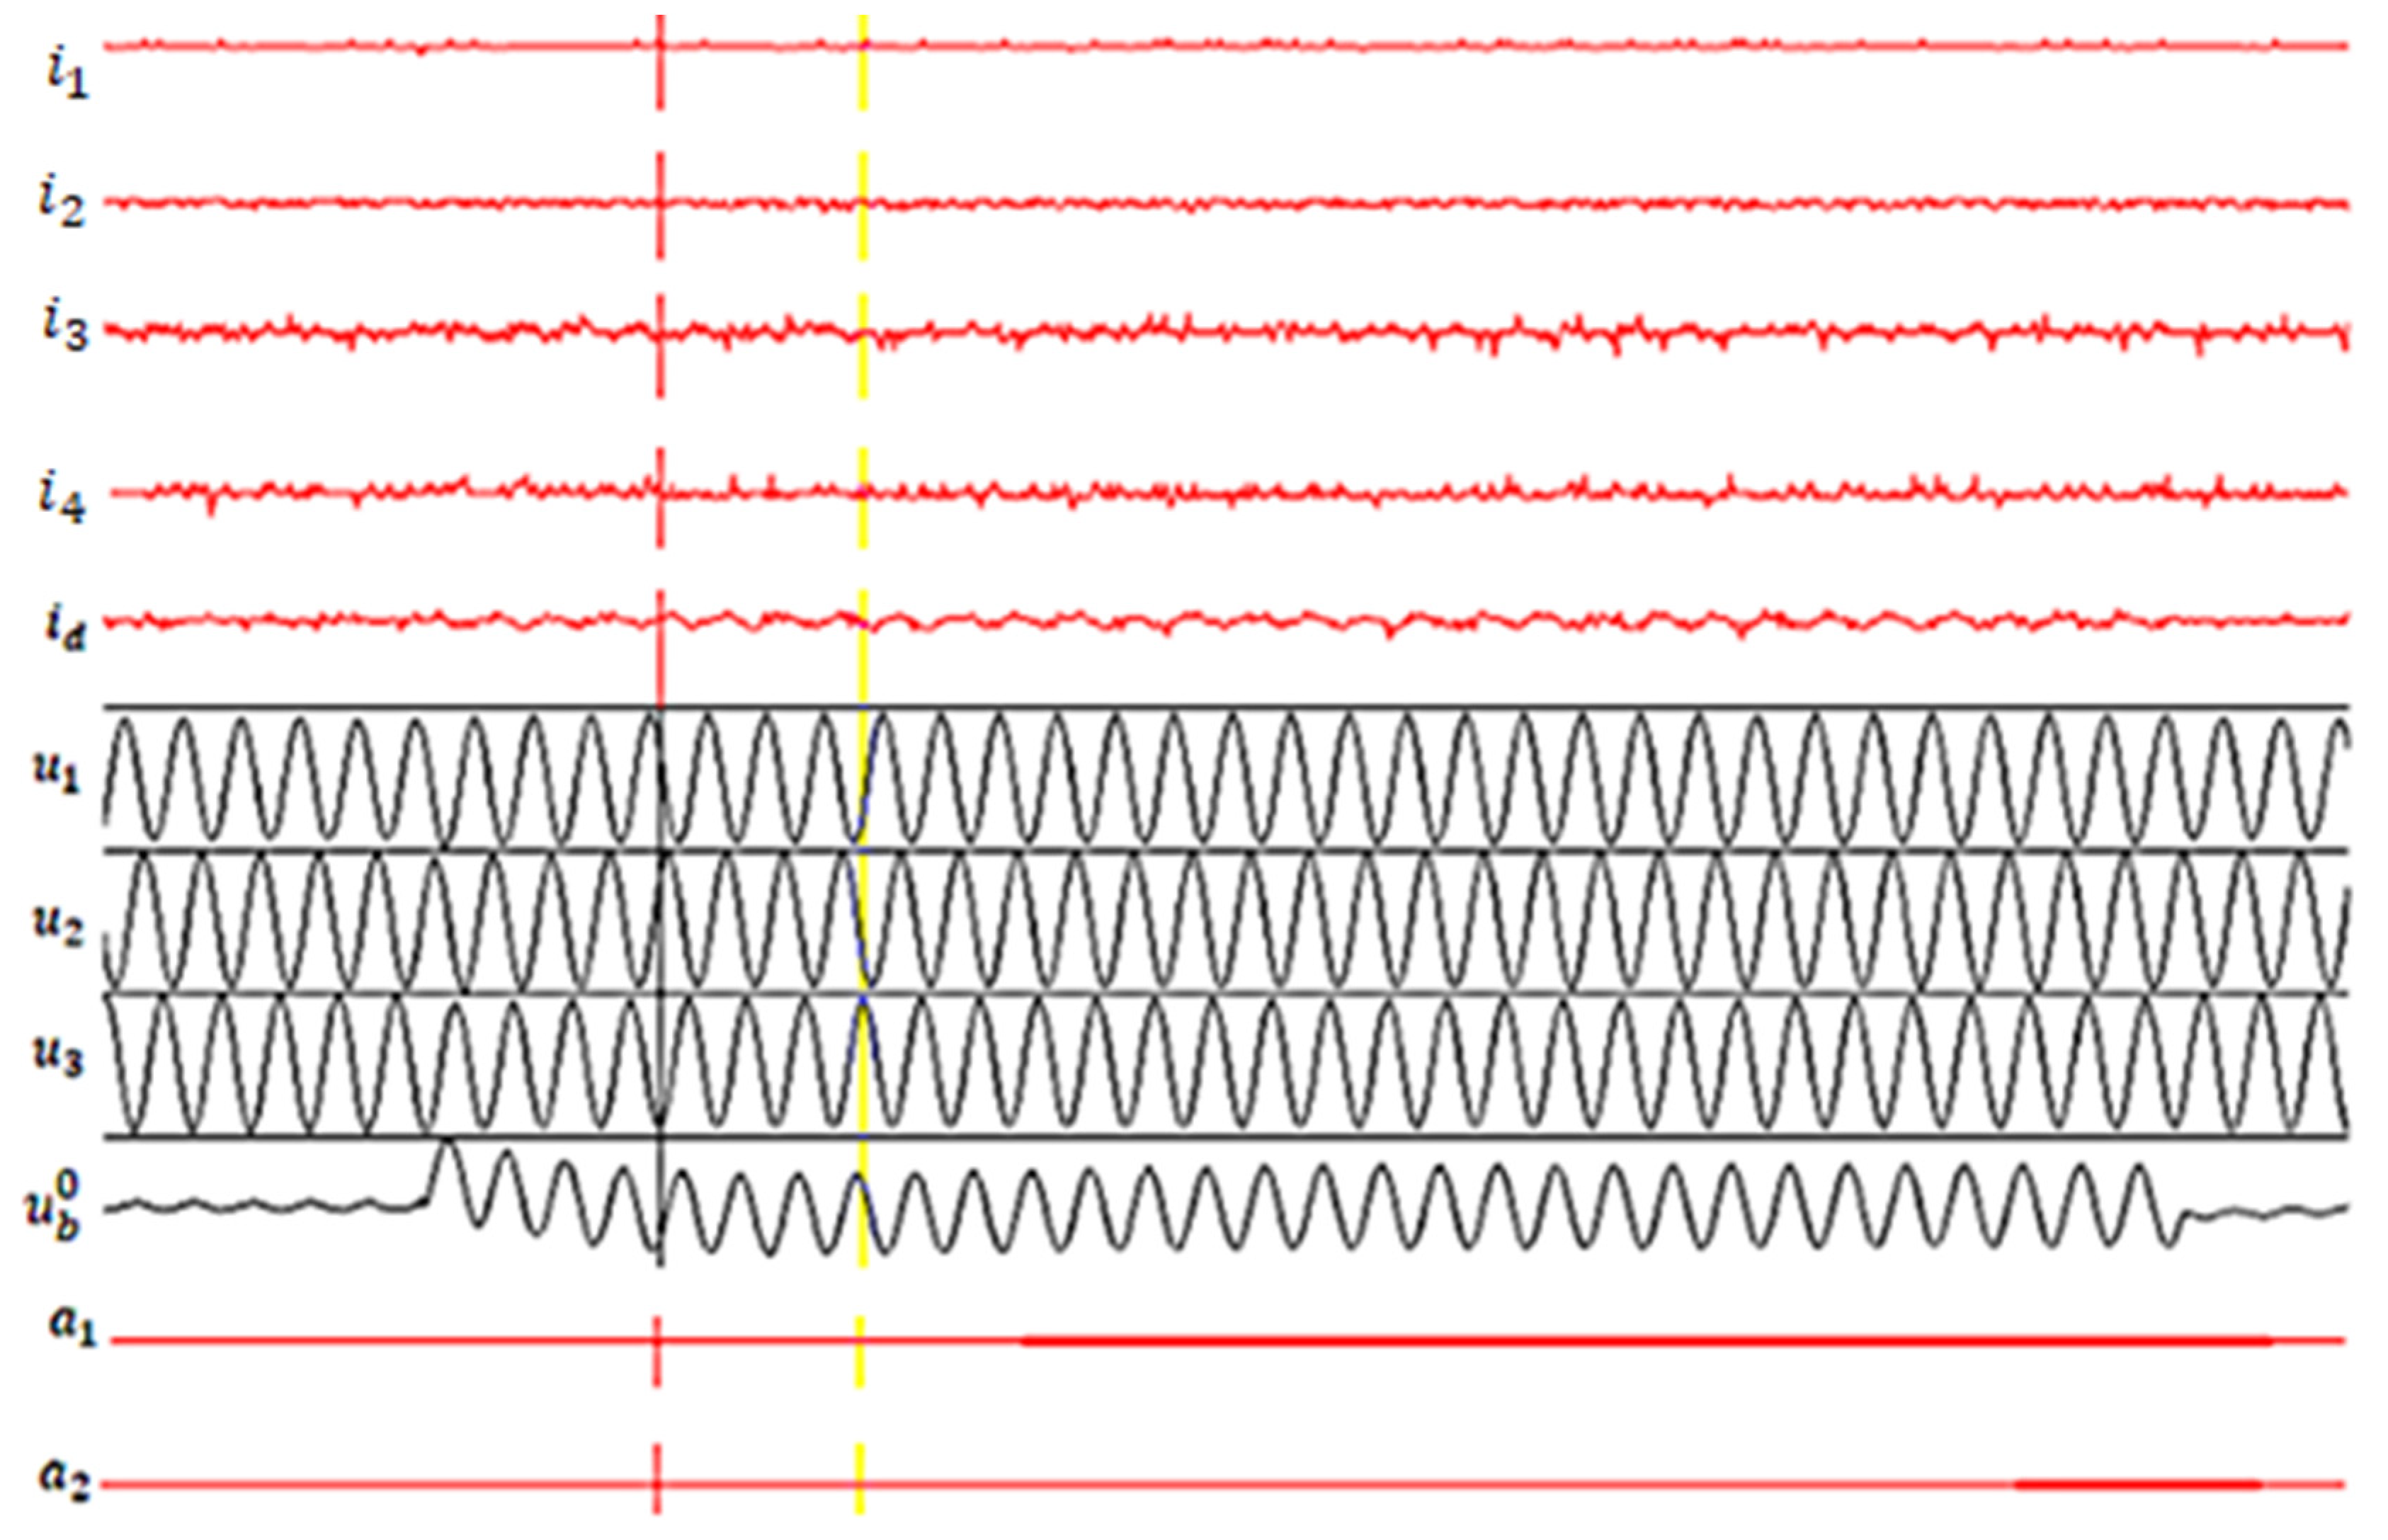
The measurements recorded during the fault are: i d —fault current (zero-sequence current of the L 5 line on which the fault is caused); i 1 ,   i 2 ,   i 3 ,   i 4   —currents of fault-free lines ( L 1 ,   L 2 ,   L 3 ,   L 4 ) ; u 1 ,   u 2 ,   u 3 —the phase voltages of the 20 kV bus bars in the transformer station; u b 0 —zero sequence voltage of the 20 kV busbars in the transformer station; a 1 —the position of the normally open contact of the overvoltage relay controlling the zero-sequence voltage value of the 20 kV bus bars in the transformer substation; a 2 —the position of the normally open contact of the current directional relay controlling the actual value and direction of the zero-sequence current of the faulted line ( L 5 ) .
Measurements were made considering the following values for the resistance at the fault site: 3.5, 5000 and 10,000 Ω, respectively. The waveforms obtained are shown in Figure 8, Figure 9 and Figure 10. The directional current relay is so set that it operates if the direction of the zero-sequence current is from the transformer substation bus bar to the fault location and does not operate if the direction of the zero-sequence current is reversed.
The complex values of the measured quantities are shown in Table 12.
From the waveforms shown in Figure 8, Figure 9 and Figure 10 it can be seen that the fault was sensed by both the zero-sequence voltage relay and the zero-sequence current directional relay of the line on which the fault occurred. The maximum zero-sequence voltage relay has the effective value of the drive voltage 2 V, and the minimum effective value of the zero-sequence voltage in the zero-sequence filter secondary is 6.8 V, so it has operating conditions even when the resistance at the fault site is 10,000 Ω. The zero-sequence directional relay has an effective value of 25 mA actuating current. The minimum effective value of the fault current in the secondary of the zero-sequence filter of the faulted line is 60.1 mA, when the resistance at the fault location is 10,000 Ω. So, both the maximum voltage relay and the current directional relay had operating conditions for the three faults caused in the 20 kV network. The waveforms recorded and shown in Figure 8, Figure 9 and Figure 10, confirm that the two relays operated correctly. So, for the selective detection of a single line-to-ground fault in a medium voltage electrical network with isolated neutral, a directional current relay can be used which controls the actual value and direction of the zero-sequence current of the medium voltage lines, even if the value of the resistance at the fault site is 10,000 Ω. From the waveforms shown in Figure 8 (fault site resistance 3.5 Ω) it follows that the fault lasted 560 ms, from Figure 9 (fault site resistance 5000 Ω) it follows that the fault lasted 580 ms, and from Figure 10 (fault site resistance 10,000 Ω) shows that the fault lasted 720 ms. Figure 8 shows that there is a significant transient component in both the fault current and the fault-free line currents. If the fault site resistance is 5000 Ω and 10,000 Ω respectively the fault current and the currents of the non-faulted lines do not contain a transient component, which is why the transient regime can no longer be used to detect a single line-to-ground fault in a medium voltage network with isolated neutral. The numerical simulation of the transient regime caused by such a fault [24] showed that in case of high value resistances at the fault location the transient component becomes negligible.

5. Discussion

The dependence of the equivalent impedance value on frequency is influenced by the value of the resistance at the fault location ( R t ). From Table 5 it can be seen that when the resistance at the fault site has a value of 3.5 Ω, the value of the equivalent impedance decreases sharply with frequency, obtaining the minimum value for the 11th harmonic, in which case the value of the equivalent impedance decreases 104 times compared to its value for the fundamental. Given this change in the equivalent impedance value with frequency, it follows that in order to detect a simple earth fault in a medium voltage electrical network with isolated neutral, the harmonic content of the zero-sequence current of the lines connected to the medium voltage bus bar can be checked. The harmonic content is most pronounced at the fault current. In this way the faulted line can be selectively detected.
If the value of the resistance at the fault site increases to 50 Ω, the minimum value of the equivalent impedance is 12.5 times lower than its value for the fundamental, this value being 8.33 times higher than if the resistance at the fault site was 3.5 Ω. Under these conditions the harmonic content of the fault current decreases by 8.33 times, so one may end up in a situation where the harmonic content of the fault current can no longer be technically determined, i.e., this procedure can no longer be used for selective detection of such a fault. If the resistance at the fault site is 100 Ω (Table 7) the minimum equivalent impedance value is 6.38 times lower (harmonic 11) than its value for the fundamental. This value is 16.3 times higher than if the resistance at the fault site is 3.5 Ω.
If the resistance at the fault site is 5000 Ω the minimum value of the equivalent impedance (Table 8) is 1.008 times lower than the impedance value for the fundamental, and if the value of the resistance at the fault site is 10,000 Ω (Table 9), the same ratio becomes 1.002 i.e., the equivalent impedance value no longer depends on the frequency, having the same value for all harmonics. Under these conditions the harmonic content of the fault current decreases significantly, so the harmonic content of the fault current can no longer be used for selective detection of such a fault. That is why at high values of the fault site resistance, for selective detection of the faulted line the actual value and the direction of the zero sequence currents of the medium voltage lines connected by the 20 kV bus bar of the transformer substation are controlled.
Assuming that the phase voltage has the following expression:
u p h ( t ) = [ 2 × sin ( 100 π × t ) + 0.04 2 × sin ( 3 × 100 π × t ) + + 0.02 2 × sin ( 5 × 100 π × t ) + 0.01 2 × sin ( 7 × 100 π × t ) +      + 0.009 2 × sin ( 9 × 100 × t ) + 0.007 2 × sin ( 11 × 100 π × t ) +    + 0.005 2 × sin ( 13 × 100 π × t ) + 0.003 2 × sin ( 15 × 100 π × t ) ] V
The total distortion coefficient voltage [29] is:
T H D U = U ( 3 ) 2 + U ( 5 ) 2 + U ( 7 ) 2 + U ( 9 ) 2 + U ( 11 ) 2 + U ( 13 ) 2 + U ( 15 ) 2 U ( 1 ) = 0.0476
The values of the total fault current distortion coefficient ( T H D I ) [29], as a function of the value of the resistance at the fault location are shown in Table 13.
From Table 13 it follows that the value of the total current distortion coefficient is practically equal to that of the total voltage distortion coefficient ( T H D I T H D U )   if the resistance at the fault site is greater than 5000 Ω.
The difference between the equivalent impedance value when there are no active power losses in the 20 kV grid insulation ( R i s in Figure 1 is infinite) and active power losses ( R i s = 19,929 Ω, i.e., loss angle δ = 5.12⁰) is shown in Table 14. The difference is expressed in % and is calculated using relation (20) and the results are shown in Table 14:
ε % = Z e ( δ = 5.12 ) Z e ( δ = 0 ) Z e ( δ = 5.12 ) × 100
From Table 14 it can be seen that the state of the insulation of the medium voltage network does not significantly change the value of the equivalent impedance, regardless of the value of the resistance at the fault location. The maximum difference is 1.289% for the fundamental and the resistance at the fault location having the value of 5000 Ω. For this reason, in the mathematical model used for the phase-to-ground fault analysis (Figure 3) the value of the insulation resistance ( R i s ) can be considered as infinite, so the insulation of the medium voltage network can be considered without active power losses (ideal insulation). In the case of medium voltage networks with Petersen coil treated neutral the insulation condition can lead to a pronounced change in the fault current [30], which is why in the mathematical model used for single line-to-ground fault analysis the active power losses in the medium voltage network insulation cannot be neglected.
The percentage differences between the calculated (Table 9) and experimentally determined (Table 12) values are shown in Table 15. To calculate these differences, the following relationship is used:
ε 1 % = experimental results calculation results experimental results × 100
Given the precision with which the parameter values in the zero-sequence current and voltage calculation relationships are known the error values in Table 15 are fully justified. As a result, the simplifying assumptions used for mathematical models for calculating currents and voltages in the case of a single line-to-ground fault in a medium voltage network with isolated neutral are correct.

6. Conclusions

The paper demonstrates that the method of selective detection of a phase-to-earth fault that uses the control of the effective value of the zero sequence currents of medium voltage lines and the direction of these currents can selectively detect such a fault even if the resistance at the fault reaches the value of 10,000 Ω. The equipment needed to implement this method is much simpler and cheaper than the equipment needed to implement methods that involve analyzing the waveform of the fault current, which in the case of faults where the resistance at the fault location exceeds 1000 Ω no longer have operating conditions. The main findings of the study are presented below:
(a)
A single line-to-ground fault occurring in a medium voltage network with isolated neutral can be selectively detected by checking the harmonic content of the fault current only if the resistance at the fault site does not exceed 100 Ω. If the total voltage distortion coefficient is 0.0476 (which is within the allowed limits) the total current distortion coefficient is 0.8312 if R t = 3.5 Ω, 0.2443 if R t = 50 Ω, and 0.1866 if = 100 Ω. So, when the resistance at the fault site is 100 Ω the total current distortion coefficient decreases by 4.45 times compared to the case when R t = 3.5 Ω, and when R t = 50 Ω the total current distortion coefficient decreases by 2.99 times compared to the case when R t = 3.5 Ω (Table 13).
(b)
If the value of the resistance at the fault site exceeds 1000 Ω the total phase current distortion coefficient is not more than 9.3% higher than the total phase voltage distortion coefficient (Table 13). As a result, controlling the harmonic content of the phase current does not provide a reliable procedure for selective single line-to-ground fault detection.
(c)
If the fault site resistance exceeds 100 Ω, it is advisable to use the actual value of the zero-sequence current and its direction to sense a fault in a medium voltage network with isolated neutral using a directional current relay. If the operating current of the directional relay is 25 mA, a single line-to-ground fault can be detected with this relay, where the resistance at the fault site can reach 10,000 Ω (waveforms shown in Figure 10).
(d)
A maximum voltage relay can be used to signal the occurrence of a single line-to-ground fault in the medium voltage network, which controls the actual value of the zero-sequence voltage of the medium voltage bus bar voltages in the transformer substation. If the operating voltage of the relay is 2 V, a single line-to-ground fault can be detected in a medium voltage network with isolated neutral leading to an effective value of the zero-sequence voltage of the 20 kV bus bars in the transformer substation of at least 231 V, which value is obtained if the resistance at the fault site does not exceed 30,000 Ω. A value of 2 V for the voltage relay adjustment is only possible if in the absence the fault the zero-sequence voltage of the medium voltage bus-bars in the secondary of the zero sequence filter does not exceed the value of 0.5 V, to ensure a value for safety factor 4.
(e)
If the operating voltage of the overvoltage relay has too low an effective value, there is a risk that the overvoltage relay will operate in normal operation of the medium voltage network. To avoid such a situation, it is necessary to determine experimentally the value of the zero-sequence component of the medium voltage bus bar voltage in the transformer substation before setting the maximum voltage relay setting. The value of the voltage at which the voltage relay is set shall be at least twice the value of the zero-sequence component of the voltage of the medium voltage bus bars in the transformer substation in the absence of a fault.
(f)
For the single line-to-ground fault detection in a medium voltage network when the resistance at the fault location exceeds 1000 Ω the transient component of the fault current cannot be used because it practically does not exist (Figure 9 and Figure 10).
(g)
Checking the effective value of the zero-sequence voltage of the medium voltage bars in the transformer station only detects the existence of the fault, not the fault line. In order to detect the fault line, it is necessary to control the effective value of the zero- sequence current and its direction for the medium voltage lines. There are many medium voltage networks with isolated neutral in which such a fault is not selectively detected. The fact that there is such a fault is an important piece of information in the operation of medium voltage networks. In such situations, the faulty line is established by disconnecting them from the source.

Author Contributions

Conceptualization, D.T., M.V. and C.S.; methodology, D.T., M.V. and C.S.; software, D.T. and C.S.; validation, D.T., M.G. and D.V.; formal analysis, D.V. and M.G.; investigation, C.S., D.V. and M.G.; resources, D.T. and M.G.; data curation, C.S.; writing—original draft preparation, D.T. and M.V.; writing—review and editing, C.S., M.V. and D.T.; visualization, D.V.; supervision, D.T.; project administration, M.G.; funding acquisition, D.T. All authors have read and agreed to the published version of the manuscript.

Funding

This research received no external funding.

Institutional Review Board Statement

Not applicable.

Informed Consent Statement

Not applicable.

Data Availability Statement

The data presented in the paper, obtained by calculation, respectively experimentally were not published, which is why data sharing is not applicable to this article.

Conflicts of Interest

The authors declare no conflict of interest.

References

  1. Abbas, A.K.; Hamad, S.; Hamad, N. Single line to ground fault detection and location in medium voltage distribution system network based on neural network. Indones. J. Electr. Eng. Comput. Sci. 2021, 23, 621–632. [Google Scholar] [CrossRef]
  2. Ukrainicev, A.; Nagy, V.; Nagy, I.; Sarry, S.; Chmihaloy, G. Analysis of the functioning of the earth fault protection with active influence on electrical grid. In Proceedings of the 9th International Scientific Symposium on Electrical Power Engineering, Stará Lesná, Słowacja, 12–14 September 2017; pp. 418–421. [Google Scholar]
  3. Ma, J.; Yan, X.; Fan, B.; Liu, C.; Thorp, J.S. A novel line protection scheme for a single phase-to-ground fault based on voltage phase comparison. IEEE Trans. Power Deliv. 2016, 31, 2018–2027. [Google Scholar] [CrossRef]
  4. Zhang, X.; Xu, B.; Pan, Z.; Wei, P. Study on single-phase earthed faulty feeder selection methods in non-solidly grounded systems. In Proceedings of the Third International Conference on Electric Utility Deregulation and Restructuring and Power Technologies (DRPT 2008), Nanjing, China, 6–9 April 2008; pp. 1836–1840. [Google Scholar]
  5. Mardegan, C.; Rifaat, R.S. Insights into Applications of IEEE Standards for Ground-Fault Protection in Industrial and Commercial Power Systems. IEEE Trans. Ind. Appl. 2015, 51, 2854–2861. [Google Scholar] [CrossRef]
  6. Mukherjee, A.; Kundu, P.K.; Das, A. A supervised principal component analysis-based approach of fault localization in transmission lines for single line to ground faults. Electr. Eng. 2021, 103, 2113–2126. [Google Scholar] [CrossRef]
  7. Toader, D.; Blaj, C.; Ruset, P.; Hategan, I.D.; Pinte, N.; Arvinti, B. Device for automatic control of the Petersen coil. In Soft Computing Applications; Springer: Berlin/Heidelberg, Germany, 2016; pp. 1121–1137. [Google Scholar]
  8. Toader, D.; Haragus, S.; Blaj, C. Numeric simulation of faults in electrical networks. In Proceedings of the 10th WSEAS International Conference on Fuzzy Systems, Praque, Czech Republic, 23–25 March 2009; pp. 128–135. [Google Scholar]
  9. Jia, Q.; Dong, X.; Mirsaeidi, S. A traveling-wave-based line protection strategy against single-line-to-ground faults in active distribution networks. Int. J. Electr. Power Energy Syst. 2019, 107, 403–411. [Google Scholar] [CrossRef]
  10. Kapoor, G. Wavelet transform based detection and classification of multi-location three phase to ground faults in twelve phase transmission line. Majiesi J. Mechatron. Syst. 2018, 6, 47–60. [Google Scholar]
  11. Osipov, D.; Satpaev, D.; Kisselyov, B. Analysis of Single Phase-to-Ground Fault in Mixed Neutral Ground Systems Using Wavelet Transform. In Proceedings of the International Conference on Industrial Engineering, Applications and Manufacturing (ICIEAM) 2018, Moscow, Russia, 15–18 May 2018; pp. 1–5. [Google Scholar]
  12. Nam, S.R.; Ko, W.H.; Key, S.; Lee, N.H. IEC 61850-Based Centralized Protection against Single Line-To-Ground Faults in Ungrounded Distribution Systems. Energies 2021, 14, 722. [Google Scholar] [CrossRef]
  13. Mohamed, F.A.F.; Lehtonen, M. Transient-based protection as a solution for earth-fault detection in unearthed and compensated neutral medium voltage distribution networks. In Proceedings of the 2010 Electric Power Quality and Supply Reliability Conference, Kuressaare, Estonia, 16–18 June 2010. [Google Scholar]
  14. Al-Shaher, M.; Saleh, A.S.; Sabry, M.M. Estimation of Fault Location Resistance for Single Line-to-ground faults in Multi-ring Distribution Network Using Artificial Neural Network. Electr. Power Compon. Syst. 2009, 37, 697–713. [Google Scholar] [CrossRef]
  15. Nakho, A.; Hamam, Y. Detection and Classification of Single Phase to Ground Faults under High Resistance Ground Paths in Power Systems using Machine Learning. In Proceedings of the Southern African Universities Power Engineering Conference/Robotics and Mechatronics/Pattern Recognition Association of South Africa (SAUPEC/RobMech/PRASA), Potchefstroom, South Africa, 27–29 January 2021. [Google Scholar]
  16. Kingrey, L.J.; Painter, R.D.; Locker, A.S. Applying High-Resistance Neutral Grounding in Medium-Voltage System. IEEE Trans. Ind. Appl. 2011, 47, 1220–1231. [Google Scholar] [CrossRef]
  17. Tang, Y.; Chang, Y.; Tang, J.; Xu, B.; Ye, M.; Yang, H. A Novel Faulty Phase Selection Method for Single-Phase-to-Ground Fault in Distribution System Based on Transient Current Similarity Measurement. Energies 2021, 14, 4695. [Google Scholar] [CrossRef]
  18. Wang, X.; Gao, J.; Wei, X.; Zeng, Z.; Wei, Y.; Kheshti, M. Single Line to Ground Fault Detection in a Non-Effectively Grounded Distribution Network. IEEE Trans. Power Deliv. 2018, 33, 3173–3186. [Google Scholar] [CrossRef]
  19. Jin, N.; Xing, J.; Liu, Y.; Li, Z.; Lin, X. A novel Single-phase-to-ground fault identification and isolation strategy in wind farm collector line. Int. J. Electr. Power Energy Syst. 2018, 94, 15–26. [Google Scholar] [CrossRef]
  20. Achleitner, G.; Obkircher, C.; Fickert, L.; Sakulin, M.; Raunig, C. An earth fault distance location algorithm in compensated networks with additional estimation of the fault impedance and fault current. In Proceedings of the Power Quality and Supply Reliability Conference, Parnu, Estonia, 27–28 August 2008. [Google Scholar]
  21. Guo, M.; Zeng, X.; Chen, D.; Yang, N. Deep-Learning-Based Earth Fault Detection Using Convolutional Neural Network in Resonant Grounding Distribution Systems. IEEE Sens. J. 2018, 18, 1291–1300. [Google Scholar] [CrossRef]
  22. Leitloff, V.; Feuillet, R.; Grifel, D. Detection of resistive single-phase earth faults in a compensated power-distribution system. Electr. Energy Syst. 1997, 7, 65–73. [Google Scholar] [CrossRef]
  23. Mamikonyan, B.; Nikoghosyan, D. Measurement of Dielectric Loss by Phase Method. Am. Sci. Res. J. Eng. Technol. Sci. 2017, 29, 124–137. [Google Scholar]
  24. Buta, A. Neutral grounding of electrical networks. In Electric Power Systems; Electric Networks; Eremia, M., Ed.; Romania Academy: Bucharest, Romania, 2006; pp. 327–334. [Google Scholar]
  25. NTE001/00/03 Standard Concerning the Insulation Choice, Insulation Coordination and the Electrical Power Devices Protection against over-Voltages, ANRE 2003. p. 50. Available online: https://documente.net/document/nte-001-normativ-pentru-alegerea-izolatiei-coordonarea-izolatiei-si-protectia-instalat; https://www.anre.ro/ro/energie-electrica/legislatie/norme-tehnice/normative-tehnice-energetice-nte (accessed on 10 September 2021).
  26. Toader, D.; Blaj, C.; Vesa, D.; Tatai, I.; Arvinti, B. Numeric Simulator for the Analysis of Transients due to Faults in Electric Networks. In Proceedings of the 8th International Conference on Modern Power Systems, MPS 2019, Cluj-Napoca, Romania, 21–22 May 2019; pp. 1–6. [Google Scholar]
  27. Gomez-Exposito, A.; Conejo, A.; Canizaris, C. Symmetrical Components Electric Energy Systems. In Analysis and Operation, 2nd ed.; CRC Press: Boca Raton, FL, USA; London, UK; Taylor & Francisc Group: New York, NY, USA, 2018; pp. 421–471. [Google Scholar]
  28. El-Hawary, M.E. Chapter VIII Fault on Electric Energy Systems. In Electrical Power Systems: Design and Analysis; IEEE Press Power Systems Engineering Series; John Wiley & Sons Inc.: New York, NY, USA, 1995; pp. 474–507. [Google Scholar]
  29. IEEE 1459–2010—IEEE Standard Definitions for the Measurement of Electric Power Quantities Under Sinusoidal, Non-Sinusoidal, Balanced, or Unbalanced Conditions. Available online: https://www.p3-inc.com/blog/entry/understanding-total-harmonic-distortion-thd-in-power-systems (accessed on 10 September 2021).
  30. Toader, D.; Greconici, M.; Vesa, D.; Vintan, M.; Solea, C. Analysis of the Influence of the Insulation Parameters of Medium Voltage Electrical Networks and of the Petersen Coil on the Single-Phase-to-Ground Fault Current. Energies 2021, 14, 1330. [Google Scholar] [CrossRef]
Figure 1. Simplified diagram of medium voltage network with isolated neutral.
Energies 14 07019 g001
Figure 2. Connection of sequence diagrams in case of a single line-to-ground fault.
Energies 14 07019 g002
Figure 3. Equivalent circuit diagram in symmetrical components.
Energies 14 07019 g003
Figure 4. Dependence of equivalent impedance on frequency for Rt = 3.5 Ω.
Energies 14 07019 g004
Figure 5. Dependence of equivalent impedance on frequency for Rt = 50 Ω, respectively 100 Ω.
Energies 14 07019 g005
Figure 6. Dependence of equivalent impedance on frequency for Rt = 5000 Ω, respectively 10,000 Ω.
Energies 14 07019 g006
Figure 7. Measurement scheme in the network 20 kV.
Energies 14 07019 g007
Figure 8. Waveforms of currents and voltages when in the 20 kV network there is a ground phase fault, and the value of the resistance at the fault location (Rt) is 3.5 Ω.
Energies 14 07019 g008
Figure 9. Waveforms of currents and voltages when in the 20 kV network there is a ground phase fault, and the value of the resistance at the fault location (Rt) is 5000 Ω.
Energies 14 07019 g009
Figure 10. Waveforms of currents and voltages when in the 20 kV network there is a ground phase fault, and the value of the resistance at the fault location (Rt) is 10,000 Ω.
Energies 14 07019 g010
Table 1. Meaning of the notations used in Figure 1. i 1 = 3 i 1 0   i d R t   K .
KPoint where is the location of the phase-ground fault
R t The resistance at the fault site
T r 110/20 kV transformer (nominal apparent power 16 MVA, wye with neutral (Y0) connection on the 110 kV side and delta (Δ) on the 20 kV side)
U T 20/0.4 kV the own utilities transformer (nominal apparent power 250 kVA, delta connection (Δ) on the 20 kV side and wye with neutral (Y0) connection on the 0.4 kV side)
L 1 Line without fault having capacitive current 4.82 A and loss angle δ = 4⁰
L 2 Line without fault having capacitive current 1.54 A and loss angle δ = 2⁰
L 3 Line without fault having capacitive current 9.06 A and loss angle δ = 4⁰
L 4 Line without fault having capacitive current 2.75 A and loss angle δ = 2⁰
R i s 1 Electrical resistance of the line phase insulation L 1
C p h 1 Capacitance between the phase conductor of line L 1 and ground
R i s 2 Electrical resistance of the line phase insulation L 2
C p h 2 Capacitance between the phase conductor of line L 2 and ground
R i s 3 Electrical resistance of the line phase insulation L 3
C p h 3 Capacitance between the phase conductor of line L 3 and ground
R i s 4 Electrical resistance of the line phase insulation L 4
C p h 4 Capacitance between the phase conductor of line L 4 and ground
R i s 5 Electrical resistance of the line phase insulation L 2
C p h 5 Capacitance between the phase conductor of line L 2 and ground
Table 2. Meaning of the notations in Figure 3.
U _ e + = U _ p h The positive-sequence of electromotive forces of the equivalent voltage generator (Thevenin) corresponding to the 20 kV mains terminals, considered from the fault point
Z _ T r + Positive-sequence impedance of transformer T r in Figure 1
Z _ T r Negative-sequence impedance of the transformer T r in Figure 1
Z _ L 5 + Positive-sequence impedance from the substation bus bars to the fault location on the faulted line ( L 5 in Figure 1)
Z _ L 5 Negative-sequence impedance from the substation bus bars to the fault location of on the faulted line ( L 5 in Figure 1)
Z _ L 5 0 Zero-sequence impedance from the substation bus bars to the fault location on the faulted line ( L 5 in Figure 1)
Z _ U T + Positive-sequence impedance of the utilities transformer
Z _ U T Negative-sequence impedance of the utilities transformer
X c 0 Zero-sequence capacitive reactance of electrical network with a nominal voltage 20 kV
R i n Equivalent electrical resistance corresponding to active power losses in the insulation of the electrical network with a nominal voltage of 20 kV
R t Resistance at the fault location
Table 3. Sequence parameters of the elements involved in Figure 1.
Equipment Name R +   =   R [ ] R 0 [ ] L +   =   L [ H ] L 0 [ ]
The transformer T r 0.2 0.0086
The utilities transformer U T 8.2 4.54
Line with fault ( L 5 ) 0.460.510.001210.00363
Table 4. Parameters of the 20 kV network.
Network Element I c 0 [ A ] R i s [ ] X C 0 [ ] C 0   =   3 C p h [ μ F ]
Network 20 kV 1.747 + j 18.068 = 18.15 × e j 84.48 ° 19,8291917.31.66
Line 20 kV L 1 0.362 + j 4.81 = 4.824 × e j 85.7 ° 95,6937201.90.441
Line 20 kV L 2 0.054 + j 1.54 = 1.541 × e j 88 ° 641,50022,494.20.141
Lin 20 kV L 3 1.261 + j 8.972 = 9.06 × e j 82.1 ° 27,47138610.824
Line 20 kV L 4 0.096 + j 2.648 = 2.65 × e j 88 ° 360,84413,0820.243
Table 5. Ratio values Z ( k ) Z ( 1 ) as a function of frequency (harmonic order) for Rt = 3.5 Ω, δ = 0, δ = 5.12⁰.
Frequency [Hz]/Harmonic Order50/1150/3250/5350/7450/9550/11650/13750/15
Impedance value/Impedance value at 50 Hz (fundamental) δ = 010.30880.15580.07970.02930.00960.04210.0709
Impedance value/Impedance value at 50 Hz (fundamental) δ = 5.12⁰10.31030.15660.08020.02950.00980.04240.0713
Table 6. Ratio values Z ( k ) Z ( 1 ) as a function of frequency (harmonic order) for Rt = 50 Ω, δ = 0, δ = 5.12⁰.
Frequency [Hz]/Harmonic Order50/1150/3250/5350/7450/9550/11650/13750/15
Impedance value/Impedance value at 50 Hz (fundamental) δ = 010.31790.17450.11240.08470.08010.08990.1064
Impedance value/Impedance value at 50 Hz (fundamental) δ = 5.12⁰10.31970.17580.11360.08570.08070.09020.1064
Table 7. Ratio values Z ( k ) Z ( 1 ) as a function of frequency (harmonic order) for Rt = 100 Ω, δ = 0, δ = 5.12⁰.
Frequency [Hz]/Harmonic Order50/1150/3250/5350/7450/9550/11650/13750/15
Impedance value/Impedance value at 50 Hz (fundamental) δ = 010.34280.21940.17510.15910.15670.16190.1714
Impedance value/Impedance value at 50 Hz (fundamental) δ = 5.12⁰10.34410.22000.17510.15860.15590.16070.1700
Table 8. Ratio values Z ( k ) Z ( 1 ) as a function of frequency (harmonic order) for Rt = 1000 Ω, δ = 0, δ = 5.12⁰.
Frequency [Hz]/Harmonic Order50/1150/3250/5350/7450/9550/11650/13750/15
Impedance value/Impedance value at 50 Hz (fundamental) δ = 010.91140.89870.89550.89450.89430.89460.8952
Impedance value/Impedance value at 50 Hz (fundamental) δ = 5.12⁰10.82920.81400.81010.80870.80840.80850.8090
Table 9. Ratio values Z ( k ) Z ( 1 ) as a function of frequency (harmonic order) for Rt = 5000 Ω, δ = 0, δ = 5.12⁰.
Frequency [Hz]/Harmonic Order50/1150/3250/5350/7450/9550/11650/13750/15
Impedance value/Impedance value at 50 Hz (fundamental) δ = 010.99280.99220.99210.99200.99200.99200.9921
Impedance value/Impedance value at 50 Hz (fundamental) δ = 5.12⁰10.98160.98010.97970.97960.97950.97950.9795
Table 10. Ratio values Z ( k ) Z ( 1 ) as a function of frequency (harmonic order) for Rt = 10,000 Ω, δ = 0, δ = 5.12⁰.
Frequency [Hz]/Harmonic Order50/1150/3250/5350/7450/9550/11650/13750/15
Impedance value/Impedance value at 50 Hz (fundamental) δ = 010.99820.99800.99800.99800.99800.99800.9980
Impedance value/Impedance value at 50 Hz (fundamental) δ = 5.12⁰10.99240.99180.99160.99160.99150.99150.9915
Table 11. Complex values of currents and zero sequence voltage of 20 kV bus bars in the transformer substation.
R t [Ω]3.5501005001000500010,000
I _ d [A] 19.25 × e j 84.48 ° 19.11 × e j 79.9 ° 17.81 × e j 75.6 ° 13.71 × e j 48.2 ° 9.36 × e j 30.61 ° 2.264 × e j 7.07 ° 1.185 × e j 3.57 °
U _ b 0 [V] 11 , 747 × e j 0.025 ° 11 , 466.4 × e j 4.61 ° 11 , 138.8 × e j 8.92 ° 8681.8 × e j 36.3 ° 5729.7 × e j 53.9 ° 1523.8 × e j 77.43 ° 725.4 × e j 80.93 °
I _ 1 [A] 5.11 × e j 86 ° 5.073 × e j 81.1 ° 4.728 × e j 76.8 ° 3.639 × e j 49.4 ° 2.485 × e j 31.8 ° 0.599 × e j 8.26 ° 0.314 × e j 4.76 °
I _ 2 [A] 1.62 × e j 88 ° 1.608 × e j 83.4 ° 1.499 × e j 79.1 ° 1.154 × e j 51.7 ° 0.787 × e j 34.1 ° 0.206 × e j 10.56 ° 0.0996 × e j 7.06 °
I _ 3 [A] 9.28 × e j 82 ° 9.213 × e j 77.4 ° 8.586 × e j 73.1 ° 6.609 × e j 45.7 ° 4.512 × e j 28.1 ° 1.197 × e j 4.57 ° 0.575 × e j 1.07 °
I _ 4 [A] 2.91 × e j 88 ° 2.889 × e j 83.4 ° 2.692 × e j 79.1 ° 2.073 × e j 51.6 ° 1.415 × e j 34.03 ° 0.377 × e j 10.49 ° 0.179 × e j 6.99 °
Table 12. Complex values of experimentally determined currents and voltages.
R t [Ω]3.5500010,000
I _ d [A] 18.15 × e j 84.489 ° 2.342 × e j 84.489 ° 1.202 × e j 84.489 °
U _ b 0 [ V ] 12 , 320 × e j 0.025 1645.3 × e j 0.025 785.4 × e j 0.025
I _ 1 [A] 4.82 × e j 86 ° 0.622 × e j 86 ° 0.319 × e j 86 °
I _ 2 [A] 1.54 × e j 88 ° 0.199 × e j 88 ° 0.102 × e j 88 °
  I _ 3 [A] 9.06 × e j 84 ° 1.169 × e j 84 ° 0.609 × e j 84 °
  I _ 4 [A] 2.75 × e j 88 ° 0.355 × e j 88 ° 0.182 × e j 88 °
U _ 1 [V] 21 , 210 × e j 149 ° 13 , 860 × e j 119 ° 12 , 910 × e j 120 °
U _ 2 [V] 21 , 120 × e j 151 ° 12 , 050 × e j 123 ° 12 , 110 × e j 124 °
U _ 3 [V] 192.3 × e j 0 10 , 900 × e j 2 ° 11 , 470 × e j 1 °
Table 13. The values of the total fault current distortion coefficient.
R t [Ω]3.5501001000500010,000
T H D I 0.83120.24430.18660.05250.04790.0477
Table 14. Ɛ% as a function of frequency (harmonic order) and 20 kV grid insulation loss angle.
R t [ Ω]/f[Hz] 50(1)150(3)250(5)350(7)450(9)550(11)650(13)750(15)
3.5−0.531−0.048−0.0120.0330.2151.5240.0620.015
500.2900.8581.0781.3391.4381.0770.6160.334
1001.0791.4821.3331.0790.7910.5480.3680.248
50001.2890.1480.0540.0270.0170.0110.0080.006
10,0000.6570.0740.0270.0140.0080.0060.0040.003
Table 15. Error Ɛ1% calculation of currents and voltages.
R t [Ω]3.5500010,000
I d [A]−6.0613.3311.414
U b 0 [V]4.657.3837.639
  I 1 0 [A]−6.0233.6981.567
I 2 0 [A]−5.212−3.5182.353
I 3 0 [A]−2.434−2.3955.583
I 4 0 [A]−5.824−6.1971.648
Publisher’s Note: MDPI stays neutral with regard to jurisdictional claims in published maps and institutional affiliations.

