Abstract
Photo-excited charge carriers play a vital role in photocatalysts and photovoltaics, and their dynamic processes must be understood to improve their efficiencies by controlling them. The photo-excited charge carriers in photocatalytic materials are usually trapped to the defect states in the picosecond time range and are subject to recombination to the nanosecond to microsecond order. When photo-excited charge carrier dynamics are observed via refractive index changes, especially in particulate photocatalytic materials, another response between the trapping and recombination phases is often observed. This response has always provided the gradual increase of the refractive index changes in the nanosecond order, and we propose that the shallowly trapped charge carriers could still diffuse and be trapped to other states during this process. We examined various photocatalytic materials such as TiO2, SrTiO3, hematite, BiVO4, and methylammonium lead iodide for similar rising responses. Based on our assumption of surface trapping with diffusion, the responses were fit with the theoretical model with sufficient accuracy. We propose that these slow charge trapping processes must be included to fully understand the charge carrier dynamics of particulate photocatalytic materials.
1. Introduction
Photo-excited charge carrier dynamics is a fundamental process for various photo-devices, such as solar cells and photocatalysts. In the field of solar cells, nanoparticulate semiconductor films have been used for charge transport and charge collection since the discovery dye-sensitized solar cells by Gratzel et al. [1,2]. In photocatalytic applications, mostly particulate aggregates consisting of semiconductor particles are used [3,4]. In these applications, the surfaces and interfaces are made of particles, and the charge carriers are subject to trap and decay, causing various different lifetimes due to the trap states. Additionally, the energy and reaction efficiencies for photovoltaics and photocatalysts are lowered due to the resulting recombination. Generally, such particulate films show totally different charge carrier dynamics compared to the crystalline form. For example, a single-crystalline titanium oxide (TiO2) shows a single exponential decay, [5] while the transient response for a particulate film consists of multiple different decays extending for multiple time orders [6,7,8].
Photo-excited charge carrier dynamics are usually studied using the time-resolved photoluminescence (TP) and transient absorption (TA) methods [5,9,10,11,12,13,14,15]. In the former method, the emission of the excited carriers is investigated by studying quenching due to defects and atmospheric conditions, but non-emissive carriers are neglected. The TA method covers the drawback via the observation of various charge carriers by selecting an appropriate wavelength for detection at different energy levels, but the measurement sensitivity is not as good as that of the TP method.
On the other hand, different types of methods have been developed for the observation of charge carrier dynamics via the refractive index change. The heterodyne transient grating (HD-TG) method [16,17] and pattern-illumination time-resolved phase microscopy (PI-PM) [18,19] have been applied for studies on the charge carrier dynamics of photocatalysts [20,21] and solar cells such as dye/quantum dot-sensitized and perovskite solar cells [22,23,24]. The PI-PM method was also applied for Z-scheme water-splitting photocatalysts and the spatially resolved catalytic activity was clarified on a micro-scale [25]. The charge carrier dynamics observed via the refractive index change were different from the ones observed via the photoluminescence (TP) or the absorption change (TA) methods, especially for the particulate samples. This is because optical phase changes due to the refractive index change are sensitive to the dipole changes at the interface, which is induced in the charge transfer processes at the interface, making this method preferable for monitoring the charge carriers at the interfaces [21,22].
There have been issues in the understanding of charge carrier dynamics; one is the difference between single crystals and the particulate films, and the other is the differences in the information obtained by different methods. With regard to the former issue, the charge carrier dynamics of single crystalline TiO2 and SrTiO3 showed a single exponential decay followed by an instantaneous rise caused by pump pulse irradiation [5,9]. However, particulate films show different charge responses. For TiO2 and SrTiO3 particulate films, photo-excited charge carriers are generally trapped within 100 ps at most, and the trapped carriers are decayed due to recombination on the order of microseconds [26,27]. With regard to the latter issue, TA responses showed a few types of decay responses with time constants of <100 ps and nanoseconds to microseconds for TiO2 [26,27] and for SrTiO3 [28,29,30]. In the TP method, two types of decay were observed in the visible and near-infrared region, corresponding to the trapped carriers at the shallow and the deep trap states, and the decay times ranged: <1 ns, hundreds of nanoseconds, and microseconds for TiO2 [31,32]. On the other hand, the charge carrier dynamics observed via the refractive index change showed an increase on the order of hundreds of nanoseconds followed by a 1–100 microsecond decay. Similarly, other particulate semiconductor films such as Fe2O3, BiVO4, and methylammonium lead iodide (MAPI) have also shown different responses [23].
The largest distinction in the response via the refractive index change was a rising component in the range of 10–1000 nanoseconds, which could not be assigned due to the charge trapping to the defect states, which occur <100 ps at the latest, from the other measurements. This is assumed to be due to the trapping process into the deep non-mobile states while the shallowly trapped carriers diffuse between particles.
Based on this assumption, a model was proposed for charge trapping during the diffusion for the responses of TiO2 and SrTiO3 particulate films. Additionally, the difference in the responses for the single crystal and the particulate films are shown. From the agreement with the theoretical model, it was proven that this type of trapping with diffusion is a generally observed process for particulate films. This result provides a whole picture of the photo-excited charge processes and will help researchers to understand the optimization of the photovoltaic and photocatalytic substrates.
2. Theory and Methods
Photo-excited charge carriers are usually trapped to the trap states on the order of picoseconds, and we assume that such trapped carriers can diffuse in position and can be trapped to another state on the order of hundreds of nanoseconds in particulate semiconductor materials. It is possible that such charge carriers are trapped at the shallow states and are subject to diffusion and recombination. The shallowly trapped charge carriers, N, can be expressed as,
where is the diffusion coefficient of the shallowly trapped charge carriers, is the decay time of the charge carriers, including recombination and other decays, and z is the direction to the film thickness. The shallowly trapped charge carriers are trapped to another trap state at the surface and is represented as
where S is the trap rate to another trap state. This model is calculated with an initial distribution of photo-excited charge carriers, which can be calculated as
where is the apparent penetration depth of the pump light. Since the film consists of particles, it is an ensemble average of the photo-excitation depth from the surface. The number of the trapped carriers to another state can be described as
Equations (1)–(3) can be analytically solved as [33]
where erfc indicates the error function and , which is necessary to solve Equation (4) to obtain , which is calculated as,
From this equation, is numerically obtained. When the number of trap states is limited, the effect was included as the open trap states as in Equation (4), and it was modified as
In the analyses of data, the recombination of the shallowly trapped charge carriers was neglected, that is, was much longer than the time needed for the increase of . Additionally, , , and were regarded as fitting parameters, and they were obtained by sampling using the Markov Chain Monte Carlo (MCMC) method, as the values for the posterior probability took the maximum value [34].
The PI-PM method was used for the time-resolved dynamics of the photo-excited charge carriers. The experimental procedures have been described previously [19]. In brief, an arbitrary pattern of light was illuminated onto a sample surface, and the refractive index contrast that was generated due to the photoexcited charge carriers and the temperature change was imaged via phase-contrast imaging. The experimental apparatus is shown in Figure S1 in the Supporting Information (SI). The pump beam was the third harmonics of an Nd:YAG pulse laser (pulse width: 5 ns, wavelength: 355 nm) (GAIA, Rayture Systems, Tokyo, Japan), and the probe light was the second harmonics of an Nd:YAG pulse laser (pulse width: 5 ns, wavelength: 532 nm) (GAIA, Rayture Systems, Tokyo, Japan). The pump pulse light was reflected by a digital micromirror device (DMD) (Light Crafter 4500, Texas Instruments, Dallas, USA), and the pattern was arbitrarily controlled by a computer. The image of the DMD mirror was irradiated as the same pattern but was reduced in size (1/14) onto a sample. The diameter of the area irradiated by the pump pulse was 0.5 mm. The pump light intensity was 0.8 mJ/pulse, and the probe light intensity was 0.02 mJ/pulse. While varying the time delay between the pump and probe pulse, a sequence of images was obtained and stored on a computer. The time resolution was only limited by the pulse width of the pump and probe light (3 ns). The response of the charge carrier dynamics was obtained by taking the Fourier transform in the horizontal direction to obtain the amplitude of the refractive index change. The signal-to-noise (SN) ratio was typically 5–10%, depending on the certain factors of the sample quality, such as surface roughness. The sensitivity for the refractive index change was .
Single crystals and particulate films of TiO2 and SrTiO3 were used. A TiO2 film was prepared by a titania nanoparticle paste with the crystal structure of anatase (PST-18NR, JGC Catalysts and Chemicals, Kitakyushu, Japan). A PST-18NR paste was coated on a glass slide (Matsunami Glass, Osaka, Japan) using the doctor-blade technique, and it was sintered at 450 °C for two hours to remove all of the solvents and chemicals included in the paste. For the preparation of a SrTiO3 film, the particles were synthesized via a solid-phase reaction [35]. The particle powder and ethanol were put into a mortar and were manually ground for 1 min, and this process was repeated 15 times. After that, ethanol, terpineol, and ethylcellulose were added and stirred manually for 10 min. Finally, the solution was evaporated to remove the ethanol to finish the paste. The paste was coated on a glass slide using the doctor-blade technique, and it was sintered at 450 °C for two hours. For single crystals of TiO2 and SrTiO3, we used a single crystal with a size of 10 × 10 × 0.5 mm and (110) surface, and both surfaces were polished. (Furuchi Chemicals, Tokyo, Japan)
For measurements of particulate films, a solid/liquid cell was prepared by putting another glass slide together with a silicon rubber spacer (thickness: 0.5 mm), and acetonitrile (ACN) was sandwiched within the gap. ACN was used as a liquid phase as an inert liquid, meaning that no charge transfer occurred from TiO2 and SrTiO3 to the liquid side [21]; otherwise, photo-excited electrons were scavenged from oxygen in air or liquid.
The SEM images for the TiO2 and SrTiO3 particulate films are shown in Figure S2. They were made of particles with sizes of 10–200 and 50–300 nm, respectively. The optical images for these samples are given together with the PI-PM image sequences in the results section. The analytical data for each sample can be found in previous papers [20,25].
3. Results and Discussions
The PI-PM image sequences for a single crystal and a particulate film of TiO2 are shown in Figure 1. In both of the samples, a contrast of the stripe patterns corresponding to the pump light pattern was recognized. The stripe contrast is proportional to the refractive index change due to the photo-excited charge carriers, and the temperature rise is due to the nonradiative relaxation of the charge carriers. The stripe profile for the single crystal shows a diffraction-like pattern by a slit (humps at the slit edges) due to the thick sample (0.5 mm). The stripe contrast disappeared on the order of microseconds due to thermal diffusion, which can be recognized by the smearing of the stripe patterns. The difference between the single crystal and the particulate film was noticed at an earlier time of <1 μs. In the case of the single crystal, the contrast of the refractive index changes appeared instantaneously after pump pulse irradiation, while the contrast for the particulate film grew gradually until 1 μs.
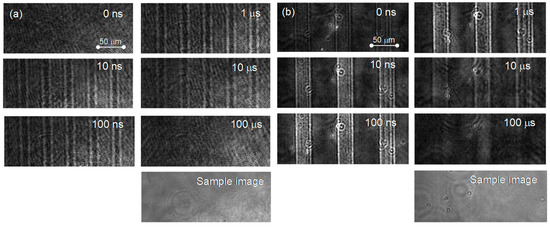
Figure 1.
The PI-PM image sequences for (a) a single crystal and (b) a particulate TiO2 film are shown. The optical images of the samples obtained under the same optical setup are also shown at the bottom of the sequences.
The temporal responses of the refractive index changes are shown in Figure 2 to clearly show the differences in the time responses. The stripe amplitude was calculated by taking the amplitude of the Fourier transform of each image in the horizontal direction. It is obvious that the signal increased instantaneously after the pump light irradiation for the single crystal and showed a gradual decay until ~100 ns, followed by decay with a time constant of ~600 ns. In the case of the particulate film, the signal gradually increased until ~1 μs, followed by decay to the microsecond order. The decay corresponded to the thermal diffusion that was previously reported. The thermal diffusion was an order faster for the single crystal than that for the particulate film [18]. We would like to emphasize the difference in the rising parts of the signals; the signal kept rising until ~1 μs for the particulate film, while the signal only decayed after the instantaneous increase cause by the pump pulse irradiation for the single crystal.
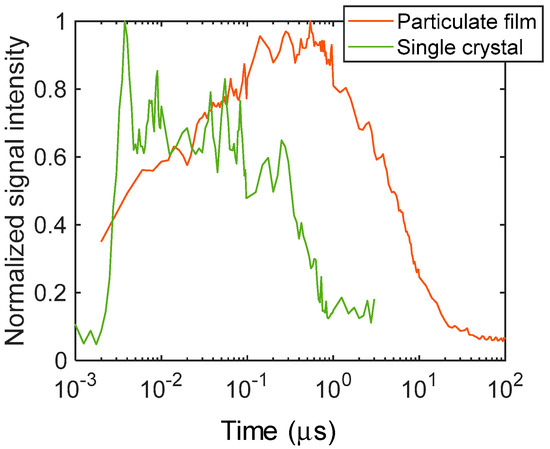
Figure 2.
The normalized temporal responses of the refractive index changes for the particulate film and the single crystal of TiO2 are shown. The signal amplitude was calculated from the images of Figure 1.
As was described in the introduction, photo-excited charge carriers are trapped in the trap states at least <100 ps for TiO2 particulate films, and the photo-excited charge carriers are subject to recombination on the order of nanoseconds to microseconds. With regard to the signal response for the single crystal, the signal increased within our time resolution (3 ns) and decayed with a time constant of 600 ns, which agreed with the literature values [5]. However, the signal rise over ~1 μs for the particulate film has not been observed by other techniques. Since it is around the time between when the charge carrier become trapped to the shallow states and the following recombination, we presume that the charge carriers could be in a state where they can diffuse between particles under the shallowly trapped condition.
Based on this assumption, we fitted our model to the signal and could obtain the parameters for the particulate film. The results are shown in Figure 3. The response was fitted with good accuracy (the coefficient of determination, R2 = 0.97). It is noted that the response could not be fitted with a simple exponential rise, as shown in the same graph. The unit of S could not be defined because we used the normalized signal intensity instead of the charge carrier density. The signal response was described with the diffusion-trapping model well.
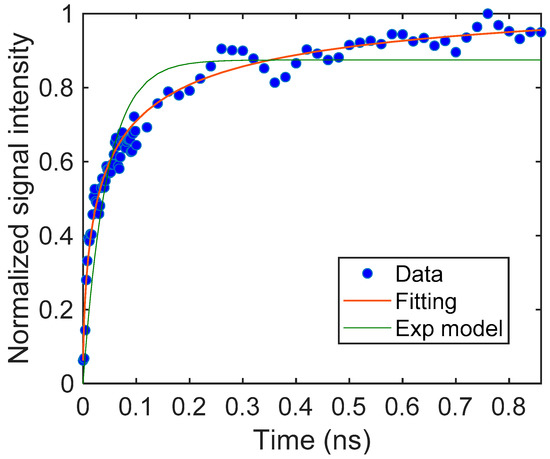
Figure 3.
The rising part of the TiO2 particulate film and the fitting curve obtained from Equation (4). The parameters were S = 18.2 (–), β = 6.16 (μm−1), and DN = 0.594 (μm2/μs). For comparison, a fitting curve using an exponential model is also shown.
The PI-PM image sequences for a single crystal and a particulate film of SrTiO3 are shown in Figure 3. In both image sequences, there is a contrast in the stripe patterns that decayed on the order of hundreds of nanoseconds. For the single crystal, the image showed a diffraction-like pattaern due to a slit, which was similar as in the case of TiO2. Different from the results of TiO2, the thermal response was almost negligible for SrTiO3 because the coefficient of the refractive index changes to the temperature is much lower for SrTiO3 [36]. Thus, the contrast of the phase image was due to the generation and decay of the photo-excited charge carriers in the case of SrTiO3. The difference between the single crystal and the particulate film was noticed in the earlier times of the sequences. In the case of the single crystal, the contrast of the refractive index changes appeared instantaneously after pump pulse irradiation, while the contrast for the particulate film grew gradually until 100 ns.
The temporal responses of the refractive index changes obtained from the image sequence of Figure 4 are displayed in Figure 5 to clearly show the differences in the time responses. It is obvious that the signal increased instantaneously after the pump light irradiation for the single crystal and showed a decay with a time constant of 35 ns. In the case of the particulate film, the signal increased gradually until ~100 ns, followed by an exponential decay with a time constant of 170 ns. The difference was noted again in the rising portion of the signals.
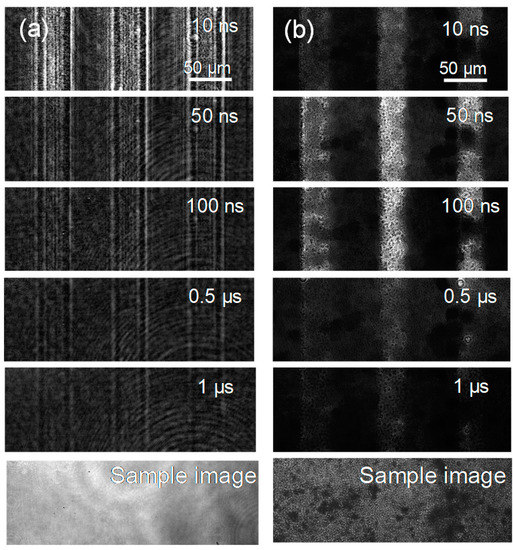
Figure 4.
The PI-PM image sequences for (a) a single crystal and (b) a particulate film of SrTiO3 are shown. The sample images obtained under the same optical setup are also shown at the bottom of each sequence.
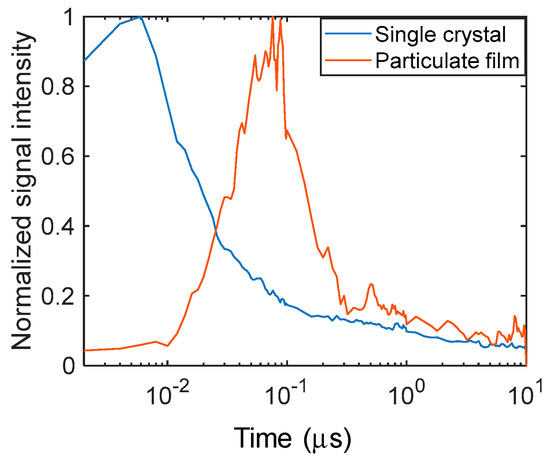
Figure 5.
The normalized temporal responses of the refractive index changes for the particulate film and the single crystal of SrTiO3 are shown. The signal amplitude was calculated from the images of Figure 4.
As described in the Introduction, the photo-excited charge carriers are trapped to the trap states at least <100 ps for SrTiO3, and the photo-excited charge carriers are subject to recombination on the order of nanoseconds. With regard to the signal response for the single crystal, the signal increased within our time resolution (3 ns) and decayed with a time constant of 35 ns, which was on a similar time order as the literature values [9]. However, the signal rise of about ~100 ns for the particulate film has not been observed by other techniques. Again, we presumed that the charge carriers could be in a state where they could diffuse between particles under the shallowly trapped condition.
In the case of the rising curve for SrTiO3, the response started with a smaller slope at the beginning and gradually increased and became saturated. This type of response cannot be predicted with Equation (4), which corresponds to the trapping that occurs during the diffusion processes, where the signal rise has the largest slope at the initial part. When we assume that the number of trap sites is limited, Equation (4) is modified to Equation (7), which provides a sigmoid-type response curve. The response curve was fitted well with this theoretical prediction, with a R2 value of 0.98. (Figure 6) This indicates that the number of trap sites could be limited compared to the number of excited charge carriers.
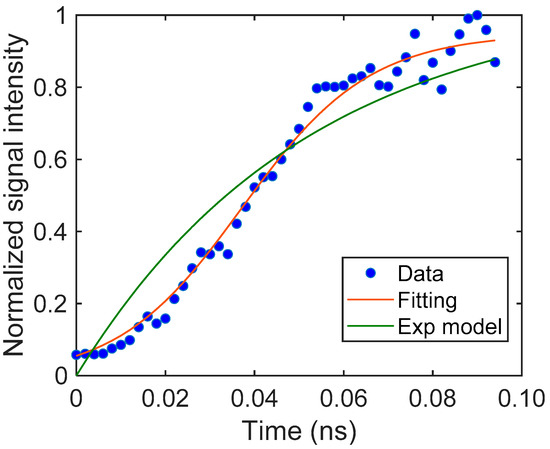
Figure 6.
The rising part of the SrTiO3 particulate film and the fitting curve obtained from Equation (7). The parameters were S = 0.436 (–), β = 0.145 (μm−1), DN = 1.03 (μm2/μs). For comparison, a fitting curve using an exponential model is also shown.
A rise on the order of nanoseconds was observed for various different films made of photocatalytic materials, such as BiVO4 and hematite, as well as for those made from a perovskite material, MAPI. (Figures S3–S5 in SI) The rising curve and fitting data, together with the time-resolved image sequences, are listed in the supporting information. The hematite and MAPI films were modeled with Equation (4), and the BiVO4 film was modeled with Equation (7). This indicates that the number of trapping states may depend on the material and its conditions.
Based on these results, the diffusion-induced trapping of the photo-excited charge carriers is a general phenomenon for particulate photocatalytic substrates, but it cannot be observed by conventional time-resolved methods such as TA and TP. The time-resolved method via the refractive index change is a compensating method that fully covers the important processes of photo-excited charge carriers.
4. Conclusions
We often observed the charge carrier dynamics via the refractive index changes that were not observed by other time-resolved methods such as the TA and TP methods, especially for particulate photocatalytic materials. Since the response was observed in the time region between charge carrier trapping in the picosecond time region and during recombination in the nano-to-micro second time region, we assumed that the shallowly trapped charge carriers could be moved to another state between the trapping sites before the recombination processes. The signal rising curve was modeled based on the assumption, and the responses were fitted well with the theoretical prediction. This research indicates that the time-resolved dynamics could have missed some invisible processes in the conventional time-resolved methods, and such invisible processes can be compensated for via the observation of refractive index changes.
Supplementary Materials
The following are available online at https://www.mdpi.com/article/10.3390/en14217011/s1, Figure S1: The details of the experimental setup, Figure S2: SEM images of samples, Figures S3–S5 time-resolved images and analyses for hematite, BiVO4, and MAPI.
Author Contributions
T.C. and K.K. (Kei Kawaguchi) conducted the experiments, and K.K. (Kenji Katayama) analyzed the data and wrote the manuscript. All of the authors reviewed the manuscript. All authors have read and agreed to the published version of the manuscript.
Funding
The research was financially supported by JST PRESTO (#JPMJPR1675) and the Institute of Science and Engineering, Chuo University and the Iron and Steel Institute of Japan.
Institutional Review Board Statement
Not applicable.
Informed Consent Statement
Not applicable.
Data Availability Statement
All the data are available on request.
Conflicts of Interest
The authors declare no conflict of interest.
List of Symbols
| Number density of shallowly trapped charge carriers; | |
| Number density of deeply trapped charge carriers; | |
| Available maximum number density of deeply trapped charge carriers; | |
| Diffusion coefficient of shallowly trapped charge carriers; | |
| Decay time of shallowly trapped charge carriers; | |
| Trap rate of shallowly trapped charge carriers; | |
| Apparent penetration depth of light absorption. |
References
- O’Regan, B.; Grätzel, M. A Low-Cost, High-Efficiency Solar Cell Based on Dye-Sensitized Colloidal TiO2 Films. Nature 1991, 353, 737–740. [Google Scholar] [CrossRef]
- Grätzel, M. Dye-Sensitized Solar Cells. J. Photochem. Photobiol. C Photochem. Rev. 2003, 4, 145–153. [Google Scholar] [CrossRef]
- Wang, Z.; Li, C.; Domen, K. Recent Developments in Heterogeneous Photocatalysts for Solar-Driven Overall Water Splitting. Chem. Soc. Rev. 2019, 48, 2109–2125. [Google Scholar] [CrossRef]
- Wang, Q.; Okunaka, S.; Tokudome, H.; Hisatomi, T.; Nakabayashi, M.; Shibata, N.; Yamada, T.; Domen, K. Printable Photocatalyst Sheets Incorporating a Transparent Conductive Mediator for Z-Scheme Water Splitting. Joule 2018, 2, 2667–2680. [Google Scholar] [CrossRef]
- Yamada, Y.; Kanemitsu, Y. Determination of Electron and Hole Lifetimes of Rutile and Anatase TiO2 Single Crystals. Appl. Phys. Lett. 2012, 101, 133907. [Google Scholar] [CrossRef]
- Yamakata, A.; Ishibashi, T.; Onishi, H. Time-Resolved Infrared Absorption Spectroscopy of Photogenerated Electrons in Platinized TiO2 Particles. Chem. Phys. Lett. 2001, 333, 271–277. [Google Scholar] [CrossRef]
- Yamakata, A.; Ishibashi, T.; Onishi, H. Water- and Oxygen-Induced Decay Kinetics of Photogenerated Electrons in TiO2 and Pt/TiO2: A Time-Resolved Infrared Absorption Study. J. Phys. Chem. B 2001, 105, 7258–7262. [Google Scholar] [CrossRef]
- Yamakata, A.; Ishibashi, T.; Onishi, H. Electron- and Hole-Capture Reactions on Pt/TiO2 Photocatalyst Exposed to Methanol Vapor Studied with Time-Resolved Infrared Absorption Spectroscopy. J. Phys. Chem. B 2002, 106, 9122–9125. [Google Scholar] [CrossRef]
- Yamada, Y.; Yasuda, H.; Tayagaki, T.; Kanemitsu, Y. Photocarrier Recombination Dynamics in Highly Excited SrTiO3 Studied by Transient Absorption and Photoluminescence Spectroscopy. Appl. Phys. Lett. 2009, 95, 121112. [Google Scholar] [CrossRef]
- Qian, R.; Zong, H.; Schneider, J.; Zhou, G.; Zhao, T.; Li, Y.; Yang, J.; Bahnemann, D.W.; Pan, J.H. Charge Carrier Trapping, Recombination and Transfer during TiO2 Photocatalysis: An Overview. Catal. Today 2019, 335, 78–90. [Google Scholar] [CrossRef]
- Gabriel, M.M.; Kirschbrown, J.R.; Christesen, J.D.; Pinion, C.W.; Zigler, D.F.; Grumstrup, E.M.; Mehl, B.P.; Cating, E.E.M.; Cahoon, J.F.; Papanikolas, J.M. Direct Imaging of Free Carrier and Trap Carrier Motion in Silicon Nanowires by Spatially-Separated Femtosecond Pump–Probe Microscopy. Nano Lett. 2013, 13, 1336–1340. [Google Scholar] [CrossRef]
- Zhu, T.; Yuan, L.; Zhao, Y.; Zhou, M.; Wan, Y.; Mei, J.; Huang, L. Highly Mobile Charge-Transfer Excitons in Two-Dimensional WS2/Tetracene Heterostructures. Sci. Adv. 2018, 4, eaao3104. [Google Scholar] [CrossRef] [PubMed]
- Guo, Z.; Wan, Y.; Yang, M.; Snaider, J.; Zhu, K.; Huang, L. Long-Range Hot-Carrier Transport in Hybrid Perovskites Visualized by Ultrafast Microscopy. Science 2017, 356, 59–62. [Google Scholar] [CrossRef] [PubMed]
- Fischer, M.C.; Wilson, J.W.; Robles, F.E.; Warren, W.S. Invited Review Article: Pump-Probe Microscopy. Rev. Sci. Instrum. 2016, 87, 031101. [Google Scholar] [CrossRef]
- Wang, X.; Shen, S.; Feng, Z.; Li, C. Time-Resolved Photoluminescence of Anatase/Rutile TiO2 Phase Junction Revealing Charge Separation Dynamics. Chin. J. Catal. 2016, 37, 2059–2068. [Google Scholar] [CrossRef]
- Katayama, K.; Yamaguchi, M.; Sawada, T. Lens-Free Heterodyne Detection for Transient Grating Experiments. Appl. Phys. Lett. 2003, 82, 2775–2777. [Google Scholar] [CrossRef]
- Okuda, M.; Katayama, K. Selective Detection of Real and Imaginary Parts of Refractive Index Change in Solutions Induced by Photoexcitation Using Near-Field Heterodyne Transient Grating Method. Chem. Phys. Lett. 2007, 443, 158–162. [Google Scholar] [CrossRef]
- Ebihara, M.; Sohn, W.Y.; Katayama, K. Lifetime Mapping of Photo-Excited Charge Carriers by the Transient Grating Imaging Technique for Nano-Particulate Semiconductor Films. Rev. Sci. Instrum. 2019, 90, 073905. [Google Scholar] [CrossRef]
- Katayama, K. Photo-Excited Charge Carrier Imaging by Time-Resolved Pattern Illumination Phase Microscopy. J. Chem. Phys. 2020, 153, 054201. [Google Scholar] [CrossRef] [PubMed]
- Ebihara, M.; Katayama, K. Anomalous Charge Carrier Decay Spotted by Clustering of a Time-Resolved Microscopic Phase Image Sequence. J. Phys. Chem. C 2020, 124, 23551–23557. [Google Scholar] [CrossRef]
- Kuwahara, S.; Katayama, K. Distinction of Electron Pathways at Titanium Oxide/Liquid Interfaces in Photocatalytic Processes and Co-Catalyst Effects. Phys. Chem. Chem. Phys. 2016, 18, 25271–25276. [Google Scholar] [CrossRef]
- Kuwahara, S.; Hata, H.; Taya, S.; Maeda, N.; Shen, Q.; Toyoda, T.; Katayama, K. Detection of Non-Absorbing Charge Dynamics via Refractive Index Change in Dye-Sensitized Solar Cells. Phys. Chem. Chem. Phys. 2013, 15, 5975–5981. [Google Scholar] [CrossRef] [PubMed]
- Chugenji, T.; Ebihara, M.; Katayama, K. Charge Carrier Inhomogeneity of MAPbI3 Clarified by the Clustering of the Time-Resolved Microscopic Image Sequence. ACS Appl. Energy Mater. 2021, 4, 6430–6435. [Google Scholar] [CrossRef]
- Osada, N.; Oshima, T.; Kuwahara, S.; Toyoda, T.; Shen, Q.; Katayama, K. Photoexcited Carrier Dynamics of Double-Layered CdS/CdSe Quantum Dot Sensitized Solar Cells Measured by Heterodyne Transient Grating and Transient Absorption Methods. Phys. Chem. Chem. Phys. 2014, 16, 5774–5778. [Google Scholar] [CrossRef][Green Version]
- Ebihara, M.; Ikeda, T.; Okunaka, S.; Tokudome, H.; Domen, K.; Katayama, K. Charge Carrier Mapping for Z-Scheme Photocatalytic Water-Splitting Sheet via Categorization of Microscopic Time-Resolved Image Sequences. Nat. Commun. 2021, 12, 3716. [Google Scholar] [CrossRef] [PubMed]
- Yamakata, A.; Vequizo, J.J.M. Curious Behaviors of Photogenerated Electrons and Holes at the Defects on Anatase, Rutile, and Brookite TiO2 Powders: A Review. J. Photochem. Photobiol. C Photochem. Rev. 2019, 40, 234–243. [Google Scholar] [CrossRef]
- Vequizo, J.J.M.; Matsunaga, H.; Ishiku, T.; Kamimura, S.; Ohno, T.; Yamakata, A. Trapping-Induced Enhancement of Photocatalytic Activity on Brookite TiO2 Powders: Comparison with Anatase and Rutile TiO2 Powders. ACS Catal. 2017, 7, 2644–2651. [Google Scholar] [CrossRef]
- Kato, K.; Yamakata, A. Defect-Induced Acceleration and Deceleration of Photocarrier Recombination in SrTiO3 Powders. J. Phys. Chem. C 2020, 124, 11057–11063. [Google Scholar] [CrossRef]
- Furuhashi, K.; Jia, Q.; Kudo, A.; Onishi, H. Time-Resolved Infrared Absorption Study of SrTiO3 Photocatalysts Codoped with Rhodium and Antimony. J. Phys. Chem. C 2013, 117, 19101–19106. [Google Scholar] [CrossRef]
- Kato, K.; Jiang, J.; Sakata, Y.; Yamakata, A. Effect of Na-Doping on Electron Decay Kinetics in SrTiO3 Photocatalyst. ChemCatChem 2019, 11, 6349–6354. [Google Scholar] [CrossRef]
- Vequizo, J.J.M.; Kamimura, S.; Ohno, T.; Yamakata, A. Oxygen Induced Enhancement of NIR Emission in Brookite TiO2 Powders: Comparison with Rutile and Anatase TiO2 Powders. Phys. Chem. Chem. Phys. 2017, 20, 3241–3248. [Google Scholar] [CrossRef] [PubMed]
- Brüninghoff, R.; Wenderich, K.; Korterik, J.P.; Mei, B.T.; Mul, G.; Huijser, A. Time-Dependent Photoluminescence of Nanostructured Anatase TiO2 and the Role of Bulk and Surface Processes. J. Phys. Chem. C 2019, 123, 26653–26661. [Google Scholar] [CrossRef]
- Tanaka, T.; Harata, A.; Sawada, T. Subpicosecond Surface-Restricted Carrier and Thermal Dynamics by Transient Reflectivity Measurements. J. Appl. Phys. 1997, 82, 4033–4038. [Google Scholar] [CrossRef]
- Haario, H.; Laine, M.; Mira, A.; Saksman, E. DRAM: Efficient Adaptive MCMC. Stat. Comput. 2006, 16, 339–354. [Google Scholar] [CrossRef]
- Yamada, K.; Suzuki, H.; Abe, R.; Saeki, A. Complex Photoconductivity Reveals How the Nonstoichiometric Sr/Ti Affects the Charge Dynamics of a SrTiO3 Photocatalyst. J. Phys. Chem. Lett. 2019, 10, 1986–1991. [Google Scholar] [CrossRef] [PubMed]
- Toyoda, T.; Yabe, M. The Temperature Dependence of the Refractive Indices of SrTiO3 and TiO2. J. Phys. Appl. Phys. 1983, 16, L251–L255. [Google Scholar] [CrossRef]


Publisher’s Note: MDPI stays neutral with regard to jurisdictional claims in published maps and institutional affiliations. |
© 2021 by the authors. Licensee MDPI, Basel, Switzerland. This article is an open access article distributed under the terms and conditions of the Creative Commons Attribution (CC BY) license (https://creativecommons.org/licenses/by/4.0/).