Article

How CO2-to-Diesel Technology Could Help Reach Net-Zero Emissions Targets: A Canadian Case Study

1
National Research Council Canada, Ottawa, ON K1A 0R6, Canada
2
Robert F. Smith School of Chemical and Biomolecular Engineering, Cornell University, Ithaca, NY 14853, USA
*
Author to whom correspondence should be addressed.
Energies 2021, 14(21), 6957; https://doi.org/10.3390/en14216957
Submission received: 20 September 2021 / Revised: 12 October 2021 / Accepted: 19 October 2021 / Published: 22 October 2021
(This article belongs to the Section B3: Carbon Emission and Utilization)

Abstract

:
Carbon capture, utilization, and storage (CCUS) is an attractive technology for the decarbonization of global energy systems. However, its early development stage makes impact assessment difficult. Moreover, rising popularity in carbon pricing necessitates the development of a methodology for deriving carbon abatement costs that are harmonized with the price of carbon. We develop, using a combined bottom-up analysis and top-down learning curve approach, a levelized cost of carbon abatement (LCCA) model for assessing the true cost of emissions mitigation in CCUS technology under carbon pricing mechanisms. We demonstrate our methodology by adapting three policy scenarios in Canada to explore how the implementation of CO2-to-diesel technologies could economically decarbonize Canada’s transportation sector. With continued policy development, Canada can avoid 932 MtCO2eq by 2075 at an LCCA of CA$209/tCO2eq. Technological learning, low emission hydroelectricity generation, and cost-effective electricity prices make Quebec and Manitoba uniquely positioned to support CO2-to-diesel technology. The additional policy supports beyond 2030, including an escalating carbon price, CO2-derived fuel blending requirements, or investment in low-cost renewable electricity, which can accelerate market diffusion of CO2-to-diesel technology in Canada. This methodology is applicable to different jurisdictions and disruptive technologies, providing ample foci for future work to leverage this combined technology learning + LCCA approach.

Graphical Abstract

1. Introduction

Anthropogenic emissions of carbon dioxide (CO2) and other greenhouse gases (GHGs) have led to rising global temperatures, leading to concern over the effects of global climate change. In 2018 alone, 33.5 billion metric tonnes of CO2 emissions [1] were emitted globally. One technology with high potential for emissions reduction is the synthesis of fuels through carbon capture, utilization, and storage (CCUS). Under the International Energy Agency’s (IEA) Sustainable Development Scenario, the production of synthetic fuels through CCUS is projected to begin in 2025 [2]. CCUS has the advantage of being able to provide a value-added product to offset CO2 capture costs [3]. Furthermore, CCUS offers an attractive option for drop-in substitution with fossil fuel feedstock when the product can be produced at a lower cost and with reduced emissions [4]. While current cost estimates for products generated through CCUS pathways are high [5], policy mechanisms such as carbon pricing [5,6] can help stimulate technology diffusion by gradually incentivizing low-emission technologies.
Currently, one of the largest barriers for large-scale deployment of CCUS is the low technology readiness level (TRL), or maturity, of CCUS processes [5,7,8]. This can lead to data gaps [8] when assessing the life cycle costs and emissions associated with scaling and deploying the technology. Previous studies have aimed to overcome this gap by vetting low TRL CCUS projects using key indicators like reaction stoichiometry [9], energy efficiency [10], or a combination of primary data and performance calculations [8]. However, these indicators do not consider resulting commercial competitiveness rooted in technological improvements, market demands, and policy supports. Moreover, methodologies such as learning curve cost projections [11] or carbon abatement costs [12] have been proposed to capture the economic outlook of these technologies. Still, the former suffers from a lack of explicit environmental evaluation while the latter does not consider indirect costs from the substitution of an incumbent technology [13].
A reliable approach for assessing low TRL CCUS pathways that are both scalable and result in significant emissions reduction is necessary to identify the most climate promising technologies for investment towards future research, development, and demonstration (RD&D). The development and demonstration of such a methodology provides an opportunity to address these highlighted gaps in low carbon energy technology assessment, offering an accurate and forward-looking solution.
Canada, ranked as the highest-scoring nation [14] in carbon capture and storage (CCS) readiness, serves as a good case study for demonstrating this methodology. As the world’s tenth largest economy [15], Canada emitted 2% [1] of global emissions with 565 million metric tonnes of CO2 in 2018. Moreover, the transportation sector was responsible for over 25% [16] of Canada’s emissions in 2018, making it a key sector for reducing national emissions. To meet their Paris Agreement pledge of net-zero emissions by 2050 [17], the Government of Canada has developed a Clean Fuel Standard [18] which aims to reduce the emission intensity of transportation fuels. This is complemented by a federal carbon price pledge of CA$170/tCO2 [19] in 2030. To complement these policies, CO2-to-diesel pathways [20,21] provide an attractive CCUS technology for decarbonizing Canada’s transportation sector. In 2018, nearly 30% [22] of all transport fuel demand in Canada came from diesel. Furthermore, diesel has a higher emission intensity than gasoline [23], making it a good candidate for targeted emission intensity reduction. Domestic production of next-generation low-emission diesel will help Canada maintain its competitive advantage as global energy markets shift to more sustainable solutions.
Herein, we present a methodology for assessing the climate benefit of low TRL CCUS technologies compared to other technologies using a levelized cost of carbon abatement (LCCA) that accounts for all costs and emissions associated with deploying a new technology. A learning curve approach to a CO2-to-diesel process demonstrates both cost and emission reductions as this technology matures. Leveraging this model, we evaluate the potential of this CO2-to-diesel process under three policy scenarios in Canada up to 2050. We also perform a sensitivity analysis to understand the uncertainty of particular market factors. A survey of Canada’s policy landscape highlights mechanisms that can improve the cost of emissions mitigation from the proposed CO2-to-diesel process in relation to the federal carbon price. While we apply this approach to a specific CCUS process in the context of Canada’s climate plan, this methodology can be applied to different technologies and policy environments. This methodology is better suited for cases where robust data are available and limited for cases where data are unreliable. Furthermore, this methodology becomes more specific as the geographical region studied becomes more specific, and vice-versa.

2. Methods

2.1. Hybrid Approach to Levelized Cost of Carbon Abatement Projections

We base our model on the principles outlined in the methodological report for determining a harmonized levelized cost of carbon abatement (LCCA). As defined in this report, the LCCA measures “how much CO2 can be reduced by a specific investment or policy, taking into account relevant factors related to geography and specific asset” [13]. Simply put, it provides the cost per unit of CO2 emission avoided, often expressed in $/tCO2:
L = C E 0 E 1
Here L represents LCCA, C represents the cost for the technology replacement, E0 represents the CO2 emissions from the original technology, and E1 represents the CO2 emissions from the new technology. Importantly, this includes emissions avoided from operation and replacement of feedstock. A more descriptive form of this equation is as follows:
L = C 1 , c a p e x + C 1 , o p e x C 0 , o p e x , a v C 0 , c a p e x , l o s s E 0 E 1
Here, C1 refers to the costs incurred from deploying the new technology, including the capital costs (C1,capex) and the present value operating costs (C1,opex), which is dependent on factors including the overall plant lifetime and energy costs to upgrade CO2. Likewise, C0 refers to the costs incurred from retiring the incumbent technology. This includes the capital losses associated with retiring the technology early (C0,capex,loss), minus the present value operating costs avoided from stopping operating of the plant (C0,opex,av).
Using the LCCA, we can assess the potential of promising CCUS technology through a hybrid bottom-up, top-down approach [11]. The bottom-up component refers to a comprehensive techno-economic analysis (TEA) and life cycle assessment (LCA) used to rigorously estimate the state of a current CCUS process. For our purposes, we use this analysis to derive an LCCA for our initial technology scenario. In the case of future scenarios, a bottom-up model is no longer appropriate since it is difficult to predict the technologies or processes used. The top-down component [11] refers to future estimates based on technology learning curves (TLCs) which capture the reduction in production costs relative to the cumulative production volume of a specific technology.
We apply a component-based TLC approach, where the overall learning of a system is constructed from learning rates for individual components of the system [24]. This is valuable for technologies that have not reached the market yet, such as CCUS, since learning for the entire system is not fully understood. Furthermore, cost reductions can be attributed to specific components [24] through cost reductions from mass production, changing material costs, reductions in material usage, or improvements in manufacturing time. This component-based approach is explained mathematically through the following equation:
C ( X t ) = i = 1 n C 0 i X t X 0 α i
Here, the change in cost of each individual component (C) is related to the change in process capacity (X) from time 0 to time t through the learning index, α i . Overall, this is a disaggregated form of a one-factor learning curve (OFLC) [24]. Since TLC studies are often interested in the cost reduction for every doubling of capacity, this relationship can be generalized to the cost reduction for the doubling of production volume, known as the progress ratio, p r i :
p r i = C ( 2 X 0 ) C 0 i = 2 X 0 X 0 α i = 2 α i
Finally, the progress ratio and learning index can be related to the learning rate,   l r i :
l r i = 1 p r i = 1 2 α i
Similarly, we use this component-based learning rate method to estimate the energy efficiency improvements associated with individual units. Through this approach, the LCCA can be determined at a particular point in time. Then, we can derive a final form for the LCCA, expressed as a function of time:
L t = C 1 , c a p e x t + C 1 , o p e x t C 0 , o p e x , a v t C 0 , c a p e x , l o s s t E 0 t E 1 t
Through a time-dependent LCCA, we can elucidate the relationship between innovation, emissions reduction, and low carbon government policies such as the Clean Fuel Standard [25], which uses an increasing carbon price as its cornerstone for emissions reduction.

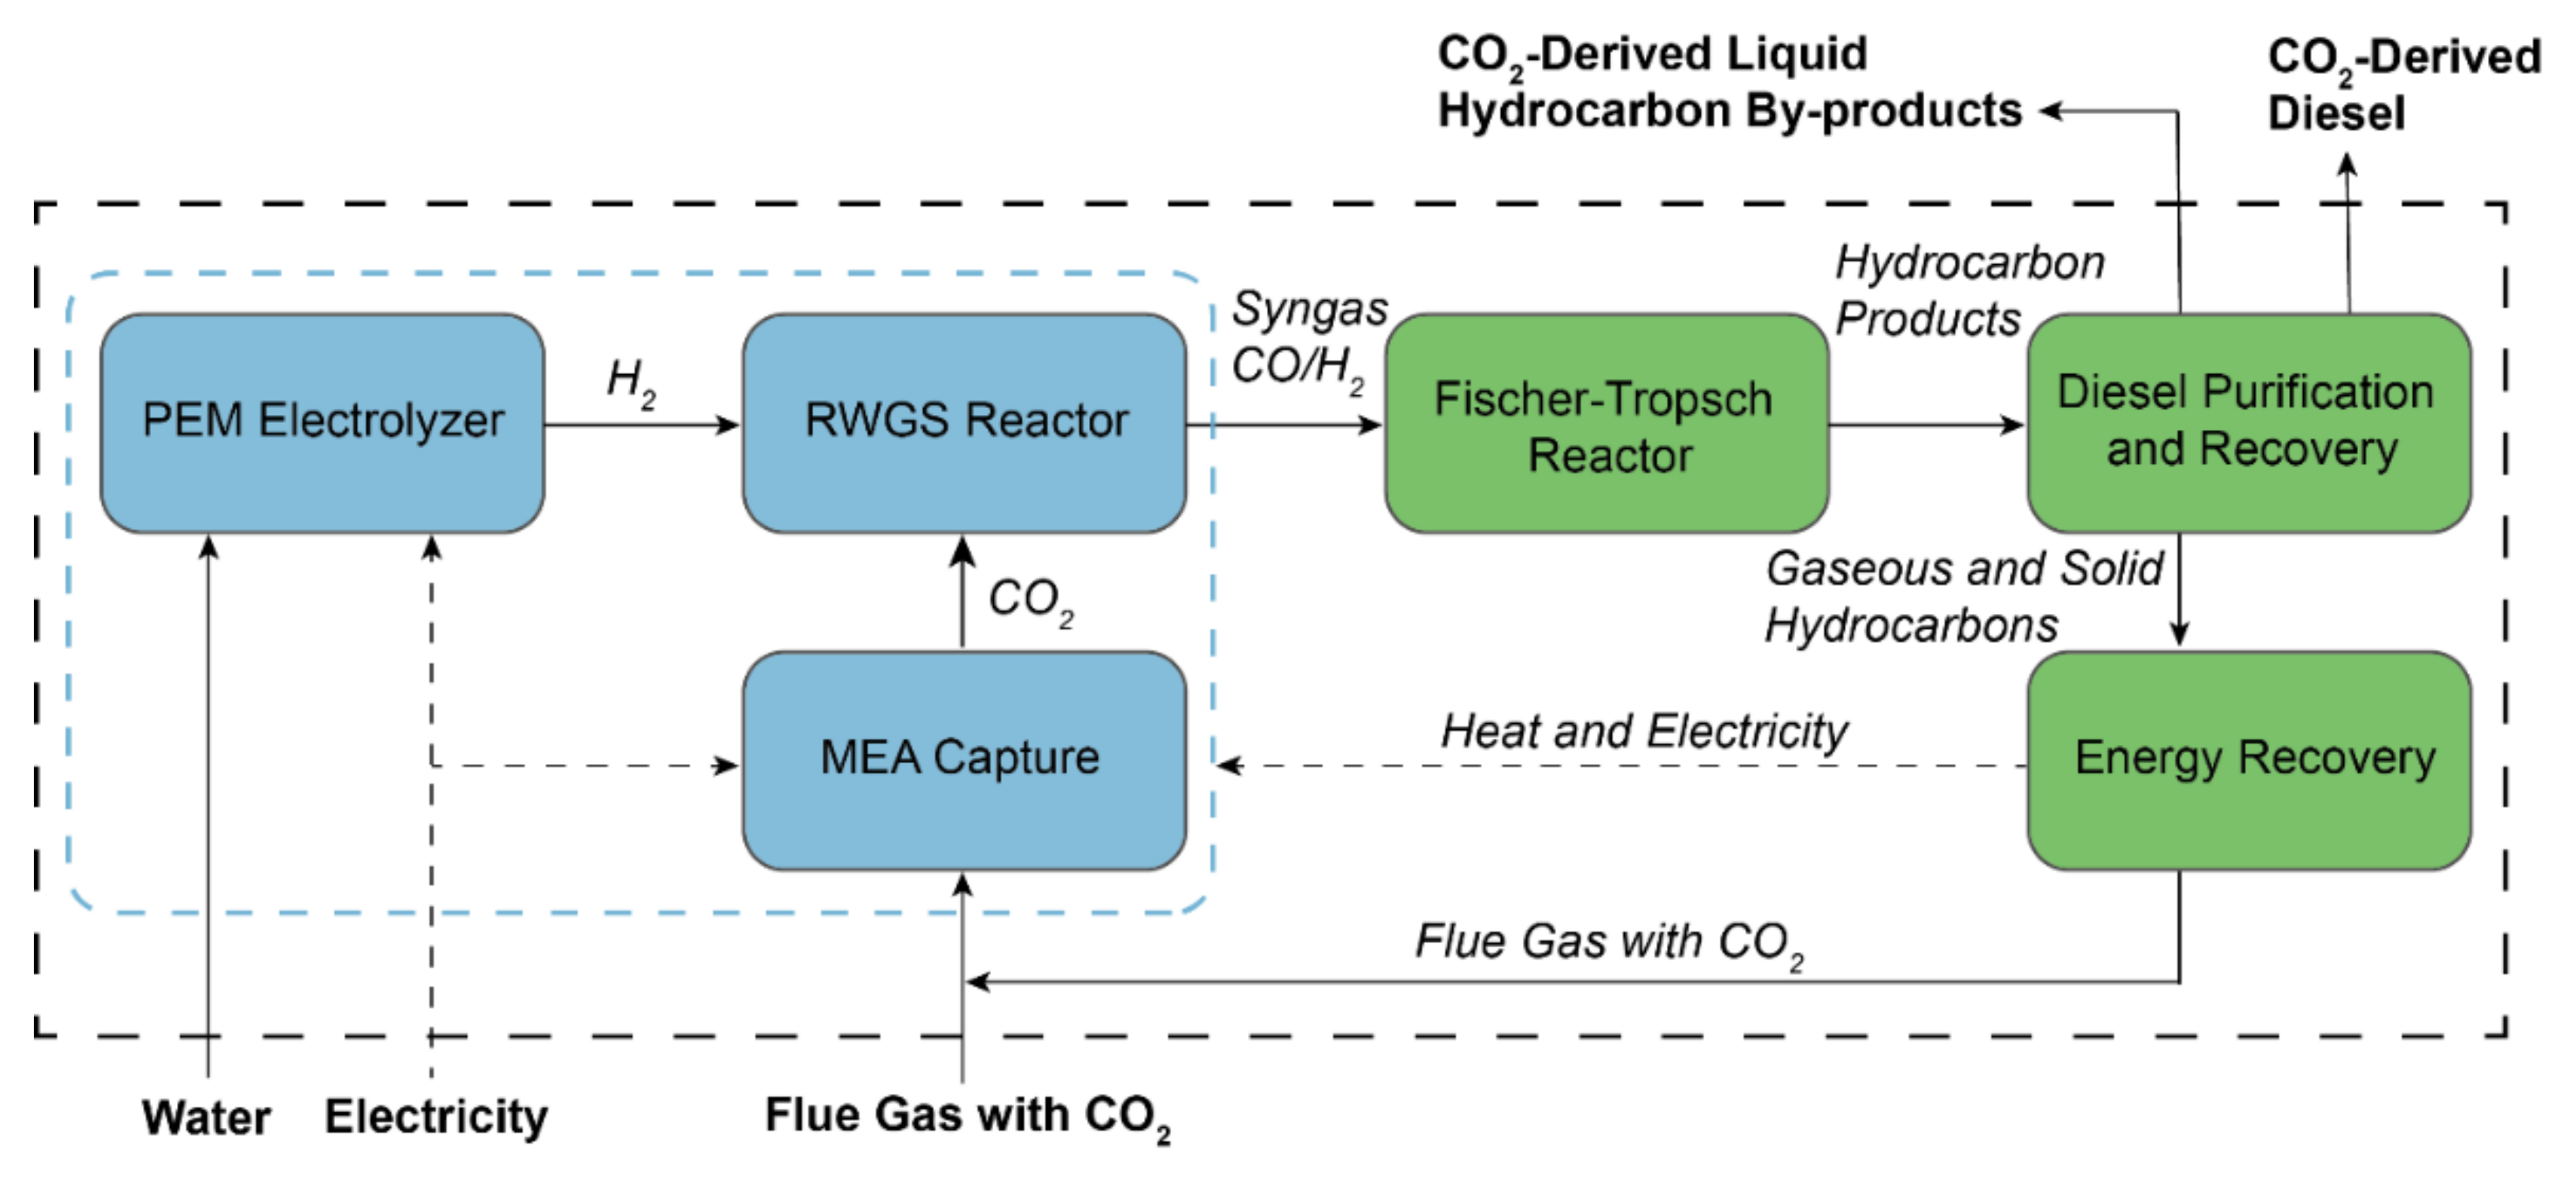
2.2. CO2-to-Diesel Case Study

We apply the described methodology to assess the development of the CO2-to-diesel process provided in Figure 1, developing a mass and energy balance to support a TEA and LCA (Figure S1, Tables S1–S4). Briefly, CO2 feedstock is captured using a Monoethanolamine (MEA)-based capture system while hydrogen is generated through electrolysis which converts water and electricity into H2. The gaseous feedstocks are then combined and sent through a reverse water gas shift (RWGS) reactor, producing the desired CO/H2 syngas ratio. The syngas is then fed to a Fischer Tropsch (FT) reactor, where it is converted to a distribution of hydrocarbon molecules. Units downstream of the FT reactor serve the purpose of recovering the diesel fuel from the other by-products. This includes water separation, product recovery through hydrotreating, isomerization, reforming, upgrading, separation of gaseous and wax hydrocarbons, and combustion of the final non-diesel products for heat generation and flue gas for recycling to the FT reactor after CO2 separation. The flue gas generated from heat generation can be recycled for additional CO2 feedstock.
Currently, there are no large-scale CCUS processes in operation in Canada, excluding those using captured CO2 for enhanced oil recovery. Instead, we use the Shell Quest CCS plant [26] as our reference capacity, which began operation in 2015 and captures one MtCO2/year. To ensure economies-of-scale do not influence the observed cost reductions, we assume one MtCO2/year plant is constructed every year from 2026 and 2049, with the operation of each plant beginning the year following construction from 2027 to 2050. Initial plant construction in 2026 is in line with Canada’s Clean Fuel Standard which estimates blending of hydrogenation-derived renewable diesel (HDRD) [25] is projected to begin in 2026. We assume CO2-derived renewable diesel to be equivalent to HDRD in our work due to technological similarities [27] for production. Additional technical details are provided in the SI.
Utility costs, product demand, and utility demand were estimated using estimates from Canada Energy Regulator (CER), using the 2020 Energy Futures Evolving Scenario data [22,28] which makes projections under the assumption that current policy trajectories continue at the same trajectory into the future. While energy system projections are known to be uncertain and sensitive to numerous inputs [29], CER data are consistent with similar energy models [30] and have been reliably and verifiably demonstrated in the literature [30,31,32]. Water price and emissions intensity were 12.3 ¢/tonne and 28.18 gCO2eq/tonne, respectively, and were constant throughout the analysis (Table S4). Emissions intensity [33,34] for electricity generation was calculated based on a weighted average by source (Table S7).
Learning rates for capital costs were selected using literature values for the technology when possible. Otherwise, a learning rate from a similar technology is applied [35]. Learning rates for each technology are provided in Table 1, with learning rates for the sub-components provided in Table S8 of the SI. Due to the lack of data available [7] for learning rates for environmental impacts, learning rates gathered for capital costs reductions were similarly applied to the respective units to estimate improvements in energy efficiency (Table 2). In the case of the PEM electrolyzer, a minimum energy value was set based on a 100% [36] electricity-to-hydrogen efficiency to ensure efficiency improvements were not overpredicted.

3. Results & Discussion

3.1. Learning Curve Effects on LCCA

Prior to evaluating different policy scenarios in Canada, we looked at the pure learning effects of the CO2-to-diesel process on the LCCA up to 2050. Through this, we can decouple technology innovation from market and/or policy evolution. To isolate the impact of technology learning on the LCCA, Canada average 2026 CER projections are used for each year (Table S6).
The effect of the individual learning rates on the overall cost shares is provided in Figure 2A. Initially, the PEM electrolyzer and MEA Capture are responsible for 48.6% and 15.9% of total capital costs, respectively. However, since both technologies are at lower TRLs, higher learning rates lead to a reduction in the cost-share from 2027 to 2030 and 2050. While the PEM electrolyzer is still the dominant capital cost in 2050, the cost-share has now reduced to 40.1%. The MEA capture also saw a decrease to 14.4% of the cost-share. As these technologies improve rapidly, the already mature technologies bear a higher cost-share. FT product upgrading is similar to oil refining, which is considered to be a mature technology. As a result, while the FT product upgrading has an 18.8% cost share in 2027, this increases to 24.1% in 2050. A similar trend occurs for the steam cycle, boiler steam generation, and the syngas compressor.
Figure 2B highlights the effect of learning on the overall electricity consumption shares. The PEM electrolyzer is the dominant source for electricity consumption with 84.2% in 2027. Despite a higher learning rate than the other components, the electricity consumption share increases to 86.7% in 2050. This is a result of the minimum electricity value, which assumes 100% power to gas efficiency. In contrast, the MEA capture unit has no minimum electricity applied to it, causing a more significant improvement in energy efficiency as the electricity consumption share drops from 10.4% in 2027 to 7.7% in 2050.
The impact of technological learning on overall expenses and the LCCA are shown in Figure 3A,B, respectively. In our initial year of 2027, capital costs are CA$1846 million for a 1 MtCO2/year facility. The learning rate, initially at 9.5%, leads to quick decreases in capital costs as capacity doubles rapidly in the intial years, reaching a capital cost of CA$1484 million in 2030. Afterwards, the rate of improvement decreases as doubling slows, reaching a capital cost of CA$1142 million in 2050. Similarly, the improved energy efficiency leads to decreases in the required electricity consumption, leading to a drop from 1086 MW in 2027 to 973 MW in 2030 to 864 MW in 2050. Together, this leads to an LCCA that decreases to below half its original value, from CA$987/tCO2eq in 2027 to CA$482/tCO2eq in 2050. However, when compared to Canada’s federal carbon price pledge, the LCCA is still CA$312/tCO2eq above the carbon price, suggesting additional subsidies would still be needed to sustainably operate this CO2-to-diesel technology.

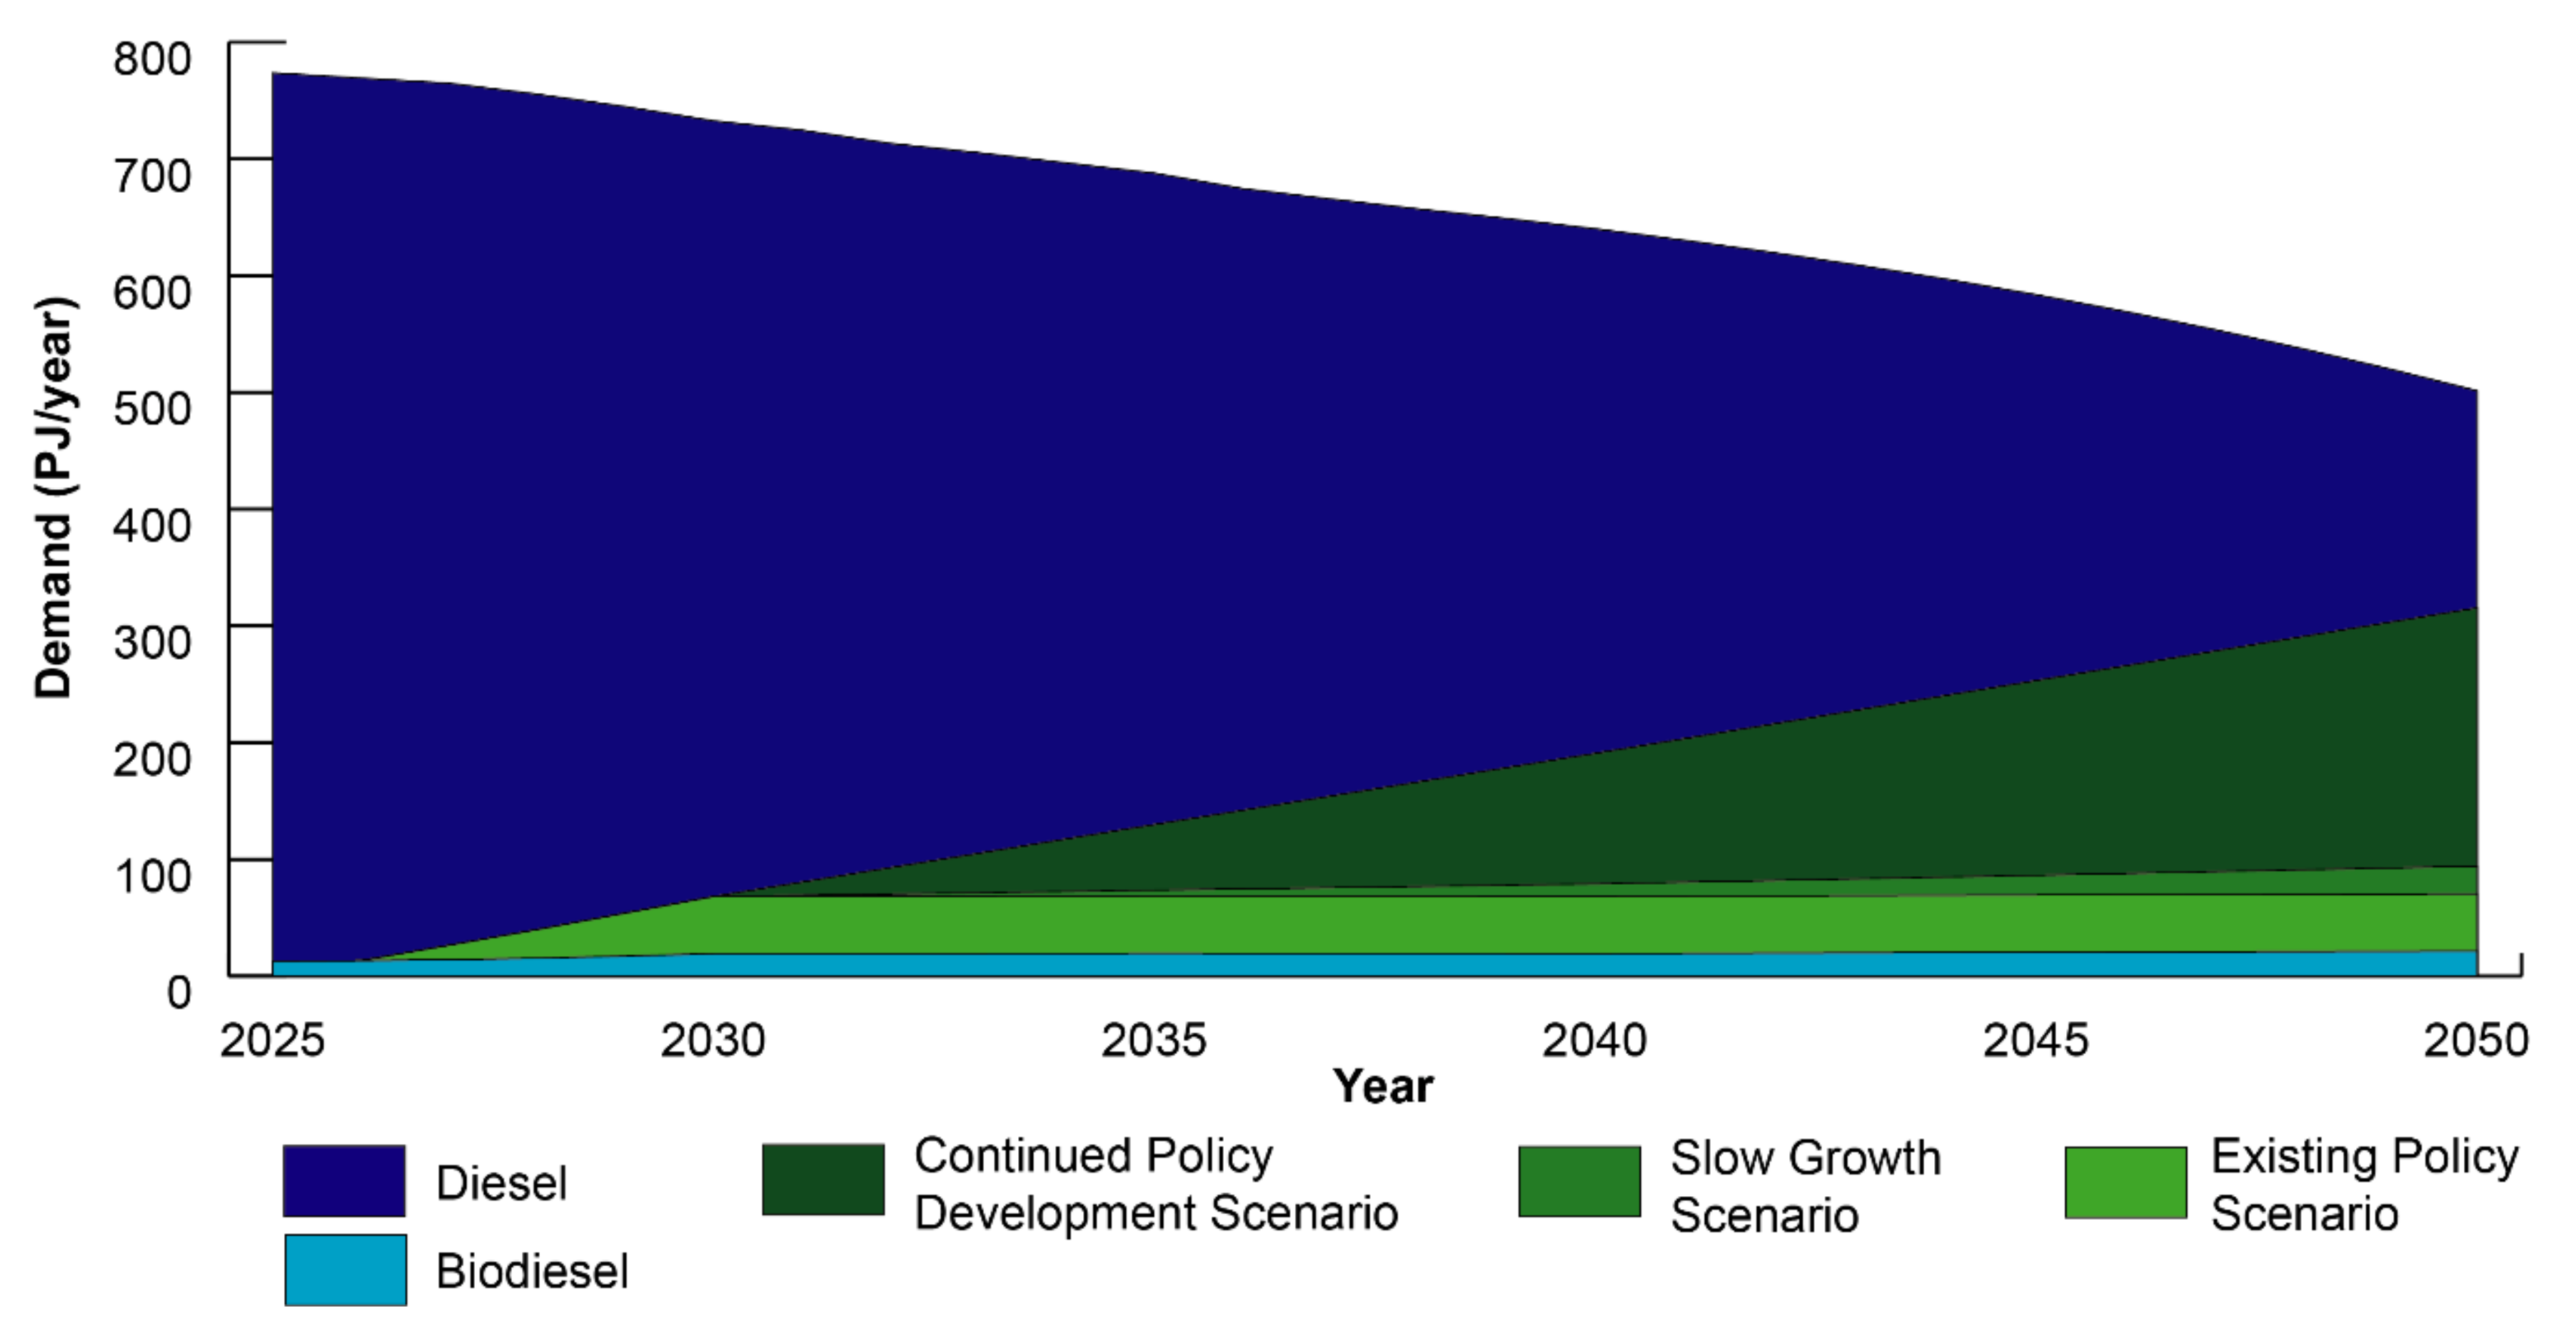
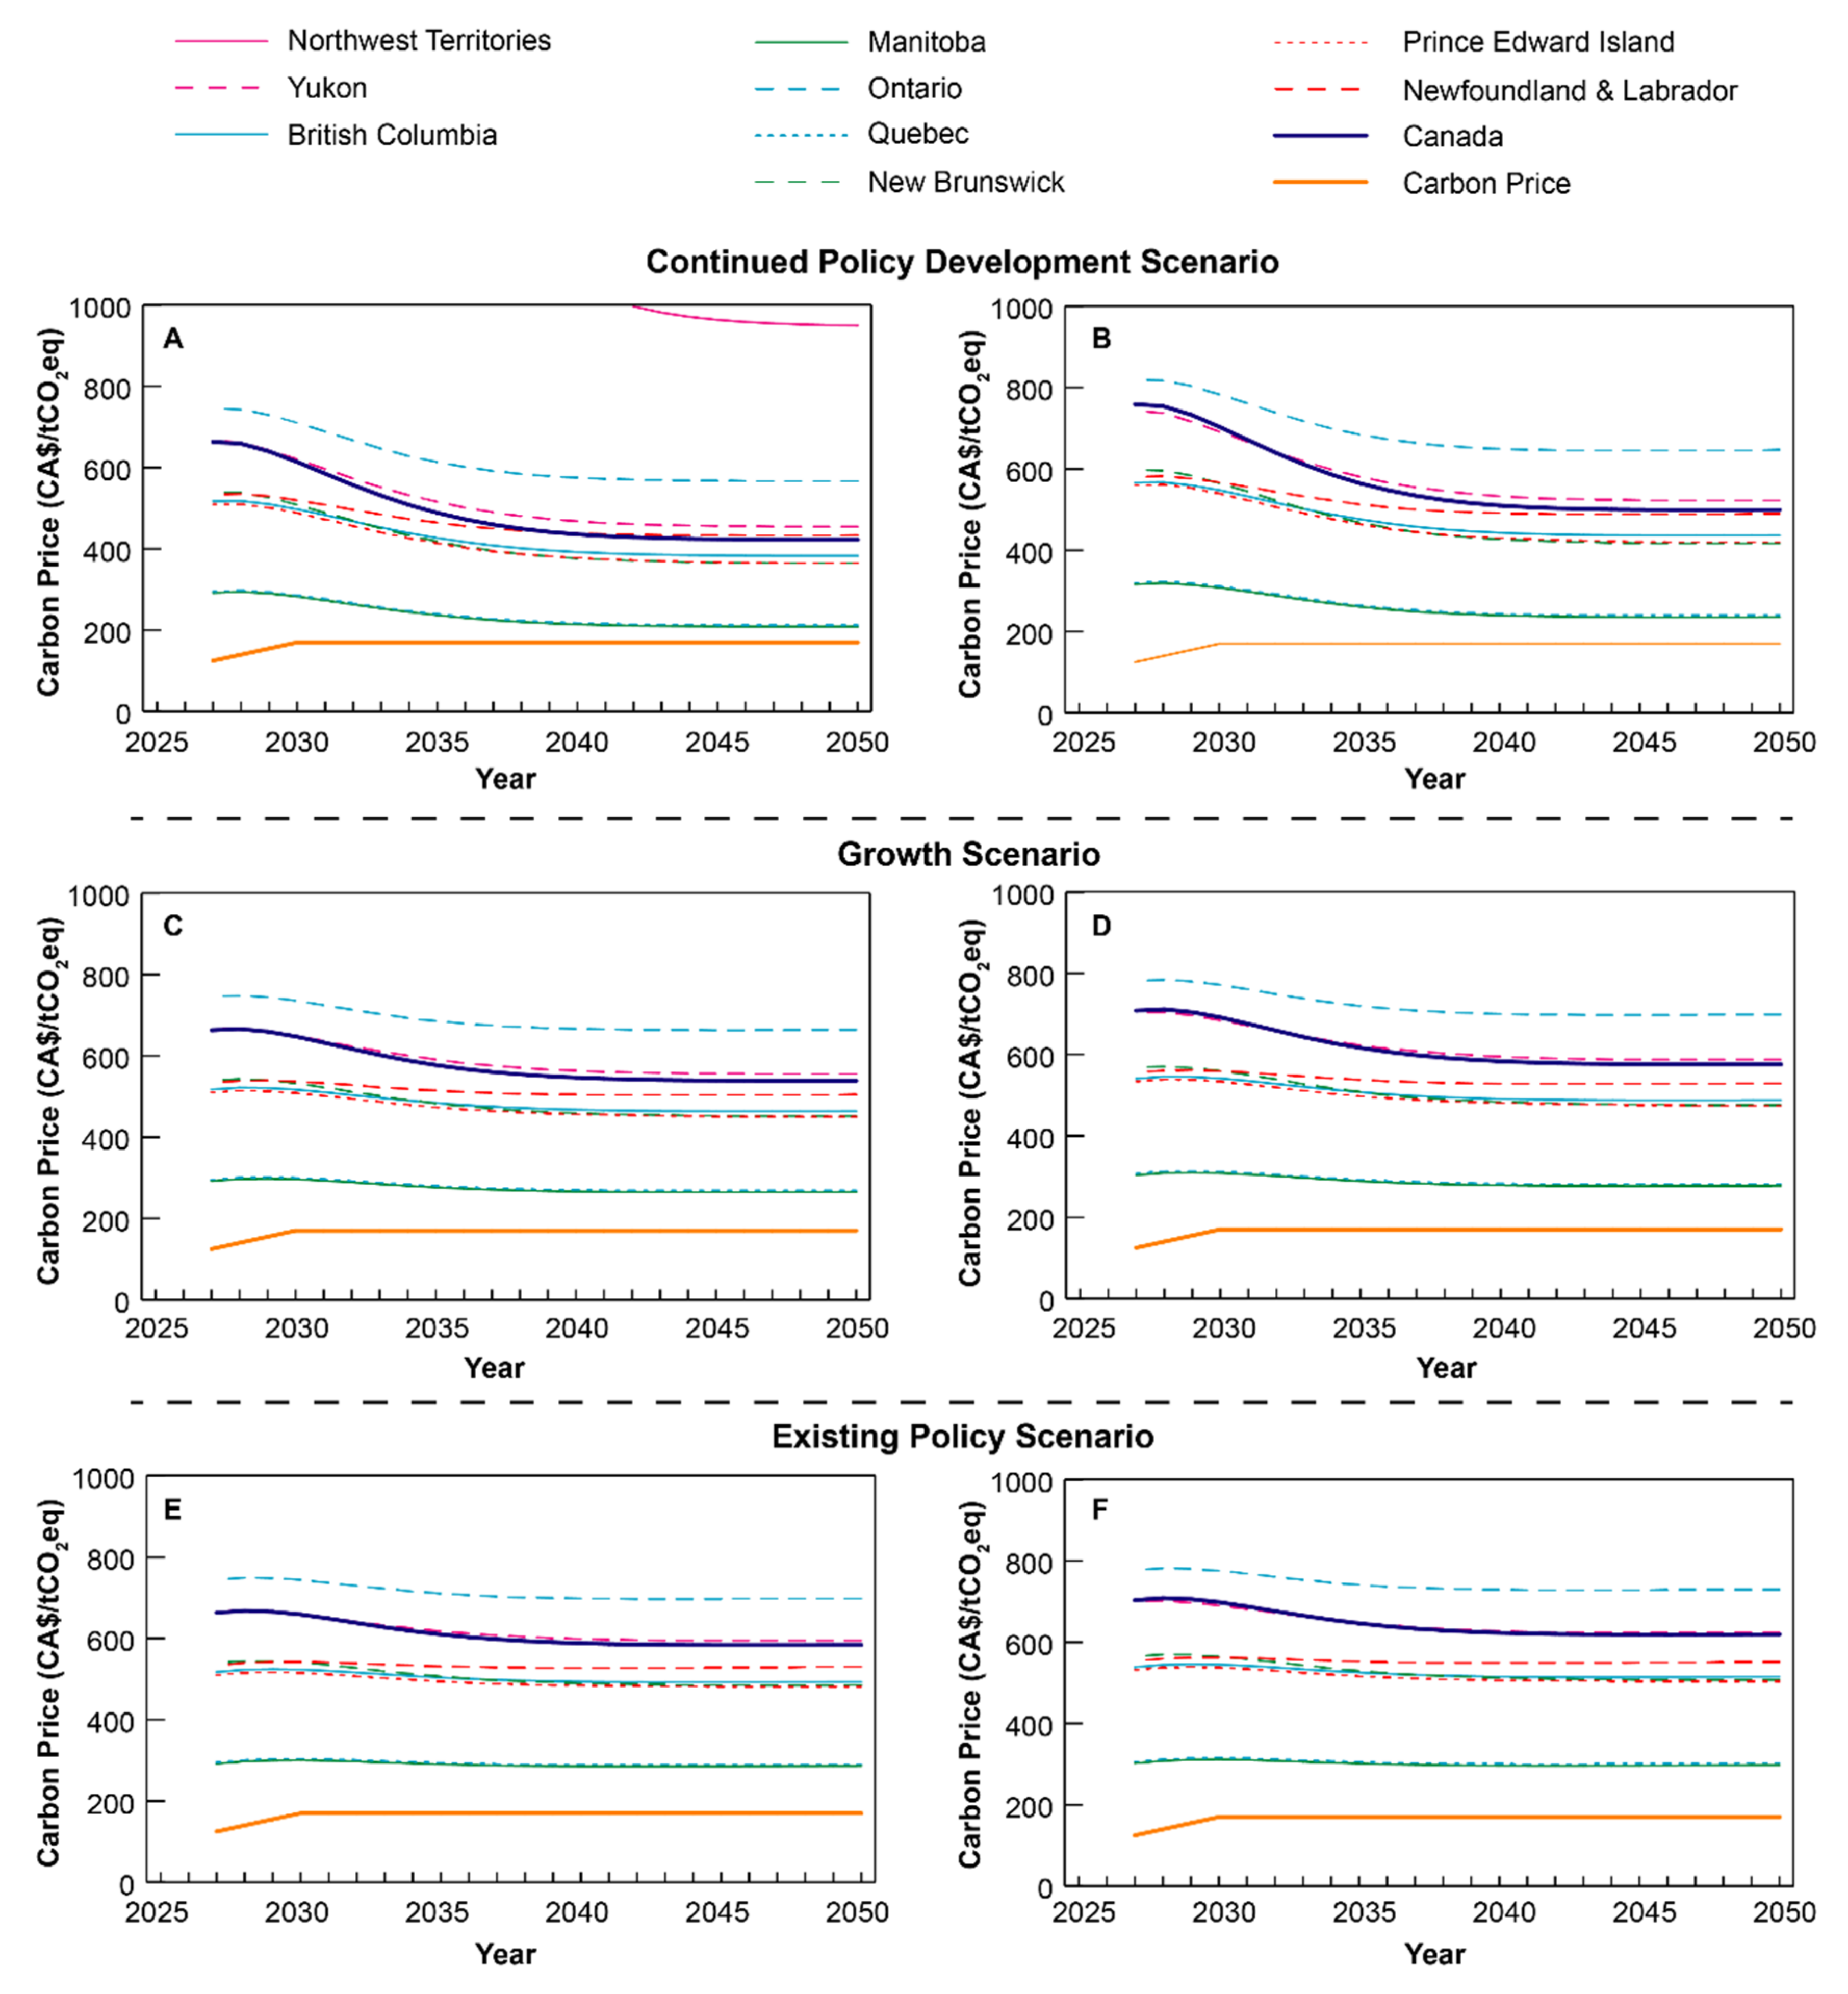
3.2. Adapting Policy Scenarios in Canada to CO2-Derived Diesel Demand

Now, we examine specific policy scenarios within Canada to evaluate the potential for emissions reduction using this CO2-to-diesel technology, and the cost relative to Canada’s carbon price pledge of CA$170/tCO2 in 2030. CER projections in diesel and biofuel demand are predicated on policy action continuing to increase at a pace similar to recent history [28]. For Canada, the Pan-Canadian Framework on Clean Growth and Climate Change [40] plays an important role, from which an escalating carbon price and the Clean Fuel Standard are primary drivers. In 2020, the demand for diesel in the transportation sector in Canada was 754 PJ. However, this demand is expected to decline at an average annual rate of 1.5% [28], reaching 480 PJ in 2050. Simultaneously, biofuel demand was 109 PJ in 2020 and is expected to grow at an average annual rate of 2.0% [28] to 195 PJ in 2050. In 2018, biodiesel constituted 11% [41] of total biofuel demand in Canada. We assume this ratio is constant in order to estimate biodiesel demand consistent with CER projections.
Projections of CO2-derived diesel demand up to 2030 are driven by the Clean Fuel Standard [25], which is complemented by the federal carbon price. Within the Clean Fuel Standard, HDRD diesel is expected to be integrated into the fuel mix in 2026 and rises to 49 PJ/year [25] in 2030. From this, we can develop three trajectories based on various policy scenarios. Diesel, biodiesel, and the three CO2-derived diesel scenarios are provided in Figure 4, with additional values provided in Table 3.
Existing Policy Scenario (Scenario 1): Under this scenario, no additional policies are put in place after 2030 to succeed the Clean Fuel Standard and strengthen CO2-derived diesel demand. Further, no additional growth of renewable fuels is assumed. Domestic production of renewable diesel through the proposed CO2-to-diesel follows the projection provided through the Clean Fuel Standard. That is, production rises from 0 to 49 PJ from 2026 to 2030, before remaining constant to 2050.
Growth Scenario (Scenario 2): Under this scenario, no additional policies are put into place after 2030 to succeed the Clean Fuel Standard and strengthen CO2-derived diesel demand. However, we assume renewable fuels grow at a rate of 2.0% annually [28], based on projections from the CER. Domestic production of renewable diesel through the proposed CO2-to-diesel pathway follows the projection provided through the Clean Fuel Standard up to 2030. Then, between 2030 and 2050, production increases at a rate of 2.0% annually.
Continued Policy Development Scenario (Scenario 3): Under this scenario, it is assumed that additional policy enacted after 2030 follows the same trajectory set by the Clean Fuel Standard, consistent with the demand projections from CER. Examples of policies may include more stringent emission intensity standards, renewable fuel blending requirements, and/or a higher carbon price. Domestic production of renewable diesel through the proposed CO2-to-diesel pathway follows the projection provided through the Clean Fuel Standard up to 2030. Then, between 2030 and 2050, the production of renewable diesel continues this linear growth until it reaches 294 PJ in 2050.
While our three policy scenarios follow linear growth profiles, technology tends to diffuse in a non-linear fashion. Therefore, to better model the true rate of commercial deployment of technology in relation to imposed policies, we leverage the three policy scenarios and map the linear diesel demands to a sigmoid function (S-curve) using the logistic growth function [42]:
A n = A s a t 1 + A s a t A b a s e A b a s e e r n
Here, A n is the annual market capacity at a particular year, while A b a s e is the initial capacity and A s a t is the saturated capacity; r is the growth rate and n is the number of periods after the start period [43]. A b a s e and A s a t are specified, allowing r to be fit using techniques such as non-linear regression. For all scenarios, we define the initial capacity as 1 MtCO2/year. The saturation capacity is determined based on the demand for CO2-derived diesel in 2050 (Table 3). We fit for r by constraining actual demand in 2050 to be 99% of the demand required in our scenarios.
The resulting S-curve growth trajectories (Figure 5) serve to model the more natural trajectory of technology uptake and CO2-derived diesel production, while the linear growth trajectories (Figure 4) serve as the regulatory backbone mandating a defined amount of CO2-derived diesel consumption. In cases where actual demand differs relative to the demand projected under the three scenarios, we assume import/export of CO2-derived diesel at a 9% markup [44], consistent with marketing and distribution costs for gasoline. The result is commercial uptake of the CO2-to-diesel process that is triggered by imposed policies but diffuses at a rate independent of these policy requirements. The gap between the two demands is then accounted for by imports/exports. The S-curve results for each scenario, along with the calculated growth rate, are shown in Figure 5.
Although the largest environmental benefit will arise from substituting diesel with CO2-derived diesel, in reality, CO2-derived diesel will be competing with other low carbon fuels, like biofuel, for market share. Financial risks are a concern here, with feedstock costs of CO2 largely dictating CO2-derived diesel production costs [45] and hence, its competitiveness. Unfavorable competition between CO2-derived diesel and other low-carbon diesel can be mitigated through two supporting mechanisms. First, supporting literature showing high performance with higher renewable diesel blending ratios [46] increases confidence in the use of blended fuel. Second, explicit policy intervention to support biodiesel use [47] has led to a significant production increase in recent years. With similar policy support like the Clean Fuel Standard, this could see the same effect for CO2-derived fuel.
Since there is uncertainty surrounding the future supporting mechanisms for integrating CO2-derived diesel into the diesel pool, we evaluate the resulting LCCA under two diesel substitution assumptions:
(1)
the consumption of diesel is sufficiently regulated to facilitate a one-to-one substitution of fossil fuel-derived diesel with diesel produced from the CO2-to-diesel process and;
(2)
no additional higher blending regulations are introduced and CO2-derived diesel competes equally with all sources of diesel. Here, diesel from the CO2-to-diesel process follows a one-to-one substitution with the diesel pool in the year it is substituted.
In 2018, the biodiesel content in the diesel pool amounted to 1.9% [41]. Furthermore, under our policy scenarios, biodiesel is projected to rise to 4.0% of the diesel pool and CO2-derived diesel is projected to account for 10–59% of the diesel pool in 2050. As the makeup of the diesel pool shifts from fossil fuel-derived feedstocks produced in oil refineries to biomass and CO2 feedstocks, the overall emission intensity of the diesel pool will also decrease. Then, the impact of adding additional CO2-derived diesel on the LCCA will decrease since the diesel being displaced leads to fewer emissions avoided. Estimates for the makeup of the diesel pool and diesel demands under each scenario are provided in Tables S10–S12 of the SI.
Finally, we also incorporate CER projections [28] for utility and fuel prices, demands, and sources of electricity generation from 2026 to 2050. This creates a complete picture for our model by taking into account the factors unique to Canada. Importantly, by explicitly accounting for regional variability in factors such as utility prices and utility emission intensities, we can assess the impact of the geographical location where the CCUS technology is in operation. This makes the proposed approach easily transferrable to fit the unique geographic or policy environment of other subnational (e.g., states or provinces), national (e.g., USA), or multi-national jurisdictions (e.g., European Union).

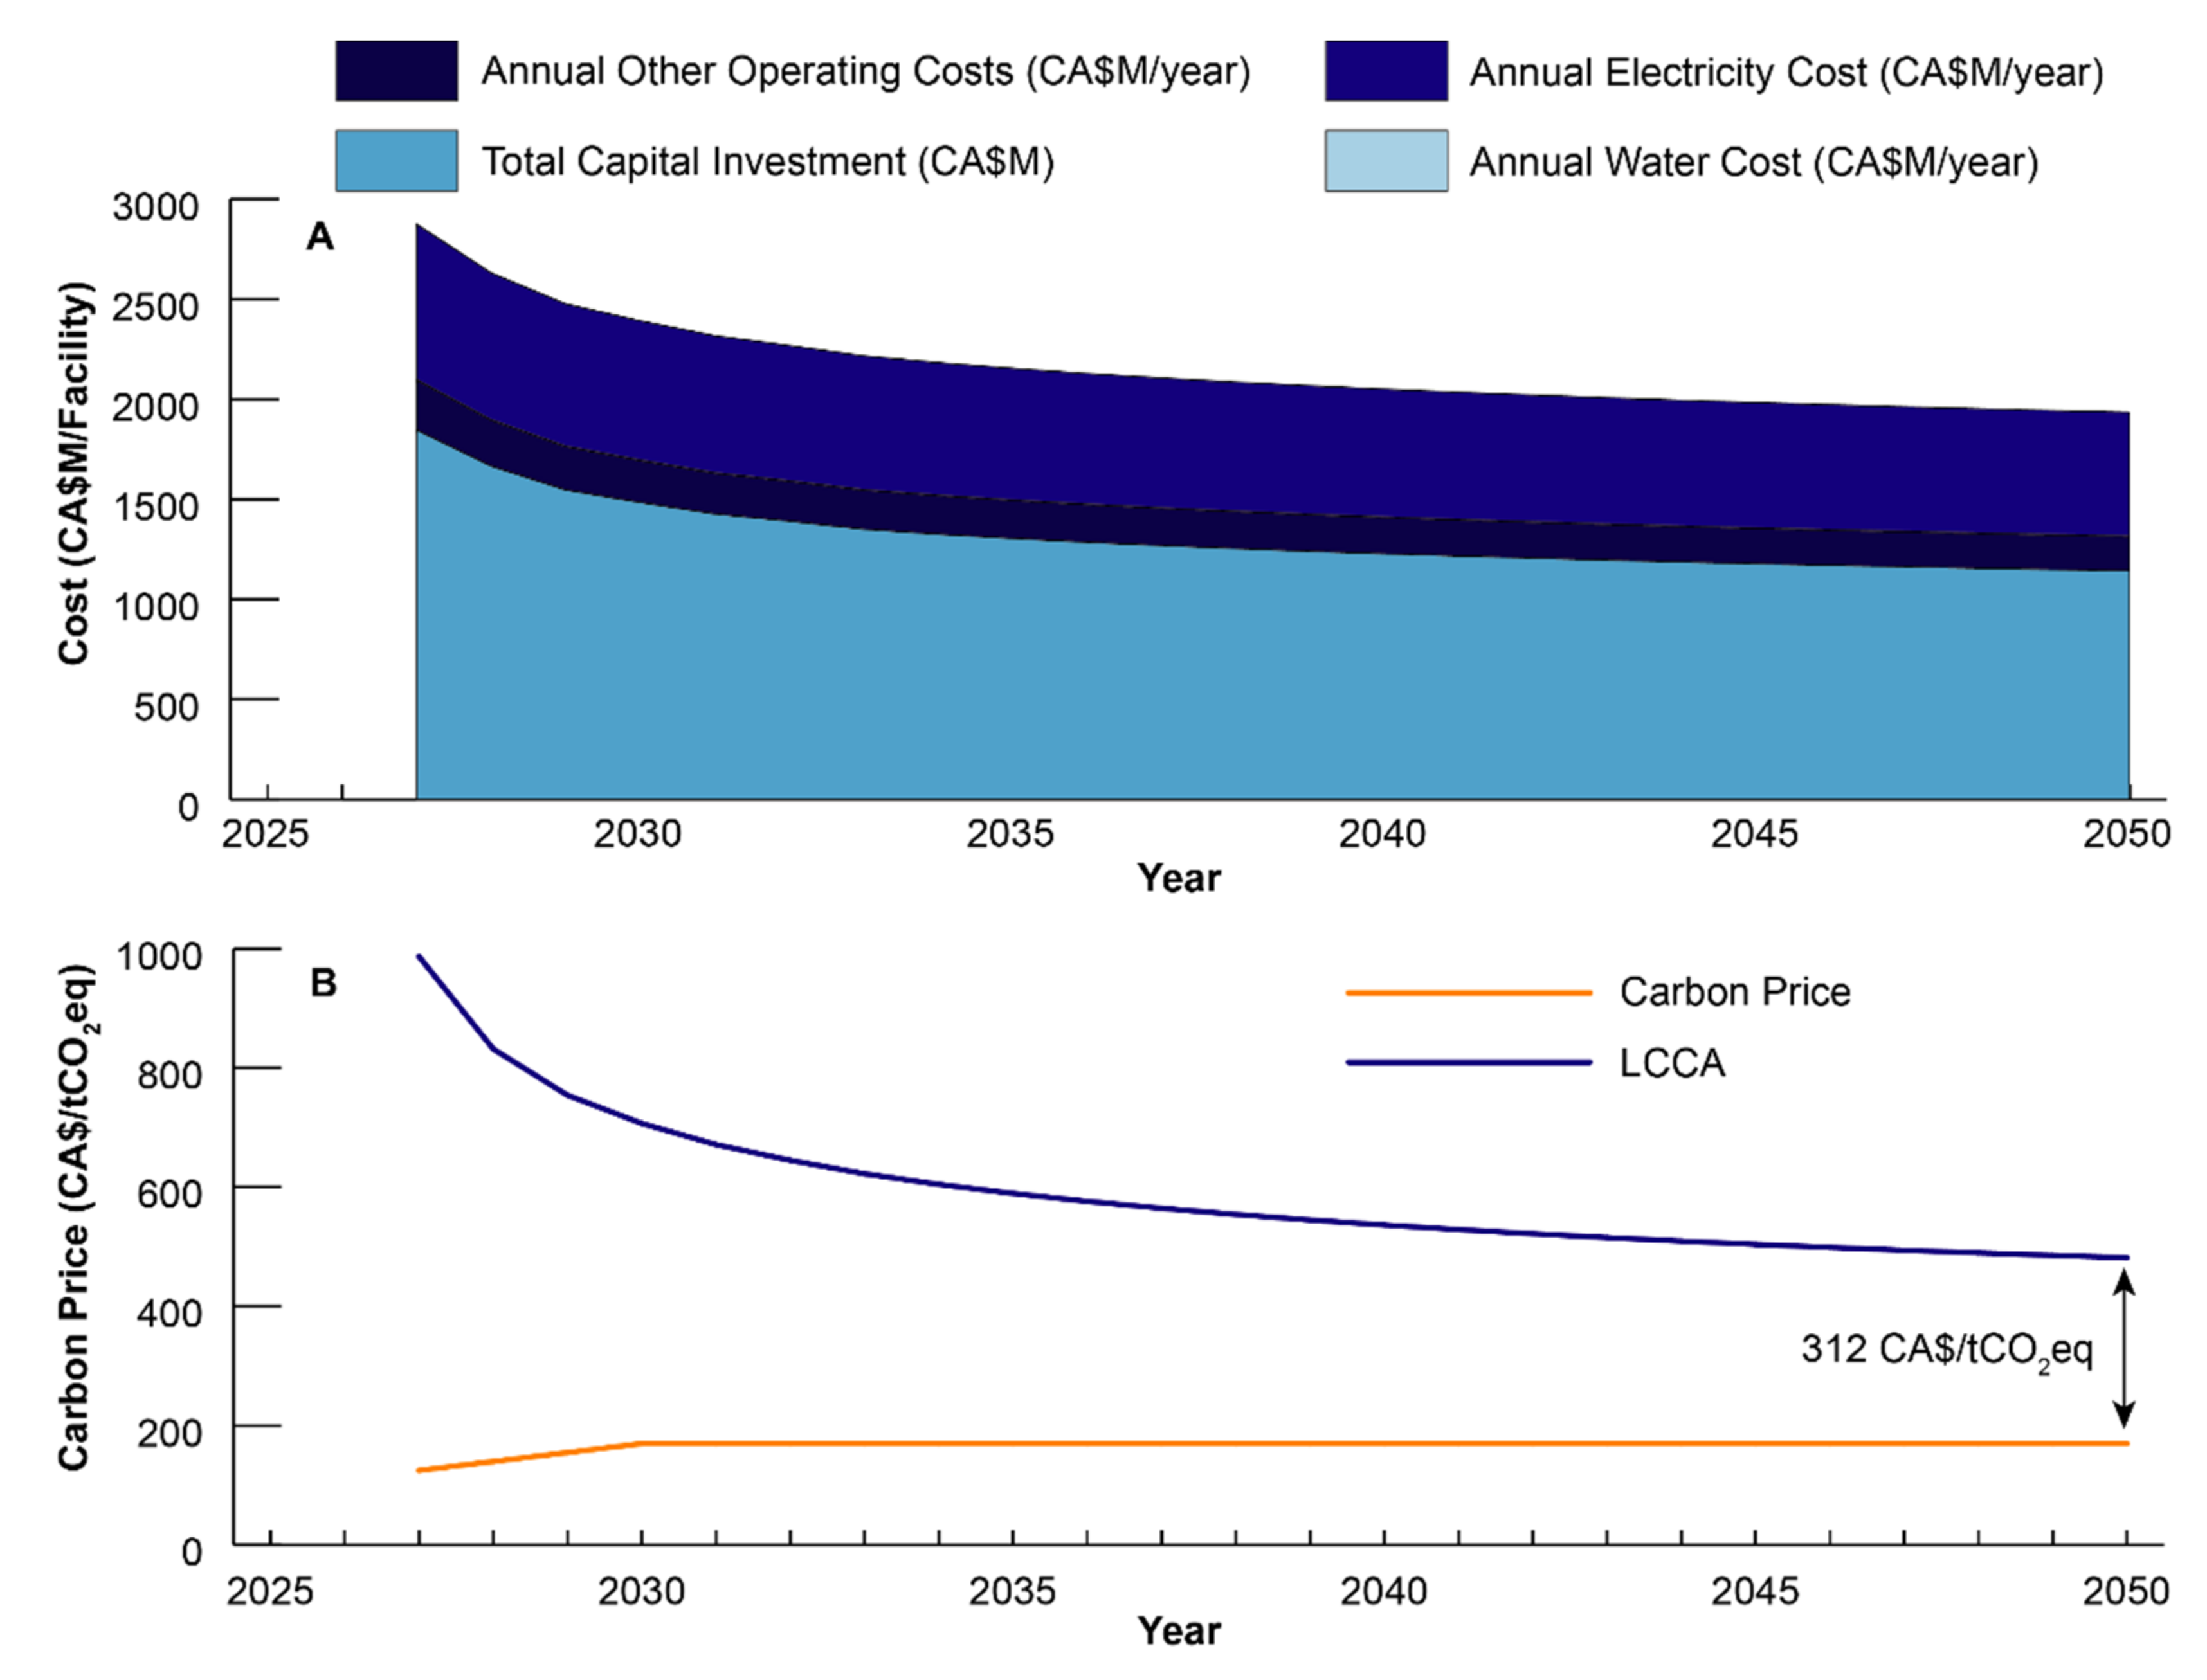
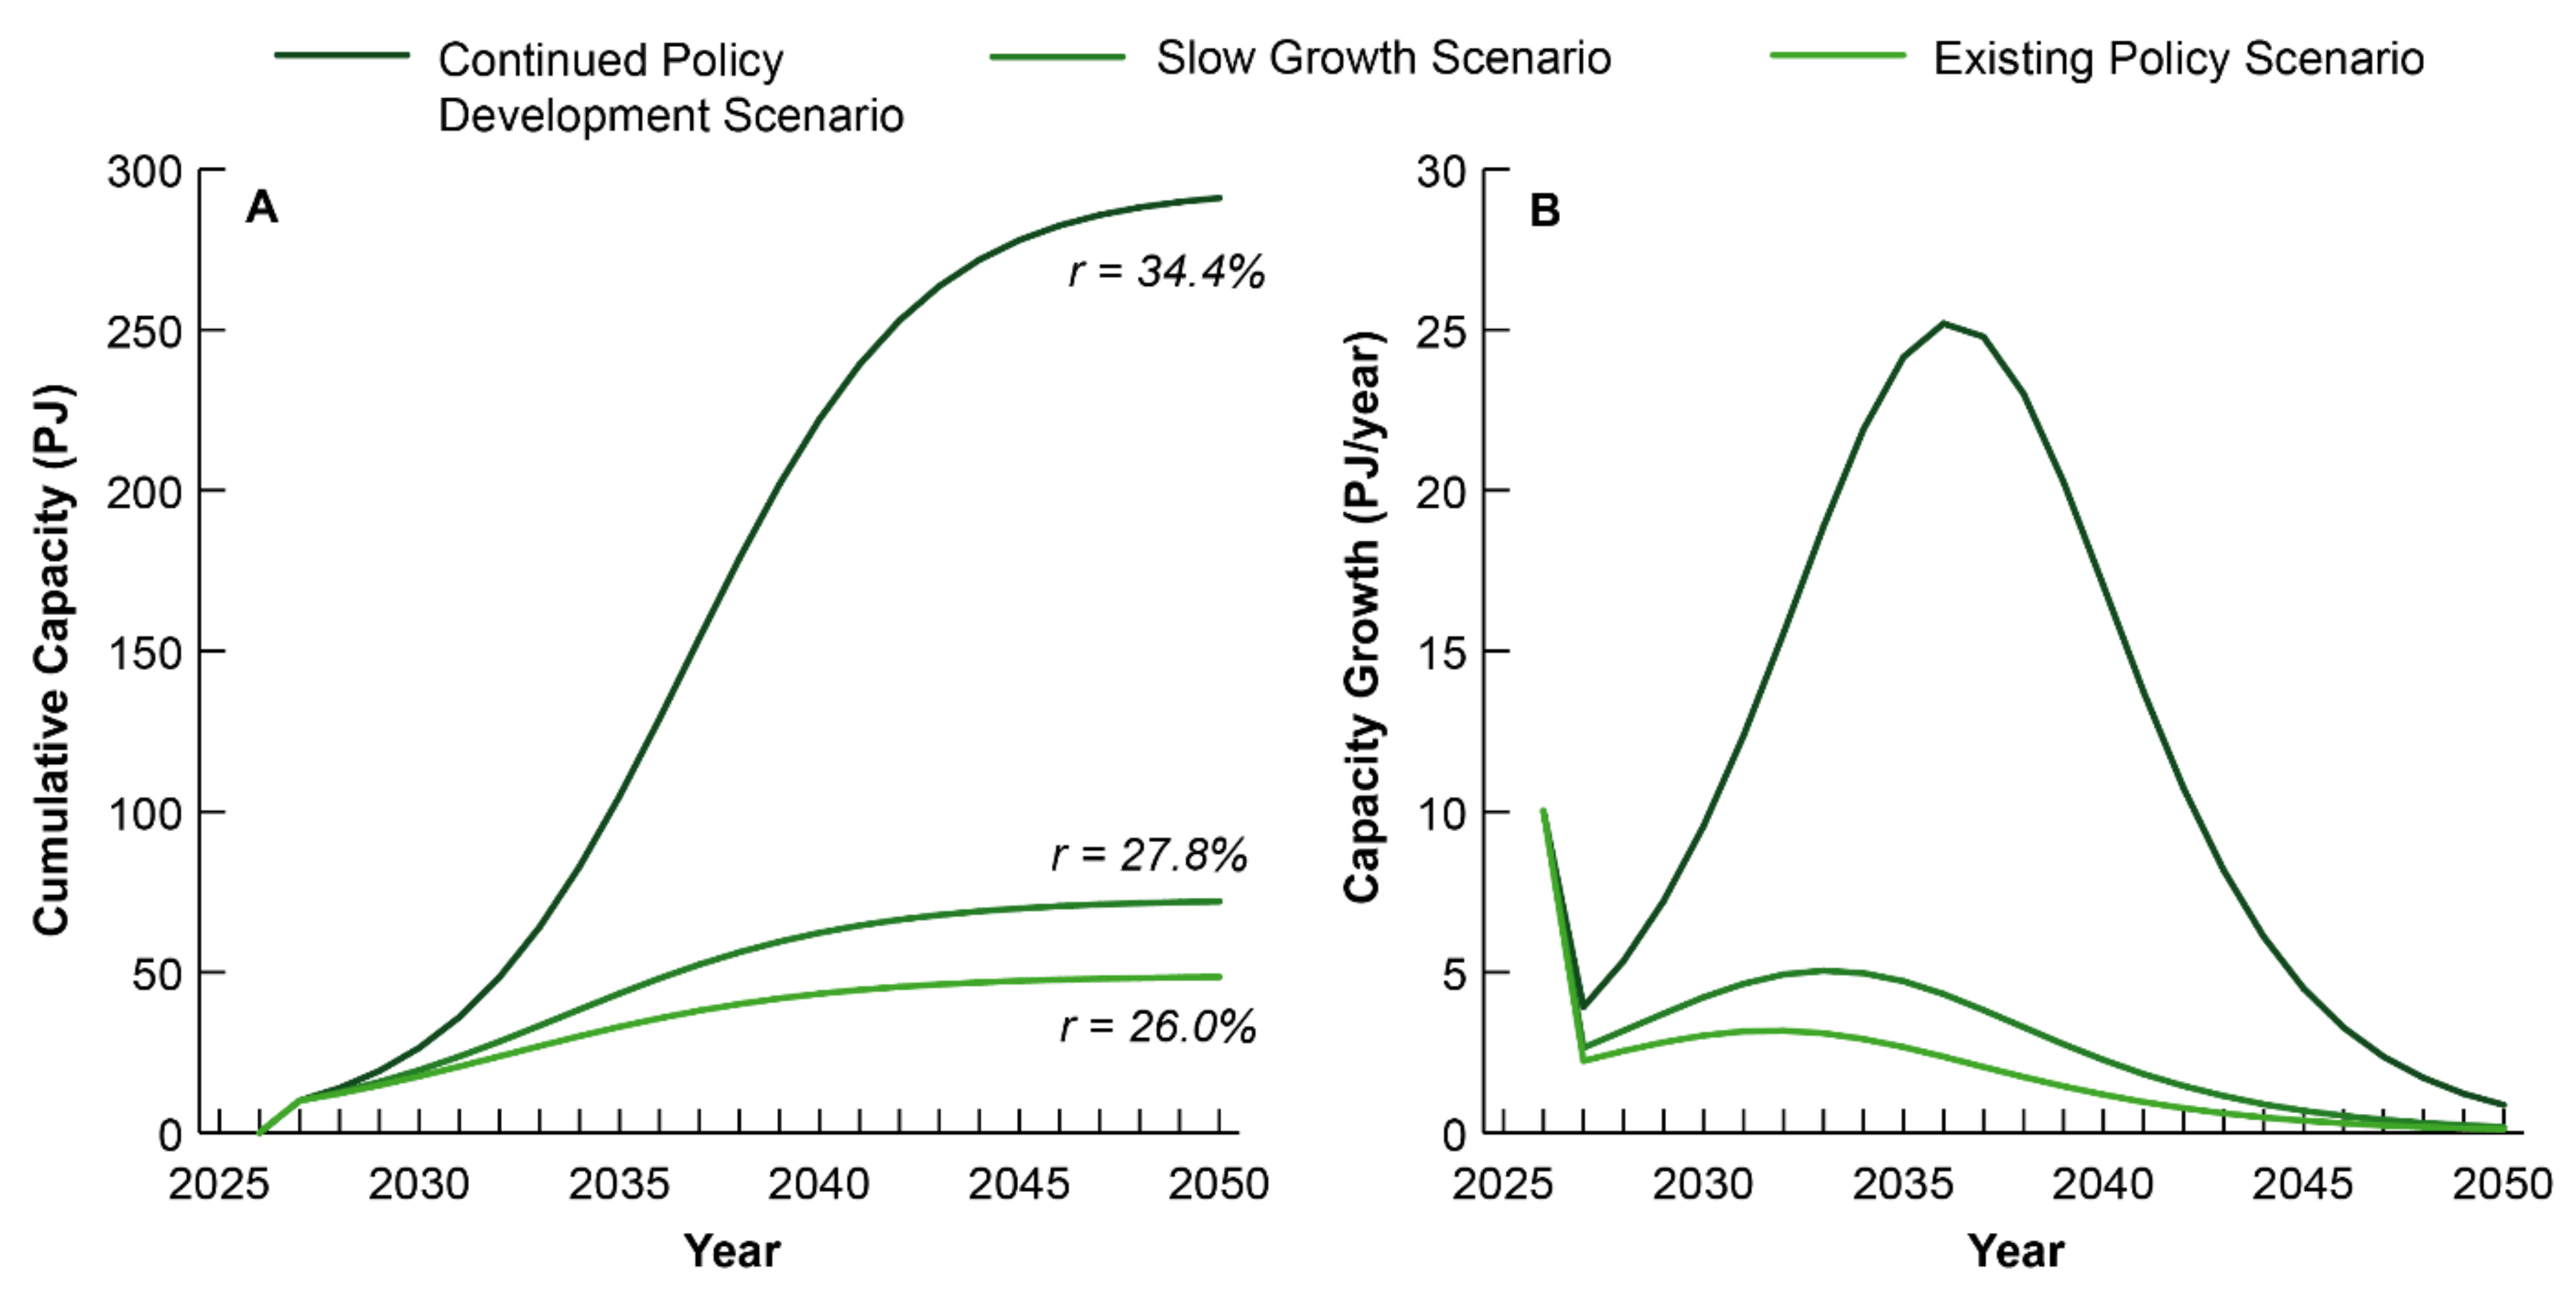
3.3. Projections for CO2-to-Diesel in Canada

LCCAs for all three of our policy scenarios were estimated under both the one-to-one substitution of fossil fuel-derived diesel and the diesel pool, leading to six cases. In each case, we provide the LCCA for the Canadian average of the CER data, as well as each province and territory in Canada based on the electricity price and electricity generation in the region. Lifetime emissions are determined by averaging the emission intensities of the electricity generation and diesel pool over the plant lifetime. To limit effects from economies of scale, we report the LCCA for all cumulative expenses and emissions between the initial operation year of 2027 and time, t. This can be expressed mathematically by modifying our time-dependent LCCA formula:
L t = 2027 t C 1 , c a p e x t + C 1 , o p e x t C 0 , o p e x , a v t C 0 , c a p e x , l o s s t 2027 t ( E 0 t E 1 t )
Results for the LCCA under each scenario are provided in Figure 6. All data are provided in Tables S16–S29 of the SI. An example calculation of the LCCA is also provided for Quebec in Table S44 of the SI.
For each scenario, our results show that the LCCA varies widely depending on the province or territory that the CO2-to-diesel process is located in. In the cases of Nova Scotia, Alberta, and Nunavut, the high emission intensity of electricity generated leads to a situation where the proposed CO2-to-diesel process produces more emissions than it avoids. In 2027, the estimated emission intensity for electricity generation in each region is projected to be 430 gCO2eq/kWh, 439 gCO2eq/kWh, and 948 gCO2eq/kWh, respectively. For Nova Scotia and Alberta, respectively, 57% and 80% of electricity is generated from coal or natural gas. In the case of Nunavut, 97% of electricity is generated from oil, since many communities are remote. Considering the Continued Policy Development Scenario with a one-to-one substitution with fossil fuel-derived diesel, technological learning and decarbonization of electricity generation will eventually lead to emissions avoided in Nova Scotia, beginning in 2036. Therefore, this technology could be a viable option in the future once this level of emissions is reached. However, for the cases of Alberta and Nunavut, both will continue to create net emissions through 2050 unless additional emissions mitigation technologies such as CCS are employed.
A comparison of the three policy scenarios developed shows the influence of technological learning. As expected, the 2050 LCCA is lowest for the Continued Policy Development Scenarios and highest for the Existing Policy Scenarios. Considering the Canadian average LCCA under each scenario with one-to-one substitution with fossil fuel-derived diesel, the 2050 LCCA ranges from CA$422/tCO2eq in the Continued Policy Development Scenario to CA$584/tCO2eq in the Existing Policy Scenario. As more CO2-to-diesel capacity is built, the capital expenses and energy consumption decrease, leading to a more favorable LCCA. This is aided further by decreasing emission intensity from 2027 to 2050 across all regions but is offset slightly by rising electricity prices. Overall, without additional policy beyond 2030, it is unlikely that the proposed CO2-to-diesel process will be a viable option in Canada. Even in Manitoba—the most favorable region—the LCCA under the Existing Policy Scenario and Growth Scenario only reach CA$286/tCO2eq and CA$265/tCO2eq, respectively. This sits CA$116/tCO2eq and CA$95/tCO2eq above the federal carbon price, meaning additional subsidies or investments are necessary in order to operate the facilities at break-even. This could be achieved through additional provincial policy supports such as carbon pricing or other incentives. Conversely, under the Continued Policy Development Scenario, Manitoba has an LCCA of CA$209/tCO2eq—just CA$39/tCO2eq above the carbon price, making it much more viable. This would translate to a consumer cost of only 20¢/L above the levy from the pledged federal carbon price. Herein, we will focus on the Continued Policy Development Scenario to highlight key factors that can help reduce the LCCA. The initial 2027 and final 2050 LCCA for each region under this scenario for a one-to-one substitution with fossil fuel-derived diesel are provided in Table 4. Our estimated LCCAs fall in line with break-even carbon price estimates of US$0-670/tCO2eq [5] for fuels generated from CCUS technology.
In all scenarios, substituting diesel from the diesel pool leads to higher LCCAs than substituting fossil fuel-derived diesel. For example, the Canadian average 2050 LCCA rises from CA$422/tCO2eq to CA$500/tCO2eq. This is directly related to the emission intensity of the fuel being displaced. Fossil fuel-derived diesel has a well-to-wheel emission intensity of 104.5 gCO2eq/MJ, while the CO2-derived diesel has an emission intensity of 26.2 gCO2eq/MJ in 2027. As CO2-derived diesel is integrated into the diesel pool, the overall emission intensity will decrease, and the emissions avoided will follow. For the Canadian average, this leads to a difference of 105 MtCO2eq avoided over the lifetime of the CO2-to-diesel facilities coming into operation between 2027 and 2050 (Figure 7). Care should be taken to ensure renewable diesel substitutes high emission intensity diesel to achieve the highest emissions reductions on the road to net-zero emissions by 2050.
Regional variation in LCCA is a result of the combined factors of electricity prices and emission intensity from electricity generation. Substitution of fossil fuel-derived diesel in Manitoba and Quebec leads to LCCAs of CA$209/tCO2eq and CA$213/tCO2eq, respectively. In Manitoba and Quebec, only 0.04% and 0.4% of electricity is generated from fossil fuel sources in 2027, making them particularly suited for low carbon technology with high electricity burdens. Furthermore, the electricity prices in these provinces are the lowest nationally, at 5.9 ¢/kWh. In contrast, British Columbia and Newfoundland & Labrador have low emissions intensities for electricity generation but have electricity prices above the national average which makes them less attractive than Quebec or Manitoba. For Ontario, electricity generation has an emission intensity of 51.4 gCO2eq/kWh in 2027—below the national average—but has an electricity price of 15.1 ¢/kWh, leading to an LCCA of CA$567/tCO2eq in 2050. Until provinces or territories with high electricity prices can lower the cost of electricity, the proposed CO2-to-diesel process is unlikely to be a net benefit for emissions mitigation since significant additional investment will be needed outside of the federal carbon price to achieve these emissions reductions.
Emissions avoided from the CO2-to-diesel facilities coming into operation between 2027 to 2050 also differ significantly across regions (Figure 7, Tables S30–S43). Since the plant lifetime is 25 years, emission mitigation continues until 2075. Using the average Canadian values, 681 MtCO2eq are avoided through the CO2-to-diesel facilities coming into operation between 2027 and 2050. Nearly half of the total emissions avoided are from net capture of the facility. Substitution of diesel with the lower emission intensity CO2-derived diesel accounts for an additional 34.9% if substituting fossil fuel-derived diesel. Only 16% of electricity generated in Canada in 2027 is expected to come from fossil fuels, therefore emissions avoided from decarbonization of electricity and technological learning are smaller contributions, but still account for 112 MtCO2 avoided. In Quebec, 925 MtCO2eq would be avoided in the same period. Quebec has a low emission intensity from electricity generation, leading to nearly three-quarters of total emissions avoided coming from net capture from the operation of the CO2-to-diesel facility. Technological learning only contributes 0.3% of the emissions avoided in this case, since improving the energy efficiency of the plant does not translate significantly to avoided emissions. Diesel substitution leads to equal emissions avoided regardless of region. Operation of the CO2-to-diesel facilities in Ontario would lead to 858 MtCO2eq avoided since the emission intensity from electricity generation is between the Quebec average and the Canadian average.
While the proposed CO2-to-diesel process is unlikely to be operated in Northwest territories due to its remoteness, the territory provides insight into the effect of technological learning when emission intensity from electricity generation is relatively higher. Here, the operation of the CO2-to-diesel facilities leads to 139 MtCO2eq emissions created compared to the incumbent refining technology, due to the high consumption of electricity with higher emission intensity. However, over time technological learning improves the energy efficiency of the individual units. By 2075, 35.4% of emissions avoided are a result of technological learning. Moreover, emissions avoided from decarbonization accounts for 39.4%. As a result of these contributions, only 393 MtCO2eq are avoided, or 42% of the emissions avoided if the facilities were in Quebec. While not shown explicitly, Manitoba would avoid 932 MtCO2eq over this period. Overall, technological learning is important for emission reduction in areas where emission intensity from electricity generation is high. However, in areas where electricity generation is low emission intensity, simple operation of the facility will lead to net avoided emissions. From an emissions mitigation perspective, CCUS technology with high electricity consumption has a positive effect only in regions with low emission intensity from electricity generation. Otherwise, the focus should be on the decarbonization of electricity.

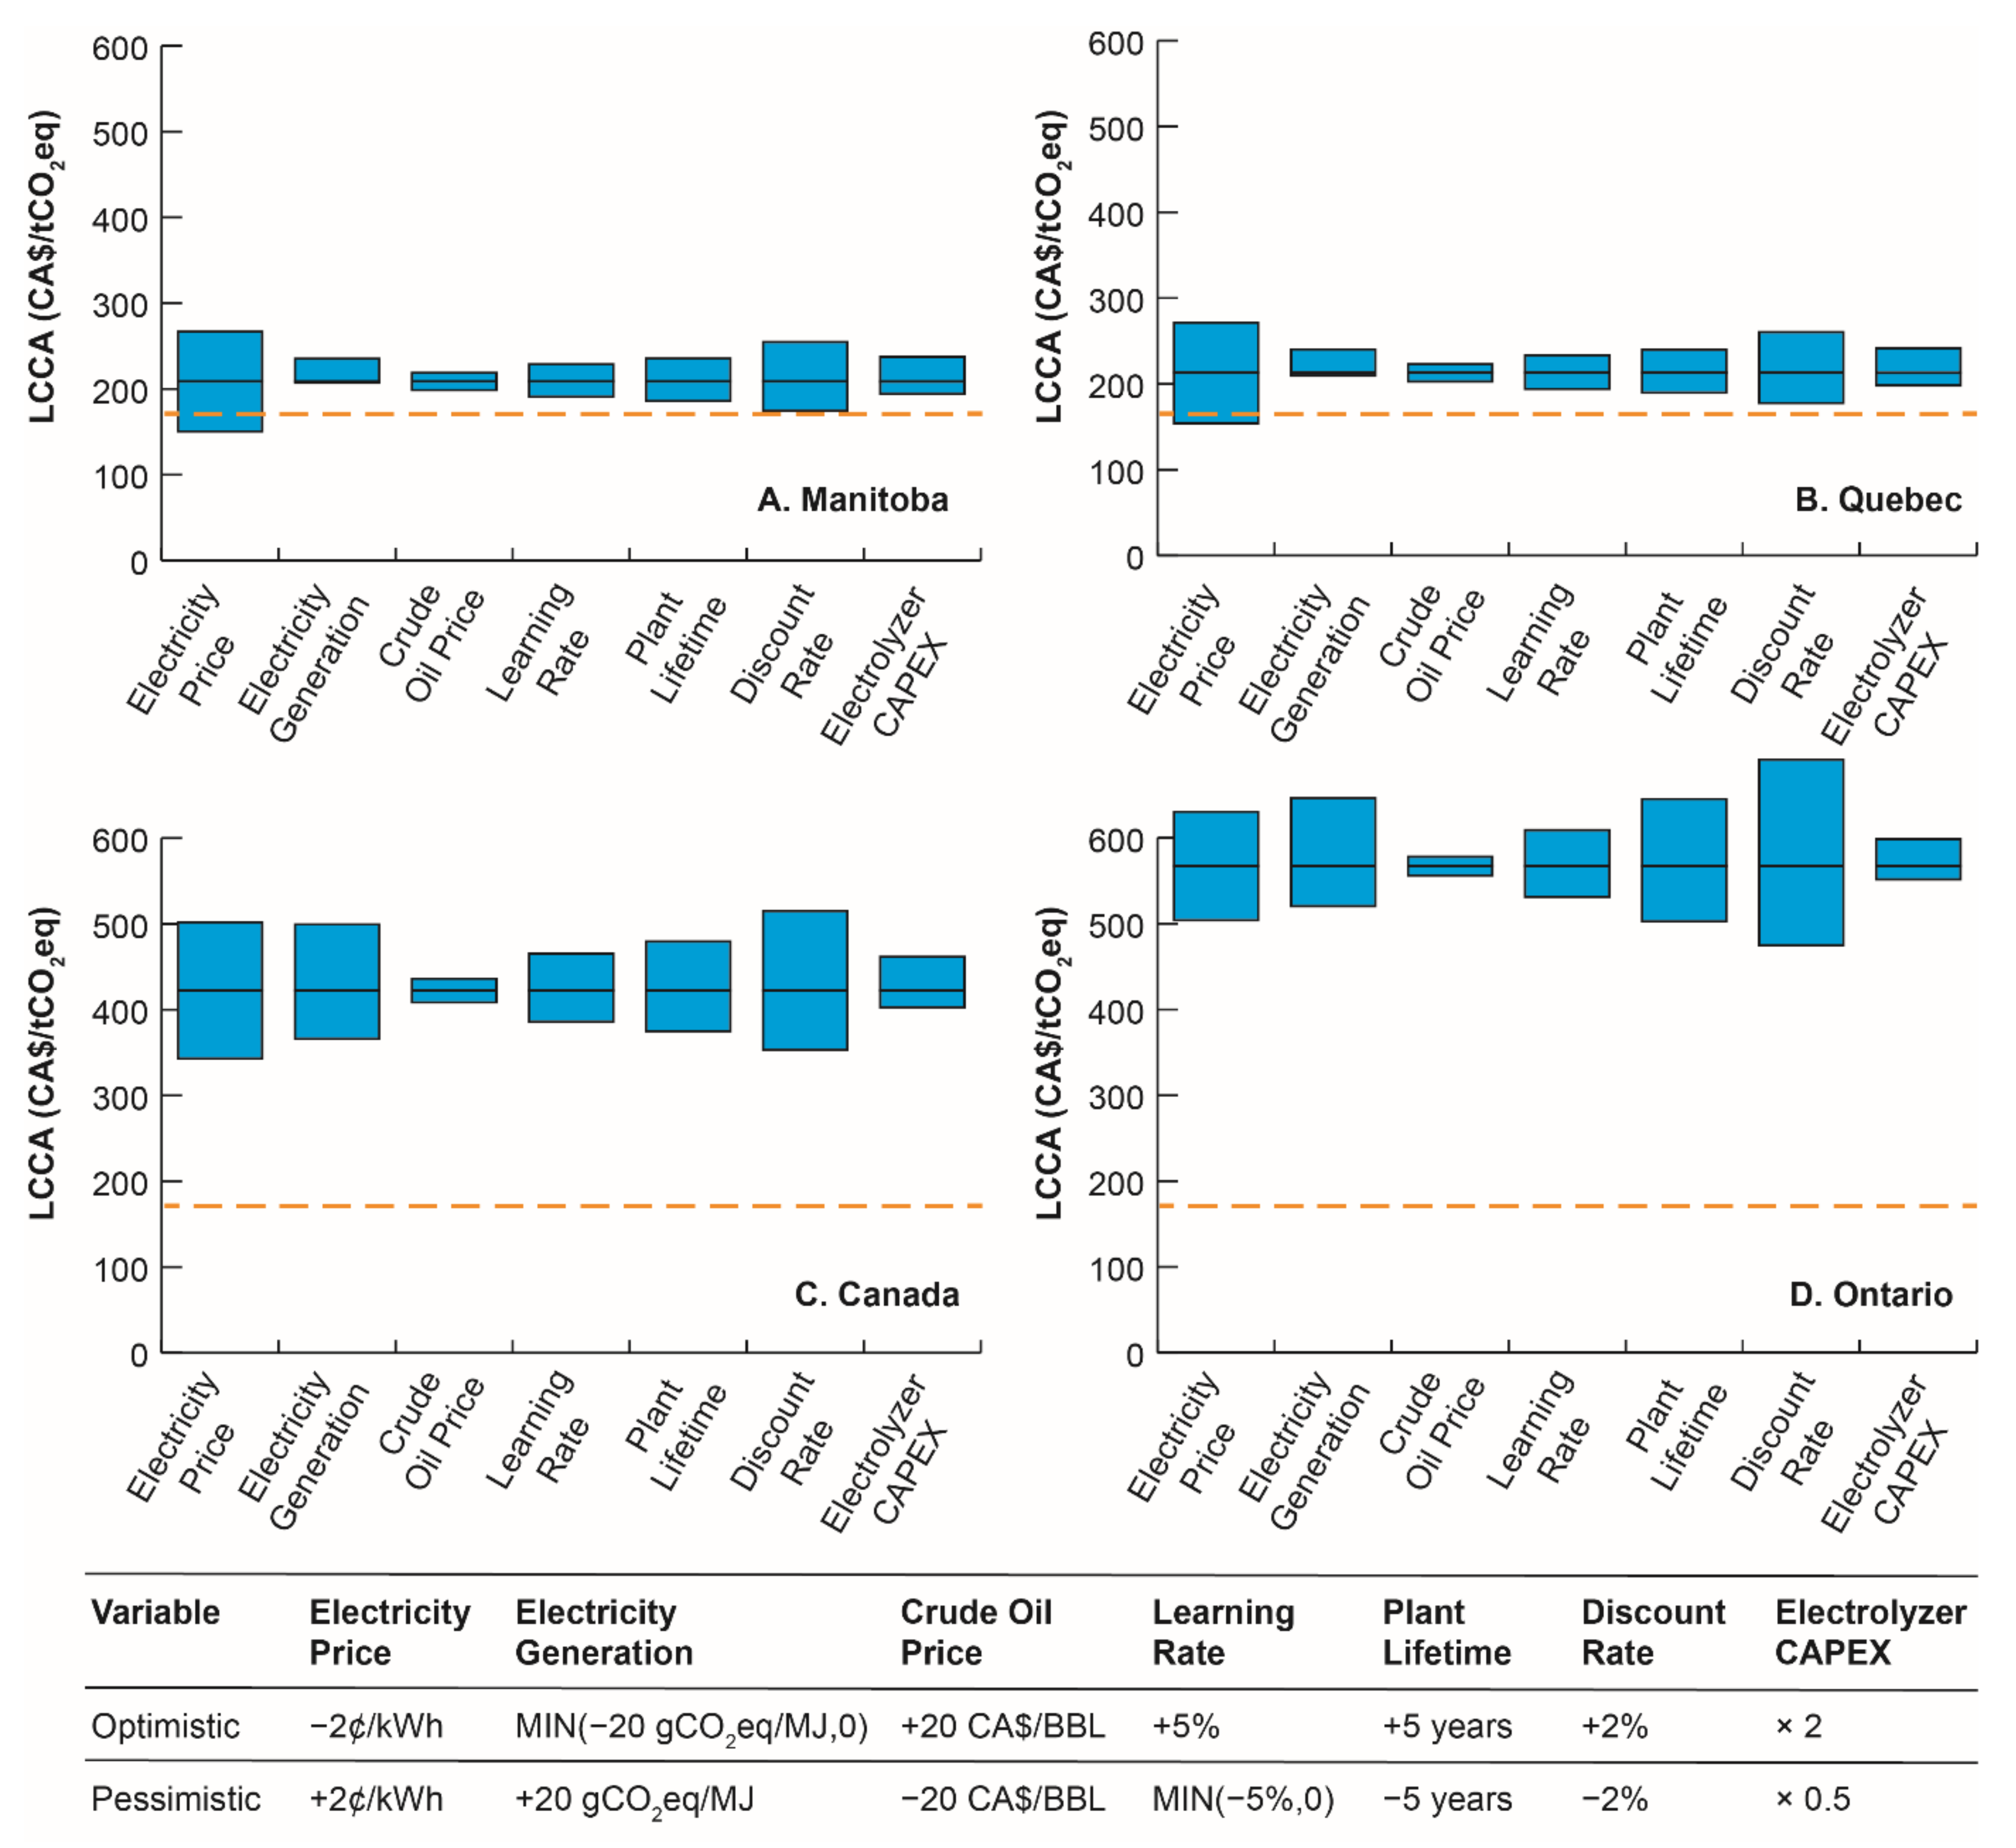
3.4. Sensitivity Analysis

While no provinces or territories in Canada have an LCCA that drops below the CA$170/tCO2eq federal carbon price, both Quebec and Manitoba move within CA$50/tCO2eq by 2050 under the Continued Policy Development Scenario. Furthermore, many of the variables used in our projections are subjected to external factors that lead to uncertainty in the reported LCCA. To understand how these external factors can influence our LCCA, we run a sensitivity analysis on electricity price, emission intensity from electricity generation, crude oil price, learning rate, and electrolyzer capital cost. Model-specific variables like plant lifetime and discount rate are also included. The effect on the 2050 LCCA for Quebec, Manitoba, Ontario, and Canada are provided in Figure 8. For each case, we assume a constant decrease or increase from the baseline value of the region. In the case of emission intensity from electricity generation and learning rate, a minimum of 0 was set.
Results of the sensitivity analysis show varying degrees of influence by the underlying factors. While there is significant uncertainty surrounding capital costs of nascent technology like the electrolyzer, we find that this does not translate to large uncertainty in the resulting LCCA. Conversely, the plant lifetime and discount rate model parameters lead to the most uncertainty, highlighting the importance of proper variable selection. Finally, while the sensitivity of the learning rate is noticeable, the significant variation of electricity price and emission intensity of electricity generation emphasizes the regional impact on the viability of low TRL CCUS. In particular, while the sensitivity of all other variables dampens as the LCCA decreases, the impact of electricity price remains the same.
Considering electricity price in more detail, the results show that for Manitoba and Quebec there are cases where the LCCA of the proposed CO2-to-diesel process drops below the federal carbon price limit. Specifically, if the electricity price in Quebec is 2 ¢/kWh below the projected value, the LCCA will reach CA$154/tCO2eq in 2050 and drop below the federal carbon price in 2038. Likewise with Manitoba, the LCCA will reach CA$151/tCO2eq in 2050 and drop below the federal carbon price in 2037. When compared to the pledged carbon price levy, this would save the consumer of 41 ¢/L and 39 ¢/L in Manitoba and Quebec, respectively. Furthermore, combinations of these variables shifting towards our optimistic cases can further reduce the LCCA.
An LCCA below the federal carbon price indicates that the emissions-reducing technology can be fully funded by revenue generated from the federal carbon price, rather than from other public revenue streams. Considering Manitoba, an additional investment would be required to make up the gap between the LCCA and carbon price—CA$100/tCO2eq or CA$100 million in 2027. However, this investment would be fully recovered in 2037 when avoided costs are considered. Therefore, Manitoba and Quebec are both well-suited provinces for CO2-to-diesel technology if capacity growth is in line with our Continued Policy Development Scenario. For the Canadian average and Ontario, the gap between the LCCA and the federal carbon price is still significantly under the optimistic cases, meaning operation of the proposed CO2-to-diesel is highly sensitive to regional variations and facility construction should be limited to regions with favorable environments for CCUS technology.

4. Future Work

Variable policy and market conditions in different global jurisdictions create opportunities for specific CCUS technologies. Therefore, future work should look to apply our methodology to different CCUS technologies and/or different global jurisdictions to identify locations where each unique process offers a cost-effective climate solution. For example, CO2 electrolysis [48] is an area of active research as a negative emissions CCUS pathway. Due to the lower TRL of CO2 electrolysis compared to an RWGS reaction for producing CO, a CO2 electrolysis-to-diesel pathway could lead to lower LCCAs after sufficient doublings of capacity. However, this technology also has higher electricity consumption requirements that could offset any cost reductions. Beyond CO2-to-diesel production, CO2 electrolysis can serve as a pathway to production [48,49] of various renewable chemicals, fuels, and value-added products. As new CCUS technologies mature, detailed projections for deployment should be developed on a case-by-case basis using our methodology to the benefit of sub-national, national, and multi-national jurisdictions alike.

5. Conclusions and Policy Implications

5.1. Conclusions

For the first time, technology learning curves (TLCs) have been integrated with a levelized cost of carbon abatement (LCCA) to assess early-stage CCUS technologies and determine the true cost of mitigating emissions. Using a case study, we illustrated and demonstrated this integrated TLC-LCCA tool for a CO2-to-diesel pathway under three policy scenarios in Canada. Through technological learning alone, we find that the LCCA for a 1 MtCO2/year CO2-to-diesel process will drop from CA$987/tCO2eq in 2027 to CA$482/tCO2eq in 2050. Projections for energy consumption and market prices across Canada allow us to develop regional roadmaps accounting for variations in market factors, emission intensities, and energy profiles. High emission intensities of electricity generation in Alberta, Nova Scotia, and Nunavut lead to a net increase in emissions when replacing fossil fuel-derived diesel with CO2-derived diesel. For all other regions, we find that CO2-to-diesel processes are infeasible under existing policy pledges without additional subsidies. Under a scenario of continued policy development, Manitoba and Quebec reach 2050 LCCAs of CA$209/tCO2eq and CA$213/tCO2eq, respectively. This is primarily due to low emission intensities from electricity generation and low electricity prices compared to other regions in Canada. From a consumer perspective, this would cost 20 ¢/L and 23 ¢/L, respectively, above the federal carbon price levy of CA$170/tCO2eq in 2030.
We find that substituting fossil fuel-derived diesel with CO2-derived diesel versus substituting the diesel pool composition with CO2-derived diesel leads to a 105 MtCO2eq difference in avoided emissions, highlighting the importance of ensuring CO2-derived diesel does not replace biodiesel or other renewable fuels. For regions with higher relative emission intensities, technological learning has more relative importance than areas of low emission intensities, but overall more emissions are avoided in areas with lower emission intensities from electricity generation. Rather than developing CCUS technologies, areas with higher emission intensities from electricity generation should focus on the decarbonization of their electrical grid.
For Manitoba and Quebec, electricity available at 2 ¢/kWh below the baseline values would lead to LCCAs of CA$151/tCO2eq and CA$154/tCO2eq in 2050, respectively. This would save the consumer 41 ¢/L and 39 ¢/L, respectively, when compared to the levy from the pledged carbon price. A higher learning rate, longer plant lifetime, or larger discount rate can lead to further decreases in the LCCA. Overall, Quebec and Manitoba are well-suited for the deployment of CCUS technology such as our CO2-to-diesel process.
Finally, from a wider perspective, CO2-derived diesel is developing alongside numerous strategies aiming to decarbonize transportation in Canada. For instance, electric vehicles are highly energy-efficient [50,51] and are seen as the primary solution [51,52] to decarbonizing light-duty and personal transportation. At the same time, renewable fuels like hydrogen, biofuels, and CO2-derived fuels are anticipated to help decarbonize other areas including maritime shipping, aviation, and heavy-duty transportation [52]. This is particularly true in the short to medium term due to energy density limits [51] in electric vehicle technology. Considering the importance of both electrification and the use of low carbon fuels in the energy transition [52], future efforts should aim to identify gaps in decarbonization so that these technologies can be deployed in a strategic and complementary way. In the context of the present study, electric vehicles would be well suited for regions with low emission intensity electricity, like Quebec or Manitoba. Meanwhile, for regions with high emission intensity electricity like Alberta or Saskatchewan, CO2-derived fuel offers an effective solution to decarbonizing transportation.

5.2. Policy Implications

While scale-up of low technology readiness level CCUS technologies can help reduce costs and mitigate emissions over time, new policy mechanisms can catalyze the deployment of this low carbon technology. Foremost, escalating the federal carbon price beyond 2030 provides a broad market solution to incentivizing low carbon technologies. An economy-wide carbon price signal is considered an effective approach for achieving long-term emissions mitigation goals, such as Canada’s 2050 net-zero emissions target [53]. For the proposed CO2-to-diesel process, if the federal carbon price rose to the BP estimate [54] of US$250/tCO2eq by 2050, the LCCA under the Continued Policy Development Scenario for Quebec and Manitoba would both be under the federal carbon price. Additional policies (e.g., carbon pricing) applied at the provincial level could also support the proposed CCUS technology beyond the federal carbon price level. Seven provinces and territories in Canada, including Quebec, have sub-national carbon prices [55] in place. However, carbon pricing as a primary policy approach for emissions mitigation has been criticized [56]. While others support the effectiveness of carbon pricing, it should be part of a larger policy package aiming to reduce emissions that includes complementary climate and non-climate policies [53,57]. The United States currently uses the 45Q tax credit [58] that will provide a US$35/tCO2eq credit to carbon utilization processes by 2026. Implementation of a similar tax credit in Canada could help bridge the gap between the LCCA of CCUS technologies and the federal carbon price.
Regulating the allowable emission intensity of fuels, akin to the Clean Fuel Standard, can also support a CO2-to-diesel process. Under the Clean Fuel Standard, the emission intensity of liquid fuels is required to drop 12 gCO2eq/MJ [25] from 90.4 gCO2eq/MJ to 81.0 gCO2eq/MJ between 2022 and 2030. By continuing this emission intensity standard trajectory beyond 2030, low emission intensity fuels will be required to be blended at increased quantities into fuels. While biodiesel is currently used to reduce the overall emission intensity of the diesel pool, CO2-derived diesel can accelerate this process due to an emission intensity of 5 gCO2eq/MJ lower [23] than biodiesel. However, emission reduction targets could still be achieved through lower-cost biodiesel. Instead, introducing modified fuel blending requirements can better support the growth of CO2-derived fuels. In 2020, Canada, along with five provinces, had diesel fuel blending requirements ranging from 2.0–4.0% [59] biodiesel in the diesel pool. Introducing a similar CO2-derived fuel blending requirement would incentivize the growth of CO2-to-fuels technologies that could accelerate capacity growth and therefore, technological learning and reduced LCCAs.
Mechanisms such as Renewable Portfolio Standards [60] can help reduce emission intensities from electricity generation by mandating the percent of electricity generated from renewable or non-emitting sources. In Canada, five provinces [60] currently have a Renewable Portfolio Standard in place, ranging from targets of 30% in 2030 in Alberta to 93% as of 2020 in British Columbia. Nova Scotia, Alberta, Saskatchewan, and the Northwest Territories, with emission intensities above the national average, are good targets for emissions reduction through non-emitting electricity sources. All but Northwest Territories have a Renewable Portfolio Standard in place, but none provide targets beyond 2030. Increasing the renewable energy requirement and setting new targets towards 2050 can both help support the decarbonization of Canada’s electrical grid and lower the LCCA for CCUS technologies such as the proposed CO2-to-diesel process. Alongside Renewable Portfolio Standards, feed-in tariffs and coal phase-out [61] can also generate large reductions in emission intensity.
In addition to reducing emission intensity, increased capacity of renewable electricity can help lower regional costs of electricity. In 2020, the International Energy Agency (IEA) reported that solar photovoltaic (PV) is consistently cheaper than coal and gas-fired electricity generation [62] in most countries. Furthermore, the International Renewable Energy Agency (IRENA) projected the cost of solar PV could fall to as low as US$0.02/kWh in 2030 and US$0.014/kWh in 2050 [63]. In the short term, replacing coal and gas-fired electricity generation with cheap renewable sources such as solar PV and onshore wind can reduce emission intensities while simultaneously reducing electricity costs. In the long term as electricity storage becomes more reliable, the substitution of more expensive electricity sources such as nuclear can further reduce the LCCA as emission intensities begin to level out.
Finally, public RD&D investment in CCUS technology is important for creating a demand for clean technology [61], while also leading to reductions in cost through learning-by-researching [64]. During early development periods, policies that support learning-by-researching [65] can be effective in the growing market capacity of a particular technology. For low technology readiness levels, CCUS such as the proposed CO2-to-diesel process, a well-designed funding program [66] will be necessary to support its innovation process. Focus moving forward should be to ensure coordination between RD&D funding and support policy to accelerate CCUS innovation towards market diffusion.
Overall, learning in emerging CCUS technology, realized through deployment and scale-up of promising processes, provides a competitive option for the synthesis of low emission, CO2-derived products, particularly in regions with favorable market conditions. The additional policy supports up to and beyond 2030, including an escalating carbon price, CO2-derived fuel blending requirements, or investment in low-cost renewable electricity, can further accelerate market diffusion. While this study has been tailored to a Canadian context, our methodology and model provided can be applied to develop detailed LCCA projections for any region and technology.

Supplementary Materials

The following are available online at https://www.mdpi.com/article/10.3390/en14216957/s1, Figures S1 and S2, Tables S1–S43. Includes details of the mass and energy balance, techno-economic analysis, life cycle assessment, a description of the incumbent diesel production process and economic estimates, 2026 CER market variables used for the learning curve study, emissions intensities by source of electricity generation, learning rates used in the study, diesel demand and diesel pool compositions by scenario, S-curve demand projections, LCCA for each region and scenario, and emissions avoided for each region and scenario. Table S44. Supplemental LCCA Example. Provides an example of the LCCA calculation for Quebec under the Continued Policy Development Scenario and fossil fuel-derived diesel substitution.

Author Contributions

Conceptualization, Data Curation, Formal Analysis, Investigation, Methodology, Visualization, Writing—Original Draft, Writing—Review & Editing, A.W.R.; Conceptualization, Data Curation, Formal Analysis, Investigation, M.K.; Conceptualization, Data Curation, Formal Analysis, Investigation, J.S.; Writing—Review & Editing, Supervision, Project Administration, Funding Acquisition, P.D.L.; Conceptualization, Resources, Writing—Review & Editing, Supervision, Project Administration, F.B. All authors have read and agreed to the published version of the manuscript.

Funding

This research received no external funding.

Data Availability Statement

Original data used for our analysis is available through the Canada Energy Regulator (https://doi.org/10.35002/zjr8-8x75) and the International Energy Agency (https://doi-org/10.1787/co2-data-en; https://doi.org/10.1787/oil-data-en, https://doi.org/10.1787/enestats-data-en).

Acknowledgments

A.W.R. would like to acknowledge the support of his thesis advisor Paulette Clancy for providing him the opportunity to conduct part of his thesis work with National Research Council of Canada. This work was supported by the National Research Council of Canada.

Conflicts of Interest

The authors declare no competing interests.

Abbreviations

LCCALevelized Cost of Carbon Abatement
TLCTechnology Learning Curve
TRLTechnology Readiness Level
MEAMonoethanolamine
RWGSReverse Water Gas Shift
FTFischer Tropsch
HDRDHydrogenation-Derived Renewable Diesel

References

  1. International Energy Agency (IEA). CO2 Emissions from Fuel Combustion Statistics. Available online: https://doi-org/10.1787/co2-data-en (accessed on 18 March 2021).
  2. International Energy Agency (IEA). CCUS in Clean Energy Transitions; IEA Publications: Paris, France, 2020. [Google Scholar]
  3. Grim, R.G.; Huang, Z.; Guarnieri, M.T.; Ferrell, J.R., III; Tao, L.; Schaidle, J.A. Transforming the Carbon Economy: Challenges and Opportunities in the Convergence of Low-Cost Electricity and Reductive CO2 Utilization. Energy Environ. Sci. 2020, 13, 472–494. [Google Scholar] [CrossRef]
  4. MacDowell, N.; Fennell, P.S.; Shah, N.; Maitland, G.C. The Role of CO2 Capture and Utilization in Mitigating Climate Change. Nat. Clim. Chang. 2017, 7, 243–249. [Google Scholar] [CrossRef] [Green Version]
  5. Hepburn, C.; Adlen, E.; Beddington, J.; Carter, E.A.; Fuss, S.; MacDowell, N.; Minx, J.C.; Smith, P.; Williams, C.K. The Technological and Economic Prospects for CO2 Utilization and Removal. Nature 2019, 575, 87–97. [Google Scholar] [CrossRef] [Green Version]
  6. Naims, H. Economics of Carbon Dioxide Capture and Utilization—A Supply and Demand Perspective. Environ. Sci. Pollut. Res. 2016, 23, 22226–22241. [Google Scholar] [CrossRef] [Green Version]
  7. Zimmermann, A.W.; Schomäcker, R. Assessing Early-Stage CO2 Utilization Technologies—Comparing Apples and Oranges? Energy Technol. 2017, 5, 850–860. [Google Scholar] [CrossRef] [Green Version]
  8. Roh, K.; Bardow, A.; Bongartz, D.; Burre, J.; Chung, W.; Deutz, S.; Han, D.; Heßelmann, M.; Kohlhaas, Y.; König, A.; et al. Early-stage Evaluation of Emerging CO2 Utilization Technologies at Low Technology Readiness Levels. Green Chem. 2020, 22, 3842–3859. [Google Scholar] [CrossRef]
  9. Otto, A.; Grube, T.; Schiebahn, S.; Stolten, D. Closing the Loop: Captured CO2 as a Feedstock in the Chemical Industry. Energy Environ. Sci. 2015, 8, 3283–3297. [Google Scholar] [CrossRef] [Green Version]
  10. Schakel, W.; Fernández-Dacosta, C.; Van Der Spek, M.; Ramírez, A. New Indicator for Comparing the Energy Performance of CO2 Utilization Concepts. J. CO2 Util. 2017, 22, 278–288. [Google Scholar] [CrossRef]
  11. Rubin, E.S. Improving Cost Estimates for Advanced Low-carbon Power Plants. Int. J. Greenh. Gas Control 2019, 88, 1–9. [Google Scholar] [CrossRef]
  12. Zimmermann, A.; Wunderlich, J.; Buchner, G.; Muller, L.; Armstrong, K.; Michailos, S.; Marxen, A.; Naims, H.; Mason, F.; Stokes, G.; et al. Techno-Economic Assessment & Life-Cycle Assessment Guidelines for CO2 Utilization; Global CO2 Initiative: Ann Arbor, MI, USA, 2018. [Google Scholar]
  13. Friedmann, S.J.; Fan, Z.; Byrum, Z.; Ochu, E.; Bhardwaj, A.; Sheerazi, H. Levelized Cost of Carbon Abatement: An Improved Cost-Assessment Methodology for a Net-Zero Emissions World; Columbia University Center on Global Energy Policy: New York, NY, USA, 2020. [Google Scholar]
  14. Global CCS Institute. Is the World Ready for Carbon Capture and Storage? Global CCS Institute: Melbourne, Australia, 2018. [Google Scholar]
  15. World Bank Group. GDP (Current US$). Available online: https://data.worldbank.org/indicator/NY.GDP.MKTP.CD (accessed on 11 March 2021).
  16. Environment and Climate Change Canada. National Inventory Report 1990-2018: Greenhouse Gas Sources and Sinks in Canada; Environment and Climate Change Canada: Ottawa, ON, Canada, 2020. [Google Scholar]
  17. Environment and Climate Change Canada. Progress Towards Canada’s Greenhouse Gas Emissions Reduction Target. Available online: https://www.canada.ca/en/environment-climate-change/services/environmental-indicators/progress-towards-canada-greenhouse-gas-emissions-reduction-target.html (accessed on 11 March 2021).
  18. Environment and Climate Change Canada. What Is the Clean Fuel Standard? Available online: https://www.canada.ca/en/environment-climate-change/services/managing-pollution/energy-production/fuel-regulations/clean-fuel-standard/about.html (accessed on 11 March 2021).
  19. International Carbon Action Partnership (ICAP). Canada Proposes Rising Carbon Price to 2030. Available online: https://icapcarbonaction.com/en/news-archive/736-canada-proposes-rising-carbon-price-to-2030 (accessed on 11 March 2021).
  20. Spurgeon, J.M.; Kumar, B. A Comparative Technoeconomic Analysis of Pathways for Commercial Electrochemical CO2 Reduction to Liquid Products. Energy Environ. Sci. 2018, 11, 1536–1551. [Google Scholar] [CrossRef]
  21. Dimitriou, I.; García-Gutiérrez, P.; Edler, R.J.; Cuéllar-Franca, R.M.; Azapagic, A.; Allen, R.W.K. Carbon Dioxide Utilisation for Production of Transport Fuels: Process and Economic Analysis. Energy Environ. Sci. 2015, 8, 1775–1789. [Google Scholar] [CrossRef] [Green Version]
  22. Canada Energy Regulator. Canada’s Energy Future 2020: Energy Supply and Demand Projections to 2050; Canada Energy Regulator: Ottawa, ON, Canada, 2020. [Google Scholar]
  23. Environment and Climate Change Canada. Clean Fuel Standard: Proposed Regulatory Approach. Available online: https://www.canada.ca/en/environment-climate-change/services/managing-pollution/energy-production/fuel-regulations/clean-fuel-standard/regulatory-approach.html (accessed on 11 March 2021).
  24. Zauner, A.; Böhm, H.; Rosenfeld, D.C.; Tichler, R. Innovative Large-scale Energy Storage Technologies and Power-to-Gas Concepts after Optimization: Report on Learning Curves and Economies of Scale. Available online: https://www.storeandgo.info/fileadmin/downloads/deliverables_2019/20190801-STOREandGO-D7.5-EIL-Report_on_experience_curves_and_economies_of_scale.pdf (accessed on 4 December 2020).
  25. Department of the Environment. Clean Fuel Regulations. Can. Gaz. Part I 2020, 154, 3761–4305. [Google Scholar]
  26. Global CCS Institute. The Global Status of CCS: 2019; Global CCS Institute: Melbourne, Australia, 2019. [Google Scholar]
  27. Lambert, N. Study of Hydrogenation Derived Renewable Diesel as a Renewable Fuel Option in North America. Available online: https://www.nrcan.gc.ca/sites/www.nrcan.gc.ca/files/oee/files/pdf/transportation/alternative-fuels/resources/pdf/HDRD_Final_Report_eng.pdf (accessed on 11 March 2021).
  28. Canada Energy Regulator. Canada’s Energy Future; Canada Energy Regulator: Ottawa, ON, Canada, 2020. [Google Scholar]
  29. Hansen, M.; Bhargava, A.; Nadew, M.; Stogran, M.; Hansen, L.; Hundal, M.; Budgell, P.; Safton, R. Analyzing Uncertainty in Projections of Canadian Energy Use and Production: Results and Insights from EMF 34 Scenarios. Energy Policy 2021, 148, 111915. [Google Scholar] [CrossRef]
  30. Davis, M.; Moronkeji, A.; Ahiduzzaman, M.; Kumar, A. Assessment of Renewable Energy Transition Pathways for a Fossil Fuel-Dependent Electricity-Producing Jurisdiction. Energy Sustain. Dev. 2020, 59, 243–261. [Google Scholar] [CrossRef]
  31. Bošković, B.; Leach, A. Leave It in the Ground? Oil Sands Development under Carbon Pricing. Can. J. Econ. 2020, 53, 526–562. [Google Scholar] [CrossRef]
  32. Institut de L’energie Trottier. Canadian Energy Outlook 2021—Horizon 2060; Institut de L’energie Trottier: Montreal, QC, Canada, 2021. [Google Scholar]
  33. Canada Energy Regulator. Canada’s Renewable Power Landscape 2017—Energy Market Analysis. Available online: https://www.cer-rec.gc.ca/en/data-analysis/energy-commodities/electricity/report/2017-canadian-renewable-power/canadas-renewable-power-landscape-2017-energy-market-analysis-ghg-emission.html (accessed on 11 March 2021).
  34. International Energy Agency (IEA). World Energy Balances. Available online: https://doi.org/10.1787/enestats-data-en (accessed on 18 March 2021).
  35. Thomassen, G.; Van Passel, S.; Dewulf, J. A Review on Learning Effects in Prospective Technology Assessment. Renew. Sust. 2020, 130, 109937. [Google Scholar] [CrossRef]
  36. Brynolf, S.; Taljegard, M.; Grahn, M.; Hansson, J. Electrofuels for the transport sector: A review of production costs. Renew. Sustain. Energy Rev. 2018, 81, 1887–1905. [Google Scholar] [CrossRef]
  37. National Energy Technology Laboratory. Technology Learning Curve (FOAK to NOAK). Available online: http://citeseerx.ist.psu.edu/viewdoc/download;jsessionid=2215E76B047081C1EF98E855F731153A?doi=10.1.1.385.8547&rep=rep1&type=pdf (accessed on 18 January 2021).
  38. Schoots, K.; Ferioli, F.; Kramer, G.J.; Van der Zwaan, B.C.C. Learning Curves for Hydrogen Production Technology: An Assessment of Observed Cost Reductions. Int. J. Hydrog. 2008, 33, 2630–2645. [Google Scholar] [CrossRef]
  39. Rubin, E.S.; Yeh, S.; Antes, M.; Berkenpas, M.; Davison, J. Use of Experience Curves to Estimate the Future Cost of Power Plants with CO2 Capture. Int. J. Greenh. Control 2007, 1, 188–197. [Google Scholar] [CrossRef] [Green Version]
  40. Environment and Climate Change Canada. Pan-Canadian Framework on Clean Growth and Climate Change: Canada’s Plan to Address Climate Change and Grow the Economy; Environment and Climate Change Canada: Ottawa, ON, Canada, 2016. [Google Scholar]
  41. USDA Foreign Agriculture Service. Canada: Biofuels Annual 2019. Available online: https://www.fas.usda.gov/data/canada-biofuels-annual-5 (accessed on 11 March 2021).
  42. Rogers, E.M. Diffusion of Innovations; Free Press: New York, NY, USA, 1995. [Google Scholar]
  43. Schmidt, O.; Hawkes, A.; Gambhir, A.; Staffell, I. The Future Cost of Electrical Energy Storage Based on Experience Rates. Nat. Energy 2017, 2, 1–8. [Google Scholar] [CrossRef]
  44. Competition Bureau Canada. A Guide to Retail Gasoline Pricing in Canada. Available online: https://www.competitionbureau.gc.ca/eic/site/cb-bc.nsf/eng/04429.html (accessed on 11 March 2021).
  45. Gebremariam, S.N.; Marchetti, J.M. Economics of Biodiesel Production. Energy Convers. Manag. 2018, 168, 74–84. [Google Scholar] [CrossRef]
  46. Ogunkunle, O.; Ahmed, N.A. A Review of Global Current Scenario of Biodiesel Adoption and Combustion in Vehicular Diesel Engines. Energy Rep. 2019, 5, 1560–1579. [Google Scholar] [CrossRef]
  47. Naylor, R.L.; Higgins, M.M. The Political Economy of Biodiesel in an Era of Low Oil Prices. Renew. Sust. Energy Rev. 2017, 77, 695–705. [Google Scholar] [CrossRef]
  48. De Luna, P.; Hahn, C.; Higgins, D.; Jaffer, S.A.; Jaramillo, T.F.; Sargent, E.H. What Would It Take for Renewably Powered Electrosynthesis to Displace Petrochemical Processes? Science 2019, 364, eaav3506. [Google Scholar] [CrossRef] [PubMed] [Green Version]
  49. Jouny, M.; Luc, W.; Jiao, F. General Techno-Economic Analysis of CO2 Electrolysis Systems. Ind. Eng. Chem. Res. 2018, 57, 2165–2177. [Google Scholar] [CrossRef]
  50. Van der Zwaan, B.; Keppo, I.; Johnsson, F. How to Decarbonize the Transport Sector? Energy Policy 2013, 61, 562–573. [Google Scholar] [CrossRef] [Green Version]
  51. de Blas, I.; Mediavilla, M.; Capellán-Pérez, I.; Duce, C. The Limits of Transport Decarbonization under the Current Growth Paradigm. Energy Strategy Rev. 2020, 32, 100543. [Google Scholar] [CrossRef]
  52. International Energy Agency (IEA). Net Zero by 2050: A Roadmap for the Global Energy Sector; IEA Publications: Paris, France, 2021. [Google Scholar]
  53. National Round Table on the Environment and the Economy. Achieving 2050: A Carbon Pricing Policy for Canada; National Round Table on the Environment and the Economy: Ottawa, ON, Canada, 2009. [Google Scholar]
  54. British Petroleum Company. Energy Outlook 2020 Edition; British Petroleum Company: London, UK, 2020. [Google Scholar]
  55. World Bank Group. State and Trends of Carbon Pricing 2020; World Bank Group: Washington, DC, USA, 2020. [Google Scholar]
  56. Rosenbloom, D.; Markard, J.; Geels, F.W.; Fuenfschilling, L. Opinion: Why Carbon Pricing is not Sufficient to Mitigate Climate Change—And How “Sustainability Transition Policy” Can Help. Proc. Natl. Acad. Sci. USA 2020, 117, 8664–8668. [Google Scholar] [CrossRef] [Green Version]
  57. Bataille, C.; Guivarch, C.; Hallegatte, S.; Rogelj, J.; Waisman, H. Carbon Prices Across Countries. Nat. Clim. Chang. 2018, 8, 648–650. [Google Scholar] [CrossRef] [Green Version]
  58. Beck, L. The US Section 45Q Tax Credit for Carbon Oxide Sequestration: An Update; Global CCS Institute: Melbourne, Australia, 2020. [Google Scholar]
  59. Wolinetz, M. Biofuels in Canada 2020: Tracking Biofuel Consumption, Feedstocks, Avoided Greenhouse Gas Emissions and Fuel Cost Impacts; Navius Research: Vancouver, BC, Canada, 2020. [Google Scholar]
  60. Ye, J. Canadian Provincial Renewable Energy Standards. Available online: https://www.c2es.org/document/canadian-provincial-renewable-energy-standards/ (accessed on 11 March 2021).
  61. Jordaan, S.M.; Romo-Rabago, E.; McLeary, R.; Reidy, L.; Nazari, J.; Herremans, I.M. The Role of Energy Technology Innovation in Reducing Greenhouse Gas Emissions: A Case Study of Canada. Renew. Sust. Energ. Rev. 2017, 78, 1397–1409. [Google Scholar] [CrossRef]
  62. International Energy Agency (IEA). World Energy Outlook 2020; IEA Publications: Paris, France, 2020. [Google Scholar]
  63. International Renewable Energy Agency (IRENA). Future of Solar Photovoltaic 2019: Deployment, Investment, Technology, Grid Integration, and Socio-economic Aspects (A Global Energy Transformation: Paper); IRENA: Abu Dhabi, United Arab Emirates, 2019. [Google Scholar]
  64. Wene, C.O. Energy Technology Learning Through Deployment in Competitive Markets. Eng. Econ. 2008, 53, 340–364. [Google Scholar] [CrossRef]
  65. Lohwasser, R.; Madlener, R. Relating R&D Investment Policies to CCS Market Diffusion through Two-Factor Learning. Energy Policy 2013, 52, 439–452. [Google Scholar]
  66. Weyant, J.P. Accelerating the Development and Diffusion of New Energy Technologies: Beyond the “Valley of Death”. Energy Econ. 2013, 33, 674–682. [Google Scholar] [CrossRef]
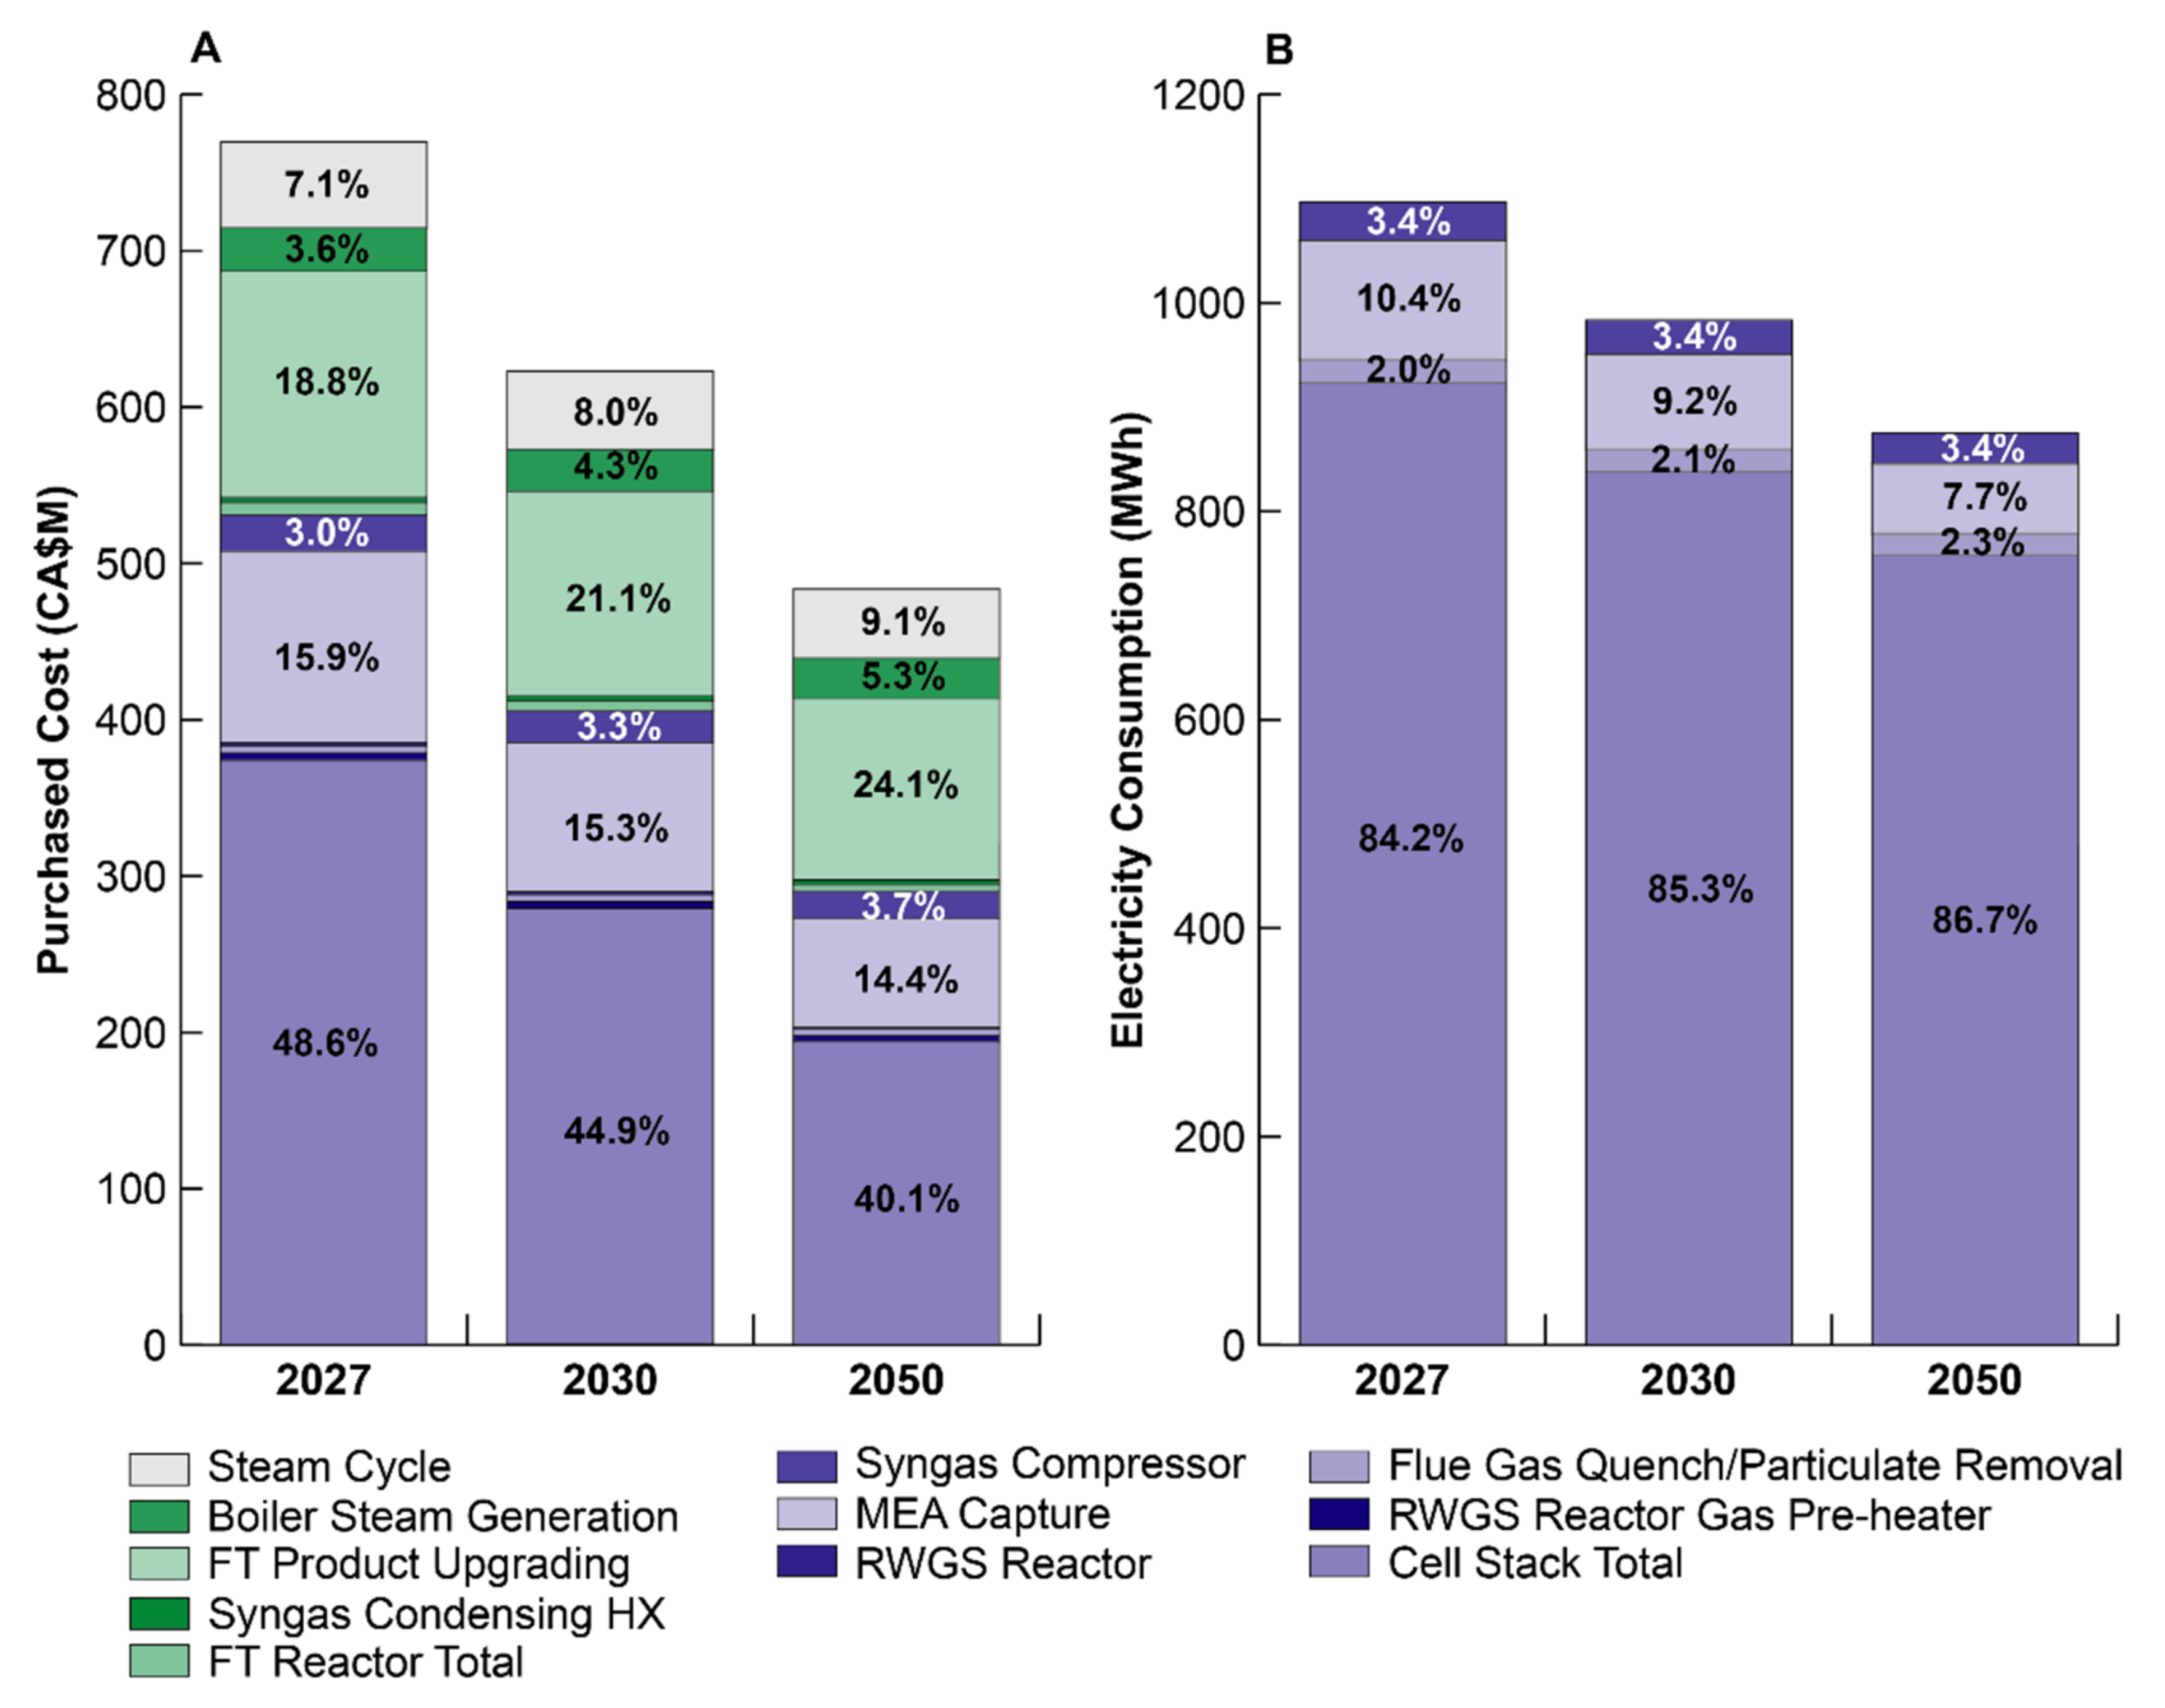
Figure 1. A block flow diagram of the CO2-to-diesel process used for our case study. The blue blocks indicate upstream processes, while green blocks indicate the FT synthesis and other downstream processes.
Energies 14 06957 g001
Figure 2. (A). The purchased cost of each unit in the overall CO2-to-diesel process highlighting the effect of individual learning rates on the cost structure of the process between 2027 and 2050. The cost-shares are provided for significant units. (B). The electricity consumption of each unit in the overall CO2-to-diesel process highlighting the effect of individual learning rates on the cost structure of the process between 2027 and 2050.
Energies 14 06957 g002
Figure 3. (A). The annual operating costs and lifetime capital costs of a 1 MtCO2/year CO2-to-diesel process from 2027 to 2050. (B). the LCCA compared to Canada’s federal carbon price pledge from 2027–2050. The difference between these in 2050 is provided. In each sub-figure, a legend is provided.
Energies 14 06957 g003
Figure 4. Projections for demand of diesel and biodiesel, as well as the demand for CO2-derived diesel under three different policy scenarios in Canada. A legend is provided below the figure. Data is provided in Table S9.
Energies 14 06957 g004
Figure 5. (A) Cumulative CO2-to-diesel capacity for each policy scenario using an S-curve distribution to model technological diffusion. Growth rates for each scenario are provided in the figure. (B) Annual CO2-to-diesel capacity growth for each policy scenario based on the derived growth rates. A legend is provided at the top of the figure. All data is provided in Tables S13–S15.
Energies 14 06957 g005
Figure 6. Projections for the LCCA for the provinces and territories in Canada with LCCA’s below CA$1000/tCO2eq under (A) The Continued Policy Development Scenario with substitution of fossil fuel-derived diesel, (B) The Continued Policy Development Scenario with substitution of the diesel pool, (C) The Growth Scenario with substitution of fossil fuel-derived diesel, (D) The Growth Scenario with substitution of the diesel pool, (E) The Existing Policy Scenario with substitution of fossil fuel-derived diesel, and (F) The Existing Policy Scenario with substitution of the diesel pool. Alberta, Nova Scotia, and Nunavut are not included since they do not abate emissions. Saskatchewan is not included because its LCCA is above the cutoff. The Canadian average LCCA and federal carbon price are provided as bold lines. All data are provided in Tables S16–S29.
Energies 14 06957 g006
Figure 7. Emissions avoided by type of mitigation for (A) Canada, (B) Quebec, (C) Ontario, and (D) Northwest Territories under the Continued Policy Development Scenario. The total emissions avoided from type of mitigation is provided to the right of each subfigure.
Energies 14 06957 g007
Figure 8. Sensitivity of the LCCA to seven highlighted factors for (A) Manitoba, (B) Quebec, (C) Canada, and (D) Ontario. The range of each variable for the optimistic and pessimistic cases are provided in the table below the sub-figures. The pledged federal carbon price of CA$170/tCO2eq is provided as a dashed orange line.
Energies 14 06957 g008
Table 1. Initial learning curve parameters for the capital costs of the individual units in the CO2-to-diesel process. Learning rates for each technology, along with capital expenses, initial cost-share, and whether or not the learning rate for individual unit was calculated based on its sub-components are provided.
ComponentCapital Expense (CA$M)Cost ShareSub-ComponentsLearning RateSources
PEM Electrolyzer374.0648.6%Yes12.9%[24]
Gas Pre-Heater before RWGS reactor4.560.6% 4%[37]
Flue Gas Quench and Particulate Removal4.710.6% 2%[37]
RWGS Reactor2.190.3% 11%[24,38]
MEA Capture112.2015.9% 11%[39]
Syngas Feed Compressor23.263.0% 5%[35]
FT Reactor7.671.0%Yes12.3%[24]
Syngas Cooler Water Condensing Heat Excharger3.350.4% 4%[37]
FT Product Upgrading144.5718.8% 4.0%[35]
Boiler Steam Generation27.823.6% 1%[37]
Steam Cycle54.837.1% 4%[37]
Overall769.43100.0% 9.5%
Table 2. Initial learning curve parameters for the energy efficiency of the individual units in the CO2-to-diesel process. Learning rates for each technology, along with electricity requirement, initial electricity share, and electricity minimum are provided.
ComponentElectricity (MW)Electricity ShareElectricity Minimum (MW)Learning RateSource(s)
PEM Electrolyzer923.584.2%572.6%12.9%[24]
Flue Gas Quench and Particulate Removal21.92.0% 2%[37]
MEA Capture114.210.4% 11%[39]
Syngas Feed Compressor37.23.4% 5%[35]
Total Consumption1096.8100.0%
Net Generation10.91.0%
Net Total1085.999.0%
Table 3. Demand for different diesel products, including CO2-derived diesel demand under each policy scenario.
Product2026 (PJ)2030 (PJ)2050 (PJ)
Diesel Demand756.1713.5480.1
Biodiesel13.219.321.4
CO2-Derived Diesel under Existing Policy Scenario (Scenario 1)0.049.049.0
CO2-Derived Diesel under Growth Scenario (Scenario 2)0.049.072.8
CO2-Derived Diesel under Continued Policy Development Scenario (Scenario 3)0.049.0294.0
Table 4. LCCA for each province and territory in Canada, as well as the Canadian average and federal carbon price, in the Continued Policy Development Scenario and under one-to-one substitution with fossil fuel-derived diesel in 2027 and 2050. The levelized diesel price above the CER Canadian average diesel price is also provided.
RegionLCCALevelized Diesel Price Above Canadian Average
2027 (CA$/tCO2eq)2050 (CA$/tCO2eq)2027 (CA$/L)2050 (CA$/L)
Carbon Price125.00170.000.340.46
Canada663.10422.412.821.73
Newfoundland & Labrador534.03433.604.072.99
Prince Edward Island509.90364.723.171.82
Nova ScotiaNo AbatementNo Abatement4.533.06
New Brunswick539.95364.723.111.99
Quebec295.45212.671.620.69
Ontario745.55567.325.304.00
Manitoba291.84208.751.630.66
SaskatchewanNo Abatement1576.492.111.11
AlbertaNo AbatementNo Abatement2.721.65
British Columbia517.39383.093.442.18
Yukon666.67454.963.882.64
Northwest Territories5006.75949.594.202.71
NunavutNo AbatementNo Abatement4.943.26
Publisher’s Note: MDPI stays neutral with regard to jurisdictional claims in published maps and institutional affiliations.

