Article

An Attempt to Use Machine Learning Algorithms to Estimate the Rockburst Hazard in Underground Excavations of Hard Coal Mine

1
Central Mining Institute, 1 Gwarków Sqr., 40-166 Katowice, Poland
2
School of Mining and Petroleum Engineering, University of Alberta, Edmonton, AB T6G 2R3, Canada
*
Author to whom correspondence should be addressed.
Energies 2021, 14(21), 6928; https://doi.org/10.3390/en14216928
Submission received: 20 August 2021 / Revised: 8 October 2021 / Accepted: 18 October 2021 / Published: 21 October 2021
(This article belongs to the Special Issue Geomechanics for Energy)

Abstract

:
Rockburst is a dynamic rock mass failure occurring during underground mining under unfavorable stress conditions. The rockburst phenomenon concerns openings in different rocks and is generally correlated with high stress in the rock mass. As a result of rockburst, underground excavations lose their functionality, the infrastructure is damaged, and the working conditions become unsafe. Assessing rockburst hazards in underground excavations becomes particularly important with the increasing mining depth and the mining-induced stresses. Nowadays, rockburst risk prediction is based mainly on various indicators. However, some attempts have been made to apply machine learning algorithms for this purpose. For this article, we employed an extensive range of machine learning algorithms, e.g., an artificial neural network, decision tree, random forest, and gradient boosting, to estimate the rockburst risk in galleries in one of the deep hard coal mines in the Upper Silesian Coal Basin, Poland. With the use of these algorithms, we proposed rockburst risk prediction models. Neural network and decision tree models were most effective in assessing whether a rockburst occurred in an analyzed case, taking into account the average value of the recall parameter. In three randomly selected datasets, the artificial neural network models were able to identify all of the rockbursts.

1. Introduction

Rockburst is a complex, dynamic, and catastrophic phenomenon, occurring during the excavation of underground workings, mostly during the mining of natural resources and while excavating tunnels. A major mining hazard is a cause of underground infrastructure destruction and, in many cases, has tragic consequences.
The occurrence of rockbursts is a global problem. Rockbursts are present both during the mining of many resources, including hard coal, and in different mining methods. Consequently, many definitions of rockburst are based on various concepts, experiences, and theories [1,2,3,4].
Rockburst in underground hard coal mines was defined by Dubiński and Konopko [2] as a sudden release of strain energy accumulated in the rock mass, correlated with high-energy vibrations of rock mass, and acoustic effects and shock waves causing the structural destruction of a coal seam or its roof or floor rocks, and, simultaneously, a movement of rocks into the excavation. It destroys or damages supports, machines, and devices [2]. In hard coal mines, this phenomenon is commonly called a coal bump.
Rockbursts can be categorized according to their cause. They can be triggered by stress changes close to excavation boundaries and remote seismic events [5]. Stress rockburst results from a sudden release of accumulated energy combined with a stress increase in the rock mass in the vicinity of an underground excavation. Stress rockbursts are present in hard coal mines [2,6,7]. Rockbursts triggered by the sudden dynamic impact resulting from a fracture in the competent rocks above or under the deposit are called stroke rockbursts. These types of rockbursts are also present in hard coal mines. In hard coal mines, mixed rockbursts (i.e., stress-stroke rockbursts) are common. They are caused by the influence of the dynamic load pulse, due to competent rocks fracturing on the partly stressed sidewall part of the coal seam [6]. Thus, a complex constellation of factors contributes to rockburst in hard coal mines.
The rockburst phenomenon in hard coal mines has been investigated for many years in the Polish part of the Upper Silesian Coal Basin (USCB), e.g., [8,9,10,11,12]. The annual number of rockbursts in hard coal mines in the Polish part of the Upper Silesian Coal Basin remains stable despite a decreasing total coal extraction [13]. This constant number of rockbursts results from mining at ever greater depths and the additional stress from remnants from previous coal seams mining and left pillars. Over the past few years, the number of phenomena officially classified as rockbursts in the Polish part of the Upper Silesian Coal Basin has ranged from one to four per year [13]. These phenomena are usually associated with fatal accidents, and damage to workings occurs over a large distance. Apart from them, some dynamic phenomena cause local damage to mine workings. Although concerning damage to workings on a smaller scale, these phenomena were not omitted in the presented study. Rockbursts in underground excavations of non-coal mines or tunnels are predicted mainly by using stress-related and energy-related factors; among them, tangential stress, uniaxial compressive strength, uniaxial tensile strength, and the strain energy storage index.
There are numerous reasons for rockburst hazards in hard coal mines. Pure stress rockbursts or pure stroke rockbursts occur in practical hard coal mining, but mixed stress-stroke rockbursts dominate [6]. Factors affecting the rockburst hazard in excavations of underground hard coal mines can be classified into three main groups: geological, mining, and technical/technological. Belonging to the main geological factors are: the depth of mining and, correlated with it, the primary stress level in the rock mass; the coal seam thickness and its predisposition to burst; the strength properties of gangue rocks surrounding the coal seam; thick layers of competent roof rocks able to accumulate the strain energy and its sudden release; tectonics and coal seam disturbances (splittings, washouts) in charge of residual stress occurrence. Besides, leaving coal at the bottom of an excavation can result in a floor heave. The main mining factors responsible for rockburst occurrence are edges and remnants of previously extracted coal seams, the increasing stress level in the rock mass, pillars and ribs of coal from previous excavations, and the presence of goaf and other underground excavations. After the total extraction of the coal seam, the stress level in the rock mass decreases, which helps to minimize the rockburst hazard in excavations in other coal seams, but usually only for a few years. The main factors minimizing the occurrence of rockbursts in underground workings belong to technical/technological parameters and include active rockburst prevention (e.g., destress blasting, hydrofracturing, and large-diameter hole drilling) and support reinforcement. The complex mechanisms and many factors contributing to rockburst in hard coal mines make predicting this phenomenon difficult.
Geological and mining conditions are becoming more and more complex, e.g., growing depth, edges of coal seams, and sill pillars. Currently, there are also more and more tremors in the pillars, and their energy is comparable to the energy of regional tremors. Therefore, in order to predict and control rockburst hazards, additional solutions are necessary.
Rockburst hazards in underground hard coal mines in the Upper Silesian Coal Basin are estimated in both long- and short-term periods. This means that the potential and actual state of rockburst hazards are estimated, respectively.
Methods belonging to the first group are applied during the planning of mining workings. The long-term rockburst hazard assessment is based on the analysis of mechanical parameters of the coal seam and/or surrounding rocks, e.g., the uniaxial compressive strength. The long-term rockburst hazard assessment is also conducted by analyzing the geological and mining conditions. In Polish hard coal mines, this method is known as mining hazards assessment, and it is a part of a complex method [6]. Factors affecting rockburst hazards are taken into consideration, and each has its value. All of these values are added up to obtain the potential rockburst hazard state. The long-term rockburst hazard assessment in hard coal mines of the Polish part of the Upper Silesian Coal Basin is also supported by theoretical stress distributions [14,15].
The short-term rockburst hazard assessment is based on field observations from some basic methods, e.g., seismological monitoring, seismoacoustic emission monitoring, and drillings [6]. Seismic surveys in situ, e.g., seismic tomography and seismic profiling, or the induced seismoacoustic activity method, are also commonly applied. In addition, direct measurements of stress changes in underground excavations are, at present, more and more common.
In the comprehensive method commonly used in USCB mines, the results of the mining hazards assessment (state of potential rockburst hazard) and the results of current seismological and seismoacoustic observations and drillings are taken into account together in the daily assessment of the state of rockburst hazards [6]. This article proposed a similar solution for assessing the rockburst hazard but based on machine learning algorithms. Factors potentially influencing the risk of rockbursts have been linked to the results of the current seismological monitoring. The database prepared in this way was analyzed and then used to train models of machine learning algorithms.
Many methods have been worked out or imported during many years of working rockburst hazards in hard coal mines in the Upper Silesian Coal Basin. However, predicting rockbursts in underground excavations is still a complicated and ambiguous issue. Machine learning algorithms are becoming more widely used to solve complex problems, which may have multiple causes, such as rockburst hazards during underground work.
Next to the methane hazard, the rockburst hazard is the dominant threat in the selected hard coal mine in the Upper Silesian Coal Basin. This mine is part of the Polish Mining Group. The data analyzed in this paper come from a coal mine located in the main saddle, which is a structural geological unit of the Upper Silesian Coal Basin. The beginnings of the exploitation in this mine date back to the eighteenth century. The mine’s long history is reflected in the complicated mining conditions, with many pillars, remnants, and edges of extracted coal seams. The geological conditions are also complicated because of tectonics and coal seam disturbances, e.g., folding, washout, splitting.
Additionally, thick layers of competent rocks (sandstones) are present in the lithological structure. Therefore, most of the coal seams can accumulate strain energy while under stress. In the selected hard coal mine, passive rockburst prevention (e.g., monitoring, support reinforcement) and active rockburst prevention (e.g., blasting) are applied. They have a positive influence on the state of rockburst hazards in underground excavations. However, the occurrence of rockbursts has not been eliminated. In both the selected mine and other mines in the Upper Silesian Coal Basin, the effects of rockbursts have occurred in recent years in practically only the development headings. Occasionally, the effects of rockbursts have occurred in longwalls.
For this reason, in our paper, we focused only on rockbursts in the development headings. The purpose of the research described in this article was to check whether a machine learning algorithms can learn to recognize when a tremor caused a rockburst and when it did not, in specific geological, mining, and technical/technological conditions, and with the values of selected parameters correlated with tremors and their distribution. The application of machine learning algorithms to the problem of rockbursts may prove helpful in improving safety. Moreover, reducing the number of rockbursts also reduces the costs associated with the removal of their damages. Such costs depend on the extent of the damage, but they are usually large.

2. Materials and Methods

2.1. The Current Application of Machine Learning Algorithms to the Problem of Rockbursts in Hard Coal Mines

Machine learning algorithms are a set of algorithms intended to train mathematical models based on sample data and make decisions without being specially programmed. In general, there are three types of machine learning algorithms: supervised, unsupervised, and reinforcement.
Supervised machine learning algorithms use a training dataset with labelled examples. The process of training continues until the model achieves a desired level of the selected indicator. Supervised machine learning algorithms include artificial neural networks, decision trees, random forests, support vector machines, gradient boosting, and naïve Bayes.
The dependence between geological, mining, and technical/technological conditions, seismicity, and rockburst occurrence is not a simple linear relationship. It is observed mainly in underground hard coal mines, where the number of factors affecting the rockburst hazard is high. Moreover, rockburst itself is also a nonlinear dynamic process. The effects of rockburst in underground excavations suggest a simple dependence on prevailing conditions. Furthermore, data collected in underground mines are usually incomplete, approximate and/or disturbed. This is mainly a result of limitations of the geometry of the bed and the level of progress at the mine site. Rockburst prediction is a complex and nonlinear procedure influenced by model and parameter uncertainty [16]. To summarize, nonlinearity relates to the factors responsible for rockburst occurrence and the scale of the damages, which are the same factors used to predict the phenomenon.
Due to the fact that machine learning algorithms cope well with complicated and nonlinear relationships [17,18,19], some attempts to apply them for rockburst hazard assessment have been made. Investigations have generally focused on assessing the potential threat of rockburst, which falls into the category of long-term rockburst prediction. Most research into this topic concerns rockburst phenomena in non-coal underground mines [20,21,22,23] and drilled tunnels [24,25]. The algorithms were focused on stress rockbursts. Therefore, the indicators correlated with the stress level in the rock mass, the strength of rocks, and their strain energy accumulation capability. Some calculations have been made for underground hard coal mines only [26,27], or in combination with other mines or tunnels [28].
Among the machine learning algorithms, mainly artificial neural networks were applied. However, some attempts to use other algorithms, e.g., decision tree, random forest, gradient boosting, and naïve Bayes, have also been made [22,23,29].
Both fuzzy mathematics and a neural network were applied to create a fuzzy neural network risk prediction model for rockburst in hard coal mines [26]. This model was trained using an improved backpropagation algorithm (B.P.). The applied method improved the comprehensive index judgment and multi-index judgment with fuzzy mathematics [26]. A four-layer neural network, with the sigmoid function as the excitation function, was used. The following factors affecting rockburst hazard were considered: depth, coal seam thickness and its change, dip angle of the coal seam, coal strength, roof strength, complex degree of geological structure, roof management situation, pressure relief situation, and coal noise. The input layer contained 40 nodes corresponding to the subordination degree of four rockburst risk grades of the factors mentioned above, whereas the output layer contained four nodes corresponding to the four rockburst risk grades, i.e., without, weak, moderate, and strong. The backpropagation neural network was trained on 16 examples corresponding to excavations threatened by rockbursts in different degrees. The built model was tested on ten excavations.
A backpropagation neural network was used for rockburst prediction in an underground hard coal mine [27]. This neural network was trained based on 17 examples and tested using six examples. The following geological, mining, and technical/technological factors were considered: depth, the lithological character of the roof, the complexity of the structure, coal seam thickness and dip angle, mining method, pillar, and mining technology. Excavations were classified into one of three degrees of rockburst risk: weak, medium, or strong.
Recently, machine learning algorithms are being used to analyze seismic hazards in underground hard coal mines. For example, a study conducted by Cichy et al. [30] has shown that neural networks can be used to estimate changes in the size of induced seismicity associated with deposit operations.
The examples presented showed a growing interest in applying machine learning algorithms to rockburst prediction. The complicated nature of rockbursts in hard coal mines and the multitude of factors influencing their occurrence were taken into account in this article. For the first time, it was proposed to jointly use geological, mining, and technical/technological factors influencing or minimizing the occurrence of rockbursts in an underground coal mine and parameters related to tremors and their distribution to training models of machine learning algorithms. The developed models were used to classify cases in the test dataset when, as a result of the tremor, a rockburst occurred at a given point of the opening or not.

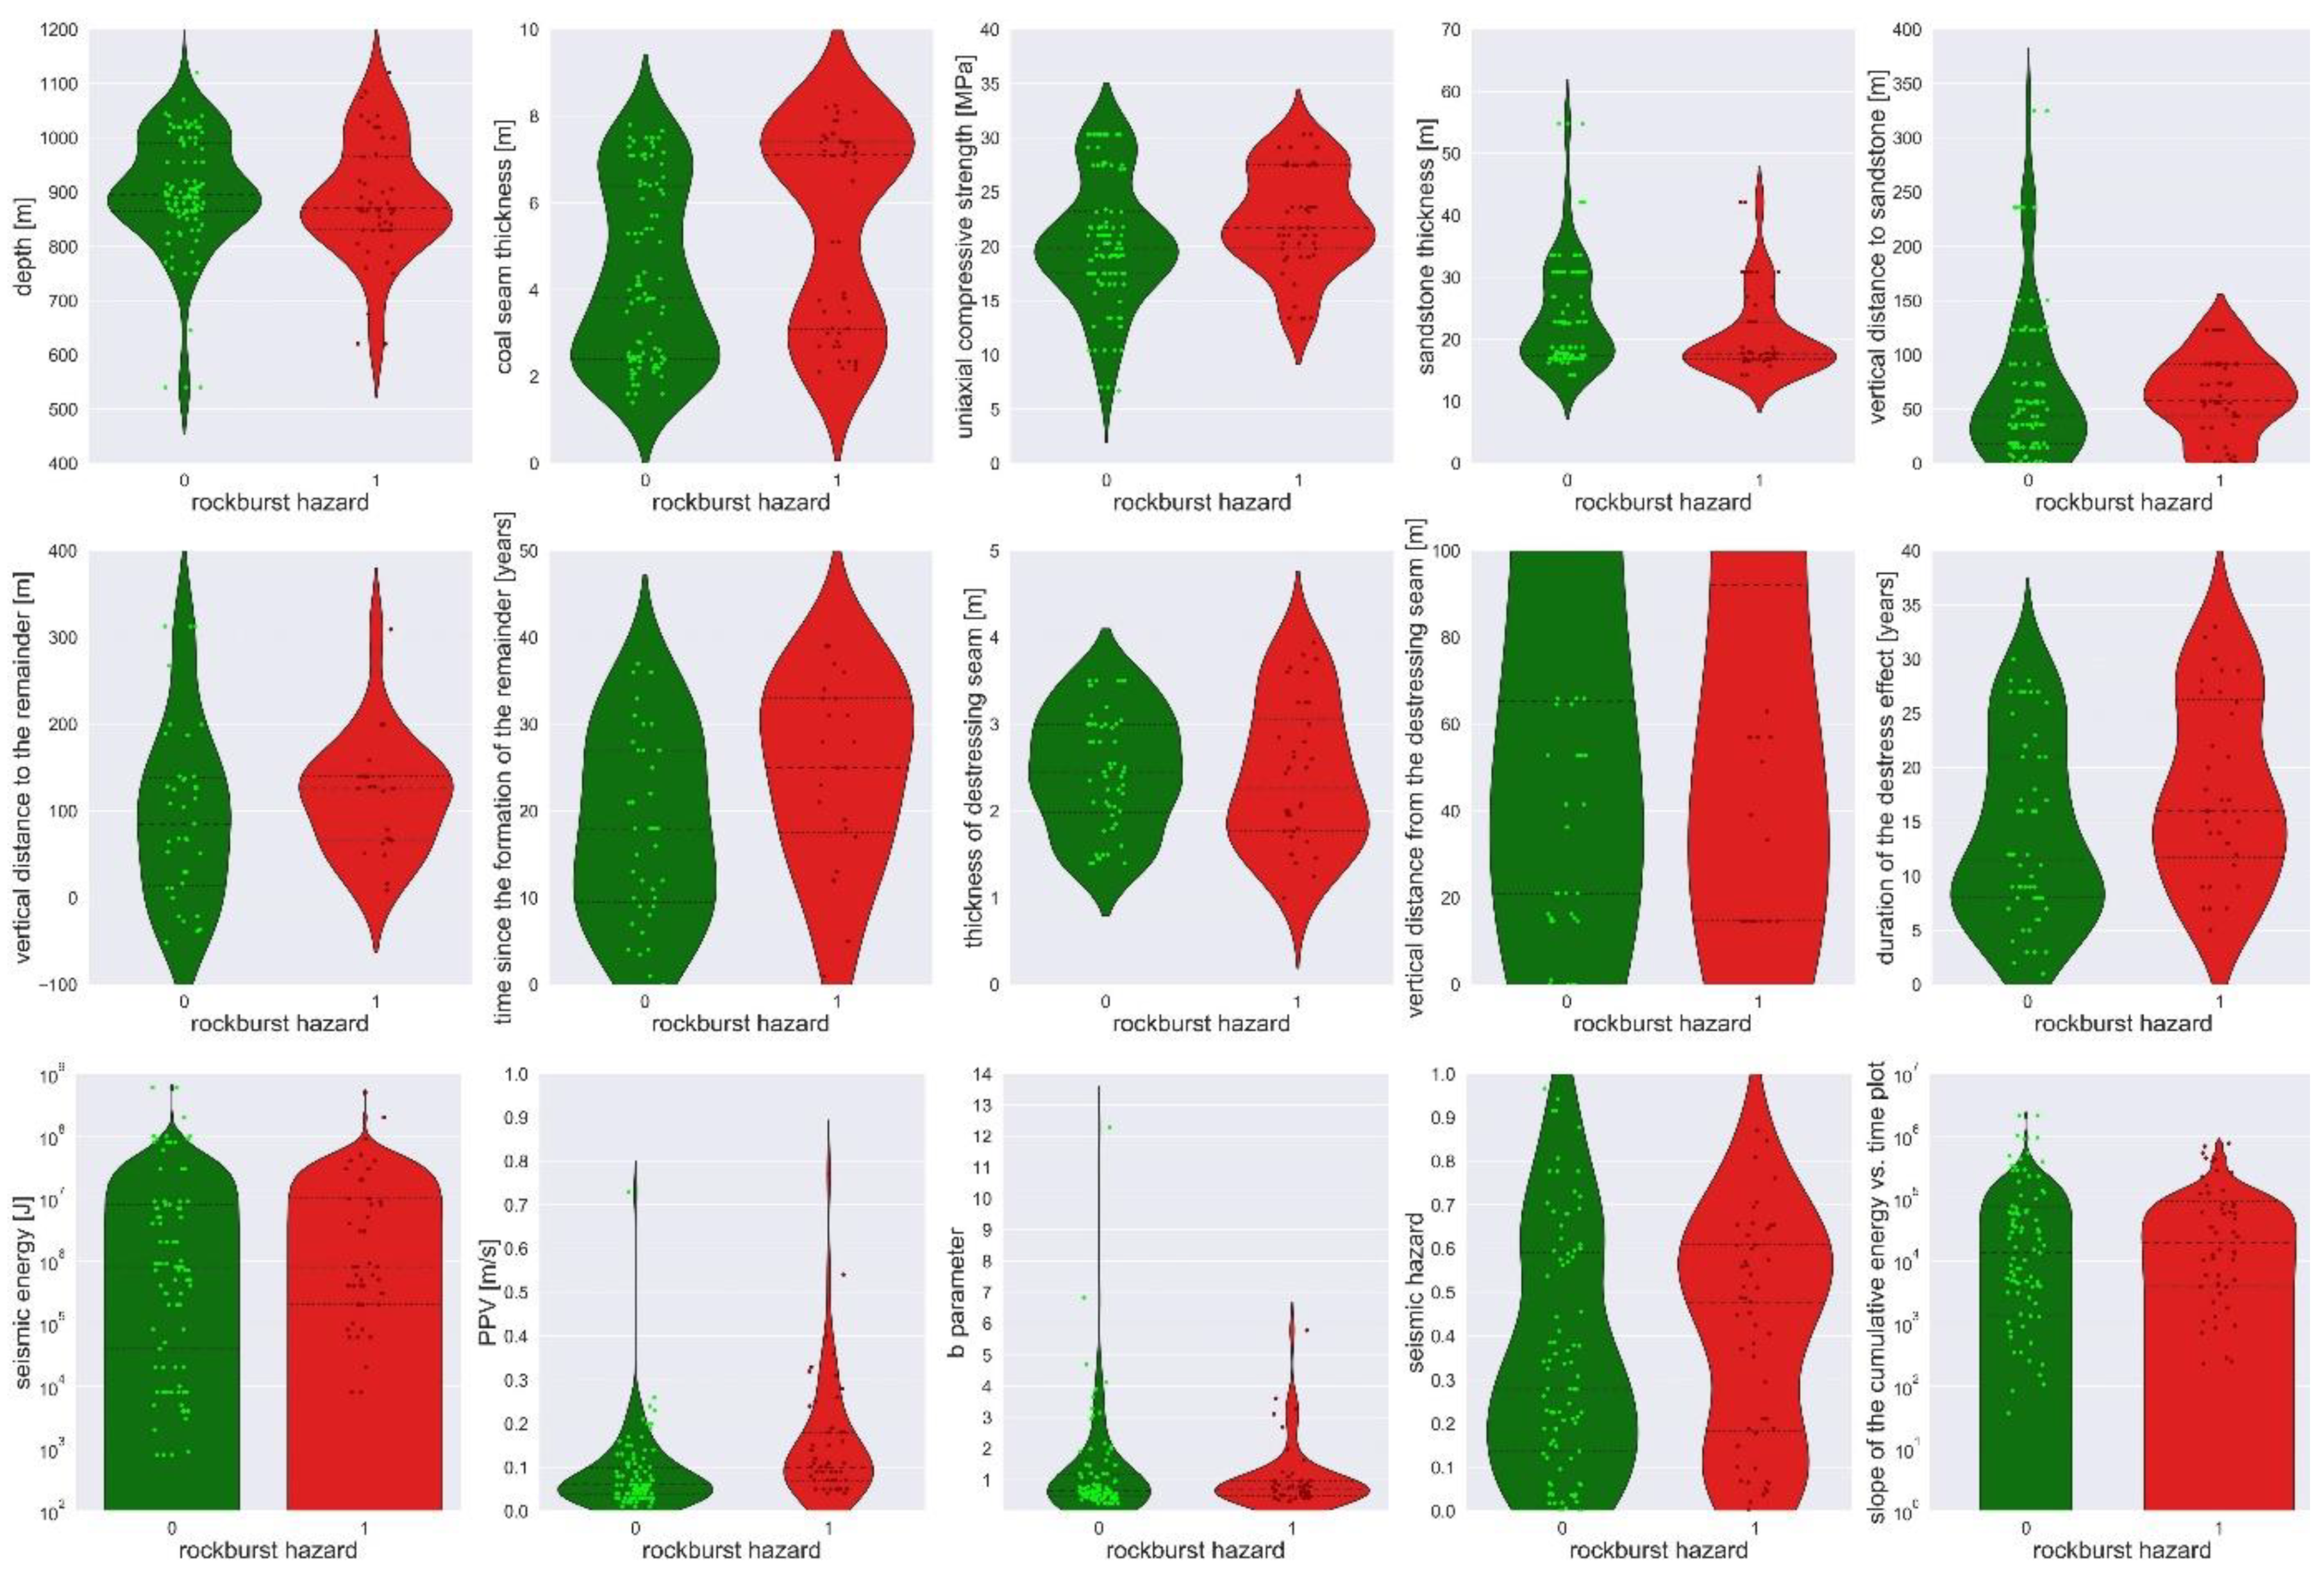
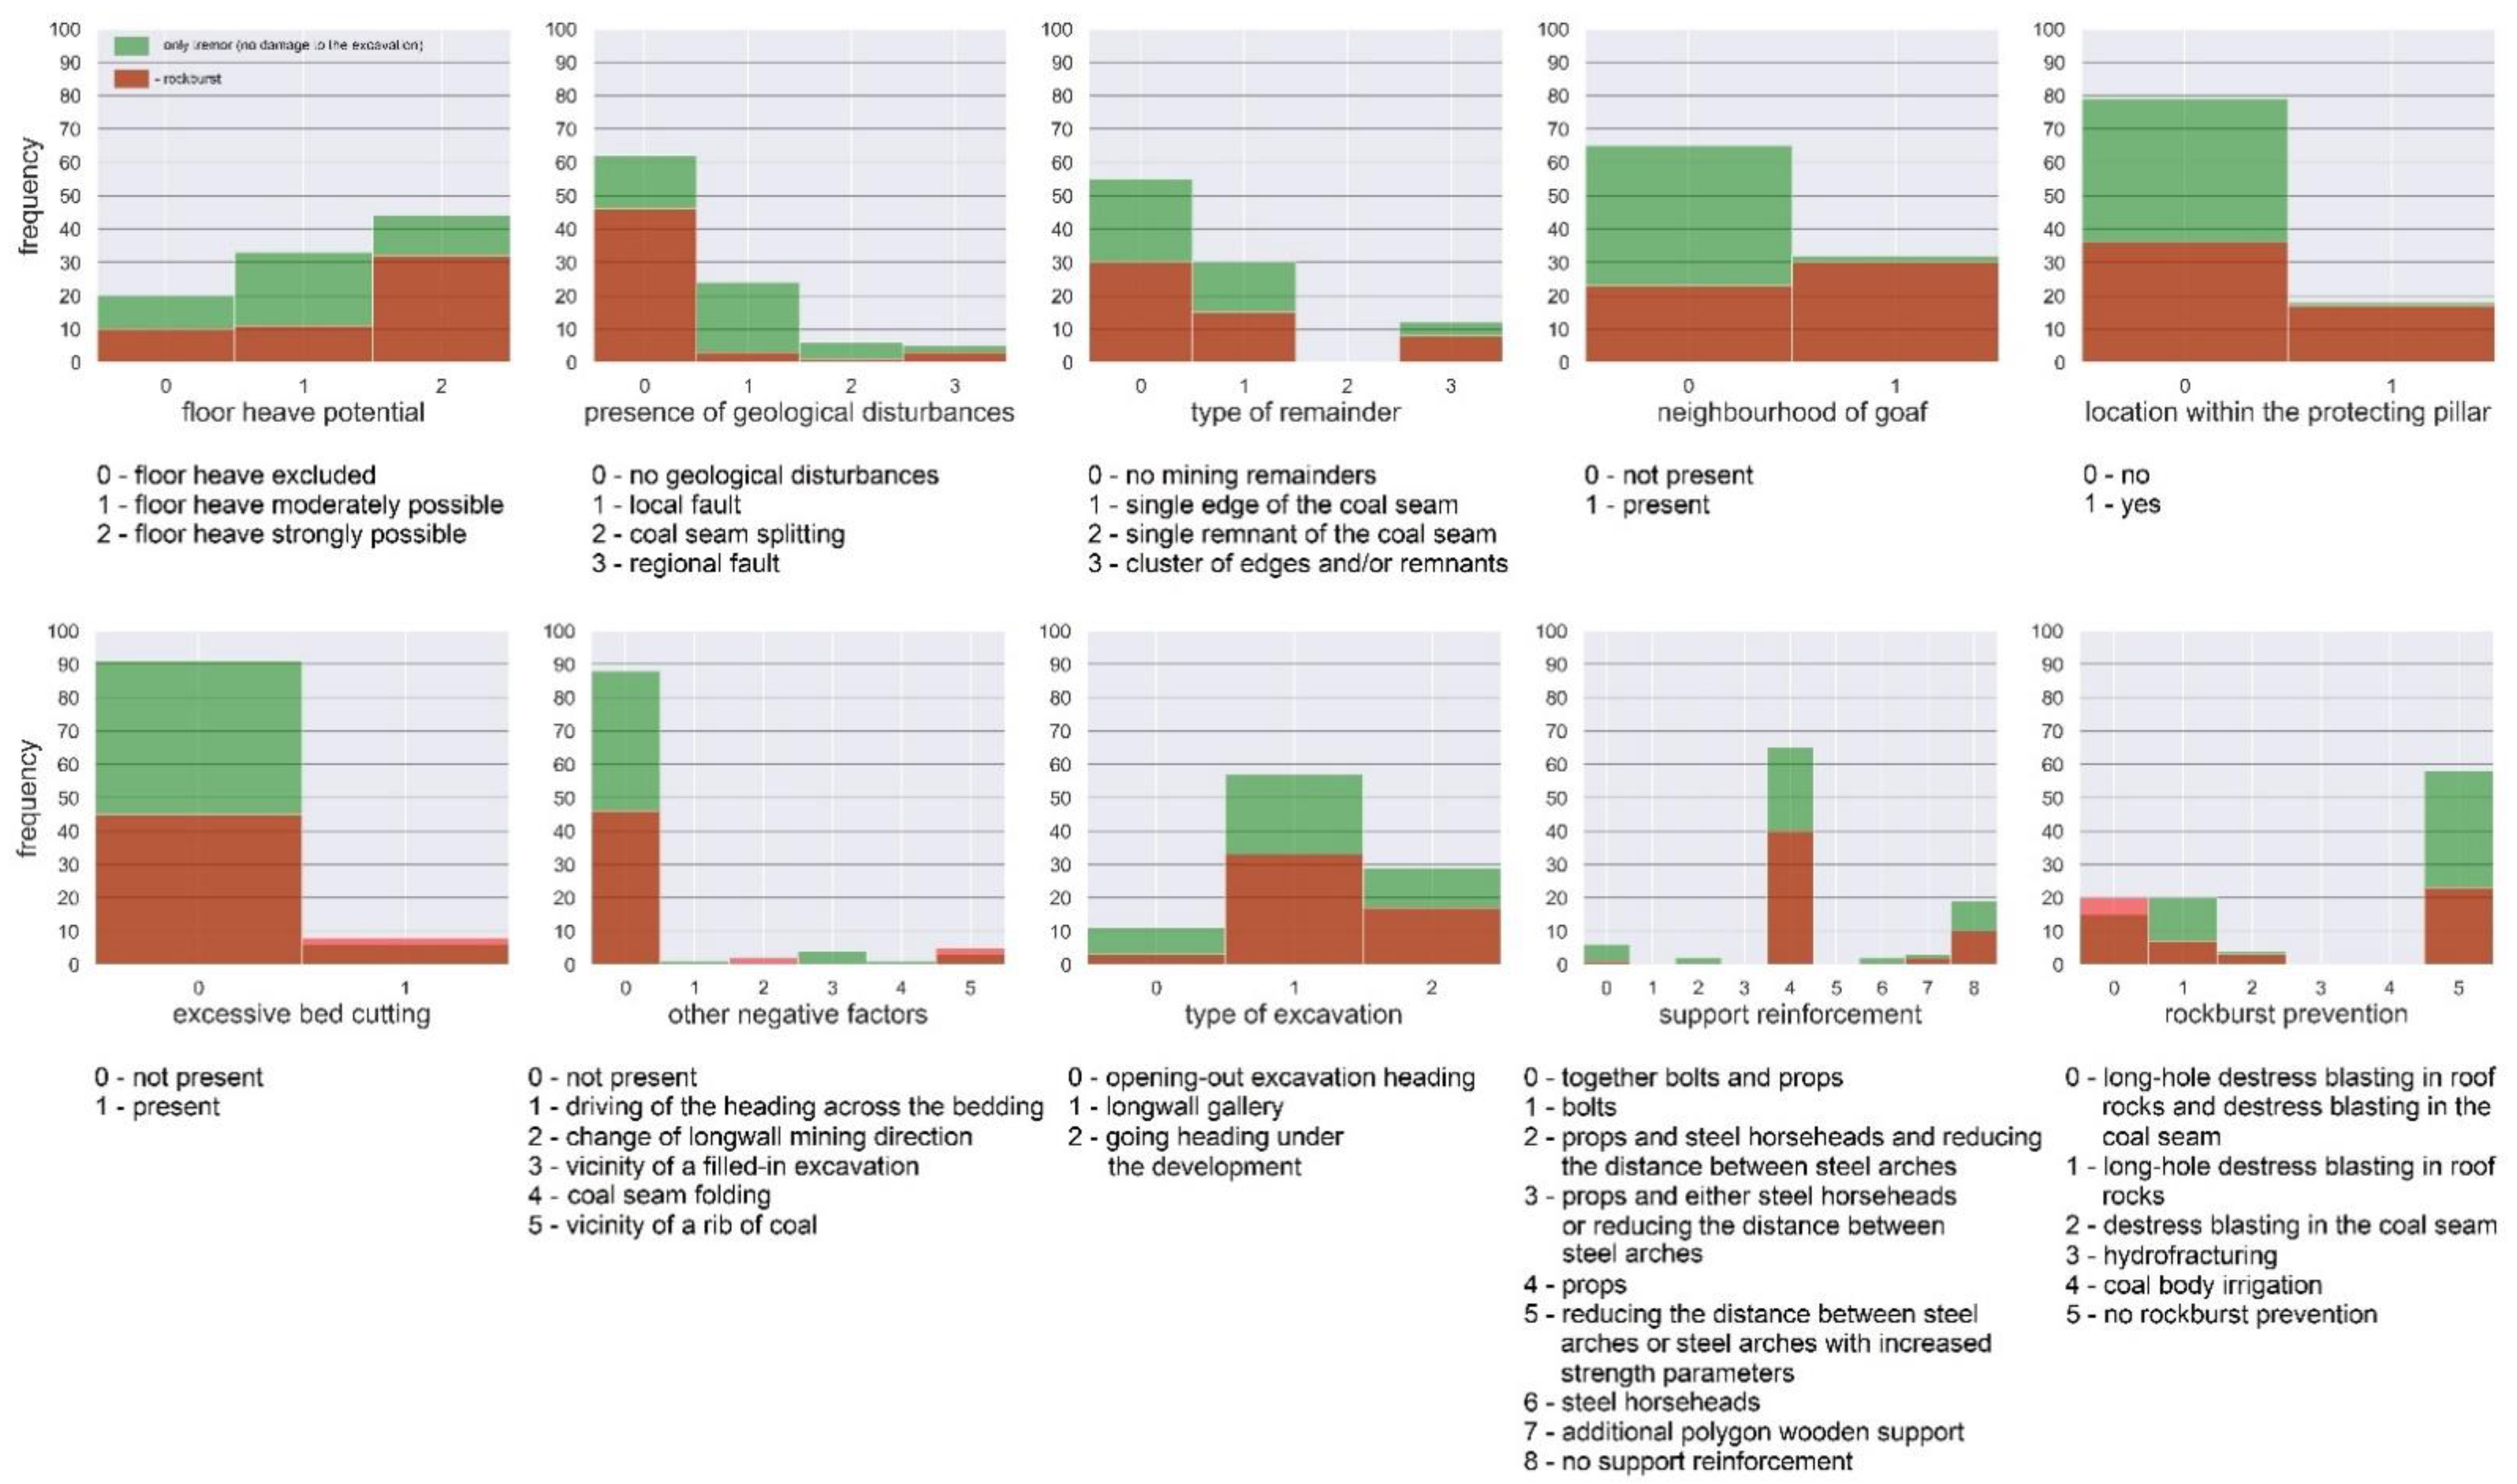
2.2. Characteristics of The Input Dataset

The data for analysis came only from a mine in the Upper Silesian Coal Basin and were collected during the last 25 years of the mine’s operation. It collected data similar to the current conditions and technology and relevant to rockburst prevention and seismic monitoring. These data concerned points in underground mining excavations excavated in 13 different coal seams or their layers, i.e., 401 and 405/2 (top and lower layers), 407/3, 408, 418, 502, and 504 (top and lower layers), and 506, 507, and 510 (top and lower layers). A total of 150 points were selected in the headings of the selected mine. In 53 cases, rockbursts resulted from a seismic event, i.e., damage to the excavation after the tremor. In other cases, despite the occurrence of a mining tremor, the excavation was not damaged. In this article, any destruction of the excavation due to the mining tremor, including even small-scale destruction, was classified as a rockburst, e.g., local floor heave, damages of support, dislocation of props, and coal ejection to the excavation. The database also included cases where a significant part of the excavation or the entire excavation was destroyed, so it lost its functionality. Even minor damage to underground workings can pose threats to miners underground. We also classified minor damage to workings as rockbursts, which the law would not classify as such. Each of the 150 records has been labeled: “1” if the rockburst occurred (53 cases) and “0” when the rockburst did not occur despite a tremor (97 cases). The occurrence of rockbursts is not a frequent phenomenon concerning the occurrence of mining tremors that do not cause damage to the excavation. Therefore, the database used in the article is not balanced. However, it seemed important that machine learning algorithms learn to recognize when a mining tremor of a given energy and distance from the excavation causes a rockburst and when it does not. Therefore, cases where the excavation was not damaged also had to be included in the database. Many different factors influence the possibility of a rockburst. Both positive and negative factors that influence the rockburst hazard in galleries were directly considered. Each of the 150 points was characterized by the indicators mentioned above.
Twenty-two indicators concerned the assessment of the potential rockburst hazard (i.e., in a long-term period). They were divided into four groups: geological (seven indicators), mining (ten indicators), technical/technological (three indicators), and seismic (two indicators).
The first group includes depth, coal seam thickness, domination of the coal seam or shales in the floor of the excavation (possibility of floor heave), uniaxial compressive strength of the coal seam, thickness of the competent rock layer and its distance from the excavation, and presence of disturbances (e.g., fault, coal seam splitting, etc.). As the depth increases, the level of primary stresses in the rock mass also increases. Rockbursts occur much more often in galleries excavated in thick seams than in thin ones. The presence of coal or shale at the bottom of the excavation can lead to floor heave. Coal can break down mildly under pressure, or it can accumulate elastic energy and release it rapidly. The ability of hard coal to accumulate elastic energy can be represented, e.g., by uniaxial compressive strength. In turn, cracks in thick layers of competent rocks can be a source of high-energy tremors. The proximity of such rocks to the excavation is associated with high-energy tremors near the excavation and an increased likelihood of a rockburst. In the vicinity of geological disturbances, residual stresses may occur.
The second group covered mining conditions, i.e., the presence of mining remnants (e.g., the coal seam edge, remnant, cluster of edges, and/or remnants), the vertical distance between the excavation and remainder, the time from the formation of the remnant, the neighborhood of goaf in the same coal seam, location within the protecting pillar, excessive bed cutting, and other negative factors (e.g., change in longwall mining direction, drilling across the bedding). Furthermore, when the destress mining was carried out, factors such as the thickness of the destressing seam, the vertical distance from the destressing seam, and the duration of the destressing effect were also considered.
Mining remnants are responsible for the stress increase in the rock mass. Even with the greater vertical distance of the remainders, the occurrence of high-energy tremors in the area cannot be ruled out [31]. The impact of remnants should decrease with time; however, even remnants from several decades earlier can affect the stress level in the rock mass [2]. Earlier destress mining of the adjacent seam is an effective form of rockburst prevention. Generally, the greater the thickness of the destressing seam, the shorter the vertical distance to the destressing seam, and the shorter the time from the destress mining, the better the destress effect. With the neighborhood of goaf in the same coal seam, the deflection of the roof rocks may be related, resulting in additional stress. The stress level in the created protective pillar, especially near its boundaries, is usually very high. Excessive bed cutting weakens a body of coal, which may result in a bump.
Technical/technological conditions include the following: type of excavation (support reinforcement (e.g., props, bolts), and rockburst prevention (e.g., long-hole destress blasting in the roof rocks, destress blasting in coal seam).
The group of potential seismic indicators includes seismic energy and PPV. Rockburst in mines in USCB occurred when PPV reached values within the range of 50 mm/s and 1000 mm/s [32]. The seismic energy and PPV can be estimated while designing the excavation based on the analysis of geological conditions and the theoretical state of stress in the rock mass. Our database includes the recorded energies of mining tremors and the theoretical PPV values calculated from them. In hard coal mines in the Upper Silesian Coal Basin, PPV measurements in underground mine workings are more common, but they have not been used so far in the selected mine. The seismic energy of tremors E was calculated by a mine geophysics station using a numerical integrating method [33]. The energy of strong tremors, i.e., equal to or higher than 1 × 10⁵ J, was verified with the calculations of the Upper Silesian Regional Seismological Network, which belong to the Central Mining Institute in Katowice, Poland [34]. The seismic energy E can be easily transformed to the local magnitude ML according to the formula [35]:
log   E = 1.8 + 1.9 M L
A value of PPV, which is widely applied as an indicator for assessing the influence of the vibrations on the underground infrastructure, was calculated according to the formula [32]:
log ( PPV · R ) = 0.66 log ( M o ) 7.4
where PPV is in [m/s], the hypocentral distance R is in [m], and the scalar seismic moment Mo is in [Nm].
Three indicators have been applied to estimate the actual state of rockburst hazard: the b parameter of the G-R distribution, the seismic hazard SHAZ, and the slope of the line fitted to the cumulative energy versus the time plot. These indicators take into account the temporal relationship between mining events. Based on these indicators, it is possible to draw conclusions about the rockburst hazard. They can therefore be considered as predictors. All three indicators used to assess the actual state of a rockburst hazard were calculated in a moving two-week time window. The use of a narrow time interval made it possible to determine the values of the indicators of the changing conditions. However, there were cases in which it was impossible to calculate the values. As a result, empty cells were left in the database.
High anomalies or low values of the b-value of G-R distribution or its downward trend were observed in another hard coal mine in the Upper Silesian Coal Basin before high seismic activity and the strongest seismic events [36]. This parameter was calculated according to the formula [37]:
b = n [ i = 1 n ln ( E i / E 0 ) ] 1
where n represents the consecutive events in a determined time interval, Ei is the seismic energy of the mining tremor in a determined time interval, and E0 is the particular minimum energy corresponding to the energy with the largest frequency of seismic events in the low-energy range. However, especially in the case of excavations already drilled, the size of the tremor base was small. As a result, calculating the b parameter for sporadic cases turned out to be impossible.
Based on the b-value of the G-R distribution mentioned above, the seismic hazard SHAZ was calculated. This hazard is defined as a probability that the energy of at least one tremor will be higher than the assumed critical energy during the forecast horizon [38]. Therefore, it can be calculated according to the following formula:
S H A Z = 1 exp [ λ · Δ t · ( E 1 ) b ]
where λ is the intensity of the tremors, i.e., the number of tremors in a determined time interval divided by the width of the time interval (in days); Δt is the forecast horizon, taken as one day; E*1 = E1/E0, E1 is the critical energy, i.e., the seismic energy of the tremor from which the excavation is considered to be in danger of rockburst, taken as 1 × 10⁴ J. Other parameters—E0 and b—are defined as before.
In turn, the large angle of inclination of the straight line fitted to the cumulative energy versus the time graph is correlated with an energy release from the rock mass, therefore, an increased rockburst hazard level. This parameter is not commonly used in mines for the current assessment of the rockburst hazard; however, the results presented in this article indicate its usefulness.
In order to visualize the data distribution with numerical values and its probability density, violin plots have been used separately for cases where rockburst occurred (1) or not (0). Value distributions of 15 indicators and their probability density are listed in Appendix A. Histograms were prepared for ten indicators with non-numeric categories, which were only assigned numerical values, e.g., for support reinforcement, rockburst prevention, and location within the protecting pillar. These histograms are shown in Appendix B. They were also prepared separately for rockbursts and for cases where, despite the tremor, no damage occurred in the excavation.
In the vast majority of cases, the indicators included in the database were not correlated with each other. In isolated cases, Pearson’s correlation coefficient oscillated around a value of 0.5. The possibility of floor heave and the thickness of the coal seam correlated most strongly with each other. In this case, Pearson’s correlation coefficient equaled 0.59. The correlation matrix with Pearson’s correlation coefficients is presented in Appendix C. Before running the simulations, it was important to determine the correlation between the rockburst hazard and individual indicators. The highest value of Pearson’s correlation coefficient, 0.31, was found for PPV. Both the coal seam thickness and the time since the formation of the remainder had the second-highest value. In both cases, Pearson’s correlation coefficient was 0.27. Some of the other selected indicators had the following Pearson’s coefficient values: duration of the destress effect (0.24), the neighborhood of goaf (0.23), uniaxial compressive strength (0.18), location within the protecting pillar (0.15), and excessive bed cutting (0.15). The values of Pearson’s correlation coefficients indicate no clear correlation between the indicators considered and the occurrence of rockbursts. Surprisingly, no correlation was found between seismic energy and the occurrence of a rockburst (−0.039). There was also no correlation between the occurrence of a rockburst and the depth (−0.055) or the vertical distance of thick layers of sandstone from the coal seam (−0.058). The occurrence of rockbursts was negatively correlated with the thickness of tremor-generating sandstones. Pearson’s correlation coefficient, in this case, equaled −0.21.
Standard rockburst risk assessment is performed in hard coal mines in the USCB for going headings under the development and longwalls by the complete method. The assessment is made for the entire excavation and not for a specific point or fragment of the excavation. Old workings are not subject to rockburst hazard assessment by the complex method. For the selected workings, the assessment is performed once a day. Most of the workings with points included in the analyzed database were classified as not endangered or with little risk of rockbursts. In individual cases, these workings were classified as moderately endangered with rockbursts. The presented database was used to train machine learning models. In this article, different machine learning algorithms were used to assess the state of rockburst hazards.

2.3. Machine Learning Algorithms Used to Create Models
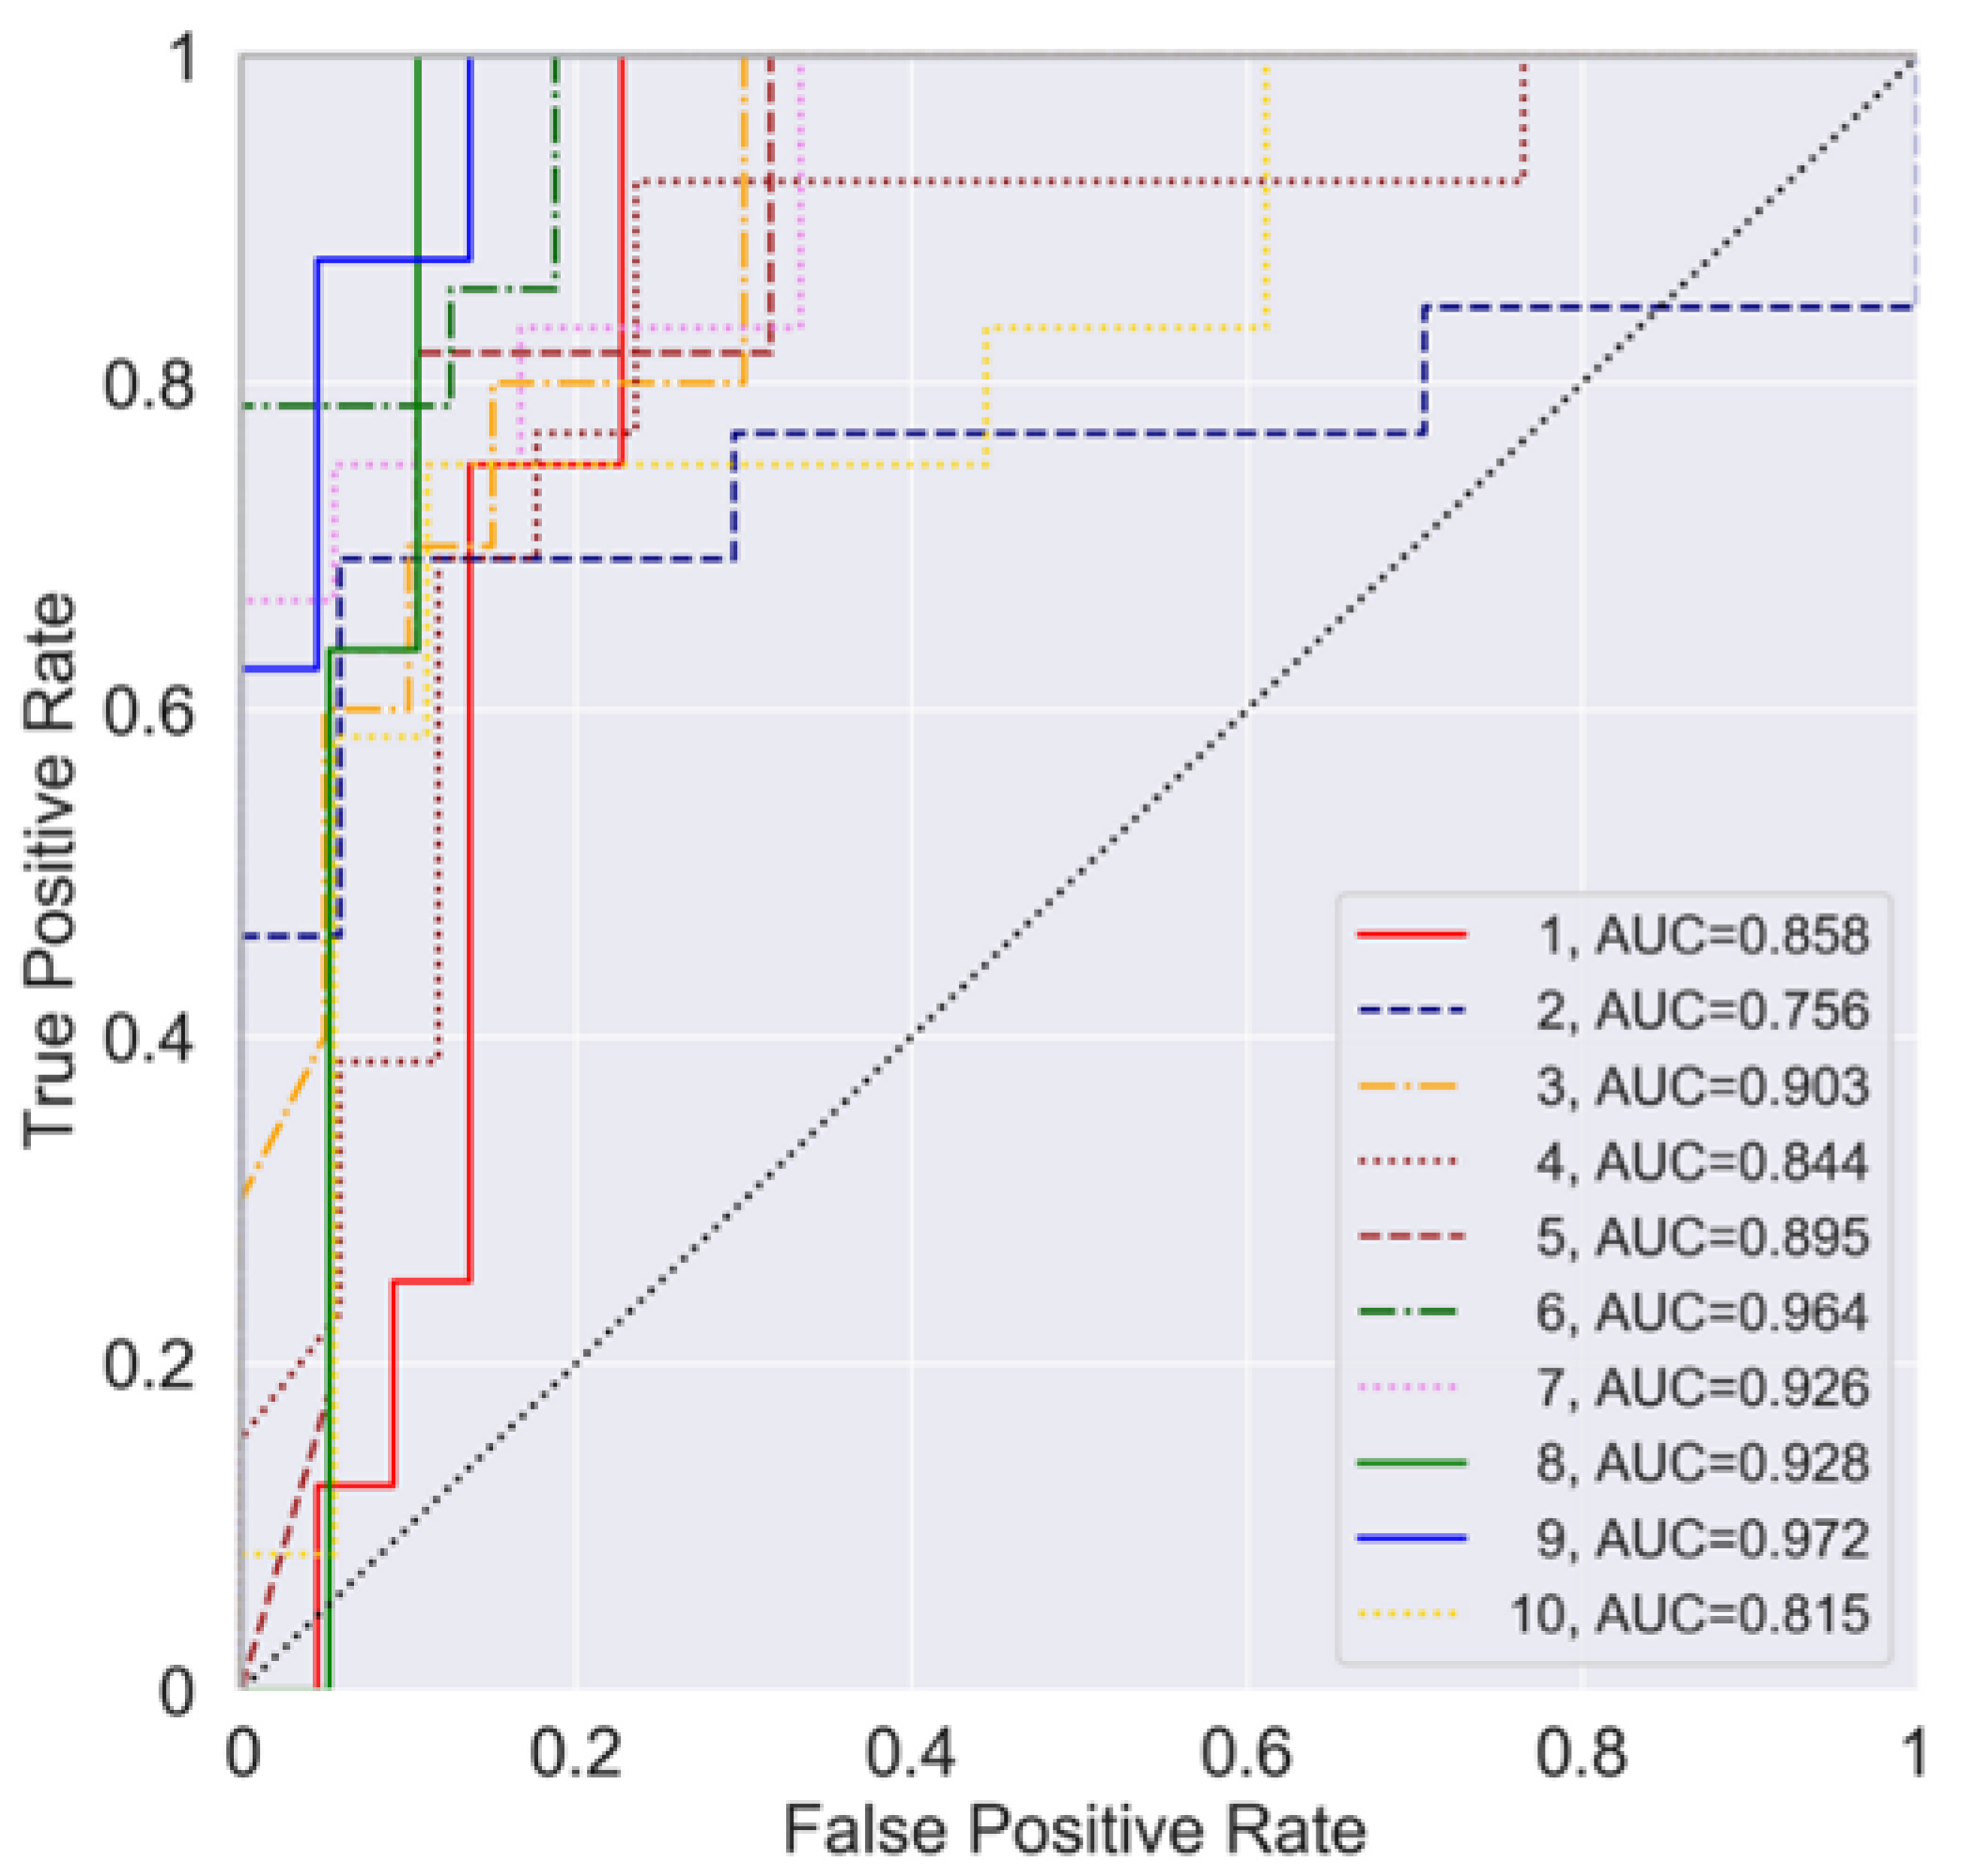
The calculations were made in JupyterLab [39,40]. The Scikit-learn library, i.e., the machine learning library in Python [41], was widely used. The dataset described above was pre-processed with the use of the pre-processing package. First, the raw feature vectors were changed into representations more suitable for machine learning algorithms. Then, the mean removal was applied. In this particular standardization method, the average value of each characteristic is removed, and then the scaling operation to divide by standard deviation takes place. With this method, each feature is centered at zero.
The train–test split method randomly splits 150 input data into a training dataset (120 records) and a test dataset (30 records). The machine learning algorithms available in Scikit-learn were selected to train the models used to assess the state of rockburst hazards. The machine learning models were trained using the indicators presented in the previous chapter. In each case, the training dataset underwent four-fold cross-validation (four datasets with 30 records each).
Sixteen machine learning algorithms have been applied for this purpose: logistic regression (L.R.), decision tree (D.T.), random forest (R.F.), support vector classifier (SVC), linear support vector classifier (LSVC), Gaussian naïve Bayes (GNB), Bernoulli naïve Bayes (BNB), Gaussian process classifier (GPC), k-nearest neighbours (kNN), gradient boosting (G.B.), adaptive boosting (AdaBoost), XGBoost (XGB), light gradient boosting machine (LGBM), linear discriminant analysis (LDA), quadratic discriminant analysis (QDA), and multi-layer perceptron classifier (MLPC). At the output, we consistently obtained two states, i.e., 0 (a tremor that did not cause any damage in the excavation) and 1 (a rockburst, in the sense of any damage to the excavation due to the occurrence of the tremor). The optimal hyper-parameters of each machine learning algorithm were determined using a grid search approach. The GridSearchCVclass was used for this purpose.
The logistic regression classifier uses the regression function for predicting the class given the features vector [42]. The logistic function calculates the probability threshold used in order to obtain the classification result (the threshold value of 0.5 is typically used). The logistic regression classifier forms a linear boundary between classes. The other algorithms used, which are based on probability determination, are LDA and QDA. Both algorithms use a Gaussian density function to approximate the distribution of the classes. However, LDA uses the linear border separation between classes, whereas QDA takes advantage of second-order curves. Both classifiers use the posterior distribution to determine the test point class. SVC and LSVC are examples of support vector machines (SVM) [43,44]. The algorithm attempts to find the hyperplane separating the points optimally in the features space. The hyperplane is constructed so that distances from the closest points to the separating hyperplane are maximized. The LSVC constructs just the hyperplane in the features space, whereas the SVC uses radial base functions (RBF) to transform points from the features space to the space of greater dimensionality. Such a transformation helps in separation because points that are not linearly separable in the features space become separable after transformation.
The GNB and BNB are classifiers that use the Bayes theorem for class discrimination [45]. They assume that features are pairwise independent, which is hardly observed in real problems. Nevertheless, they have proved to be robust in many classification tasks. The difference between the classifiers mentioned above is that the model assumed for determination and the a priori probabilities for each feature (Gaussian and Bernoulli distributions) are used, respectively. The kNN algorithm remembers the points shown during the training phase, which is why it is sometimes called “a lazy algorithm.” The algorithm calculates the distances to the k nearest neighbors of a given point in order to predict the class. Then, the majority of the neighbors decide the classification result [46]. The D.T. represents the classification problem as a tree structure. At each node, a condition concerning the selected feature value is checked. Once the decision process reaches the leaves, the decision is made. The D.T.s are robust and cope well with discrete features [47,48]. When training the models presented in this article, the values of the predicted class were used to automatically adjust weights inversely proportional to class frequencies in the input data. The Gini impurity was taken to measure the quality of a split. The maximum depth of the tree was not declared. The maximum number of leaf nodes and depth of the decision tree was not predetermined. The minimum number of samples required to split an internal node usually equaled 2. The R.F. classifier is an example of ensemble learning methods [48,49]. The idea behind the ensemble methods follows the “wisdom of the crowd” principle. It can be expected that the decision made collectively by a large population is comparable to or better than the decision made by a single expert. In the case of random forest, a large set of simple decision trees is used. Every tree is trained to elaborate on its decision. The final decision of the classifier is obtained by using the class predicted by the majority of the trees. The idea of using a set of weak classifiers is used in the AdaBoost algorithm [50,51]. The weak classifier is a classifier that is only slightly better than random guessing. The G.B. algorithm is a set of weak classifiers. It gradually develops an ensemble of weak classifiers to obtain better classification results [52,53]. XGBoost is one of the newest and most powerful G.B. algorithms [54]. It uses a regularization term, which helps to control the development of tree classifier structures. The regularization penalizes the structure of overly complicated internal tree classifiers. Therefore, XGBoost is one of the most resistant algorithms for overfitting problems. A multilevel perceptron (MLP) is an example of neural network-based classifiers. It comprises at least three layers: input, output, and one or more hidden [55]. Each neuron calculates the weighted sum of its inputs. Then, the output value is determined using the so-called activation function. The activation function is usually nonlinear. The network architecture (the number of hidden layers and the number of neurons in each layer) is chosen depending on the problem’s nature and the available data. The rectified linear unit function was used as an activate function for the hidden layer during the calculations. In all cases, there was one hidden layer with 100 neurons. The solver for weight optimization was stochastic gradient descent. The learning rate was assumed as constant or adaptive.
The results of testing the effectiveness of the models of all of the discussed machine learning algorithms are presented below. In addition, the algorithms whose models were characterized by the highest following the adopted criteria were used to train subsequent models for a randomly selected configuration of the training dataset. The effectiveness of these models has also been tested, and the results of these tests are also presented below.

3. Results

Due to applying the binary classification of phenomena (1—rockburst and 0—tremor without damage to the excavation), it was possible to analyze a dataset using a confusion matrix. This is the primary tool used to evaluate the effectiveness of classification models. Data labelled as described above are classified and assigned a predicted positive class or a predicted negative class. True positives (Tp) denote the cases where the model correctly predicted the rockburst in the excavation. True negatives (Tn) denote cases where the model correctly predicted that a rockburst would not occur despite the mining tremor. False positives (Fp) indicate the cases where overestimation took place, i.e., the model showed a rockburst even though it did not occur. False negatives (Fn) denote cases where the model underestimated, i.e., cases where rockburst was classified as if nothing had happened. Based on the frequency of the actual positive state in the population and the mutual relationships between correct and incorrect classifications, several measures of the diagnostic value of the test can be distinguished, e.g., accuracy, precision, recall, and the F1-score.
Accuracy is a commonly used measure of the model’s effectiveness. It can be defined as the ratio of the correct positive and negative classifications to the total size of a dataset. However, it should be noted that the number of rockbursts is significantly lower compared to the number of tremors, including even those with the potential to cause a rockburst. Therefore, accuracy alone may not be a good measure when the dataset is not balanced. For this reason, the parameter recall (sensitivity) was used to measure the effectiveness of machine learning models to assess the state of rockburst hazards. This parameter specifies the ratio of correctly classified positives (true positives) to all positives in the tested dataset. In addition, other parameters, such as precision and the F1-score, were also calculated. Precision is the ratio of correct positive predictions to the total predicted positives (true positives and false positives). The F1-score is the harmonic mean of precision and recall. This measure assesses the balance between precision and recall and allows for a comparison of models that differ in the values of these parameters.
As mentioned previously, the data for model testing included 30 cases. A first test set was selected at random, in which 8 cases were rockbursts (labeled as positives), and 22 cases were tremors, after which, the damage of the workings did not occur (labeled as negatives). Table 1 shows the results of model testing. In total, sixteen models of machine learning algorithms have been tested.
As mentioned above, the number of rockbursts in mining excavations is relatively low compared to the number of tremors that do not damage the excavations. Therefore, it is important to have the largest possible number of correctly predicted rockbursts and the smallest possible number of false negatives to best control the rockburst hazard. Thus, the recall parameter value was considered as the most important. Therefore, the recall parameter was adopted as a measure of the effectiveness of the classification of the trained models. The effectiveness of the models of sixteen machine learning algorithms was compared based on this parameter. An important issue is the occurrence of false alarms, i.e., false positives. Over the long run, too many such alarms may result in a lack of response, and the method becomes useless. Therefore, the percentage of Fp concerning the total number of negatives in the test dataset was analyzed too. Therefore, this parameter was considered as the second place for the model effectiveness classification.
The highest recall values were obtained for the models of the following machine learning algorithms: MLPC, D.T., R.F., G.B., and AdaBoost. For the first of the machine learning algorithm models mentioned above, the value of the recall parameter was 1, and, for the remaining ones, 0.88 (Table 1). The rest of the machine learning algorithm models in Table 1 had smaller recall values. For the models that obtained the highest recall values, the percentage of false positives was determined to the total number of tremors that did not cause damage to the excavation in the test dataset (negatives). The following results were obtained: G.B.—4.5%, D.T. and R.F.—13.6%, MLPC—22.7%, and AdaBoost—27.3%.
Based on the diagnostic parameters described above, four machine learning algorithms were selected, i.e., MLPC, D.T., R.F., and G.B., for which, subsequent models were trained for different configurations of datasets. The purpose of using various randomly selected datasets was to confirm the effectiveness of the applied machine learning algorithms and the stability of the solutions. Each time, the training dataset contained 120 records and the test dataset contained 30 records. In addition to the dataset used for the models in Table 1, nine other datasets were used, with randomly selected records corresponding to rockbursts (positive, P) and tremors without excavation damage (negatives, N). The previously mentioned ten training and test datasets differed in the configuration of the records. The model testing results are presented below. Table 2 shows the test results for the MLPC models, Table 3 for the D.T. models, Table 4 for the R.F. models, and Table 5 for the G.B. models. The tables below also include the testing of the models of selected machine learning algorithms presented in Table 1. These results relate to the dataset marked with number 1.
Additionally, the effectiveness of the MLPC models was assessed based on the ROC curves (Figure 1). The MLPC models were the most effective according to the average value of the recall parameter. ROC curves are a graphical representation of the relationship between the true positive rate (recall) and false positive rate. The area under the ROC curve (area under curve, AUC), ranging from 0 to 1, determines the test’s ability to distinguish between normal and abnormal results. The greater the AUC (i.e., the more concave the ROC function will be), the greater the diagnostic power of the test. For MLPC models, the AUC value ranged from 0.756 to 0.972 (mean 0.886). An AUC value between 0.7 and 0.8 is acceptable, between 0.8 and 0.9 is excellent, and above 0.9 is outstanding [56]. According to these AUC criteria, half of the models were outstanding (3, 6, 7, 8, 9), four were excellent (1, 4, 5, 10), and one was acceptable (2).

4. Discussion

Models of sixteen machine learning algorithms were trained and then tested for rockburst classification in a dataset from a selected hard coal mine in the USCB. Most of the algorithms have not previously been used for this purpose in coal mines. Moreover, the article presents, for the first time, the possibility of jointly applying geological, mining, and technical/technological parameters and parameters related to tremors and their distributions in order to train models of machine learning algorithms.
Based primarily on the recall parameter and secondarily on the percentage of false positives (false alarms) versus the total number of tremors without damage to openings (negatives), the following machine learning algorithm models were the most effective: MLPC, D.T., R.F., and G.B. These models have learned best in identifying cases where, under the given geological, mining, and technical conditions and the results of current seismic monitoring, a tremor with a specific energy and related PPV at a selected point will lead to a rockburst. The best four algorithms from the first dataset were used to train subsequent models on the nine randomly selected datasets. Models were trained and tested for different sets of data to confirm their effectiveness. The effectiveness of the algorithms used and the stability of the solutions was confirmed.
The recall parameter values for all ten MLPC models ranged from 0.69 to 1 (mean 0.84), for all ten D.T. models—from 0.75 to 0.91 (mean 0.83), for all ten R.F. models—from 0.71 to 0.91 (mean 0.81), and for all ten G.B. models—from 0.54 to 0.91 (average 0.74). The order in the case of the average precision value was the opposite, i.e., for the G.B. model, it was 0.89, for the R.F. model – 0.83, for the D.T. model—0.82, and for the MLPC model—0.79. The same order was followed for the average percentage of false positives over the total number of negatives, i.e., for the G.B. model, it was 5.8%, for the R.F. model—9.8%, for the D.T. model—11%, and for the MLPC model—13.5%. Higher precision values are associated with fewer false alarms. The values of the accuracy and F1-score parameters for the models of the four selected machine learning algorithms did not differ significantly from each other, i.e., the accuracy was between 0.85 and 0.87, and the F1-score ranged between 0.80 and 0.82. Parameter recall is better suited to assessing the effectiveness of models trained on an unbalanced dataset, such as those containing cases of rockbursts and non-destructive tremors from a selected mine.
The MLPC and D.T. models were most effective in assessing whether a rockburst occurred in an analyzed case, taking into account the average value of the recall parameter. Thus, it has been confirmed that neural networks and a decision tree can classify the rockbursts among numerous non-damaging tremors with high efficiency. However, it should be emphasized that, in the three selected datasets, the MLPC models could correctly classify 100% of rockbursts (Table 2, datasets nos. 1, 8, and 9). To date, artificial neural networks have been the most widely used to predict rockbursts in hard coal mines, e.g., [26,27]. These authors took, respectively, 10 and 8 parameters influencing the risk of rockbursts. A total of 25 parameters were used to train the models presented in this article, including, for the first time, the parameters related to the tremors and their distribution. The neural network with one hidden layer composed of 100 neurons coped satisfactorily with the prediction of rockbursts from the test dataset. The neural network was structured as follows: 25→100→2.
The D.T. algorithm once again turned out to be very useful in assessing the rockburst hazard. Previously, the application of this algorithm was shown by Pu et al. [22], but for non-coal mines. For eight out of twelve samples, the burst liability was moderate, in line with practical rockburst situations at this diamond mine [22]. The average effectiveness value of the recall parameter of the D.T. and MLPC models presented in this article was almost at the same level. However, it should be emphasized that the decision tree models did not correctly identify all rockbursts in any of the ten randomly selected datasets. For dataset no. 5, the highest recall value was obtained, i.e., 0.91. For comparison, the value of the recall parameter for the three MLPC models was 1. The decision tree models had a depth between 8 and 14 (mainly 10), and the number of leaves ranged from 31 to 38 (mainly 34). Thus, the structures of the decision tree models were quite similar to each other.

5. Conclusions

The correct classification, on average, of more than 80% of rockbursts, based on MLPC and D.T., and also R.F. models against all rockbursts in the datasets, appears to be promising. In particular, the use of artificial neural network models that correctly classify even 100% of rockbursts is remarkable. Standard methods of the rockburst hazard assessment qualified the workings (going headings under the development and longwall galleries), where the points included in the database were located, as not endangered, slightly endangered, or moderately endangered with rockbursts. However, this assessment applies to the entire workings and not for their fragments or, especially, the points located in these workings. Therefore, this article’s classification based on machine learning algorithms concerned specific points in these underground mining excavations and old workings.
Trained models, mainly of machine learning algorithms such as MLPC and D.T., were able to correctly classify the cases of rockbursts among the numerous cases where the opening was not damaged due to the tremor.
Applying trained models to the current forecasting of rockburst risk in mine conditions is still a challenge. It must be taken into account that the phenomenon of rockbursts is scarce compared to tremors that do not damage workings. Therefore, checking the trained models in conditions of nearly all tremors that do not cause damage in workings seems to be justified. In applying the models in mining conditions, it will undoubtedly be necessary to assume the maximum forecast energy of the tremors, standardly defined for mining workings, pillars, or faults with a large throw in hard coal mines in the USCB. Another issue is the attempt to replace such a large number of parameters taken directly by certain collective parameters, such as the theoretical level of stress resulting from the presence of remnants in other coal seams and/or geological disturbances. The use of machine learning algorithms to assess the risk of rockbursts in hard coal mines seems to be promising, but further investigation in this area is necessary.

Author Contributions

Conceptualization, Ł.W.; methodology, S.I., Ł.W. and T.C.; validation, S.I. and Ł.W.; formal analysis, Ł.W., S.I. and T.C.; investigation, Ł.W. and S.I.; resources, Ł.W.; data curation, Ł.W.; writing—original draft preparation, Ł.W., S.I. and D.B.A.; writing—review and editing, Ł.W., S.I. and D.B.A.; visualization, Ł.W.; supervision, D.B.A.; project administration, Ł.W.; funding acquisition, Ł.W. All authors have read and agreed to the published version of the manuscript.

Funding

This research was funded by the Ministry of Science and Higher Education, Republic of Poland (Statutory Activity of the Central Mining Institute, Task no. 11133010).

Institutional Review Board Statement

Not applicable.

Informed Consent Statement

Not applicable.

Data Availability Statement

Not applicable.

Acknowledgments

The authors would like to thank the Polish Mining Group for providing the data used for the calculations and the discussion of the results.

Conflicts of Interest

The authors declare no conflict of interest.

Appendix A

Figure A1. Violin plots of selected indicators influencing the occurrence of rockbursts.
Energies 14 06928 g0a1

Appendix B

Figure A2. Histograms of selected indicators with text value influencing the occurrence of rockbursts.
Energies 14 06928 g0a2

Appendix C

Figure A3. The correlation matrix of Pearson’s correlation coefficients of indicators related to the occurrence of rockbursts.
Energies 14 06928 g0a3

References

  1. Lenhardt, W.A. Seismicity associated with deep level mining at Western Deep Levels Limited. J. S. Afr. Inst. Min. Metall. 1992, 92, 113–120. [Google Scholar]
  2. Dubiński, J.; Konopko, W. Rockbursts: Assessment, Forecasting and Combating; Central Mining Institute: Katowice, Poland, 2000. (In Polish) [Google Scholar]
  3. Hoek, E. Practical Rock Engineering; Evert Hoek Consulting Engineer: North Vancouver, BC, Canada, 2007. [Google Scholar]
  4. Mazaira, A.; Konicek, P. Intense rockburst impacts in deep underground construction and their prevention. Can. Geotech. J. 2015, 52, 1426–1439. [Google Scholar] [CrossRef]
  5. Ortlepp, W.; Stacey, T. Rockburst mechanisms in tunnels and shafts. Tunn. Undergr. Space Technol. 1994, 9, 59–65. [Google Scholar] [CrossRef]
  6. Barański, A.; Drzewiecki, J.; Dubiński, J.; Kabiesz, J.; Konopko, W.; Kornowski, J.; Kurzeja, J.; Lurka, A.; Makówka, J.; Mutke, G.; et al. Principles of Using the Complex Method and Detailed Methods for Assessing the State of Rockburst Hazard in Hard Coal Mines; Central Mining Institute: Katowice, Poland, 2012. (In Polish) [Google Scholar]
  7. Dubiński, J. The mechanism and consequences of strong mining tremors that occur in Polish hard coal and copper mines. In Proceedings of the ISRM International Symposium EUROCK 2013, Wrocław, Poland, 23–26 September 2013; Taylor & Francis Group: Milton Prak, UK, 2013; pp. 31–38. [Google Scholar]
  8. Konopko, W. About rockbursts and associated phenomena in the USCB. Work. Saf. Min. 1984, 4. (In Polish) [Google Scholar]
  9. Kidybinski, A.; Dubiński, J. Strata Control in Deep Mines; Balkema Publishers: Rotterdam, The Netherlands, 1990. [Google Scholar]
  10. Drzewiecki, J.; Kabiesz, J. Dynamic events in roof strata—Occurrence and prevention. Coal. Sci. Technol. Mag. 2008, 235, 55–57. [Google Scholar]
  11. Bukowska, M. The rockbursts in the upper silesian coal basin in Poland. J. Min. Sci. 2012, 48, 445–456. [Google Scholar] [CrossRef]
  12. Prusek, S.; Masny, W. Analysis of damage to underground workings and their supports caused by dynamic phenomena. J. Min. Sci. 2015, 51, 63–72. [Google Scholar] [CrossRef]
  13. Kabiesz, J. Rockburst hazard. In Annual Report for 2018 of the State of Basic Natural and Technical Hazards in the Hard Coal Mining Industry; Central Mining Institute: Katowice, Poland, 2019. (In Polish) [Google Scholar]
  14. Biliński, A. Rockburst in the light of mechanics of destressed rock mass. AGH Sci. J. 1985, 2, 275–291. (In Polish) [Google Scholar]
  15. Drzęźla, B.; Białek, J.; Jaworski, A. Prediction method of stress distribution in areas of completed mining. Publ. Inst. Geophys. Pol. Acad. Sc. 1998, 10, 49–57. [Google Scholar]
  16. Pu, Y.; Apel, D.B.; Liu, V.; Mitri, H. Machine learning methods for rockburst prediction-state-of-the-art review. Int. J. Min. Sci. Technol. 2019, 29, 565–570. [Google Scholar] [CrossRef]
  17. Breiman, L.; Friedman, J.H.; Olshen, R.A.; Stone, C.G. Classification and Regression Trees; Wadsworth International Group: Belmont, CA, USA, 1984. [Google Scholar]
  18. Hornik, K.; Stinchcombe, M.; White, H. Multilayer feedforward networks are universal approximators. Neural Netw. 1989, 2, 359–366. [Google Scholar] [CrossRef]
  19. Friedman, J.H. Greedy function approximation: A gradient boosting machine. Ann. Stat. 2001, 29, 1189–1232. [Google Scholar] [CrossRef]
  20. Feng, X.T.; Webber, S.; Ozbay, M.U. Neural network assessment of rockburst risk for deep gold mines in South Africa. Trans. Nonferrous Met. Soc. China 1998, 2, 335–341. [Google Scholar]
  21. Su, G.S.; Zhang, X.F.; Yan, L.B. Rockburst prediction method based on case reasoning pattern recognition. J. Min. Saf. Eng. 2008, 25, 63–67. [Google Scholar]
  22. Pu, Y.; Apel, D.B.; Lingga, B. Rockburst prediction in kimberlite using decision tree with incomplete data. J. Sustain. Min. 2018, 17, 158–165. [Google Scholar] [CrossRef]
  23. Pu, Y.; Apel, D.; Xu, H. A Principal Component Analysis/Fuzzy Comprehensive Evaluation for Rockburst Potential in Kimberlite. Pure Appl. Geophys. 2018, 175, 2141–2151. [Google Scholar] [CrossRef]
  24. Zheng, X.; Bu, X. The forecasting of rockburst in deep-buried tunnel with adaptive neural network. In Proceedings of the International Conference on Industrial and Information Systems, Haikou, China, 24–25 April 2009; pp. 3–6. [Google Scholar]
  25. Gong, F.Q.; Li, X.; Zhang, W. Rockburst prediction of underground engineering based on Bayes discriminant analysis method. Rock Soil Mech. 2010, 33, 370–377. [Google Scholar]
  26. Sun, J.; Wang, L.; Zhang, H.; Shen, Y. Application of fuzzy neural network in predicting the risk of rock burst. Procedia Earth Planet. Sci. 2009, 1, 536–543. [Google Scholar]
  27. Shi, Y.; Li, P.; Wang, Y.; Zhang, J. Classification and prediction of rock burst based on B.P. neural network. Electron. J. Geotech. Eng. 2015, 20, 5839–5848. [Google Scholar]
  28. Zhou, J.; Koopialipoor, M.; Li, E.; Armaghani, D.J. Prediction of rockburst risk in underground projects developing a neuro-bee intelligent system. Bull. Int. Assoc. Eng. Geol. 2020, 79, 1–15. [Google Scholar] [CrossRef]
  29. Zhou, J.; Li, X.; Mitri, H.S. Classification of rockburst in underground projects: Comparison of ten supervised learning methods. J. Comput. Civ. Eng. 2016, 30, 04016003. [Google Scholar] [CrossRef]
  30. Cichy, T.; Prusek, S.; Świątek, J.; Apel, D.B.; Pu, Y. Use of neural networks to forecast seismic hazard expressed by number of tremors per unit of surface. Pure Appl. Geophys. 2020, 177, 5713–5722. [Google Scholar] [CrossRef]
  31. Wojtecki, Ł.; Gołda, I.; Mendecki, M.J. The influence of distant coal seam edges on seismic hazard during longwall mining. J. Seism. 2021, 25, 283–299. [Google Scholar] [CrossRef]
  32. Mutke, G.; Masny, W.; Prusek, S. Peak particle velocity as an indicator of the dynamic load exerted on the support of underground workings. Acta Geodyn. Geomater. 2016, 13, 367–378. [Google Scholar] [CrossRef] [Green Version]
  33. Wojtecki, Ł.; Gołda, I. Analysis of stress level during longwall mining of a coal seam with the use of seismic effect method. IOP Conf. Ser. Earth Environ. Sci. 2019, 261, 012057. [Google Scholar] [CrossRef]
  34. Stec, K.; Lurka, A. Characteristics and seismologic methods of analysis of seismic activity in the Upper Silesian Coal Basin. Pol. Min. Rev. 2015, 1, 83–93. (In Polish) [Google Scholar]
  35. Dubiński, J.; Wierzchowska, Z. Methods for the calculation of tremors seismic energy in the Upper Silesia. Sci. Work. Cent. Min. Inst. 1973, 591, 3–23. (In Polish) [Google Scholar]
  36. Mutke, G.; Pierzyna, A.; Barański, A. b-Value as a criterion for the evaluation of rockburst hazard in coal mines. In Proceedings of the 3rd International Symposium on Mine Safety Science and Engineering, Montreal, QC, Canada, 13–19 August 2016. [Google Scholar]
  37. Lasocki, S. Statistical distribution of seismological events. In Guide for Mining Geophysicist; Drzęźla, B., Dubiński, J., Fajklewicz, Z., Goszcz, A., Marcak, H., Pilecki, Z., Zuberek, W.M., Eds.; CPPGSMiE PAN: Kracow, Poland, 1995; Volume 2, pp. 174–189. (In Polish) [Google Scholar]
  38. Gołda, I.; Kornowski, J. Application of the gutenberg-richter relation to rockburst hazard prediction together with uncertainty. Min. Geol. 2011, 6, 49–62. (In Polish) [Google Scholar]
  39. Project Jupyter. Available online: https://jupyter.org/ (accessed on 9 April 2021).
  40. Kluyver, T.; Ragan-Kelley, B.; Pérez, F.; Granger, B.; Bussonnier, M.; Frederic, J.; Kelley, K.; Hamrick, J.; Grout, J.; Corlay, S.; et al. Jupyter Notebooks—A Publishing Format for Reproducible Computational Workflows; Positioning and Power in Academic Publishing: Amsterdam, The Netheralnds, 2016; pp. 87–90. [Google Scholar]
  41. Pedregosa, F.; Varoquaux, G.; Gramfort, A.; Michel, V.; Thirion, B.; Grisel, O.; Blondel, M.; Prettenhofer, P.; Weiss, R.; Dubourg, V.; et al. Scikit-learn: Machine learning in python. J. Mach. Learn. Res. 2011, 12, 2825–2830. [Google Scholar]
  42. Kuhn, M.; Johnson, K. Applied Predictive Modeling; Springer: New York, NY, USA, 2013. [Google Scholar]
  43. Boser, B.E.; Guyon, I.M.; Vapnik, V.N. A training algorithm for optimal margin classifiers. In Proceedings of the Fifth Annual Workshop on Computational Learning Theory-COLT’92, Pittsburgh, PA, USA, 27–29 July 1992; pp. 144–152. [Google Scholar] [CrossRef]
  44. Cortes, C.; Vapnik, V. Support-vector network. Mach. Learn. 1995, 20, 273–297. [Google Scholar] [CrossRef]
  45. Zhang, H. Exploring conditions for the optimality of naïve bayes. Int. J. Pattern Recognit. Artif. Intell. 2005, 19, 183–198. [Google Scholar] [CrossRef]
  46. Murphy, K.P. Machine Learning: A Probabilistic Perspective; MIT Press: Cambridge, UK, 2013. [Google Scholar]
  47. Quinlan, J.R. Induction of decision trees. Mach. Learn. 1986, 1, 81–106. [Google Scholar] [CrossRef] [Green Version]
  48. Friedman, J.; Hastie, T.; Tibshirani, R. The Elements of Statistical Learning; Springer: New York, NY, USA, 2001. [Google Scholar]
  49. Breiman, L. Random forests. Mach. Learn. 2001, 45, 5–32. [Google Scholar] [CrossRef] [Green Version]
  50. Freund, Y.; Schapire, R.E. A decision-theoretic generalization of on-line learning and an application to boosting. J. Comput. Syst. Sci. 1997, 55, 119–139. [Google Scholar] [CrossRef] [Green Version]
  51. Schapire, R.E.; Singer, Y. Improved boosting algorithms using confidence-rated predictions. Mach. Learn. 1999, 37, 297–336. [Google Scholar] [CrossRef] [Green Version]
  52. Mason, L.; Baxter, J.; Bartlett, P.L.; Frean, M.R. Boosting algorithms as gradient descent. In Advances in Neural Information Processing Systems; Solla, S., Leen, T., Müller, K., Eds.; MIT Press: Cambridge, UK, 2000; pp. 512–518. [Google Scholar]
  53. Friedman, J.H. Stochastic gradient boosting. Comput. Stat. Data Anal. 2002, 38, 367–378. [Google Scholar] [CrossRef]
  54. Chen, T.; Guestrin, C. Xgboost: A scalable tree boosting system. In Proceedings of the 22nd ACM SIGKDD International Conference on Knowledge Discovery and Data Mining, KDD’16, New York, NY, USA, 13–17 August 2016; ACM Press: New York, NY, USA, 2016; pp. 785–794. [Google Scholar]
  55. Haykin, S. Neural Networks: A Comprehensive Foundation; Prentice Hall: Hoboken, NJ, USA, 1999. [Google Scholar]
  56. Hosmer, D.W.; Lemeshow, S. Applied Logistic Regression, 2nd ed.; John Wiley and Sons: New York, NY, USA, 2000; pp. 160–164. [Google Scholar]
Figure 1. ROC curves and AUC values for MLPC models.
Energies 14 06928 g001
Table 1. Results of applying trained models of machine learning algorithms to the test dataset.
ClassifierTpTnFpFnAccuracyRecallPrecisionF1-Score
L.R.518430.770.630.560.59
D.T.719310.870.880.700.78
R.F.719310.870.880.700.78
SVC516630.700.630.450.53
LSVC518430.770.630.560.59
GNB517530.730.630.500.56
BNB321150.800.380.750.50
GPC517530.730.630.500.56
k-NN518430.770.630.560.59
G.B.721110.930.880.880.88
AdaBoost716610.770.880.540.67
XGB621120.900.750.860.80
LGBM518430.770.630.560.59
LDA518430.770.630.560.59
QDA614820.670.750.430.55
MLPC817500.831.000.620.76
Table 2. MLPC models were trained and tested on ten randomly selected datasets.
DatasetPNTpTnFpFnAccuracyRecallPrecisionF1-Score
1822817500.831.000.620.76
21317916140.830.690.900.78
31020817320.830.800.730.76
413171014330.800.770.770.77
51119917220.870.820.820.82
614161116030.900.791.000.88
712181015320.830.830.770.80
811191116300.901.000.790.88
9822819300.901.000.730.84
101218915330.800.750.750.75
Mean0.850.840.790.80
Table 3. D.T. models trained and tested on ten randomly selected datasets.
DatasetPNTpTnFpFnAccuracyRecallPrecisionF1-Score
1822719310.870.880.700.78
213171116120.900.850.920.88
31020917310.870.900.750.82
413171114320.830.850.790.81
511191015410.830.910.710.80
614161116030.900.791.000.88
712181016220.870.830.830.83
81119917220.870.820.820.82
9822620220.870.750.750.75
101218917130.870.750.900.82
Mean0.870.830.820.82
Table 4. R.F. models trained and tested on ten randomly selected datasets.
DatasetPNTpTnFpFnAccuracyRecallPrecisionF1-Score
1822719310.870.880.700.78
213171017030.900.771.000.87
31020816420.800.800.670.73
413171014330.800.770.770.77
511191016310.870.910.770.83
614161016040.870.711.000.83
71218917130.870.750.900.82
811191018110.930.910.910.91
9822620220.870.750.750.75
1012181016220.870.830.830.83
Mean0.860.810.830.81
Table 5. G.B. models trained and tested on ten randomly selected datasets.
DatasetPNTpTnFpFnAccuracyRecallPrecisionF1-Score
1822721110.930.880.880.88
21317917040.870.691.000.82
31020618240.800.600.750.67
41317715260.730.540.780.64
51119917220.870.820.820.82
614161016040.870.711.000.83
71218917130.870.750.900.82
811191017210.900.910.830.87
9822622020.930.751.000.86
101218917130.870.750.900.82
Mean0.860.740.890.80
Publisher’s Note: MDPI stays neutral with regard to jurisdictional claims in published maps and institutional affiliations.

