Article

Thermal Performance of Finned Heat Sinks Embedded with Form-Stable Myristic Acid Phase Change Material in Photovoltaic Cooling for Green Energy Storage

by
Yamuna Munusamy
1,
John Wong Lin Onn
1,
Mohammed Alquraish
2,
Mohamed Kchaou
2,3,* and
Sumathi Sethupathi
4
1
Department of Petrochemical Engineering, Faculty of Engineering and Green Technology, Universiti Tunku Abdul Rahman, Petaling Jaya 31900, Malaysia
2
Department of Mechanical Engineering, College of Engineering, University of Bisha, P.O. Box 001, Bisha 67714, Saudi Arabia
3
Laboratory of Electromechanical Systems (LASEM), National Engineering School of Sfax, University of Sfax, Sfax 3038, Tunisia
4
Department of Environmental Engineering, Universiti Tunku Abdul Rahman, Kampar 31900, Perak, Malaysia
*
Author to whom correspondence should be addressed.
Energies 2021, 14(21), 6860; https://doi.org/10.3390/en14216860
Submission received: 9 July 2021 / Revised: 29 September 2021 / Accepted: 1 October 2021 / Published: 20 October 2021
(This article belongs to the Section A2: Solar Energy and Photovoltaic Systems)

Abstract

:
Photovoltaic (PV) panels must be equipped with a cooling system to increase their electrical output generation. Despite numerous publications on the fabrication of form-stable phase change material (FSPCM) for thermal energy storage application, studies on the usage of FSPCM for PV cooling are incredibly limited. In this work, the cooling performance of myristic acid FSPCM encapsulated with cross-linked nitrile rubber (NBR) was investigated. A fin heat sink (FHS) was employed to hold the FSPCM. The thermal performance of the FHS embedded with FSPCM (FHS-FSPCM) was preliminarily tested in an indoor setup. Results show that the FHS-FSPCM has a lower temperature distribution curve than the bare FHS, highlighting the increase in cooling capability of fabricated FSPCM. Field-testing of PV panels integrated with an FHS-FSPCM displayed that FSPCM manages to reduce the operating temperature of the panel by 4 to 15 °C and increase power output generation by 38.61%.

1. Introduction

Typical photovoltaic (PV) panels convert 15% to 22.5% of solar power into electricity, whereas the remaining is turned into heat [1]. This unproductive heat energy contributes to an increase in the PV panels’ operating temperature and reduces its maximum power output production due to an increase in carrier concentration at the p-n junction. When the temperature of the PV module increases, the fill factor and open circuit voltage will reduce and cause a drop in electrical efficiency [2]. Therefore, PV panels must be equipped with a cooling system to maintain the low operating temperature [3]. Moreover, extreme heat exposure to PV silicone cells for a long period will result in long-term degradation that rapidly reduces its lifespan [4]. Reduction of PV panel temperature was found to increase the power generation in many studies, as shown in Figure 1. However, the amount of net power generation improvement could not to be directly correlated to the value of temperature reduction of the panel due to factors such as ability of the cooling system to continuously cool the surface of the panel for a period of time, the experimental time period (whole day time or peak time), the type of panel, wind speed and the amount of power used to operate the system (in the case of an active system). Thus, as can be observed in Figure 1, in studies conducted by Hassan et al. and Baqi et al. the temperature reduction of both systems using PCM is almost similar, but there is a large difference in terms of power generation [5,6,7,8,9,10,11,12,13,14,15,16].
PV cooling systems can be classified into active and passive cooling. Active cooling technologies include jet impingement via forced water circulation, water spraying systems, and microchannel systems via forced air or coolant circulation by a pump. Passive cooling technologies consist of phase change material (PCM), heat pipe, thermosiphon, and microchannel heat sink cooling systems [17,18]. Passive PV cooling systems offer more advantages than the active cooling methods, as they possess no additional energy consumption, high layout flexibility, and have minimum maintenance requirements [19].
Among passive cooling technologies, PCM has gained a great deal of interest for its high latent heat, chemical stability, and ability to store heat in a narrow temperature range [20]. When the PV panel temperature increases, the PCM absorbs and stores the heat as sensible heat until the PCM material reaches its melting temperature. Once the melting temperature is reached, the PCM changes phase from solid to liquid, and stores the heat as latent heat. Typical PCM has a 5 to 14 times larger heat storage capacity than the sensible heat storage materials [21]. Nevertheless, the practical usage of PCM in PV panel cooling is limited because PCM possesses high volume change during the phase transition from solid to liquid, which leads to a leakage issue. This issue needs to be solved to avoid corrosion on the PV panel’s surface, pressure build-up in the container, disturbance on PV wirings, and to avoid fire safety issues [22,23,24]. To prevent such consequences, form-stable phase change material (FSPCM) is preferable to be employed in PV cooling applications whereby PCM is encapsulated with a polymeric matrix.
Despite many research articles published on the fabrication of FSPCM, limited studies have been done on solar panels with FSPCM as a cooling system. Senthilkumar et al. successfully produced polyethylene glycol/ expanded graphite FSPCM with a melting point of 34.7 °C and a phase change enthalpy of 125.97 J/g [25]. PV panels integrated with this FSPCM manageds to keep the surface temperature lower than the reference panel by 4 to 6 °C throughout the experiment. Tangsiriratana et al. proposed the usage of FSPCMs made of sugarcane wax-Al2O3 composite encapsulated with gelatin-gum Arabic for PV cooling [26]. The average temperature of the module equipped with this FSPCM was lowered by 3.87 °C. Nevertheless, the PV cooling performance remains insignificant mainly because of the large heat storage density reduction during the fabrication of FSPCM [27]. Large weight fraction of coating or encapsulation material used reduces the weight percentage of the core material, which contributes to heat storage density. Thus, the selection of the coating or encapsulation material remains crucial for determining the cooling capability of FSPCM on the PV panel.
In the present study, the FSPCM employed was made of myristic acid (MA) as the core, and was encapsulated with cross-linked nitrile rubber via a dip-coating technique, as reported in our previous work [28]. MA was selected because of their high latent heat density and low-volume change during the phase transition [29]. Nitrile butadiene rubber (NBR) latex was chosen as the encapsulation material due to its excellent chemical and tensile properties and its mechanical properties can be further enhanced with sulfur vulcanization to form a thin and compact coating [30,31]. Therefore, the weight percentage of coating material on PCM can be reduced and consequently minimize the latent heat reduction.
In this research, the cooling capability of FSCPM prepared was evaluated in an indoor preliminary set up before field-testing on the PV panel occurred. The fin heat sink (FHS) acted as a “container” to hold the FSPCM, and the thermal performance of FHS filled with FSPCM (FHS-FSPCM) and without FSPCM was evaluated via heating with different power supplies of 10, 20, and 30 W. The cooling performance of FSPCM was analyzed and evaluated by comparing the temperature distribution of FHS and FHS-FSPCM. Then, the cooling performance of FHS-FSPCM on the solar module in field-testing was assessed and the maximum power output generation was determined.

2. Materials and Methods

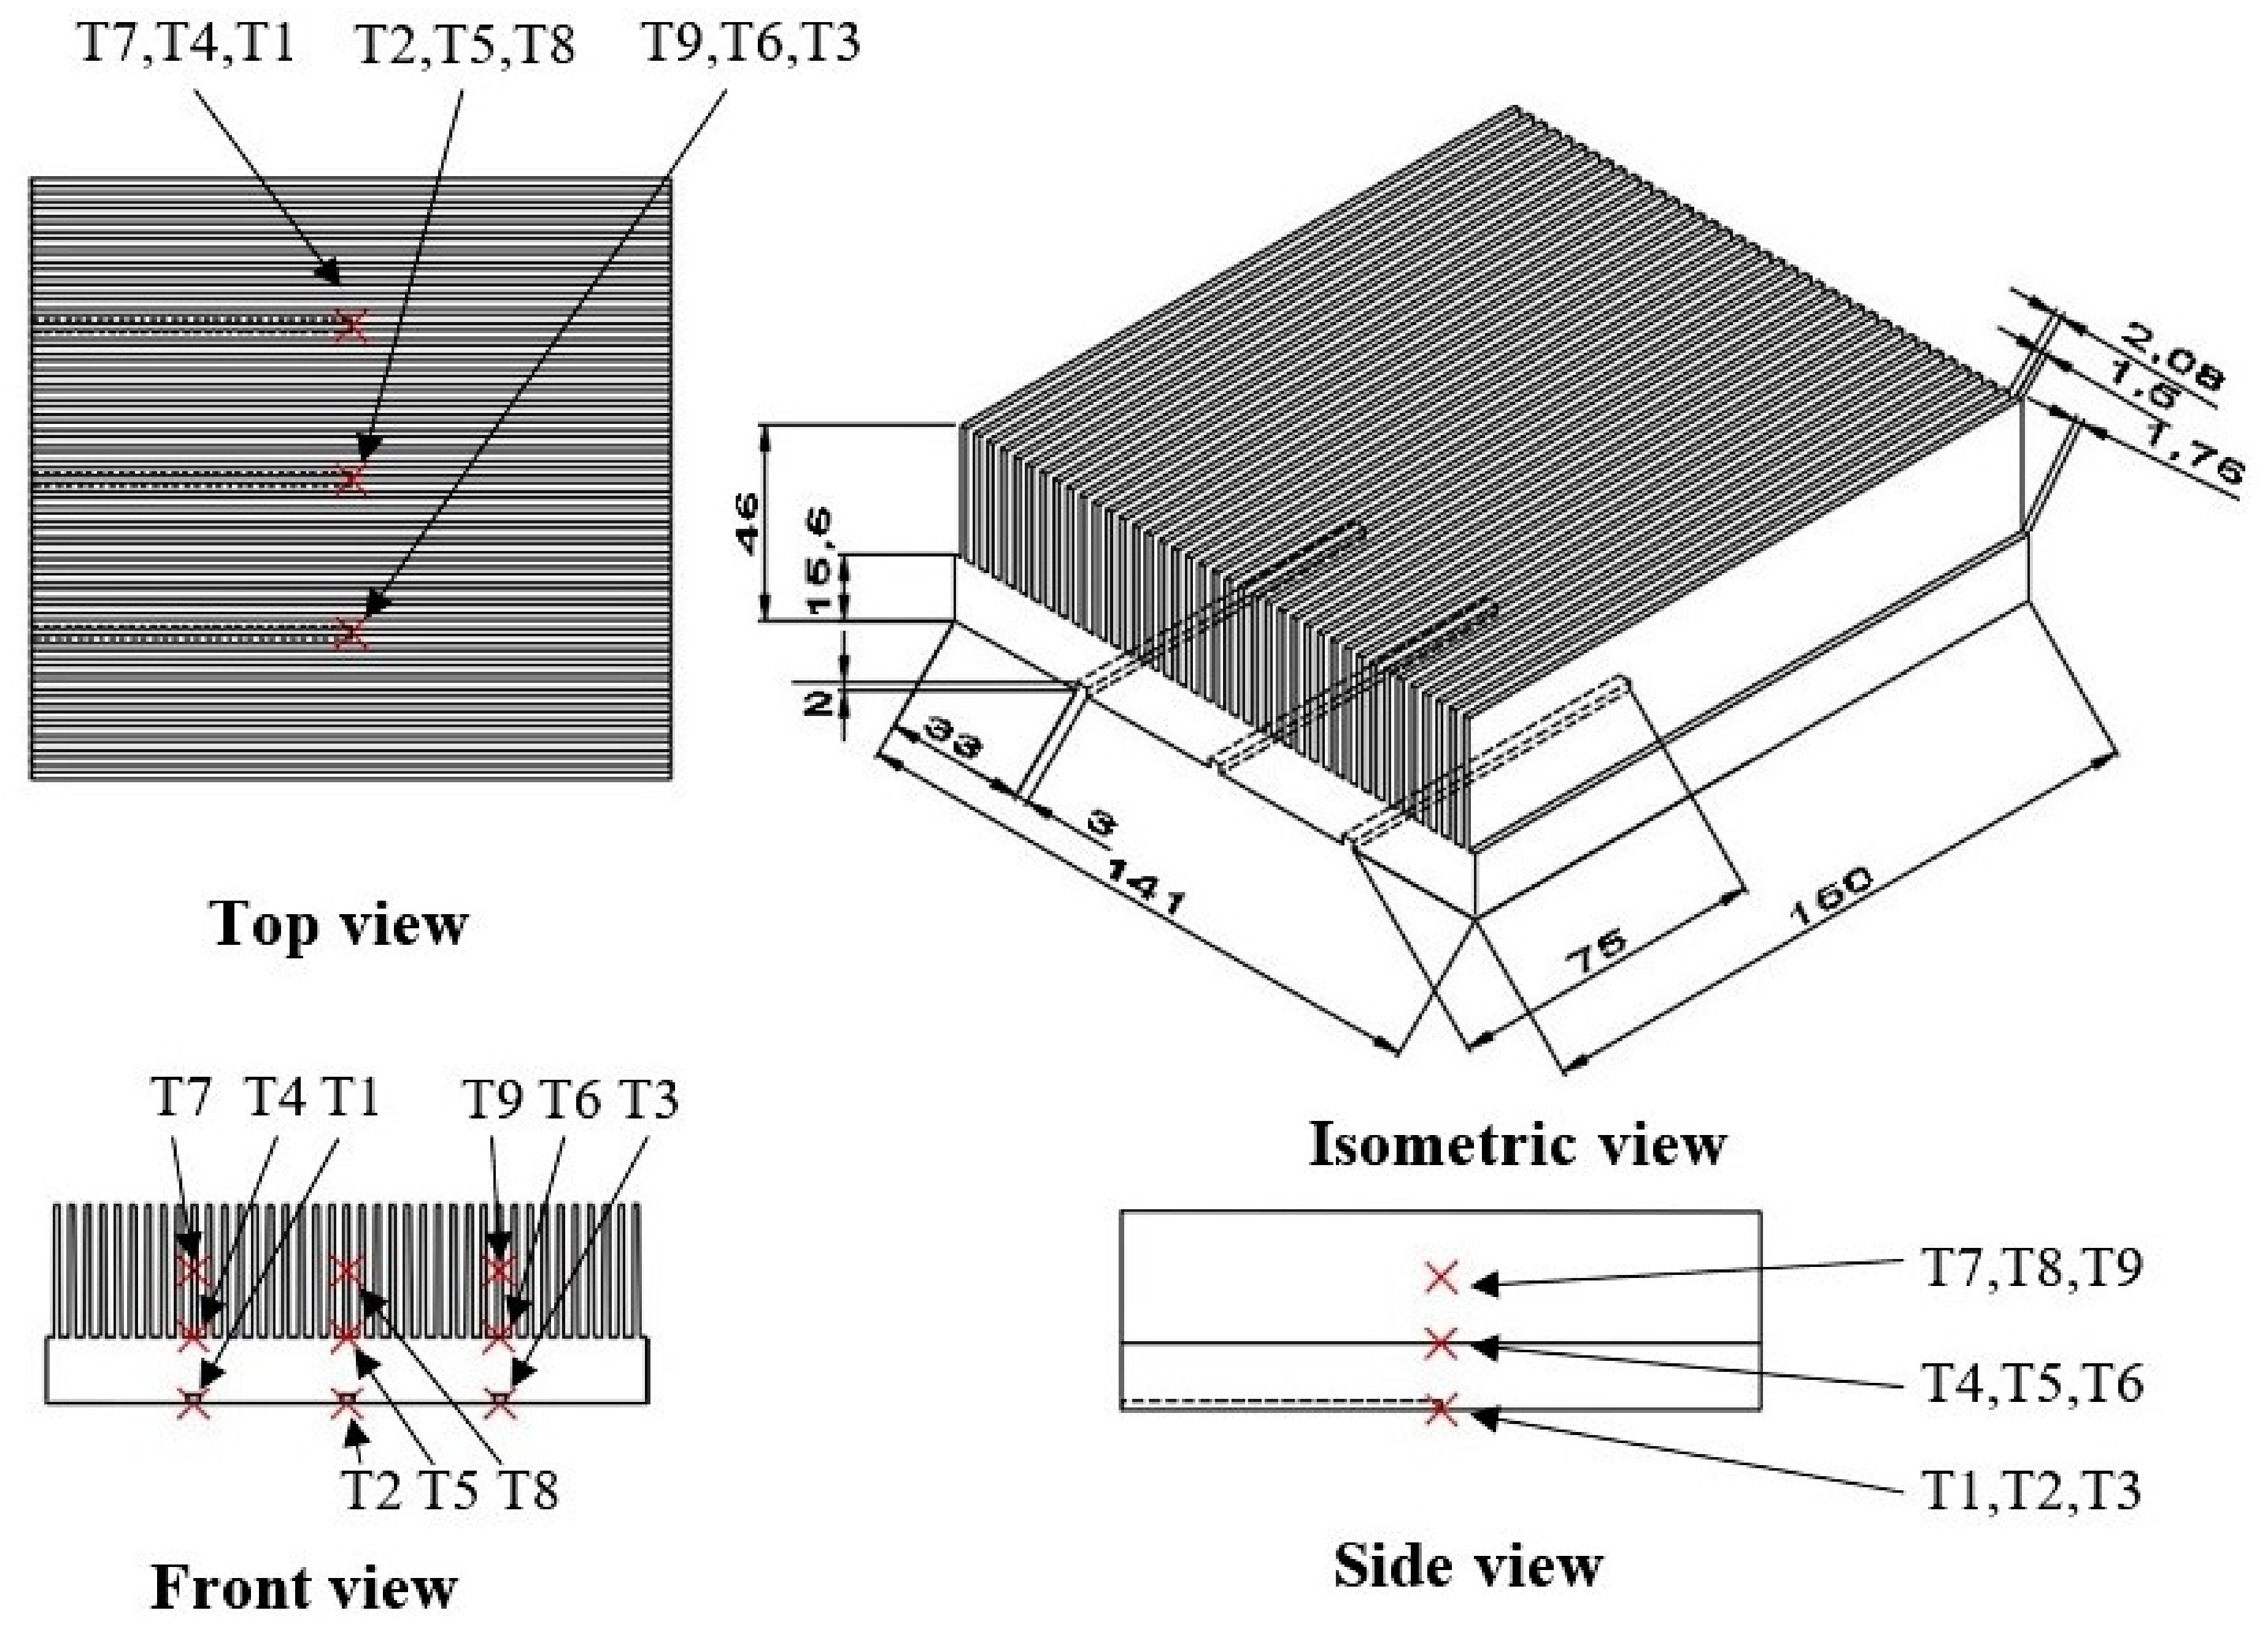
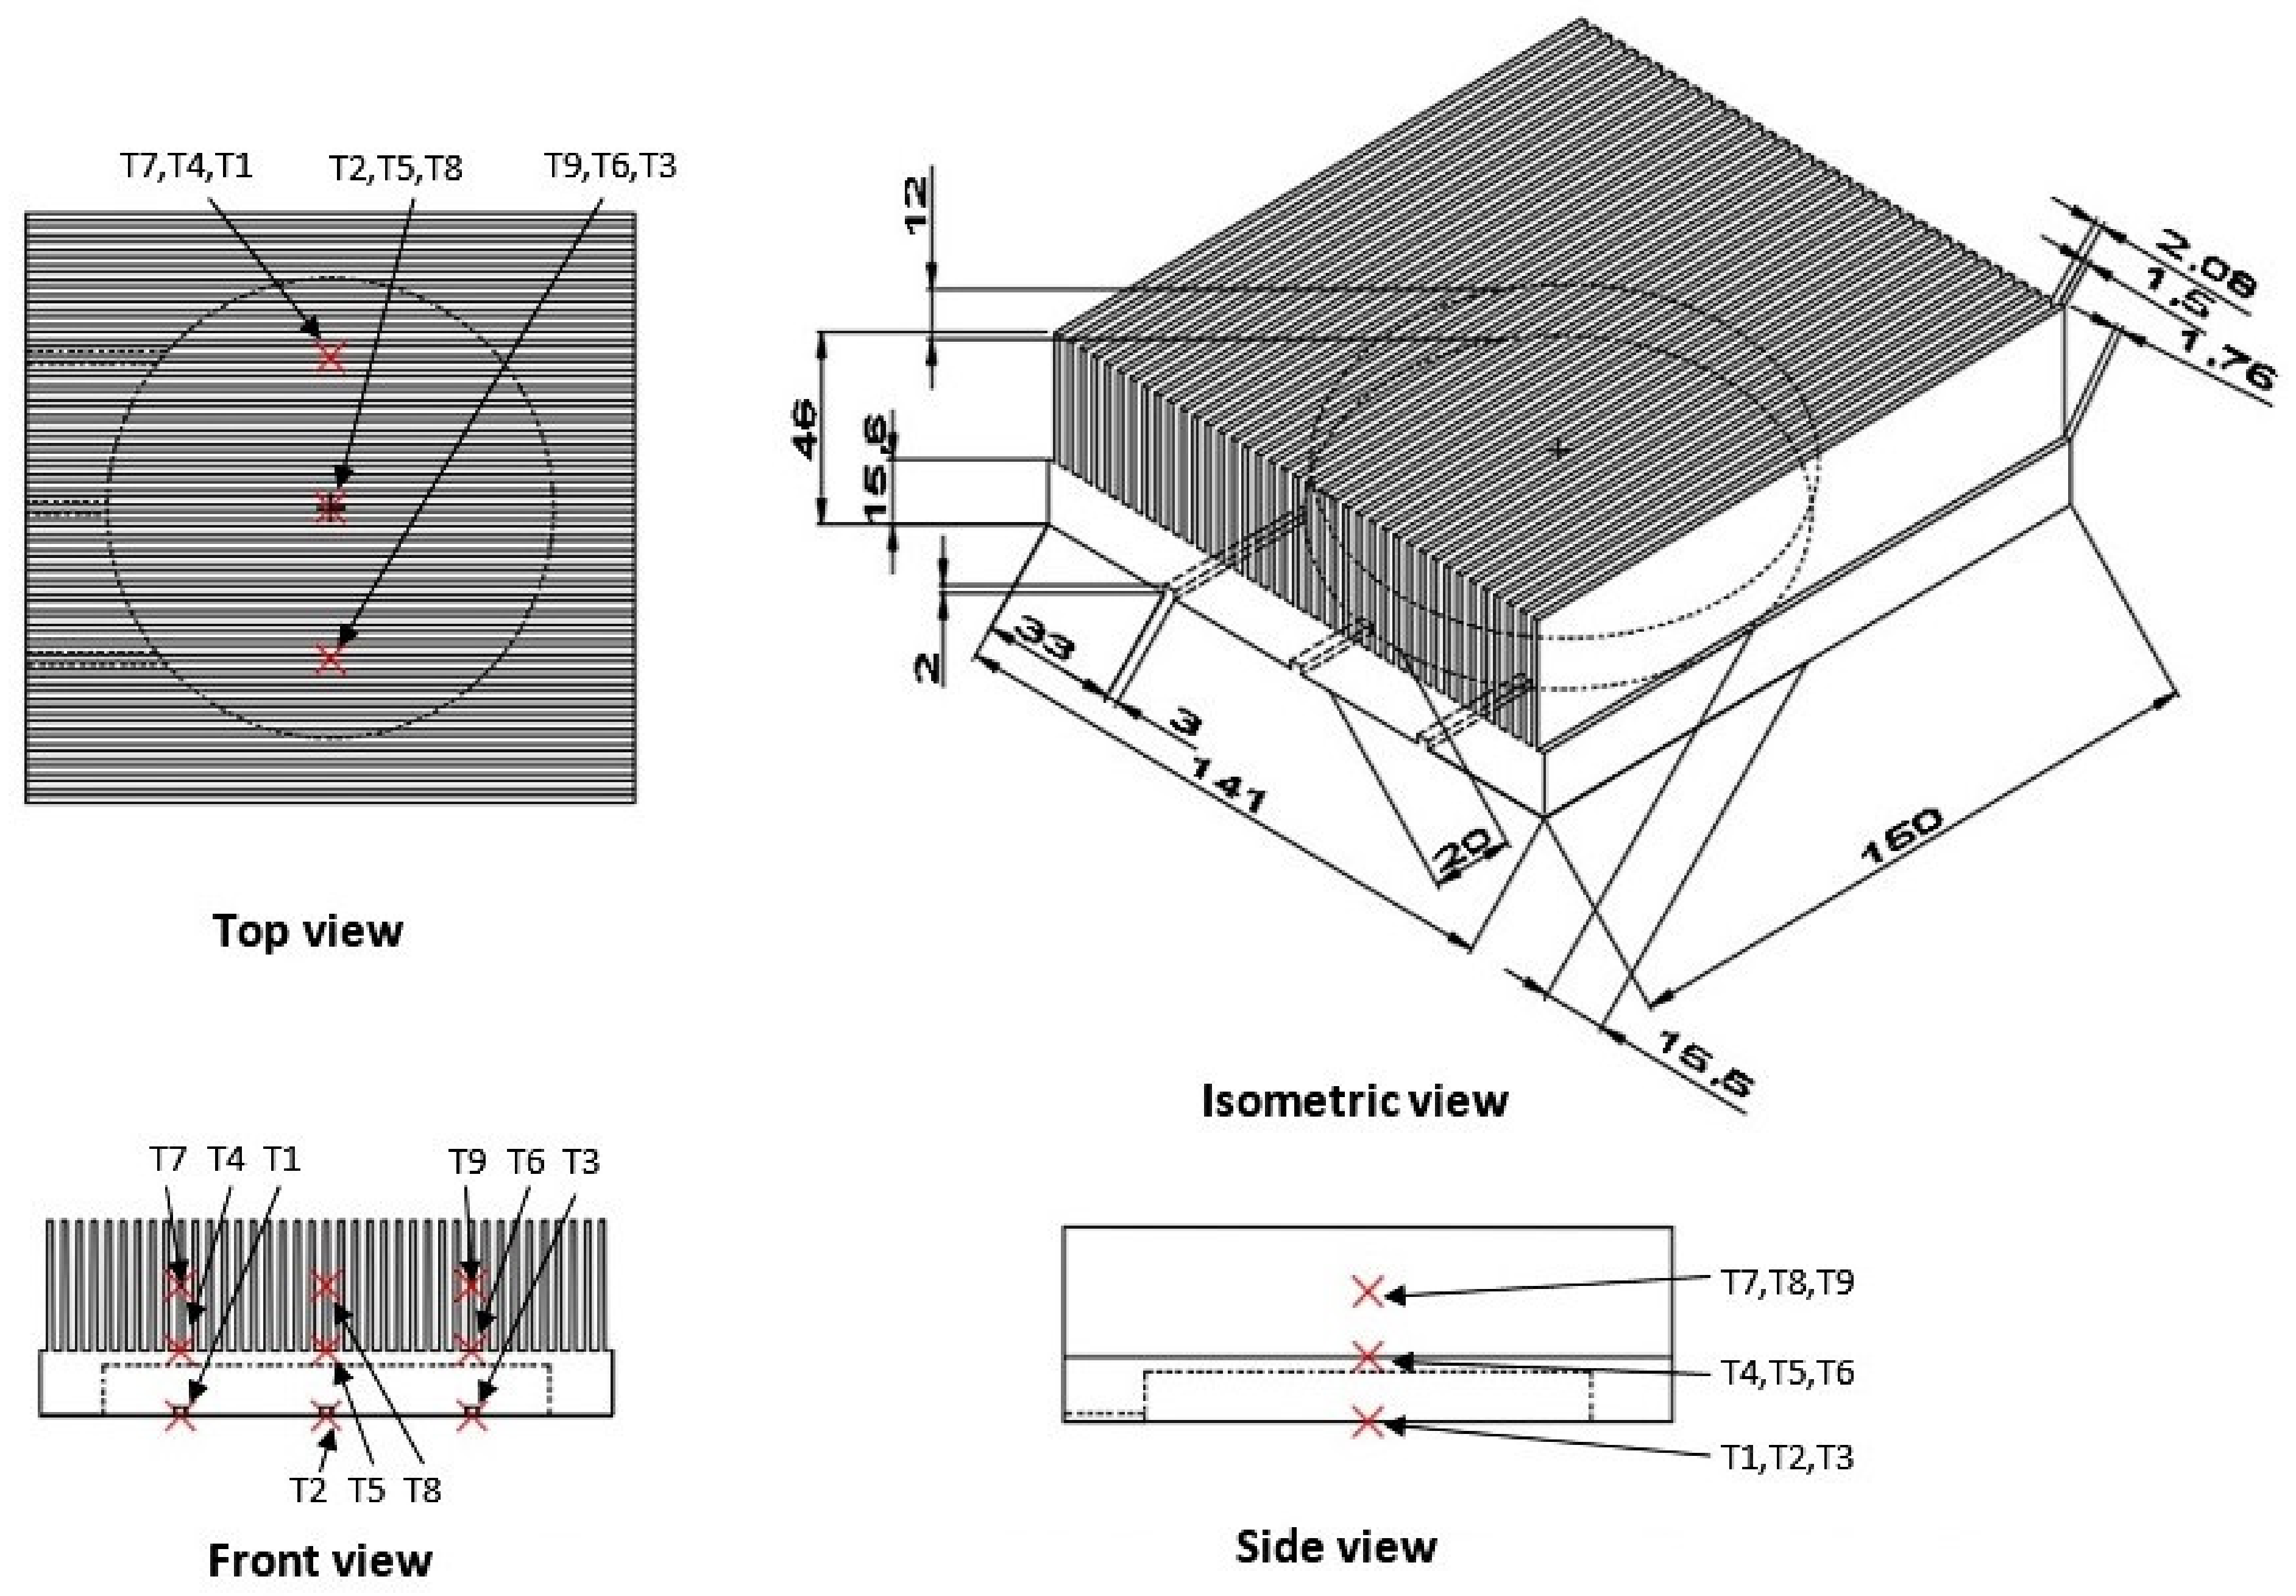
2.1. Fin Heat Sink Configuration and Location of Thermocouples

In this study, two pieces of FHS made of aluminum with a dimension of 141 × 150 mm2 base and a height of 46 mm were employed. These FHS consist of 39 fins with a length × width × height of 150 × 1.5 × 30.4 mm. The distance between the fins was 2.08 mm. Both FHS was machined with the dimension as illustrated in Figure 2 and Figure 3 to enable positioning of thermocouples and its integration with FSPCM. Nine calibrated T-type thermocouples were fixed on each FHS using AralditeTM epoxy resin as shown in Figure 2 and Figure 3. The locations of thermocouples were; three on the heated surface of FHS (labelled as T1 to T3), three on the base of FHS (labelled as T4 to T6), and three on the fin of FHS (labelled as T7 to T9).

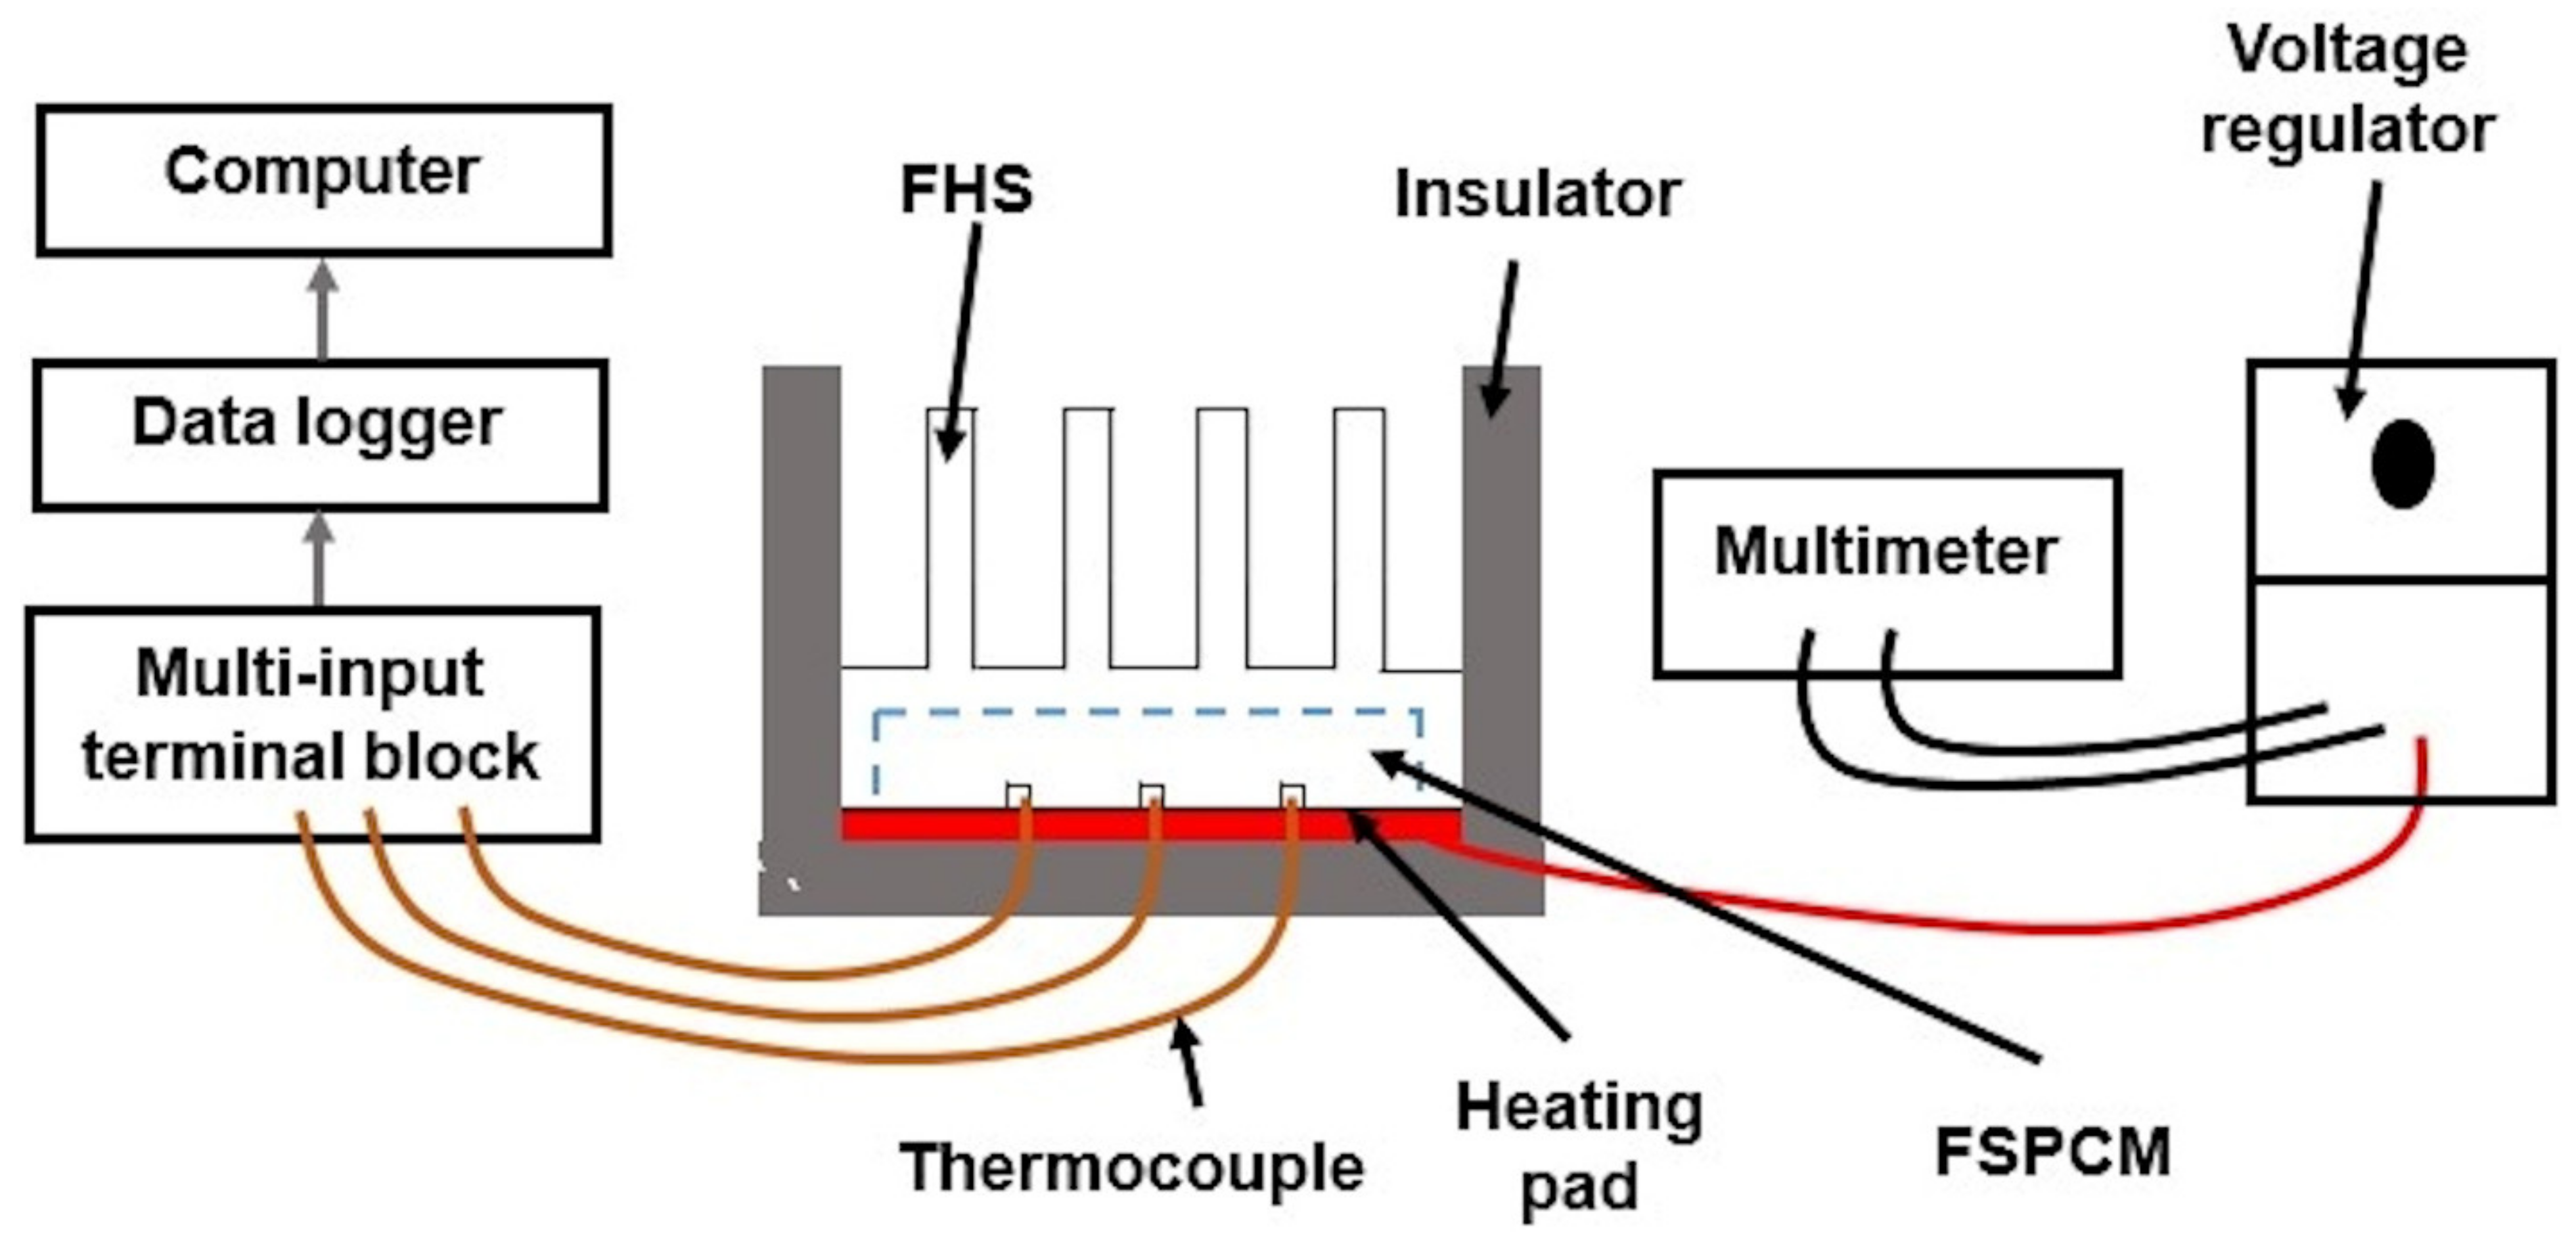
2.2. Experimental Setup for Preliminary Performance Assessment on FHS and FHS-FSPCM

The schematic experimental setup for this study was displayed in Figure 4. The setup consists of a FHS or FHS-FSPCM, insulated with polyurethane foam to prevent heat loss to its surroundings. Voltage regulator (TDGC2-2kVA) and a digital multimeter (GW Instek GDM-8034) were used to control the power supply. 150 × 150 mm2 heating pad with a thickness of 1.5 mm, type-T thermocouples, data logger (Graphtec data logger GL820) to record the temperature over time, and a multi-input terminal block (Graphtec B-564) that connects multiple thermocouples with the data logger were also used in the setup. Thermal paste was employed in between the heating pad and heated surface of the FHS to prevent contact resistance. FSPCM employed in present study was fabricated with MA as the core phase change material and encapsulated with cross-linked NBR latex via dip-coating technique as published in our previous work [28]. The produced FSPCM has a diameter of 108 mm and a thickness of 10 mm. The properties of materials utilized in this study are given in Table 1. Three different power supplies of 10, 20, and 30 W were studied to determine the temperature distribution of FHS and FHS-FSPCM. For the first 200 min, the voltage regulator was adjusted to obtain a power supply of 10 W and FHS was heated until it reaches a steady-state condition. The data logger recorded the temperature of thermocouples every 10 min. Then, the continuous power supply was increased to 20 and 30 W, respectively, after every 200 min of heating. The average temperature of thermocouples on three different parts of FHS was calculated as in Equations (1)–(3).
Ths = (T1 + T2 + T3)/3
Tbs = (T4 + T5 + T6)/3
Tfin = (T7 + T8 + T9)/3
where Ths represents average temperature on heated surface of FHS, Tbs represents average temperature on base of FHS, and Tfin represents average temperature on fin of FHS.

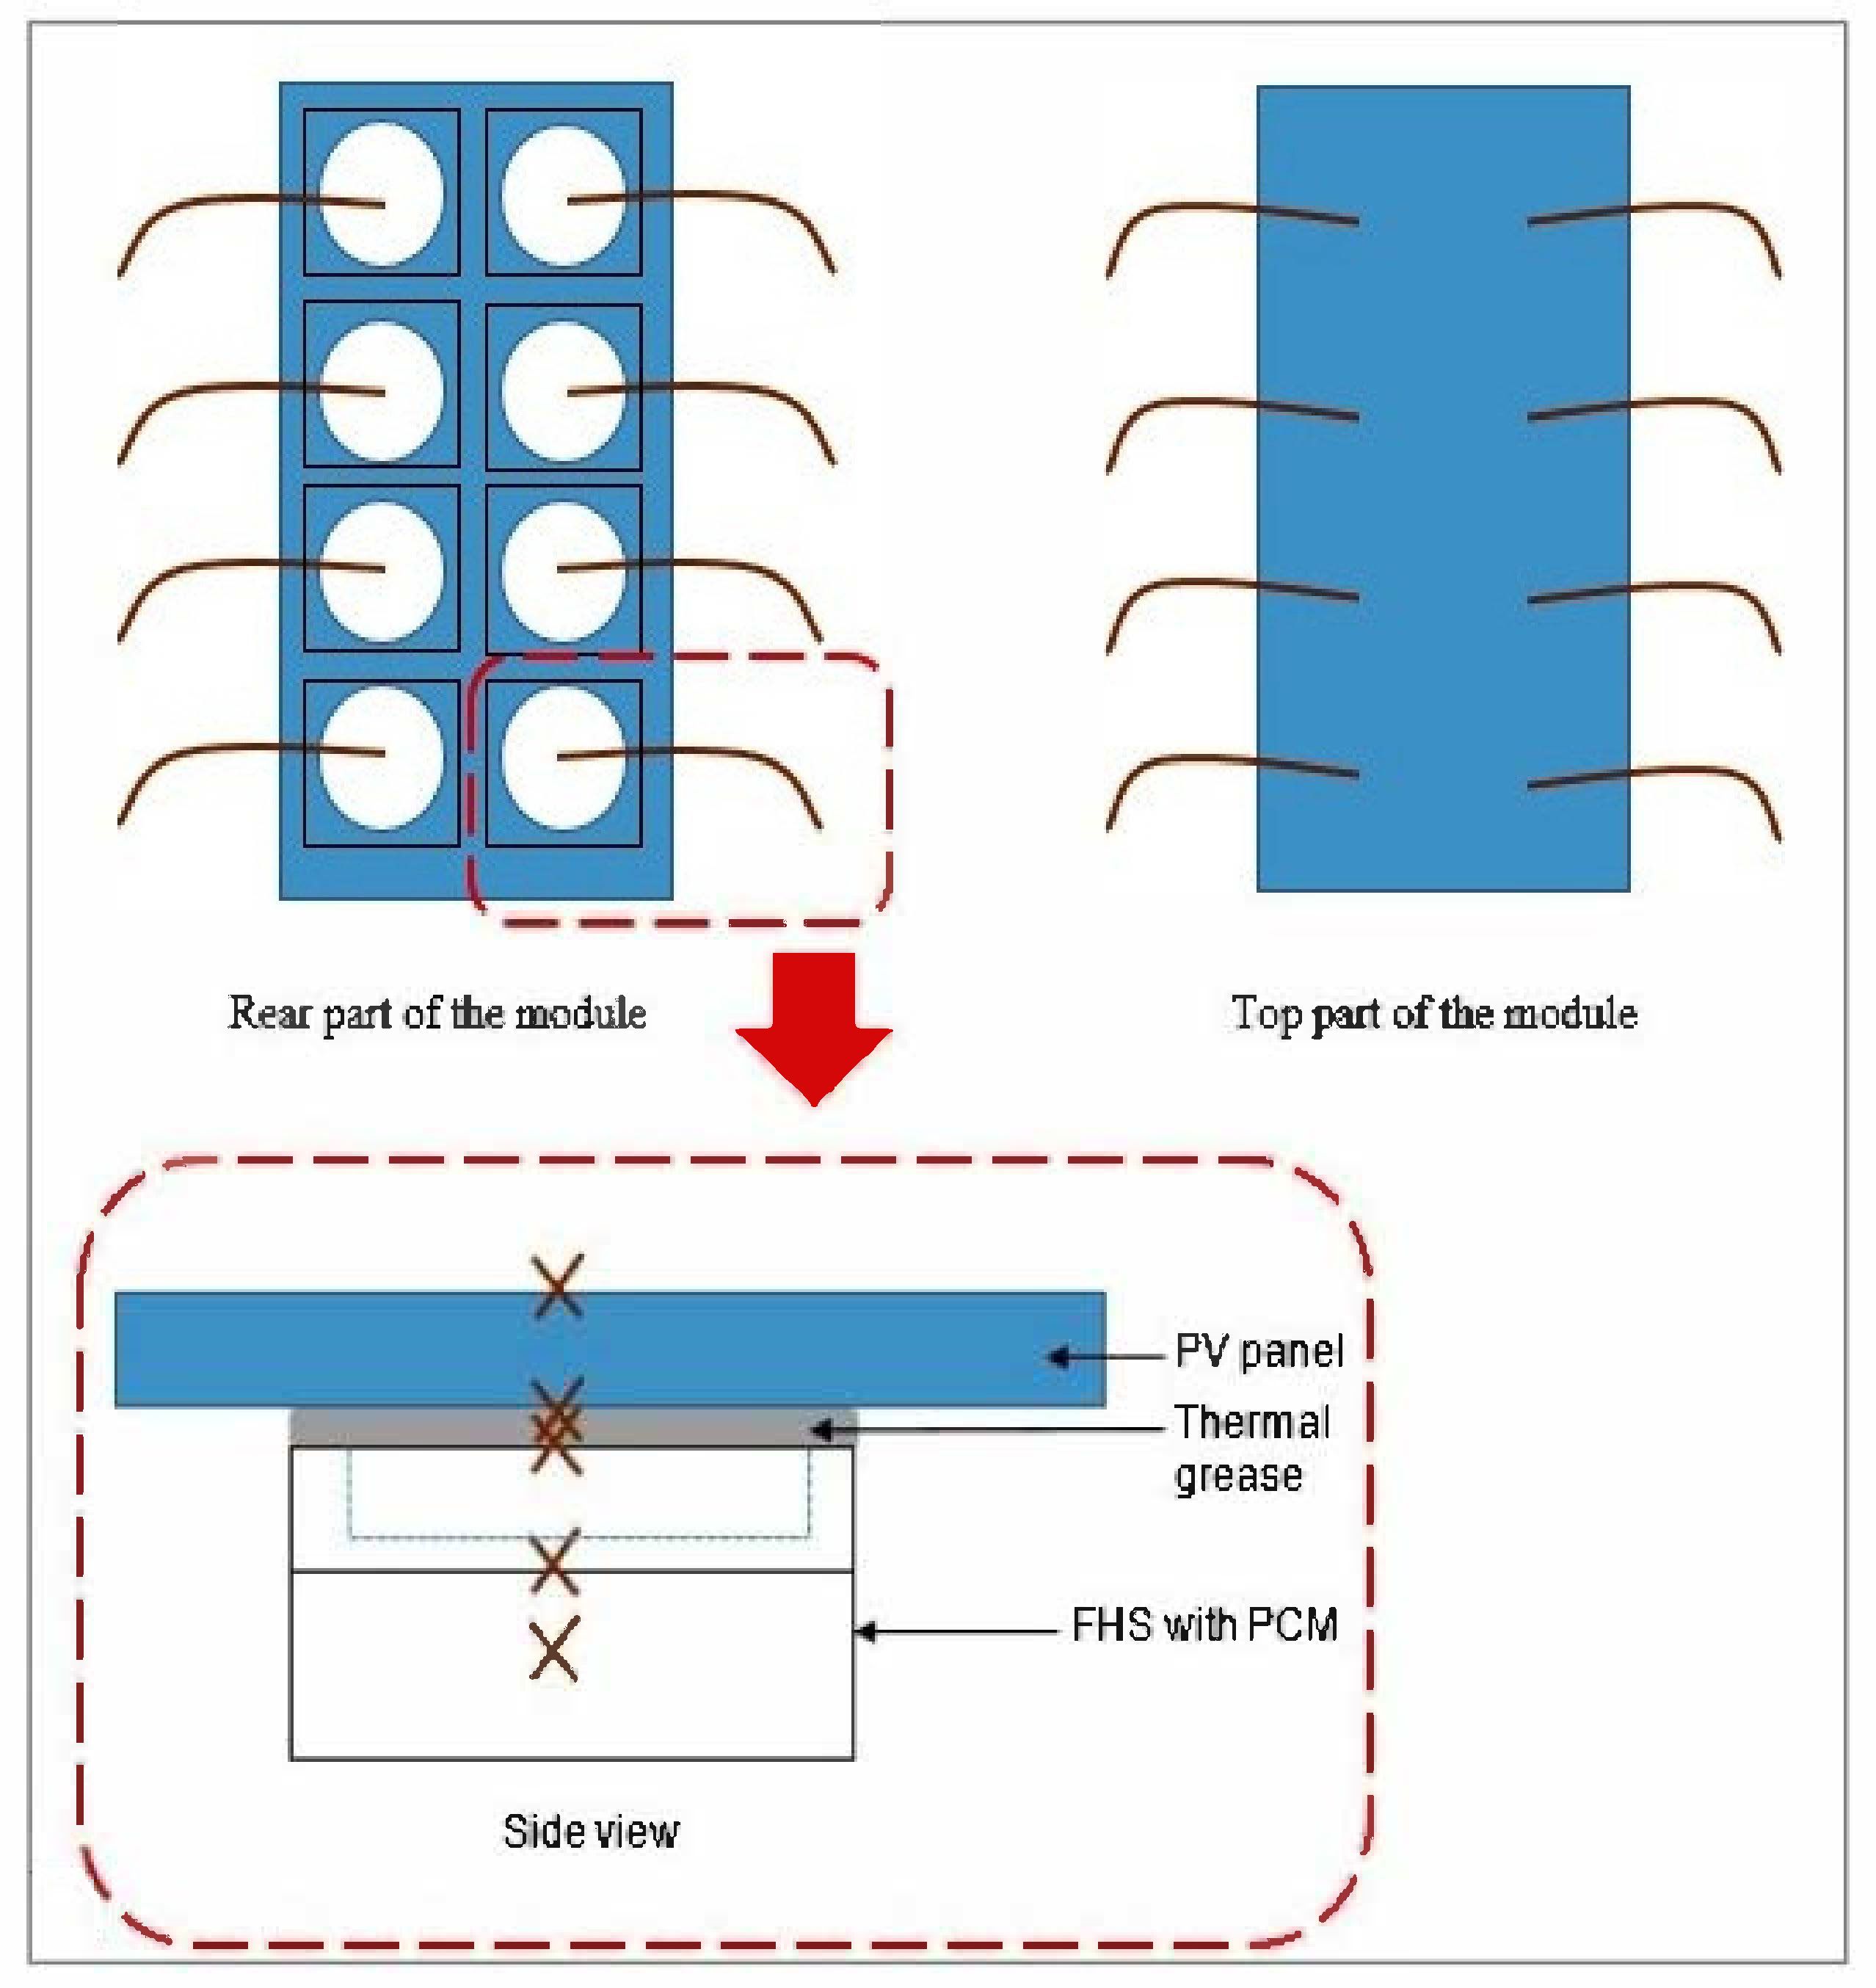
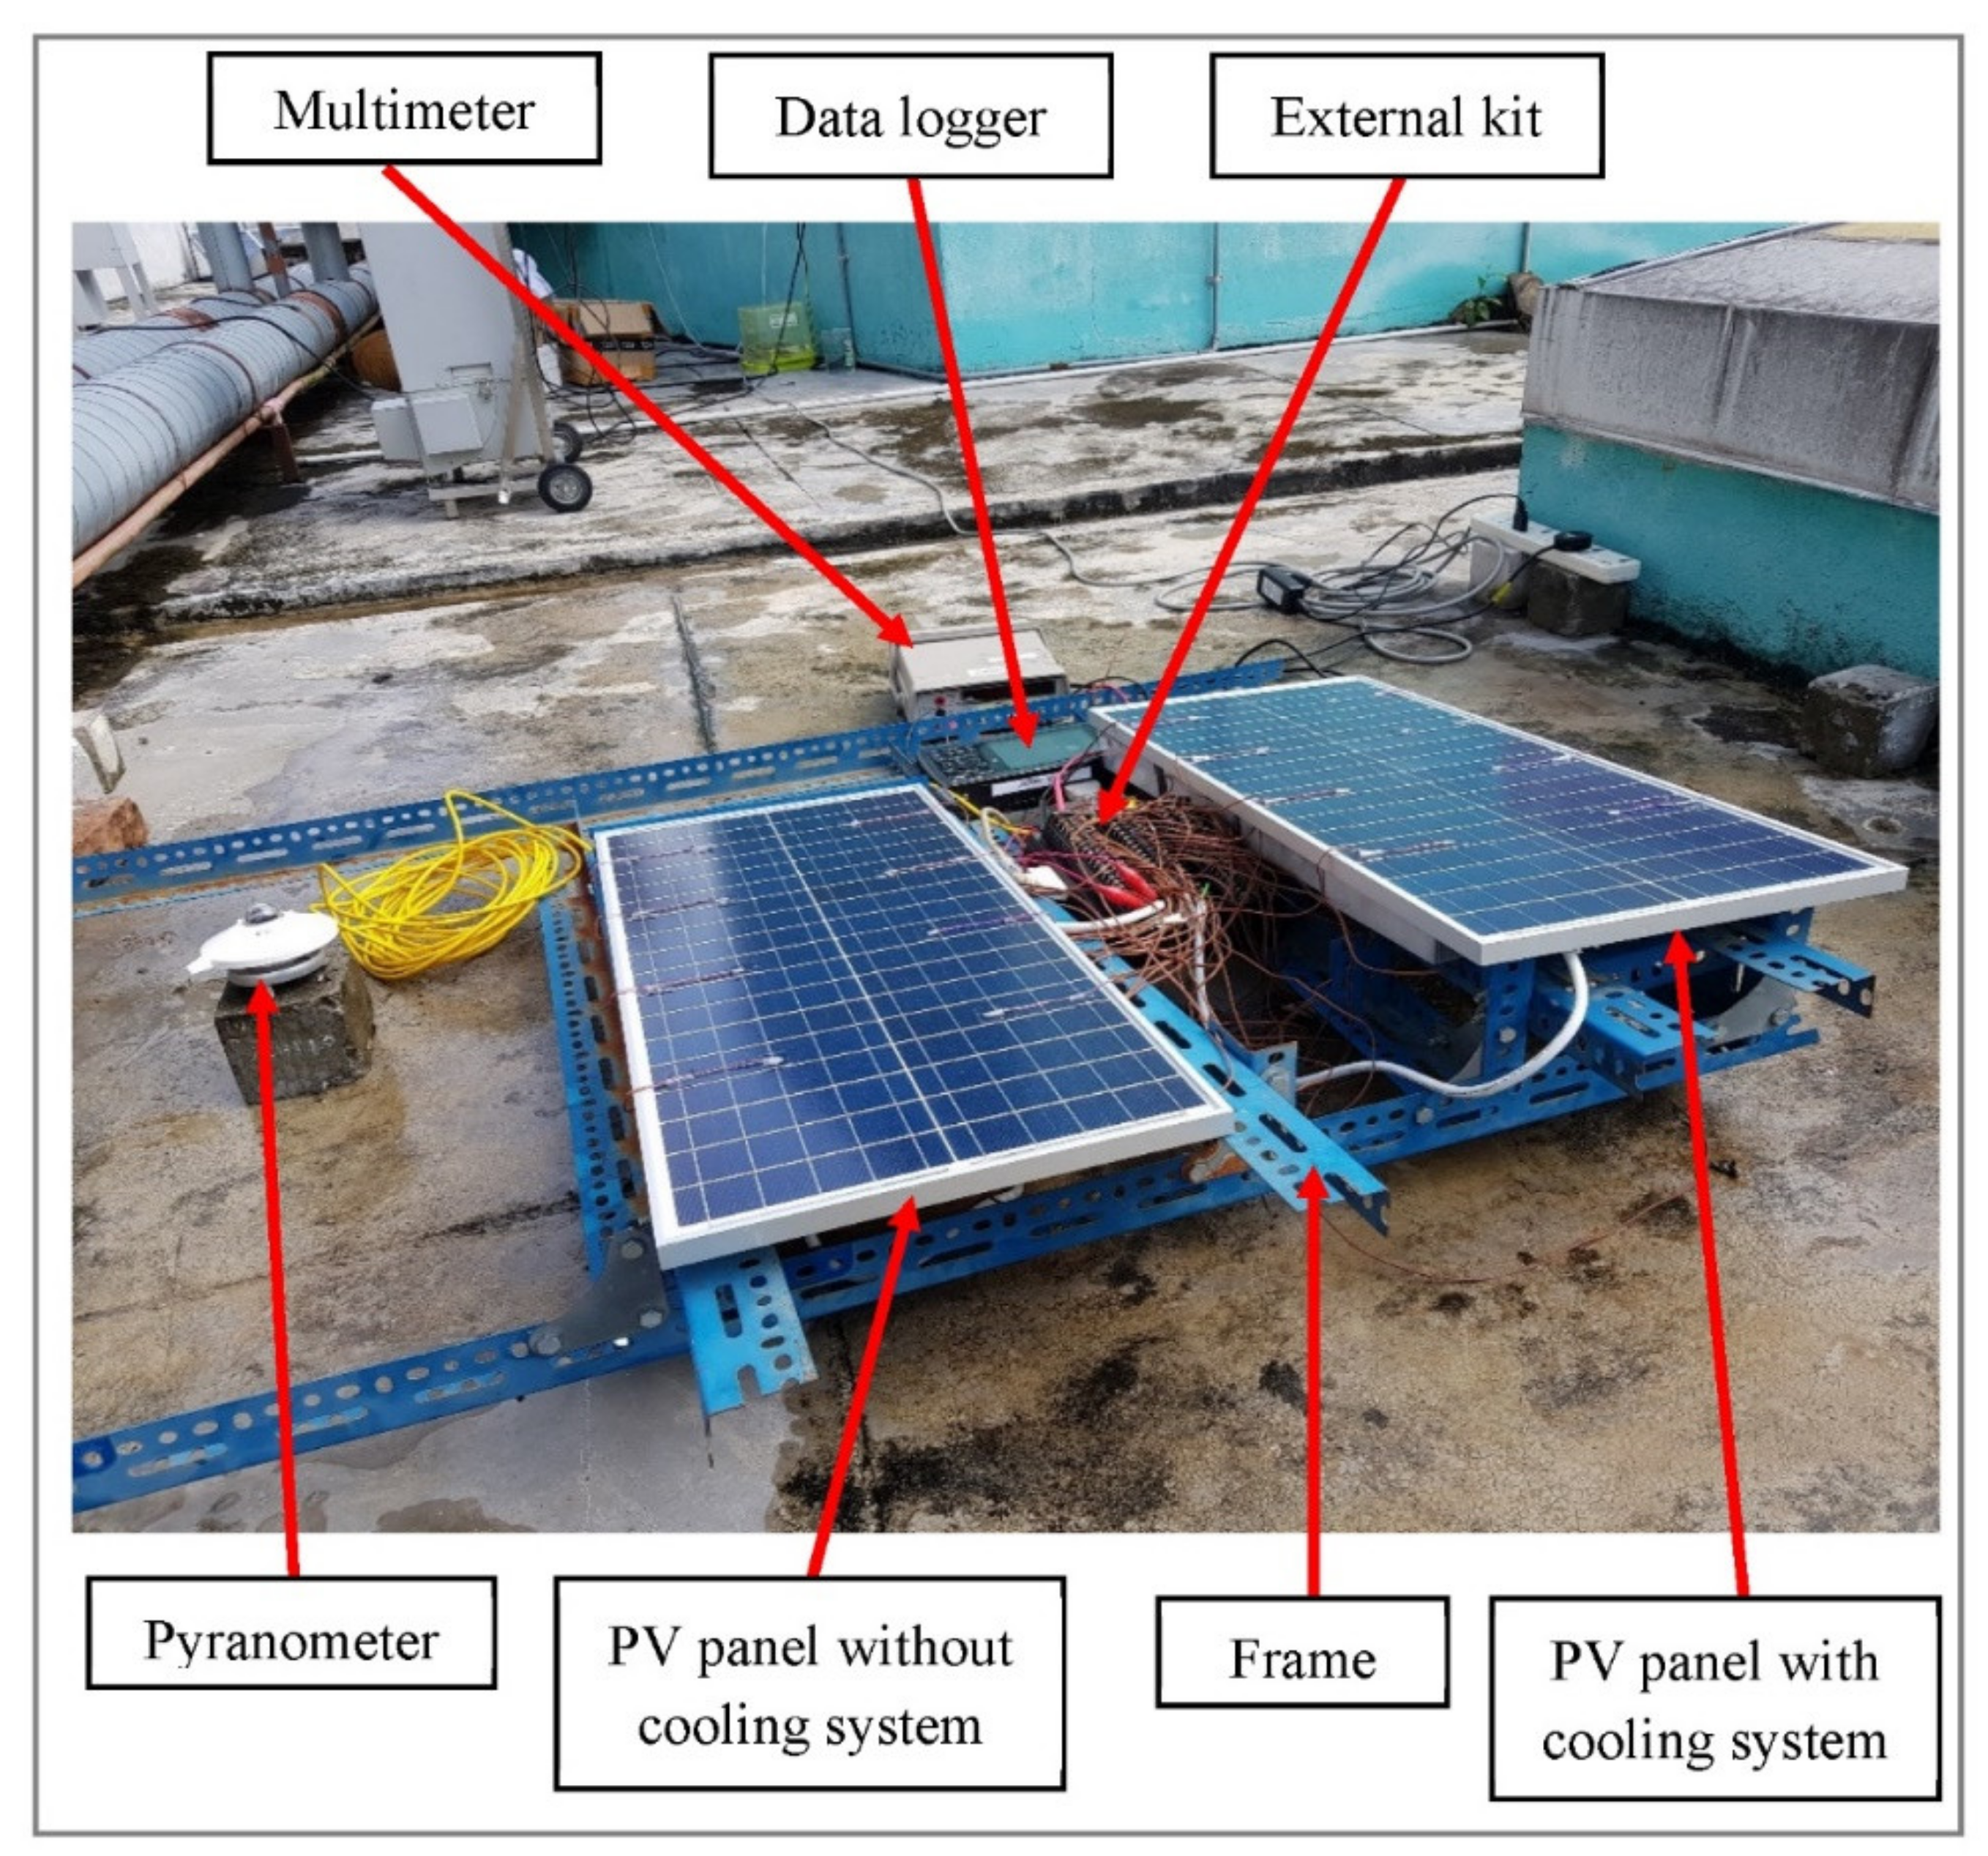
2.3. Experimental Setup for Application of FHS-FSPCM on Photovoltaic (PV) Panel

As the FHS-FSCPM has better cooling capability than the FHS, it was selected to be further investigated on the PV panel. Figure 5 outlines the setup of PV panels for FHS-FSPCM and the location of the thermocouples. Eight pieces of modified FHS-FSPCM were prepared with one thermocouple each installed on the heated surface, top of the FHS surface, and fin of the FHS. In addition, eight thermocouples were attached on the surface and rear part of PV panel, respectively. FHS-FSPCM were attached to the rear part of the PV panel. Figure 6 shows the outdoor experimental setup to study the performance of PV cooling. Two pieces of 39.25 W monocrystalline PV modules were employed; one was used as a reference and the other was attached with 8 pieces of FHS-FSPCM on its rear surface. The specific electrical properties of the PV panels are displayed in Table 2. Two panels with similar electrical properties were chosen for the field-testing. One thermocouple was used to measure the ambient temperature. The solar irradiance was measured by a pyranometer. A multimeter was utilized to obtain the current produced by the panel. Multi-input terminal block serves as a terminal to connect thermocouples, voltage cables, and pyranometer with the data logger so that the voltage generated by the PV module, temperature, and solar irradiance can be recorded concurrently. This experiment was conducted from 10 am. to 3 pm. for 30 sunny days on October and November 2020. PV panels system were tilted to an inclination angle of 15° and the modules were facing towards south. The experiment was performed on the rooftop of Block E, Faculty of Engineering and Green Technology, Universiti Tunku Abdul Rahman, Malaysia. Maximum power output was calculated as in Equation (4) with short circuit current and open circuit potential [32]. The relative humidity was recorded to be between 80 and 82% on these days and the wind speed was recorded to be between 3 and 5 km/h.
P o u t = V o c × I s c × F F
where P o u t represents maximum power output, V o c represents open circuit voltage, I s c   represents short circuit current, and FF represents fill factor.

3. Results and Discussion

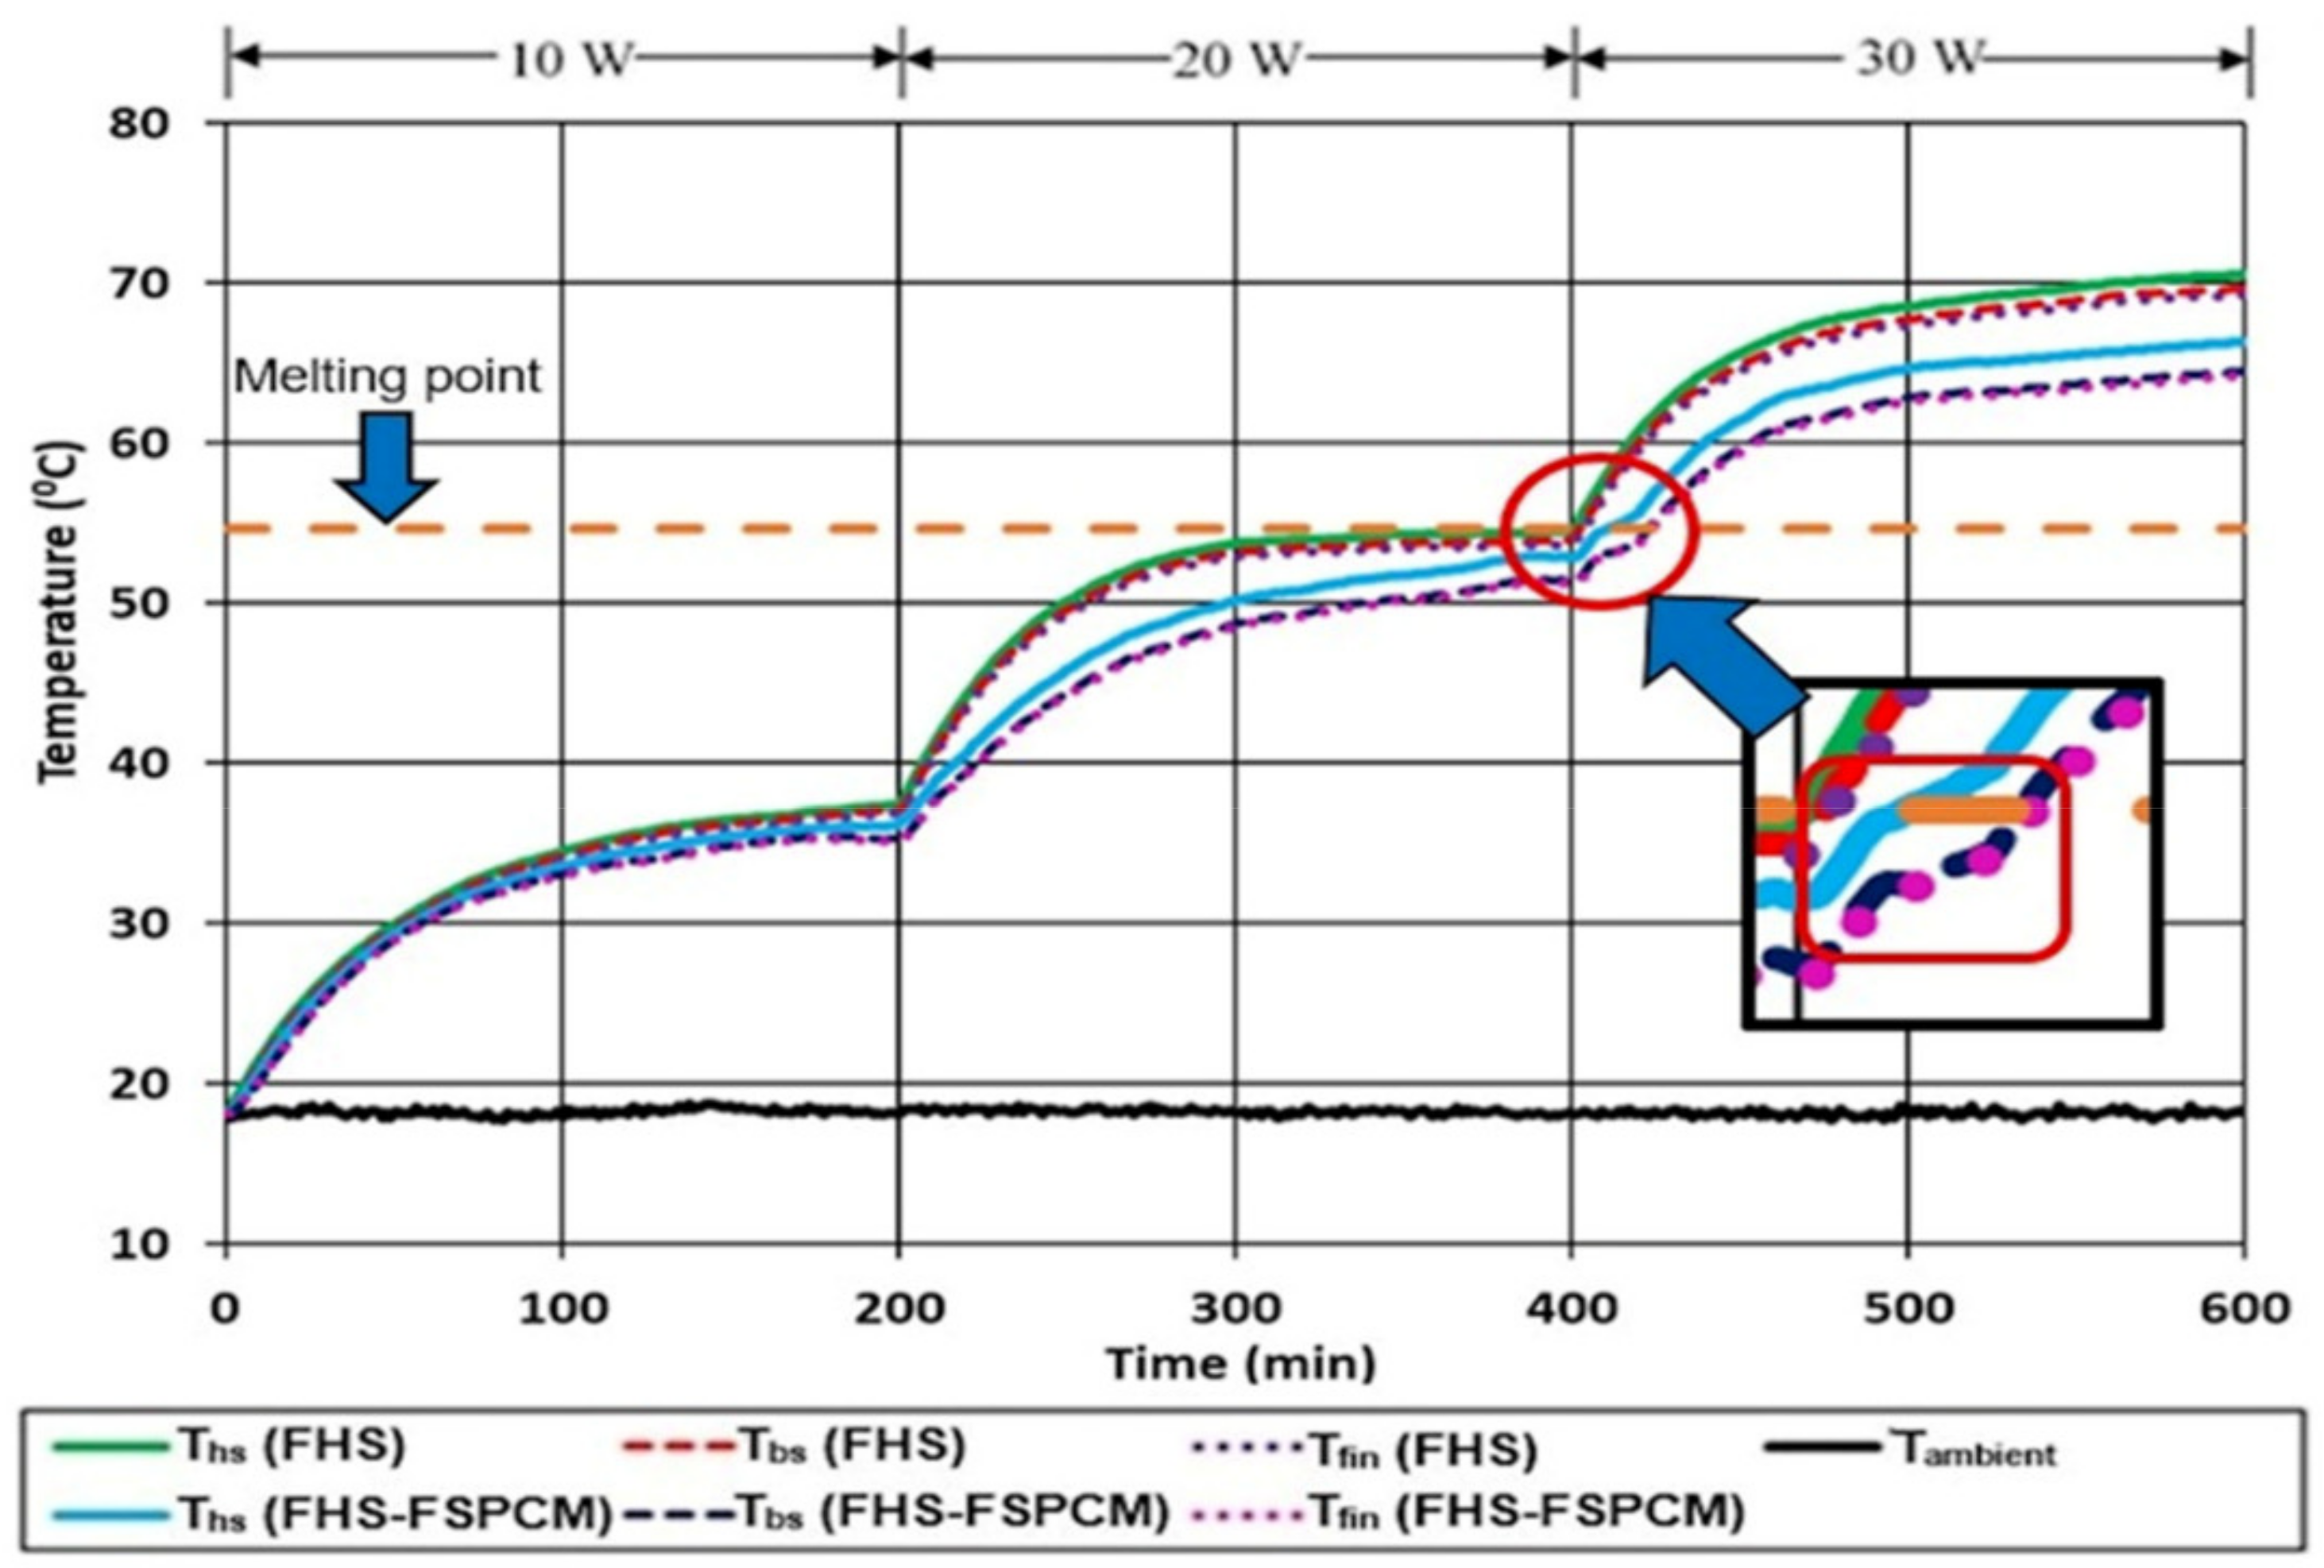
3.1. Preliminary Thermal Performance Assessment of FHS and FHS-FSPCM with Different Power Supply

The temperature distribution of the FHS and FHS-FSPCM was analyzed with the continuous power supplies of 10, 20, and 30 W (an increment of 10 W every 200 min). Figure 7 shows the average temperature collected from three parts of the FHS (heated surface = Ths; base of FHS = Tbs; fin of FHS = Tfin). The temperature of thermocouples at steady-state conditions is outlined in Table 3. In general, the temperature recorded by the thermocouples in the system with only FHS is higher compared to the system with FHS-FSPCM. The difference between the temperature of the thermocouples in both systems is wider at higher power value. The melting temperature of FSPCM could not be reached at the power supply of 10 and 20 W. In the first 200 min and power supply of 10 W, the temperature distribution curve of FHS-FSPCM is only slightly lower than the FHS because FSPCM provides cooling by absorbing heat from its surrounding in the form of sensible heat [33]. In between 200 and 400 min and heating power of 20 W, the temperature difference between the FHS and FHS-FSPCM became more prominent due to the larger sensible heat energy storage by the FSPCM as temperature of the FHS rises [34]. During this time period, the absorbed heat is stored by the change in temperature of storage medium. The amount of stored heat is proportional to the temperature rise [35]. The temperature distribution curve of FHS-FSPCM grows closer towards the FHS’s curve when approaching steady-state conditions, indicating that the FSPCM’s sensible heat storage capability had reduced.
When heating power was increased to 30 W from 400 to 600 min, the temperature distribution curve for FHS-FSPCM slightly flattened from 408 to 420 min, which differs from the curve obtained by the FHS as it increases rapidly. FSPCM was heated beyond its melting point and absorbed thermal energy in the form of latent heat during the phase transformation from solid into a liquid state. The difference between the FHS and FHS-FSPCM’s curves remained consistent until the steady-state condition, due to the larger latent heat storage capacity of FSPCM as shown in Table 1 [36,37]. Thus, FSPCM could absorb more waste heat energy from PV panel.
Throughout the experiment, FHS-FSPCM successfully maintained its surface temperature to be much lower compared to the FHS. This finding affirms the capability of FSPCM to store thermal energy in the form of sensible and latent heat. Thus, FHS-FSPCM provides better cooling performance than the FHS system.
Table 4 summarizes the average temperature recorded by thermocouples at the heated surface, top of FHS surface, and fin of the FHS and their temperature difference for the FHS and FHS-FSPCM at a steady state. The FHS-FSPCM managed to reduce the temperature by 11.43% at the heated surface and 22% at the top of FHS surface and fin of the FHS when the power supplied was 10 W. Temperature reduction at the heated surface of the FHS was smaller compared to top of the FHS surface and fin of the FHS because they were nearest to the heating source. Thermal energy at the top of the FHS surface and fin of the FHS can be easily dissipated into the environment. When continuous power supply increased to 20 W, FSPCM reduces Ths by 8% while Tf and Tfin by 16%. Meanwhile, when power supply increased to 30 W, Ths reduced by 11% while Tf and Tfin by 17%.

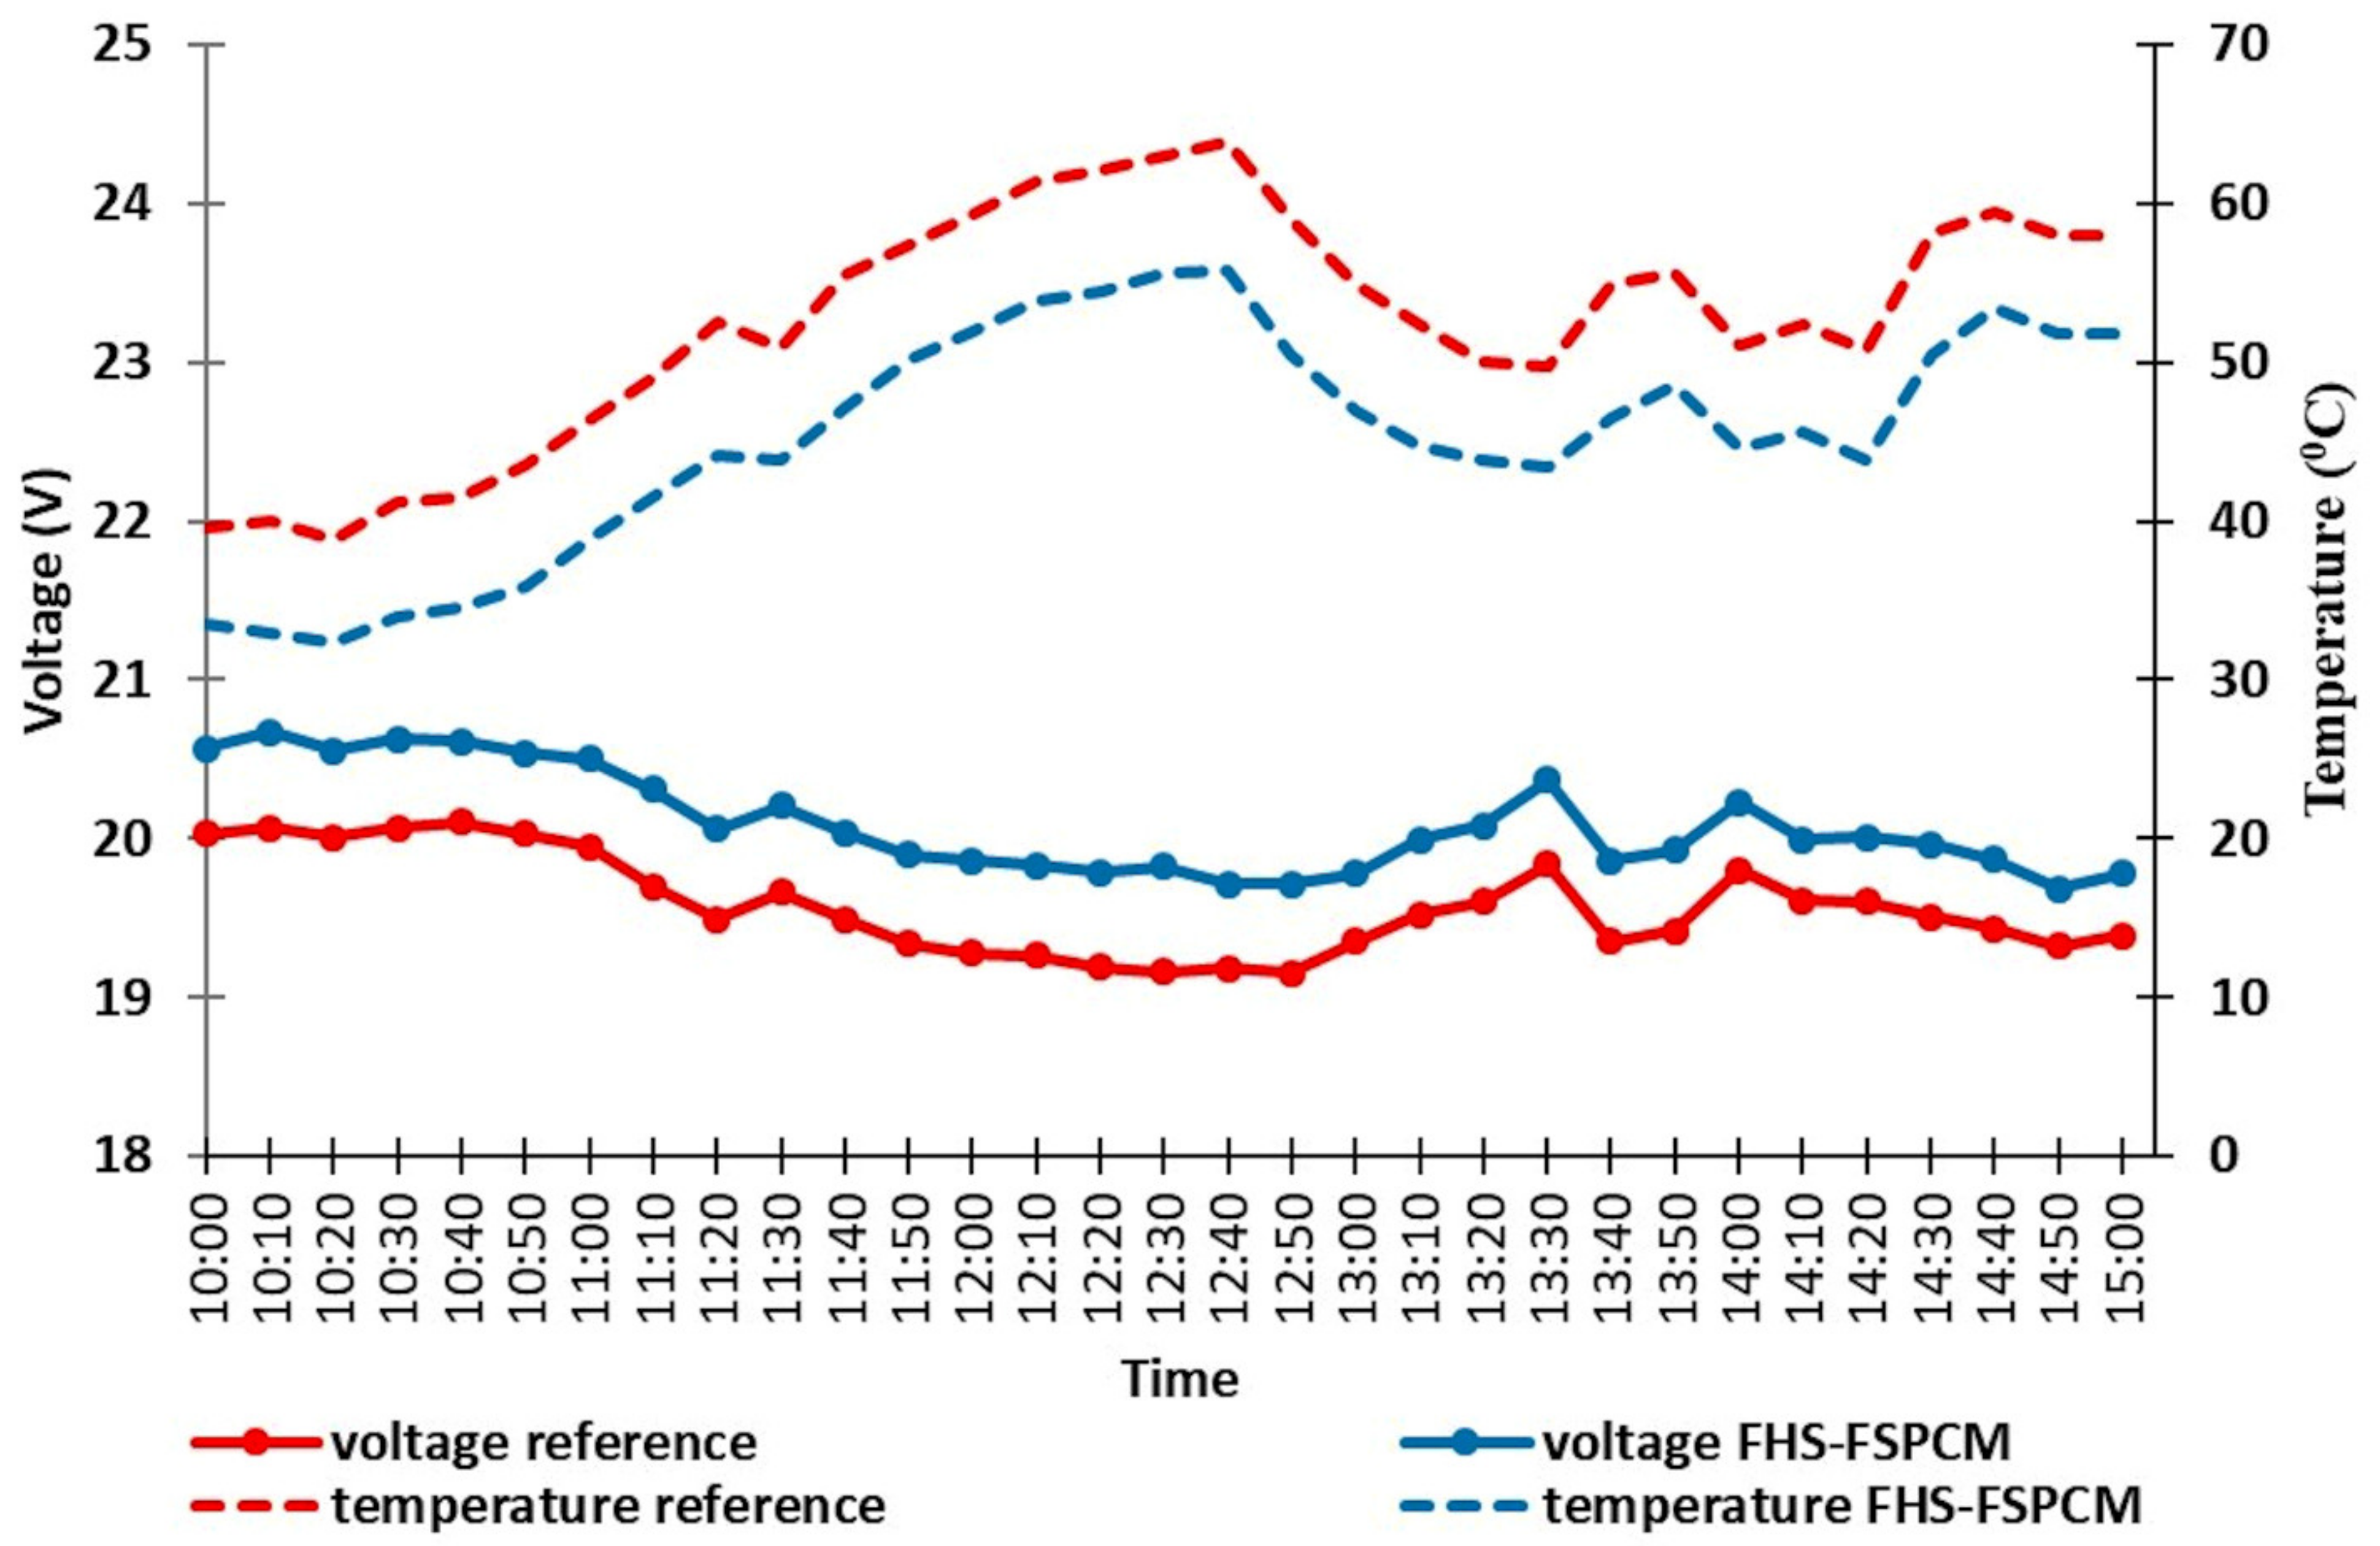
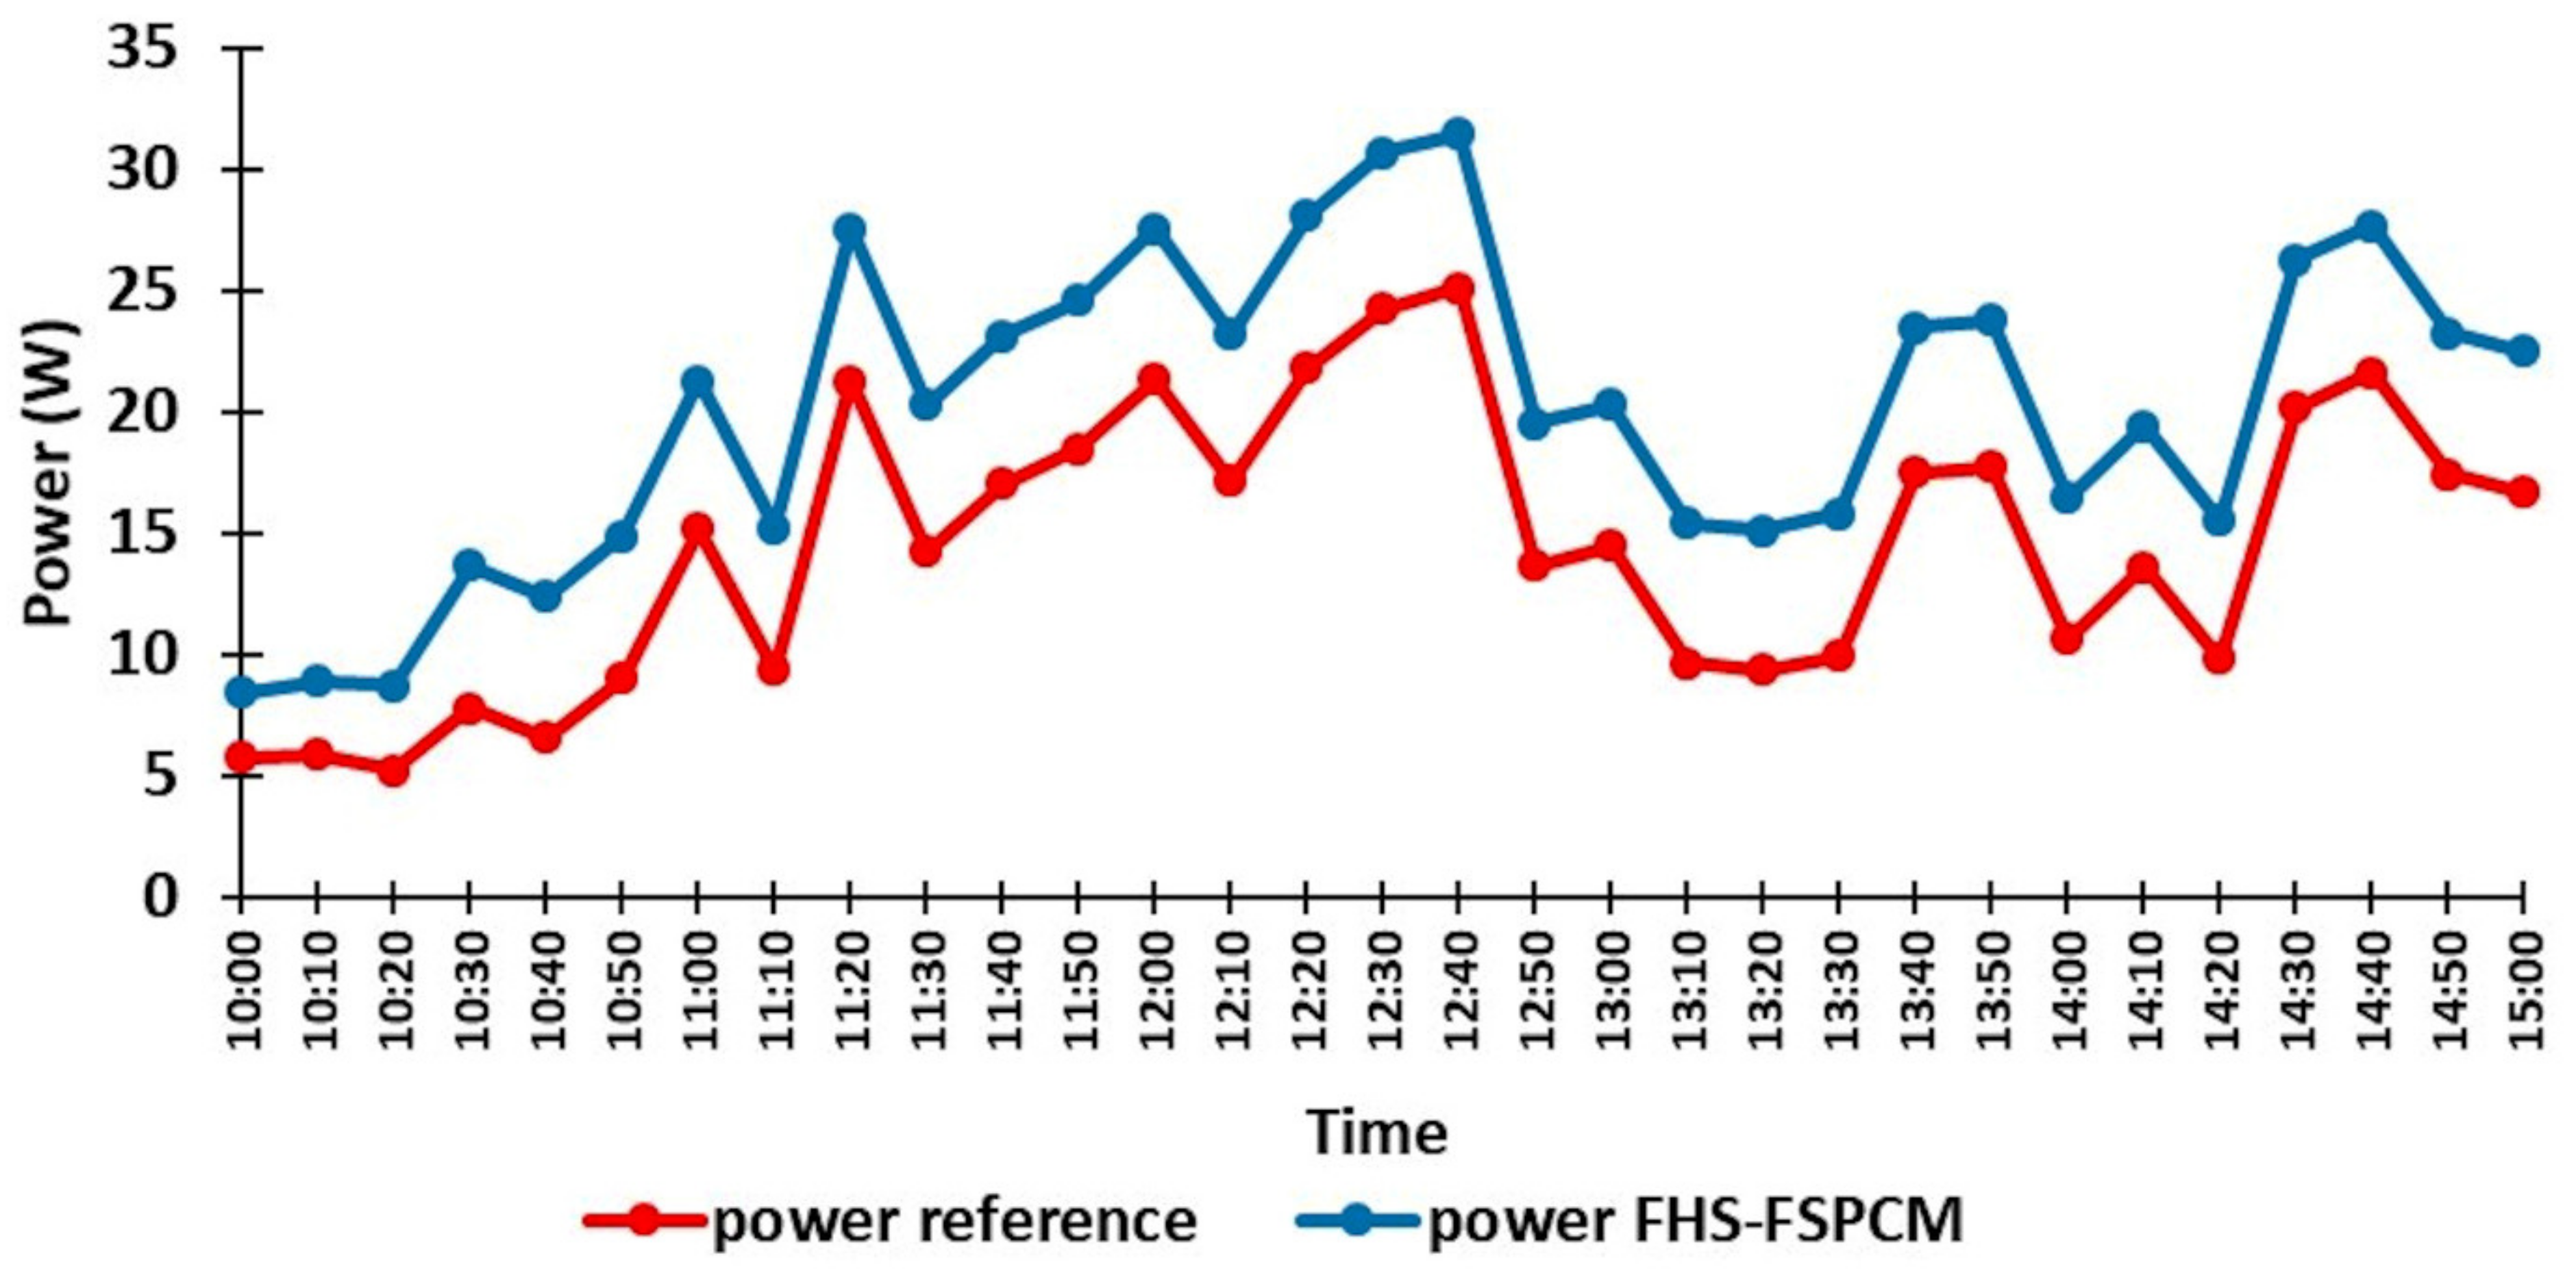
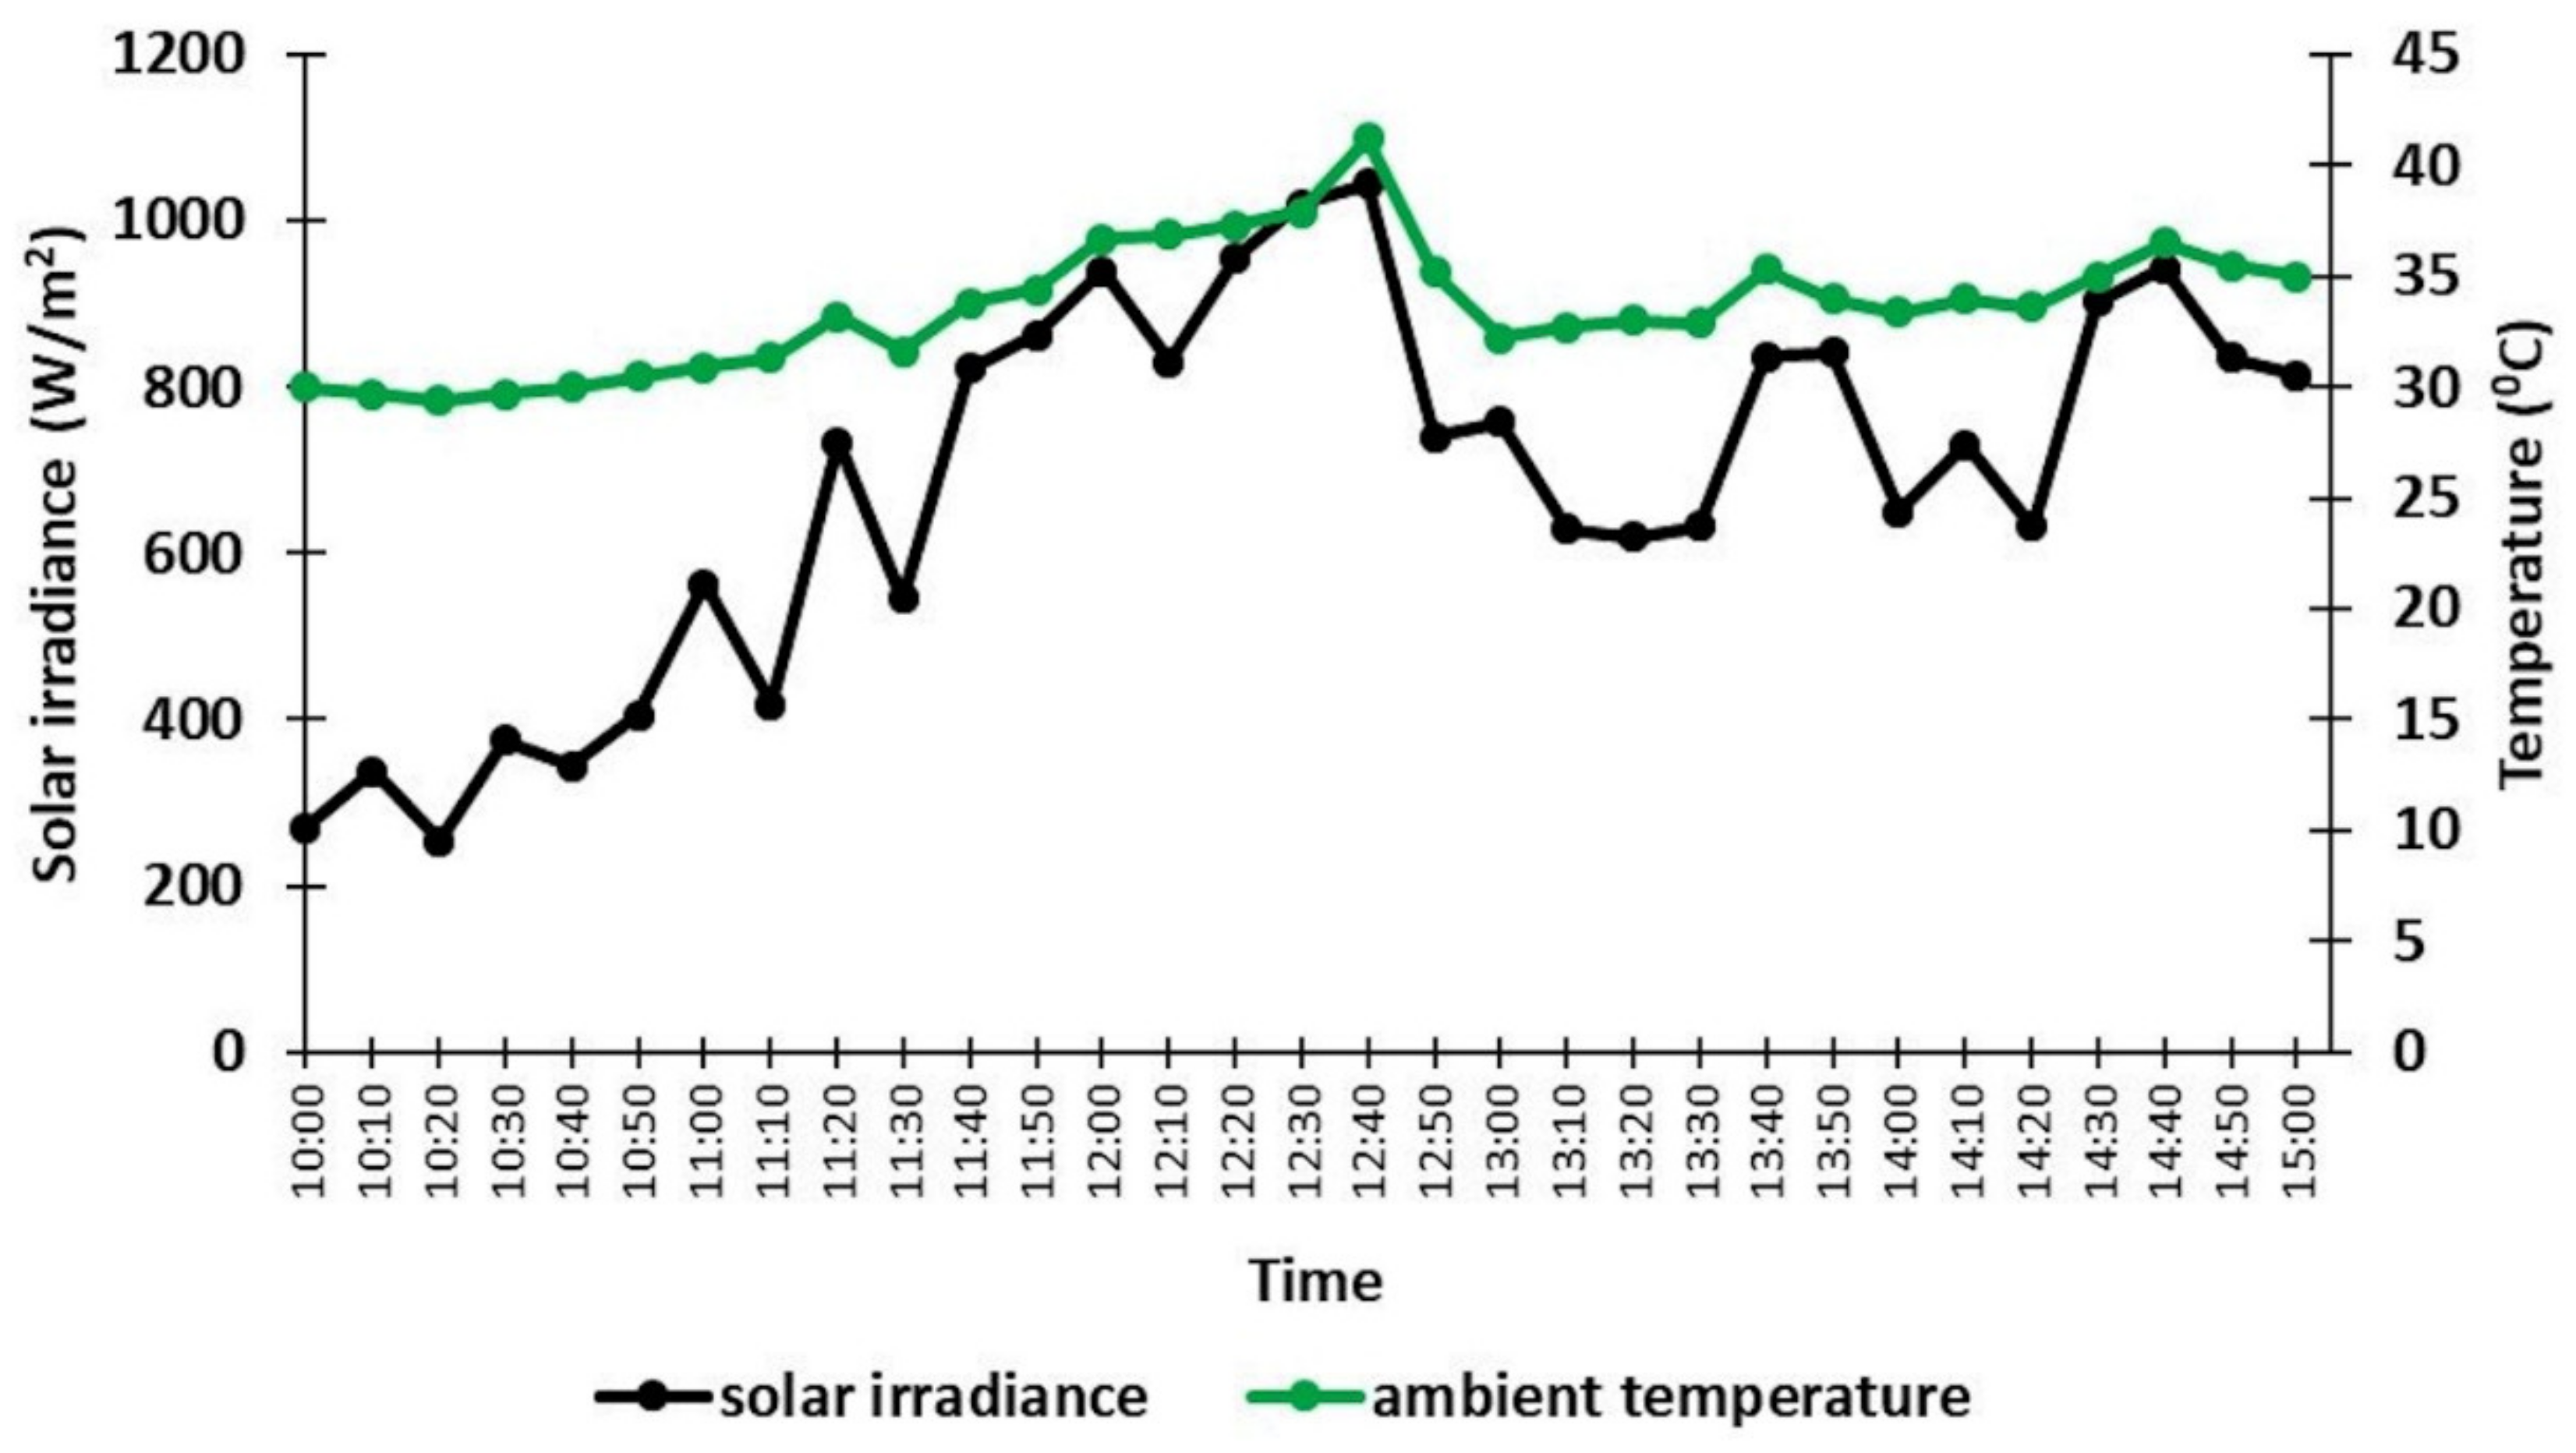
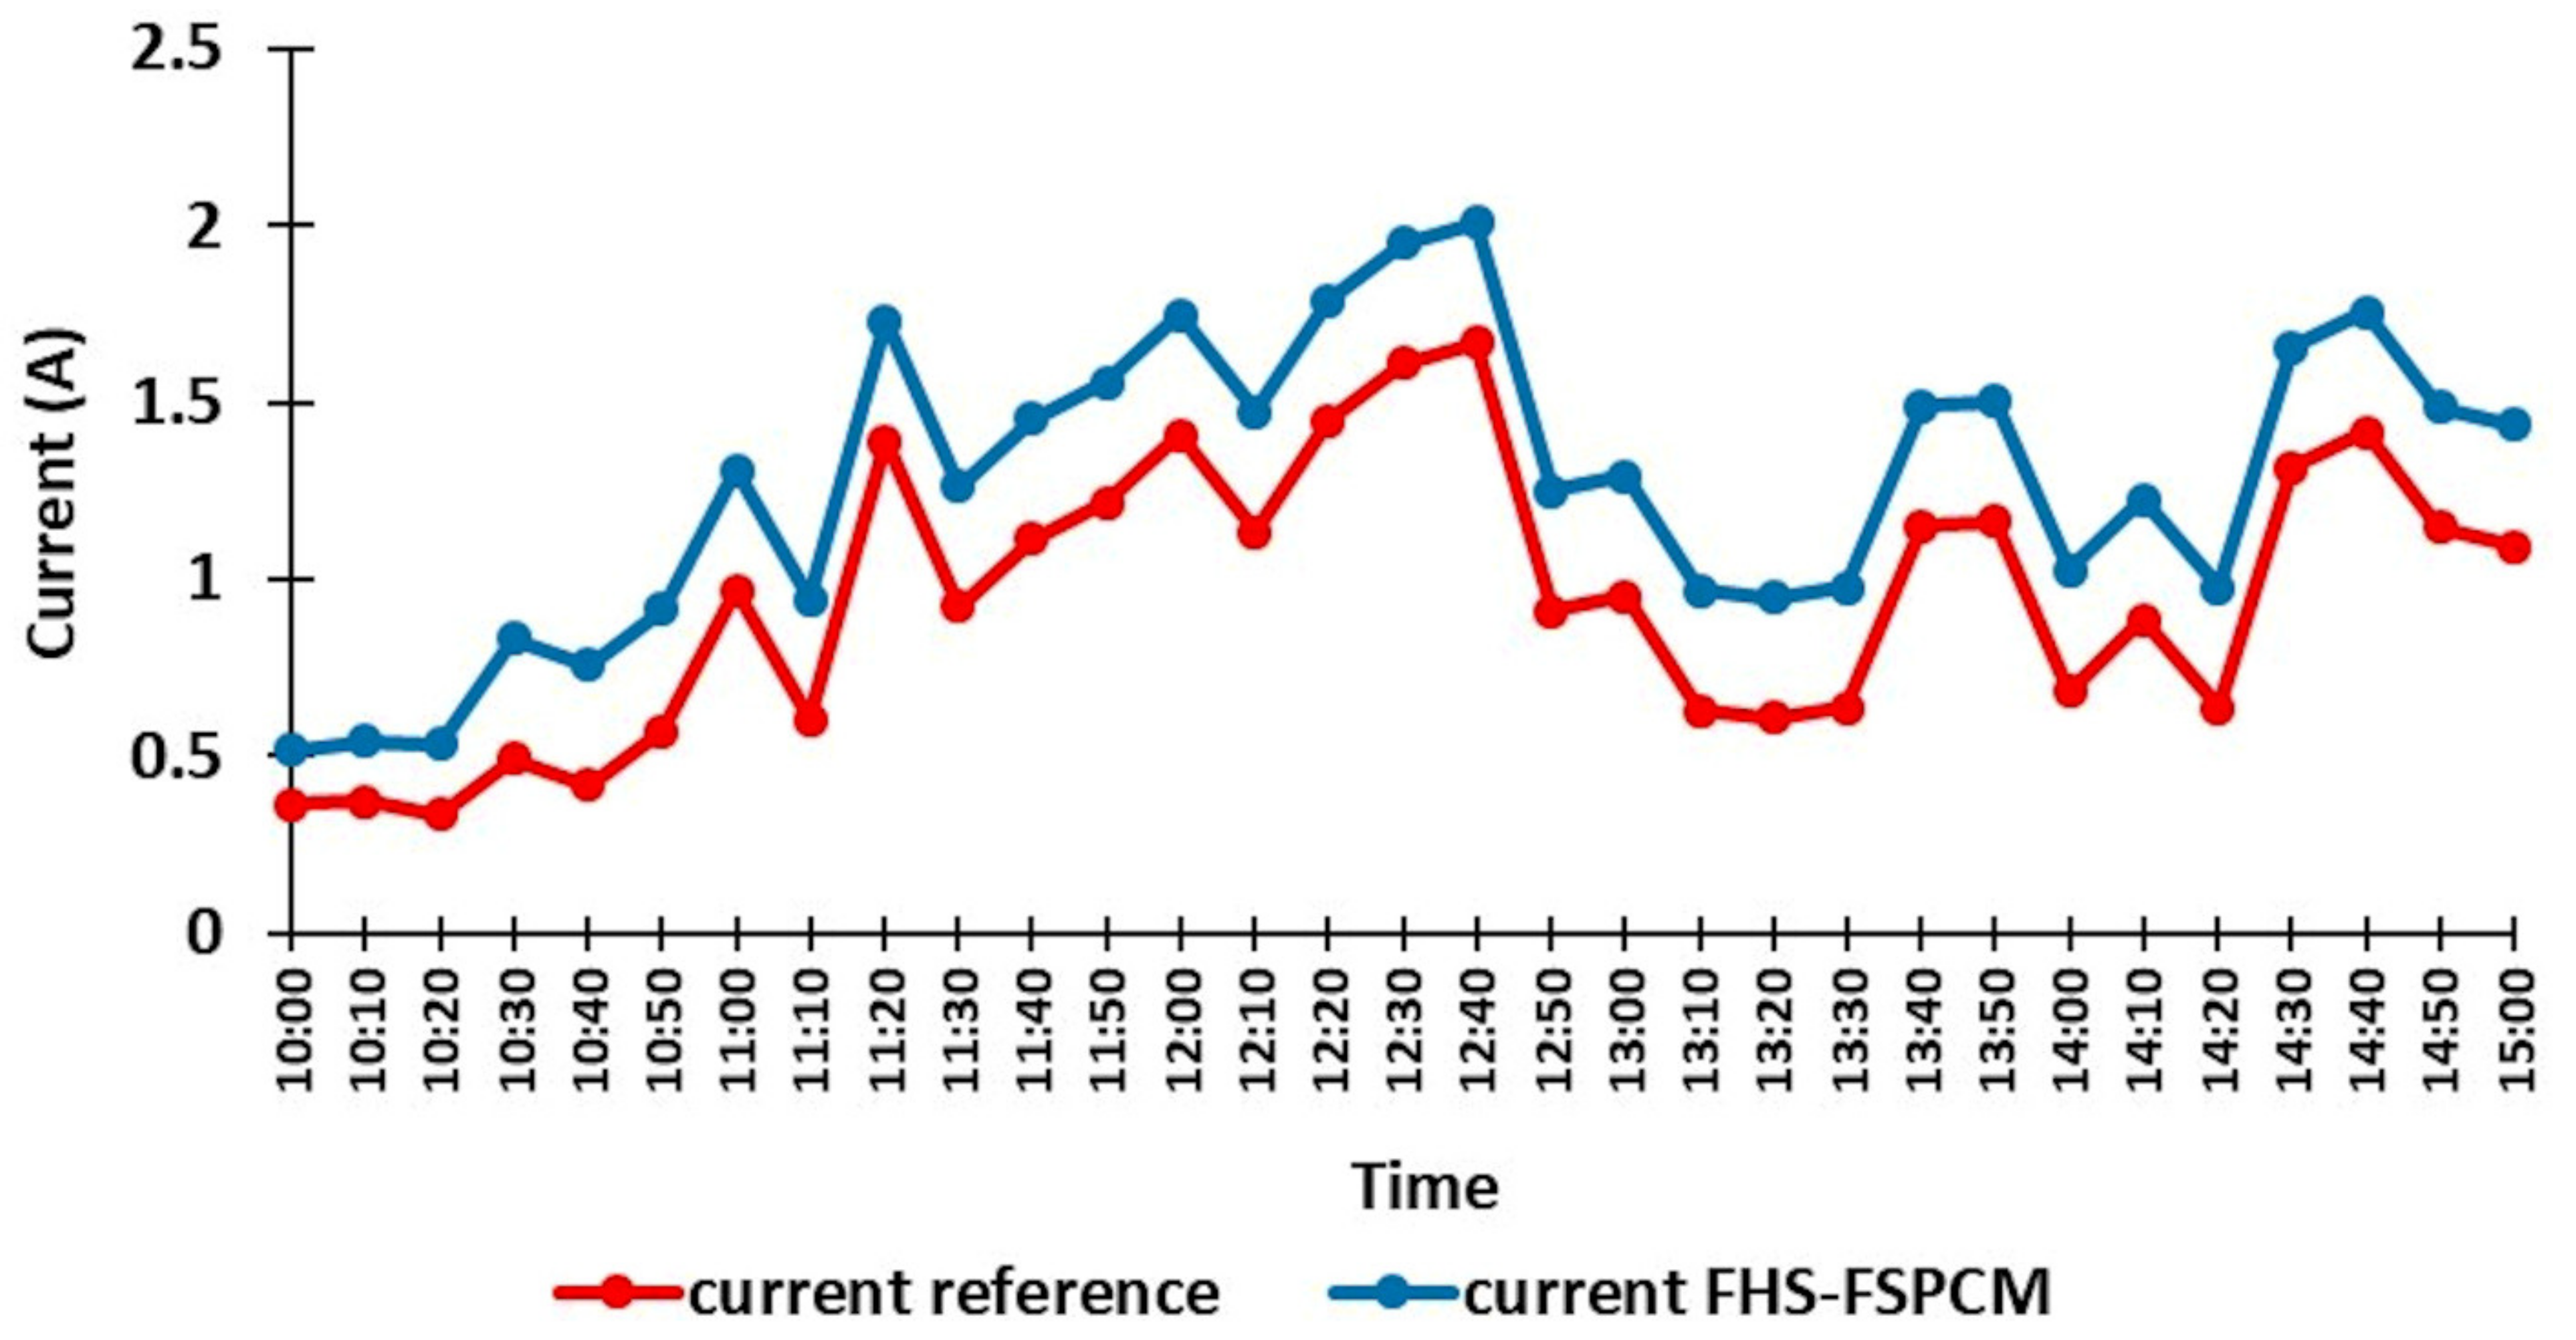
3.2. Application of FHS-FSPCM on Photovoltaic Panel

Two monocrystalline PV panels, integrated with and without a cooling system, were employed to determine their maximum output power generated. The first panel was utilized as a reference (bare panel) and another panel was integrated with FHS-FSPCM. Figure 8 shows the details of solar irradiance and ambient temperature over time. The average solar irradiance and ambient temperatures were reported as 686.7505 W/m2 and 33.6 °C, respectively. Solar irradiance and the ambient temperature reached its peak at 12.40 pm. with 1043.75 W/m2 and 41.2 °C, respectively. Ambient temperature registered an increasing trend with increasing solar irradiance.
Figure 9 displays the surface temperature and voltage against time for reference and FHS-FSPCM integrated PV panel. FSPCM managed to keep the temperature of the PV panel lower than the reference panel by minimum temperature difference of 4 °C and maximum temperature difference of 15 °C, as shown in Figure 10a. Furthermore, the temperature distribution curve for FHS-FSPCM was flattened from 12.30 to 12.40 p.m., indicating the storage of thermal energy in the form of latent heat by the FSPCM. The heat from PV panel was transferred to the FSPCM by conduction and regulated by the FHS [24]. The temperature of PV panel is one of the most important factors that influences the energy conversion efficiency of PV panel, and the efficiency of PV panel is a decreasing function of temperature [38,39].
Average voltage output by the bare PV panel and FHS-FSPCM were recorded as 19.61 and 20.28 V, respectively. The average voltage output of the solar panel with FHS-FSPCM was increased by 3.41%. Maximum voltage output by bare solar module was 20.1 V and the minimum voltage output was 19.10 V. Meanwhile, for the solar module with FHS-FSPCM, the maximum voltage output recorded was 20.86 V and the minimum voltage output was 20.10 V. FSPCM exhibited a lower melting temperature than the PV panel surface temperature at peak solar irradiance time which leads to melting of FSPCMs and latent heat absorption. More heat is continuously absorbed into the FSPCM from the PV panel surface, which then causes a continuous cooling effect on the PV panel. The heat absorbed by FSPCM could be released through convention to the air surrounding the system. Due to this phenomenon, a higher voltage output between 11.20 a.m. to 12.30 p.m. is observed in this work.
When the temperature of PV panel increases, the bandgap in PV cell will reduce, thus the energy of electrons in the material will increase, and the increase in temperature of PV cell will influence the open circuit voltage. The open circuit voltage is dependent on an intrinsic carrier concentration for silicon, which then depends on the bandgap energy. Higher temperatures, reduce bandgap, cause higher intrinsic carrier concentrations and lower voltage output by panels. The differences in voltage values are shown in Figure 10b.
Current generated by PV modules against time was plotted in Figure 11; the average current output by reference solar panel was 0.98 A and panel with FHS-FSPCM was 1.29 A. The average current generated by the solar module integrated with FHS-FSPCM increased by 31.635%. The bare module has a maximum and minimum current output of 1.80 and 0.38 A, respectively. For the module with FHS-FSPCM, it recorded maximum and minimum current of 2.10 and 0.52 A, respectively. The current generation pattern is very much similar to solar irradiance pattern as shown in Figure 8, indicating that solar irradiance has a direct influence on the current generation. Theoretically, the short circuit current generated in PV cell should increase slightly when temperature increases since the bandgap energy decreases and more photons have enough energy to create e-h pair. However, in this work, the voltage and current was measured concurrently during the field-testing and both value increases with incorporation of FHS-FSPCM. This finding needs further investigation and might be associated with heat being stored in FSPCM at the rear part of the PV module instead of being extracted completely from the system. Further, it is noteworthy that, in most of the reported PV cooling work, current values are not being presented [38]. The difference in current outputs between the reference PV panel and PV panel with FHS-PCM are shown in Figure 10c.
Figure 12 shows the maximum power output generated by the PV panels against time. The average power output produced by bare and FHS-FSPCM modules was 14.79 and 20.50 W, respectively. The power output produced by the solar module with FHS-FSPCM has increased by 38.61%. The bare module has a maximum and minimum power of 25.13 and 6.25 W, respectively, while the module with FHS-FSPCM has maximum and minimum power of 33.23 and 8.44 W. The power differences between reference panel and PV panel with FHS-PCM are shown in Figure 10d. The power output increases because FHS-FSPCM can maintain PV panel at constant temperature for a long time and delays panel temperature rise. The latent heat absorbed by the FSPCM will be released to environment through convention completely during nighttime and cause solidification of FSCPM again.
Many other methods are also being employed to contain PCM and resolve problems such as leakage, which leads to corrosions of the PV module. An attempt was made to fill commercial PCMs into copper tubes in order to contain the PCM and increase the area of exposed surface for heat dissipation. This approach results in a PV panel temperature reduction of between 6.4 °C and 7.5 °C, but only increases electrical power output by 4.19% [40,41,42].
High solar irradiance causes an increase in the surface temperature of the PV panel, but FSPCM managed to keep the average temperature of the PV panel lower by 4 to 15 °C as compared to the panel without a cooling system. Moreover, higher solar irradiance causes the PV panel to generate a lower voltage output, but obtains a higher current output. The maximum power output generated by the PV panel is higher when the surface temperature of the PV panel is low.
Table 5 shows comparison between current work and other researchers’ work in terms of FSPCM properties and their cooling performance on the PV panel. FSPCM utilized in the present study has a larger heat storage capacity than the FSPCM used in other works of literature due to the formation of thin and compact coating. Thus, the average operating temperature of the panel was effectively reduced between 4 to 15 °C, while other research works reported less than a 5 °C reduction. Furthermore, the maximum power output recorded by the current study is higher than the others due to the lower operating temperature of PV panel. Besides, the FHS container plays a crucial role in increasing the heat absorption rate of FSPCM because of their high thermal conductivity. Indeed, the FHS also helps FSPCM to dissipate heat more efficiently.

4. Conclusions

In this work, the cooling capability of FSPCM was determined via preliminary indoor setup, whereby the temperature distribution curve of FHS-FSPCM was consistently kept below the FHS’s curve. The test also confirms that FSPCM absorbs and stores heat in the form of sensible and latent heat. Field-testing demonstrates that the temperature of the PV panel increases with increasing solar irradiation. FSPCM successfully cooled the PV panel by showing a temperature reduction of between 4 to 15 °C during the testing period. The maximum power output produced by the PV panel fixed with FHS-FSPCM increases by 38.61 % as compared to the reference panel. However, the increment of current measured directly from the PV panel needs to be further investigated.

Author Contributions

Conceptualization, Y.M. and S.S.; methodology, Y.M.; software, Y.M. and J.W.L.O.; validation, Y.M., S.S., M.A. and M.K.; formal analysis, Y.M.; investigation, S.S.; resources, S.S.; data curation, Y.M.; writing—original draft preparation, Y.M. and S.S.; writing—review and editing, M.K. and J.W.L.O.; visualization, M.A.; supervision, M.A.; project administration, Y.M.; funding acquisition, Y.M. and M.A. All authors have read and agreed to the published version of the manuscript.

Funding

This research was funded by Universiti Tunku Abdul Rahman Research Fund, grant number (UTARRF/2018-6200/Y56).

Data Availability Statement

The study did not report any data.

Acknowledgments

The authors extend their appreciation to the Universiti Tunku Abdul Rahman.

Conflicts of Interest

The authors declare no conflict of interest.

References

  1. Kafka, J.; Miller, M.A. A Climatology of Solar Irradiance and Its Controls across the United States: Implications for Solar Panel Orientation. Renew. Energy 2018, 125, 707–897. [Google Scholar] [CrossRef]
  2. Ali, H.M.; Mahmood, M.; Bashir, M.A.; Ali, M.; Siddiqui, A. Outdoor testing of photovoltaic modules during summer in Taxila, Pakistan. Therm. Sci. 2016, 20, 165–173. [Google Scholar] [CrossRef] [Green Version]
  3. Moh, T.S.Y.; Ting, T.W.; Lau, A.H.Y. ScienceDirect Graphene Nanoparticles (GNP) Nanofluids as Key Cooling Media on a Flat Solar Panel through Micro-Sized Channels. Energy Rep. 2020, 6, 282–286. [Google Scholar] [CrossRef]
  4. Almosni, S.; Delamarre, A.; Jehl, Z.; Suchet, D.; Giteau, M.; Behaghel, B.; Julian, A.; Tatry, L.; Wang, H.; Kubo, T.; et al. Material Challenges for Solar Cells in the Twenty- First Century: Directions in Emerging Technologies. Sci. Technol. Adv. Mater. 2018, 6996, 1–34. [Google Scholar] [CrossRef] [PubMed]
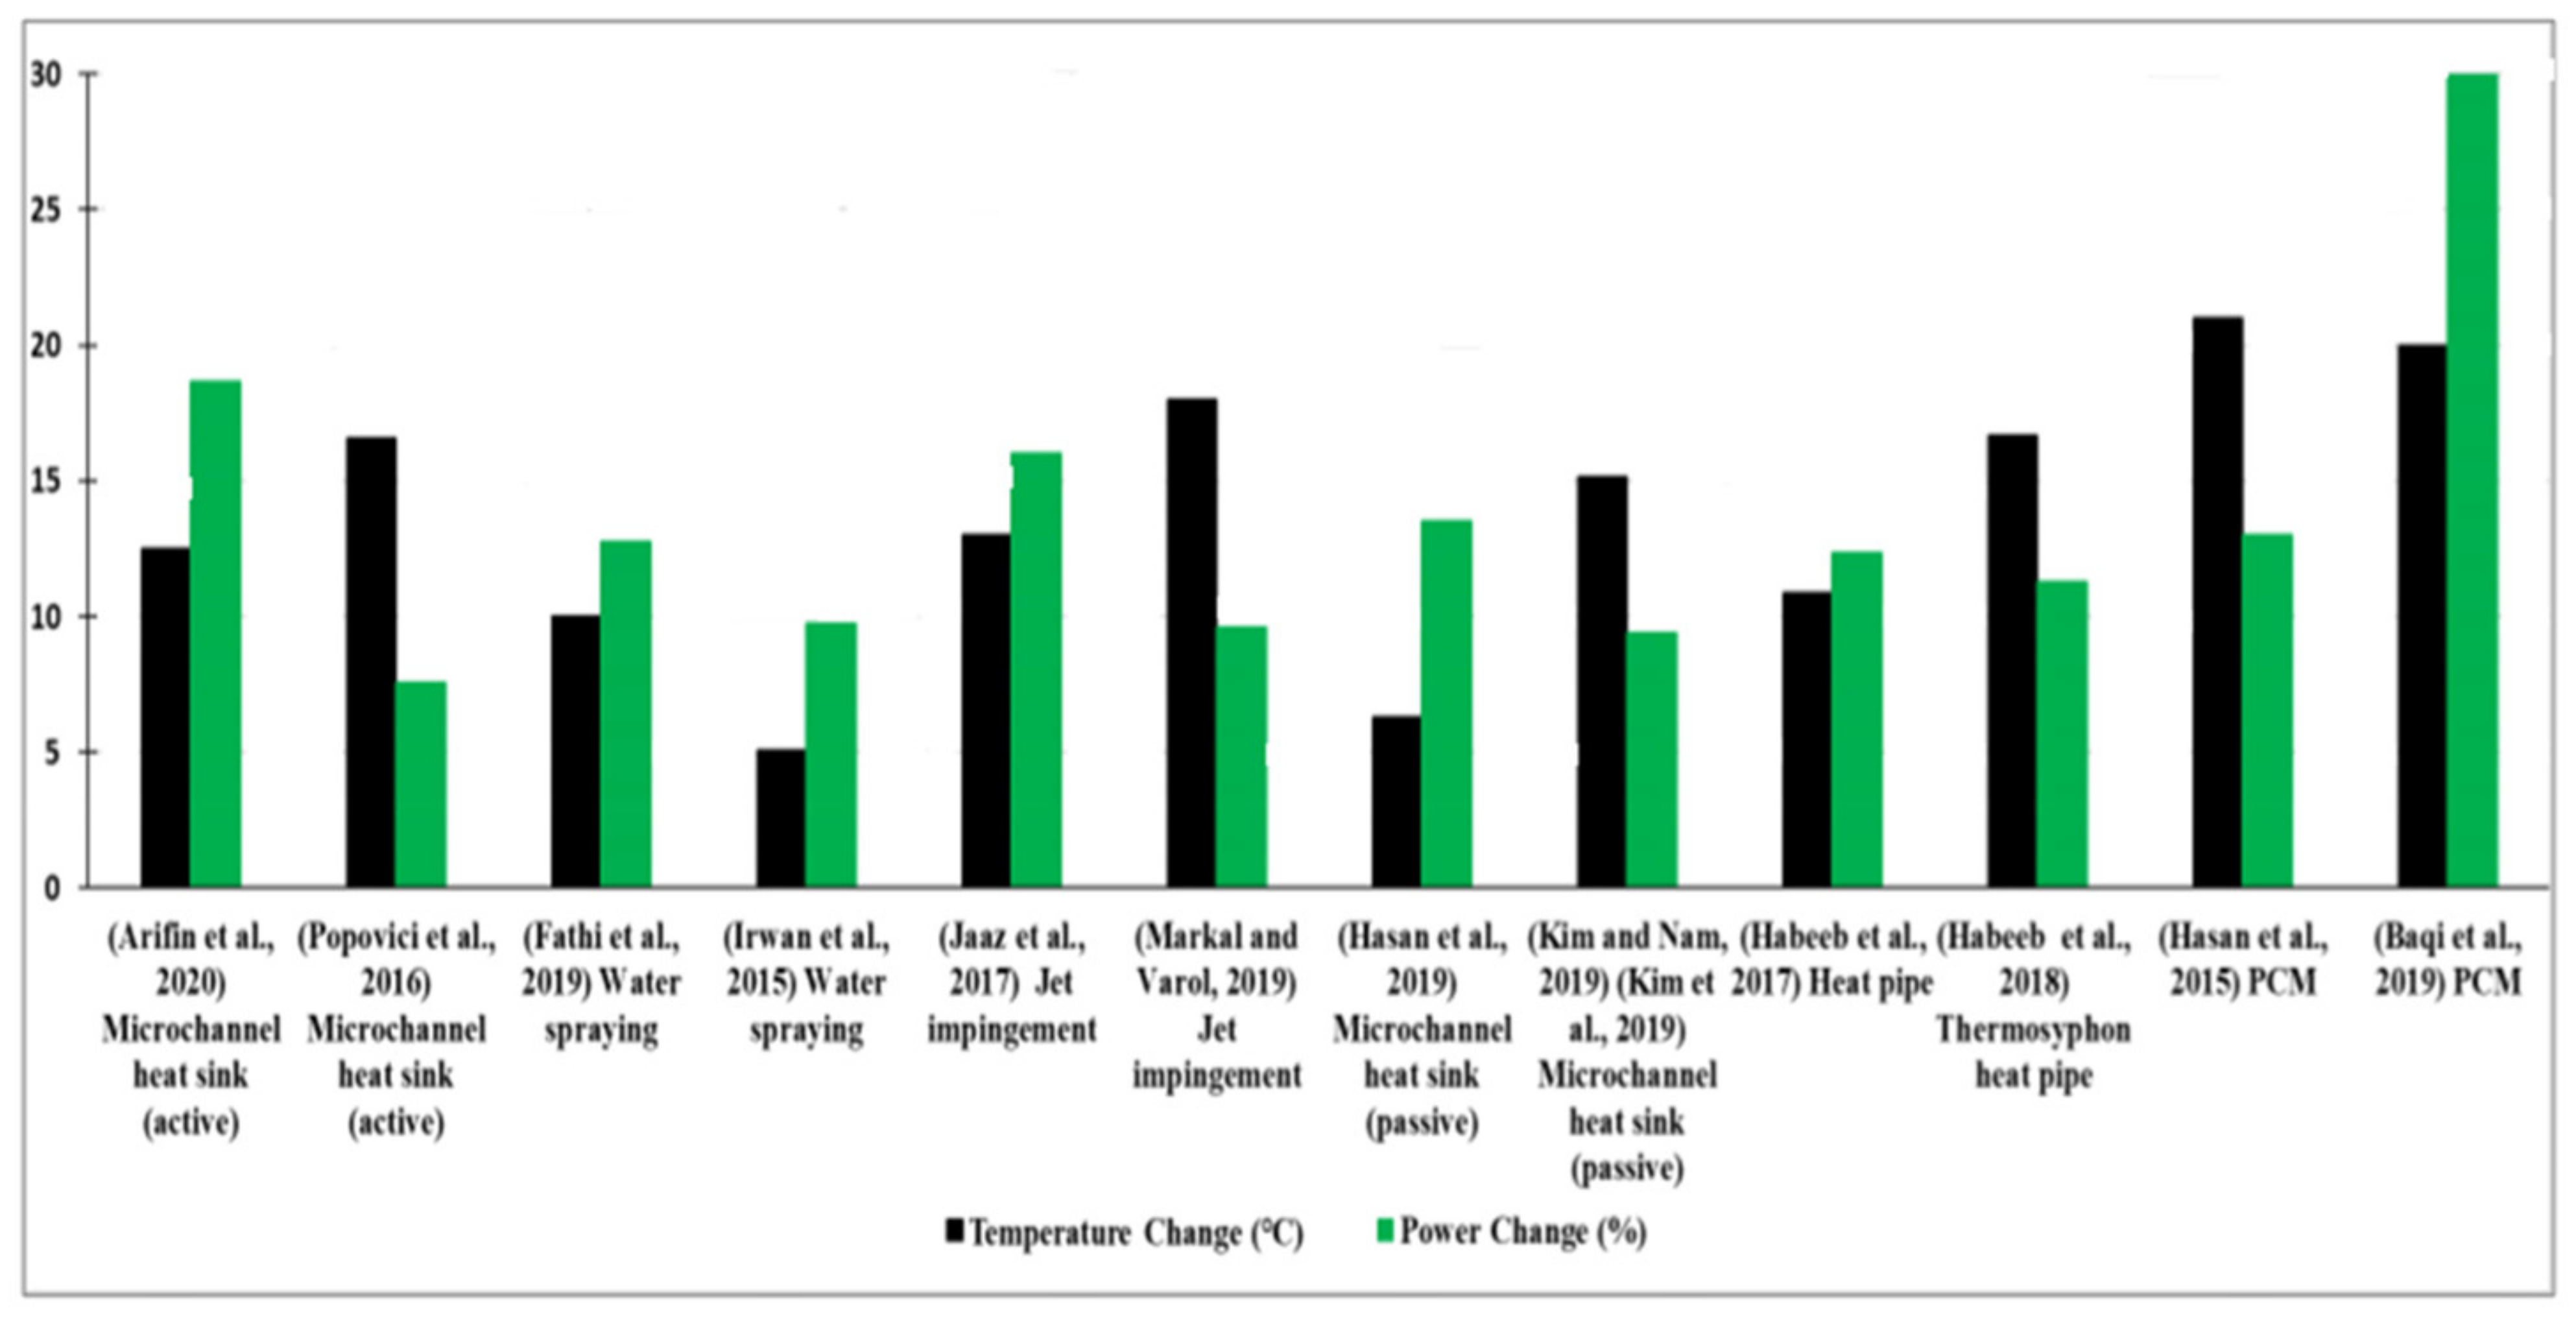
  5. Arifin, Z.; Tjahjana, D.D.D.P.; Hadi, S.; Rachmanto, R.A.; Setyohandoko, G.; Sutanto, B. Numerical and experimental investigation of air cooling for photovoltaic panels using aluminum heat sinks. Int. J. Photoenergy 2020, 2020, 1–9. [Google Scholar] [CrossRef]
  6. Popovici, C.G.; Hudişteanu, S.V.; Mateescu, T.D.; Cherecheş, N.C. Efficiency improvement of photovoltaic panels by using air cooled heat sinks. Energy Procedia 2016, 85, 425–432. [Google Scholar] [CrossRef] [Green Version]
  7. Fathi, M.; Abderrezek, M.; Djahli, F. Heating behavior of photovoltaic panels and front side water cooling efficiency. Appl. Sol. Energy 2019, 55, 327–339. [Google Scholar] [CrossRef]
  8. Irwan, Y.M.; Leow, W.Z.; Irwanto, M.; Amelia, A.R.; Gomesh, N.; Safwati, I. Indoor test performance of pv panel through water cooling method. Energy Procedia 2015, 79, 604–611. [Google Scholar] [CrossRef] [Green Version]
  9. Jaaz, A.H.; Hasan, H.A.; Sopian, K.; Kadhum, A.A.H.; Gaaz, T.S.; Al-Amiery, A.A. Outdoor performance analysis of a photovoltaic thermal (PVT) collector with jet impingement and compound parabolic concentrator (CPC). Materials 2017, 10, 888. [Google Scholar] [CrossRef] [Green Version]
  10. Markal, B.; Varol, R. The effect of jet impingement on the performance of a photovoltaic module. SETSCI Conf. Proc. 2019, 4, 647–650. [Google Scholar]
  11. Hasan, I.A.; Attar, D.A. Improved Photovoltaic Panel Performance Using a Cylindrical Pin Fins as a Heat Sink. Univ. Thi-Qar J. Eng. Sci. 2019, 10, 84–97. [Google Scholar]
  12. Kim, J.; Nam, Y. Study on the cooling effect of attached fins on PV using CFD simulation. Energies 2019, 12, 758. [Google Scholar] [CrossRef] [Green Version]
  13. Habeeb, L.J.; Mutasher, D.G.; Ali, F.A.M.A. Solar panel cooling and water heating with an economical model using thermosyphon. Jordan J. Mech. Ind. Eng. 2018, 12, 189–196. [Google Scholar]
  14. Habeeb, L.J.; Mutasher, D.G.; Ali, F.A.M.A. Cooling photovoltaic thermal solar panel by using heat pipe at Baghdad climate. Int. J. Mech. Mechatron. Eng. 2017, 17, 171–185. [Google Scholar]
  15. Hasan, A.; McCormack, S.J.; Huang, M.J.; Sarwar, J.; Norton, B. Increased photovoltaic performance through temperature regulation by phase change materials: Materials comparison in different climates. Sol. Energy 2015, 115, 264–276. [Google Scholar] [CrossRef]
  16. Baqi, S.A.; Hassan, A.; Shah, A.H. Performance Optimization of Concentrated Photovoltaic-Thermal (CPV-T) System Employing Phase Change Material (PCM) in Hot Climate. In Renewable Energy and Sustainable Buildings; Springer: Cham, Switzerland, 2020; pp. 579–594. [Google Scholar]
  17. Siecker, J.; Kusakana, K.; Numbi, B.P. A Review of Solar Photovoltaic Systems Cooling Technologies. Renew. Sustain. Energy Rev. 2017, 79, 192–203. [Google Scholar] [CrossRef]
  18. Zhao, J.; Yang, Y.; Li, Y.; Zhao, L.; Wang, H.; Song, G.; Tang, G. Microencapsulated phase change materials with TiO2-doped PMMA shell for thermal energy storage and UV-shielding. Sol. Energy Sol. Cells 2017, 168, 62–68. [Google Scholar] [CrossRef]
  19. Zilio, C.; Righetti, G.; Mancin, S.; Hodot, R.; Sarno, C.; Pomme, V.; Tru, B. Active and Passive Cooling Technologies for Thermal Management of Avionics in Helicopters: Loop Heat Pipes and Mini-Vapor Cycle System. Therm. Sci. Eng. Prog. 2018, 5, 107–116. [Google Scholar] [CrossRef]
  20. Wang, H.; Zhao, L.; Chen, L.; Song, G.; Tang, G. Facile and Low Energy Consumption Synthesis of Microencapsulated Phase Change Materials with Hybrid Shell for Thermal Energy Storage. J. Phys. Chem. Solids 2017, 111, 207–213. [Google Scholar] [CrossRef]
  21. Koukou, M.K.; Vrachopoulos, M.G.; Tachos, N.S. Experimental and Computational Investigation of a Latent Heat Energy Storage System with a Staggered Heat Exchanger for Various Phase Change Materials. Therm. Sci. Eng. Prog. 2018, 7, 87–98. [Google Scholar] [CrossRef]
  22. Bland, A.; Khzouz, M.; Statheros, T.; Gkanas, E.I. PCMs for Residential Building Applications: A Short Future Development. Buildings 2017, 7, 78. [Google Scholar] [CrossRef] [Green Version]
  23. Vasu, A.; Hagos, F.Y.; Noor, M.M.; Mamat, R.; Azmi, W.H.; Abdullah, A.; Ibrahim, T.K. Corrosion e Ff Ect of Phase Change Materials in Solar Thermal Energy Storage Application. Renew. Sustain. Energy Rev. 2017, 76, 19–33. [Google Scholar] [CrossRef] [Green Version]
  24. Fang, Y.; Wei, H.; Liang, X.; Wang, S.; Liu, X.; Gao, X.; Zhang, Z. Preparation and Thermal Performance of Silica/n-Tetradecane Microencapsulated Phase Change Material for Cold Energy Storage. Energy Fuels 2016, 30, 9652–9657. [Google Scholar] [CrossRef]
  25. Senthilkumar, M.; Balasubramanian, K.R.; Kottala, R.K.; Sivapirakasam, S.P.; Maheswari, L. Characterization of Form-Stable Phase-Change Material for Solar Photovoltaic Cooling. J. Therm. Anal. Calorim. 2020, 141, 2487–2496. [Google Scholar] [CrossRef]
  26. Tangsiriratana, E.; Skolpap, W.; Patterson, R.J.; Sriprapha, K. Thermal Properties and Behavior of Microencapsulated Sugarcane Wax Phase Change Material. Heliyon 2019, 5, e02184. [Google Scholar] [CrossRef] [Green Version]
  27. Wu, D.; Wen, W.; Chen, S.; Zhang, H. Preparation and Properties of a Novel Form-Stable Phase Change Material Based on a Gelator. J. Mater. Chem. A Mater. Energy Sustain. 2015, 3, 2589–2600. [Google Scholar] [CrossRef]
  28. Wong, J.L.O.; Munusamy, Y.; Ong, K.S. Effect of Sulfur Addition into Nitrile Rubber Latex on Coating Performance of Phase Change Material. AIP Conf. Proc. 2019, 2157, 020047. [Google Scholar] [CrossRef]
  29. Huang, X.; Guo, J.; He, J.; Gong, Y.; Wang, D.; Song, Z. Novel Phase Change Materials Based on Fatty Acid Eutectics and Triallyl Isocyanurate Composites for Thermal Energy Storage. J. Appl. Polym. Sci. 2017, 134, 1–8. [Google Scholar] [CrossRef]
  30. Yew, G.Y.; Tham, T.C.; Law, C.L.; Chu, D.; Ogino, C.; Show, P.L. Emerging Crosslinking Techniques for Glove Manufacturers with Improved Nitrile Glove Properties and Reduced Allergic Risks. Mater. Today Commun. 2019, 19, 39–50. [Google Scholar] [CrossRef]
  31. Cheng, Z.; Yan, M.; Cao, L.; Huang, J.; Cao, X.; Yuan, D.; Chen, Y. Design of Nitrile Rubber with High Strength and Recycling Ability Based on Fe 3+ − Catechol Group Coordination. Ind. Eng. Chem. Res. 2019, 58, 3912–3920. [Google Scholar] [CrossRef]
  32. Paul, D.I. Experimental Characterisation of Photovoltaic Modules with Cells Connected in Different Configurations to Address Nonuniform Illumination Effect. J. Renew. Energy 2019, 2, 1–15. [Google Scholar] [CrossRef]
  33. Beemkumar, N.; Karthikeyan, A.; Manoj, A.; Keerthan, J.S.; Stallan, J.P.; Amithkishore, P. Investigation of Sensible and Latent Heat Storage System Using Various HTF. IOP Conf. Ser. Mater. Sci. Eng. 2017, 197, 012038. [Google Scholar] [CrossRef] [Green Version]
  34. Reddy, K.S.; Mudgal, V.; Mallick, T.K. Review of Latent Heat Thermal Energy Storage for Improved Material Stability and Effective Load Management. J. Energy Storage 2018, 15, 205–227. [Google Scholar] [CrossRef]
  35. Zavrl, E.; Stritih, U. Improved thermal energy storage for nearly zero energy buildings with PCM integration. Sol. Energy 2019, 190, 420–426. [Google Scholar]
  36. Kiwan, S.; Ahmad, H.; Alkhalidi, A.; Wahib, W.O.; Al-Kouz, W. Photovoltaic Cooling Utilizing Phase Change Materials. In E3S Web of Conferences; EDP Sciences; ICRET 2020: Perth, Australia, 2020; Volume 160, p. 02004. [Google Scholar]
  37. Ghosal, J. Thermal Management of Photovoltaic Panel Using PCM for Improved Efficiency and Power Output. Ph.D. Thesis, University of Windsor, Windsor, ON, Canada, 2019; 197p. [Google Scholar]
  38. Ali, H.M. Recent advancements in PV cooling and efficiency enhancement integrating phase change materials based systems–A comprehensive review. Sol. Energy 2020, 197, 163–198. [Google Scholar] [CrossRef]
  39. Ciulla, G.; Lo Brano, V.; Franzitta, V.; Trapanese, M. Assessment of the operating temperature of crystalline PV modules based on real use conditions. Int. J. Photoenergy 2014, 2014, 1–11. [Google Scholar] [CrossRef] [Green Version]
  40. Osma-Pinto, G.; Ordóñez-Plata, G. Dynamic thermal modelling for the prediction of the operating temperature of a PV panel with an integrated cooling system. Renew. Energy 2020, 152, 1041–1054. [Google Scholar] [CrossRef]
  41. Smith, M.K.; Selbak, H.; Wamser, C.C.; Day, N.U.; Krieske, M.; Sailor, D.J.; Rosenstiel, T.N. Water cooling method to improve the performance of field-mounted, insulated, and concentrating photovoltaic modules. J. Sol. Energy Eng. 2014, 136, 034503. [Google Scholar] [CrossRef]
  42. Bayrak, F.; Oztop, H.F.; Selimefendigil, F. Experimental study for the application of different cooling techniques in photovoltaic (PV) panels. Energy Convers. Manag. 2020, 212, 112789. [Google Scholar] [CrossRef]
Figure 1. Temperature and power output change data from various cooling systems.
Energies 14 06860 g001
Figure 2. The dimension of machined FHS and thermocouples positioning.
Energies 14 06860 g002
Figure 3. The dimension of machined FHS-FSPCM and thermocouples positioning.
Energies 14 06860 g003
Figure 4. The schematic diagram of experimental setup for preliminary assessment.
Energies 14 06860 g004
Figure 5. The schematic diagram of experimental setup for application of FHS-FSPCM on PV panel.
Energies 14 06860 g005
Figure 6. Outdoor PV panel setup for cooling performance study.
Energies 14 06860 g006
Figure 7. Temperature distribution curve of FHS and FHS-FSPCM with different power supply.
Energies 14 06860 g007
Figure 8. Solar irradiance and ambient temperature.
Energies 14 06860 g008
Figure 9. Surface temperature and voltage against time for PV panel with an FHS and FHS-FSPCM.
Energies 14 06860 g009
Figure 10. The differences of: (a) temperature, (b) voltage, (c) current, and (d) power between reference PV panel and FHS-FSPCM.
Energies 14 06860 g010
Figure 11. Current generation against time for PV panel with an FHS and FHS-FSPCM.
Energies 14 06860 g011
Figure 12. Power output against time for PV panel with FHS and FHS-FSPCM.
Energies 14 06860 g012
Table 1. Properties of materials employed in the present study.
MaterialSpecific Heat (kJ/kgK)Latent Heat of Melting (J/g)Melting Point (°C)Latent Heat of Freezing (J/g)Freezing Point (°C)
FSPCM3.01130.30 ± 1.2954.60 ± 0.08129.95 ± 1.2150.51 ± 0.08
Aluminum0.88399.90660.3--
Polyurethane foam insulator1.50----
Table 2. Properties of PV Panel.
ParameterValue
Maximum power39.25 W
Maximum current2.05 A
Maximum voltage19.15 V
Short circuit current2.18 A
Open circuit voltage22.89 V
Fill factor0.79
Table 3. Temperature of Thermocouples when Reaching a Steady-State Condition.
Heat SinkPower (W)Temperature of Thermocouples (°C)
T1T2T3ThsT4T5T6TfsT7T8T9Tfin
FHS1038.738.638.338.538.338.238.238.238.238.138.138.1
2053.653.453.553.553.052.953.053.052.952.952.852.9
3069.068.568.768.767.968.067.968.067.967.767.767.8
FHS-FSPCM1034.234.433.834.129.829.729.729.729.729.729.629.7
2049.549.249.049.244.444.444.344.444.244.344.244.2
3061.361.060.861.056.456.456.356.456.256.356.256.3
Table 4. Temperature comparison between a system with an FHS and FHS-FSPCM when reaching a steady-state condition.
PowerTemperature of Thermocouples (°C)Difference Percentage (%)
TaverageWithout FSPCMWith FSPCMDifference
10 WThs38.534.14.411.43
Tf38.229.78.522.25
Tfin38.129.78.422.05
20 WThs53.549.24.38.04
Tf53.044.48.616.23
Tfin52.944.28.516.07
30 WThs68.761.07.711.21
Tf68.056.411.617.06
Tfin67.856.311.516.96
Table 5. Comparison Between Current Work and Other Researchers’ Work on PV Cooling Using FSPCM.
No.FSPCM (PCM/Supporting Material)FSPCM PropertiesPV CoolingReference
Melting Point (°C)Latent Heat of Melting (J/g)Freezing Point (°C)Latent Heat of Freezing (J/g)Reduction of PV Panel’s Temperature (°C)Increment of Maximum Power Output Generation (%)
1.Myristic acid/cross-linked nitrile rubber54.60 ± 0.08130.30 ± 1.2950.51 ± 0.08129.95 ± 1.217.239.45Current study
2.Polyethylene glycol/expanded graphite 34.7125.97--4-6-25
3.Sugarcane wax-Al2O3 composite/gelatin-gum Arabic6268.0960.8353.773.87726
Publisher’s Note: MDPI stays neutral with regard to jurisdictional claims in published maps and institutional affiliations.

