Article

Determinants of the Energy Development Based on Renewable Energy Sources in Poland

by
Jan L. Bednarczyk
1,*,
Katarzyna Brzozowska-Rup
2 and
Sławomir Luściński
3
1
Department of Economic Policy and Banking, Faculty of Economics and Finance, Kazimierz Pułaski University of Technology and Humanities in Radom, Chrobrego 31, 26-600 Radom, Poland
2
Department of Economics and Finance, Faculty of Management and Computer Modelling, Kielce University of Technology, Aleja Tysiąclecia Państwa Polskiego 7, 25-314 Kielce, Poland
3
Department of Production Engineering, Faculty of Management and Computer Modelling, Kielce University of Technology, Aleja Tysiąclecia Państwa Polskiego 7, 25-314 Kielce, Poland
*
Author to whom correspondence should be addressed.
Energies 2021, 14(20), 6762; https://doi.org/10.3390/en14206762
Submission received: 31 August 2021 / Revised: 6 October 2021 / Accepted: 12 October 2021 / Published: 17 October 2021
(This article belongs to the Special Issue Sustainable Energy: Economy & Policy in Europe)

Abstract

:
In this article, we aim to identify the determinants that profoundly impact renewable energy sources development in Poland. To this end, the authors have conducted qualitative and quantitative analyses of Poland’s renewable energy sector. In this paper, we demonstrate an original approach considering the different development levels of the given sector across provinces (voivodeships). It uses panel data from the Local Data Bank of the Statistics Poland on electricity production from renewable energy sources in individual voivodeships in Poland from 2005 through 2019. The study confronts the results of previous studies and sheds light on the situation in Poland—specifically, upon the changes that have happened over the ten years (2010–2019). The qualitative analysis shows a negative correlation between energy consumption and the share of renewable energy sources in total energy production. Evidence shows that favorable changes are underway in the energy production structure: RES share is growing and by degrees satisfying energy demand, and there is growing potential of energy entities in Poland. Furthermore, the analysis shows that R&D and total expenditures on environmental protection and water management investments do not significantly affect the development of RES. A dynamic panel data model has been used to analyze the group and time effects on the dependent variable. The findings confirm the existence of the persistency effect and indicate positive effects of total installed electric capacity (IEC) and household electricity consumption (HEC). Nonhousehold electricity consumption (NHEC) has a negative effect on the endogenous variable, i.e., the renewable energy sources share in the gross final energy consumption (RESS). The research results may be applicable as recommendations for energy efficiency policy development based on renewable energy sources depending on the RES development level in the regions of Poland.

1. Introduction

The continuity of energy supply as an aspect of energy security is crucial for ensuring economic development and quality of life. Nevertheless, it cannot be ignored that the rapid development of world economies has been accompanied by irrational exploitation of natural resources, which, in turn, has caused severe disruption to the ecological balance and precipitated the depletion of nonrenewable resources. In addition, the emission of greenhouse gases (mainly carbon dioxide) has increased due to the combustion of fossil fuels, which causes a severe imbalance in the natural environment, such as the greenhouse effect. International organizations have been conducting numerous activities such as conferences and campaigns to promote energy from renewable sources to minimize the threats mentioned. One of the main goals of sustainable development (ecodevelopment) is running all business activity in harmony with nature without causing irreversible damage to it and in such a manner that meeting the needs of the present generation does not limit the perspectives for future generations [1].
Bearing in mind the importance of the use of renewable energy sources in meeting the needs of modern societies for electricity, we attempt to identify the factors that affect the share of renewable energy sources in the final energy consumption, and thus the factors determining the success/failure of measures taken at the international, national, and local levels to increase this share. Research on this subject is undertaken successively and published by numerous researchers and experts dealing with renewable energy issues. Characteristics of this particular research are as follows: (1) it concerns Poland, a member state of the European Union with a relatively fast-paced economic growth, which, however, has limited possibilities of implementing investments in renewable energy infrastructure (e.g., in wind farms); (2) it concerns a country that traditionally relies on hard coal and lignite resources for its energy and, in the coming decades, despite capital restrictions, will be forced to change the model of electricity supply completely; (3) it takes the territorial division of the country into 16 voivodeships into account, which allows one to capture the share of individual provinces in renewable energy sources (RES) development and to specify additional factors for the success of such a project.
In this paper, we aim to identify the determinants that profoundly impact total RES production share at individual voivodeships in total electricity consumption in Poland. The authors analyze Poland’s energy policy and diagnose the state of Poland’s renewable energy (RE) sector. The research covers two periods: 2005–2019 as a subject of qualitative analysis and 2010–2019 with applying quantitative analysis. The specific area of research, the periods covered by the analysis, and the research methodology have led to conclusions that may or may not correspond to the results obtained by other researchers but provide a broader perspective for analyzing and supporting national policies for RES development.

1.1. Literature Review

According to Directive 2009/28/EC of the European Parliament and of the Council of 23 April 2009 [2], “energy from renewable sources means energy from renewable non-fossil sources, namely wind, solar, aerothermal, geothermal, hydrothermal and ocean energy, hydropower, biomass, landfill gas, sewage treatment plant gas and biogases”.
In general, three approaches to modeling the processes that determine the importance of RES as an alternative source of energy can be distinguished in the literature on the subject. In particular, researchers focus on modeling:
  • The share of energy from renewable energy sources in the gross final energy consumption.
  • The relationship between renewable energy sources and economic growth.
  • Renewable energy consumption drivers.
Literature focusing on the share of RES in the gross energy consumption takes a wide array of factors that affect this share into account and considers various groups of countries but rarely pays attention to Poland exclusively. Methods employed to analyze renewables issues and the main findings in the reviewed literature are summarized in Table 1.
The advocates of RE point out that when calculating the costs of making the switch to renewable energy, its positive environmental and health benefits should be considered, unlike energy production from fossil fuels. The use of RES has numerous potential benefits, such as reducing greenhouse gases, diversification of energy supply and limited dependence on fossil fuels (especially natural gas and oil). RES development may play a crucial role in stimulating employment in the RE sector across the EU. Furthermore, RES offers a possibility of counteracting climate change and reducing dependence on energy imports. Instead of relying on large-scale power plants and high-voltage power grids, it allows for decentralized energy production. Renewable energy can be produced and consumed adjacent to the same household and generally enjoys greater social acceptability.
However, besides all the benefits of RES, there are certain drawbacks like high capital expenditure on installations, e.g., wind turbines, which demonstrate low efficiency when transforming mechanical energy into electricity [11]. Moreover, wind energy infrastructure may not be entirely environmentally neutral. For example, it should not be located close to households due to the level of noise the turbines produce (the 15 July 2016 act on investments stipulates a 1.5–2 km distance). Wind installations also threaten the local bird population, which may get trapped in the blades [19].

1.2. International RES Initiatives and Regulations

Decades-long scientific research conducted by national and international experts focusing on environmental degradation, mainly caused by increased production of electricity and the use of fuels in transport, gave rise to initiatives (also on a global scale) aimed at halting or even reversing adverse climate changes. For instance, for almost thirty years, the UN Climate Change Conference has brought together country leaders to define common priorities in overcoming global warming. Its main achievement so far has been the Paris Agreement (2015), referring to collaboration to hold “the increase in the global average temperature to well below 2 °C above pre-industrial levels and pursuing efforts to limit the temperature increase to 1.5 °C above pre-industrial levels” and to make “finance flows consistent with a pathway toward low greenhouse gas emissions and climate-resilient development” (Article 2) [20]. The UN Climate Change Conference of the Parties (COP26), scheduled for 31 October–12 November 2021 with the participation of over 190 country leaders, sets even more ambitious climate goals with its motto: “Secure global net-zero by mid-century and keep 1.5 degrees within reach” [21]. Furthermore, it introduces constantly pursuing the goals of reducing greenhouse gases emission and gradual withdrawal from coal power so that by 2050 less carbon is produced than taken out of the atmosphere. The recommended pathway to reach the goals are eliminating dependence on coal, curtailing deforestation, accelerating a switch to electric vehicles, and encouraging investment in renewables [21].
A crucial step toward decreasing reliance on fossil fuels is the agreement of G7 countries and the EU of May 2021 on ending international financing of carbon projects to ensure reaching the agreed climate targets. The parties agreed to halt direct government investment in unabated coal-fired power plants totally. In addition, the most developed countries agreed on accelerating the switch to zero-emission vehicles, advanced decarbonization of the energy sector by 2030, moving away from international funding of fossil fuels and meeting PAC targets [22].
Implementation of PAC provisions in the European Union is conducted under the scenario developed by the Climate Action Network (CAN) Europe and the European Environmental Bureau. By 2040, EU countries are expected to achieve 100% energy supply from renewables as a prerequisite for averting dangerous climate changes. The strategy is further developed from the 2009 EU leaders’ agreements, which stipulated 20% energy use from renewable sources within the EU by 2020. The 2018 target set for 2030 was to ensure 32% EU energy use from renewable sources. As much as the 2020 and 2030 goals seem likely, the 2040 objective appears uncertain mainly due to a significant financial barrier, e.g., Poland’s expenditure on wind installations. It is estimated that a 12 GW increase in wind energy production calls for a capital investment of 16 billion euros [22]. Purchasing expensive facilities to replace traditional fossil-based technology for generating energy from more advanced EU producers seems beyond the reach of some EU countries.
To reach out to the less prosperous community members, the Commission set up the Modernisation Fund, a funding mechanism to support the energy transition, which has been in force since September 2020 [23]. Its main aim is to assist Member States in modernizing their energy systems, improving energy efficiency, and meeting individual and community RE goals. The funding mechanism brings together the countries offering financial help with beneficiary countries, which agree for the new projects to be developed on their territory. The Commission defines the framework and the means of financing the mechanism by allowing member states, EU funds, or the private sector to provide the funding. It would appear that it is essential to allocate appropriate EU funds to the scheduled tasks, which has not been the case, to ensure the success of the transformation process (also because of its scale). Having commercial banks, which generally opt out of supporting coal-dependent energy projects, finance the energy transformation process seems far from convincing.

1.3. Regulations and Policy for the Renewable Energy Sector in Poland

The first legal act regulating in Poland the presence of energy producers from unconventional or renewable sources was The Ordinance of the Minister of Economy of 2 February 1999 on the obligation and its scope to purchase electricity and heating from unconventional sources (Journal of Laws of 1999 No.13, item 119). The major regulations on national energy policy, in that regard on RES, currently in force in Poland are:
  • The Act of 10 April 1997. The Energy Law, Journal of Laws of 1997 No. 54, item 348, with later amendments (consolidated text, Journal of Laws of 2020, item 261).
  • The Act of 20 February 2015 on renewable energy sources, Journal of Laws of 2015, item 478, with later amendments (consolidated text, Journal of Laws of 2021, item 610).
  • The Ordinance of the Minister of Economy of 4 May 2007 on detailed conditions for the functioning of the electricity system (Journal of Laws, item 623 and of 2008, items 178 and 1005, with later amendments).
  • The Ordinance of the Minister of Energy of 6 March 2019 on detailed rules of shaping and calculating tariffs and settlements in electricity trade, Journal of Laws of 2019, item 503.
The energy policy of Poland follows the EU regulatory conditions:
  • Directive 2001/77/EC of the European Parliament and of the Council of 27 September 2001 on the promotion of electricity produced from renewable energy sources in the internal electricity market. Official Journal of the European Union, L 283, 27 October 2001.
  • Directive 2003/30/EC of the European Parliament and of the Council of 8 May 2003 on the promotion of the use of biofuels or other renewable fuels for transport. Official Journal of the European Union, L 123, 17 May 2003.
  • Directive 2009/28/EC of 23 April 2009 on the promotion of the use of energy from renewable sources and amending and subsequently repealing Directives 2001/77/EC and 2003/30/EC. Official Journal of the European Union, L 140/16; 5 June 2009.
  • Directive 2010/75/EU of the European Parliament and of the Council of 24 November 2010 on industrial emissions (integrated pollution prevention and control) with later amendments.
  • Directive (EU) 2018/2001 of the European Parliament and of the Council of 11 December 2018 on the promotion of the use of energy from renewable sources (recast).
Poland’s energy policy to meet climate neutrality is presented in two key documents:
  • “Poland’s National Energy and Climate Plan for the years 2021–2030” (NECP PL) developed in fulfilment of the obligation set out in Regulation (EU) 2018/1999 of the European Parliament and of the Council of 11 December 2018 on the Governance of the Energy Union and Climate Action submitted to the European Commission on 30 December 2019.
  • “Energy Policy of Poland until 2040” (PEP2040), prepared by the Ministry of Climate and Environment of 2 March 2021, Official Journal of the Republic of Poland (Monitor Polski, item 264).
NECP PL presents an integrated approach to the implementation of the five dimensions of the Energy Union [24]: (1) decarbonization, (2) energy efficiency, (3) energy security, (4) internal energy market, (5) research, innovation, and competitiveness. Accordingly, Poland’s primary climate and energy targets by 2030 are:
  • Reduction of CO2 emissions by 7% in non-ETS sectors (compared to 2005).
  • 14% renewable energy share in transport.
  • 21–23% RES share in gross final energy consumption.
  • Increase to approx. 32% of RES share in electricity production.
  • Increase by an average of 1.1 pp per year of RES share in heating and cooling.
Additionally, it is assumed that Poland should achieve a 23% increase in energy efficiency by 2030.
PEP2040 is a strategic document on the development of the energy sector and was developed in the context of the EU’s New Green Deal policy, including the energy transition and the EU’s Post-Pandemic Reconstruction Plan (under which Poland is to receive significant financial support). PEP2040 establishes the framework for energy transformations based on three pillars [25]: (1) equitable transition; (2) zero-emission energy system; (3) good air quality. The strategy provides for an energy transformation taking account of energy self-sufficiency achieved owing to the RES increase in all sectors and technologies (following the NECP PL provisions), the development of offshore wind energy (approx. 5.9 GW in 2030 to approx. 11 GW in 2040), growing capacity of photovoltaic installations (5–7 GW in 2030 and 10–16 GW in 2040), and the implementation of nuclear power. The first nuclear power plant unit with 1–1.6 GW capacity is scheduled to be built in 2033 (jointly, six units are to be erected). The strategy intends to reduce coal dependence in energy production to 56% and, by 2030, ensure a 30% decrease in greenhouse gas emissions compared to 1990. Finally, under the strategy, all coal mines are to be shut down by 2049. It is a crucial goal because Poland had a 96% share of hard coal production in Europe in 2020. Natural gas is to be considered a transitional fuel and will be used for balancing renewable energy sources. Until 2030, primary energy consumption is predicted to decrease by 23% compared to 2007. The transformation is expected to rely on the development of energy technologies and R&D in terms of energy storage, smart metering and energy management systems, electromobility and alternative fuels, and hydrogen technologies.

2. Data and Methodologies

2.1. Research Design

The purpose of the analysis is to identify the determinants of renewable energy deployment in Poland. The research is provided in two subsections. The first one deals with a qualitative analysis to present renewables in Poland against EU background for 2005–2019. The second one presents an analysis based on the panel data from 16 voivodeships in Poland and the 2010–2019 time period. The data were acquired from the Local Data Bank of the Statistics Poland (LDB). In addition, the data relevant to the study are discussed, potential explanatory variables are proposed, and the method of the dynamic panel model used in the study is briefly described.

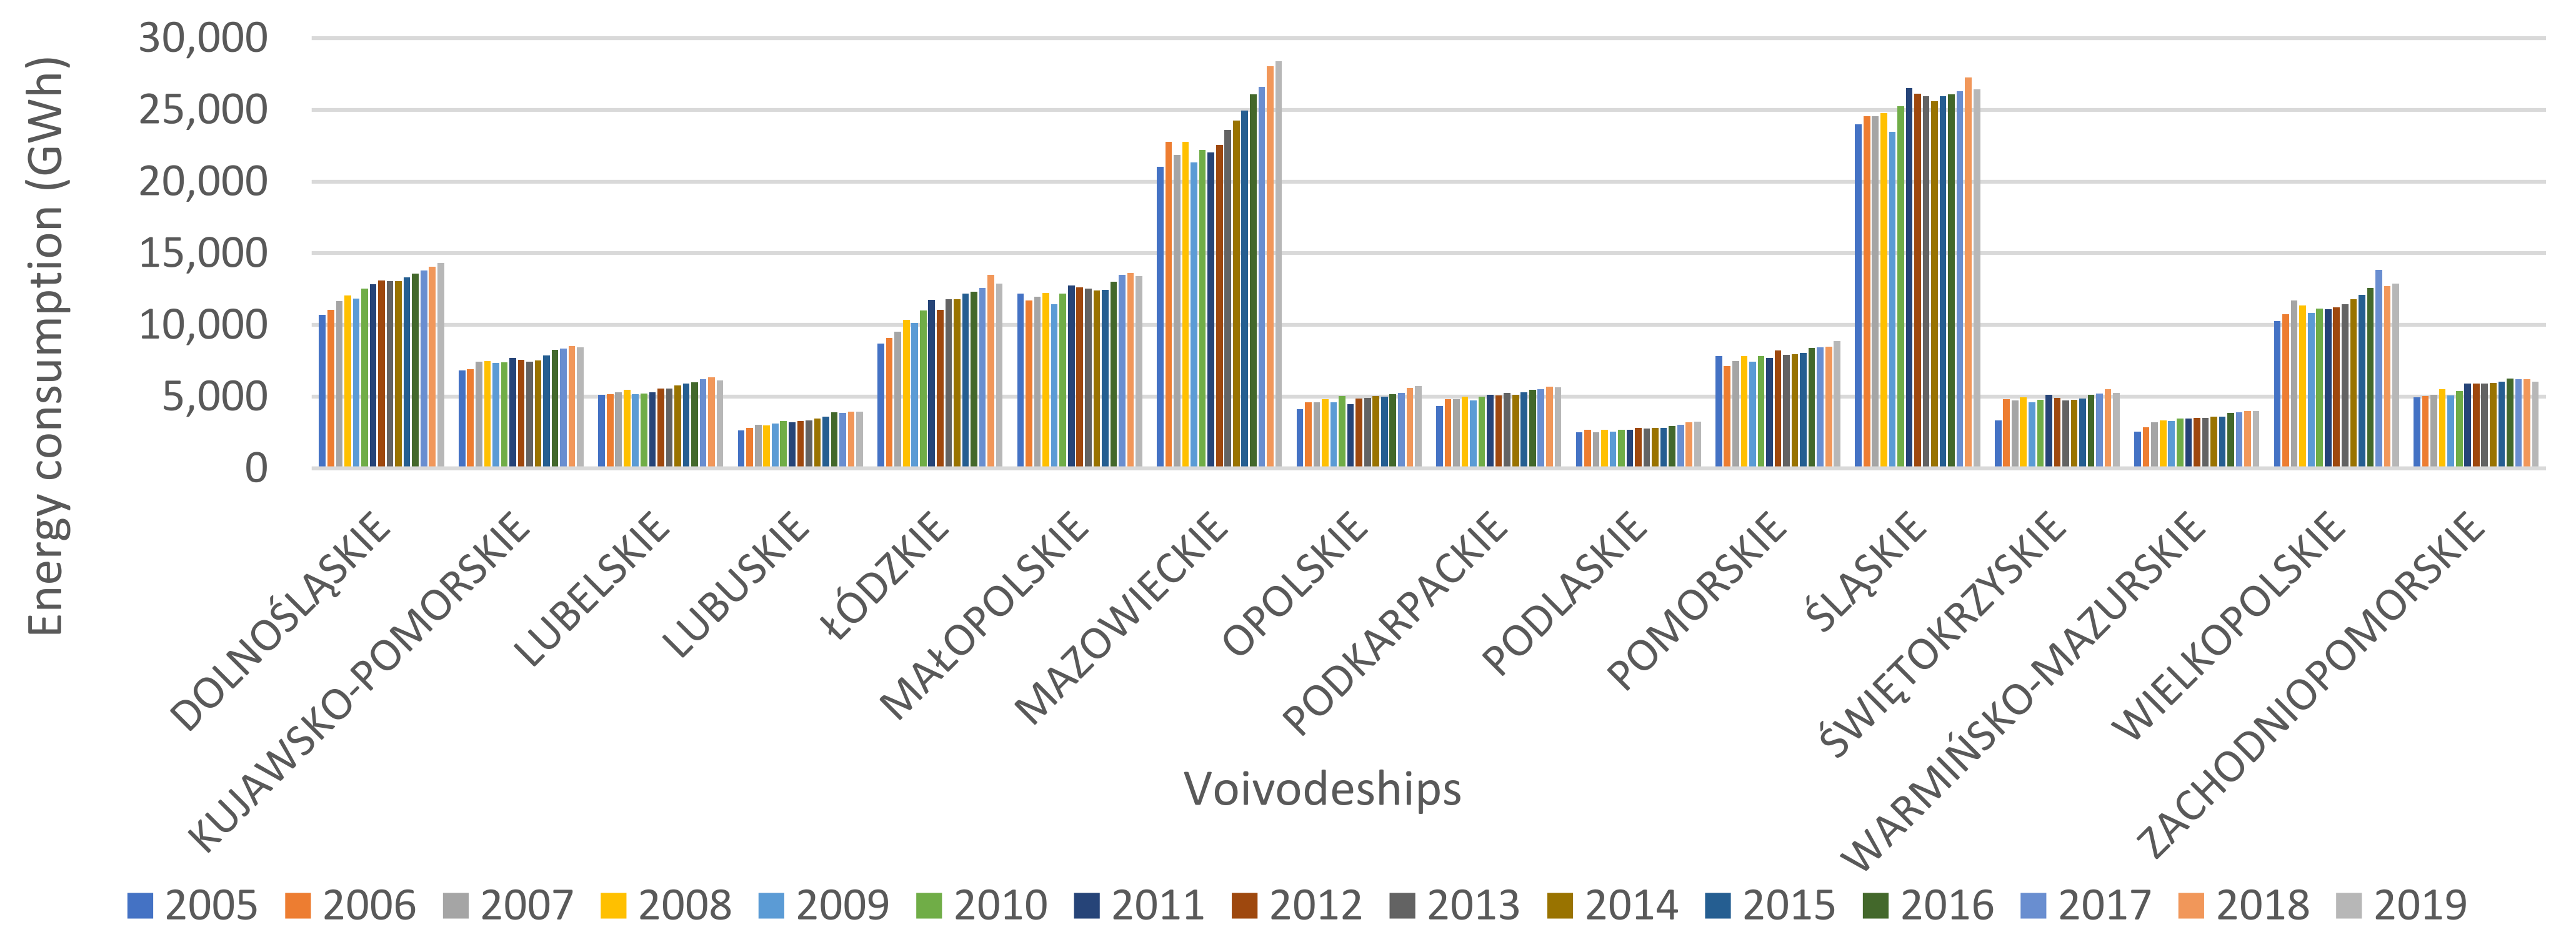
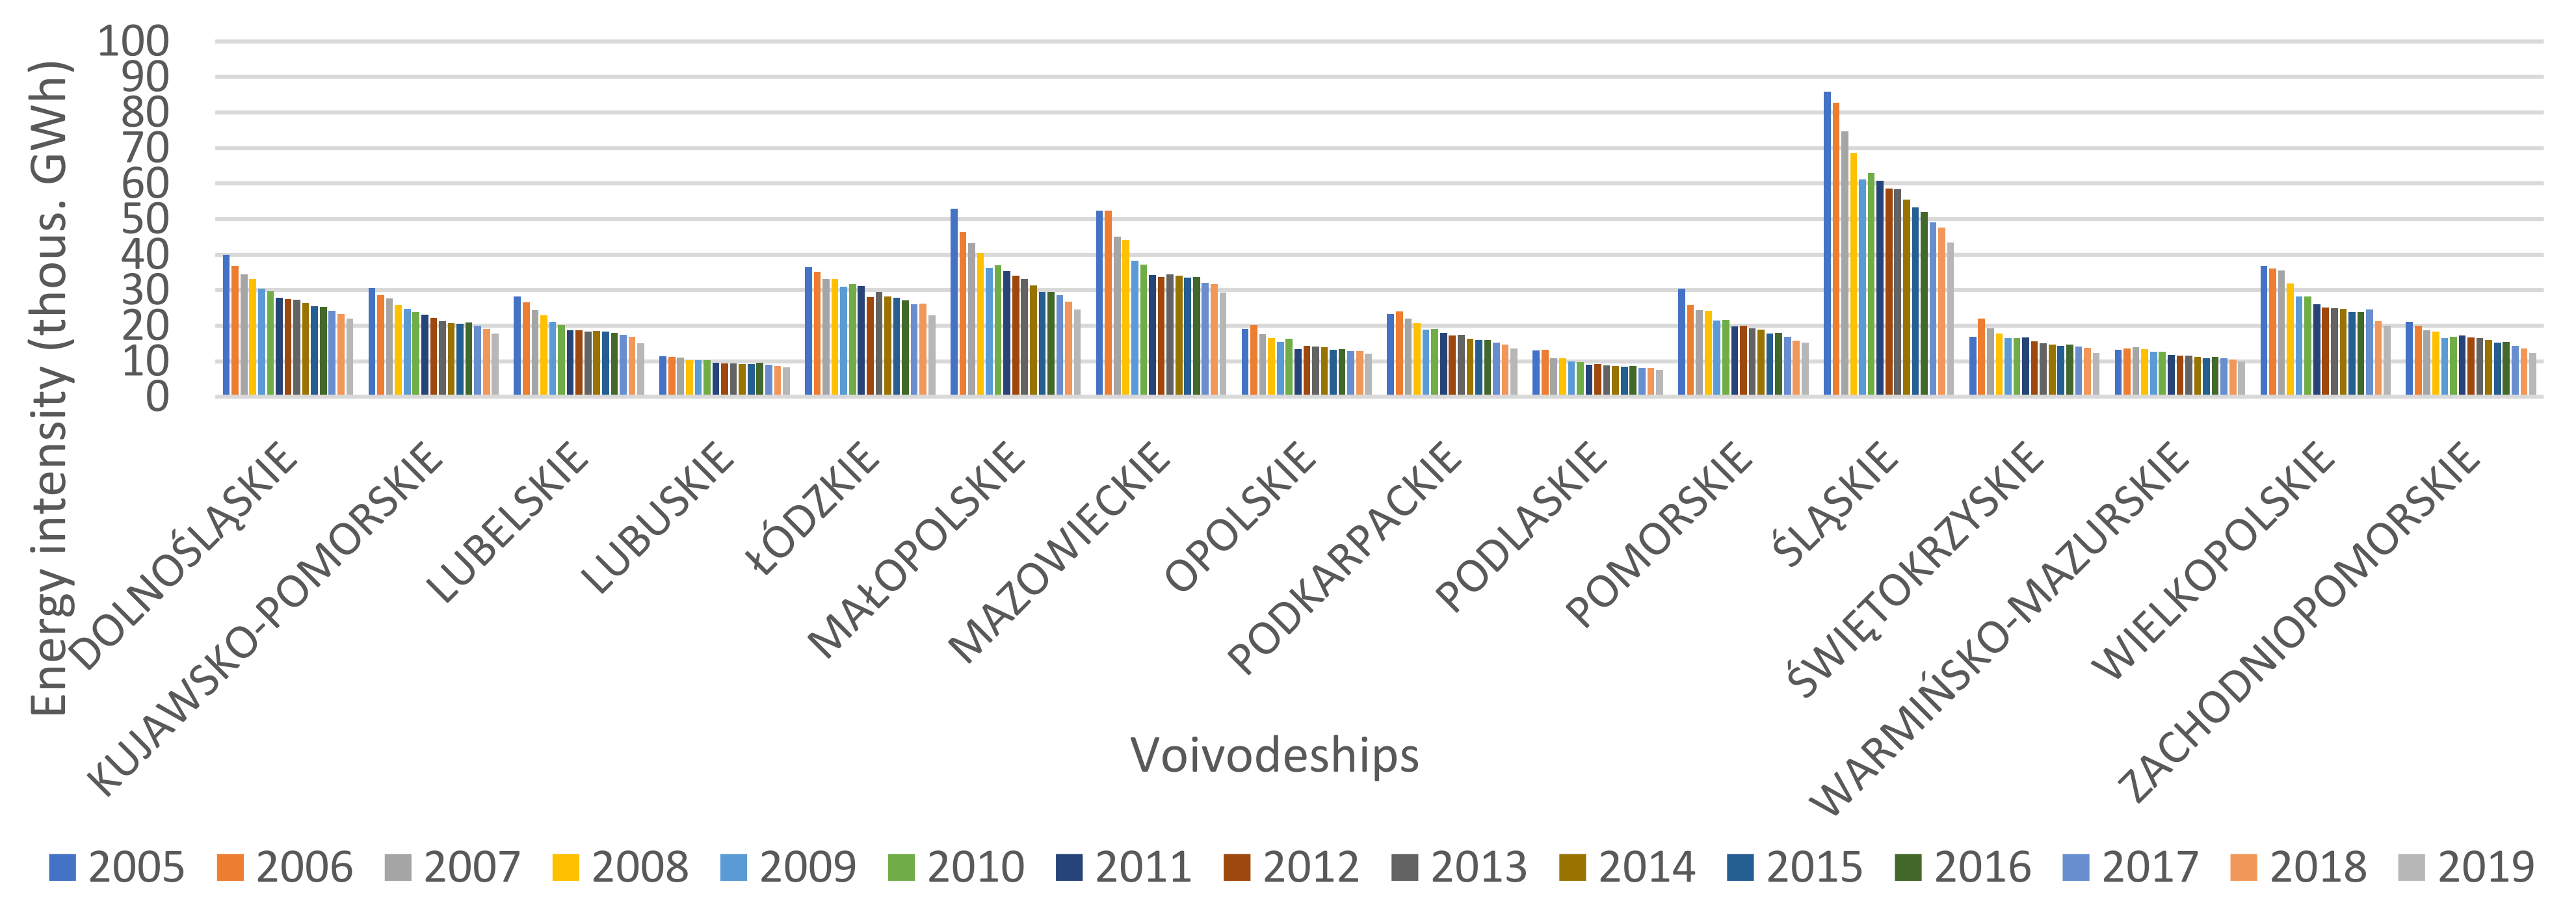
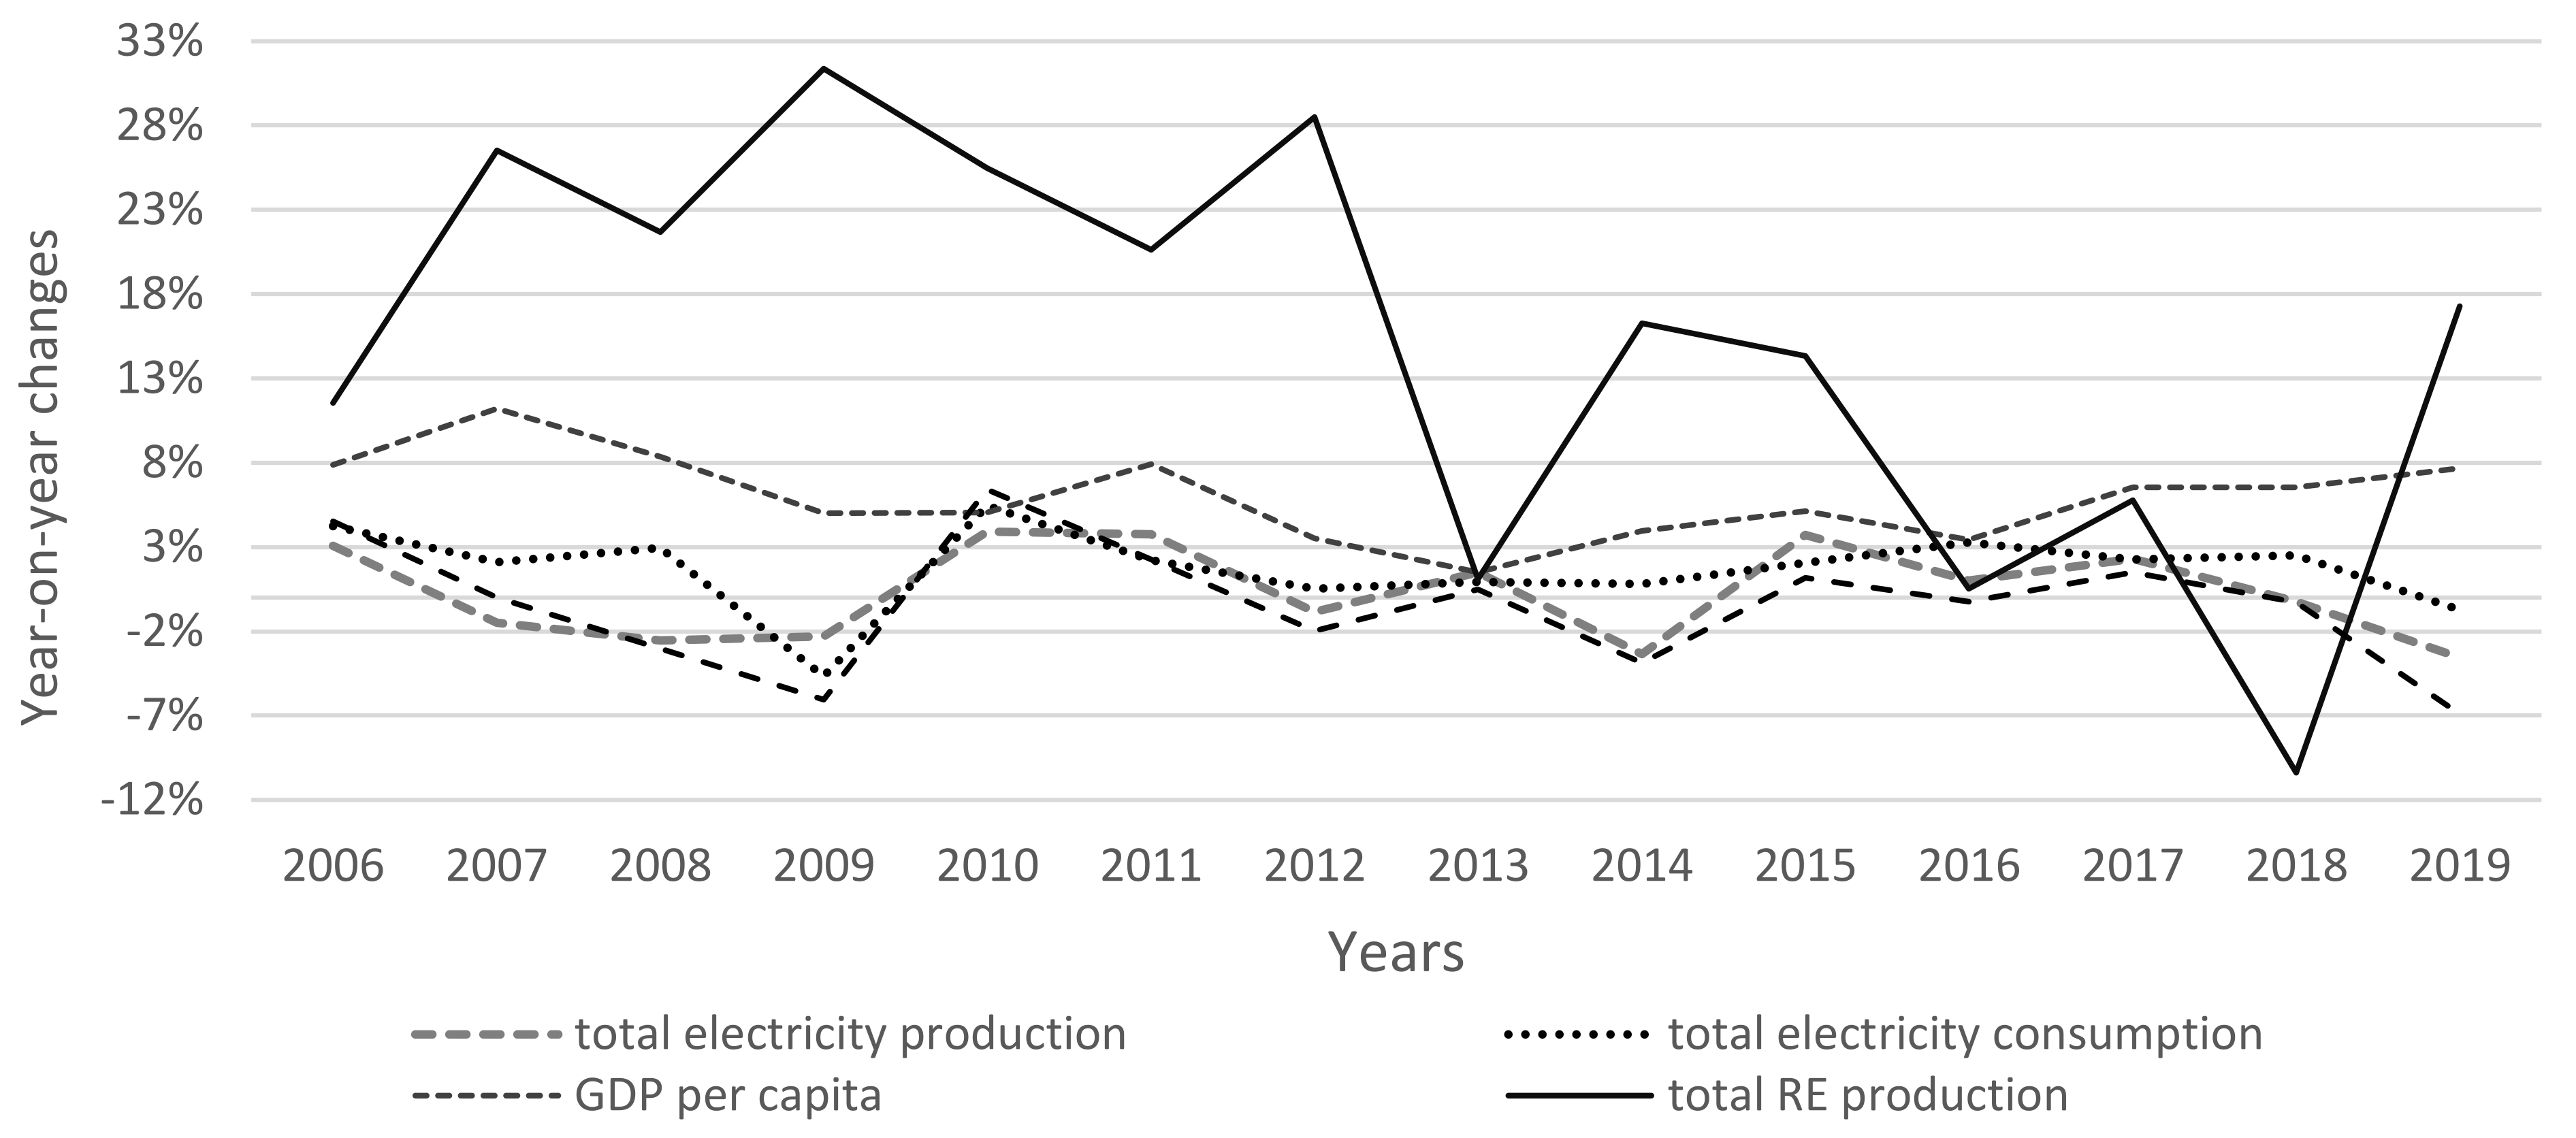
2.2. Renewable Energy Sector in Poland in 2005–2019

Pursuant to the Art. 131, Clause 1 of the Act of 20 February 2015 referring to renewable energy sources, the data concerning renewable energies from the electronic database are available to the public. The total installed power of particular types of RES installations as of 31 December 2019 amounted to 24.7 GW. The total amount of energy produced from renewable sources in 2019 was 15.3 GWh [26].
In order to demonstrate the changes in Poland’s economic situation in 2005–2019, the dynamic of selected factors is presented in Figure 1.
A constant increase in GDP per capita is observed: the average growth rate is 5.4%. However, electricity production’s annual growth rate is irregular, while the average electricity consumption growth rate is 2% per year (except in 2009 and 2019). In 2019, energy production and demand for it decreased by approximately 4% and 1%, respectively, while GDP per capita increased by 7.7% compared to 2018. In the same period, the entire country’s CO2 emissions decreased by 3.57%. However, for the public electricity and heat production sector, it decreased by 16.65% (own calculations based on [27]).
Having analyzed the data in Figure 1, the following hypotheses can be formulated: (1) there is a positive correlation between RE production growth and GDP per capita growth, (2) increase in RE production leads to a reduction in emissions, especially of CO2 (also observed by Sadorsky. 2009) [3].
Primary energy consumption covers the energy consumption by end users such as industry, transport, households, services, and agriculture, but also of the energy sector itself for production and transformation of energies, energy transformation losses (e.g., the efficiency of electricity production from combustible fuels) and the transmission and distribution losses of energy. According to Eurostat [28], primary energy consumption (PEC) increased in Poland by 11.6% between 2005 and 2019, while it decreased in EU countries by 11.3% (Figure A1).
Since 2010, Statistics Poland has provided energy intensity calculations as a relationship between PEC expressed in kilograms of oil equivalent [kgoe] and GDP (in constant prices from 2005), taking account of the climatic correction (Figure A2). The climatic correction determines the theoretical value of energy consumption for a given year, assuming that average weather conditions characterize it. Between 2010 and 2019, energy intensity of GDP drops by 21.70% to 0.249 (kgoe/EUR) [29]. Year-on-year changes are irregular and vary between 0.37% and −6.04%.
Primary energy consumption (at “normal climate”, described by Climate Normals, which are 30-year averages for climate variables such as temperature and precipitation), and GDP trends in the EU were in 2000–2018 as follows [30]:
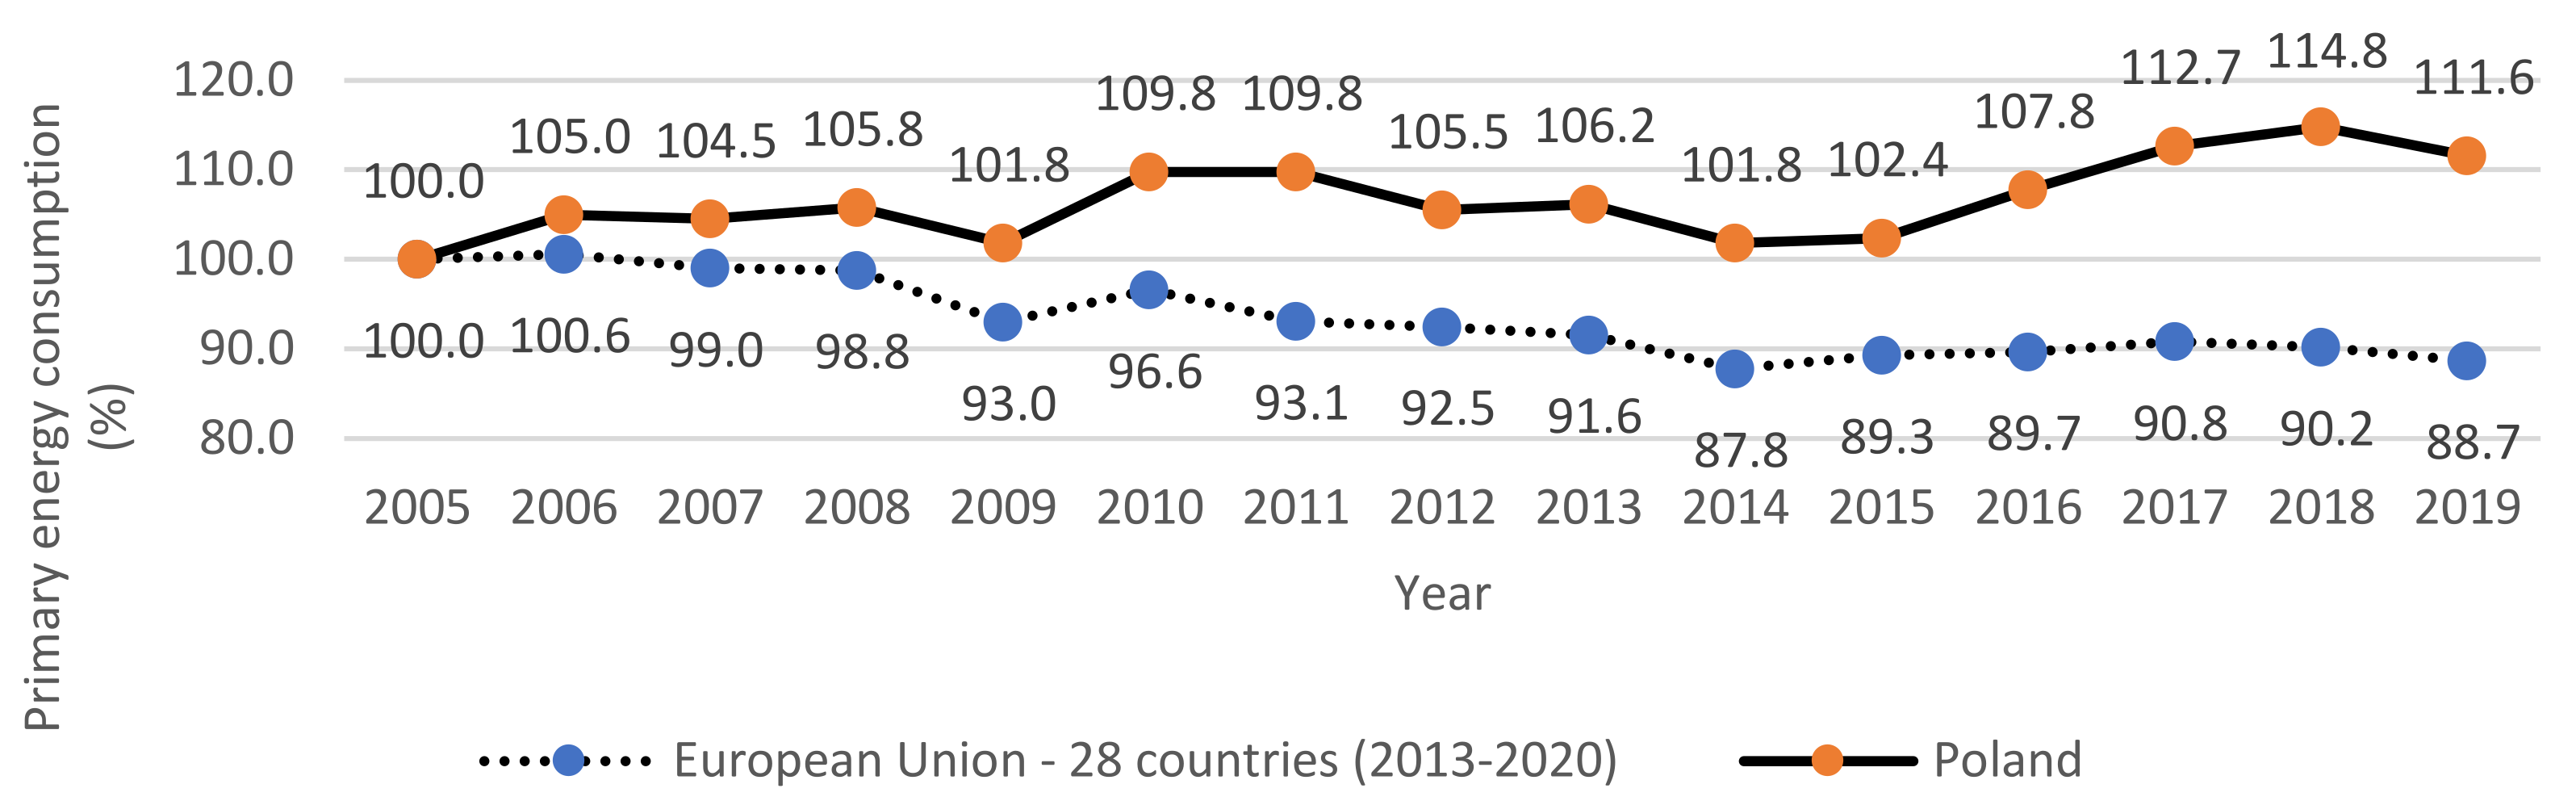
  • Primary energy consumption decreased by 1.6% per year between 2007 and 2014.
  • Slight progress of the primary consumption since 2014 (0.4% per year), however, was about six times slower than the GDP rate of growth.
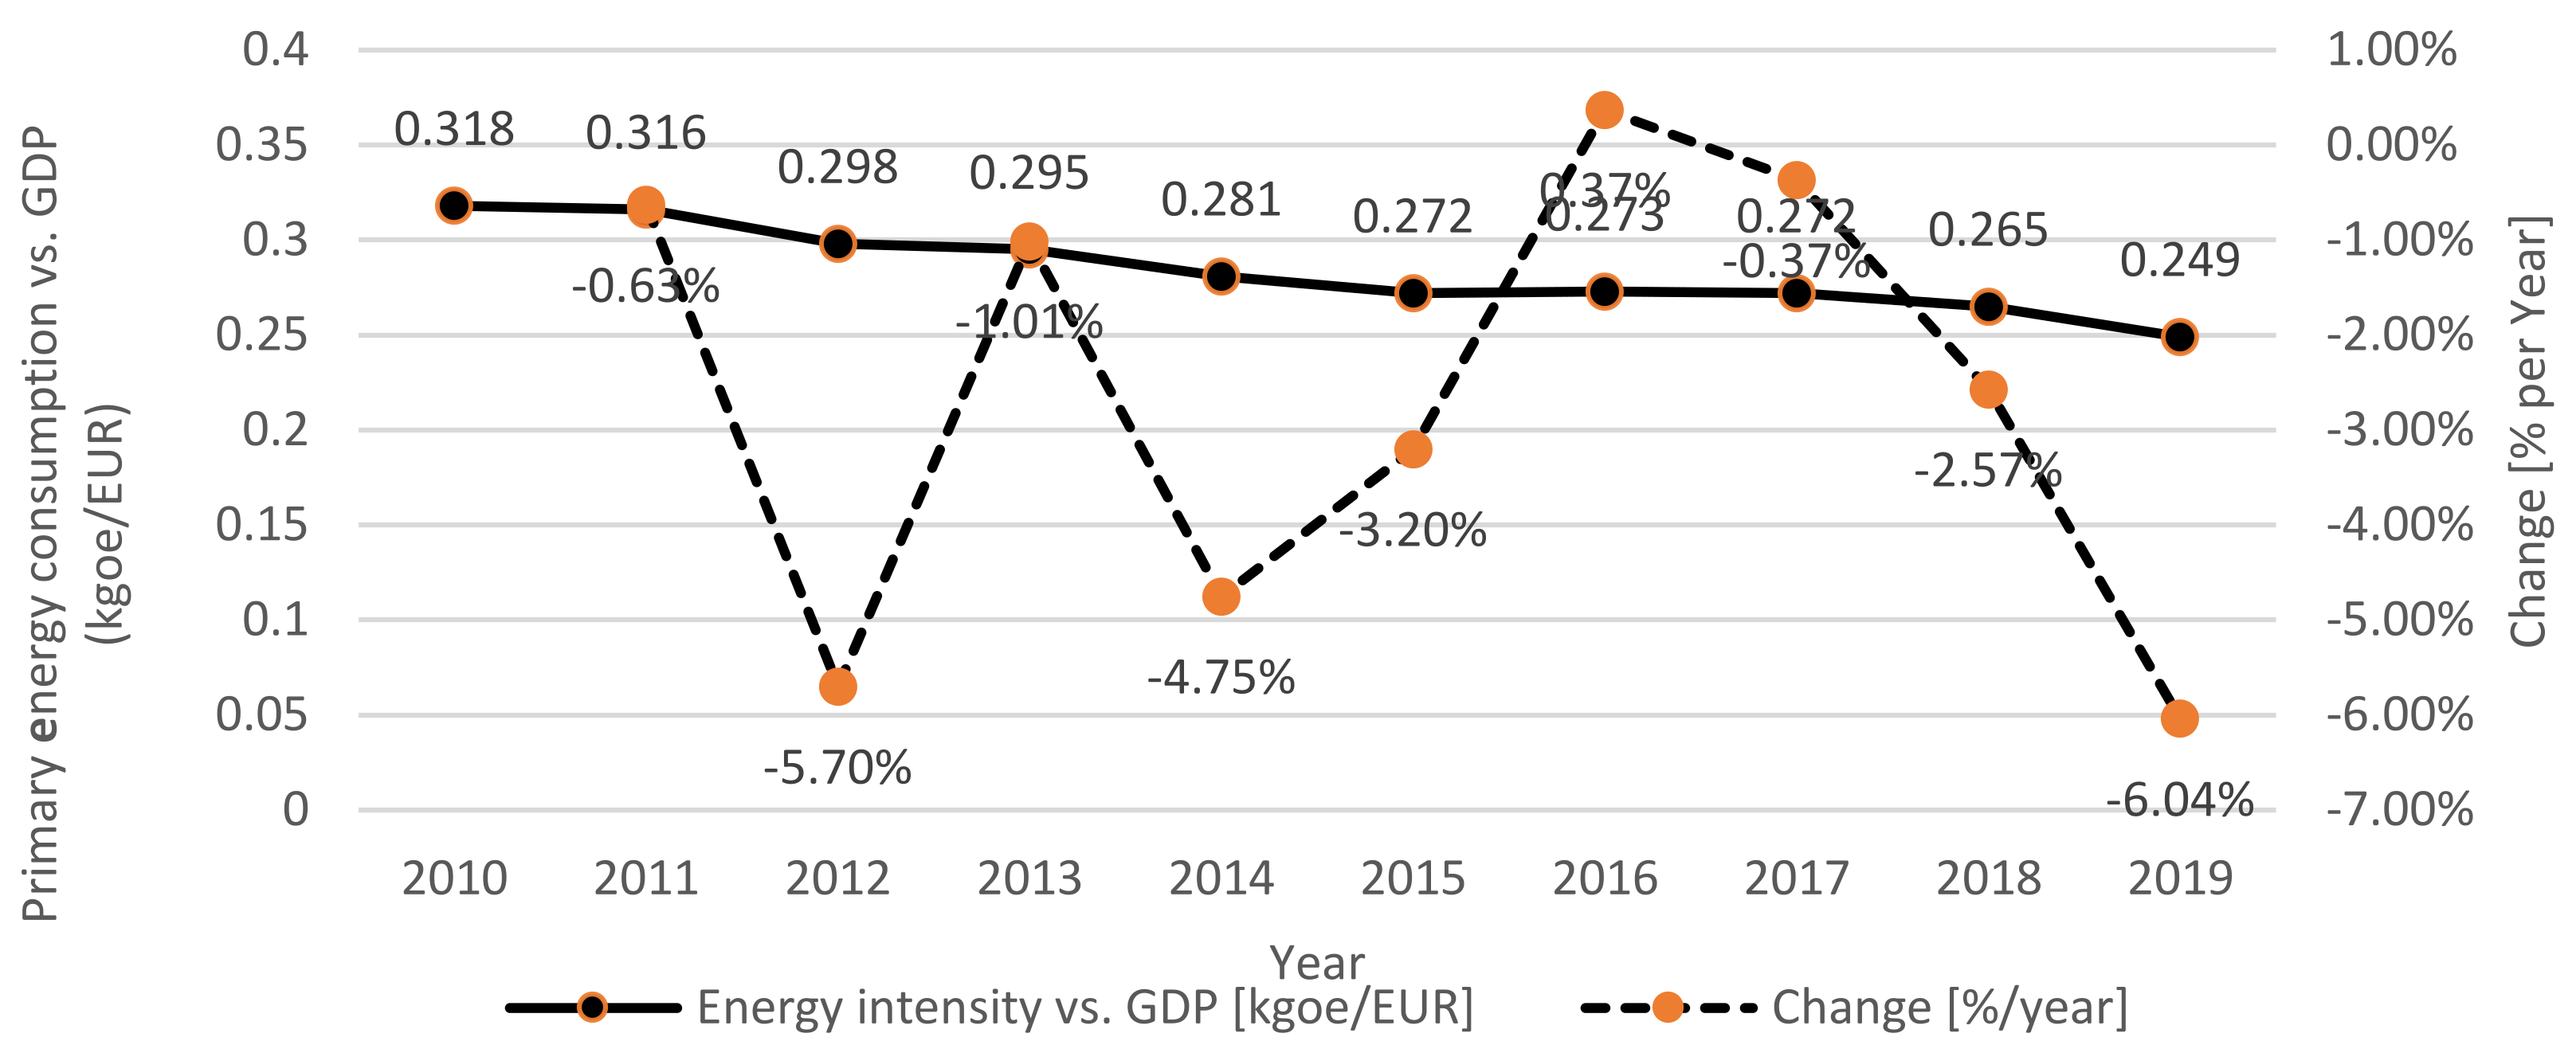
  • Regular and rapid decrease in primary energy intensity of GDP since 2007 (−1.8% per year).
Poland committed itself to meet the target of 15% RES share in the final gross energy consumption by 2020 (20% RES share for the whole Community) following the Directive 2009/28/EC of the European Parliament on renewable sources of energy containing pan-European objectives and policy goals on energy strategies and the National Action Plan on RES development in 2010–2020. The share of renewable energy in gross final energy consumption (%) in Poland vs. EU28 in 2005–2019 is presented in Figure A3.
The growth of RES share in the European and global energy mix is mainly driven by dropping capital expenditures (CAPEX) due to technological innovations. For analytical purposes, the global weighted-average levelized cost of electricity (LCOE) is defined in literature as [31]: “the ratio of lifetime costs to lifetime electricity generation, both of which are discounted back to a common year using a discount rate that reflects the average cost of capital”. According to the cost data from the International Renewable Energy Agency (IRENA), the LCOE of utility-scale solar photovoltaics (PV) declined by 82% between 2010 and 2019, while that of concentrating solar power (CSP) fell by 47%, onshore wind by 39% and offshore wind by 29%. Moreover, electricity costs from utility-scale solar PV fell by 13% year-on-year, and onshore and offshore wind fell by about 9% year-on-year. It is because hydropower provides low-cost electricity and effective and flexible storage capacity. However, both hydropower and geothermal installations are site-sensitive and require capital-intensive technologies. Furthermore, the most accessible hydropower reservoirs and geothermal sources in Europe have been already used, so increasing the power of these types of RES requires significant investments. The LCOE of hydropower installations in 2019 was 27% higher than in 2010, but it was still lower than the LCOE of fossil fuel-fired installations. Concerning the LCOE of geothermal, it was 49% higher than in 2010 [32].
Renewable energy in Poland is primarily produced from the incineration of biomass (Figure 2). However, since 2013, this form of energy generation has been losing traction to the benefit of wind energy due to limited funding. As a result, in 2019, energy from biomass amounted to 65.56%, while from wind farms 13.72%. Similarly, hydroelectricity plants’ energy share fell by more than a half over the period in question.
The data on primary energy production by energy carriers shows that fossil fuels still dominate the energy generation in Poland: 74.74% share in primary energy production in 2019 (Figure 3).
In order to illustrate the production of energy broken down into voivodeships, Appendix B features relevant graphs. The level of regional energy market centralization in Poland is relatively high (Figure A4), especially in the following voivodeships: Łódzkie, Śląskie, Mazowieckie, Dolnośląskie. The Łódzkie voivodeship boasts the highest level of electricity production, relying on its rich lignite sources. The Bełchatów Fuel and Energy Complex is comprised of the Bełchatów lignite mine and the Bełchatów power station, which produce over 20% of all electricity in the country [33].
Energy consumption in Poland is largely diversified. The share of individual voivodeships in total energy consumption is presented in Figure A5. The Mazowieckie and Śląskie voivodeships demonstrate the highest consumption values, with the Mazowieckie characterised by rapid consumption growth. The four voivodeships of Dolnośląskie, Łódzkie, Małopolskie, and Wielkopolskie show average consumption levels, but the Lubuskie, Podlaskie, and Warmińsko-Mazurskie voivodeships display bottom values.
Having analyzed the data in Figure A2 and Figure A6, a negative correlation between energy intensity and RES share in the total energy production can be observed. It proves that favorable changes are underway in the energy production structure, RES share is gradually satisfying energy demand, and there is growing investment potential of energy entities in Poland.

2.3. Variables Selection for Quantitative Analyses (2010–2019)

The article sets out to study the impact of selected determinants on implementing an energy model using energy from renewable sources. The analysis employs a dynamic panel data model where the cross-sectional units (objects) are voivodeships and all variables’ time unit is a year. Poland is composed of 16 voivodeships and the period under consideration is 2010–2019. All the cross-sectional units are measured across the whole period. The analysis refers to a balanced panel, which means each panel member is observed every year. The data set contains 240 (NT = 16 ∙ 15) records. A majority of the data were provided by the Local Data Bank of Statistics Poland.
Taking the EU climate and energy policy targets, which aim at reaching a specific RES share in total electricity consumption [34], into account, this research defines the rate of the renewable energy sources share (RESS) as its modeling endogenous variable (1):
RESS = production   of   electricity   from   renewable   energy   sources   as   per   voivodeship   GWh total   electricity   consumption   in   Poland   GWh
The resources expressed by the endogenous variable RESS comprise hydropower, wind, solar, biomass, and geothermal energy (its value is presented in Figure A7).
Based on the literature review (summarized in Table 1) and available data as per voivodeship, the following variables are proposed (Table 2).
The proposed variables can be categorized into five groups: the level of economic development, energy demand, national price rates, funding for R&D, features of energy carriers, and environmental actions. Energy consumption is the most important driver for the development of all energy sources. Increased energy consumption is conducive to depletion of resources [3,35,36].
Estimation of dynamic panel models requires different methods from those employed in statistical models [6,13]. In the article, the least-squares dummy variable estimation using robust standard errors technique (Arellano and Bond approach) is employed [35,36,37]. These dynamic relationships are characterized by the presence of a lagged endogenous variable among the regressors (2), i.e.
y i t = α + δ y i ,   t 1 + k = 1 K β k x k i t + ε i t ,     i = 1 , ,   N ;     t = 1 , , T
where the subscripts i and t denote the voivodeship and time, respectively,   α denotes the constant term, δ is a scalar, x k i t is the kth explanatory variable, and β k determines the effect of the exogenous variables X k on the endogenous variable Y . The disturbance ε i t is broken down into three components (3):
ε i t = μ i + θ t + ν i t ,
the nonobservable individual fixed effects, which are time-invariant— μ i (in our panel model, μ i refers to the individual heterogeneity of every voivodeship) and time-specific effects θ t , which are unit-invariant, and the purely random component ν i t , where μ i ~ I I D 0 ,   σ μ 2 and ν i t ~ I I D 0 ,   σ ν 2 are independent of each other and among themselves.

3. Results Based on Data for 2010–2019

3.1. Preliminary Results

Before the panel data model estimation, a detailed description of the proposed endogenous and exogenous variables was conducted (Table A1).
As Table A1 demonstrates, in the analyzed period, the data presented are characterized by certain asymmetry. As to the following variables: RESS, GDPPC, HEC, NHEC, AEPC, R&D, IEC, AEPC, PECD, and EEPW, the mean is greater than the median, and the skewness index is positive. It means that there are more relatively small values among the cross-sectional and time series values than big ones. Whereas in the case of price-related values PEH, PC, and PGH, this relation has the opposite sign, and the skewness index is negative, which indicates more frequent high values of such variables. The value of RESS across voivodeships is relatively diversified (Table A1, Figure A7). The most dynamic RES development is demonstrated by the Zachodniopomorskie and Kujawsko-Pomorskie voivodeships as well as the Pomorskie, Śląskie, and Świętokrzyskie voivodeships (still above the average). The differences observed might be attributed not only to varied geographical conditions such as proximity of the sea and landform but also to the level of social approval of RES, funding of R&D and environmental protection, and other voivodeship-specific factors. It should also be noted that there is high volatility of R&D and EEPW. In the period under consideration, the average electricity price for households (PEH) is characterized by lowest volatility (average annual growth of 0.02%), which was the result of the Amended Energy Act of 29 June 2019 (Journal of Laws of 2019, item 1210), which prevented electricity price increases in 2019. The price of coal (PC) was also marked by low volatility. The high value of kurtosis (especially for EEPW) indicates a leptokurtic distribution (demonstrates fat tails of distribution) suggesting that extreme values are likely to emerge. A distribution with negative kurtosis indicates that values are more dispersed, and it is impossible to identify certain data change tendencies.
In order to analyze the relations between the proposed exogenous variables and the RES share in total energy consumption, correlations for the cross-sectional data in the years 2010–2019 are analyzed (Table 3).
The table above reveals an interesting pattern that indicates that the majority of proposed exogenous variables in 2010 prove a sufficiently strong correlation with the endogenous variable, except PC and PGH. A slight price increase of the conventional energy sources does not seem to be enough to encourage the switch to renewable sources of energy. Empirical results (in the case of the five variables PEH, R&D, EEPW, HEC, and NHEC) suggest that there is a breakthrough in 2015 and 2016 (the direction of the relationship changes; shadowed cells in Table 3). Additionally, a weaker correlation between the exogenous variables and the endogenous variable can be observed. It is suspected that the observed changes might be related to the fact that in February 2015, the Polish Power Exchange (POLPX) started to trade in electricity, natural gas, property rights, cogeneration, and energy efficiency, a guarantee of origin and CO2 emission allowances. POLPX enables the possibility of determining an accurate market price, which is a reference price for other energy market transactions. On 20 February 2015, The Renewable Energy Sources Act (RES Act) was passed and opened up new possibilities for supporting RES development. Since then, the system of RES auctions, which are a means of encouraging RES development, has undergone numerous modifications. As part of the 2019 auction, 185 TWh was allocated for sale with a total value of over PLN 69.9 bn. As a result, almost 91 TWh of electricity was traded, worth approx. PLN 20.6 bn, and the contracted energy was less expensive than expected by the legislator [38]. There has been a noticeable development of micro and small RES sources due to both the changes introduced by the RES Act to the renewable energy market and the development of renewable energy technologies, including photovoltaic technology. Subsequent amendments to the RES Act of 2016 and 2017 introduced prosumer solutions, thanks to which the owner of micro renewable energy installations can “store” surplus energy in the power grid by collecting it in the period when his production does not cover his demand on an ongoing basis. In 2016–2019, 2000 installations were given support.
In the analyzed period of 2010-2019, IEC growth was accompanied by the rise in RESS, whereas the indices corresponding to consumption were marked by a change of the sign of correlation coefficient in 2016. This may have been caused by the 2016 regulations and the faults of the RES market, which were described in detail in the Supreme Audit Office report (NIK, 2021) [39]. The report highlights the following obstacles to RES development: inefficient auction system introduced by the RES Act (2015), the reduction of wind farm investments caused by the RES Act on wind farm investments in 2016 introducing the 10 h principle, defining the minimum distance between residential buildings and other facilities, and establishing wind power plant capacity at max. 40 kW (in 2018, the limit was raised to 50 kW), but also unfinished work on marine spatial planning and lack of aid instruments dedicated to geothermal energy.
The level of RESS in the previous periods is positively and highly correlated with that in the current period (which indicates the persistent effect on RESS) and confirms the need for stable and consistent political support for RESS.
The correlation coefficient suggests the absence of collinearity among RESS and the average electricity price for households (PEH) and the price of gas (PGH), which indicates that the price of energy from nonrenewable sources does not significantly affect RES development in Poland. It would demonstrate the relatively low level of social awareness and inadequate promotion of the benefits of RES. Furthermore, the relationship between the endogenous variable, R&D expenditure, and the environmental protection expenditure is surprisingly weak.

3.2. Results Based on the Dynamic Panel Data Model

The final stage of the proposed analysis is the construction of a dynamic panel model. Potential determinants were selected based on the results presented in Table A1. A summary of the final results is presented in Table 4. The occurrence of the high correlation coefficient between RESS in the current period ( R E S S t ) and that in the previous one ( R E S S t 1 ) (e.g., 0.97 in 2010, 0.99 in 2019) confirms the high persistent effect on RESS and justifies using a dynamic panel data model.
The estimation results and model assessment of the RES share in total consumption in 2010–2019 are presented in Table 4. Individual voivodeships are coded alphabetically: du_1—Dolnośląskie, du_2—Kujawsko-pomorskie, du_3—Lubelskie, du_4—Lubuskie, du_5—Łódzkie, du_6—Małopolskie, du_7—Mazowieckie, du_8—Opolskie, du_9—Podkarpackie, du_10—Podlaskie, du_11—Pomorskie, du_12—Śląskie, du_13—Świętokrzyskie, du_14—Warmińsko-Mazurskie, du_15—Wielkopolskie, du_16—Zachodniopomorskie. The time unit t is identified by means of the variable dt_i, where i = 1, …, 10 corresponds to the period of 2010–2019. It is assumed that the reference unit for the cross-sectional data is the Zachodniopomorskie voivodeship, while for the time unit it is the year 2019 (the final year of the research).
.
We note the following significant determinants of RES share production in total electricity consumption in Poland for individual voivodeships:
  • The increase in total installed electric capacity (IEC) of connections affects the growth of RESS.
  • The growth of household electricity consumption (HEC) is accompanied by the rise in RESS.
  • The growth of nonhousehold electricity consumption (NEHC) affects the reduction of RESS.
In an attempt to assess the validity of the model, the Levin–Lin–Chu (LLC) test was applied to examine the occurrence of the first- and second-order autocorrelation [35,37]. There is no evidence to reject the H0 indicating the absence of higher than the first-order autocorrelation in the model, which confirms the correct specification of the model. In connection with the trends observed in Table 3, the test for structural change and stability (Chow test) was also carried out.

4. Discussion

We aimed to examine the significance of selected factors on the development of renewable sources of energy in Poland. In our view, the paper could fill a certain gap in the literature by closely analyzing and assessing RES development with regard to regional diversity based on the latest data from the Local Data Bank of Statistics Poland.
Before the dynamic panel data model (Section 3) was created and analyzed, the Polish energy market in 2005–2019 had been thoroughly characterized with regard to both changes in the legal regulations and international context. According to Eurostat data, RES development in Poland compared with that in the EU countries does not appear favorable. Nevertheless, Poland followed EU28 in terms of share of RE consumption between 2007 and 2013; since 2014, the growth dynamics has been decelerating, and the gap between Poland and EU28 systematically growing. As a result, the gap was −6.71 pp in 2019, while it was only −2.23 pp in 2005. Since 2005, the primary renewable energy source has been biomass. However, since 2015, wind energy has been gaining traction. Poland’s RESS is to reach 21%–23% by 2030; in energy production, it will rise to approx. 32%. Meeting those targets will not be possible without the government involvement in stimulating and supporting RES development by relevant regulatory attempts of the energy market and secure financing, especially by obtaining EU funds for RES producers and prosumers.
It is worth noting that in Poland, according to the LDB data:
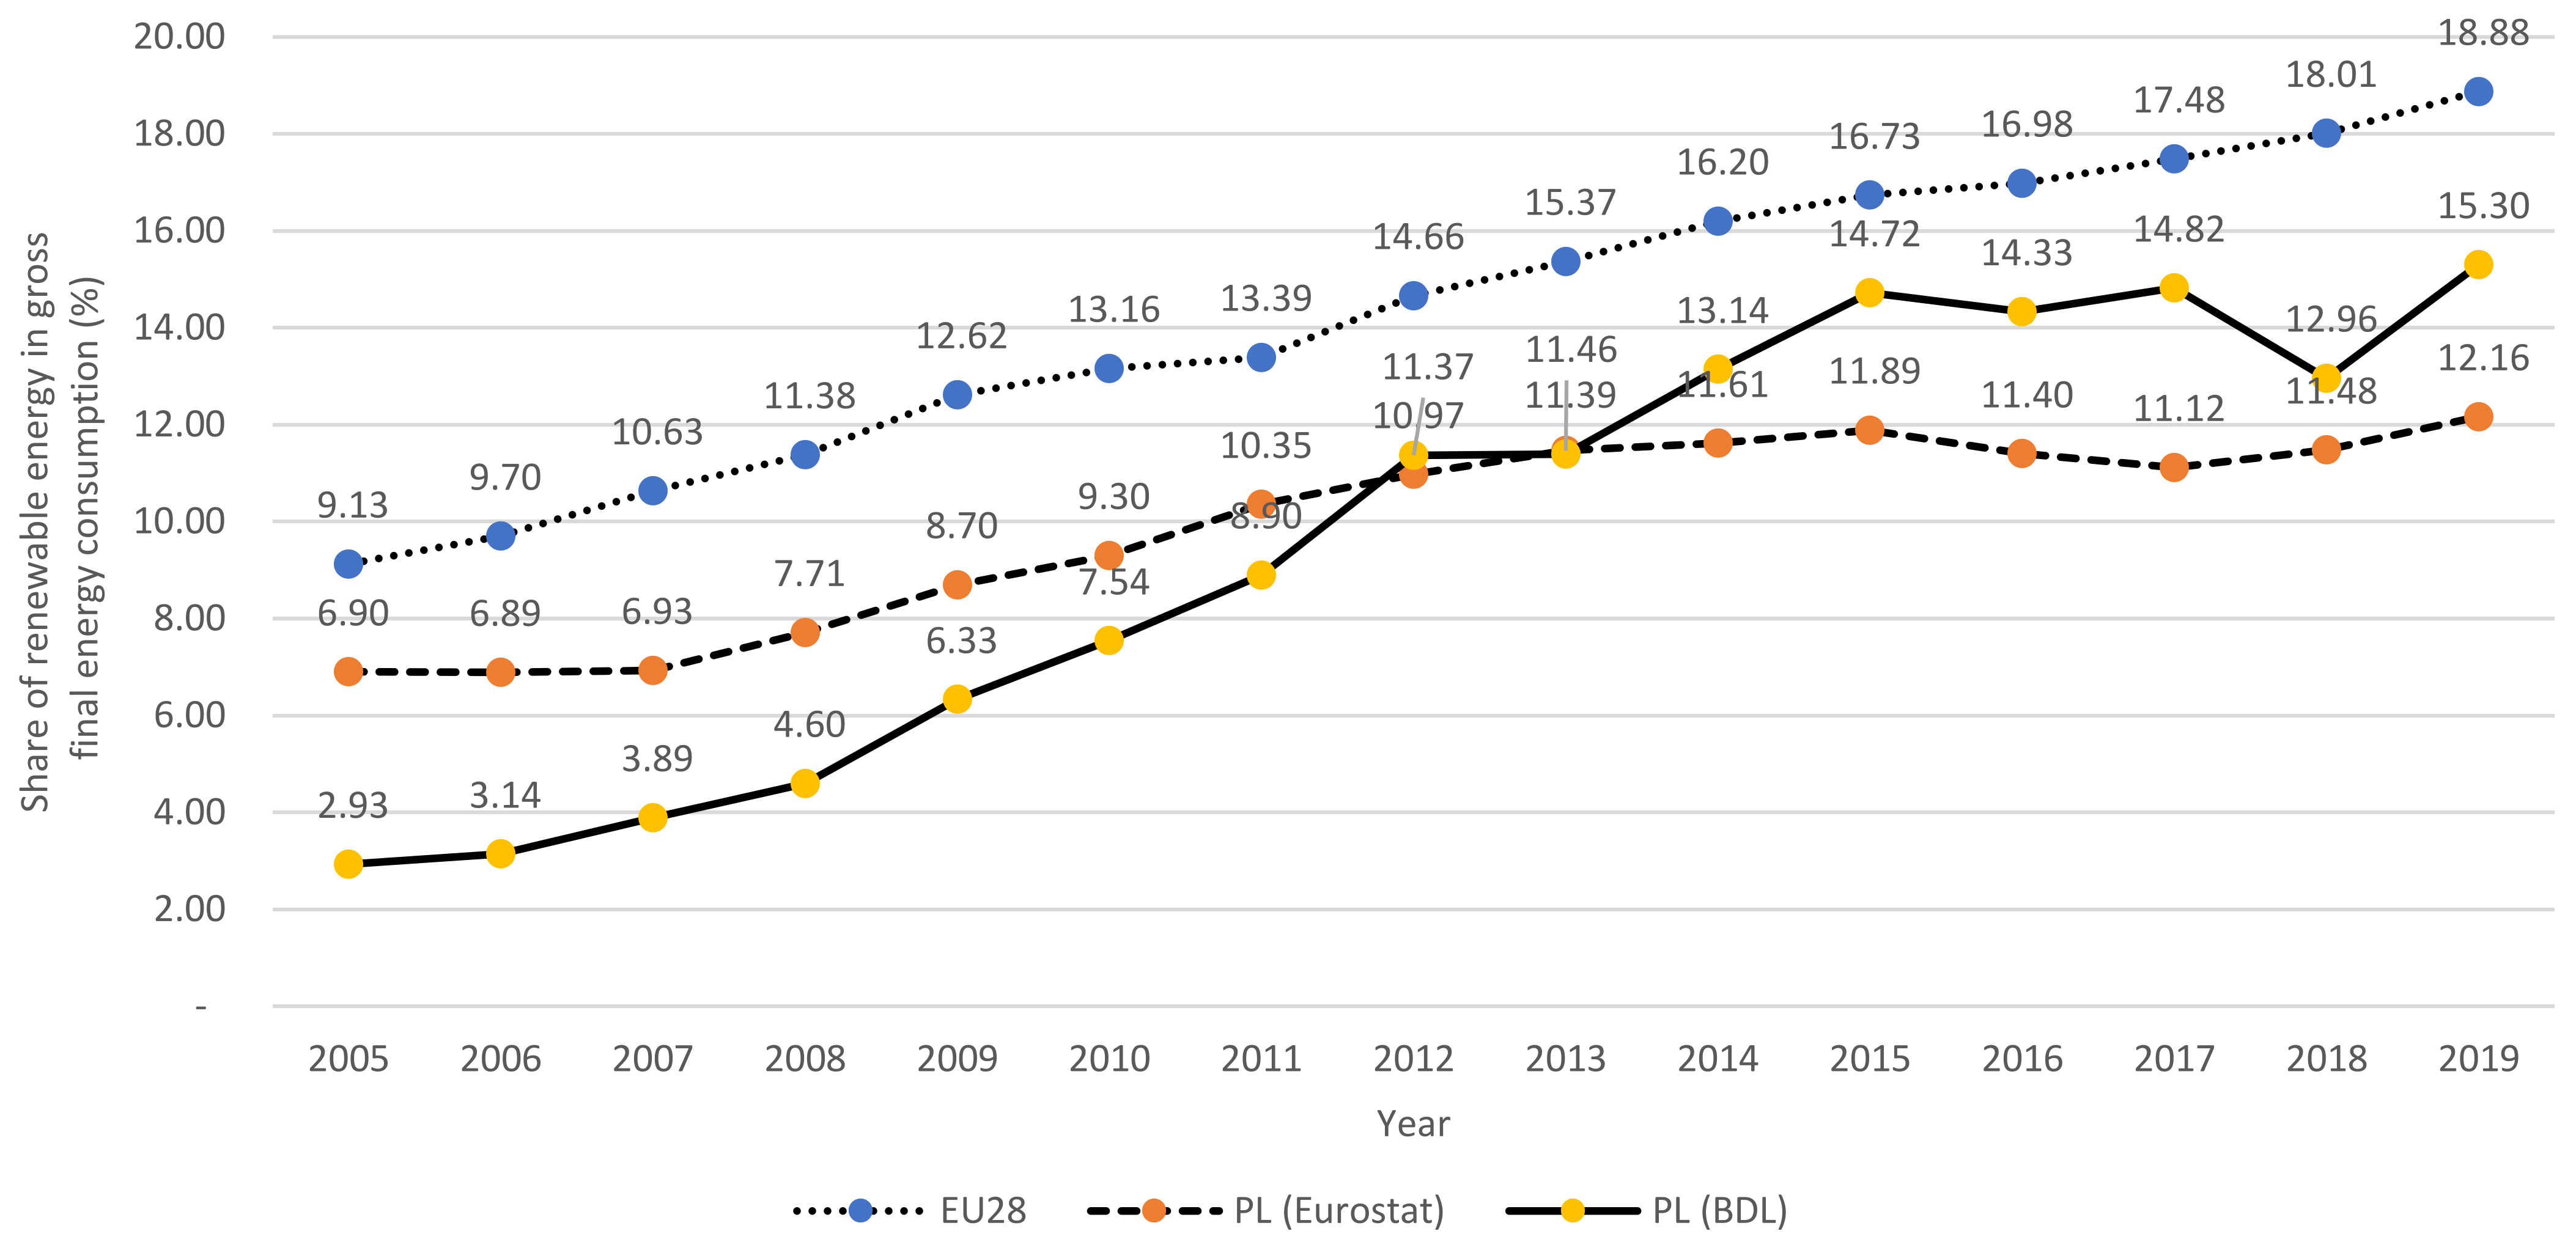
  • The RE share in total energy production increased from 2.45% to 15.46% between 2005 and 2019. Likewise, RE share in energy consumption increased from 2.93% to 15.30%.
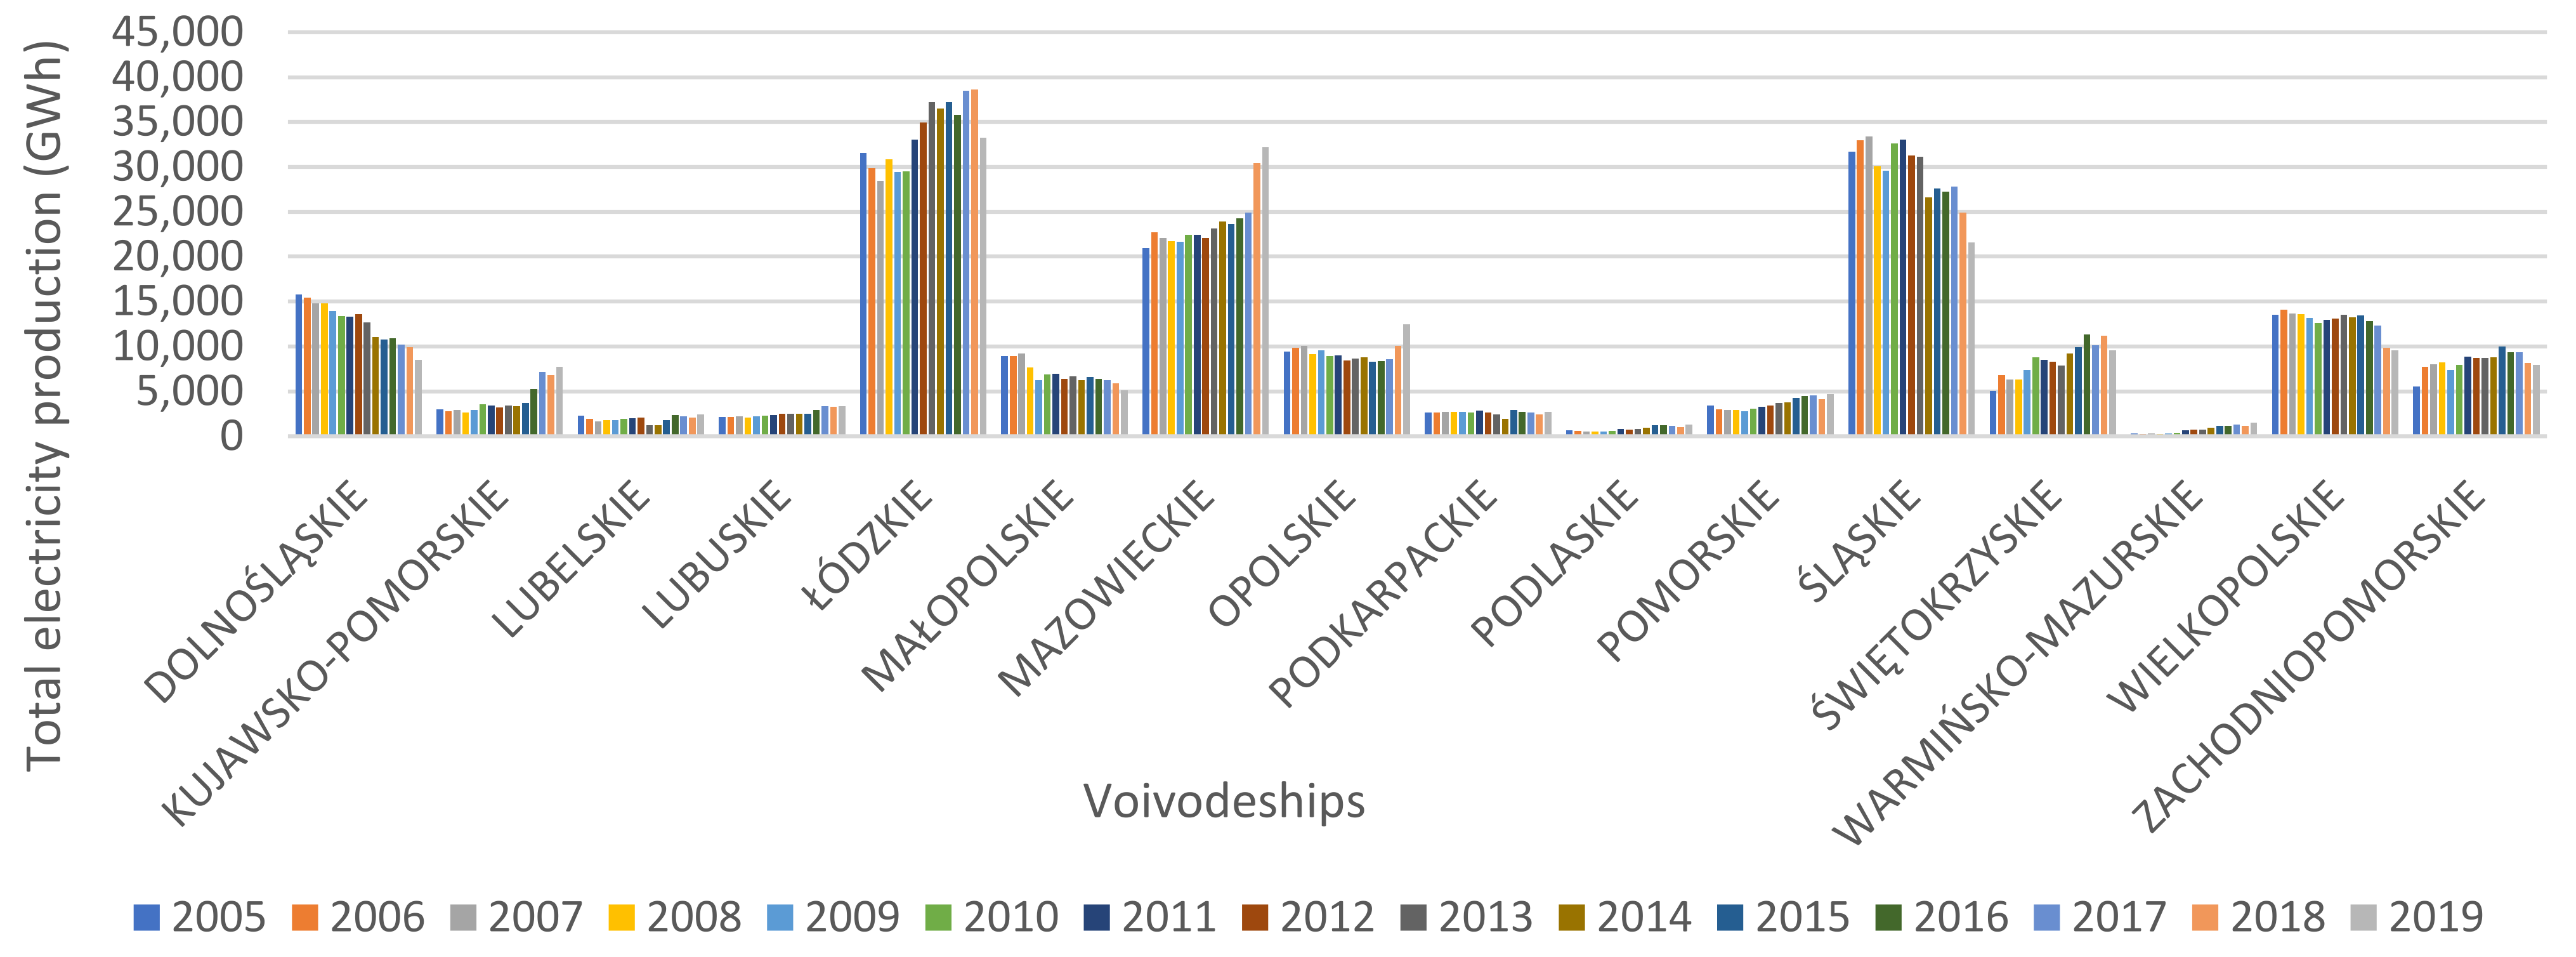
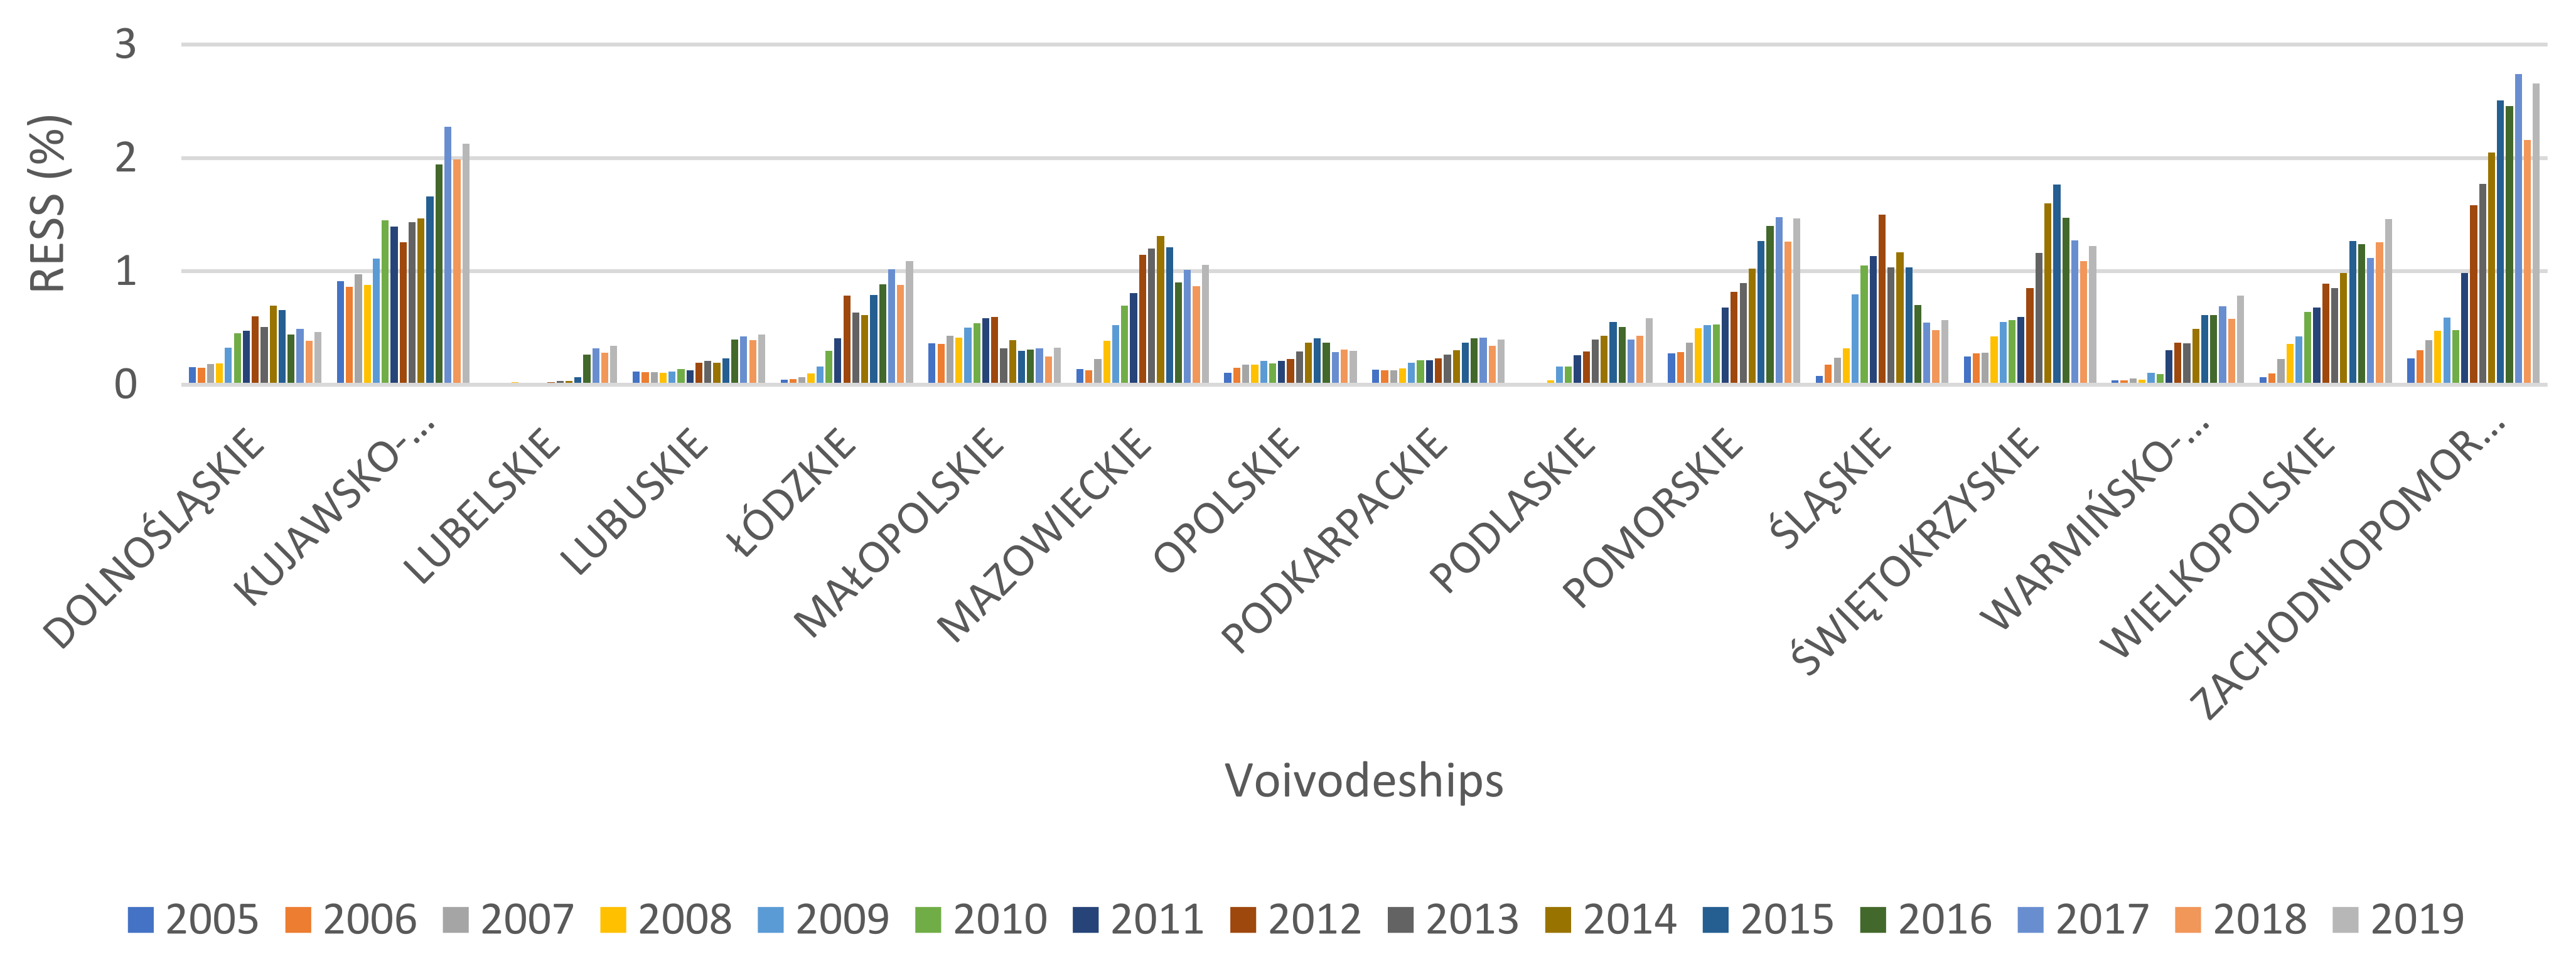
  • The RE of voivodeships shares in total energy production (RESS) in 2010–2019 systematically increased in 9 out of 16 surveyed voivodeships. The largest shares in RE production are in voivodeships as follows: Warmińsko-Mazurskie, Podlaskie, Kujawsko-Pomorskie, Pomorskie, Zachodniopomorskie. The smallest share is in the Łódzkie and Śląskie voivodeships.
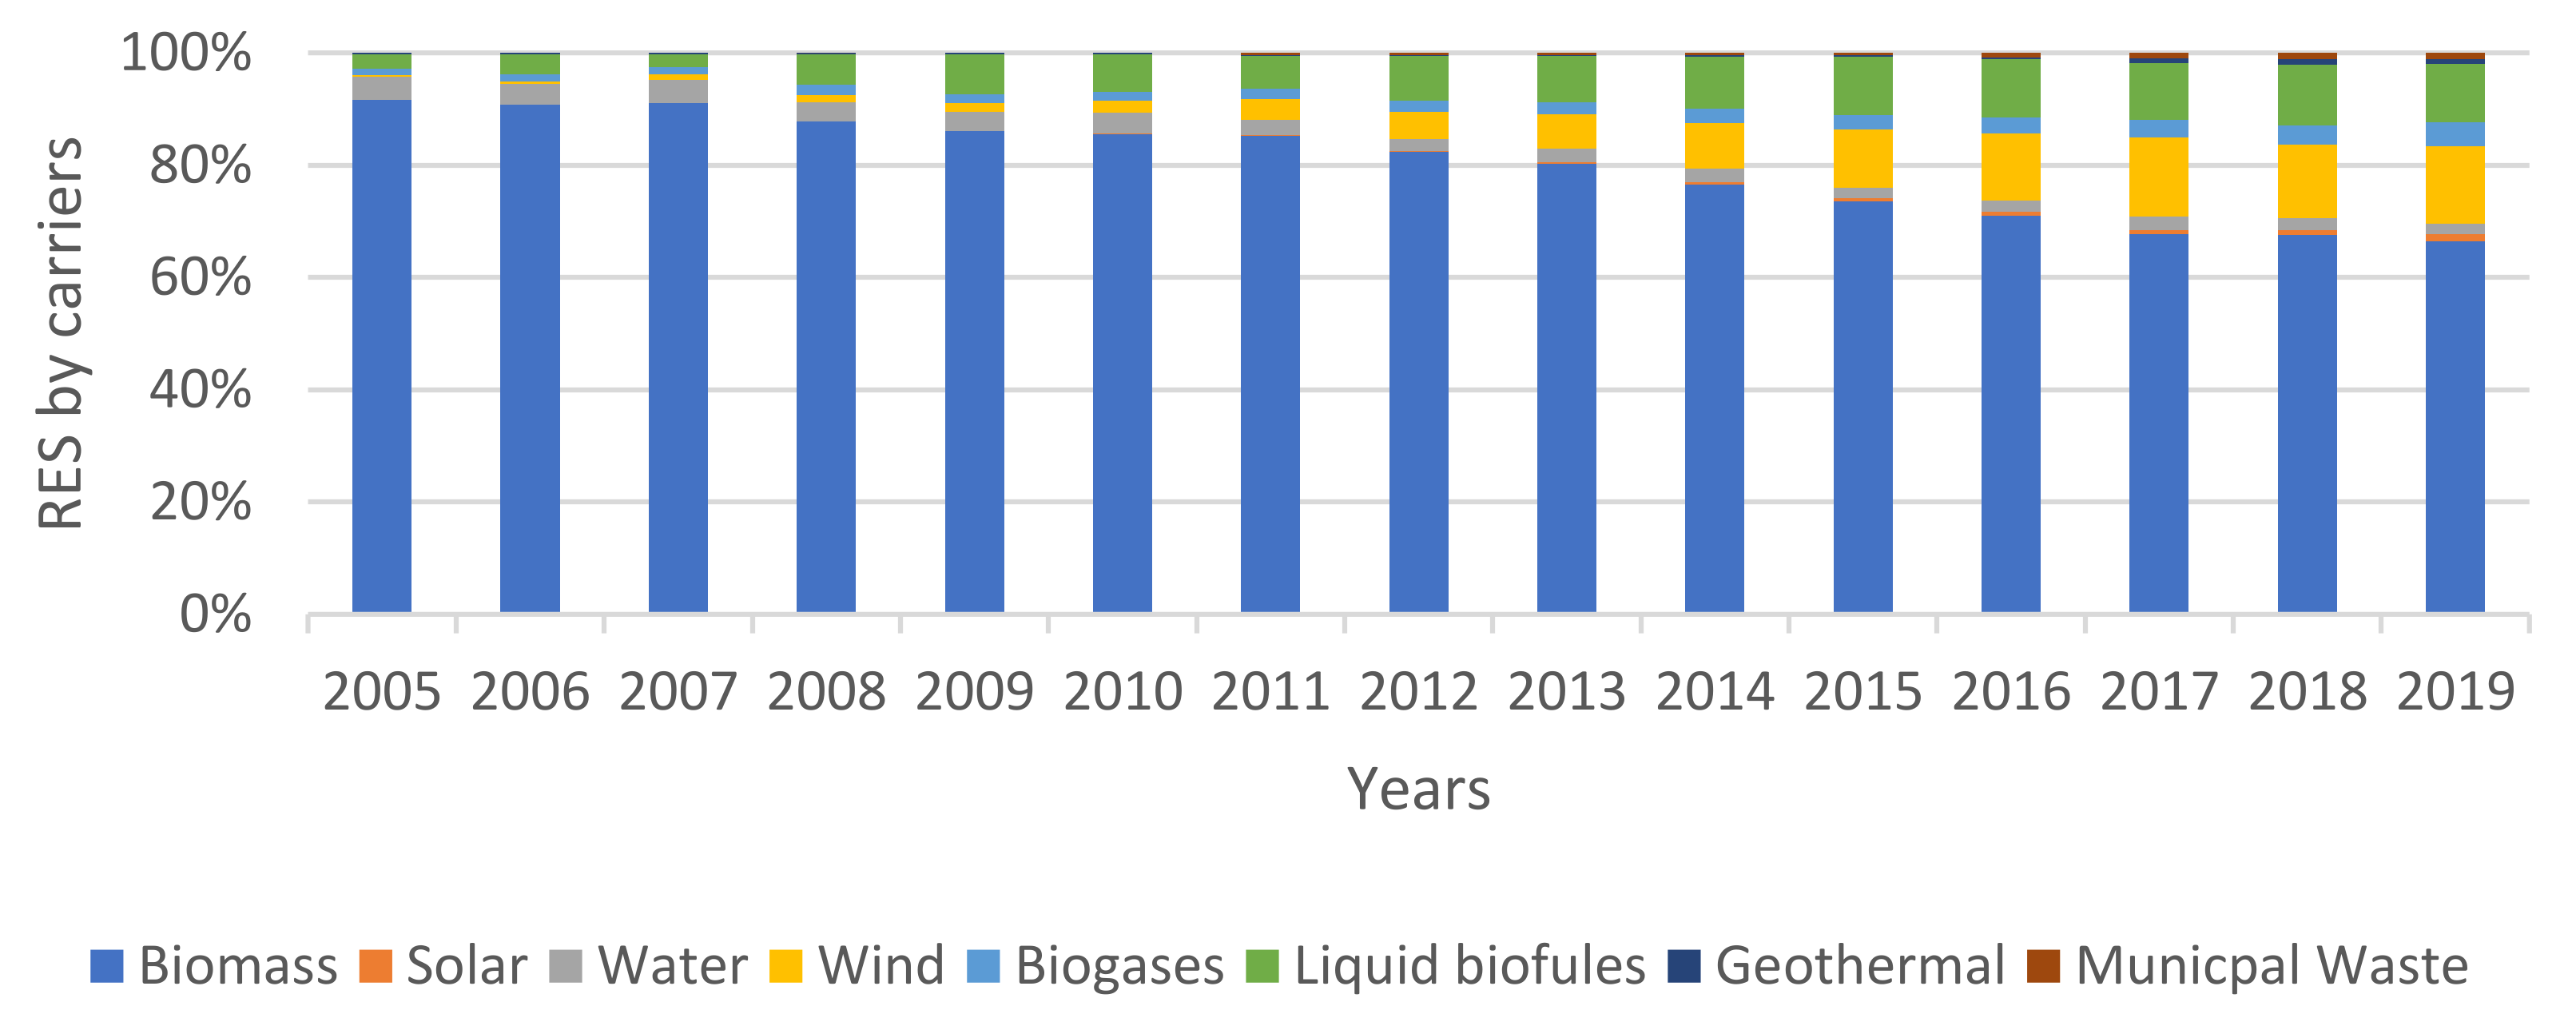
  • Renewable energy in Poland is primarily produced from the incineration of biomass. In 2019, energy from biomass amounted to 65.56%, from wind farms 13.72%, from liquid biofuels 10.36%, from biogases 3.15%, from geothermal sources 2.96%, from solar production 2.96%, and from municipal waste 1.08%. The share of energy from hydroelectricity plants fell by more than a half over the period in question and reached 1.78%.
The estimated dynamic panel model provides strong evidence of the persistent effect on RESS (the level of RESS in the previous time periods is positively and highly correlated with that in the current period). Such results emphasize the need to work toward consistent and stable policy support for RE in Poland, ensuring secure and predictable RES investment. In addition, the results indicate:
  • The positive and statistically significant relationship between the power of installed facilities (IEC) and RES share in energy consumption.
  • The rise in electricity consumption in households (HEC) causes an increase in the endogenous variable. This relationship is statistically significant.
  • The negative and statistically significant relationship between electricity consumption of nonhousehold consumers (NHEC) and RES share in total energy consumption.
The results obtained are partially consistent with Marques et al. [5], Tiba and Omri [11], and Aflaki et al. [40], i.e., electricity consumption is statistically significant, but the prices of competitive energy carriers are not statistically significant in explaining the production of renewable energy. Contrary to literature, CO2 emissions [4,8,9,17], innovation expenditure (related to R&D) [8], electricity price rate [4,14], and GDP per capita [4,12] do not appear to be statistically significant and do not affect the endogenous variable. It may be assumed that the lack of significant effect of institutional support of R&D is caused by uneven distribution of financial support to voivodeships (the relative standard deviation, RSD, amounts to over 110%). Moreover, there was zero-level support in the Łódzkie (2010, 2019), Podlaskie (2010, 2011, 2012), and Świętokrzyskie (2011, 2012) voivodeships. Furthermore, the absence of a profound impact of the variable may be due to relatively limited observation time, which, however, may also suggest inadequate social awareness of the need for reducing climate change (particularly by reducing CO2 emissions) and for an indispensable change of paradigm in policymaking concerning RES development.
The panel model results also suggest that the cross-sectional and time effects are statistically significant, which indicates that RES development across Polish voivodeships is relatively diversified (Table 4) and that the volatility of RES share in consumption (RESS) is related to the specificity of each of the analyzed voivodeships. The significance of time effects indicates an upward trend of the RES share in the total energy consumption. However, these changes are not regular; the share of RES in 2019 remains close to that in 2016. Despite the irregular changes in values of the endogenous variable year on year, the form of the model and the empirical data suggest improved results of RES production in Poland.

5. Conclusions

In this paper, we explore the relationships between RES production share in individual voivodeships in total electricity consumption in Poland (RESS) (as a measure of RES development) and its potential determinants. Obtained results may enable developing support instruments for RES deployment in a more precise way due to different RES development levels in separate regions. The study confronts the results of previous studies and sheds light on the situation in Poland—specifically, upon the changes that happened over a period of ten years (2010–2019). The empirical results of the study reveal the existence of the following relationships: (1) the increase in total installed electric capacity (IEC) by 1 thous. MWh affects the growth of RES production share in individual voivodeships in total electricity consumption by 15.33%; (2) the rise of household electricity consumption (HEC) by 1 thous. GWh corresponds to the growth of RESS by 12.78%; (3) surprisingly, as nonhousehold electricity consumption (NEHC) increases by 1 thous. GWh, RESS falls by 7.5%. The study also shows the moments of significant changes in the renewable energy market (i.e., in 2015, 2016, and 2017), revealed in the correlation matrix between the explanatory variables and the dependent variable. The qualitative analysis of data from LDB shows a negative correlation between energy consumption and the share of renewable energy sources in total energy production. It is evidence that favorable changes are underway in the energy production structure; RES share is growing and by degrees satisfying energy demand, and there is growing investment potential of energy entities in Poland.

Author Contributions

Conceptualization, J.L.B., K.B.-R. and S.L.; methodology, J.L.B. and K.B.-R.; software, K.B.-R.; validation, K.B.-R.; formal analysis, K.B.-R.; investigation, J.L.B., K.B.-R. and S.L.; resources, K.B.-R. and S.L.; data curation, K.B.-R. and S.L.; writing—original draft preparation, J.L.B., K.B.-R. and S.L.; writing—review and editing, J.L.B. and S.L.; visualization, K.B.-R. and S.L.; supervision, J.L.B. and K.B.-R.; project administration, J.L.B.; funding acquisition, J.L.B., K.B.-R. and S.L. All authors have read and agreed to the published version of the manuscript.

Funding

This research was funded by Kielce University of Technology and Kazimierz Pułaski University of Technology and Humanities in Radom.

Institutional Review Board Statement

Not applicable.

Informed Consent Statement

Not applicable.

Data Availability Statement

Publicly available datasets were analyzed in this study. The data were acquired from the Local Data Bank of the Statistics Poland (LDB) available at: https://bdl.stat.gov.pl (Accessed: 1 July 2021). The links to other data sources are indicated in the references.

Conflicts of Interest

The authors declare no conflict of interest.

Appendix A

Figure A1. Primary energy consumption (% of the base year 2005 amount) in Poland vs. EU28 in 2005–2019. Source: own elaboration based on [26].
Energies 14 06762 g0a1
Figure A2. Primary energy consumption vs. GDP (kgoe/EUR) in Poland in 2010–2019. Source: own elaboration based on Statistics Poland [27].
Energies 14 06762 g0a2
Figure A3. Share of renewable energy in gross final energy consumption (%) in Poland vs. EU28 in 2005–2019. Source: own elaboration based on [28], LDB.
Energies 14 06762 g0a3
According to Eurostat, the share of renewable energy in gross final energy consumption in Poland between 2005 and 2019 increased from 6.90% to 12.16%, while the average for all EU member states increased from 9.13% to 18.88%, respectively. It should be noted that there are divergences between the data provided by Eurostat and the Local Data Bank of Statistics Poland, which serve as the basis for creating the model in Section 2. According to LDB, Poland met the 15% RES in gross final energy consumption target (15.30%) in 2019, whereas Eurostat claims that it did not (12.16%). Data from Eurostat show that Poland followed EU28 in terms of RE consumption share between 2007 and 2013. However, from 2014, the growth dynamics was losing pace, and the gap between Poland and EU28 was systematically growing. As a result, the gap was −6.71 pp in 2019, while it was only −2.23 pp. in 2005.

Appendix B

Figure A4. Total electricity production in individual Polish voivodeships in 2005–2019 (GWh). Source: Own calculations based on the LDB.
Energies 14 06762 g0a4
Figure A5. Energy consumption in individual Polish voivodeships in 2005–2019 (GWh). Source: Own calculations based on the LDB.
Energies 14 06762 g0a5
Figure A6. RES production share in individual voivodeships in the total electricity production (TEP) in Poland in 2005–2019 (%). Source: Own calculations based on the LDB.
Energies 14 06762 g0a6
Figure A7. RES production share in individual voivodeships in total electricity consumption in Poland (RESS) in 2005–2019 (%). Source: Own calculations based on the LDB.
Energies 14 06762 g0a7
Figure A8. Energy intensity as total energy consumption (thous. GWh) in relation to GDP per capita (thous. PLN) in individual voivodeships of Poland in 2005–2019. Source: own elaboration based on LDB.
Energies 14 06762 g0a8

Appendix C

Table A1. Summary statistics—variables per voivodeship in Poland in 2010–2019.
VariableMeanMedianMinMaxSDRSDSkewnessKurtosis
RESS0.7780.5930.012.740.5810.7471.1951.119
GDPPC42.49239.65125.99396.57912.0890.2841.6493.566
HEC1.7921.4230.6584.8491.0810.6031.2520.864
NHEC7.8945.4861.82223.7535.8910.7461.4241.108
PEH0.6360.640.560.70.0330.051−0.218−0.515
PC807.2809.6633.48947.8763.970.079−0.031−0.219
PGH53.08853.4640.1664.235.5090.104−0.257−0.73
R&D328.95179.6301855.4382.681.1631.853.532
IEC2.5421.9520.1437.5612.1350.841.0840.042
AEPC2.5121.9540.1327.5322.1380.8511.0920.041
PECD13.2079.7981.38243.7112.1330.9191.2730.46
EEPW57.35721.5160.092954.45105.291.8364.8833.264
Adopted designation: SD—standard deviation, RSD—relative SD.

References

  1. Transforming Our World: The 2030 Agenda for Sustainable Development. Available online: https://www.unfpa.org/resources/transforming-our-world-2030-agenda-sustainable-development (accessed on 4 October 2021).
  2. Directive 2009/28/EC of the European Parliament and of the Council of 23 April 2009 on the Promotion of the Use of Energy from Renewable Sources. Available online: https://eur-lex.europa.eu/legal-content/EN/ALL/?uri=celex%3A32009L0028 (accessed on 4 October 2021).
  3. Sadorsky, P. Renewable Energy Consumption, CO2 Emissions and Oil Prices in the G7 Countries. Energy Econ. 2009, 31, 456–462. [Google Scholar] [CrossRef]
  4. Marques, A.C.; Fuinhas, J.A.; Pires Manso, J.R. Motivations Driving Renewable Energy in European Countries: A Panel Data Approach. Energy Policy 2010, 38, 6877–6885. [Google Scholar] [CrossRef]
  5. Marques, A.C.; Fuinhas, J.A.; Manso, J.P. A Quantile Approach to Identify Factors Promoting Renewable Energy in European Countries. Environ. Resour. Econ. 2011, 49, 351–366. [Google Scholar] [CrossRef]
  6. Marques, A.C.; Fuinhas, J.A. Drivers Promoting Renewable Energy: A Dynamic Panel Approach. Renew. Sustain. Energy Rev. 2011, 15, 1601–1608. [Google Scholar] [CrossRef]
  7. Marques, A.C.; Fuinhas, J.A. Are Public Policies towards Renewables Successful? Evidence from European Countries. Renew. Energy 2012, 44, 109–118. [Google Scholar] [CrossRef]
  8. Aguirre, M.; Ibikunle, G. Determinants of Renewable Energy Growth: A Global Sample Analysis. Energy Policy 2014, 69, 374–384. [Google Scholar] [CrossRef] [Green Version]
  9. Omri, A.; Nguyen, D.K. On the Determinants of Renewable Energy Consumption: International Evidence. Energy 2014, 72, 554–560. [Google Scholar] [CrossRef]
  10. Graczyk, A. Development of Renewable Energy Sources in Polish Regional Policy. Barom. Reg. Anal. Progn. 2020, 15, 55–59. [Google Scholar]
  11. Tiba, S.; Omri, A. Literature Survey on the Relationships between Energy, Environment and Economic Growth. Renew. Sustain. Energy Rev. 2017, 69, 1129–1146. [Google Scholar] [CrossRef]
  12. Papież, M.; Śmiech, S.; Frodyma, K. Determinants of Renewable Energy Development in the EU Countries. A 20-Year Perspective. Renew. Sustain. Energy Rev. 2018, 91, 918–934. [Google Scholar] [CrossRef]
  13. He, Z.-X.; Xu, S.-C.; Li, Q.-B.; Zhao, B. Factors That Influence Renewable Energy Technological Innovation in China: A Dynamic Panel Approach. Sustainability 2018, 10, 124. [Google Scholar] [CrossRef] [Green Version]
  14. Sysko-Romańczuk, S.; Kluj, G. Mikrosieci jako innowacyjny komponent dywersyfikacji rynku energetycznego w Polsce. PO 2019, 19–24. [Google Scholar] [CrossRef]
  15. Jarno, K. Renewable Energy Drivers in the European Union—Evidence from the Panel Data Threshold Regression Model. Bank Kredyt 2020, 51, 505–516. [Google Scholar]
  16. Miskinis, V.; Galinis, A.; Konstantinaviciute, I.; Lekavicius, V.; Neniskis, E. Comparative Analysis of Energy Efficiency Trends and Driving Factors in the Baltic States. Energy Strategy Rev. 2020, 30, 100514. [Google Scholar] [CrossRef]
  17. Miškinis, V.; Galinis, A.; Konstantinavičiūtė, I.; Lekavičius, V.; Neniškis, E. The Role of Renewable Energy Sources in Dynamics of Energy-Related GHG Emissions in the Baltic States. Sustainability 2021, 13, 10215. [Google Scholar] [CrossRef]
  18. Serowaniec, M. Sustainable Development Policy and Renewable Energy in Poland. Energies 2021, 14, 2244. [Google Scholar] [CrossRef]
  19. Tomaszewski, K.; Sekściński, A. Odnawialne Źródła Energii w Polsce—Perspektywa Lokalna i Regionalna. Rynek Energii 2020, 4, 10–19. [Google Scholar]
  20. The Paris Agreement|UNFCCC. Available online: https://unfccc.int/sites/default/files/english_paris_agreement.pdf (accessed on 4 October 2021).
  21. COP26 Goals. Available online: https://ukcop26.org/cop26-goals/ (accessed on 4 October 2021).
  22. As G7 Calls Time on Coal, Have You Checked Your Supply Chain? Available online: https://www.weforum.org/agenda/ 2021/06/g7-coal-have-you-checked-your-supply-chain/ (accessed on 4 October 2021).
  23. Commission Implementing Regulation (EU) 2020/1294 of 15 September 2020 on the Union Renewable Energy Financing Mechanism (Text with EEA Relevance). Available online: http://data.europa.eu/eli/reg_impl/2020/1294/oj/eng (accessed on 4 October 2021).
  24. National Energy and Climate Plan for the Years 2021–2030—Ministerstwo Klimatu i Środowiska—Portal Gov.pl. Available online: https://www.gov.pl/web/klimat/national-energy-and-climate-plan-for-the-years-2021-2030 (accessed on 4 October 2021).
  25. Energy Policy of Poland Until 2040—Portal Gov.pl. Available online: https://www.gov.pl/web/klimat/polityka-energetyczna-polski (accessed on 4 October 2021).
  26. Ministry of State Treasury of the Republic of Poland Information for Q4 2019 on the Use of Energy from Renewable Sources. Available online: https://www.gov.pl/web/klimat/2019-r3 (accessed on 4 October 2021).
  27. Ministry of Climate and Environment Poland. 2021 National Inventory Report (NIR)|UNFCCC. Available online: https://unfccc.int/documents/274762 (accessed on 4 October 2021).
  28. Statistics|Eurostat Primary Energy Consumption. Available online: https://ec.europa.eu/eurostat/databrowser/view/ SDG_07_10/bookmark/line?lang=en&bookmarkId=0288fb5b-f38c-4b5e-8f28-65576ba025c9 (accessed on 4 October 2021).
  29. Statistics Poland Primary Energy Consumption of GDP with Climate Correction. Available online: https://sdg.gov.pl/ (accessed on 4 October 2021).
  30. Enerdata GDP & Primary Consumption Trends|Primary Consumption and GDP in Europe|ODYSSEE-MURE. Available online: https://www.odyssee-mure.eu/publications/efficiency-by-sector/overview/primary-consumption-gdp-trends.html (accessed on 4 October 2021).
  31. IRENA. Renewable Power Generation Costs in 2019; International Renewable Energy Agency (IRENA): Abu Dhabi, United Arab Emirates, 2020; ISBN 978-92-9260-244-4. [Google Scholar]
  32. Agencja Rynku Energii S.A. Bilans Energii Pierwotnej w Latach 2005–2020. Available online: https://www.are.waw.pl/component/phocadownload/category/21-bilans-energii-pierwotnej?download=70:bilans-energii-pierwotnej-w-latach-2005-2020 (accessed on 4 October 2021).
  33. PGE Polska Grupa Energetyczna SA, P.S. O Oddziale (Oddział Elektrownia Bełchatów). Available online: https://elbelchatow.pgegiek.pl/o-oddziale (accessed on 4 October 2021).
  34. EN. Directive (EU) 2018/2001 of the European Parliament and of the Council of 11 December 2018 on the Promotion of the Use of Energy from Renewable Sources (Text with EEA Relevance). Off. J. Eur. Union 2018, L328, 82–209. [Google Scholar]
  35. Arellano, M.; Bond, S. Some Tests of Specification for Panel Data: Monte Carlo Evidence and an Application to Employment Equations. Rev. Econ. Stud. 1991, 58, 277–297. [Google Scholar] [CrossRef] [Green Version]
  36. Arellano, M.; Bover, O. Another Look at the Instrumental Variable Estimation of Error-Components Models. J. Econometr. 1995, 68, 29–51. [Google Scholar] [CrossRef] [Green Version]
  37. Baltagi, B.H. Econometric Analysis of Panel Data, 4th ed.; Wiley: Chichester, UK; Hoboken, NJ, USA, 2008; Chapter 8; ISBN 978-0-470-51886-1. [Google Scholar]
  38. The Energy Regulatory Office of the Republic of Poland. Sprawozdanie z Działalności Urzędu Regulacji Energetyki za 2019 Rok (Report on the Activities of the Energy Regulatory Office for 2019). Available online: https://www.ure.gov.pl/ pl/urzad/informacje-ogolne/aktualnosci/8861,Sprawozdanie-z-dzialalnosci-Urzedu-Regulacji-Energetyki-za-2019-rok.html (accessed on 5 October 2021).
  39. Supreme Audit Office. NIK about Barriers in Development of Renewable Energy Sources—Supreme Audit Office. Available online: https://www.nik.gov.pl/en/news/nik-about-barriers-to-the-development-of-renewable-energy-sources.html (accessed on 5 October 2021).
  40. Aflaki, S.; Basher, S.A.; Masini, A. Does Economic Growth Matter? Technology-Push, Demand-Pull and Endogenous Drivers of Innovation in the Renewable Energy Industry; Social Science Research Network: Rochester, NY, USA, 2014. [Google Scholar]
Figure 1. Dynamics of total electricity production and consumption, GDP per capita, renewable energy production, and the level of CO2 emission (carbon dioxide) in Poland in 2006–2019. Source: own elaboration based on [27].
Energies 14 06762 g001
Figure 2. The structure of RES in Poland by energy carriers in 2005–2019 (%). Source: own elaboration based on [31].
Energies 14 06762 g002
Figure 3. The primary energy production by energy carriers in 2019. Source: own elaboration based on [32].
Energies 14 06762 g003
Table 1. The summary of the literature review.
StudyCountry/RegionPeriodMethodMain Findings
Sadorsky (2009) [3]G7 countries1980–2005Panel cointegration techniquesPositive impact of real GDP per capita and carbon dioxide emissions per capita on renewable energy consumption and negative impact of oil prices on renewable energy consumption.
Marques et al. (2010) [4]24 European Union countries1990–2006Panel data techniquesDriving factors of RE deployment are identified: EU membership and adoption of Directive 2001/77/EC, effects of lobby pressure, energy self-sufficiency, CO2 emissions, and income.
Marques et al. (2011) [5]24 European Union countries1990–2006Quantile regression There is a significant difference in response to the drivers that affect renewable sources adoption suggesting the existence of an initial barrier due to the initial contribution of RE: the industry lobbying (the lobbies of the traditional fossil fuels) negative effect is more profound for low levels of RE use than for high RE commitments. Income revealed to be a significant driver to boost the use of renewable resources in the early stage of commitment with renewables; however, higher income could imply additional energy consumption from the fossil sources presently available in the market.
Marques et al. (2011) [6]24 European countries1990–2006Panel dynamic estimatorsThe level of renewable energy use in the previous period has a positive and highly significant effect on the current level of use. Traditional energy sources restrain deployments of renewables. Social awareness of sustainability, climate change mitigation, and CO2 reduction targets cannot effectively cause a transition to renewable energy sources. Market factors (income and prices of fossil-based fuels) were not significant for developing renewables in 1990–2006.
Marques et al. (2012) [7]23 European countries1990–2007Panel Corrected Standard Errors estimatorPolicies of incentives/subsidies (including feed-in tariffs) and policy processes are significant drivers of improved renewables use.
Aguirre and Ibikunle (2014) [8]OECD and BRICS countries1990–2010Fix effects vector decomposition (FEVD) and panel-corrected standard error (PCSE) estimationEnvironmental concerns (CO2 emission levels) are more relevant than energy security. Energy use is negatively linked to renewable energy participation and high electricity rates for the industry sector. There is a negative relationship between renewables participation and the composition of coal, oil, natural gas, and nuclear power in the energy mix. A negative influence of typically used political factors (Voluntary Approaches and Fiscal and Financial Instruments) suggests failures in the design of RE deployment policies that create nonacceptable uncertainty for potential RE investors.
Omri and Nguyen (2014) [9]64 countries 1990–2011Dynamic panel data modelIncreases in CO2 emissions and trade openness are the primary drivers of renewable energy consumption. Oil price increases have a more minor but negative impact on renewable energy consumption.
Graczyk (2017) [10]Poland2010–2030Descriptive analysis, analysis of sources of law, development projections based on empirical dataThe development of RES can be an essential factor in the development of distributed energy, particularly prosumer energy, which may contribute to regions’ development. However, it requires financial, administrative, and organizational support. Because of the insufficiency of state aid (especially financial aid), the regions should support the development of the RES sector.
Tiba and Omri (2017) [11]264 research results from the world literature1978–2014Comparative analysis, systematization of knowledge.There is a consensus on the seriousness of the relationship between electricity production, environmental change, and economic growth.
Papież et al. (2018) [12]26 EU countries1995–2014Best subset regression; LARS methodThe main factors of RES development are GDP per capita, the concentration of energy supply, the costs of energy consumption obtained from fossil fuels in relation to GDP, and three components that divide the analyzed countries into (1) the ones using or not using coal or crude oil as their main energy sources; (2) countries using natural gas as their primary energy source; and (3) countries that use clean energy as their main energy source and only limited amounts of dirty energy sources.
He et al. (2018) [13]29 provinces of China2006–2013Dynamic panel Electricity consumption is the most important driver for all renewables and wind energy, but the driving effect was weaker for solar energy and biomass.
Sysko-Romańczuk, Kluj (2019) [14]Poland1999–2019Research triangulation of microgrid development processes The main factors determining the development of RES are falling costs of RES production and energy storage, rising rates of electricity charges, and increasingly decisive political efforts to reduce greenhouse gas emissions while promoting distributed energy resources.
Jarno (2020) [15]EU member states2009–2017Nondynamic panel threshold regression model with individual-specific fixed effectsThere is a threshold for the GDP growth rate, from which the impact of energy prices on the growth rate of the share of RES in gross final energy consumption in the EU Member States is visible. When the GDP growth rate is more than 3.1% per year, rising energy prices positively impact the growth rate of the share of renewable energy in gross final energy consumption.
Miškinis et al. (2020) [16]Baltic States2000–2018Fisher Ideal IndexChanges in energy intensity are analyzed in each country on three stages: primary energy intensity, final energy intensity, and sectoral energy intensity. High energy conversion losses in Estonia, a high share of energy-intensive industries, and a rapid increase of energy consumption in the Lithuanian transport sector are identified as limiting the further increase of energy efficiency.
Miškinis et al. (2021) [17]Baltic See Region (BSR)2010–2019The Kaya identity and the logarithmic mean Divisia index (LMDI)The impact of population change, economic growth, decline of energy intensity, RES deployment, and emission intensity reduction on change of GHG emissions in countries of the BSR and, on average, in the EU-27 during 2010–2019 is revealed. Some energy policy recommendations are formulated.
Serowaniec (2021) [18]Poland1997–2020Descriptive methods and the interpretation of legal acts and court decisions.The state authorities should take further specific actions to achieve the sustainable development of the renewable energy sector in Poland. These actions should be primarily aimed at gradually converting electricity production from coal to renewable energy sources, and moving away from fossil fuels for heat production in favor of RES.
Source: own elaboration based on literature review.
Table 2. Variables used in the study.
VariableDescriptionUnits
GDPPCGross domestic product per capita(thous. PLN)
HECHousehold electricity consumption(thous. GWh)
NHECNonhousehold electricity consumption(thous. GWh)
PEHAverage prices of electricity for households (G-11 tariff) per 1 kWh(PLN)
PCPrice of one ton of hard coal(PLN)
PGHPrice of gas for households consumers propane–butane, cylinder, capacity 11 kg of liquefied gas (no delivery fee)(PLN)
R&DInnovation expenditure related to research and development (R&D), acc. to LDB(mln. PLN)
IECTotal installed electric capacity of connections(thous. MWh)
APECTotal achievable electric power capacity(thous. MWh)
PECDPollution emission (carbon dioxide)(mln. t/y)
EEPWTotal expenditures on environmental protection and water management 1(mln. PLN)
R E S S t 1 RESS in the previous period(%)
Source: own elaboration. 1 refers to the total prevention of pollution covering new methods and fuel combustion technologies, including modernization of heat-only boiler stations and heat plants; total reduction of pollution (i.e. particulate and gas pollutants).
Table 3. The correlation between exogenous variables and the endogenous variable in 2010–2019.
Variable2010201120122013201420152016201720182019
RESSRESSRESSRESSRESSRESSRESSRESSRESSRESS
GDPPC0.390.390.470.340.300.20.060.060.090.09
PEH−0.6−0.56−0.39−0.14−0.020.090.260.160.160.3
PECD0.40.380.540.30.260.170.060.020.020.03
R&D0.490.350.320.140.110.01−0.27−0.16−0.2−0.23
IEC0.460.470.650.430.410.310.190.190.190.15
AEPC0.450.460.640.420.380.310.190.190.180.14
PC−0.16−0.060.010.120.160.150.20.10.170.11
PGH0.19−0.07−0.04−0.06−0.12−0.02−0.07−0.05−0.23−0.08
HEC0.470.460.50.280.240.09−0.04−0.04−0.02−0.01
NHEC0.550.540.590.320.290.14−0.03−0.04−0.05−0.04
EEPW0.30.340.360.320.36−0.09−0.10.22−0.050.02
RESt−10.970.940.930.930.990.980.960.980.990.99
Source: own elaboration based on LDB.
Table 4. Dynamic panel data model, the results from least squares dummy variable estimation using 160 observations, including 16 cross-sectional units, time series length = 9, endogenous variable: R E S S i t .
VariablesCoefficientStand. Error
Intercept0.3666 ***0.0599
I E C i t 0.1533 ***0.0283
H E C i t 0.1278 ***0.0382
N H E C i t −0.075 ***0.0125
R E S S i   t 1 0.7674 ***0.0457
du_20.2275 ***0.0633
du_3−0.1797 ***0.0627
du_4−0.1946 ***0.0615
du_5−0.4923 ***0.1027
du_6−0.1202 **0.0569
du_8−0.3434 ***0.0688
du_9−0.2151 ***0.0595
du_10−0.2051 ***0.0609
du_14−0.1248 **0.0584
du_15−0.1365 **0.0569
dt_1−0.1181 ***0.0411
dt_2−0.0860 **0.0397
dt_4−0.1164 ***0.0379
dt_7−0.0803 **0.0389
dt_9−0.1689 ***0.0389
Adjusted R-square0.944Akaike criterion−161.455
Bayes–Schwarz criterion−99.951Hannana−Quinn−136.480
Autocor. residual-rho1−0.010Durbin−Watson1.679
Wooldridge test for autocorrelation: H0: no first−order autocorrelation (rho = 0); test statistic: t(15) = −0.1783, p-value = 0.8609
Chow test for structural change and stability, structural break 6:10
H0: no structural change, F(11, 129) = 1.4899, p-value = 0.1427
Levin−Lin−Chu test for panel data model
H0: Panels contain unit roots
Ha: Panels are stationary
Coeff.t-Studentz-score
1.1702−13.718−10.5422 (0.000)
Source: own elaboration based on LDB. ***, ** Represent significance at the 1% and 5% levels respectively
Publisher’s Note: MDPI stays neutral with regard to jurisdictional claims in published maps and institutional affiliations.

